State Accountability Report: Goal 2

State Accountability Report: Goal 2
Jan 01, 2016
State Accountability Report: Goal 2. Goal 2:. Make Illinois one of the five most affordable states in the country to get a college education. Ensure college affordability for students, families, and taxpayers. Goal 2: Affordability. Performance Measures. Benchmarked Against. - PowerPoint PPT Presentation
Welcome message from author
This document is posted to help you gain knowledge. Please leave a comment to let me know what you think about it! Share it to your friends and learn new things together.
Transcript
State Accountability Report: Goal 2
Ensure college affordability for students, families, and taxpayers.
Goal 2:
2
Make Illinois one of the five most affordable states in the country to get
a college education.
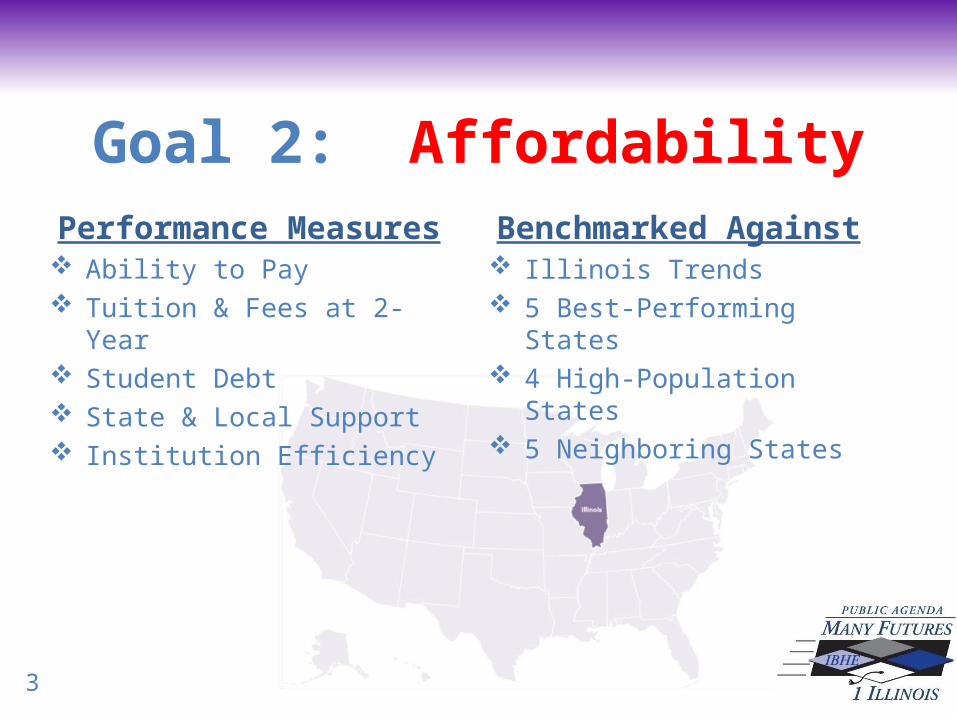
Performance Measures Ability to Pay Tuition & Fees at 2-Year Student Debt State & Local Support Institution Efficiency
Benchmarked Against Illinois Trends 5 Best-Performing States 4 High-Population States 5 Neighboring States
Goal 2: Affordability
3
Performance Measure Public
Agenda Baseline
Year 2 2018
Year 10
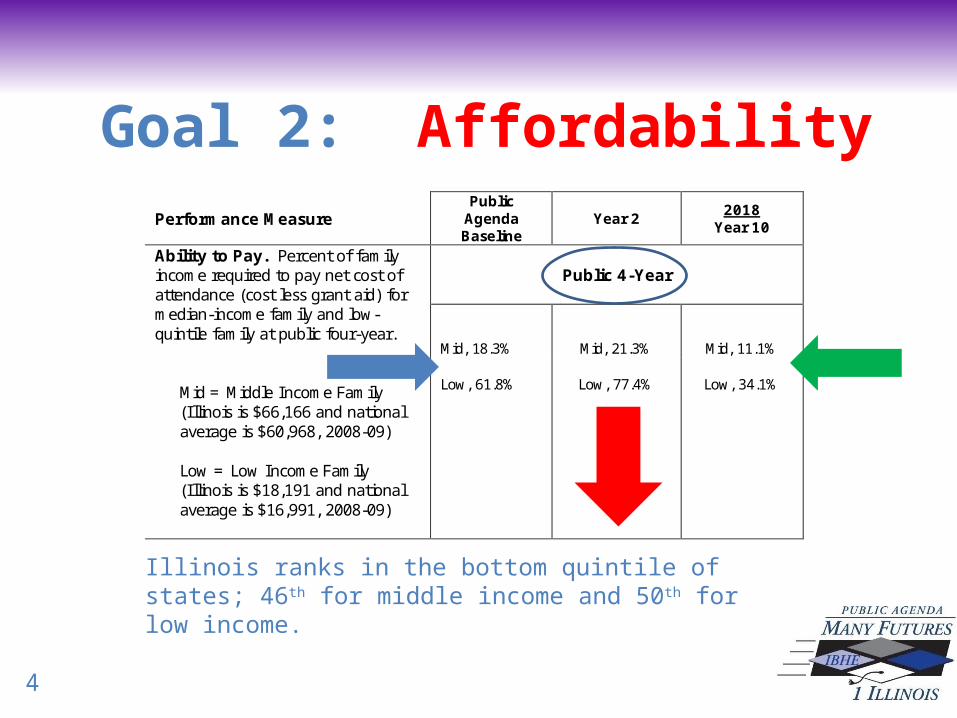
Ability to Pay. Percent of family income required to pay net cost of attendance (cost less grant aid) for median-income family and low-quintile family at public four-year.
Mid = Middle Income Family (Illinois is $66,166 and national average is $60,968, 2008-09) Low = Low Income Family (Illinois is $18,191 and national average is $16,991, 2008-09)
Public 4-Year
Mid, 18.3%
Mid, 21.3%
Mid, 11.1% Low, 61.8%
Low, 77.4%
Low, 34.1%
Goal 2: Affordability
Illinois ranks in the bottom quintile of states; 46th for middle income and 50th for low income.
4

Goal 2: Affordability
Illinois ranks better than the national average in net cost for middle and low income families.
5
Performance Measure Public
Agenda Baseline
Year 2 2018
Year 10
Ability to Pay. Percent of family income required to pay net cost of attendance (cost less grant aid) for median-income family and low-quintile family at private four-year.
Mid = Middle Income Family (Illinois is $66,166 and national average is $60,968, 2008-09) Low = Low Income Family (Illinois is $18,191 and national average is $16,991, 2008-09)
Private 4-Year
Mid, 31.8% Mid, 34.5% Mid, 17.7%
Low, 106.9% Low, 125.3% Low, 56.4%
Goal 2: Affordability
Illinois performs below the national average; ranks 29th for middle income and 32nd for low income.
6
Performance Measure Public
Agenda Baseline
Year 2 2018
Year 10
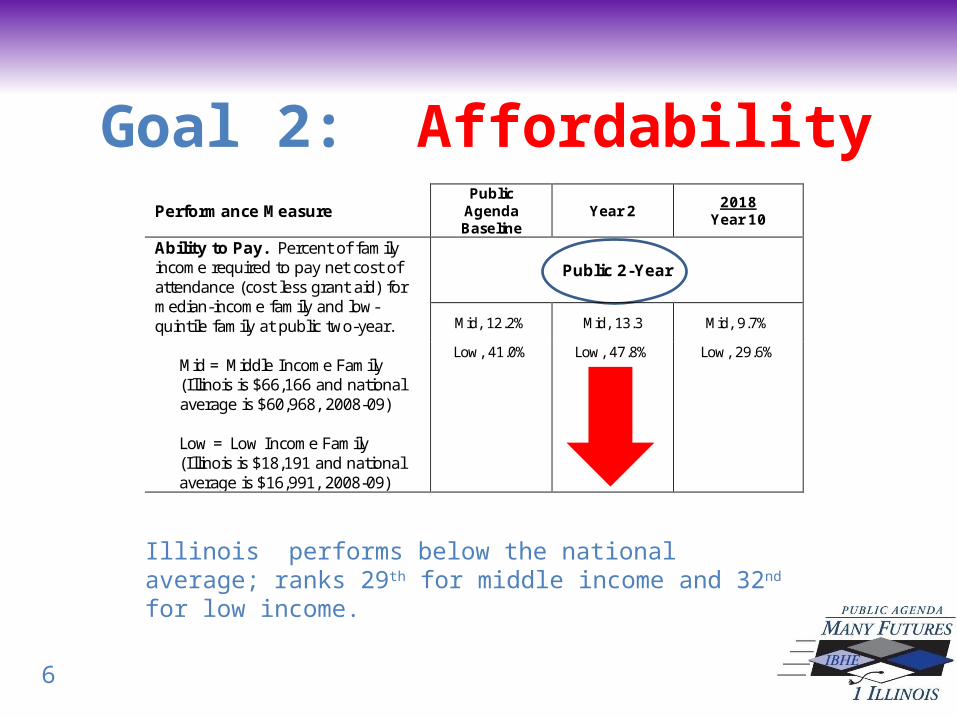
Ability to Pay. Percent of family income required to pay net cost of attendance (cost less grant aid) for median-income family and low-quintile family at public two-year.
Mid = Middle Income Family (Illinois is $66,166 and national average is $60,968, 2008-09) Low = Low Income Family (Illinois is $18,191 and national average is $16,991, 2008-09)
Public 2-Year
Mid, 12.2% Mid, 13.3 Mid, 9.7%
Low, 41.0% Low, 47.8% Low, 29.6%
Performance Measures Public
Agenda Baseline
Year 2 2018
Year 10
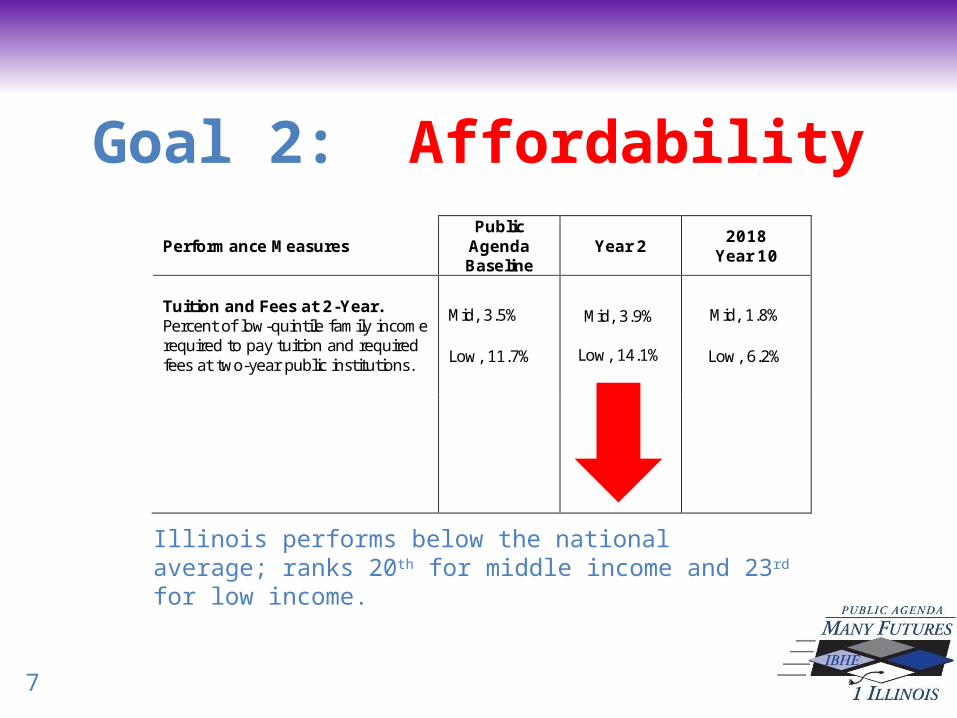
Tuition and Fees at 2-Year. Percent of low-quintile family income required to pay tuition and required fees at two-year public institutions.
Mid, 3.5% Low, 11.7%
Mid, 3.9%
Low, 14.1%
Mid, 1.8%
Low, 6.2%
Goal 2: Affordability
Illinois performs below the national average; ranks 20th for middle income and 23rd for low income.
7

Goal 2: Affordability
8Source: U.S. Department of Education, Institute of Education Sciences, National Center for Education Statistics, 2011.

Goal 2: Affordability
Illinois ranks better than the national average with 68.8 percent of revenue coming from state and local sources.
9
Performance Measures Public
Agenda Baseline
Year 2 2018
Year 10
State & Local Support. State and local support per Full-Time Equivalency (FTE) student as a proportion of total revenues (total includes state and local appropriations plus tuition and fees).
70.4% 68.8% 83.4%

Goal 2: Affordability
10
(1) South Dakota 23,417$ (1) Oregon 36,399$ (1) Oregon 42,380$ (2) Georgia 26,520$ (2) Utah 37,059$ (2) Florida 42,963$ (3) Florida 30,578$ 27,391$ (3) Florida 38,463$ 38,858$ (3) Texas 43,973$ 44,845$ (4) Indiana 30,773$ (4) Oklahoma 38,641$ (4) Utah 44,387$ (5) Colorado 31,365$ (5) Kansas 41,318$ (5) Montana 47,309$ (3) Florida 30,578$ (3) Florida 38,463$ (2) Florida 42,963$
(4) Indiana 30,773$ Texas 44,162$ (3) Texas 43,973$
(7) Illinois 34,182$ (12) Illinois 46,343$ Missouri 58,126$
Iowa 36,093$ Iowa 46,620$ Iowa 58,979$
Wisconsin 41,092$ Indiana 46,981$ (23) Illinois 59,453$
Missouri 41,879$ Kentucky 49,917$ Wisconsin 60,625$
Texas 44,352$ Wisconsin 50,335$ U.S. 62,839$
U.S. 45,949$ California 50,876$ Indiana 67,848$
New York 59,484$ New York 52,439$ Kentucky 70,985$
California 62,545$ U.S. 54,135$ California 80,969$
Kentucky NA Missouri 60,585$ New York 88,789$
Community Colleges Public Master's Public Research
Illinois ranks better than the national average.
Institution Efficiency: Education and Related Spending Per Completion
Source: Delta Project on Postsecondary Education Costs, Productivity, and Accountability, 2008 data, 2010.
11
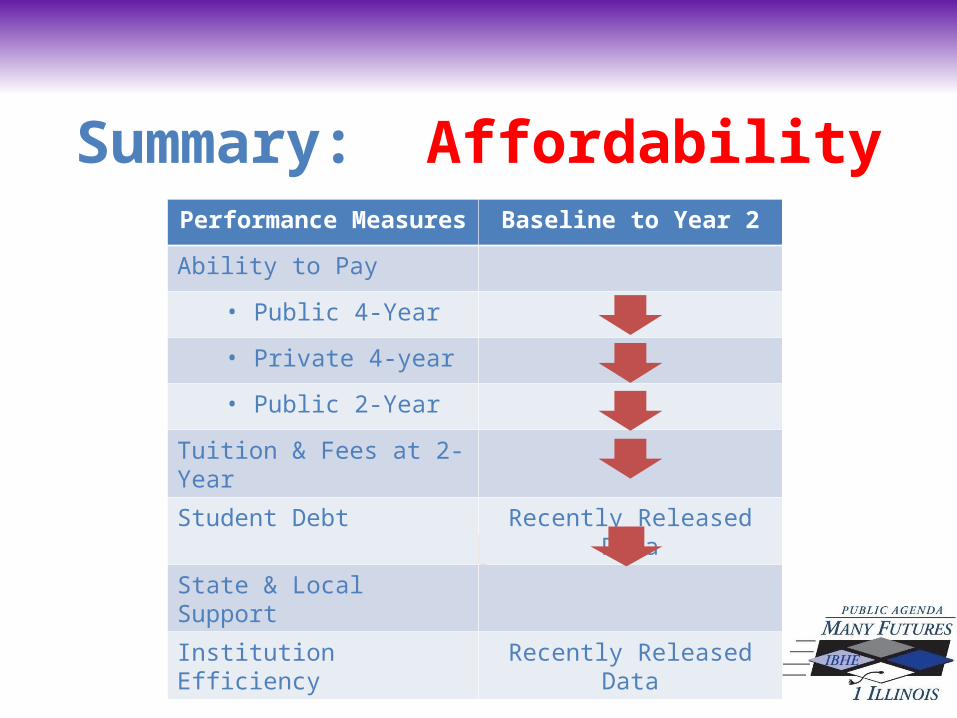
Performance Measures Baseline to Year 2
Ability to Pay
• Public 4-Year
• Private 4-year
• Public 2-Year
Tuition & Fees at 2-Year
Student Debt Recently Released Data
State & Local Support
Institution Efficiency Recently Released Data
Summary: Affordability

Related Documents