Stat 512 – Day 7 Probability Models, Inference (Ch. 4)

Welcome message from author
This document is posted to help you gain knowledge. Please leave a comment to let me know what you think about it! Share it to your friends and learn new things together.
Transcript
Stat 512 – Day 7
Probability Models, Inference (Ch. 4)
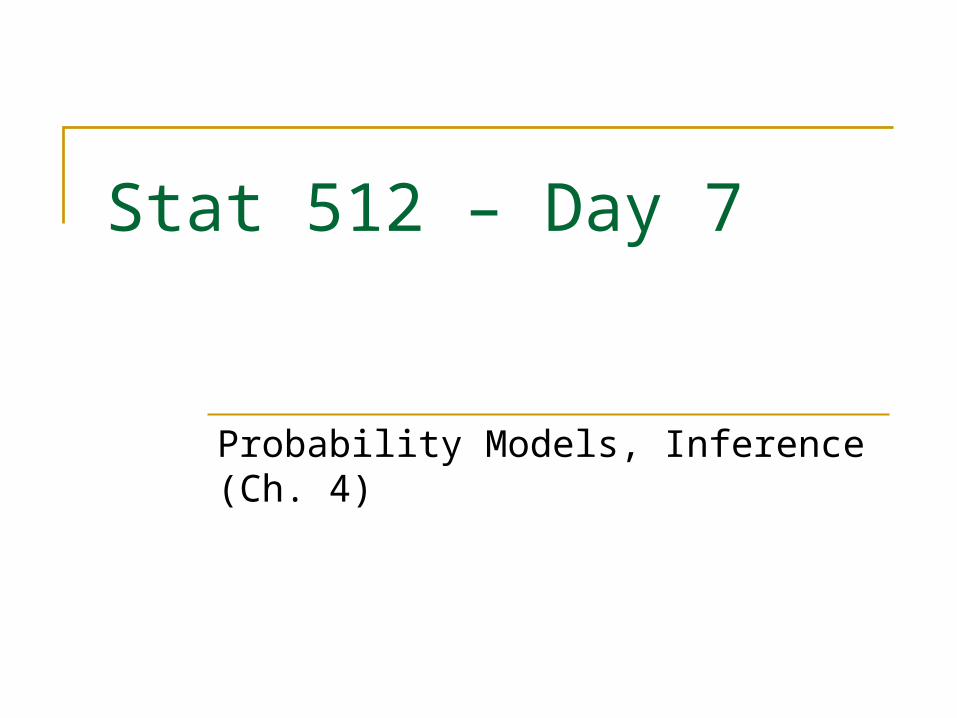
Last Time – Random Sampling Need an unbiased method for selecting
samples from a larger population so you believe sample obtained is representative of the population Simple random sample = every sample of size n
has the same chance of being selected Other probability methods: systematic, multistage,
cluster, and stratified sampling Goal: Allows us to generalize sample results
back to the population of interest
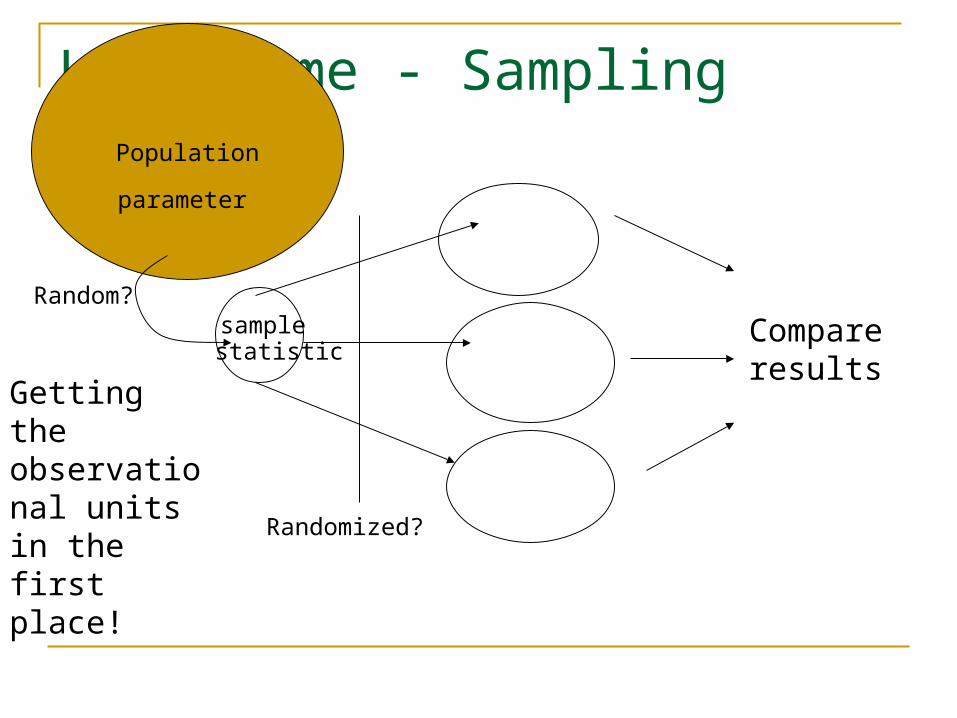
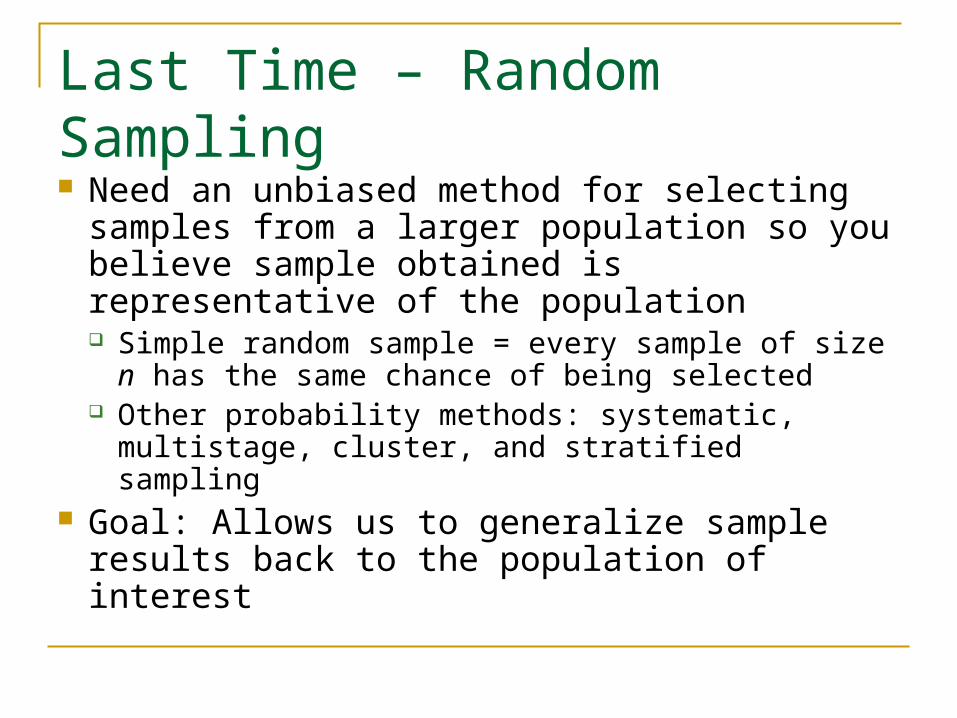
Last Time - Sampling
Compareresults
Randomized?
Getting the observational units in the first place!
Population
Random?sample
parameter
statistic
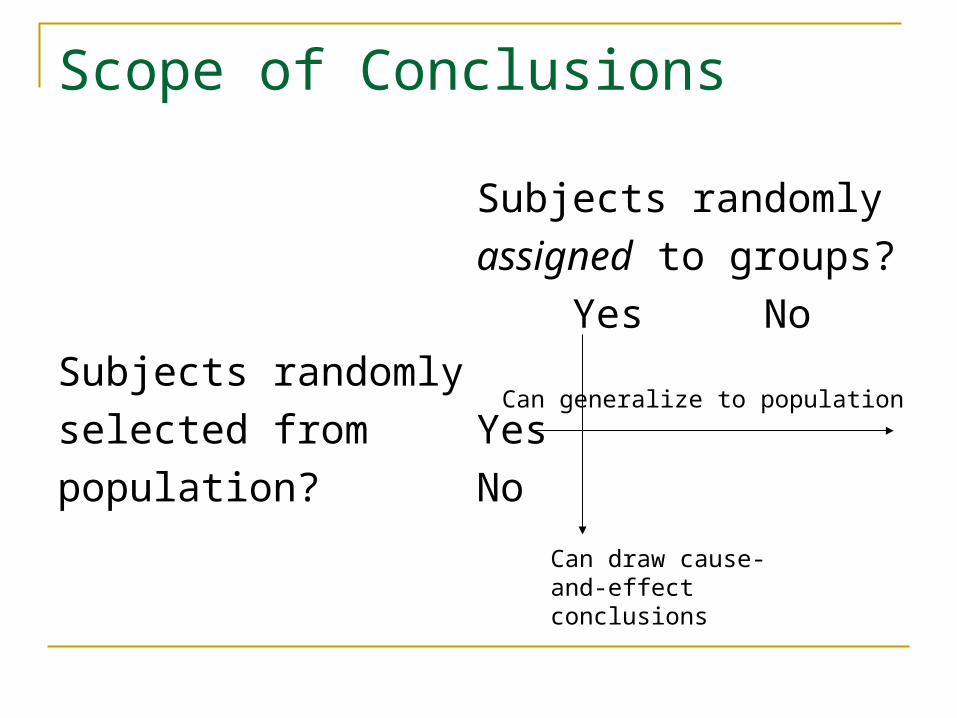
Scope of Conclusions
Subjects randomly
assigned to groups?
Yes No
Subjects randomly
selected from Yes
population? No
Can generalize to population
Can draw cause-and-effect conclusions
But: Nonsampling Errors
Even if sample is properly selected, are other sources of bias and misleading results
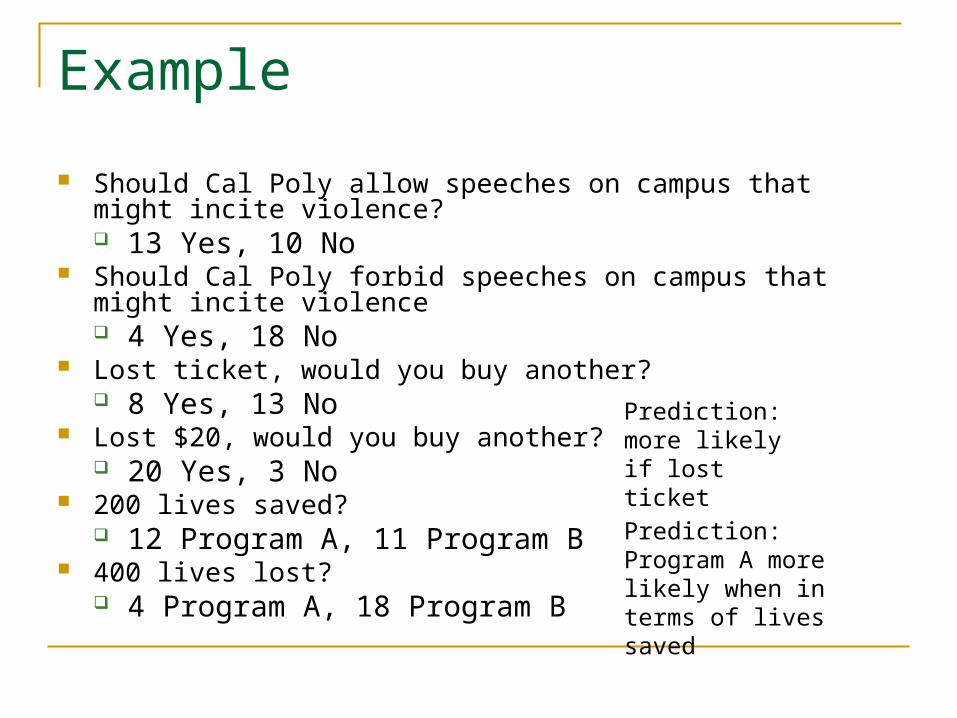
Example
Should Cal Poly allow speeches on campus that might incite violence? 13 Yes, 10 No
Should Cal Poly forbid speeches on campus that might incite violence 4 Yes, 18 No
Lost ticket, would you buy another? 8 Yes, 13 No
Lost $20, would you buy another? 20 Yes, 3 No
200 lives saved? 12 Program A, 11 Program B
400 lives lost? 4 Program A, 18 Program B
Prediction: more likely if lost ticket
Prediction: Program A more likely when in terms of lives saved
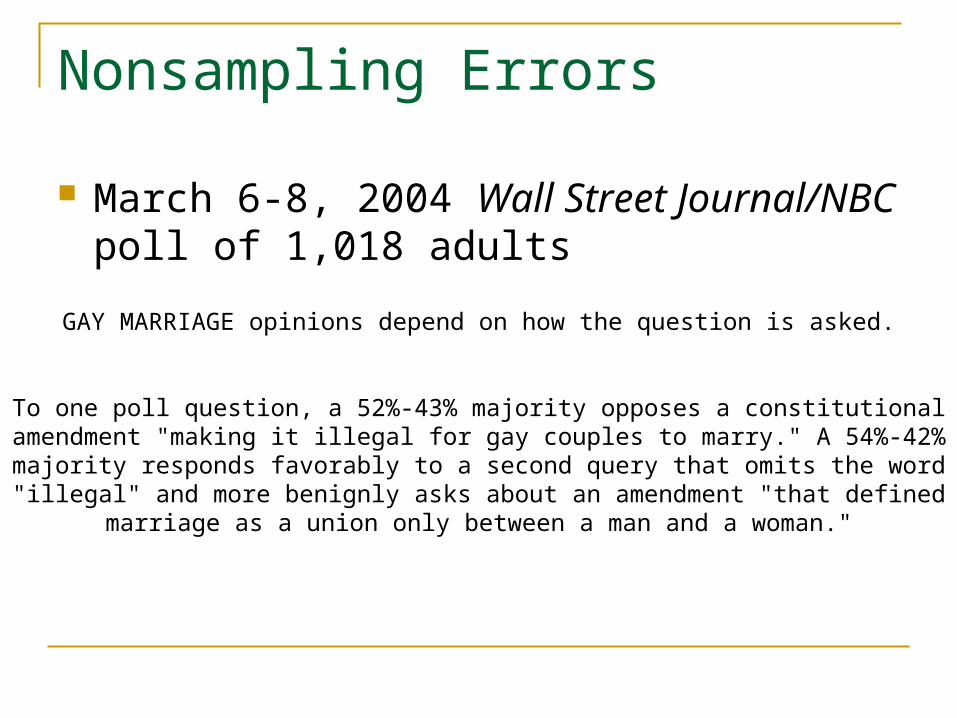
Nonsampling Errors
March 6-8, 2004 Wall Street Journal/NBC poll of 1,018 adults
GAY MARRIAGE opinions depend on how the question is asked.
To one poll question, a 52%-43% majority opposes a constitutionalamendment "making it illegal for gay couples to marry." A 54%-42%majority responds favorably to a second query that omits the word"illegal" and more benignly asks about an amendment "that defined
marriage as a union only between a man and a woman."
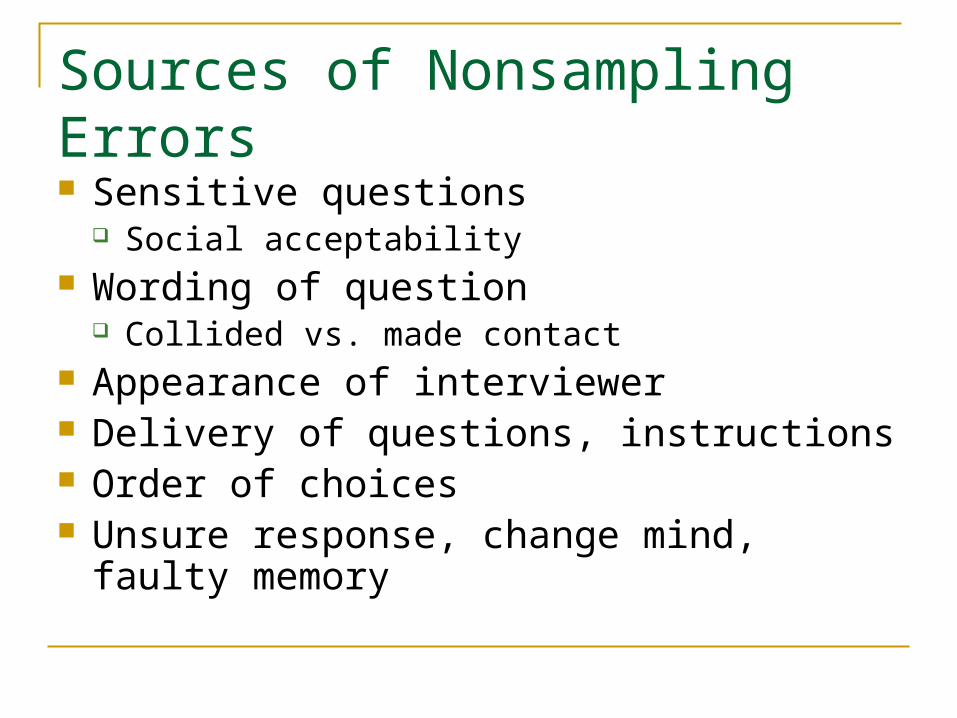
Sources of Nonsampling Errors Sensitive questions
Social acceptability Wording of question
Collided vs. made contact Appearance of interviewer Delivery of questions, instructions Order of choices Unsure response, change mind, faulty
memory
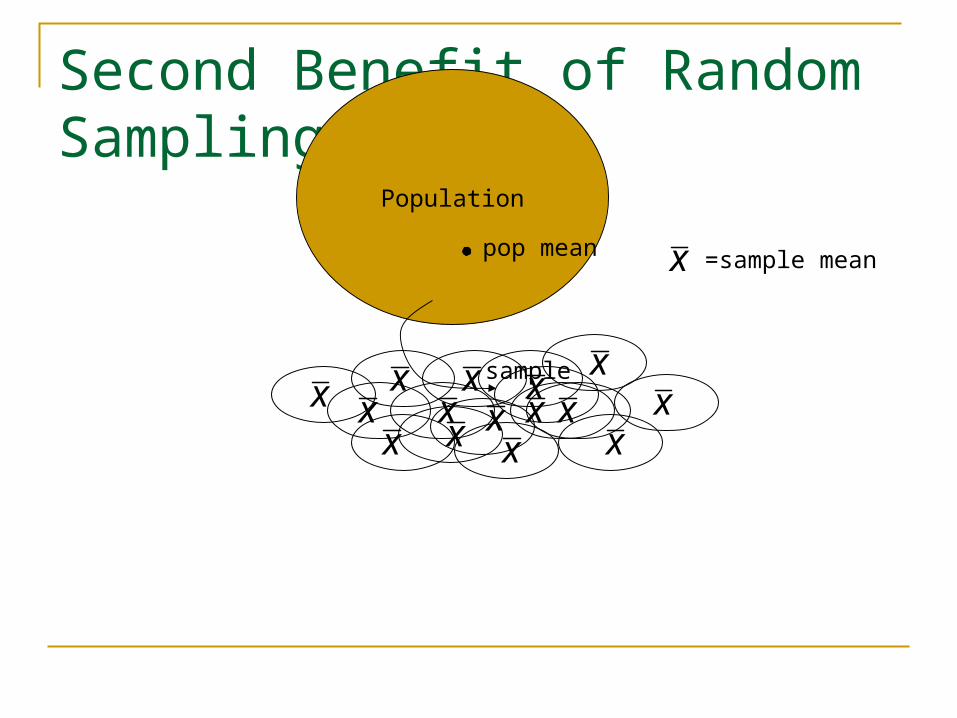
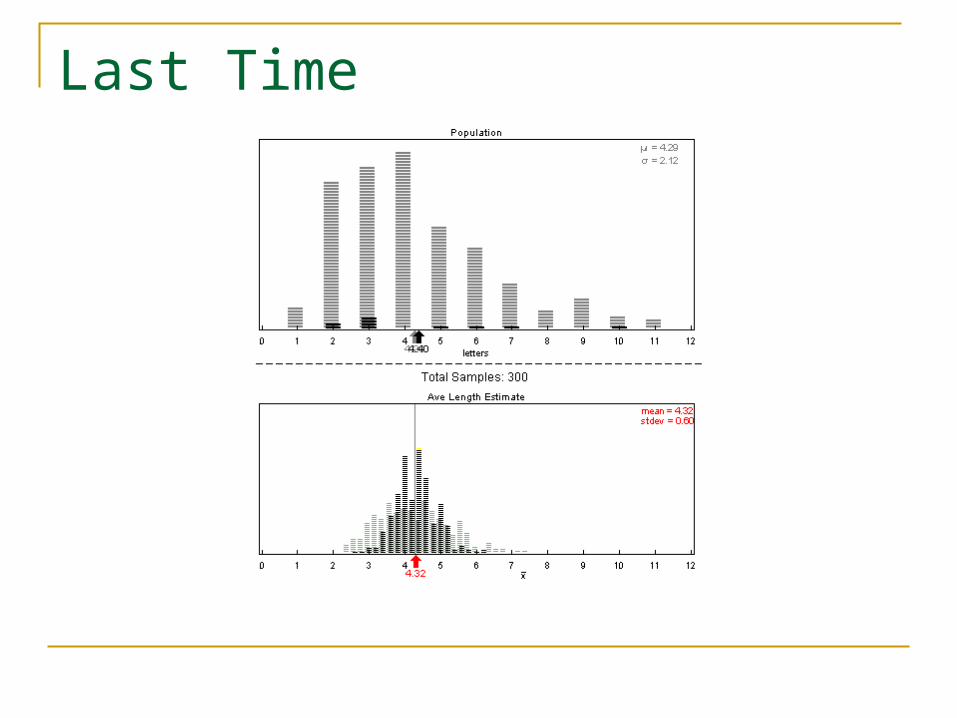
Second Benefit of Random Sampling Sample statistics follow a predictable,
probabilistic pattern Will always be some random sampling error
but we will be able to estimate its size…
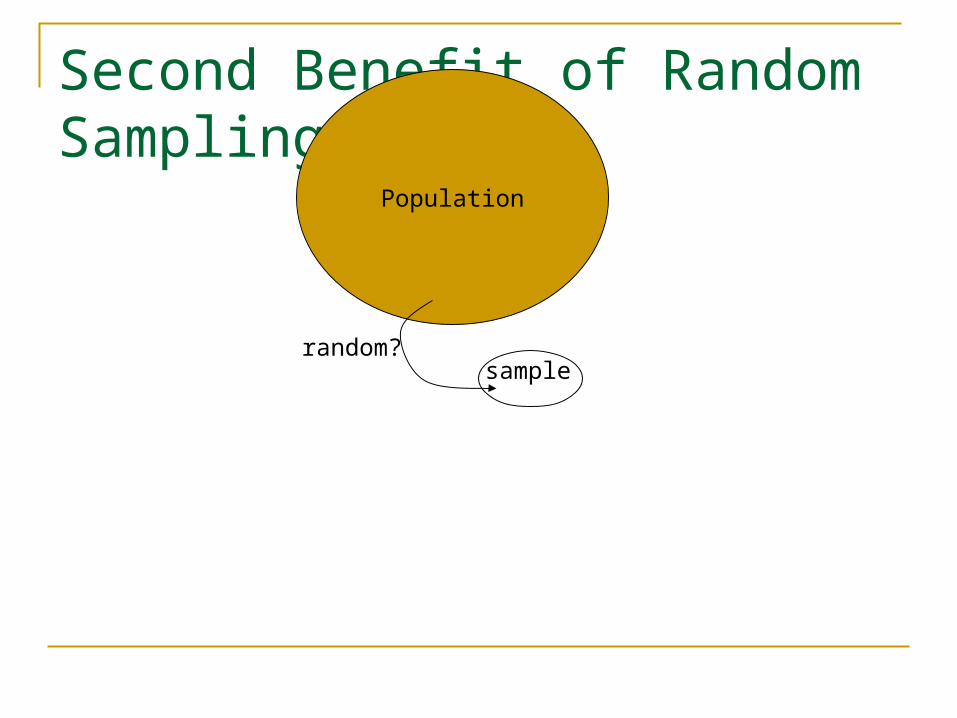
Second Benefit of Random Sampling
Population
samplerandom?
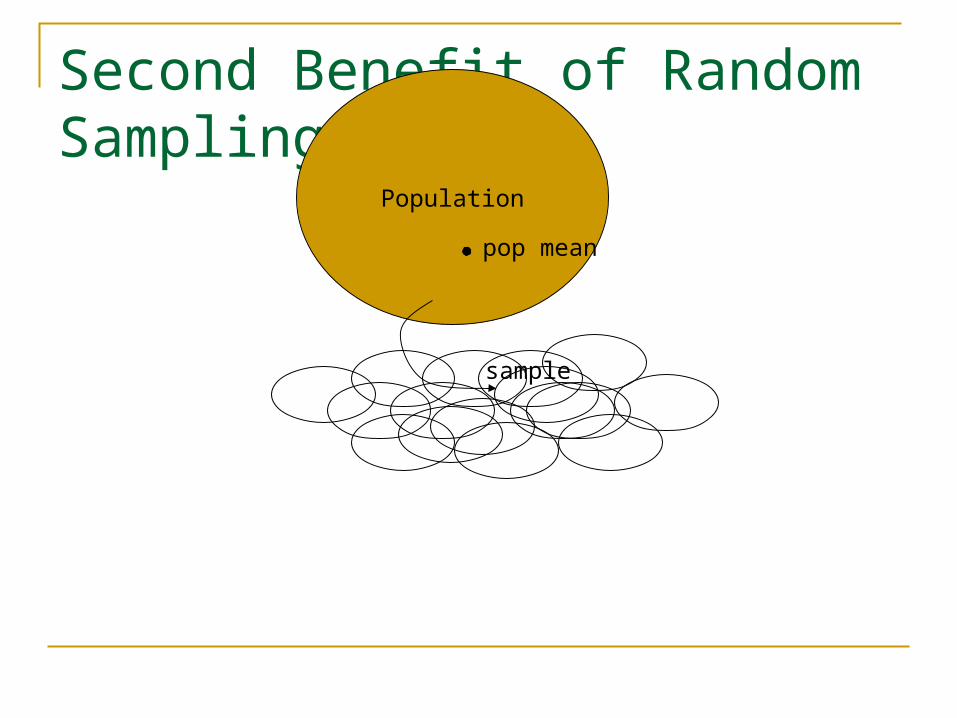
Second Benefit of Random Sampling
Population
sample
pop mean
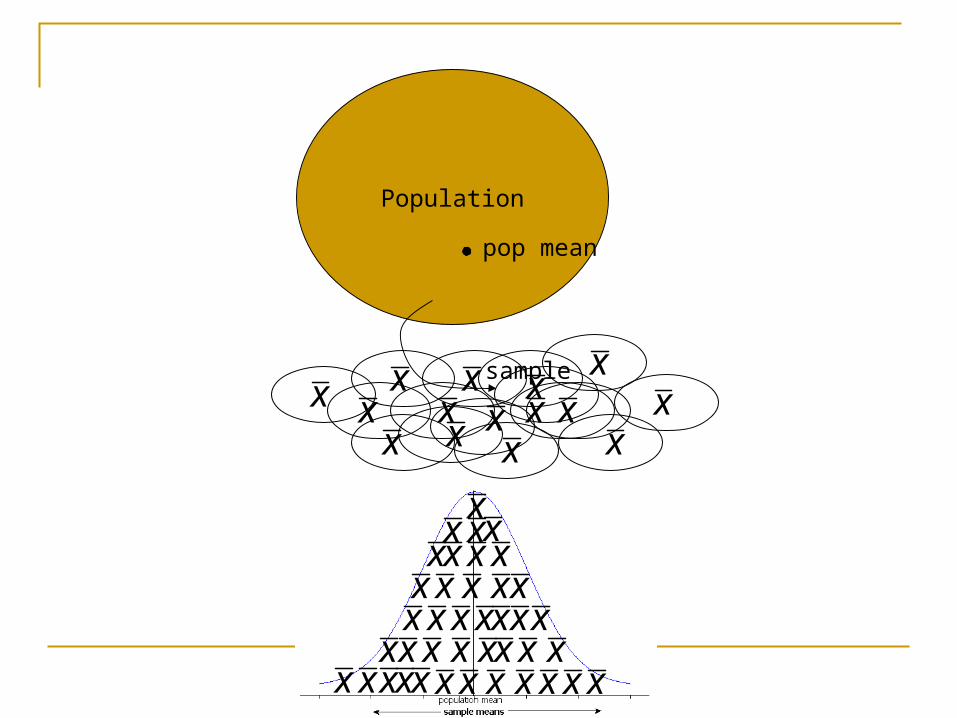
Second Benefit of Random Sampling
Population
samplex x
x
xxx
x x xx
xx
xx x
x =sample meanpop mean
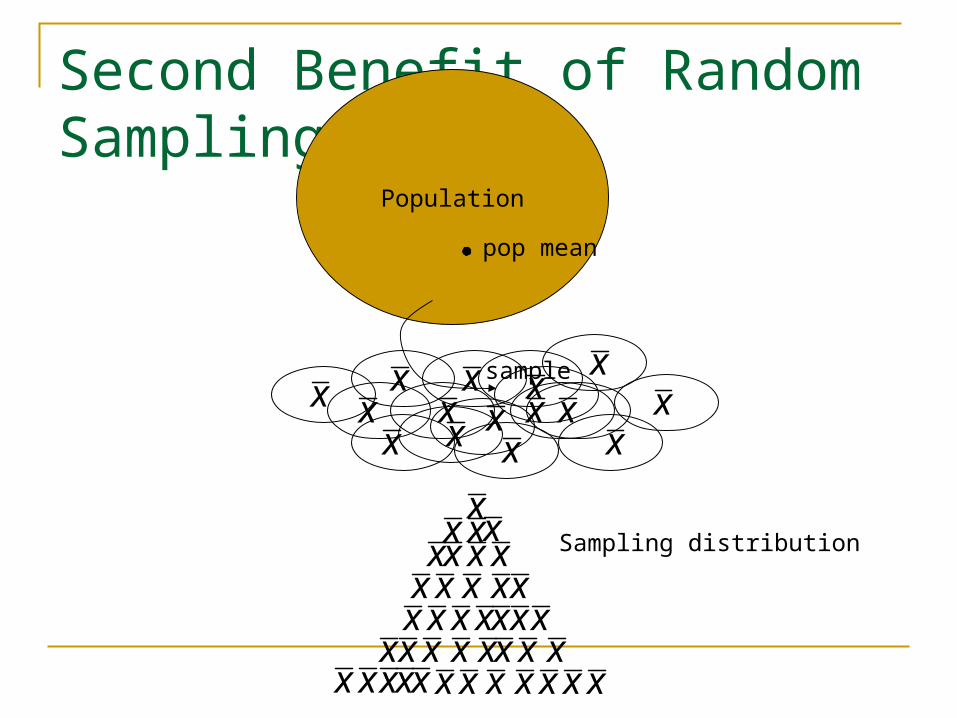
Second Benefit of Random Sampling
Population
samplex x
x
xxx
x x xx
xx
xx x
x xxx x x x x x x xxx x xx xx x x xx xx x x xxxx x xx xxx
xx xx
pop mean
Sampling distribution
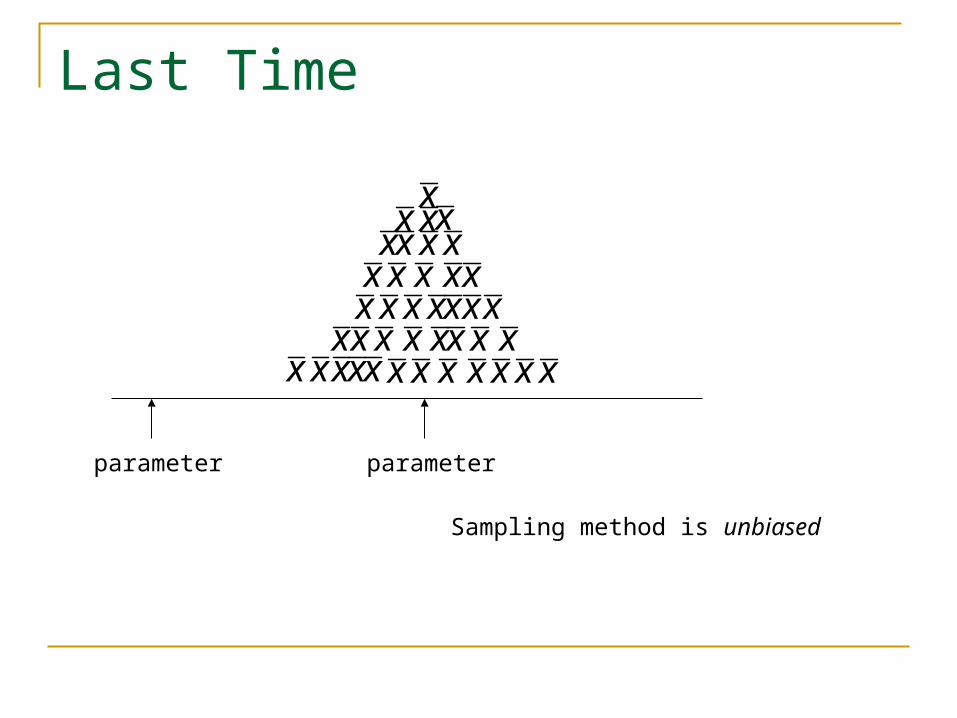
Last Time
x xxx x x x x x x xxx x xx xx x x xx xx x x xxxx x xx xxx
xx xx
parameter parameter
Sampling method is unbiased
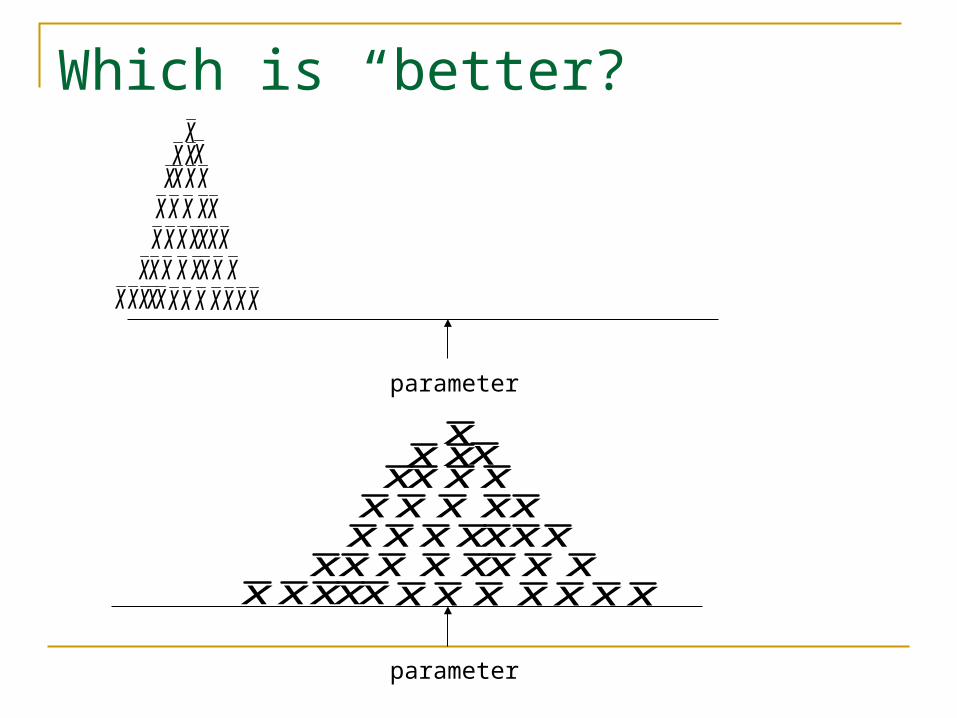
Which is “better?”
x xxx x x x x x x xxx x xx xx x x xx xx x x xxxx x xx xxx
xx xx
parameter
x xxx x x x x x x xxx x xx xx x x xx xx x x xxxx x xx xxx
xx xx
parameter
Last Time
Population size…
Population
samplex x
x
xxx
x x xx
xx
xx x
x xxx x x x x x x xxx x xx xx x x xx xx x x xxxx x xx xxx
xx xx
pop mean
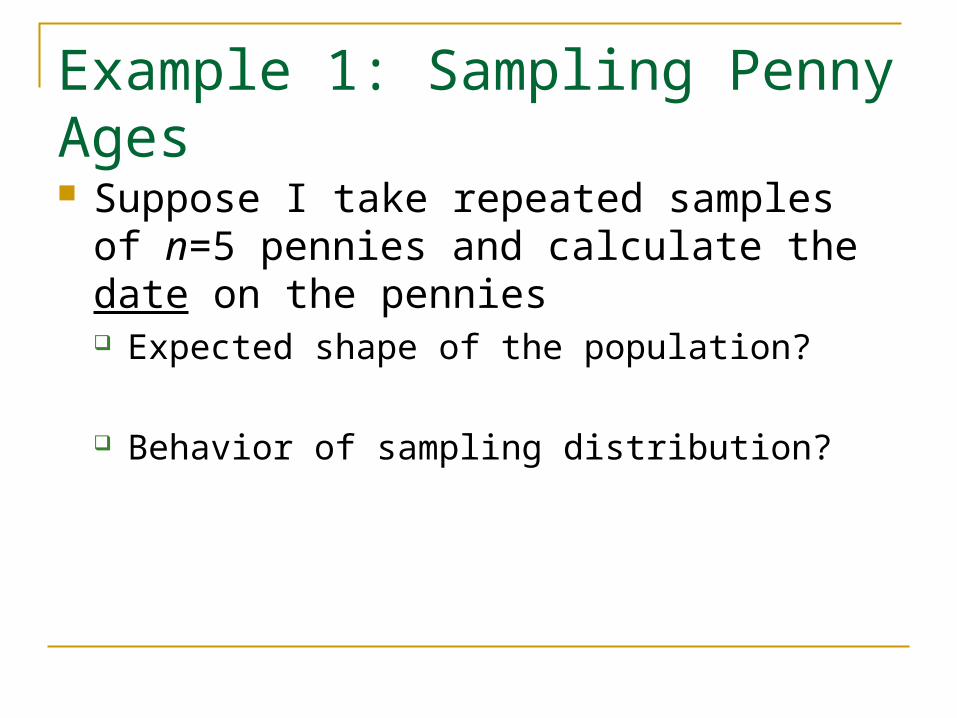
Example 1: Sampling Penny Ages Suppose I take repeated samples of n=5
pennies and calculate the date on the pennies Expected shape of the population?
Behavior of sampling distribution?
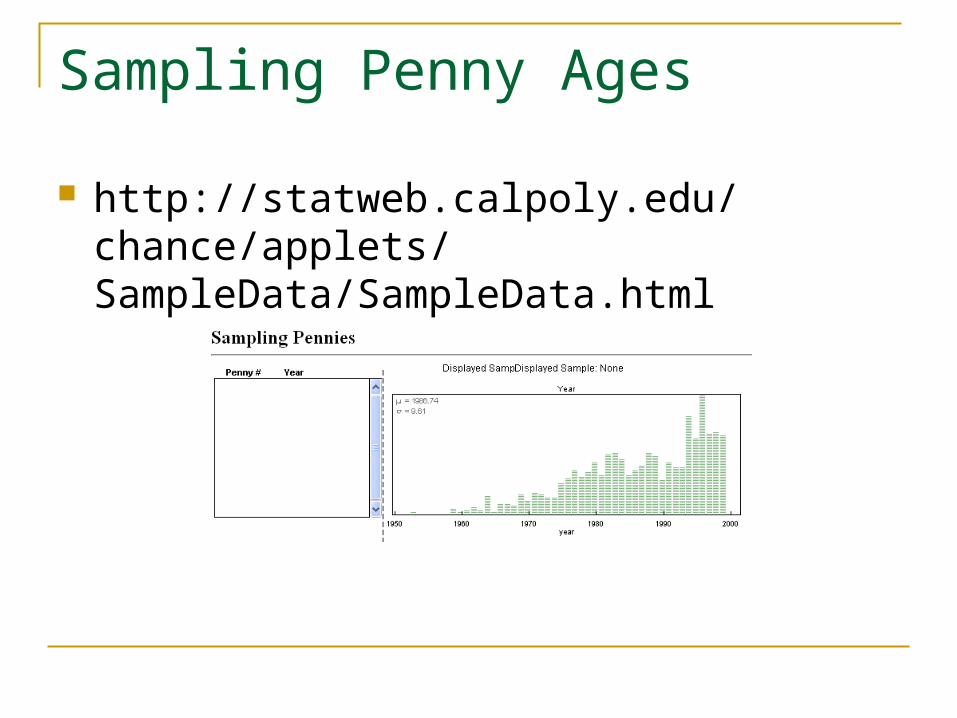
Sampling Penny Ages
http://statweb.calpoly.edu/chance/applets/ SampleData/SampleData.html
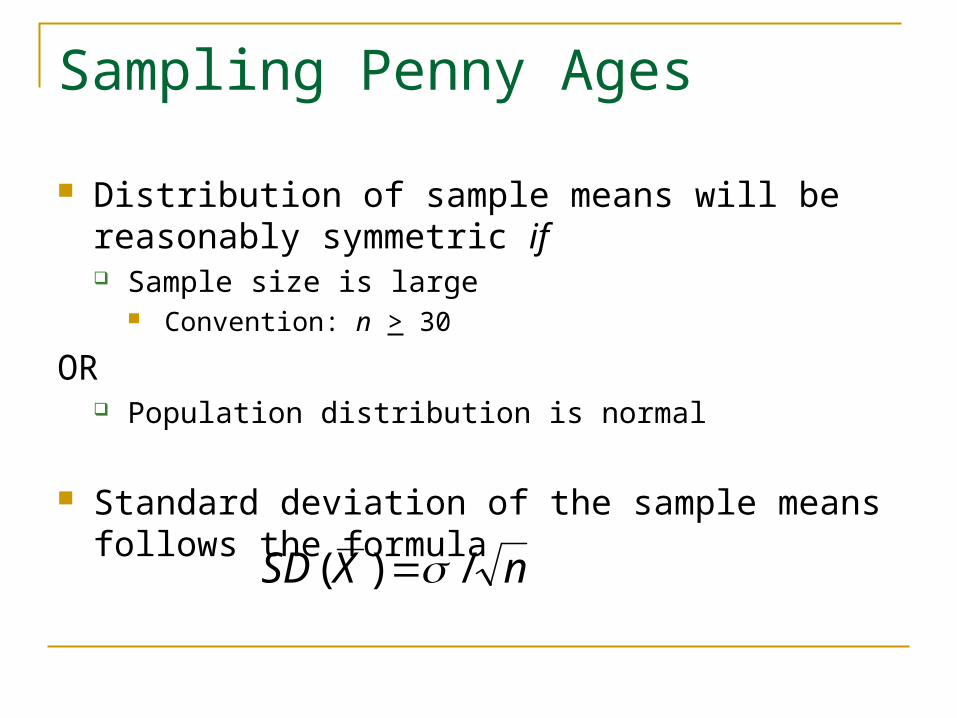
Sampling Penny Ages
Distribution of sample means will be reasonably symmetric if Sample size is large
Convention: n > 30
OR Population distribution is normal
Standard deviation of the sample means follows the formula
nXSD /)(

Normal Distribution
N()
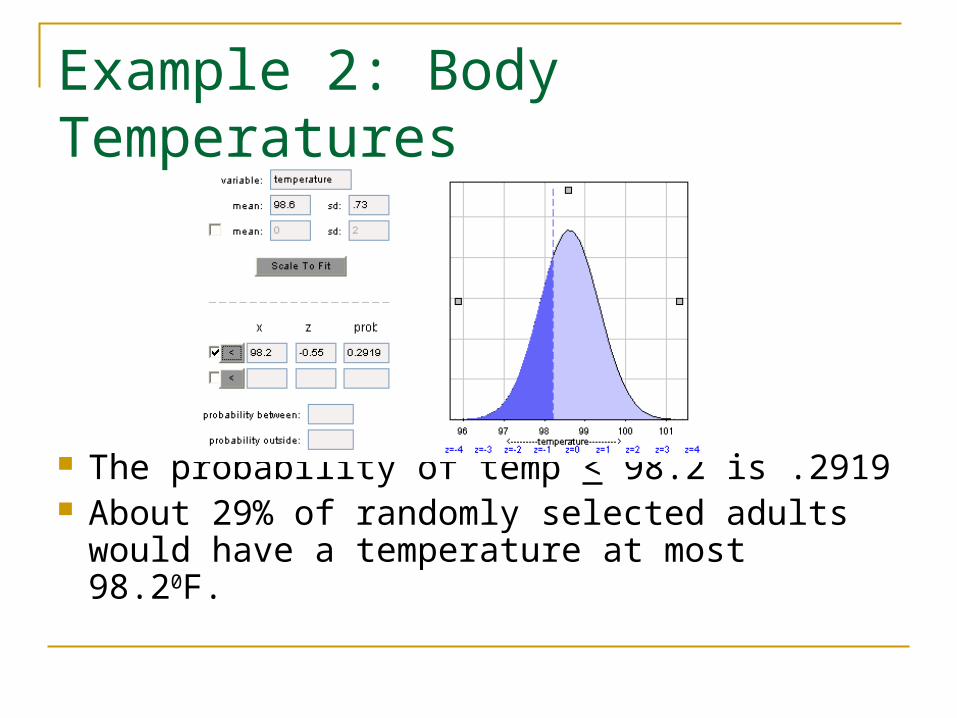
Example 2: Body Temperatures
The probability of temp < 98.2 is .2919 About 29% of randomly selected adults would
have a temperature at most 98.20F.

Example 2: Body Temperatures
There is only a 3% chance that a random person will have a temperature in excess of 1000F.
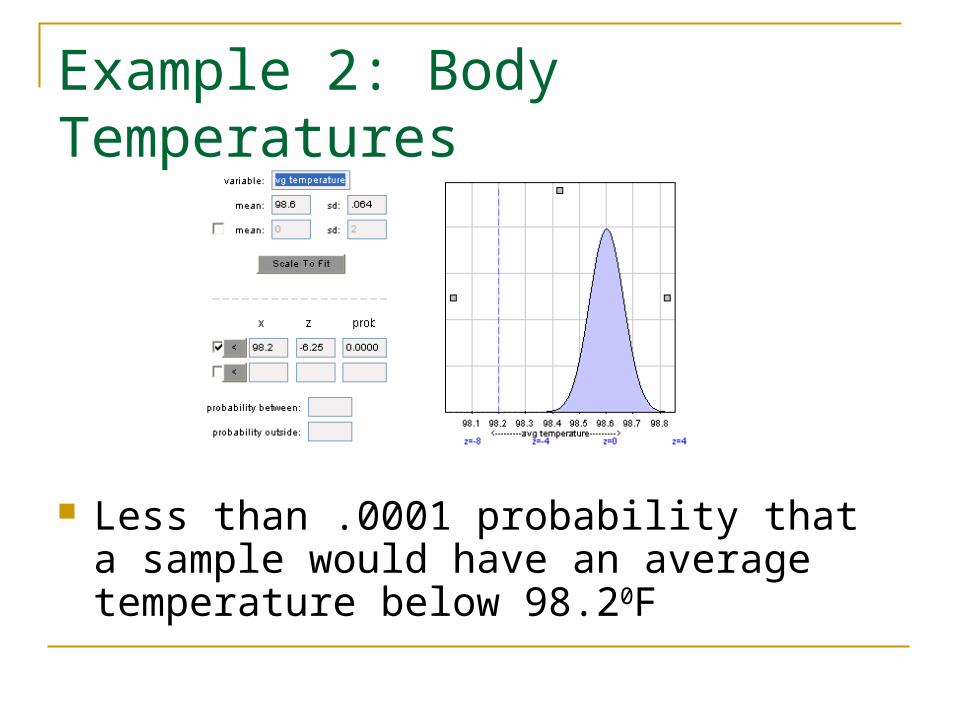
Example 2: Body Temperatures
Less than .0001 probability that a sample would have an average temperature below 98.20F
Example 2: Body Temperature We have strong evidence that a random
sample of 130 adults from a population with =98.60F would give a sample mean of 98.2 or less by chance alone
So after observing a sample mean of 98.2, we have strong evidence that the statement that =98.60F is wrong
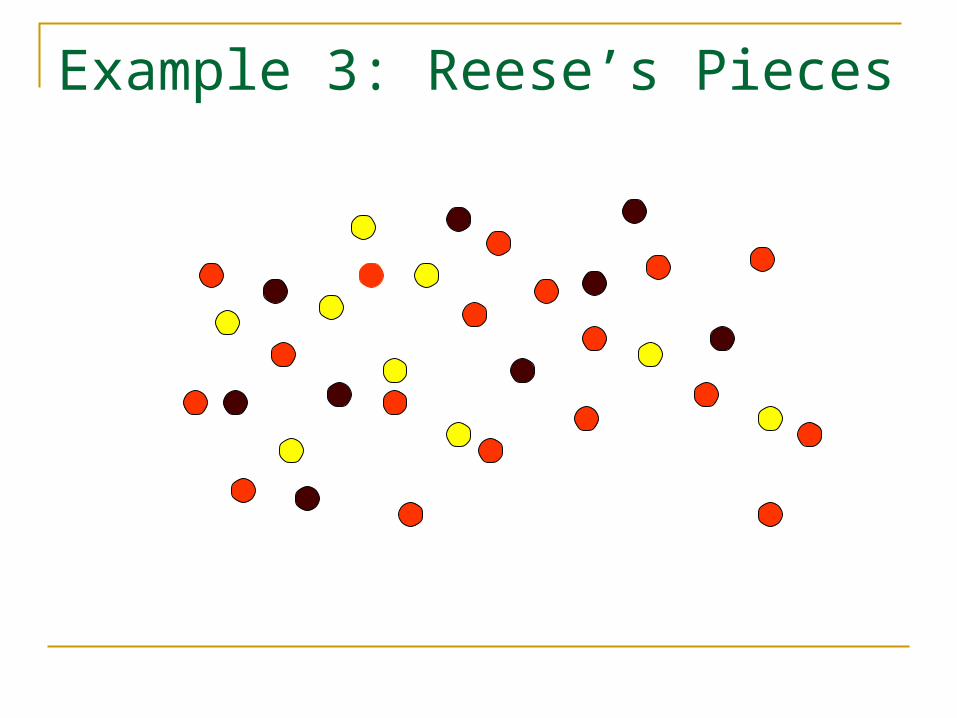
Example 3: Reese’s Pieces
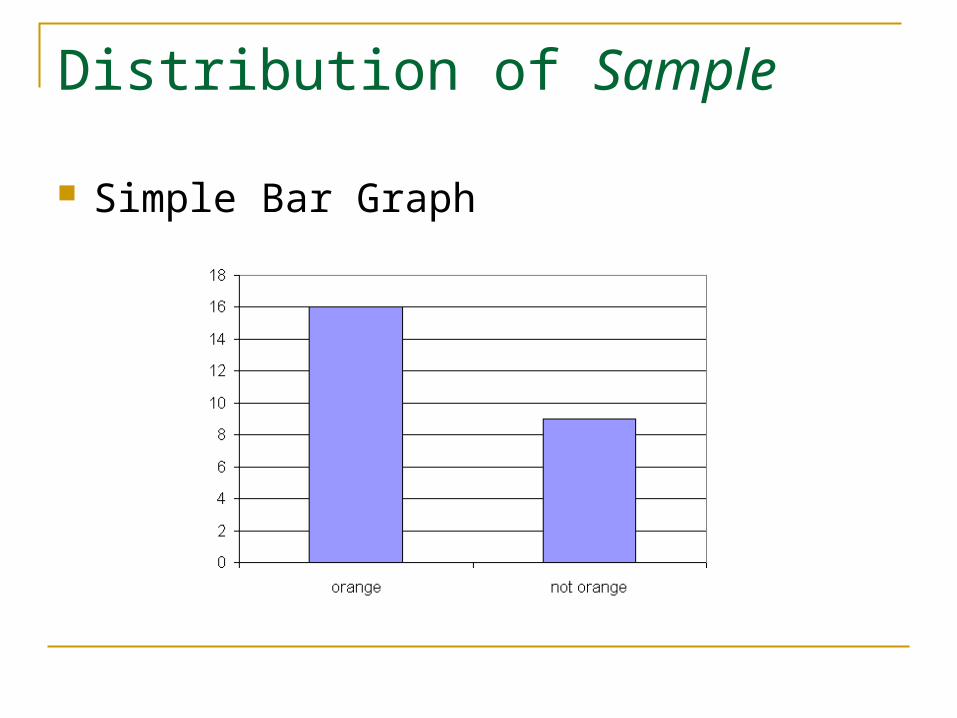
Distribution of Sample
Simple Bar Graph
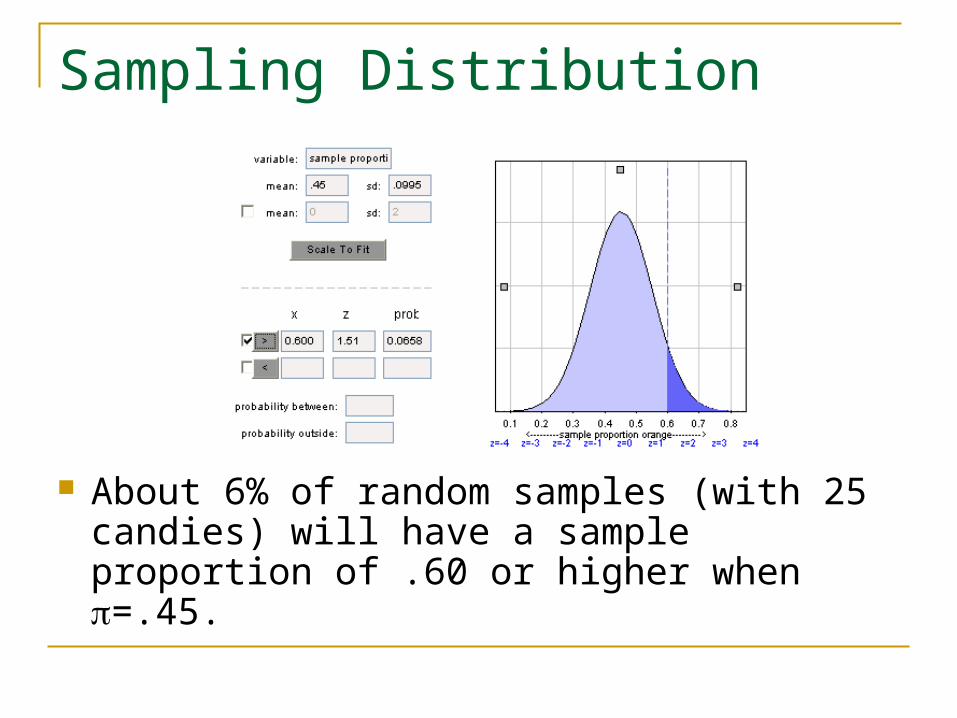
Sampling Distribution
About 6% of random samples (with 25 candies) will have a sample proportion of .60 or higher when =.45.
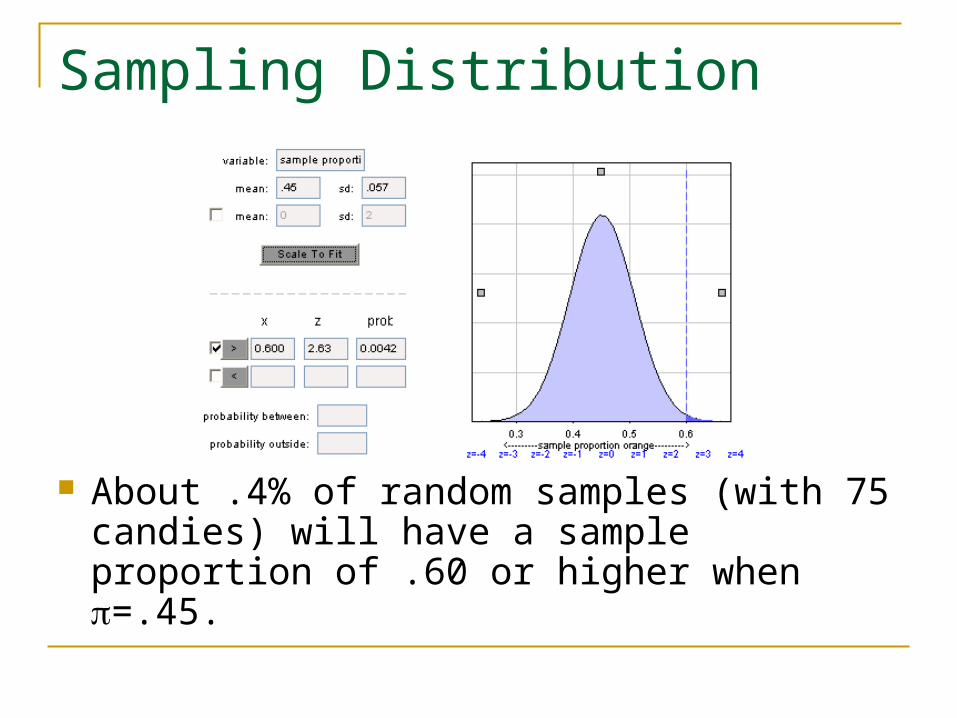
Sampling Distribution
About .4% of random samples (with 75 candies) will have a sample proportion of .60 or higher when =.45.
When n=3
Can’t use the CLT! Would need other methods to help your
friend
For Thursday
Submit PP 7 (3 pts) Read Ch. 6
Lots of new terminology but same basic reasoning…
HW 4 (by Friday)
Related Documents