Stat 31, Section 1, Last Time • Hypothesis Tests – H - , H 0 or H + version of testing – P-values – small for strong evidence – 1-sided (strong evidence for “>” or “<“) – 2-sided (strong evidence for “different”) • Cutoffs – Yes – no (P-val < 0.05, or not?) – Gray level (interpret level…)

Stat 31, Section 1, Last Time Hypothesis Tests –H -, H 0 or H + version of testing –P-values – small for strong evidence –1-sided (strong evidence for.
Dec 16, 2015
Welcome message from author
This document is posted to help you gain knowledge. Please leave a comment to let me know what you think about it! Share it to your friends and learn new things together.
Transcript

Stat 31, Section 1, Last Time
• Hypothesis Tests
– H-, H0 or H+ version of testing
– P-values – small for strong evidence
– 1-sided (strong evidence for “>” or “<“)
– 2-sided (strong evidence for “different”)
• Cutoffs
– Yes – no (P-val < 0.05, or not?)
– Gray level (interpret level…)
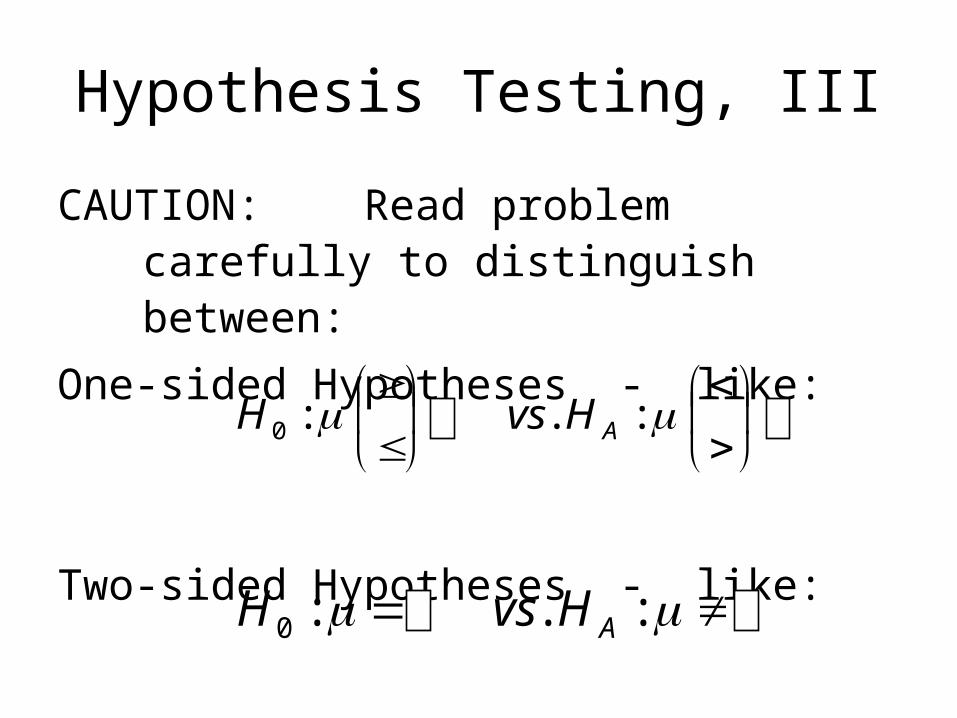
Hypothesis Testing, III
CAUTION: Read problem carefully to distinguish between:
One-sided Hypotheses - like:
Two-sided Hypotheses - like:
:.:0 AHvsH
:.:0 AHvsH
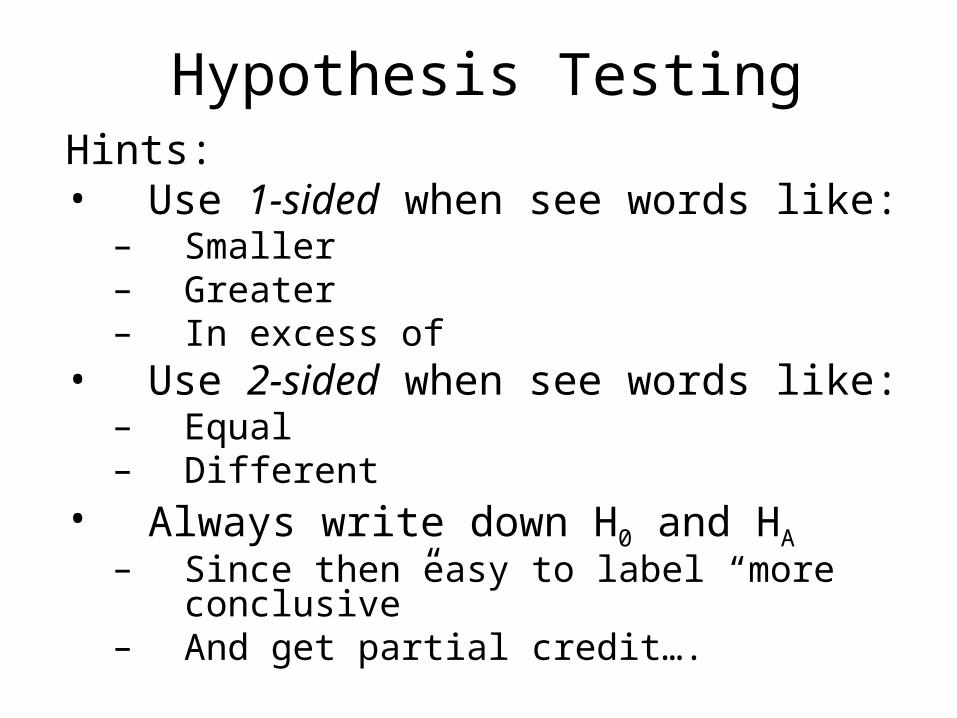
Hypothesis TestingHints:• Use 1-sided when see words like:
– Smaller– Greater– In excess of
• Use 2-sided when see words like:– Equal– Different
• Always write down H0 and HA – Since then easy to label “more conclusive”– And get partial credit….

Hypothesis Testing
E.g. Text book problem 6.32:
In each of the following situations, a
significance test for a population mean,
mu is called for. State the null
hypothesis, H0 and the alternative
hypothesis, HA in each case….

Hypothesis TestingE.g. 6.32aExperiments on learning in animals
sometimes measure how long it takes a mouse to find its way through mazes. The mean time is 18 seconds for one particular maze. A researcher thinks that a loud noise will cause the nice to complete the maze faster. She measures how long each of 10 mice takes with a noise as stimulus.
= time to finish with loud noise.18:0 H 18: AH

Hypothesis TestingE.g. 6.32bThe examinations in a large history class are
scaled after grading so that the mean score is 50. A teaching assistant thinks that his students have a higher average score than the class as a whole. His students can be considered as a sample from the population of all students he might teach, so he compares their score with 50.
= average score for all students of this TA50:0 H 50: AH

Hypothesis TestingE.g. 6.32cThe Census Bureau reports that households
spend an average of 31% of their total spending on housing. A homebuilders association in Cleveland wonders if the national finding applies in their area. They interview a sample of 40 households in the Cleveland metropolitan area to learn what percent of their spending goes toward housing.
= avg. % for housing in Cleveland %31:0 H %31: AH

Hypothesis Testing
E.g. Textbook problem 6.34
Translate each of the following research
questions into appropriate and0H AH

Hypothesis TestingE.g. 6.34aCensus Bureau data shows that the mean
household income in the area served by a shopping mall is $62,500 per year. A market research firm questions shoppers at the mall to find out whether the mean household income of mall shoppers is higher that that of the general population.
= average income of mall shoppers 500,62$:0 H
500,62$: AH

Hypothesis TestingE.g. 6.34bLast year, your company’s service
technicians took an average of 2.6 hours to respond to trouble calls from business customers who had purchased service contracts. Do this year’s data show a different average response size?
= average response time 6.2:0 H6.2: AH

Hypothesis Testing
HW on setting up hypotheses:
6.31, 6.33

Hypothesis Testing
Connection between Confidence Intervals
and Hypothesis Tests:
Reject at Level 0.05 P-value < 0.05
dist’n
Area < 0.05
0.95 margin of error
mX
mXmX , CIinnot 95.0
X

Hypothesis Testing & CIs
Reject at Level 0.05
Notes:
1. This is why EXCEL’s CONFIDENCE function uses = 1 – coverage prob.
2. If only care about 2-sided hypos, then could work only with CIs
(and not learn about hypo. tests)
CIinnot 95.0

Hypothesis Testing & CIs
HW: 6.63, 6.64
(a. [59.99,63.59] b. No, 61.3 inside c. No, 63 inside)

Hypothesis Testing
The three traps of Hypothesis Testing
(and how to avoid them…)
Trap 1: Statistically Significant is different
from Really Significant
(don’t confuse them)

Hypothesis Testing Traps
Trap 1: Statistically Significant is different
from Really Significant
E.g. To test a painful diet program, 10,000
people were put on it. Their average
weight loss was 1.7 lbs, with s = 73.
Assess “significance” by hypothesis testing.

Hypothesis Testing Traps
Trap 1: Statistically Significant is different
from Really Significant
See Class Example 23: Trap 1https://www.unc.edu/~marron/UNCstat31-2005/Stat31Eg23.xls
P-value = 0.0099
Strongly Statistically Significant
Careful: Is this practically significant?

Hypothesis Testing Traps
Trap 1, e.g: Is this practically significant?
NO! Not worth painful diet to lose 1.7 lbs.
Resolution: Hypo. testing resolves question:
Could observed results be due to
chance variation?
Answer here is no, since n is really large.

Hypothesis Testing Traps
Trap 1, e.g: Is this practically significant?
Answer here is no, since n is really large.
But this is different from question:
Do results show a big difference?

Hypothesis Testing Traps
Trap 2: Insignificant results do not mean
nothing is there,
Only: Didn’t have strong enough data to
actually prove results.
E.g. Class 23, Trap 2https://www.unc.edu/~marron/UNCstat31-2005/Stat31Eg23.xls

Hypothesis Testing Traps
Trap 3: Try enough tests, and you will find “something” even where it doesn’t exist.
Revisit Class Example 21, Q4https://www.unc.edu/~marron/UNCstat31-2005/Stat31Eg21.xls
We saw about 5% of CIs don’t cover.
So, (using CI – Hypo Test connection), expect about 5% of tests to choose HA,
(and claim “strong evidence) even when H0 true.

Hypothesis Testing Traps
Strategies to avoid Trap 3:
1. Scientific Method:
Form Hypothesis tests once.
2. For repeated tests: use careful adjustments:
(beyond scope of this course)
Get help if needed

Hypothesis Testing Traps
HW: 6.69, 6.71, 6.73, 6.75, 6.77

And now for something completely different…
A statistician’s view on politics…
Some Current Controversial Issues:
• North Carolina State Lottery
• Replace Social Security by Individual Retirement Plans
Debate is passionate, (natural for complex and important issues)
But what is missing?

And now for something completely different…
Review Ideas on State Lotteries,
from our study of Expected Value
Not an obvious choice because:
• Gambling is (at least) unsavory:– Religious objections– Some like it too much– Destroys some lives

And now for something completely different…
State Lotteries, not an obvious choice:• The only totally voluntary tax:
– Nobody required, unlike all other taxes– Money often used for education– Good or bad, given state of economy???
• Highest tax burden on the poor– Poor enjoy playing much more– Higher taxes on poor better for society???– Tendency towards “rich get richer”???

And now for something completely different…
What about Individual Retirement Plans:
Main Benefit:
On average individual investments
return greater yields
than government investments
So can we conclude:
• “Overall we are all better off”???
• Since more total money to go around?

And now for something completely different…
Very common mistake in this reasoning:
• Notice “on average” part of statement
• Should also think about variation about
the average???

And now for something completely different…
Variation about average Issue 1:
• Should think of population of people
• Average is over this population
• Except some to do great
• And expect some to lose everything
• What will the percentage of losers be?
• What do we do with those who lose all?
• What will that cost?

And now for something completely different…
Variation about average Issue 2:
• Also are averaging over time
• Overall gains of stock market happen only over this average
• Some need $$$ when market is down
• How often will this happen?
• How do we deal with it?

And now for something completely different…
Main concept I hope you carry away from this course:
Variation is a fundamental concept
• Look for it
• Think about it
• Ask questions about it
(Vital to informed citizenship)

And now for something completely different…
Australian joke about Variation:
Did you hear about the man who drowned in a lake with average depth 6 inches?

And now for something completely different…
Australian joke about Variation:
He understood “average”, but not variation about the average

And now for something completely different…
Really have such lakes?
Yes, in Australia

And now for something completely different…
Suggestions of such issues (politics, controversy…) for discussion are welcome….

Hypothesis Testing
Other views of hypothesis testing:
View 2: Z-scores
Idea: instead of reporting p-value (to assess statistical significance)
Report the Z-score
A different way of measuring significance

Hypothesis Testing – Z scores
E.g. Fast Food Menus:
Test
Using
P-value = P{what saw or m.c.| H0 & HA bd’ry}
000,20$:0 H
000,20$: AH
10,400,2$,000,21$ nsX

Hypothesis Testing – Z scores
P-value = P{what saw or or m.c.| H0 & HA bd’ry}
rybdXP '|000,21$
000,20$|000,21$ XP
102400$
000,20$000,21$
nsX
P
317.1 ZP

Hypothesis Testing – Z scores
P-value
This is the Z-score
Computation: Class E.g. 22, Part 6https://www.unc.edu/~marron/UNCstat31-2005/Stat31Eg22.xls
Distribution: N(0,1)
317.1 ZP

Hypothesis Testing – Z scores
P-value
So instead of reporting tail probability,
Report this cutoff instead,
as “SDs away from mean $20,000”
HW: 6.59 , but use NORMDIST, not Table D
317.1 ZP

Hypothesis Testing
View 3: level testing
Idea: instead of reporting P-value, choose a
fixed level, say 5%
Then reject H0, i.e. find strong evidence…
When P-value < 0.05 (more generally )
(slight recasting of yes-no version of testing)
HW: 6.53 (careful, already assigned above)
Related Documents