Stat 203 Week 3 Agenda Frequency asked quesons about the assignment. Introducon to tophat Probability , condional probability, marginal, and Bayes rule Lots of probability examples. Correlaon vs associaon. Scaerplots.

Welcome message from author
This document is posted to help you gain knowledge. Please leave a comment to let me know what you think about it! Share it to your friends and learn new things together.
Transcript
Stat 203 Week 3 Agenda
Frequency asked questions about the assignment.Introduction to tophat
Probability, conditional probability, marginal, and Bayes rule
Lots of probability examples.Correlation vs association.Scatterplots.

Assignment/Notes Frequently Asked Questions
Q: Where is the 'change dir' function for R on a Mac? A: Misc -> Change working direction
Q: Does this have to be typed, or can it be written?A: Typed is better, but written works if it's scanned into a PDF format using an app like TinyScanner.
Q: Do we have to do all these questions?A: No, only the graded ones.
Q: R for all of them?A: No, only the ones with stars (and datasets listed).

Q: My answer key says the answers for 2.31 (guineapigs) is different than what my computer says.A: Ignore the answer key, I removed 12 of the data points.
Q: There's no dataset for 3.23, but it wants a histogram.A: Only a frequency table is given, not the data. The histogram can bedrawn by hand.
Q: For the 3sd rule, it says 3*15...A: That should be 3*25

Document camera: Venn Diagrams

Document camera: Mutually exclusive

<break question 1>
Let T be the event that someone tests positive for a disease.Let D be the event that they have the disease.
We would assume that having a disease makes you more likely to test positive. So letPr(T | D) = 0.90Pr(T | not D) = 0.30 , and finallyPr(D) = 0.20
What is the probability of Test pos. AND have disease?

The union / ‘Or’ operator. If we take two events that never happen together , the probability of one event OR the other happened is the two probabilities added together.
Pr( Vancouver OR Toronto is voted the best city) = Pr( Vancouver is best) + Pr(Toronto is best)
They can’t both be the best city, so these events never happen together.
Another term for ‘never happening together’ is mutually exclusive.
Example: A lottery machine picks a single number from 1 to49.Pr( Machine picks 1 or 2) =Pr( Picks 1) + Pr(Picks 2)= 1/49 + 1/ 49 = 2/49
The (simplified) one-or-the-other formula is... Pr(A OR B) = Pr(A) + Pr(B)… when A or B can’t happen together.
We could also have written Pr( Picks 2 or less) = 2/49
For that matter, we could have written… Pr( Picks 3 or less) = Pr(Picks 1) + Pr(Picks 2) + Pr(Picks 3) = 1/49 + 1/49 + 1/49 = 3/49
Or even...Pr( Machine picks 10 or less)
10 numbers that are 10 or less 10 ---------------------------------------- = ------- 49 numbers in total 49

What happens when the two events are CAN happen together?
In other words, what happens when events A and B are NOT mutually exclusive?
We can't just add the chance of the two events because some events are going to get double counted.
By example, in a 52 card deck of cards, what is the chance of getting a King OR a Heart.
There are 4 kings, and there are 13 hearts.But there are only 16 cards that either a king OR a heart.

A , 2 , 3 , 4 , 5 , 6 , 7 , 8
9 , 10 , J , Q , K , K , K , .... K
If we were to add the probabilities as if they were mutually exclusive, we would over estimate the total probability.
Pr(King) = 4 / 52Pr(Heart) = 13 / 52Pr(King) + Pr(Heart) = 17 / 52
When we know by counting that

Pr(King OR Heart) = 16 / 52... where is the difference coming from?If we add the two possibilities directly, the king of hearts is counted in both sets.
A , 2 , 3 , 4 , 5 , 6 , 7 , 8
9 , 10 , J , Q , K
K , K , K , .... KThe FULL formula for finding Pr(A or B) is...

Pr(A or B) = Pr(A) + Pr(B) – Pr(A and B)
where Pr(A) + Pr(B) is getting the outcomes from both sets, and - Pr(A and B) one copy of each 'double counted' outcome.
Pr(King or Heart) = 4/52 + 13/52 – 1/52
If you don't know if two events are mutually exclusive, which formula is used?
Always use the full formula.If A and B are mutually exclusive, then Pr(A and B) = 0, therefore subtracting Pr(A and B) won't change anything.

The 'addition only' formula is just a convenient shortcut.
<break question 2>Two six-sided dice are rolled. (Rolls are independent)
Pr( First die rolls a 3) =
<break question 3>Two six-sided dice are rolled. (Rolls are independent)
Pr( Both dice roll 3s) =

<break question 4>Two six-sided dice are rolled. (Rolls are independent)
Pr( At least one die rolls a 3) =
(Hint: Mutually exclusive???)

In case you were wondering, there are dice of other than six-sides. (for interest)
Why is the one on the right problematic?

Sometimes the collection of events ‘A or B’ is written
‘A U B’.
The ‘U’, stands for ‘union’.A union is a collection of something, so A U B is the collection of all possible outcomes that are in either event A or B (or both).
Now let's talk about babies.

<break question 4>
Every baby is going to be born pre-term, normal, or late.
What is the chance that a baby will be born at the normal time?
Pr(Pre-Term) = 0.12Pr(Late) = 0.08

How did we know that Pr(Normal) would be 0.80?
Recall Pr(certainty) = 1
and we are certain that every baby has to fit into exactly one category: pre-term, normal, and late.SoPr(normal) = 1 – Pr(pre-term) – Pr(late)
= 1 – 0.12 – 0.08= 1 – 0.20 = 0.80

<break question 5>
What is the chance that any given baby will be born underweight AND pre-term?
Pr(Pre-Term) = 0.12Pr(Late) = 0.08Pr(Underweight | Pre-Term) = 0.60Pr(Underweight | Normal) = 0.20Pr(Underweight | Late) = 0.05

Document camera slide: Finding Pr(underweight AND pre-term) using a tree.

Correlation vs association
Association refers to any sort of trend between between any two variables.
Correlations are a specific type of association.
Correlation refers to a trend (usually linear) between any two variables of interval data pertaining to the same set of observations.
In each case 'trend' just means 'happens together'.

Examples of association:
Health science is more popular amongst women, computer science is more popular amongst men. There is an association between field of study and gender.
Lifetime incomes of post-secondary graduates is higher thanthat of high school graduates. There is a (positive) association between education level and lifetime income.

Examples of correlation*:
The weight of bearded dragons increases with the head-to-tail length of bearded dragons. This is a positive correlation.
Country by country, life expectancy at birth increases as the income-per-capita increases. This is a positive correlation.
Heating costs decrease as outdoor temperature increases. This is a negative correlation.
*Some examples have a non-linear component, we will revisit these later.
The most common graph to show two sets of interval data together is the scatter plot.

Each dot represents a subject. In Length vs. Weight, each dot is a dragon.

The height of the dot represents the length of the dragon.How far it is to the right represents the weight of the
dragon.

The dragon for this dot is 18cm long, and weighs 700g.There is an obvious upward trend in the graph. This shows apositive correlation.

The negative correlation between heating cost and outdoor temperature can be shown the same way.

The lack of correlation between two variables can also be show in a scatterplot.


Basil is happy(?) to be a data point.
Break question 6: (answers at slides end)

Break question 6:
The fee charged for any sort of event service (catering, flowers, space rental) is greater when the provider knows that it's for a wedding. This is an example of a ___________between event type and service cost.
a) Non-association.b) Association, but not a correlation.c) Positive correlation.d) Negative correlation.

Break question 7:
All else being equal, a vehicle with less mass (weight, usually) consumes less gasoline per kilometre. This is an example of a ___________ between vehicle mass (kg) and gasoline consumption (L/km).
a) Non-association.b) Association, but not a correlation.c) Positive correlation.d) Negative correlation.

Break question 8:
In other words a vehicle with less mass can travel further ona given amount of gasoline. This is an example of a ___________ between vehicle mass (kg) and gasoline EFFICIENCY (km/L).
a) Non-association.b) Association, but not a correlation.c) Positive correlation.d) Negative correlation.
Why?
Question 6: Event type is a categorical variable. For a correlation, BOTH variables must be numerical.
Question 7: As the mass INCREASES, the need for fuel INCREASES. Since these increase together, there is a positive correlation.
Question 8: As mass INCREASES, fuel efficiency DECREASES, so this is a negative correlation. Consider theunits you're using when finding a correlation.

Pearson coefficient
Pearson’s correlation coefficient refers to the strength and direction of a linear trend between two numerical variables (usually continuous, but not always).
It is the most popular to use and is considered the default option. If someone is referring to “the correlation”, it's almost always the Pearson correlation coefficient.
Much like how “mean” is the default of “average”.
Pearson correlation is always a value between -1 and 1 that tells how strong a correlation is and in what direction.

The stronger a correlation, the farther the coefficient is fromzero (and the closer it is to 1 or -1)

Positive correlations have positive coefficients r.Negative correlations have negative coefficients r.The stronger the negative correlation, the closer it is to -1.
A perfect correlation, one in which all the values fit perfectly on a line, has a correlation 1 (for positive) or -1 (for negative).

If there is no correlation at all, r will have a value of zero.
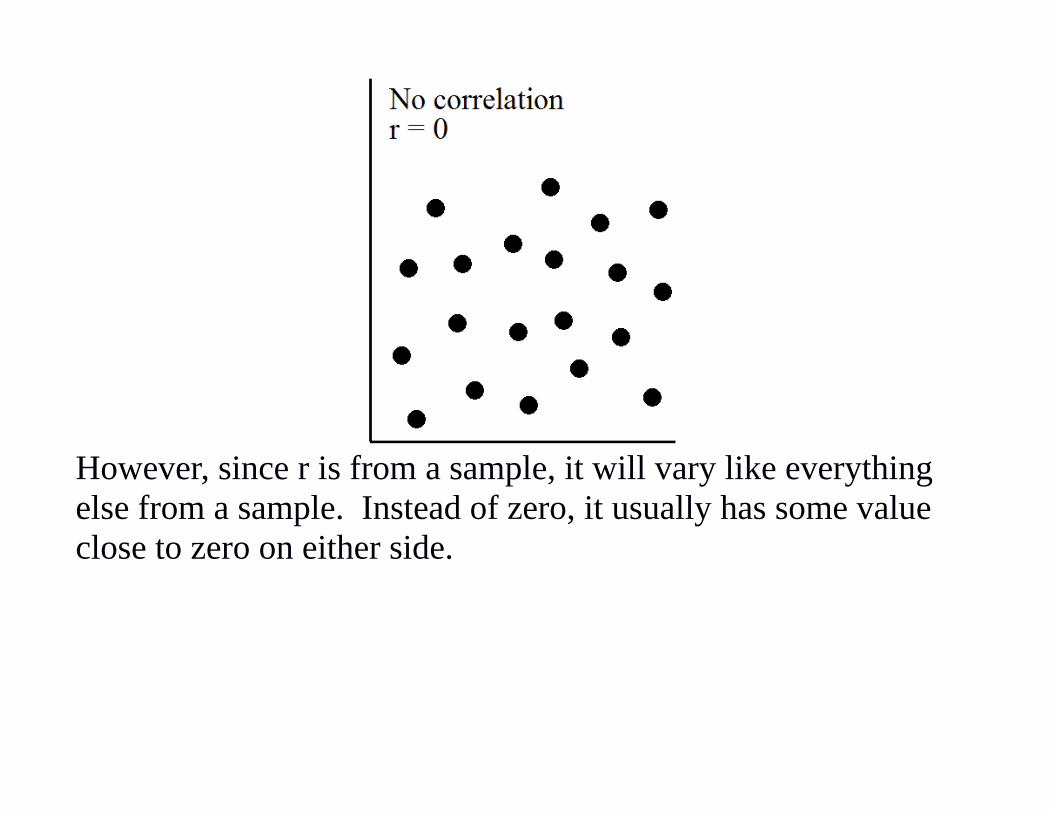
However, since r is from a sample, it will vary like everything else from a sample. Instead of zero, it usually has some value close to zero on either side.

But sometimes it doesn't come together right.
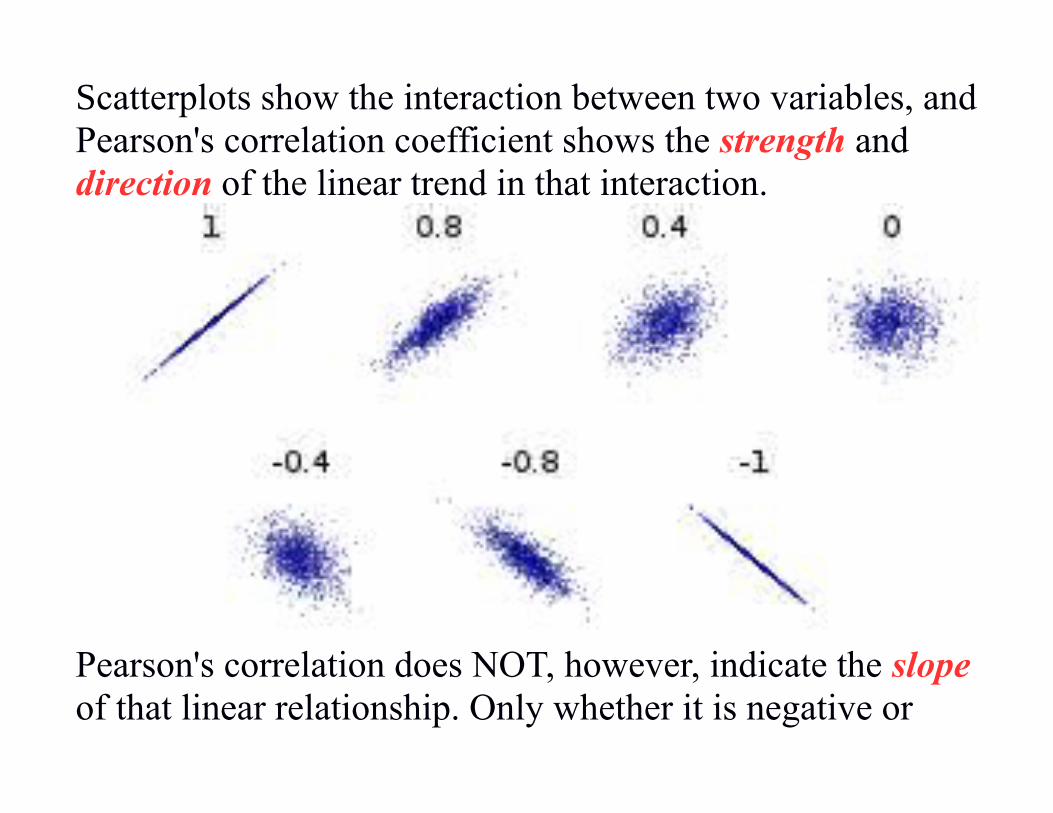
Scatterplots show the interaction between two variables, andPearson's correlation coefficient shows the strength and direction of the linear trend in that interaction.
Pearson's correlation does NOT, however, indicate the slopeof that linear relationship. Only whether it is negative or

positive.
It is also not an appropriate measure to describe non-linear relationships between variables.

In real world contexts, the most common form of non-linearrelationship is a curvilinear one. (See: Gapminder World)

Life expectancy increases with the logarithm of income, notlinearly with income. (See: Gapminder World)

In this case, the issue is one of diminishing returns.In other cases, a curvilinear relationship is the result of multiple competing factors.

(For interest: The optimum difficulty is called the Zone of Proximal Development, or ZPD)

Mathematically, non-linear means messy.

SAMPLING
One of the primary goals of statistics is to make statistical inferences on of a population.
A population is a blanket term for anything that is too large or difficult to measure directly.
Population Examples: - All the people living in Burnaby. - All the water in Deer Lake. - All the inpatients at VGH.

However, in a statistical sense, populations must be a well defined set of the same type of thing.
Population Non-Examples:
The city of Burnaby (what in the city? People? Cars?) All the water around (around where? One lake? In the sky?)
Statistical inferences are made about parameters, whichis some numeric variable of interest relating to the population.
Parameter examples:
- The average concentration of pollutant in Deer Lake (measured as ppm or mg/L),
- The average days that VGH inpatients have been admitted to the hospital,
-The proportion of VGH inpatients that have signs of pneumonia.
Parameters also need to be well-defined variables.

Parameter non-example:
-How sick are people at VGH right now ( ‘sick’ is ill-defined).
-Whether or not the patient in VGH Room 1234 has cancer. (does not pertain to a population).
Parameters are very difficult or impossible to measure directly because they involve the whole population.
However, we can take a sampleof a population and directly measure a statistic from that.

To repeat:
Statistics describe
Samples
Parameters describe
Populations

There are many ways to take a sample, but in this class we will assume that every sample is a simple random sample (SRS) unless it is stated otherwise.
In a simple random sample, each member of the population has an equal chance of being selected, and every possible sample has an equal chance of being selected.

If the parameter of interest is ‘proportion with pneumoniasigns’ and the population is ‘inpatients at VGH’, we can take a simple random sample (SRS) of 10 of the inpatients.
If we find that 6/10 of the patents have signs of pneumonia, then we could make an inference that 0.60 of all the inpatients have signs of pneumonia.

In all of these sample examples, we’re making one really big assumption:
The sample is representative of the population.
This lets us take the sample and generalize it to thewhole population.
e.g. A car we tested consumed 7.8L/100km, we assume that most cars of the same model and year will have similar mileage. *cough VW cough*

Not all sampling is simple.
It can be as fascinating as it is ugly.
Simple random sampling (SRS) is just one of many sampling options.
Other options involve mathematical complications, but have the their own practical advantages. These methodsinclude...
Non-random/convenience samples
Sampling the most convenient members of the population. This is the easiest, but least statistically validmethod.

Stratified samples/ two-level sampling
Splitting up the population into groups/strata first, sampling random groups, and using SRS without each group.
Sometimes this is easier than SRS and with similar results, especially when sampling over a large geographic area.

Quota sampling: Choosing beforehand the number of people from each group you want, and using SRS until that number from each group is met. Usually, for cost reasons, observations beyond each group's quota are rejected.
Systematic samples:
Taking observation from a population over time at fixedintervals. (e.g. at 11am of each day), used to account fornon-independence between observations that are near in time.

Snowball / Network / Recruitment / Respondent driven samples
Selecting a small 'seed' group of a population and having members of that seed group recruit new people into the sample.
Useful when a group is difficult to find, but well connected, such the homeless or endangered species.

Transect samples
Travelling along a selected geographical path (i.e. a transect) and taking every observed population member along the path as the sample.
Useful in field-based sciences such as forestry and environmental restoration.

Example: Opinion Polls.
Opinion polls are done by choosing phone numbersat randomand calling them.
This is:
SRS
Simple Random Sample (SRS) because there's no structure or plan, and every number is equally likelyto be dialed.

Example: Class opinion.
I try to get an opinion from the class by asking the front row.
This is:
Non-Random!!
Why is not random bad in this case?
People in the front of the class tend to be more engaged in the material and less likely to slumber. Engaged people are over-represented.

Polls on webpages and social media are self-selected. This means people are choosing for themselves to response, rather than being randomly chosen.

A simple random sample (SRS) is one where the chances of being in a sample are independent.

To stratify something means to divide it into groups (Geologically into layers)
To do stratified sampling, first split the population into different groups or strata. Often this is done naturally.
Possible strata: Sections of a course, gender, incomelevel, grads/undergrads any sort of category like that. Then, random select some of the strata.

The strata are selected using SRS.
Within each strata, select members of the population using SRS.

Example: Quality testing of milk.
A government agency wants to check if the milk from a company is up to code.
There are several trucks out leaving the plant today, each truck is a stratum. (single version of strata). The agency selects some of the trucks with SRS.

Each truck is carrying many jugs of milk, some jugs from each truck are selected by SRS.

Say they tested 50 jugs of milk from a total of 5 trucks (10 jugs each).
That’s a lot easier than stopping 50 trucks and testing 1 jug each. This is the appeal of stratified sampling.
Example: Employment survey.
A large company wants information about its workforce of 1000 full time employees and 500 part-time employees.
A company chooses both strata and uses SRS to select 80 from the full-time stratum and 40 from the part-time stratum.
8% of each strata is sampled this way.
Related Documents


![688 PUBLIC LAW 92-203-DEC. 18, 1971 [85 STAT. Public Law ... · 688 PUBLIC LAW 92-203-DEC. 18, 1971 [85 STAT. Public Law 92-203 December 18, 1971 ^^ ACT [H. R. 10367] To provide for](https://static.cupdf.com/doc/110x72/5f8d77a101657c07245509f6/688-public-law-92-203-dec-18-1971-85-stat-public-law-688-public-law-92-203-dec.jpg)