FISCAL NOTES , FEBRUARY 2016 | 1 FISCAL NOTES A REVIEW OF THE TEXAS ECONOMY FROM THE OFFICE OF GLENN HEGAR , TEXAS COMPTROLLER OF PUBLIC ACCOUNTS February 2016 Starting a New Business by Maria Garnett GLENN HEGAR , TEXAS COMPTROLLER OF PUBLIC ACCOUNTS As noted in the last issue of Fiscal Notes, the rate of new business formation is declining both nationally and in Texas. In this issue, we consider some of the hurdles involved in starting a new business. TEXAS STILL BUSINESS-FRIENDLY A number of public and private entities rank the states on tax climate and other aspects of business “friendliness.” One ranking, produced by the website Thumbtack.com, surveys small business owners on various aspects of business friendliness. The most recent survey, for 2015, is based on the responses of nearly 18,000 small business owners in 36 states. In 2015, Texas ranked first among these states for small-business friendliness; of the 10 most populous states, only Texas and Georgia ranked in the top 10 (Exhibit 1). The Thumbtack survey also ranks dozens of U.S. metropolitan areas, and all five of Texas’ largest cities ranked among the top 15 included in the survey (Exhibit 2). CONTINUED ON PAGE 3 ALSO INSIDE THIS ISSUE: TEXAS MOTOR FUELS TAXES 7 STATE REVENUE WATCH 11 HOW TEXAS COMPARES EXHIBIT 1 OVERALL SMALL-BUSINESS FRIENDLINESS RANK AND GRADES, 10 MOST POPULOUS STATES: 2015 OVERALL FRIENDLINESS RANK GRADE EASE OF STARTING A BUSINESS EASE OF HIRING OVERALL REGULATIONS HEALTH & SAFETY EMPLOYMENT, LABOR & HIRING TAX CODE LICENSING ENVIRONMENTAL ZONING TRAINING & NETWORKING TX 1 A+ A+ B A+ A A+ A+ A+ A A+ A GA 9 A A B B+ B B+ B+ B+ B+ B+ C+ OH 15 B B C- B B B+ B- B B+ B+ A- MI 20 B- B- B- B- C+ C+ C+ B- B B B FL 21 B- C+ C B B B A B- B B- C NC 23 B- C+ B+ B B- B+ B- B B- B+ B PA 28 C- C- C- D+ D+ C- D C C- D D+ NY 32 D F B- C C+ C C- C C+ C- B- CA 33 F F C F D+ F F F F D+ C- IL 35 F F C- D D F F F C C D+ Note: 36 states participated in the 2015 survey. Source: Thumbtack.com

Welcome message from author
This document is posted to help you gain knowledge. Please leave a comment to let me know what you think about it! Share it to your friends and learn new things together.
Transcript

F I S C A L N O T E S , F E B R U A R Y 2 0 1 6 | 1
FISCAL NOTESA R E V I E W O F T H E T E X A S E C O N O M Y F R O M T H E O F F I C E O F G L E N N H E G A R , T E X A S C O M P T R O L L E R O F P U B L I C A C C O U N T S
F e b r u a r y 2 0 1 6
Starting a New Business by Maria Garnett
G L E N N H E G A R , T E X A S C O M P T R O L L E R O F P U B L I C A C C O U N T S
As noted in the last issue of Fiscal Notes, the rate of new business formation is declining both nationally and in Texas. In this issue, we consider some of the hurdles involved in starting a new business.
TEXAS STILL BUSINESS-FRIENDLY A number of public and private entities rank the states on tax climate and other aspects of business “friendliness.” One ranking, produced by the website Thumbtack.com, surveys small business owners on various aspects of business friendliness. The most recent survey, for 2015, is based on the responses of nearly 18,000 small business owners in 36 states.
In 2015, Texas ranked first among these states for small-business friendliness; of the 10 most populous states, only Texas and Georgia ranked in the top 10 (Exhibit 1).
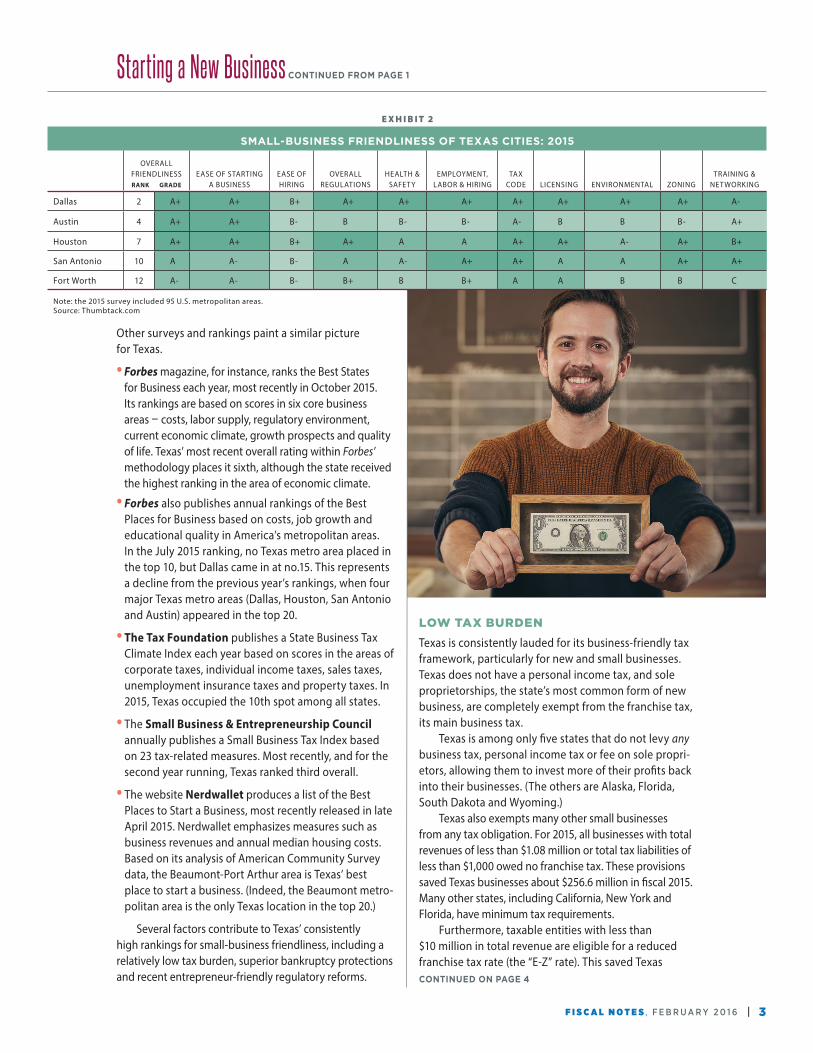
The Thumbtack survey also ranks dozens of U.S. metropolitan areas, and all five of Texas’ largest cities ranked among the top 15 included in the survey (Exhibit 2).CONTINUED ON PAGE 3
A L S O I N S I D E T H I S I S S U E :
TEXAS MOTOR FUELS TAXES 7
STATE REVENUE WATCH 1 1
HOW TEXAS COMPARES
E X H I B I T 1
OVERALL SMALL-BUSINESS FRIENDLINESS RANK AND GRADES, 10 MOST POPULOUS STATES: 2015
OVERALL FRIENDLINESS RANK GRADE
EASE OF STARTING A BUSINESS
EASE OF HIRING
OVERALL REGULATIONS
HEALTH & SAFETY
EMPLOYMENT, LABOR & HIRING
TAX CODE LICENSING ENVIRONMENTAL ZONING
TRAINING & NETWORKING
TX 1 A+ A+ B A+ A A+ A+ A+ A A+ A
GA 9 A A B B+ B B+ B+ B+ B+ B+ C+
OH 15 B B C- B B B+ B- B B+ B+ A-
MI 20 B- B- B- B- C+ C+ C+ B- B B B
FL 21 B- C+ C B B B A B- B B- C
NC 23 B- C+ B+ B B- B+ B- B B- B+ B
PA 28 C- C- C- D+ D+ C- D C C- D D+
NY 32 D F B- C C+ C C- C C+ C- B-
CA 33 F F C F D+ F F F F D+ C-
IL 35 F F C- D D F F F C C D+
Note: 36 states participated in the 2015 survey.Source: Thumbtack.com
2 | G L E N N H E G A R , T E X A S C O M P T R O L L E R O F P U B L I C A C C O U N T S
In the last issue of Fiscal
Notes, we took a look at the
decline of entrepreneurialism
in Texas and the U.S. The
plain fact is, new businesses
just aren’t being created at
the same rates as in the past,
and that’s a trend with potentially serious consequences
for our economy.
In this issue, we continue to examine this topic,
with a focus on the Texas environment for would-be
entrepreneurs. Our state has significant strengths — and
some weaknesses, too. We’ll tell you about the help and
hurdles Texans can expect when they take their first
steps into the arena of business ownership.
We’re also offering another in our series of in-depth
examinations of Texas’ major taxes, in this case those on
gasoline, diesel and other motor fuels.
All 50 states and the federal government levy
various taxes and fees on motor fuels, and ours are the
lowest among America’s largest states. They’re a vital
source of funding for road and bridge projects as well as
public education, but there are signs they’re not keeping
pace with the transportation demands of a vast and
fast-growing state.
As always, I hope you enjoy this issue!
G L E N N H E G A RTexas Comptroller of Public Accounts
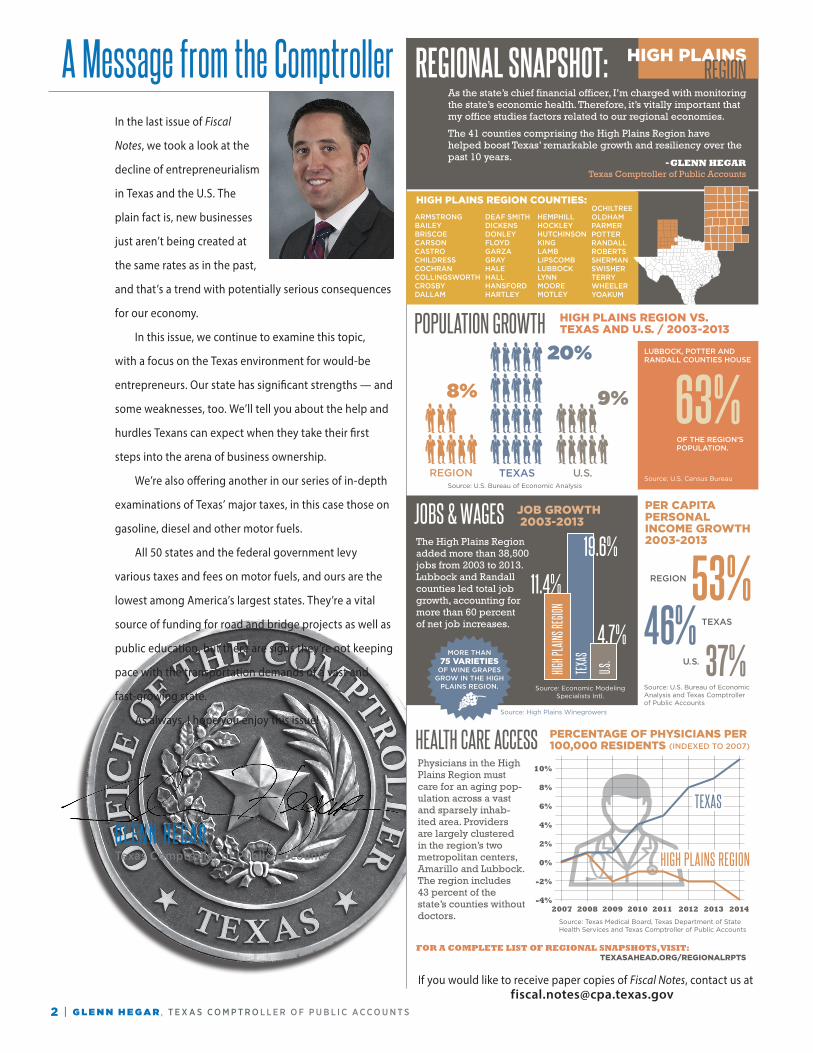
A Message from the Comptroller
If you would like to receive paper copies of Fiscal Notes, contact us [email protected]
FOR A COMPLETE LIST OF REGIONAL SNAPSHOTS, VISIT: TEXASAHEAD.ORG/REGIONALRPTS
Source: Texas Medical Board, Texas Department of State Health Services and Texas Comptroller of Public Accounts
REGIONAL SNAPSHOT:As the state’s chief financial officer, I’m charged with monitoring the state’s economic health. Therefore, it’s vitally important that my office studies factors related to our regional economies.
The 41 counties comprising the High Plains Region have helped boost Texas’ remarkable growth and resiliency over the past 10 years. - GLENN HEGAR
Texas Comptroller of Public Accounts
POPULATION GROWTH HIGH PLAINS REGION VS. TEXAS AND U.S. / 2003-2013
Source: U.S. Bureau of Economic Analysis
REGION U.S.TEXASSource: U.S. Census Bureau
JOBS & WAGES JOB GROWTH 2003-2013
Source: Economic Modeling Specialists Intl.
REGION
TEXAS
U.S.
PER CAPITA PERSONAL INCOME GROWTH 2003-2013
Source: U.S. Bureau of Economic Analysis and Texas Comptroller of Public Accounts
HEALTH CARE ACCESSPhysicians in the High Plains Region must care for an aging pop-ulation across a vast and sparsely inhab-ited area. Providers are largely clustered in the region’s two metropolitan centers, Amarillo and Lubbock. The region includes 43 percent of the state’s counties without doctors.
PERCENTAGE OF PHYSICIANS PER 100,000 RESIDENTS (INDEXED TO 2007)
ARMSTRONGBAILEYBRISCOECARSONCASTROCHILDRESSCOCHRANCOLLINGSWORTHCROSBYDALLAM
DEAF SMITHDICKENSDONLEYFLOYDGARZAGRAYHALEHALLHANSFORDHARTLEY
HIGH PLAINS REGION COUNTIES:HEMPHILLHOCKLEYHUTCHINSONKINGLAMBLIPSCOMBLUBBOCKLYNNMOOREMOTLEY
OCHILTREEOLDHAMPARMERPOTTERRANDALLROBERTSSHERMANSWISHERTERRYWHEELERYOAKUM
HIGH PLAINS
37%
53%46%
LUBBOCK, POTTER AND RANDALL COUNTIES HOUSE
8% 9%
20%
Source: High Plains Winegrowers
MORE THAN 75 VARIETIES
OF WINE GRAPES GROW IN THE HIGH
PLAINS REGION.
63%OF THE REGION’S POPULATION.
The High Plains Region added more than 38,500 jobs from 2003 to 2013. Lubbock and Randall counties led total job growth, accounting for more than 60 percent of net job increases.
19.6%
4.7%
U.S.
TEXA
S11.4%
HIGH P
LAINS
REGIO
N
10%
8%
6%
4%
2%
0%
-2%
-4%2007 2008 2009 2010 2011 2012 2013 2014
HIGH PLAINS REGION
TEXAS
REGION
F I S C A L N O T E S , F E B R U A R Y 2 0 1 6 | 3
Other surveys and rankings paint a similar picture for Texas.
• Forbes magazine, for instance, ranks the Best States for Business each year, most recently in October 2015. Its rankings are based on scores in six core business areas — costs, labor supply, regulatory environment, current economic climate, growth prospects and quality of life. Texas’ most recent overall rating within Forbes’ methodology places it sixth, although the state received the highest ranking in the area of economic climate.
• Forbes also publishes annual rankings of the Best Places for Business based on costs, job growth and educational quality in America’s metropolitan areas. In the July 2015 ranking, no Texas metro area placed in the top 10, but Dallas came in at no.15. This represents a decline from the previous year’s rankings, when four major Texas metro areas (Dallas, Houston, San Antonio and Austin) appeared in the top 20.
• The Tax Foundation publishes a State Business Tax Climate Index each year based on scores in the areas of corporate taxes, individual income taxes, sales taxes, unemployment insurance taxes and property taxes. In 2015, Texas occupied the 10th spot among all states.
• The Small Business & Entrepreneurship Council annually publishes a Small Business Tax Index based on 23 tax-related measures. Most recently, and for the second year running, Texas ranked third overall.
• The website Nerdwallet produces a list of the Best Places to Start a Business, most recently released in late April 2015. Nerdwallet emphasizes measures such as business revenues and annual median housing costs. Based on its analysis of American Community Survey data, the Beaumont-Port Arthur area is Texas’ best place to start a business. (Indeed, the Beaumont metro-politan area is the only Texas location in the top 20.)
Several factors contribute to Texas’ consistently high rankings for small-business friendliness, including a relatively low tax burden, superior bankruptcy protections and recent entrepreneur-friendly regulatory reforms.
Starting a New Business CONTINUED FROM PAGE 1
CONTINUED ON PAGE 4
LOW TAX BURDENTexas is consistently lauded for its business-friendly tax framework, particularly for new and small businesses. Texas does not have a personal income tax, and sole proprietorships, the state’s most common form of new business, are completely exempt from the franchise tax, its main business tax.
Texas is among only five states that do not levy any business tax, personal income tax or fee on sole propri-etors, allowing them to invest more of their profits back into their businesses. (The others are Alaska, Florida, South Dakota and Wyoming.)
Texas also exempts many other small businesses from any tax obligation. For 2015, all businesses with total revenues of less than $1.08 million or total tax liabilities of less than $1,000 owed no franchise tax. These provisions saved Texas businesses about $256.6 million in fiscal 2015. Many other states, including California, New York and Florida, have minimum tax requirements.
Furthermore, taxable entities with less than $10 million in total revenue are eligible for a reduced franchise tax rate (the “E-Z” rate). This saved Texas
E X H I B I T 2
SMALL-BUSINESS FRIENDLINESS OF TEXAS CITIES: 2015
OVERALL FRIENDLINESS RANK GRADE
EASE OF STARTING A BUSINESS
EASE OF HIRING
OVERALL REGULATIONS
HEALTH & SAFETY
EMPLOYMENT, LABOR & HIRING
TAX CODE LICENSING ENVIRONMENTAL ZONING
TRAINING & NETWORKING
Dallas 2 A+ A+ B+ A+ A+ A+ A+ A+ A+ A+ A-
Austin 4 A+ A+ B- B B- B- A- B B B- A+
Houston 7 A+ A+ B+ A+ A A A+ A+ A- A+ B+
San Antonio 10 A A- B- A A- A+ A+ A A A+ A+
Fort Worth 12 A- A- B- B+ B B+ A A B B C
Note: the 2015 survey included 95 U.S. metropolitan areas.Source: Thumbtack.com

4 | G L E N N H E G A R , T E X A S C O M P T R O L L E R O F P U B L I C A C C O U N T S
businesses an estimated $27.9 million in fiscal 2015. And most recently, the 2015 Texas Legislature approved a 25 percent reduction in the state franchise tax rate.
ASSET PROTECTIONTexas’ asset protections are among the nation’s most generous, protecting certain assets from seizure by creditors regardless of whether an individual files for bankruptcy protection. It’s an important consideration for those facing the financial risks of entrepreneurship.
Texas, moreover, is one of only a few states that allow most individuals filing for bankruptcy under state law to protect the entirety of their homesteads (Exhibit 3).
Texas’ statutes also include significant protection limits for personal property that frequently allow debtors to protect their equity in one motor vehicle per licensed driver in their families. Among the five largest states, only Texas usually allows debtors to protect a considerable amount of their equity in their homes and cars.
And Texas offers the choice of filing for bankruptcy under state or federal exemption laws, an option some other large states such as California, Florida and Illinois do not provide.
EQUITY CROWDFUNDINGRecent statutory changes in Texas could further encour-age entrepreneurship. For example, Texas was among the first states to approve an “equity crowdfunding” exemption to its securities regulations.
The growing popularity of crowdfunding sites, such as Kickstarter and Indiegogo, has encouraged many new and prospective businesses to make appeals for funding through these services. Until recently, however, those making these appeals could offer various awards in exchange for contributions — but not equity in the company itself, as with a traditional business investment. Only “accredited investors” (those above a certain level
Starting a New Business CONTINUED FROM PAGE 3
E X H I B I T 3
HOMESTEAD EXEMPTIONS IN THE FIVE MOST POPULOUS STATES
STATE MAXIMUM HOMESTEAD EXEMPTION
Texas Dollar amount unlimited in most cases, but limited as to land area
New York $75,000 - $150,000 (married couples may double, based on county in which homestead is located)
California* $75,000 - $100,000
Florida Dollar amount unlimited in most cases, but limited as to land area
Illinois $15,000 (married couples may double)
Note: This exhibit reflects state bankruptcy laws. Debtors in some states including Texas may choose to file under the federal bankruptcy system. *California has two distinct statutory schemes under which its residents can exempt property. Exhibit shows maximum available under either scheme.Source: Texas Comptroller of Public Accounts
E X H I B I T 4
UNBANKED AND UNDERBANKED HOUSEHOLDS
Five Most Populous States and U.S. Average, 2013
STATE UNBANKED RATE UNDERBANKED RATE
Texas 10.4% 27.4%
California 8.0% 17.0%
Florida 6.2% 19.1%
Illinois 7.4% 14.6%
New York 8.5% 19.6%
U.S. Average 7.7% 20.0%
Source: Federal Deposit Insurance Corporation
of net worth) were permitted to receive equity in a company in exchange for investment.
Since November 2014, however, Texas startups can offer equity in their ventures to any in-state investors, regardless of their resources. While there are some restrictions on the total amount such individuals can invest, equity crowdfunding could become another important tool for small businesses seeking capital.
ASSET FORMATIONDespite its business-friendly reputation, some factors undoubtedly discourage potential entrepreneurs in Texas. Whether or not these have contributed to the slowdown in business entry rates, they certainly influ-ence decisions on whether to start new ventures.
Texas trails many other states in some important measures of financial ability.
Nearly half of all U.S. startup businesses rely on personal or family assets to finance some portion of their initial costs. In a recent Gallup poll, 68 percent of potential entrepreneurs cited a lack of sufficient personal savings as a barrier to starting a business.
Texas, unfortunately, is well below national averages for some measures related to assets. Its rates of “unbanked” or “underbanked” households — those that lack bank accounts entirely, or lack access to the basic financial services, such as personal loans, that banks provide — are among the nation’s highest (Exhibit 4).
Texans who lack such basic advantages will find it much harder to engage in nearly every type of entrepreneurial activity. Simply participating in the traditional banking system can have tangible benefits. The Brookings Institution has estimated that an average full-time worker who banks at a traditional financial institution can save more than $40,000 during his or her working life.
Texas also has one of the nation’s lowest home-ownership rates. According to an analysis of recent

F I S C A L N O T E S , F E B R U A R Y 2 0 1 6 | 5
Census data (2013), just 61.8 percent of Texas’ housing is owner-occupied, a lower rate than in all but seven other states. Not owning a home, most people’s most import-ant asset, presents another roadblock for prospective entrepreneurs seeking capital.
Texas does, however, provide some tools at the local level to help low- and moderate-income families save and buy homes.
Individual development accounts (IDAs), for example, are matched savings accounts that can be used for starting a small business or for other personal transactions, such as purchasing a home or attending college. In exchange for meeting requirements such as attending financial education classes and committing to saving on a regular basis, participants in IDA programs are granted a match for every dollar they save. Some IDA programs in Texas are federally funded, while others are supported by nonprofit organizations, local governments, community colleges and private businesses.
Taxpayers can search for IDA programs and other asset-building aids in their areas through an online tool offered by Raise Texas, a statewide network of nonprofits, businesses and public institutions that supports asset-building initiatives.
VENTURE CAPITALAccess to venture capital represents another problem for entrepreneurial Texans. While Texas’ venture capital activity is strong, it is far less robust than that seen in other large states such as California and New York (Exhibit 5). In fiscal 2014, Texas businesses accounted for only 3 percent of all venture capital investments in the U.S., while California’s received 56 percent. No Texas companies were among 2014’s 25 most active venture capital firms.
Texas’ venture capital investments are focused primarily in the Austin area, implying significant oppor-tunities for growth in other areas of the state (Exhibit 6).
Texas’ state government has focused much of its economic development efforts on direct grants to companies through the recently abolished Emerging Technology Fund and other programs. One challenge facing such programs thus far has been the inherent risk and controversy involved in using taxpayer dollars to directly fund young companies that may end up failing.
There’s an alternative model, however, often called “funds of funds,” which generally involves loaning bond revenues to proven, expert investors who then combine the funds with privately raised capital to make equity investments in qualifying small businesses. The profits from the businesses’ eventual acquisition or public offer-ings, if any, are split between the state and the invest-ment fund, resulting in a self-perpetuating program. 0
$5,000
$10,000
$15,000
$20,000
$25,000
WASHINGTONTEXASMASSACHUSETTSNEW YORKCALIFORNIA
0
500
1,000
1,500
VENTURE CAPITAL DOLLARS
NUMBER OF DEALS
MIL
LION
S OF D
OLLA
RS
E X H I B I T 5
STATES WITH THE MOST VENTURE CAPITAL DEALS
2014
Source: CB Insights, The 2014 U.S. Venture Capital Year in Review
$0
$200
$400
$600
$800
SAN ANTONIOPLANODALLAS HOUSTONAUSTIN
0
20
40
60
80
VENTURE CAPITAL DOLLARS
NUMBER OF DEALSM
ILLI
ONS O
F DOL
LARS
E X H I B I T 6
TEXAS CITIES WITH THE MOST VENTURE CAPITAL DEALS
2014
Source: CB Insights, The 2014 U.S. Venture Capital Year in Review
CONTINUED ON PAGE 6
In fiscal 2014, Texas businesses accounted for only 3 percent
of all venture capital investments, while California’s received 56 percent.

6 | G L E N N H E G A R , T E X A S C O M P T R O L L E R O F P U B L I C A C C O U N T S
Starting a New Business CONTINUED FROM PAGE 5
Such efforts have seen some success. For example, the Ohio Capital Fund has attracted $939 million in private investments — more than eight times the state’s own investment — to early-stage companies in Ohio. This funding has generated an estimated 2,600 jobs with average salaries of $73,569.
Texas has a similar program, called Jobs for Texas (J4T), administered by the Department of Agriculture. J4T, however, relies entirely on a one-time $46.5 million award from the federal government. Its investments have attracted nearly $395 million in outside private financing and led to the creation or retention of an estimated 1,150 jobs.
INTERNET PRESENCEAccording to the latest Census data, Texas also ranks below average in computer ownership and high-speed Internet usage. Communities near the U.S.-Mexico border have particularly low rates, with McAllen, Brownsville and Laredo reporting some of the lowest rates among all U.S. cities.
Yet online commerce has become enormously important to the state and national economies. A recent Boston Consulting Group report estimated that the Internet now accounts for $14.5 trillion in annual U.S. economic output, or about 4.7 percent of the nation’s total gross domestic product.
Furthermore, the report suggests that a business’ use of the Internet has a direct impact on its growth. Small- and medium-sized enterprises in the U.S. that reported extensive Web use saw their sales grow by 10 percent in a recent three-year period. Similarly sized businesses reporting little or no Web activity saw sales shrink by 5 percent in the same period.
Texans without access to, and familiarity with, computers and the Internet are poorly equipped to start new businesses and remain competitive in an increasingly digital economy.
OCCUPATIONAL LICENSINGThe need for occupational licenses is receiving increased attention from business and government alike. A July 2015 White House report found that about a quarter of all U.S. workers now require a license to do their jobs, and that the share of state-licensed occupations has risen fivefold since the 1950s.
The 2014 Thumbtack survey of small business owners stated:
The complexity, time-cost, and monetary expenditure of obtaining and keeping licenses and permits was the most important issue for small businesses when rating the friendliness of their states.
Texas has fewer licensing requirements than many other states. An often-cited 2007 survey conducted by the Reason Foundation found that Texas had 78 licensed job categories versus a national average of 92.
According to a 2012 study by the Institute for Justice, however, while Texas licenses fewer lower-income occupations than most states, it places more burden-some requirements on those it does license, posing a substantial barrier to some aspiring entrepreneurs.
Texas ranked 38th among states for its number of licensed occupations, but 17th for the average burden of its licensing requirements, a measure accounting for factors such as average fees, minimum educational requirements and the average number of required exams. According to the Institute for Justice, in 2012 Texas’ licensing requirements imposed “an average of $304 in fees, 326 days of training and two exams on those wishing to enter licensed occupations.”
Occupational licensing is a continuing area of regulatory concern for Texas policymakers. The 2015 Legislature, for example, removed a requirement for operators of braiding businesses to hold barber or cosmetology licenses.
The sheer number of Texas license oversight entities — currently 42, according to the Texas Legislative Council — is not the only source of complications for entrepreneurs. Texas’ regulatory agencies have very broad authority to set licensing rules and fees.
Section 2001.039 of the Texas Government Code requires state agencies to review each established rule at least once every four years after its effective date, to determine whether it should remain, be changed in some way or be eliminated. The state, however, lacks an official mechanism to oversee this rule review, so licensing entities are self-governing in this regard.
GETTING STARTEDWith all its advantages — and despite its challenges — Texas remains one of the nation’s best places to launch a new business.
For many entrepreneurs, the most difficult part of starting a new business is learning where to start. Many national, state and local resources are available to help them, however, including the Comptroller’s own Texas Business Advisor page, at comptroller.texas.gov/tba. The Raise Texas online tool can be accessed at raisetexas.org/assets_building_db/search. FN
F I S C A L N O T E S , F E B R U A R Y 2 0 1 6 | 7
Texas’ Motor Fuels Taxes by John Heleman and Bruce Wright
Unless you’re filling up, you probably don’t give much thought to motor fuels — and even less to the taxes assessed on them. Yet these indispensable products are an important source of revenue for the federal and state governments.
Texas is a big state, and getting around it burns a lot of fuel. Texans use about 13 billion gallons of gasoline and 4.5 billion gallons of diesel fuel each year, as well as much smaller amounts of various alternative fuels such as compressed and liquefied natural gas. According to federal statistics, only eight nations used more gasoline and diesel than Texas in 2012.
That adds up to significant revenue for the state. Texas motor fuels taxes generated more than $3.4 billion in fiscal 2015, making them the fourth-largest source of state tax revenue.
Nearly all states including Texas use the bulk of this revenue for transportation projects. Under the Texas Constitution, after refunds and collection costs are subtracted, three-quarters of the state’s motor fuels tax
revenue is used to build and maintain public roadways. The remainder goes to the state’s Available School Fund, which supports public education.
HOW IT BEGAN: THE AUTO ERA
In 1917, the first year of Texas’ annual auto registration, the state already had nearly 188,000 cars and about 5,000 trucks, providing a testament to the explosive growth of the automotive era in the 20th century. Similar growth occurred across the nation, as reflected in production figures for Ford’s ubiqui-tous Model T; the company turned out 10,666 in 1909, 308,162 in 1915 — and more than 2 million in 1923.
The need for more and better roads inevitably led to taxation to fund them. According to the Federal Highway Administration, just four states — Colorado, New Mexico, North Dakota and Oregon— had a motor fuel excise tax in 1919. A decade later, every state had some form of the tax. The federal government adopted its own motor fuels tax, at one cent per gallon, in 1932.
Texas enacted its tax on gasoline in 1923, also at a cent per gallon. The Legislature increased the rate to 3 cents per gallon in 1927 and 4 cents in 1929.
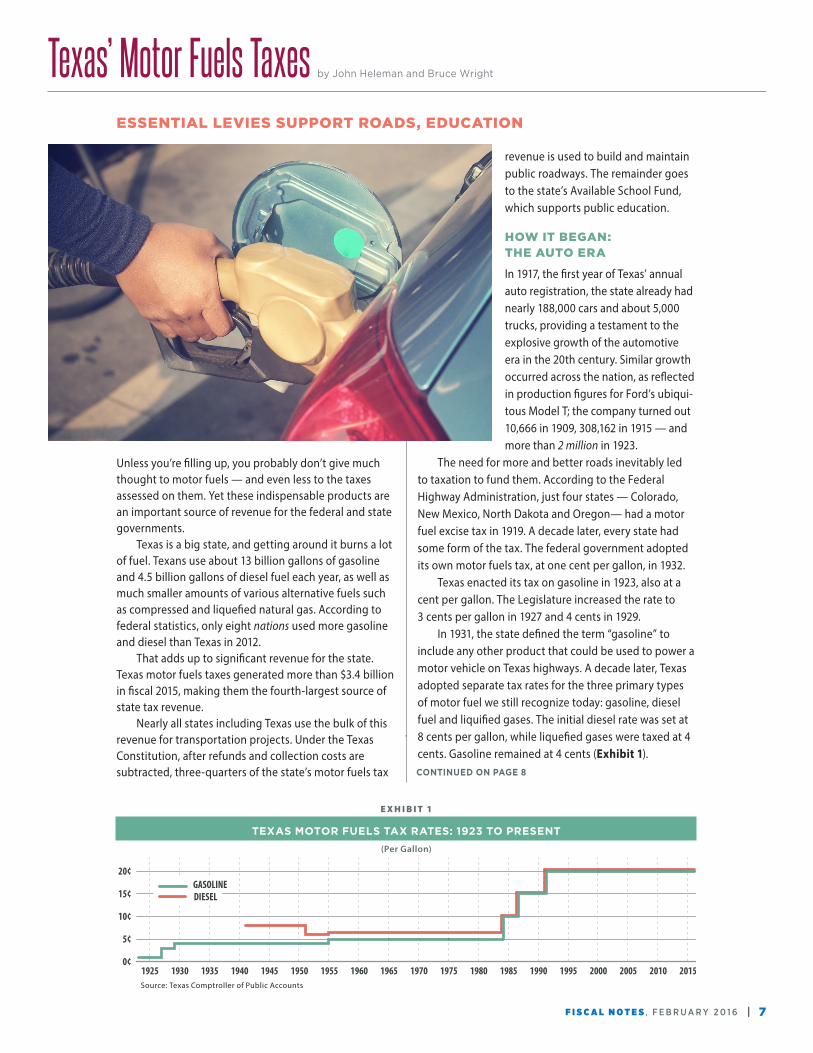
In 1931, the state defined the term “gasoline” to include any other product that could be used to power a motor vehicle on Texas highways. A decade later, Texas adopted separate tax rates for the three primary types of motor fuel we still recognize today: gasoline, diesel fuel and liquified gases. The initial diesel rate was set at 8 cents per gallon, while liquefied gases were taxed at 4 cents. Gasoline remained at 4 cents (Exhibit 1).
ESSENTIAL LEVIES SUPPORT ROADS, EDUCATION
CONTINUED ON PAGE 8
20152010200520001995199019851980197519701965196019551950194519401935193019250¢
5¢
10¢
15¢
20¢
DIESELGASOLINE
E X H I B I T 1
TEXAS MOTOR FUELS TAX RATES: 1923 TO PRESENT(Per Gallon)
Source: Texas Comptroller of Public Accounts

8 | G L E N N H E G A R , T E X A S C O M P T R O L L E R O F P U B L I C A C C O U N T S
In Texas, motor fuel is taxed as it is withdrawn from a storage facility, commonly called a “terminal rack” or rack, which is usually its first stop after leaving the refinery. From the rack, the fuel either is trucked directly to gas stations and convenience stores, or shipped by truck or pipeline to a wholesale distributor.
As Exhibit 1 illustrates, Texas’ tax rates on gasoline and diesel have been remarkably stable in recent years, remaining at 20 cents per gallon since 1991.
Long periods of unchanging rates have been common. Gasoline stayed at 4 cents per gallon for 26 years and 5 cents for 29 years. In the latter 1980s, however — an economically turbulent period in Texas due to an oil bust — gas tax rates rose sharply, from 5 cents per gallon in 1984 to 20 cents in 1991. Diesel rates more than tripled in the same period, from 6.5 cents to 20 cents per gallon.
UNTAXED FUELSTexas law provides a variety of exemptions from gasoline and diesel taxes. Federal agencies and Texas public school districts, or their bus contractors, are exempted. Another broad provision provides tax refunds for gasoline used “off-road” — in motorboats, lawnmowers, agricultural equipment and other non-vehicular, gasoline-powered devices.
Federal law requires the use of red dye, added at the rack, to maintain the distinction between taxable and nontaxable diesel. Red dye signifies that the fuel is intended for off-road uses, such as the powering of farm and con-struction equipment — a bulldozer, say. The only diesel fuel appropriate for on-road use is undyed, clear diesel.
Diesel, like gasoline, is taxed when first withdrawn from the rack, but state law places more limits on statutory refunds of the diesel fuel tax. For this reason, in Texas tax-free withdrawals of diesel from storage
are more common than refunds on diesel taxes. Even so, such refunds are issued as needed; for example, a public school bus may be obliged to use clear diesel on a school trip. The school district would be eligible to receive a refund after purchasing the fuel.
RATE COMPARISONSAmong the 10 most populous states, Texas ranks in the middle in terms of both its gasoline and diesel tax rates (Exhibit 2). Florida has the lowest rates, while Pennsylvania has the highest.
Texas’ Motor Fuels Taxes CONTINUED FROM PAGE 7
G A S O L I N E D I E S E L
Florida 4.0 Florida 4.0
New York 8.0 New York 8.0
Federal Rate 18.3 California 13.0
Illinois 19.0 Michigan 15.0*
Michigan 19.0* TEXAS 20.0
TEXAS 20.0 Illinois 21.5
Georgia 26.0 Federal Rate 24.3
Ohio 28.0 Ohio 28.0
California 30.0 Georgia 29.0
North Carolina 36.0** North Carolina 36.0**
Pennsylvania 50.5*** Pennsylvania 64.2***
* State gasoline and diesel taxes will increase to 26.3 cents per gallon on Jan. 1, 2017.** State gasoline and diesel taxes fell to 35 cents as of Jan. 1, 2016.*** Rates changed to 50.3 cents for gasoline and 64.0 cents for diesel as of Jan. 1, 2016.
Sources: U.S. Energy Information Agency, National Conference of State Legislatures and State of Pennsylvania
E X H I B I T 2
MOTOR FUELS TAX RATES: FEDERAL AND 10 LARGEST STATES
2015 (In Cents per Gallon)
E X H I B I T 3
TOTAL LEVIES ON MOTOR FUELS: FEDERAL AND 10 LARGEST STATES
2015(In Cents per Gallon)
GASOLINE TAX OTHER GASOLINE LEVIES DIESEL TAX OTHER DIESEL LEVIES
FEDERAL TEXAS GEORGIA OHIO FLORIDA MICHIGAN* ILLINOIS NEW YORK NORTH**CAROLINA
CALIFORNIA PENNSYLVANIA***0¢
20¢
40¢
60¢
* State gasoline and diesel taxes will increase to 26.3 cents per gallon on Jan. 1, 2017.** State gasoline and diesel taxes fell to 35 cents as of Jan. 1, 2016.*** Rates changed to 50.3 cents for gasoline and 64.0 cents for diesel as of Jan. 1, 2016.Sources: U.S. Energy Information Agency, National Conference of State Legislatures and State of Pennsylvania

F I S C A L N O T E S , F E B R U A R Y 2 0 1 6 | 9
CONTINUED ON PAGE 10
The primary tax rates, however, don’t always tell the entire story. Many states add additional taxes, fees or charges to the main tax, significantly raising the final price of fuel at the pump. Texas doesn’t. When all gov-ernment levies on gasoline and diesel are considered, the ranking appears quite different (Exhibit 3).
In Exhibit 2, for example, Florida appears to have the lowest tax rates on gasoline and diesel. In fact, though, the state imposes other levies on motor fuel, including the state sales tax, a state transportation system tax and other assessments. These add-ons, according to the U.S. Energy Information Agency (EIA), equate to an additional 26.6 cents in levies per gallon of gasoline, and 29.7 cents per gallon for diesel.
Among the 10 largest states, five — California, Florida, Illinois, Michigan and New York — add sales tax to the price of fuel at the pump.
Florida also adjusts its tax rates to compensate for inflation. North Carolina plans to link its rate to popula-tion growth and the Consumer Price Index (CPI) in 2017. Michigan will link its rates to the CPI beginning in 2022.
Some states also have local-option taxes and/or fees, although these are not presented in the exhibits.
Finally, the federal government also adds a 0.1 cent per gallon fee to its motor fuels taxes to remediate leaking underground storage tanks.
When total levies are considered, Texas’ taxes on gasoline and diesel are the lowest among the 10 largest states. Adding in the federal tax, Texans pay 38.4 cents in taxes for every gallon of gasoline they buy, and 44.4 cents per gallon for diesel. Pennsylvanians, by contrast, paid roughly twice as much in 2015, at 70 cents and 89.7 cents per gallon, respectively.
GRAND TOTALSOut of the $3.4 billion in state motor fuels taxes collected in fiscal 2015, net revenue from the gasoline tax totaled nearly $2.6 billion; diesel accounted for $860.9 million; and other motor fuels, such as liquefied and compressed natural gas, brought in the remaining $5.1 million. Gasoline and diesel thus made up more than 99.8 percent of all motor fuel receipts, with gasoline alone comprising about three-quarters of the entire amount.
While motor fuels taxes still comprise an important part of Texas tax collections, their share has declined sharply over the decades. In 1960 — prior to the enact-ment of the Texas sales tax — these taxes contributed
0%
5%
10%
15%
20%
25%
30%
$0
$500
$1,000
$1,500
$2,000
$2,500
$3,000
201520102005200019951990198519801975197019651960
0¢
5¢
10¢
15¢
20¢
$3,446.2
$3,042.0$2,934.6
$2,688.2
$2,235.3
$1,515.5
$986.9
$480.7$395.2$312.3$229.2$185.3
201520102005200019951990198519801975197019651960
DIESELGASOLINE
ANNUAL REVENUESHARE OF STATE TAX REVENUE
MILLIONS OF DOLLARS
E X H I B I T 4
TEXAS MOTOR FUELS TAX REVENUE AS A SHARE OF TOTAL STATE TAX REVENUE Fiscal 1960-2015
Source: Texas Comptroller of Public Accounts
While motor fuels taxes still comprise an important part of Texas tax collections,
their share has declined sharply over the decades.
10 | G L E N N H E G A R , T E X A S C O M P T R O L L E R O F P U B L I C A C C O U N T S
more than a quarter of the state budget (Exhibit 4). Interestingly, this decline occurred even though the tax rates quadrupled, a pattern attributable to a variety of factors including increasing sales tax rates and the Legislature’s extension of the tax to more goods and services.
A TROUBLED TAX?In Texas and many other states, motor fuels tax collections have begun to fall behind in their ability to meet the ever-rising cost of the transportation projects they support. Federal motor fuels taxes face the same problem; a 2009 Congressional study found that, “Because it is not adjusted for inflation, the federal gas tax has experienced a cumulative loss in purchasing power of 33 percent since 1993.”
Similarly, the Texas A&M Transportation Institute’s (TTI’s) 2016 publication Gas Tax Facts states that, “Because of inflation, we have less and less money available to pay for roads and bridges.” In 2015, TTI reported to a Texas legislative committee that the actual purchasing power of the state’s gasoline tax, set at 20 cents per gallon in 1991, had fallen to 6.8 cents by 2014 due to inflationary effects.
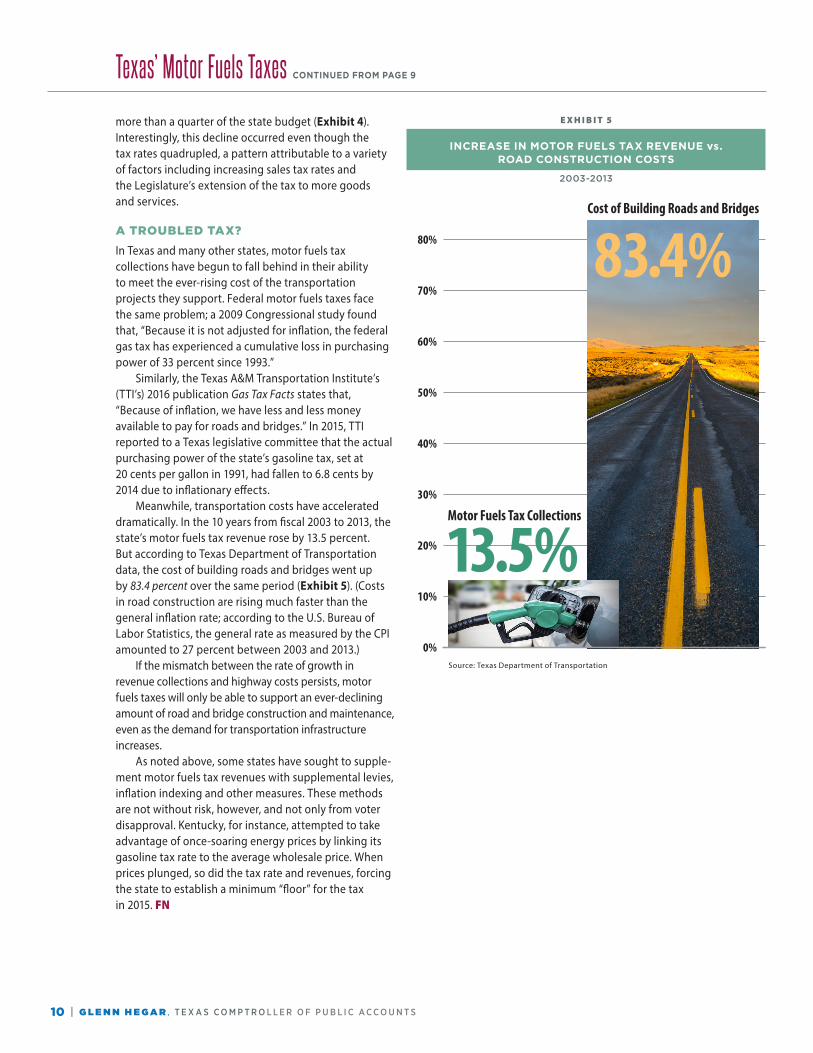
Meanwhile, transportation costs have accelerated dramatically. In the 10 years from fiscal 2003 to 2013, the state’s motor fuels tax revenue rose by 13.5 percent. But according to Texas Department of Transportation data, the cost of building roads and bridges went up by 83.4 percent over the same period (Exhibit 5). (Costs in road construction are rising much faster than the general inflation rate; according to the U.S. Bureau of Labor Statistics, the general rate as measured by the CPI amounted to 27 percent between 2003 and 2013.)
If the mismatch between the rate of growth in revenue collections and highway costs persists, motor fuels taxes will only be able to support an ever-declining amount of road and bridge construction and maintenance, even as the demand for transportation infrastructure increases.
As noted above, some states have sought to supple-ment motor fuels tax revenues with supplemental levies, inflation indexing and other measures. These methods are not without risk, however, and not only from voter disapproval. Kentucky, for instance, attempted to take advantage of once-soaring energy prices by linking its gasoline tax rate to the average wholesale price. When prices plunged, so did the tax rate and revenues, forcing the state to establish a minimum “floor” for the tax in 2015. FN
Texas’ Motor Fuels Taxes CONTINUED FROM PAGE 9
E X H I B I T 5
INCREASE IN MOTOR FUELS TAX REVENUE vs. ROAD CONSTRUCTION COSTS
2003-2013
Source: Texas Department of Transportation
Motor Fuels Tax
80%
70%
60%
50%
40%
30%
20%
10%
0%
13.5%
83.4%Cost of Building Roads and Bridges
Cost of Building Roads and Bridges
80%
70%
60%
50%
40%
30%
20%
10%
0%
80%
70%
60%
50%
40%
30%
20%
10%
0%
Motor Fuels Tax Collections
Motor Fuels Tax Collections
13.5%
13.5%
83.4%
83.4%
Motor Fuels Tax
80%
70%
60%
50%
40%
30%
20%
10%
0%
13.5%
83.4%
option below approved by sarah

F I S C A L N O T E S , F E B R U A R Y 2 0 1 6 | 11
State Revenue Watch
Tax Collections by Major Tax DECEMBER 2015YEAR TO DATE:
TOTAL
YEAR TO DATE: CHANGE FROM
PREVIOUS YEAR
SALES TAX $2,330,433 $9,427,149 -2.12%
PERCENT CHANGE FROM DECEMBER 2014 -1.09%
MOTOR VEHICLE SALES AND RENTAL TAXES $361,509 $1,547,078 2.00%
PERCENT CHANGE FROM DECEMBER 2014 4.96%
MOTOR FUEL TAXES $269,261 $1,164,803 0.94%
PERCENT CHANGE FROM DECEMBER 2014 -4.14%
FRANCHISE TAX -$145,302 -$185,602 -58.23%
PERCENT CHANGE FROM DECEMBER 2014 -54.25%
INSURANCE TAXES $16,545 $70,144 -3.89%
PERCENT CHANGE FROM DECEMBER 2014 3.02%
NATURAL GAS PRODUCTION TAX $78,131 $308,991 -48.14%
PERCENT CHANGE FROM DECEMBER 2014 -47.71%
CIGARETTE AND TOBACCO TAXES $123,938 $433,790 -14.02%
PERCENT CHANGE FROM DECEMBER 2014 -13.23%
ALCOHOLIC BEVERAGES TAXES $90,134 $378,001 3.62%
PERCENT CHANGE FROM DECEMBER 2014 1.96%
OIL PRODUCTION AND REGULATION TAXES $160,971 $648,719 -48.91%
PERCENT CHANGE FROM DECEMBER 2014 -42.68%
UTILITY TAXES1 $641 $117,877 -4.57%
PERCENT CHANGE FROM DECEMBER 2014 -69.75%
HOTEL OCCUPANCY TAX $37,915 $170,973 1.61%
PERCENT CHANGE FROM DECEMBER 2014 6.79%
OTHER TAXES2 $9,502 $46,216 -43.72%
PERCENT CHANGE FROM DECEMBER 2014 -50.42%
TOTAL TAX COLLECTIONS $3,333,680 $14,128,139 -6.06%
PERCENT CHANGE FROM DECEMBER 2014 -1.90%
Revenue By Source DECEMBER 2015YEAR TO DATE:
TOTAL
YEAR TO DATE: CHANGE FROM
PREVIOUS YEAR
TOTAL TAX COLLECTIONS $3,333,680 $14,128,139 -6.06%
PERCENT CHANGE FROM DECEMBER 2014 -1.90%
FEDERAL INCOME $3,404,106 $13,155,053 3.84%
PERCENT CHANGE FROM DECEMBER 2014 -10.03%
LICENSES, FEES, FINES AND PENALTIES $935,147 $3,722,033 19.04%
PERCENT CHANGE FROM DECEMBER 2014 -12.15%
INTEREST AND INVESTMENT INCOME $43,305 $155,991 -39.20%
PERCENT CHANGE FROM DECEMBER 2014 -70.08%
NET LOTTERY PROCEEDS3 $177,988 $640,720 2.63%
PERCENT CHANGE FROM DECEMBER 2014 4.05%
SALES OF GOODS AND SERVICES $34,448 $105,829 12.02%
PERCENT CHANGE FROM DECEMBER 2014 22.41%
SETTLEMENTS OF CLAIMS $501,879 514,406 7.55%
PERCENT CHANGE FROM DECEMBER 2014 7.01%
LAND INCOME $156,558 $422,322 -37.24%
PERCENT CHANGE FROM DECEMBER 2014 133.25%
CONTRIBUTIONS TO EMPLOYEE BENEFITS $5 $17 -20.41%
PERCENT CHANGE FROM DECEMBER 2014 -6.64%
OTHER REVENUE $347,211 $1,365,967 20.78%
PERCENT CHANGE FROM DECEMBER 2014 -3.98%
TOTAL NET REVENUE $8,934,325 $34,210,478 0.35%
PERCENT CHANGE FROM DECEMBER 2014 -5.83%
1 Includes public utility gross receipts assessment, gas, electric and water utility taxes and gas utility pipeline tax.
2 Includes the cement and sulphur taxes and other occupation and gross receipts taxes not separately identified.
3 Gross sales less retailer commissions and the smaller prizes paid by retailers.
Note: Totals may not add due to rounding.
NET STATE REVENUE — All Funds Excluding Trust
(AMOUNTS IN THOUSANDS)
Monthly and Year-to-Date Collections: Percent Change From Previous Year
This table presents data on net state revenue collections by source. It includes most recent monthly collections, year-to-date (YTD) totals for the current fiscal year and a comparison of current YTD totals with those in the equivalent period of the previous fiscal year.
These numbers were current at press time. For the most current data as well as downloadable files, visit TexasTransparency.org.
Note: Texas’ fiscal year begins on Sept. 1 and ends on Aug. 31.

12 | G L E N N H E G A R , T E X A S C O M P T R O L L E R O F P U B L I C A C C O U N T S
The Texas Comptroller of Public Accounts is an equal opportunity employer and does not discriminate on the basis of race,
color, religion, sex, national origin, age or disability in employment or in the provision of any services, programs or activities.
In compliance with the Americans with Disabilities Act, this document may be requested in alternative formats.
Contact the Communications and Information Services Division at 512-463-4900 or 1-800-531-5441, ext. 3-4900 (VOICE),
512-463-4226 (FAX), or visit the LBJ State Office Building,
111 E. 17th Street, Suite 311, Austin, Texas.
Texas Comptroller of Public Accounts Publication #96-369,February 2016
ONLINE SUBSCRIPTIONS, RENEWALS OR CANCELLATIONS of Fiscal Notes may be entered at
www.comptroller.texas.gov/fiscalnotes Send questions or comments to [email protected]
Fax: 512-463-4226 or 1-800-252-3620
HOW TO REACH USToll-free telephone line:
1-800-531-5441, ext. 3-3116; in Austin, 512-463-3116.
OR WRITE Fiscal Notes, Texas Comptroller of Public Accounts Communications and Information Division
111 E. 17th St., Suite 301, Austin, TX 78774-0100
SEND QUESTIONS OR COMMENTS TO [email protected]
Visit Fiscal Notes online at www.comptroller.texas.gov/fiscalnotes
FISCAL NOTESTexa s Comptro l l e r o f P ub l i c Account s Comm un ic at ions an d In fo rmat ion S e r v i ce s D iv i s ion 1 1 1 E . 17 th St . , Su i te 301 , Aus t in , T X 787 74- 01 0 0
FIRST-CLASS MAILPRESORTED
US POSTAGE PAIDAUSTIN TX
PERMIT NO. 1411
G L E N N H E G A RTexas Comptroller of Public Accounts
Fiscal Notes is one of the ways the Comptroller’s office strives to assist taxpayers and the people of Texas. The newsletter is a by-product of
the Comptroller’s constitutional responsibilities to monitor the state’s economy and to estimate state government revenues.
Fiscal Notes also provides a periodic summary of the financial statements for the State of Texas.
Articles and analysis appearing in Fiscal Notes do not necessarily represent the policy or endorsement of the Texas Comptroller of Public Accounts.
Space is devoted to a wide variety of topics of Texas interest and general government concern.
Fiscal Notes is not copyrighted and may be reproduced. The Texas Comptroller of Public Accounts would appreciate credit
for material used and a copy of the reprint.
FIELD OFFICESComptroller field offices are located in Abilene, Amarillo, Arlington,
Austin, Beaumont, Brownsville, Corpus Christi, Dallas, Denton, El Paso, Houston, Laredo, Longview, Lubbock, Lufkin, McAllen, Odessa, San
Angelo, San Antonio, Sherman, Tyler, Victoria, Waco and Wichita Falls; as well as Chicago, Los Angeles, New York and Tulsa.
Related Documents