Astronomy & Astrophysics manuscript no. hd199178_pap2 c ESO 2019 March 15, 2019 Starspot activity of HD 199178 - Doppler images from 1994–2017 ⋆ T. Hackman 1 , I. Ilyin 2 , J.J. Lehtinen 3, 4 , O. Kochukhov 5 , M.J. Käpylä 3, 4 , N. Piskunov 5 , and T. Willamo 1 1 Department of Physics, P.O. Box 64, FI-00014 University of Helsinki, Finland 2 Leibniz Institute for Astrophysics Potsdam (AIP), An der Sternwarte 16, D-14482 Potsdam, Germany 3 Max Planck Institute for Solar System Research, Justus-von-Liebig-Weg 3, D-37077 Göttingen, Germany 4 ReSoLVE Centre of Excellence, Department of Computer Science, Aalto University, PO Box 15400, FI-00076 Aalto, Finland 5 Department of Physics and Astronomy, Uppsala University, Box 516, S-75120 Uppsala, Sweden March 15, 2019 ABSTRACT Context. Studying spots of late-type stars is crucial for distinguishing between the various proposed dynamo mechanisms believed to be the main cause of starspot activity. For this research it is important to collect long enough time series of observations to unravel both long and short-term spot evolution. Doppler imaging is a very efficient method to study spots of stars, that cannot be angularly resolved. Aims. High-resolution spectral observations during 1994–2017 are analysed in order to reveal long and short-term changes in the spot activity of the FK Comae-type subgiant HD 199178. Methods. Most of the observations were collected with the Nordic Optical Telescope. The Doppler imaging temperature maps were calculated using an inversion technique based on Tikhonov regularisation and utilising multiple spectral lines. Results. We present a unique series of 41 temperature maps spanning more than 23 years. All reliable images show a large cool spot region centred near the visible rotation pole. Some lower latitude cool features are also recovered, although the reliability of these is questionable. There is an expected anti-correlation between the mean surface temperature and the spot coverage. Conclusions. HD 199178 clearly has a long-term large and cool spot structure at the rotational pole. This spot structure dominates the spot activity during the years 1994–2017. The size and position of the structure evolves with time, with a gradual increase during the last years. The lack of lower latitude features prevents the determination of a possible differential rotation. However, there are no indications that differential rotation would be strong enough to distort the images within the observation seasons. Key words. stars: activity – starspots – late-type – imaging – individual: HD 199178 1. Introduction HD 199178 (= V1794 Cyg) is one of the original members of the FK Comae-type stars originally defined by Bopp & Rucinski (1981). This very small group consists of stars that are single, rapidly rotating and extremely active G–K-type subgiants or gi- ants. The magnetic activity is observed both as strong emission from the corona, transition region and chromosphere as well as large cool spots causing rotational modulation of the brightness and photospheric absorption line profiles. The fact that there are very few confirmed FK Comae-type stars (only 3–4), can be interpreted as them representing a very short evolutionary stage. Bopp & Rucinski (1981) postulated that they are coalesced W Uma-type systems. Thus they would be observed in the transitionary stage when they have formed a single star, but still rotate rapidly. Eventually the rapid rotation will slow down due to magnetic braking. Even though these stars are rare, they still provide useful in- formation on stellar magnetic activity. It seems that most rapidly rotating late-type stars show similar spot activity: large non- axisymmetric spot structures, often on high latitudes and even forming polar caps (see e.g. Strassmeier 2009). This is true both for evolved stars, e.g. RS CVn and FK Comae -type stars, as ⋆ Based on observations made with the Nordic Optical Telescope, operated by the Nordic Optical Telescope Scientific Association at the Observatorio del Roque de los Muchachos, La Palma, Spain, of the In- stituto de Astrofisica de Canarias. well as young solar type stars (see e.g. Willamo et al. 2018). These high latitude structures have been confirmed, not only by Doppler imaging, but also using long-baseline infrared interfer- ometry (Roettenbacher et al. 2016, 2017). The reason behind the similarities of these late-type stars in very different evolutionary stages is apparently a common kind of dynamo mechanism op- erating in their convection zone. The general notion is that rapid rotation suppresses the differential rotation, which could lead to dynamos of α 2 − or α 2 Ω−type, in contrast to the αΩ dynamo op- erating in the Sun (see e.g. Ossendrijver 2003, and references therein). There is no doubt that the photometric rotation period of HD 199178 is around 3 d . 3 (see e.g. Jetsu et al. 1999). Furthermore, Jetsu et al. (1999) showed that the light curve of the star cannot be explained with a single, unique period. Jetsu et al. (1999) ap- plied the Kuiper method on the times of the photometric minima and retrieved the period P ≈ 3 d . 3175 implying a long-lived active longitude. Panov & Dimitrov (2007) used a “mean” period of P ≈ 3 d . 30025, to minimise the systematic drift of the phase of the photometric minimum. The variations in the photometric rota- tion period of HD 199178 were interpreted by Jetsu et al. (1999) as signs of differential rotation. However, in a recent study using long-term photometry of FK Comae, Jetsu (2018) suggested that the light curve is better explained with a combination of two pe- riods. The interference between these two periods would cause apparent period variations, when fitting a single period model to the data. The conclusion was, that the period variations should Article number, page 1 of 11

Welcome message from author
This document is posted to help you gain knowledge. Please leave a comment to let me know what you think about it! Share it to your friends and learn new things together.
Transcript

Astronomy & Astrophysics manuscript no. hd199178_pap2 c©ESO 2019March 15, 2019
Starspot activity of HD 199178 - Doppler images from 1994–2017 ⋆
T. Hackman1, I. Ilyin2, J.J. Lehtinen3,4, O. Kochukhov5, M.J. Käpylä3,4, N. Piskunov5, and T. Willamo1
1 Department of Physics, P.O. Box 64, FI-00014 University of Helsinki, Finland2 Leibniz Institute for Astrophysics Potsdam (AIP), An der Sternwarte 16, D-14482 Potsdam, Germany3 Max Planck Institute for Solar System Research, Justus-von-Liebig-Weg 3, D-37077 Göttingen, Germany4 ReSoLVE Centre of Excellence, Department of Computer Science, Aalto University, PO Box 15400, FI-00076 Aalto, Finland5 Department of Physics and Astronomy, Uppsala University, Box 516, S-75120 Uppsala, Sweden
March 15, 2019
ABSTRACT
Context. Studying spots of late-type stars is crucial for distinguishing between the various proposed dynamo mechanisms believed tobe the main cause of starspot activity. For this research it is important to collect long enough time series of observations to unravelboth long and short-term spot evolution. Doppler imaging is a very efficient method to study spots of stars, that cannot be angularlyresolved.Aims. High-resolution spectral observations during 1994–2017 are analysed in order to reveal long and short-term changes in the spotactivity of the FK Comae-type subgiant HD 199178.Methods. Most of the observations were collected with the Nordic Optical Telescope. The Doppler imaging temperature maps werecalculated using an inversion technique based on Tikhonov regularisation and utilising multiple spectral lines.Results. We present a unique series of 41 temperature maps spanning more than 23 years. All reliable images show a large cool spotregion centred near the visible rotation pole. Some lower latitude cool features are also recovered, although the reliability of these isquestionable. There is an expected anti-correlation between the mean surface temperature and the spot coverage.Conclusions. HD 199178 clearly has a long-term large and cool spot structure at the rotational pole. This spot structure dominatesthe spot activity during the years 1994–2017. The size and position of the structure evolves with time, with a gradual increase duringthe last years. The lack of lower latitude features prevents the determination of a possible differential rotation. However, there are noindications that differential rotation would be strong enough to distort the images within the observation seasons.
Key words. stars: activity – starspots – late-type – imaging – individual: HD 199178
1. Introduction
HD 199178 (= V1794 Cyg) is one of the original members ofthe FK Comae-type stars originally defined by Bopp & Rucinski(1981). This very small group consists of stars that are single,rapidly rotating and extremely active G–K-type subgiants or gi-ants. The magnetic activity is observed both as strong emissionfrom the corona, transition region and chromosphere as well aslarge cool spots causing rotational modulation of the brightnessand photospheric absorption line profiles.
The fact that there are very few confirmed FK Comae-typestars (only 3–4), can be interpreted as them representing a veryshort evolutionary stage. Bopp & Rucinski (1981) postulatedthat they are coalesced W Uma-type systems. Thus they wouldbe observed in the transitionary stage when they have formed asingle star, but still rotate rapidly. Eventually the rapid rotationwill slow down due to magnetic braking.
Even though these stars are rare, they still provide useful in-formation on stellar magnetic activity. It seems that most rapidlyrotating late-type stars show similar spot activity: large non-axisymmetric spot structures, often on high latitudes and evenforming polar caps (see e.g. Strassmeier 2009). This is true bothfor evolved stars, e.g. RS CVn and FK Comae -type stars, as
⋆ Based on observations made with the Nordic Optical Telescope,operated by the Nordic Optical Telescope Scientific Association at theObservatorio del Roque de los Muchachos, La Palma, Spain, of the In-stituto de Astrofisica de Canarias.
well as young solar type stars (see e.g. Willamo et al. 2018).These high latitude structures have been confirmed, not only byDoppler imaging, but also using long-baseline infrared interfer-ometry (Roettenbacher et al. 2016, 2017). The reason behind thesimilarities of these late-type stars in very different evolutionarystages is apparently a common kind of dynamo mechanism op-erating in their convection zone. The general notion is that rapidrotation suppresses the differential rotation, which could lead todynamos of α2− or α2Ω−type, in contrast to the αΩ dynamo op-erating in the Sun (see e.g. Ossendrijver 2003, and referencestherein).
There is no doubt that the photometric rotation period of HD199178 is around 3d.3 (see e.g. Jetsu et al. 1999). Furthermore,Jetsu et al. (1999) showed that the light curve of the star cannotbe explained with a single, unique period. Jetsu et al. (1999) ap-plied the Kuiper method on the times of the photometric minimaand retrieved the period P ≈ 3d.3175 implying a long-lived activelongitude. Panov & Dimitrov (2007) used a “mean” period ofP ≈ 3d.30025, to minimise the systematic drift of the phase of thephotometric minimum. The variations in the photometric rota-tion period of HD 199178 were interpreted by Jetsu et al. (1999)as signs of differential rotation. However, in a recent study usinglong-term photometry of FK Comae, Jetsu (2018) suggested thatthe light curve is better explained with a combination of two pe-riods. The interference between these two periods would causeapparent period variations, when fitting a single period model tothe data. The conclusion was, that the period variations should
Article number, page 1 of 11

A&A proofs: manuscript no. hd199178_pap2
not be interpreted as a measure of differential rotation. As HD199178 belongs to the same class as FK Comae, there are strongreasons to doubt that its differential rotation could be estimatedby studying variations of a single period fit. This does not, ofcourse, exclude the possbility of differential rotation.
O’Neal and collaborators (O’Neal et al. 1996, 1998) esti-mated starspot parameters of e.g. HD 199178 using photometryand molecular bands. They reported the values TQ = 5350 K andTS = 3800 K for the “quiet” surface and spots respectively.
Previous Doppler imaging studies of HD 199178 include thepapers by Vogt (1988), Strassmeier et al. (1999), Hackman et al.(2001) and Petit et al. (2004). All of these revealed large po-lar or high latitude spot structures. Petit et al. (2004) also cal-culated surface magnetic field maps for HD 199178 applyingZeeman-Doppler Imaging (ZDI) on Stokes V spectropolarime-try obtained in 1998–2003. The common features in the ZDI-maps presented in their study were mixed polarity radial fieldsranging from -500 to +500 G in the polar region, and azimuthalfields forming rings or arches around the polar region.
The attempts to determine the differential rotation of HD199178 using Doppler imaging have yielded conflicting results.Petit et al. (2004) employed differential rotation in the ZDI inver-sion and derived the value α ≈ 0.041 based on the goodness ofthe Doppler imaging solution. However, Hackman et al. (2001)tried different values of α and concluded that a negative α gavethe best fit and smallest systematic error. As the general notion isthat rapidly rotating single stars should not have strong anti-solardifferential rotation, the latter result was questioned by e.g. Rice(2002).
Several studies have aimed at determining the possible cyclicbehaviour in the spot activity of HD 199178. Jetsu and collabo-rators (Jetsu et al. 1990) reported a 9.07 year cycle in UBVRI-photometry, but failed to confirm this in a later study (Jetsu et al.1999). Panov & Dimitrov (2007) reported a cycle of 4.2 yearsin spot longitudes, while Savanov (2009) derived an eight yearbrightness cycle.
In this study we present new Doppler images for HD 199178using high resolution spectroscopy collected with three differ-ent instruments in 1994–2017. Despite some gaps, this data setconstitutes one of the longest series of Doppler images for anystar.
2. Observations
The first observational set, July 1994, was collected with the 2m Ritchey-Chretién telescope of the National Astronomical Ob-servatory (Rozhen), Bulgaria. The rest of the data was obtainedwith the Nordic Optical telescope (NOT) from August 1994 toDecember 2017. The NOT observations were obtained with theSOFIN spectrograph during 1994–2012 and June 2017. Dur-ing 2013–2016 and December 2017 the FIES spectrograph wasused.
Seven spectral regions were used for Doppler imag-ing: 6263.0 – 6267.0 Å (strongest lines Fe i 6265.13 Å andV i 6266.31 Å), 6409.6 – 6413.4 Å (Fe i 6411.65 Å), 6428.5– 6434.5 Å (Fe i 6430.84 Å and Fe ii 6432.68 Å), 6437.0 –6441.0 Å (Ca i 6439.08 Å), 6641.6 – 6645.4 Å (Ni i 6643.63 Å),6661.3 – 6665.3 Å (Fe i 6663.23 Å and Fe i 6663.44 Å) and7509.0 –7513.4 Å (Fe i 7511.02 Å). A summary of all observa-tions is given in Table 1. As can be seen from the summary, dif-ferent seasons covered different wavelength regions. However,the region with the line Ca i 6539.08 Å was included in everydata set.
The signal-to-noise ratio was usually around 200–300. Spec-tra with S/N as poor as ∼100 were used in a few cases. Theaverage S/N is listed in Table 1.
The observations from July 1994 to July 1998 were alreadypublished (Hackman et al. 2001; Hackman 2004). These wherereduced using the 3A package (Ilyin 2000). The rest of theSOFIN data was reduced using a new reduction pipeline devel-oped by the same author. A more detailed description of the newreduction pipeline can be found in Willamo et al. (2018) andwill also be presented by Ilyin (2019, in prep.). The FIES datawas reduced using the FIEStool (Telting et al. 2014). The reduc-tion covered all standard reduction procedures for high resolu-tion CCD spectra. The final continuum normalisation was doneseparately for each wavelength region (i.e. line blend) by com-paring the observed spectrum to the synthetic spectrum duringthe Doppler imaging inversion (see section 4). Plots of all spec-tral data used for the Doppler images are shown in AppendixA.
In general a minimum number of ∼10 evenly distributed ro-tational phases is considered to be optimal for a fully reliableDoppler image. However, Hackman et al. (2011) demonstrated,that some useful information can be retrieved with a much morelimited phase coverage. Therefore we calculated Doppler imagesfor all sets with nφ ≥ 4.
3. Spectral and stellar parameters
The spectral parameters were obtained from the Vienna AtomicLine Database (Piskunov et al. 1995; Ryabchikova et al. 2015).Some adjustments were made in the lg(g f ) -values in order to geta satisfactory fit for all spectral regions. This is a standard pro-cedure in Doppler imaging, since the spectra of real stars alwaysshow some deviations from calculations based on LTE-models.As we did not intend to derive exact element abundances it issafe to correct for all discrepancies between the model and thereal star by adjusting the lg(g f )-values. Furthermore, to the firstorder all photospheric absorption lines will follow the same be-haviour (i.e. a cool spot will cause a “bump” in the spectral line).
The adopted parameters for the strongest lines are listed inTable 3. The largest adjustment was for the line Ca i 6439.075 Å,were VALD listed lg(g f ) = 0.370 and we adopted the value0.450. A total number of 917 lines were included in the linesynthesis of the seven wavelength regions. Most of these weremolecular lines. For the unspotted surface a smaller number, i.e.only the atomic lines would have been sufficient. For the coolspots molecular lines, in particular TiO-bands, are important.The local line profiles were calculated using the code LOCPRF7developed at the University of Uppsala. Recent changes in thecode include a molecular equilibrium solver (Piskunov & Valenti2017).
HD 199178 is a rapidly rotating late-type star, which wasclassified as G 5 III - IV already by Herbig (1958). Strassmeieret al. (1999) calculated its luminosity and mass to be 11 L⊙ and1.65M⊙. Hackman et al. (2001) estimated its radius to be ∼5R⊙and adopted the rotation velocity v sin i = 72 km s−1, inclinationangle i = 60 and gravity lg(g) = 3.5. With such a high rota-tion velocity, the macroturbulence is hard to determine, but willanyway not strongly influence Doppler imaging. In this study weused a radial-tangential macroturbulence of ζRT = 5.0 km s−1.We adopted an effective temperature Teff = 5300 K for theunspotted surface as a starting point. The microturbulence wasdetermined by comparing the synthetic spectrum of an unspot-ted surface to the observations. This yielded ξ = 1.7 km s−1.
Article number, page 2 of 11

T. Hackman et al.: Starspot activity of HD 199178 - Doppler images from 1994–2017
Table 1. Summary of spectral observations.
Month 〈HJD〉 − 2400000 R nφ ∆t[d] fφ Wavelength regions [Å] 〈S/N〉 σ [%]July 1994 49558.5 35 000 19 14 98% 6431, 6439 239 0.529August 1994 49583.5 80 000 11 10 90% 6411, 6431, 6439, 7511 265 0.455November 1994 49673.8 140 000 9 9 86% 6431, 6439 206 0.540July 1995 49916.5 80 000 11 11 95% 6411, 6431, 6439, 7511 333 0.381October 1996 50384.8 80 000 8 7 75% 6411, 6431, 6439, 7511 326 0.408June 1997 50623.0 80 000 12 10 97% 6411, 6431, 6439, 7511 278 0.435July 1998 51003.8 80 000 13 13 96% 6411, 6431, 6439, 7511 320 0.480October 1998 51092.1 80 000 10 8 85% 6411, 6431, 6439, 7511 244 0.546November 1998 51124.4 80 000 7 6 69% 6411, 6431, 6439, 7511 230 0.520May 1999 51328.2 80 000 14 10 93% 6411, 6431, 6439, 7511 203 0.617July 1999 51388.5 80 000 11 10 97% 6411, 6431, 6439, 7511 174 0.694October 1999 51474.0 80 000 9 9 64% 6411, 6431, 6439, 7511 192 0.780August 2000 51768.6 80 000 21 11 100% 6431, 6439, 7511 222 0.618June 2001 52068.4 80 000 15 7 89% 6431, 6439, 7511 201 0.502August 2002 52511.8 80 000 23 9 100% 6411, 6431, 6439 259 0.524November 2002 52594.3 80 000 8 12 68% 6411, 6431, 6439 285 0.399June 2003 52803.4 80 000 16 19 95% 6411, 6431, 6439 268 0.462November 2003 52950.6 80 000 18 20 100% 6411, 6431, 6439 254 0.515August 2004 53220.2 80 000 16 13 89% 6411, 6431, 6439 257 0.527July 2005 53571.4 80 000 11 16 75% 6411, 6431, 6439 270 0.500November 2005 53690.8 80 000 6 10 50% 6411, 6431, 6439 242 0.525September 2006 53982.6 80 000 13 9 91% 6411, 6431, 6439 280 0.514December 2006 54074.8 80 000 8 7 75% 6265, 6439, 6644 211 0.728July 2007 54305.9 80 000 12 10 94% 6411, 6431, 6439 238 0.540September 2008 54721.2 80 000 7 6 60% 6265, 6431, 6439, 6644 337 0.494December 2008 54811.8 80 000 5 6 49% 6265, 6431, 6439, 6644 213 0.835August 2009 55074.7 80 000 9 11 78% 6439, 6644, 6663 297 0.663September 2009 55075.7 80 000 11 12 80% 6411, 6439, 6644 259 0.524December 2009 55197.1 80 000 5 6 47% 6265, 6439, 6644 205 0.536July 2010 55402.2 80 000 10 13 89% 6265, 6439, 6644 287 0.551December 2010 55552.6 80 000 4 12 31% 6265, 6439, 6644 266 0.422December 2011 55908.8 80 000 4 4 40% 6265, 6439, 6644 355 0.469August 2012 56170.5 80 000 9 7 87% 6265, 6439, 6644 349 0.382November 2012 56259.6 80 000 4 11 40% 6265, 6439, 6644 232 0.540August 2014 56886.0 67 000 10 9 84% 6265, 6411, 6431, 6439, 6644 352 0.382December 2014 56996.2 67 000 6 6 58% 6265, 6411, 6431, 6439, 6644 293 0.431July 2015 57209.1 67 000 9 9 78% 6265, 6411, 6431, 6439, 6644 380 0.380November 2015 57355.9 67 000 7 8 69% 6265, 6411, 6431, 6439, 6644 246 0.481June 2016 57560.0 67 000 8 8 75% 6265, 6411, 6431, 6439, 6644 318 0.663June 2017 57914.4 80 000 7 10 59% 6265, 6431, 6439, 6644 240 0.451December 2017 58108.3 67 000 5 4 49% 6265, 6411, 6431, 6439, 6644 245 0.636
Notes. 〈HJD〉 is the mean heliocentric Julian date, R the spectral resolution, nφ the number of observations, ∆t the time span of the observations,fφ the phase coverage of the season (for definition of this, see section 4), 〈S/N〉 the mean signal-to-noise ratio and σ the mean deviation betweenthe observations and DI solution.
Jetsu et al. (1999) and Panov & Dimitrov (2007) concluded,that the photometric light curve cannot be modelled using aconstant rotation period. However, in order to compare tem-perature maps of different seasons, all observations have to bephased by a single rotation period. This is particularly impor-tant because of our intention to study possible active longitudesand/or azimuthal dynamo waves. Thus we adopted the periodPal = 3d.3175, which was reported by Jetsu et al. (1999) as themost significant one in the analysis of possible long-term activelongitudes. Even though this may not be fully correct for all sea-sons, each observation run is short enough that a small error inthe period will not distort the image. The phases for the observa-tions where obtained with the ephemeris
HJDφ=0 = 2449557.664 + 3.3175 × E. (1)
The surface differential rotation parameter α is usually ex-pressed as
α =Ωeq −Ωpole
Ωeq, (2)
where Ωeq and Ωpole are the angular rotation velocities at theequator and approaching the pole respectively. In the Sun thedifferential rotation follows the approximate profile
Article number, page 3 of 11

A&A proofs: manuscript no. hd199178_pap2
Table 2. Adopted stellar parameters for HD 199178.
Parameter Adopted Referencea
Gravity lg(g) 3.5 Hackman et al. (2001)Inclination i 60 Hackman et al. (2001)Rotation velocity 72 km s−1 Hackman et al. (2001)Rotation period 3d.3175 Jetsu et al. (1999)Differential rotation α 0Micro turbulence ξ 1.7 km s−1
Macro turbulence ζRT 5.0 km s−1
Element abundances solar Strassmeier et al. (1999)
Notes. (a) In case of no reference, a new parameter value was de-rived/adopted for this study.
Table 3. Wavelengths, lower excitation potentials and adopted lg(g f )-values for the strongest lines.
Line λ (Å) χlow (eV) lg(g f )Fe i 6265.1319 2.1759 -2.550V i 6266.3069 0.2753 -2.290Fe i 6411.6476 3.6537 -0.705Fe i 6430.8446 2.1759 -2.206Fe ii 6432.6757 2.8910 -3.320Ca i 6439.0750 2.5257 0.450Ni i 6643.6304 1.6764 -1.920Fe i 6663.2311 4.5585 -1.239Fe i 6663.4407 2.4242 -2.479Fe i 7511.0181 4.1777 0.199
Ω(θ) ≈ Ωeq(1 − α sin2 θ). (3)
Here θ is the stellar latitude. One should emphasise that Eq.3 is only proven valid for the Sun. In fact, numerical simula-tions show that faster rotating stars could have completely differ-ent differential rotation curves (see e.g. Kitchatinov & Rüdiger1999, 2004). Still the solar differential rotation curve is, in lackof better options, used as a model for other stars.
In the study by Hackman et al. (2001) the best fit for theDoppler images was achieved using the combination v sin i = 70km s−1, α = −0.17 and Peq = 3.81. For the present study, wetested the cases of α = 0, α = −0.17 and α ≈ 0.034, the lattervalue corresponding to the differential rotation derived for theepoch 2001.97 by Petit et al. (2004). (The reason for choosingthis value instead of α = 0.041, is that the latter was a weightedmean and each value of α had a specific corresponding Ωeq-value. Using weighted means for both of these parameters wouldnot necessarily have formed a consistent pair.) In these tests weaccounted for both the surface shearing effect and change in therotational profile caused by differential rotation. For the test wechose our longest observation set, November 2003, where the ef-fect of a possible differential rotation would be strongest. Beforethe tests we chose the optimal v sin i for each α-value by testingvalues with a grid of 1 km s−1. The resulting deviation betweenthe observations and DI-solution after 0, 20 and 150 iterations(σ0, σ20 and σ150) are shown in Table 4. When running the in-versions sufficiently long (150 iterations) the differences in thedeviation of the fits were small.
We thus confirmed the previous result by Hackman et al.(2001), that using an anti-solar differential rotation will lead to afaster convergence and slightly smaller deviation of the Doppler
Table 4. Convergence of DI solution for different values of α.
α Peq v sin i σ0 σ20 σ150
-0.17 3d.81 70 km s−1 0.645% 0.539% 0.502%0.0 3d.3175 72 km s−1 0.737% 0.564% 0.515%
0.034 3d.2488 73 km s−1 0.721% 0.567% 0.508%
imaging solution. However, α = −0.17 would be in contradictionwith theoretical and observational results. Firstly, only slowly ro-tating stars should have anti-solar differential rotation (Gastineet al. 2014), although there have been studies reporting weakanti-solar differential rotation for some RS CVn -binary compo-nents (see e.g Harutyunyan et al. 2016). Secondly, rapidly rotat-ing stars should not have such a strong differential rotation (seee.g. Küker & Rüdiger 2011; Reinhold & Gizon 2015).
We believe that the approach of fastest convergence and/orsmallest deviation is not the correct way to determine stellar ro-tational parameters like α. One reason for this is the regulari-sation function (e.g. maximum entropy or minimum local gra-dient), which will in practice favour solutions with less devi-ation from a constant surface. By manipulating stellar rotationparameters, axisymmetric spot structures can be minimised andthe inversion procedure will thus favour this set of parameters.As has been demonstrated in several studies (see e.g. Hackmanet al. 2001), an anti-solar differential rotation will have a sim-ilar effect on rotationally broadened spectral line profiles, as alarge polar spot. Such high-latitude structures have been con-firmed independently using interferometric observations (Roet-tenbacher et al. 2016). Furthermore, a strong anti-solar differ-ential rotation would contradict both models and observations.Thus a strong anti-solar differential rotation cannot be regardedin anyway more probable than a large polar spot.
The conclusion is that the rotational parameters cannot bedetermined merely by optimising the Doppler imaging solution.The best way to determine the differential rotation would be totrace the movement of spot structures vs. their latitude. The prob-lem with this approach in our case, is that the reliable cool spotstructures in HD 199178 are found in a limited latitude rangenear the rotation pole (see e.g. Petit et al. 2004, and Fig. 1 in thepresent study).
In conclusion: The differential rotation of HD 199178 is ex-pected to be small and the determination of it is not possible withthe present spectroscopic data. Thus we chose to adopt the valueα = 0, as this allows for unambiguous rotation phases for thewhole set of images.
4. Doppler imaging
We used the Doppler imaging (hereafter DI) code INVERS7DRoriginally written at the University of Uppsala, with somechanges made at the University of Helsinki (see e.g. Piskunov1991; Hackman et al. 2012). A total of 41 new images were cal-culated for both the previously used spectra from 1994 – 8 and allnew spectra. A table of synthetic spectra was first calculated for aset of temperatures (3500 – 6000 K) and a number of limb angles(nµ = 40) using stellar model atmospheres supplied by MARCS(Gustafsson et al. 2008). This table was then used for solvingthe inverse problem, i.e. searching for such a surface tempera-ture distribution that best reproduces the observed photosphericspectra. In order to regularise this ill-posed inversion problem,Tikhonov regularisation was employed. This means adding theadditional constraint of minimum surface gradient of the solu-tion. Furthermore, the solution was limited to the temperature
Article number, page 4 of 11
T. Hackman et al.: Starspot activity of HD 199178 - Doppler images from 1994–2017
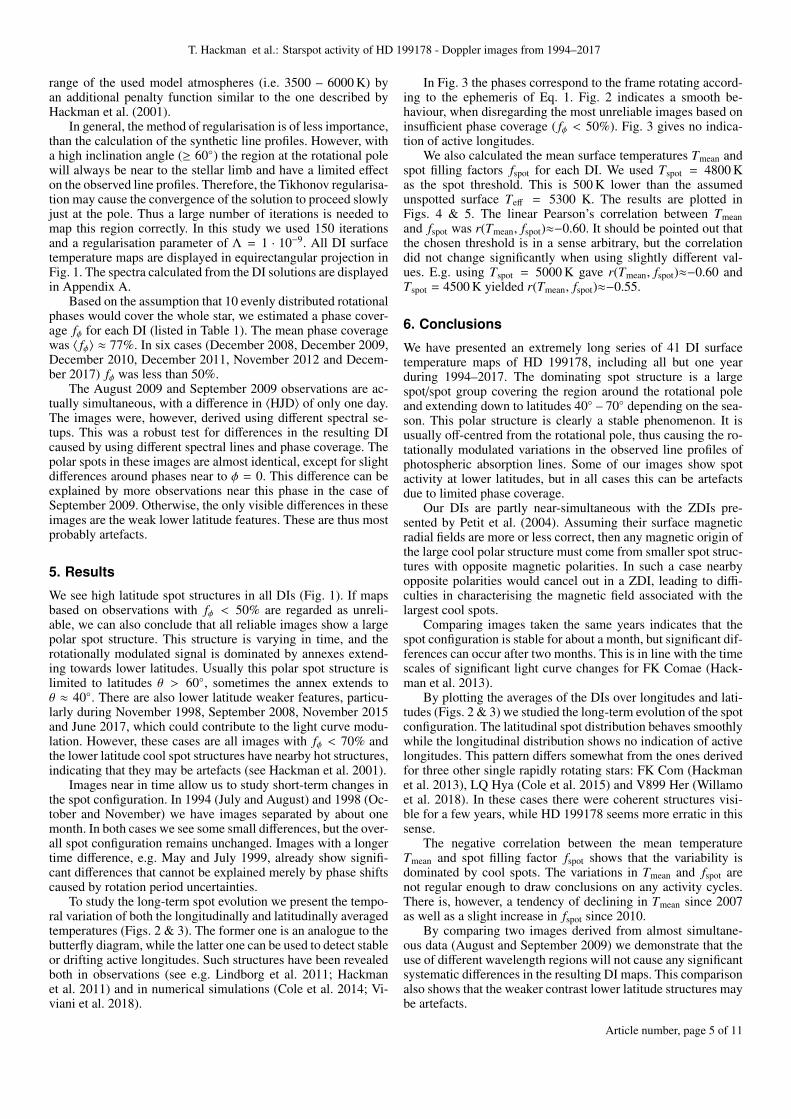
range of the used model atmospheres (i.e. 3500 – 6000 K) byan additional penalty function similar to the one described byHackman et al. (2001).
In general, the method of regularisation is of less importance,than the calculation of the synthetic line profiles. However, witha high inclination angle (≥ 60) the region at the rotational polewill always be near to the stellar limb and have a limited effecton the observed line profiles. Therefore, the Tikhonov regularisa-tion may cause the convergence of the solution to proceed slowlyjust at the pole. Thus a large number of iterations is needed tomap this region correctly. In this study we used 150 iterationsand a regularisation parameter of Λ = 1 · 10−9. All DI surfacetemperature maps are displayed in equirectangular projection inFig. 1. The spectra calculated from the DI solutions are displayedin Appendix A.
Based on the assumption that 10 evenly distributed rotationalphases would cover the whole star, we estimated a phase cover-age fφ for each DI (listed in Table 1). The mean phase coveragewas 〈 fφ〉 ≈ 77%. In six cases (December 2008, December 2009,December 2010, December 2011, November 2012 and Decem-ber 2017) fφ was less than 50%.
The August 2009 and September 2009 observations are ac-tually simultaneous, with a difference in 〈HJD〉 of only one day.The images were, however, derived using different spectral se-tups. This was a robust test for differences in the resulting DIcaused by using different spectral lines and phase coverage. Thepolar spots in these images are almost identical, except for slightdifferences around phases near to φ = 0. This difference can beexplained by more observations near this phase in the case ofSeptember 2009. Otherwise, the only visible differences in theseimages are the weak lower latitude features. These are thus mostprobably artefacts.
5. Results
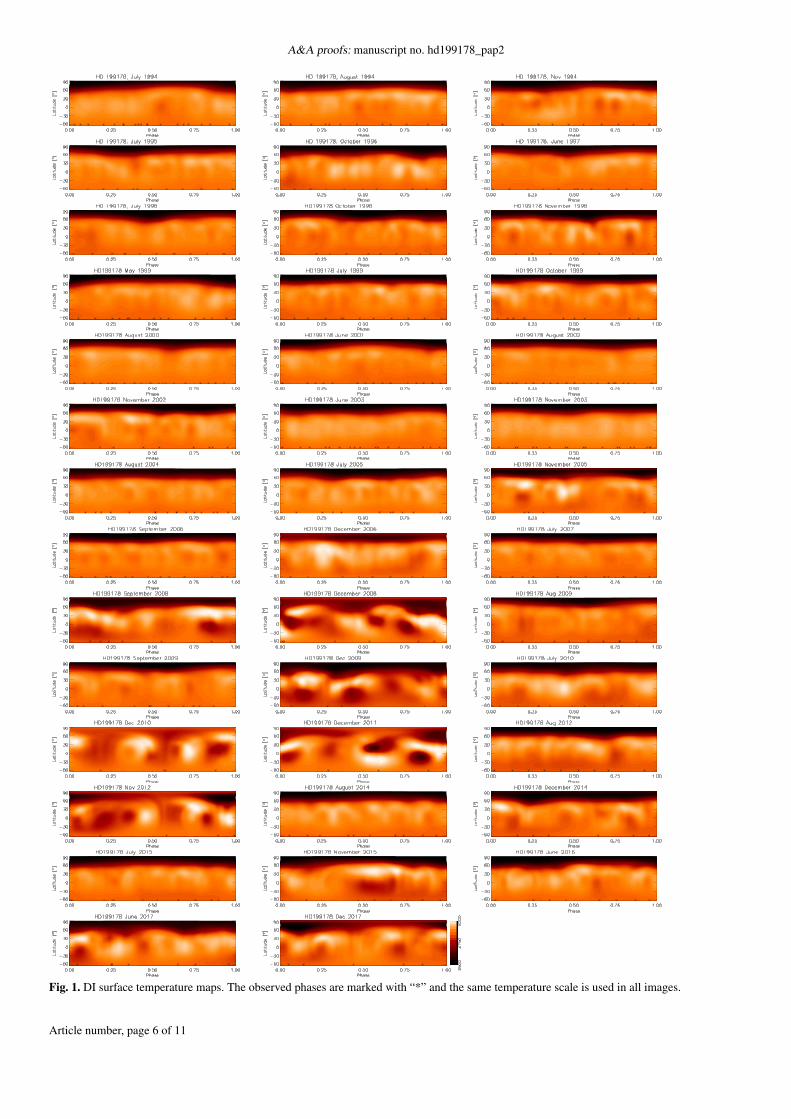
We see high latitude spot structures in all DIs (Fig. 1). If mapsbased on observations with fφ < 50% are regarded as unreli-able, we can also conclude that all reliable images show a largepolar spot structure. This structure is varying in time, and therotationally modulated signal is dominated by annexes extend-ing towards lower latitudes. Usually this polar spot structure islimited to latitudes θ > 60, sometimes the annex extends toθ ≈ 40. There are also lower latitude weaker features, particu-larly during November 1998, September 2008, November 2015and June 2017, which could contribute to the light curve modu-lation. However, these cases are all images with fφ < 70% andthe lower latitude cool spot structures have nearby hot structures,indicating that they may be artefacts (see Hackman et al. 2001).
Images near in time allow us to study short-term changes inthe spot configuration. In 1994 (July and August) and 1998 (Oc-tober and November) we have images separated by about onemonth. In both cases we see some small differences, but the over-all spot configuration remains unchanged. Images with a longertime difference, e.g. May and July 1999, already show signifi-cant differences that cannot be explained merely by phase shiftscaused by rotation period uncertainties.
To study the long-term spot evolution we present the tempo-ral variation of both the longitudinally and latitudinally averagedtemperatures (Figs. 2 & 3). The former one is an analogue to thebutterfly diagram, while the latter one can be used to detect stableor drifting active longitudes. Such structures have been revealedboth in observations (see e.g. Lindborg et al. 2011; Hackmanet al. 2011) and in numerical simulations (Cole et al. 2014; Vi-viani et al. 2018).
In Fig. 3 the phases correspond to the frame rotating accord-ing to the ephemeris of Eq. 1. Fig. 2 indicates a smooth be-haviour, when disregarding the most unreliable images based oninsufficient phase coverage ( fφ < 50%). Fig. 3 gives no indica-tion of active longitudes.
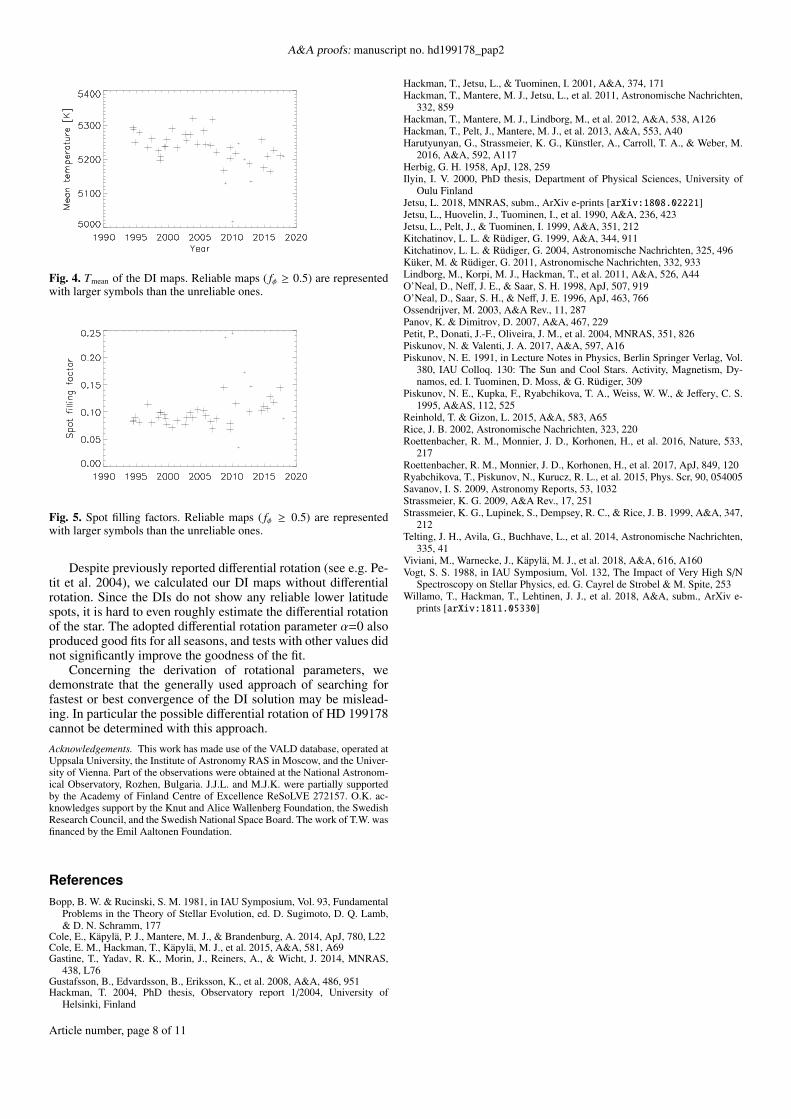
We also calculated the mean surface temperatures Tmean andspot filling factors fspot for each DI. We used Tspot = 4800 Kas the spot threshold. This is 500 K lower than the assumedunspotted surface Teff = 5300 K. The results are plotted inFigs. 4 & 5. The linear Pearson’s correlation between Tmeanand fspot was r(Tmean, fspot)≈−0.60. It should be pointed out thatthe chosen threshold is in a sense arbitrary, but the correlationdid not change significantly when using slightly different val-ues. E.g. using Tspot = 5000 K gave r(Tmean, fspot)≈−0.60 andTspot = 4500 K yielded r(Tmean, fspot)≈−0.55.
6. Conclusions
We have presented an extremely long series of 41 DI surfacetemperature maps of HD 199178, including all but one yearduring 1994–2017. The dominating spot structure is a largespot/spot group covering the region around the rotational poleand extending down to latitudes 40 – 70 depending on the sea-son. This polar structure is clearly a stable phenomenon. It isusually off-centred from the rotational pole, thus causing the ro-tationally modulated variations in the observed line profiles ofphotospheric absorption lines. Some of our images show spotactivity at lower latitudes, but in all cases this can be artefactsdue to limited phase coverage.
Our DIs are partly near-simultaneous with the ZDIs pre-sented by Petit et al. (2004). Assuming their surface magneticradial fields are more or less correct, then any magnetic origin ofthe large cool polar structure must come from smaller spot struc-tures with opposite magnetic polarities. In such a case nearbyopposite polarities would cancel out in a ZDI, leading to diffi-culties in characterising the magnetic field associated with thelargest cool spots.
Comparing images taken the same years indicates that thespot configuration is stable for about a month, but significant dif-ferences can occur after two months. This is in line with the timescales of significant light curve changes for FK Comae (Hack-man et al. 2013).
By plotting the averages of the DIs over longitudes and lati-tudes (Figs. 2 & 3) we studied the long-term evolution of the spotconfiguration. The latitudinal spot distribution behaves smoothlywhile the longitudinal distribution shows no indication of activelongitudes. This pattern differs somewhat from the ones derivedfor three other single rapidly rotating stars: FK Com (Hackmanet al. 2013), LQ Hya (Cole et al. 2015) and V899 Her (Willamoet al. 2018). In these cases there were coherent structures visi-ble for a few years, while HD 199178 seems more erratic in thissense.
The negative correlation between the mean temperatureTmean and spot filling factor fspot shows that the variability isdominated by cool spots. The variations in Tmean and fspot arenot regular enough to draw conclusions on any activity cycles.There is, however, a tendency of declining in Tmean since 2007as well as a slight increase in fspot since 2010.
By comparing two images derived from almost simultane-ous data (August and September 2009) we demonstrate that theuse of different wavelength regions will not cause any significantsystematic differences in the resulting DI maps. This comparisonalso shows that the weaker contrast lower latitude structures maybe artefacts.
Article number, page 5 of 11
A&A proofs: manuscript no. hd199178_pap2
Fig. 1. DI surface temperature maps. The observed phases are marked with “*” and the same temperature scale is used in all images.
Article number, page 6 of 11

T. Hackman et al.: Starspot activity of HD 199178 - Doppler images from 1994–2017
Fig. 2. DI:s averaged over longitudes vs. dates
Fig. 3. DI:s averaged over latitudes vs. dates.
Article number, page 7 of 11
A&A proofs: manuscript no. hd199178_pap2
Fig. 4. Tmean of the DI maps. Reliable maps ( fφ ≥ 0.5) are representedwith larger symbols than the unreliable ones.
Fig. 5. Spot filling factors. Reliable maps ( fφ ≥ 0.5) are representedwith larger symbols than the unreliable ones.
Despite previously reported differential rotation (see e.g. Pe-tit et al. 2004), we calculated our DI maps without differentialrotation. Since the DIs do not show any reliable lower latitudespots, it is hard to even roughly estimate the differential rotationof the star. The adopted differential rotation parameter α=0 alsoproduced good fits for all seasons, and tests with other values didnot significantly improve the goodness of the fit.
Concerning the derivation of rotational parameters, wedemonstrate that the generally used approach of searching forfastest or best convergence of the DI solution may be mislead-ing. In particular the possible differential rotation of HD 199178cannot be determined with this approach.
Acknowledgements. This work has made use of the VALD database, operated atUppsala University, the Institute of Astronomy RAS in Moscow, and the Univer-sity of Vienna. Part of the observations were obtained at the National Astronom-ical Observatory, Rozhen, Bulgaria. J.J.L. and M.J.K. were partially supportedby the Academy of Finland Centre of Excellence ReSoLVE 272157. O.K. ac-knowledges support by the Knut and Alice Wallenberg Foundation, the SwedishResearch Council, and the Swedish National Space Board. The work of T.W. wasfinanced by the Emil Aaltonen Foundation.
References
Bopp, B. W. & Rucinski, S. M. 1981, in IAU Symposium, Vol. 93, FundamentalProblems in the Theory of Stellar Evolution, ed. D. Sugimoto, D. Q. Lamb,& D. N. Schramm, 177
Cole, E., Käpylä, P. J., Mantere, M. J., & Brandenburg, A. 2014, ApJ, 780, L22Cole, E. M., Hackman, T., Käpylä, M. J., et al. 2015, A&A, 581, A69Gastine, T., Yadav, R. K., Morin, J., Reiners, A., & Wicht, J. 2014, MNRAS,
438, L76Gustafsson, B., Edvardsson, B., Eriksson, K., et al. 2008, A&A, 486, 951Hackman, T. 2004, PhD thesis, Observatory report 1/2004, University of
Helsinki, Finland
Hackman, T., Jetsu, L., & Tuominen, I. 2001, A&A, 374, 171Hackman, T., Mantere, M. J., Jetsu, L., et al. 2011, Astronomische Nachrichten,
332, 859Hackman, T., Mantere, M. J., Lindborg, M., et al. 2012, A&A, 538, A126Hackman, T., Pelt, J., Mantere, M. J., et al. 2013, A&A, 553, A40Harutyunyan, G., Strassmeier, K. G., Künstler, A., Carroll, T. A., & Weber, M.
2016, A&A, 592, A117Herbig, G. H. 1958, ApJ, 128, 259Ilyin, I. V. 2000, PhD thesis, Department of Physical Sciences, University of
Oulu FinlandJetsu, L. 2018, MNRAS, subm., ArXiv e-prints [arXiv:1808.02221]Jetsu, L., Huovelin, J., Tuominen, I., et al. 1990, A&A, 236, 423Jetsu, L., Pelt, J., & Tuominen, I. 1999, A&A, 351, 212Kitchatinov, L. L. & Rüdiger, G. 1999, A&A, 344, 911Kitchatinov, L. L. & Rüdiger, G. 2004, Astronomische Nachrichten, 325, 496Küker, M. & Rüdiger, G. 2011, Astronomische Nachrichten, 332, 933Lindborg, M., Korpi, M. J., Hackman, T., et al. 2011, A&A, 526, A44O’Neal, D., Neff, J. E., & Saar, S. H. 1998, ApJ, 507, 919O’Neal, D., Saar, S. H., & Neff, J. E. 1996, ApJ, 463, 766Ossendrijver, M. 2003, A&A Rev., 11, 287Panov, K. & Dimitrov, D. 2007, A&A, 467, 229Petit, P., Donati, J.-F., Oliveira, J. M., et al. 2004, MNRAS, 351, 826Piskunov, N. & Valenti, J. A. 2017, A&A, 597, A16Piskunov, N. E. 1991, in Lecture Notes in Physics, Berlin Springer Verlag, Vol.
380, IAU Colloq. 130: The Sun and Cool Stars. Activity, Magnetism, Dy-namos, ed. I. Tuominen, D. Moss, & G. Rüdiger, 309
Piskunov, N. E., Kupka, F., Ryabchikova, T. A., Weiss, W. W., & Jeffery, C. S.1995, A&AS, 112, 525
Reinhold, T. & Gizon, L. 2015, A&A, 583, A65Rice, J. B. 2002, Astronomische Nachrichten, 323, 220Roettenbacher, R. M., Monnier, J. D., Korhonen, H., et al. 2016, Nature, 533,
217Roettenbacher, R. M., Monnier, J. D., Korhonen, H., et al. 2017, ApJ, 849, 120Ryabchikova, T., Piskunov, N., Kurucz, R. L., et al. 2015, Phys. Scr, 90, 054005Savanov, I. S. 2009, Astronomy Reports, 53, 1032Strassmeier, K. G. 2009, A&A Rev., 17, 251Strassmeier, K. G., Lupinek, S., Dempsey, R. C., & Rice, J. B. 1999, A&A, 347,
212Telting, J. H., Avila, G., Buchhave, L., et al. 2014, Astronomische Nachrichten,
335, 41Viviani, M., Warnecke, J., Käpylä, M. J., et al. 2018, A&A, 616, A160Vogt, S. S. 1988, in IAU Symposium, Vol. 132, The Impact of Very High S/N
Spectroscopy on Stellar Physics, ed. G. Cayrel de Strobel & M. Spite, 253Willamo, T., Hackman, T., Lehtinen, J. J., et al. 2018, A&A, subm., ArXiv e-
prints [arXiv:1811.05330]
Article number, page 8 of 11

T. Hackman et al.: Starspot activity of HD 199178 - Doppler images from 1994–2017
Appendix A: Observed and modelled spectra
Article number, page 9 of 11

A&A proofs: manuscript no. hd199178_pap2
Fig. A.1. Observed (’+’ symbols) and modelled (red line) spectra. Different wavelength regions are plotted in the same frames, the wavelengthstep being constant. The rotational phase is given at the right of each spectrum.
Article number, page 10 of 11

T. Hackman et al.: Starspot activity of HD 199178 - Doppler images from 1994–2017
Fig. A.2. Same as Fig. A.1.
Article number, page 11 of 11
Related Documents