Maths STAR Maths™ Technical Manual

Welcome message from author
This document is posted to help you gain knowledge. Please leave a comment to let me know what you think about it! Share it to your friends and learn new things together.
Transcript

Maths
STAR Maths™ Technical Manual

Copyright NoticeCopyright © 2015 Renaissance Learning, Inc. All Rights Reserved.
This publication is protected by US and international copyright laws. It is unlawful to duplicate or reproduce any copyrighted material without authorisation from the copyright holder. This document may be reproduced only by staff members in schools that have a license for STAR Maths, Renaissance Place software. For more information, contact Renaissance Learning UK Ltd. at the address above.
All logos, designs, and brand names for Renaissance Learning’s products and services, including but not limited to Accelerated Maths, Accelerated Reader, AR, AM, ATOS, MathsFacts in a Flash, Renaissance Home Connect, Renaissance Learning, Renaissance School Partnership, STAR, STAR Assessments, STAR Early Literacy, STAR Maths and STAR Reading are trademarks of Renaissance Learning, Inc. and its subsidiaries, registered, common law, or pending registration in the United Kingdom, United States and other countries. All other product and company names should be considered as the property of their respective companies and organisations.
Macintosh is a trademark of Apple Inc., registered in the US and other countries.
STAR Maths has been reviewed for scientific rigor by the US National Center on Student Progress Monitoring. It was found to meet the Center’s criteria for scientifically based progress monitoring tools, including its reliability and validity as an assessment. For more details, visit www.studentprogress.org.
Please note: This manual presents technical data accumulated over the course of the development of the US version of STAR Maths. The US norm-referenced scores and reliability and validity data presented in this manual are for informational purposes only.
11/2015 SMRPUK
United Kingdom
Renaissance Learning UK Ltd.32 Harbour Exchange SquareLondonE14 9GE
Tel: +44 (0)20 7184 4000Fax: +44 (0)20 7538 2625Email: [email protected]: www.renlearn.co.uk
Australia
Renaissance Learning AustraliaPO Box 329Toowong DC QLD 4066
Phone: 1800 467 870
Email: [email protected]: www.renaissance.com.au

iSTAR Maths™Technical Manual
Contents
Introduction . . . . . . . . . . . . . . . . . . . . . . . . . . . . . . . . . . . . . . . . 1STAR Maths: Progress Monitoring System. . . . . . . . . . . . . . . . . . . . . . . . . . . . . . . . . . . . . . . . .1
Tier 1: Formative Class Assessments . . . . . . . . . . . . . . . . . . . . . . . . . . . . . . . . . . . . . . . . . . . . . . . . . . 1Tier 2: Interim Periodic Assessments. . . . . . . . . . . . . . . . . . . . . . . . . . . . . . . . . . . . . . . . . . . . . . . . . . 1Tier 3: Summative Assessments . . . . . . . . . . . . . . . . . . . . . . . . . . . . . . . . . . . . . . . . . . . . . . . . . . . . . . 2
STAR Maths Purpose . . . . . . . . . . . . . . . . . . . . . . . . . . . . . . . . . . . . . . . . . . . . . . . . . . . . . . . . . . .2
Design of STAR Maths. . . . . . . . . . . . . . . . . . . . . . . . . . . . . . . . . . . . . . . . . . . . . . . . . . . . . . . . . . .3Improvements to the STAR Maths Test. . . . . . . . . . . . . . . . . . . . . . . . . . . . . . . . . . . . . . . . . . . . . . . . 5
Test Security. . . . . . . . . . . . . . . . . . . . . . . . . . . . . . . . . . . . . . . . . . . . . . . . . . . . . . . . . . . . . . . . . . .7Split Application Model . . . . . . . . . . . . . . . . . . . . . . . . . . . . . . . . . . . . . . . . . . . . . . . . . . . . . . . . . . . . . 7Individualised Tests. . . . . . . . . . . . . . . . . . . . . . . . . . . . . . . . . . . . . . . . . . . . . . . . . . . . . . . . . . . . . . . . . 7Data Encryption . . . . . . . . . . . . . . . . . . . . . . . . . . . . . . . . . . . . . . . . . . . . . . . . . . . . . . . . . . . . . . . . . . . . 7Access Levels and Capabilities . . . . . . . . . . . . . . . . . . . . . . . . . . . . . . . . . . . . . . . . . . . . . . . . . . . . . . . 7Test Monitoring/Password Entry . . . . . . . . . . . . . . . . . . . . . . . . . . . . . . . . . . . . . . . . . . . . . . . . . . . . . 8Final Caveat. . . . . . . . . . . . . . . . . . . . . . . . . . . . . . . . . . . . . . . . . . . . . . . . . . . . . . . . . . . . . . . . . . . . . . . . 8
Test Administration Procedures . . . . . . . . . . . . . . . . . . . . . . . . . . . . . . . . . . . . . . . . . . . . . . . . .8
Test Interface . . . . . . . . . . . . . . . . . . . . . . . . . . . . . . . . . . . . . . . . . . . . . . . . . . . . . . . . . . . . . . . . . .9
Practice Session . . . . . . . . . . . . . . . . . . . . . . . . . . . . . . . . . . . . . . . . . . . . . . . . . . . . . . . . . . . . . . .9
Adaptive Item Selection . . . . . . . . . . . . . . . . . . . . . . . . . . . . . . . . . . . . . . . . . . . . . . . . . . . . . . .10
Test Repetition . . . . . . . . . . . . . . . . . . . . . . . . . . . . . . . . . . . . . . . . . . . . . . . . . . . . . . . . . . . . . . .10
Item Time Limits . . . . . . . . . . . . . . . . . . . . . . . . . . . . . . . . . . . . . . . . . . . . . . . . . . . . . . . . . . . . . .11Time Limits and the STAR Maths Diagnostic Report . . . . . . . . . . . . . . . . . . . . . . . . . . . . . . . . . . .12
Content and Test Design . . . . . . . . . . . . . . . . . . . . . . . . . . . . . 13Content Specification . . . . . . . . . . . . . . . . . . . . . . . . . . . . . . . . . . . . . . . . . . . . . . . . . . . . . . . . .13
Numeration Concepts. . . . . . . . . . . . . . . . . . . . . . . . . . . . . . . . . . . . . . . . . . . . . . . . . . . . . . . . . . . . . .13Computational Processes . . . . . . . . . . . . . . . . . . . . . . . . . . . . . . . . . . . . . . . . . . . . . . . . . . . . . . . . . .14Approximations . . . . . . . . . . . . . . . . . . . . . . . . . . . . . . . . . . . . . . . . . . . . . . . . . . . . . . . . . . . . . . . . . . .15Shape and Space . . . . . . . . . . . . . . . . . . . . . . . . . . . . . . . . . . . . . . . . . . . . . . . . . . . . . . . . . . . . . . . . . .15Measures . . . . . . . . . . . . . . . . . . . . . . . . . . . . . . . . . . . . . . . . . . . . . . . . . . . . . . . . . . . . . . . . . . . . . . . . .15Data Analysis and Statistics. . . . . . . . . . . . . . . . . . . . . . . . . . . . . . . . . . . . . . . . . . . . . . . . . . . . . . . . .16Word Problems. . . . . . . . . . . . . . . . . . . . . . . . . . . . . . . . . . . . . . . . . . . . . . . . . . . . . . . . . . . . . . . . . . . .16Algebra . . . . . . . . . . . . . . . . . . . . . . . . . . . . . . . . . . . . . . . . . . . . . . . . . . . . . . . . . . . . . . . . . . . . . . . . . . .16
Rules for Writing Items. . . . . . . . . . . . . . . . . . . . . . . . . . . . . . . . . . . . . . . . . . . . . . . . . . . . . . . . .41
Computer-Adaptive Test Design . . . . . . . . . . . . . . . . . . . . . . . . . . . . . . . . . . . . . . . . . . . . . . . .41
STAR Maths Scoring . . . . . . . . . . . . . . . . . . . . . . . . . . . . . . . . . . . . . . . . . . . . . . . . . . . . . . . . . . .44

Contents
iiSTAR Maths™Technical Manual
Calibration Study and Item Analysis . . . . . . . . . . . . . . . . . . . 45Calibration Sample. . . . . . . . . . . . . . . . . . . . . . . . . . . . . . . . . . . . . . . . . . . . . . . . . . . . . . . . . . . .45
Data Collection . . . . . . . . . . . . . . . . . . . . . . . . . . . . . . . . . . . . . . . . . . . . . . . . . . . . . . . . . . . . . . .47
Item Analysis . . . . . . . . . . . . . . . . . . . . . . . . . . . . . . . . . . . . . . . . . . . . . . . . . . . . . . . . . . . . . . . . .48
Item Difficulty. . . . . . . . . . . . . . . . . . . . . . . . . . . . . . . . . . . . . . . . . . . . . . . . . . . . . . . . . . . . . . . . .49
Item Discrimination . . . . . . . . . . . . . . . . . . . . . . . . . . . . . . . . . . . . . . . . . . . . . . . . . . . . . . . . . . .49
Item Response Function . . . . . . . . . . . . . . . . . . . . . . . . . . . . . . . . . . . . . . . . . . . . . . . . . . . . . . .49
Review of Calibrated Items . . . . . . . . . . . . . . . . . . . . . . . . . . . . . . . . . . . . . . . . . . . . . . . . . . . . .51Rules for Item Retention . . . . . . . . . . . . . . . . . . . . . . . . . . . . . . . . . . . . . . . . . . . . . . . . . . . . . . . . . . .51
Dynamic Calibration. . . . . . . . . . . . . . . . . . . . . . . . . . . . . . . . . . . . . . . . . . . . . . . . . . . . . . . . . . .52
Score Definitions . . . . . . . . . . . . . . . . . . . . . . . . . . . . . . . . . . . 53Types of Test Scores. . . . . . . . . . . . . . . . . . . . . . . . . . . . . . . . . . . . . . . . . . . . . . . . . . . . . . . . . . .53
National Curriculum Level–Maths (NCL–M) . . . . . . . . . . . . . . . . . . . . . . . . . . . . . . . . . . . . . . . . . . .54Normed Referenced Standardised Score (NRSS) . . . . . . . . . . . . . . . . . . . . . . . . . . . . . . . . . . . . . .54Percentile Rank (PR) and Percentile Rank Range. . . . . . . . . . . . . . . . . . . . . . . . . . . . . . . . . . . . . .55Scaled Score (SS) . . . . . . . . . . . . . . . . . . . . . . . . . . . . . . . . . . . . . . . . . . . . . . . . . . . . . . . . . . . . . . . . . .55
Reliability and Measurement Precision . . . . . . . . . . . . . . . . . 56UK Study Results . . . . . . . . . . . . . . . . . . . . . . . . . . . . . . . . . . . . . . . . . . . . . . . . . . . . . . . . . . . . . .56
Generic Reliability. . . . . . . . . . . . . . . . . . . . . . . . . . . . . . . . . . . . . . . . . . . . . . . . . . . . . . . . . . . . .57
Split-Half Reliability . . . . . . . . . . . . . . . . . . . . . . . . . . . . . . . . . . . . . . . . . . . . . . . . . . . . . . . . . . .58
Alternate Form Reliability . . . . . . . . . . . . . . . . . . . . . . . . . . . . . . . . . . . . . . . . . . . . . . . . . . . . . .58
Standard Error of Measurement . . . . . . . . . . . . . . . . . . . . . . . . . . . . . . . . . . . . . . . . . . . . . . . .60
Validity. . . . . . . . . . . . . . . . . . . . . . . . . . . . . . . . . . . . . . . . . . . . 61UK Study Results . . . . . . . . . . . . . . . . . . . . . . . . . . . . . . . . . . . . . . . . . . . . . . . . . . . . . . . . . . . . . .62
Concurrent Validity . . . . . . . . . . . . . . . . . . . . . . . . . . . . . . . . . . . . . . . . . . . . . . . . . . . . . . . . . . . . . . . .64
Relationship of STAR Maths 2.0 Scores to Scores on Other Tests of Mathematics Achievement . . . . . . . . . . . . . . . . . . . . . . . . . . . . . . . . . . . . . . . . . . . . . . . . . . . . .66
Meta-Analysis of the STAR Maths Validity Data . . . . . . . . . . . . . . . . . . . . . . . . . . . . . . . . . . .81
Relationship of STAR Maths 2.0 Scores to Teacher Ratings. . . . . . . . . . . . . . . . . . . . . . . . .82The Rating Instruments . . . . . . . . . . . . . . . . . . . . . . . . . . . . . . . . . . . . . . . . . . . . . . . . . . . . . . . . . . . .82Psychometric Properties of the Skills Ratings. . . . . . . . . . . . . . . . . . . . . . . . . . . . . . . . . . . . . . . . .85Relationship of STAR Maths 2.0 Scaled Scores to Maths Skills Ratings . . . . . . . . . . . . . . . . . . .85
Norming . . . . . . . . . . . . . . . . . . . . . . . . . . . . . . . . . . . . . . . . . . . 89Sample Characteristics . . . . . . . . . . . . . . . . . . . . . . . . . . . . . . . . . . . . . . . . . . . . . . . . . . . . . . . .89
Regional Distribution . . . . . . . . . . . . . . . . . . . . . . . . . . . . . . . . . . . . . . . . . . . . . . . . . . . . . . . . . . . . . .89Standardised Scores . . . . . . . . . . . . . . . . . . . . . . . . . . . . . . . . . . . . . . . . . . . . . . . . . . . . . . . . . . . . . . .90
How Standardised Scores Are Calculated for Students . . . . . . . . . . . . . . . . . . . . . . . . . . . .92

Contents
iiiSTAR Maths™Technical Manual
Percentile Ranks (PR) . . . . . . . . . . . . . . . . . . . . . . . . . . . . . . . . . . . . . . . . . . . . . . . . . . . . . . . . . . . . . .94How Percentile Ranks Are Calculated for a Student . . . . . . . . . . . . . . . . . . . . . . . . . . . . . . .96
National Curriculum Level–Maths (NCL–M) . . . . . . . . . . . . . . . . . . . . . . . . . . . . . . . . . . . . . . . . . .100Gender . . . . . . . . . . . . . . . . . . . . . . . . . . . . . . . . . . . . . . . . . . . . . . . . . . . . . . . . . . . . . . . . . . . . . . . . . .101Regional Differences in Outcome. . . . . . . . . . . . . . . . . . . . . . . . . . . . . . . . . . . . . . . . . . . . . . . . . . .102
Reliability . . . . . . . . . . . . . . . . . . . . . . . . . . . . . . . . . . . . . . . . . . . . . . . . . . . . . . . . . . . . . . . . . . 103Split-Half Reliability . . . . . . . . . . . . . . . . . . . . . . . . . . . . . . . . . . . . . . . . . . . . . . . . . . . . . . . . . . . . . .103Test-Retest Reliability. . . . . . . . . . . . . . . . . . . . . . . . . . . . . . . . . . . . . . . . . . . . . . . . . . . . . . . . . . . . .103
Validity. . . . . . . . . . . . . . . . . . . . . . . . . . . . . . . . . . . . . . . . . . . . . . . . . . . . . . . . . . . . . . . . . . . . . 106
Other Issues . . . . . . . . . . . . . . . . . . . . . . . . . . . . . . . . . . . . . . . . . . . . . . . . . . . . . . . . . . . . . . . . 106
Reference . . . . . . . . . . . . . . . . . . . . . . . . . . . . . . . . . . . . . . . . . . . . . . . . . . . . . . . . . . . . . . . . . . 106
Frequently Asked Questions . . . . . . . . . . . . . . . . . . . . . . . . . 107What Is the Primary Purpose of the STAR Maths Assessment? Why Have So
Many Schools Purchased It, and How Are They Using the Results?. . . . . . . . . . . . . . . . .107How Can STAR Maths Accurately Determine a Student’s Maths Level with
Only 24 Test Questions and in Just 15 Minutes? . . . . . . . . . . . . . . . . . . . . . . . . . . . . . . . . .107What Evidence Do We Have that STAR Maths Performs as Claimed?. . . . . . . . . . . . . . . . . . . .108There Do Not Seem to Be Any Calculus Items. What Are the Most Difficult
Questions in the Test? . . . . . . . . . . . . . . . . . . . . . . . . . . . . . . . . . . . . . . . . . . . . . . . . . . . . . . . .108When I Take a STAR Maths Test, I Keep Getting Difficult Questions Even
Though I Entered Myself as a Lower Year Student. Why?. . . . . . . . . . . . . . . . . . . . . . . . . .108There Does Not Seem to Be Any Pattern to the Types of STAR Maths Test
Questions Posed. How Does It Select the Maths Objectives to Be Tested On? . . . . . . .109My Students Get Items on Material We Have Not Covered Yet. Can This
Be Prevented? . . . . . . . . . . . . . . . . . . . . . . . . . . . . . . . . . . . . . . . . . . . . . . . . . . . . . . . . . . . . . . .109The STAR Maths Test Seems Too Difficult and Frustrating for My Higher-
Performing Primary School Students. . . . . . . . . . . . . . . . . . . . . . . . . . . . . . . . . . . . . . . . . . .110May Students Use Calculators or Reference Materials During a STAR Maths Test? . . . . . . .110Does the STAR Maths Test Assess Problem-Solving or Critical Thinking Skills? . . . . . . . . . .110Why Did You Choose to Use Multiple-Choice Questions to Measure Problem-
Solving Skills Rather Than Open-Ended Questions?. . . . . . . . . . . . . . . . . . . . . . . . . . . . . .110How Often Should We Administer STAR Maths Tests?. . . . . . . . . . . . . . . . . . . . . . . . . . . . . . . . .110Are STAR Maths Test Results Really Very Useful at the Secondary School Level?. . . . . . . . .111Is There a Way for the Teacher to See Which Questions a Student Answered
Correctly and Incorrectly?. . . . . . . . . . . . . . . . . . . . . . . . . . . . . . . . . . . . . . . . . . . . . . . . . . . . .111Explain What “Calibration” and “Norming” Mean.. . . . . . . . . . . . . . . . . . . . . . . . . . . . . . . . . . . .111Why Do Some of My Students Who Took STAR Maths Have Scores That Are Widely
Varying from the Results of Our Other Standardised Test Program? . . . . . . . . . . . . . . .112Why Do We See a Significant Number of Our Students Performing at a Lower Level
Now Than They Were Nine Weeks Ago? . . . . . . . . . . . . . . . . . . . . . . . . . . . . . . . . . . . . . . . . .112
Appendix A: US Norming Study. . . . . . . . . . . . . . . . . . . . . . . 114US Norming . . . . . . . . . . . . . . . . . . . . . . . . . . . . . . . . . . . . . . . . . . . . . . . . . . . . . . . . . . . . . . . . 114
Sample Characteristics . . . . . . . . . . . . . . . . . . . . . . . . . . . . . . . . . . . . . . . . . . . . . . . . . . . . . . 114
Data Analysis . . . . . . . . . . . . . . . . . . . . . . . . . . . . . . . . . . . . . . . . . . . . . . . . . . . . . . . . . . . . . . . 118
Additional Information Regarding the Norming Sample . . . . . . . . . . . . . . . . . . . . . . . . . 120

Contents
ivSTAR Maths™Technical Manual
References. . . . . . . . . . . . . . . . . . . . . . . . . . . . . . . . . . . . . . . . 123
Index . . . . . . . . . . . . . . . . . . . . . . . . . . . . . . . . . . . . . . . . . . . . 124
1STAR Maths™Technical Manual
Introduction
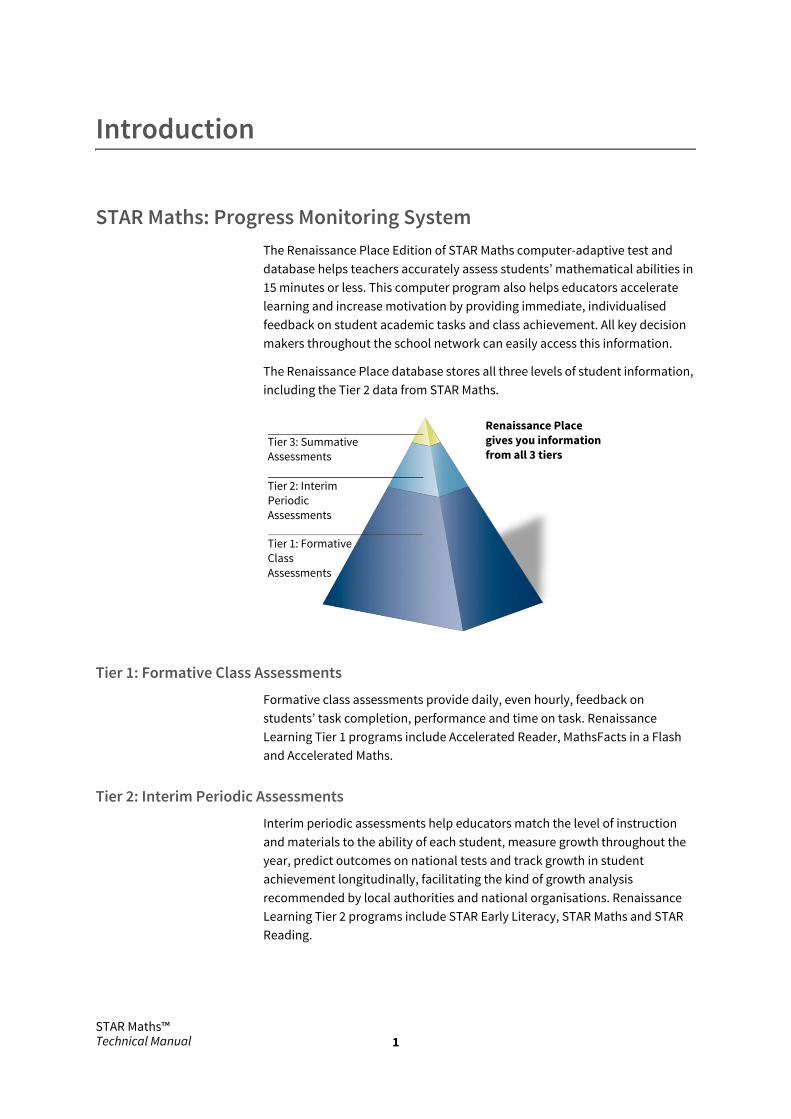
STAR Maths: Progress Monitoring SystemThe Renaissance Place Edition of STAR Maths computer-adaptive test and database helps teachers accurately assess students’ mathematical abilities in 15 minutes or less. This computer program also helps educators accelerate learning and increase motivation by providing immediate, individualised feedback on student academic tasks and class achievement. All key decision makers throughout the school network can easily access this information.
The Renaissance Place database stores all three levels of student information, including the Tier 2 data from STAR Maths.
Tier 1: Formative Class Assessments
Formative class assessments provide daily, even hourly, feedback on students’ task completion, performance and time on task. Renaissance Learning Tier 1 programs include Accelerated Reader, MathsFacts in a Flash and Accelerated Maths.
Tier 2: Interim Periodic Assessments
Interim periodic assessments help educators match the level of instruction and materials to the ability of each student, measure growth throughout the year, predict outcomes on national tests and track growth in student achievement longitudinally, facilitating the kind of growth analysis recommended by local authorities and national organisations. Renaissance Learning Tier 2 programs include STAR Early Literacy, STAR Maths and STAR Reading.
Tier 1: FormativeClassAssessments
Tier 2: InterimPeriodicAssessments
Tier 3: SummativeAssessments
Renaissance Placegives you informationfrom all 3 tiers

IntroductionSTAR Maths Purpose
2STAR Maths™Technical Manual
Tier 3: Summative Assessments
Summative assessments provide quantitative and qualitative data in the form of high-stakes tests. The best way to ensure success on Tier 3 assessments is to monitor progress and adjust instructional methods and practice activities throughout the year using Tier 1 and Tier 2 assessments.
STAR Maths PurposeAs a periodic progress monitoring system, STAR Maths software serves two primary purposes. First, it provides educators with quick and accurate estimates of students’ teaching and learning maths levels. Second, it assesses maths achievement on a continuous scale over the range of school years from 2–13, thereby providing the means for tracking growth in a consistent manner over long time periods for all students. This is especially helpful to school- and school network-level administrators.
The STAR Maths test is not intended to be used as a “high-stakes” or “national” test whose main function is to report end-of-period performance to parents and educationists. Although that is not its purpose, STAR Maths scores are highly correlated with large-scale survey achievement tests. The high correlations of STAR Maths scores with such national instruments makes it easier to fine-tune instruction while there is still time to improve performance before the regular testing cycle.
STAR Maths’ unique powers of flexibility and repeatability provide specific advantages for various groups:
For students, STAR Maths software provides a challenging, interactive and brief test that builds confidence in their maths ability.
For teachers, STAR Maths software facilitates individualised instruction by identifying students’ current developmental levels and areas for growth.
For head teachers, STAR Maths software provides regular, accurate reports on performance at the class, year, school and school network level, as well as school year-to-school year comparisons.
For school network administrators and assessment specialists, the Management program provides a wealth of reliable and timely data on maths growth at each school and throughout a school network. It also provides a valid basis for comparing data across schools, student years and special student populations.
This manual documents the suitability of the STAR Maths progress monitoring system for these purposes and presents evidence of its reliability, validity and merits as a psychometric instrument.

IntroductionDesign of STAR Maths
3STAR Maths™Technical Manual
Design of STAR MathsOne of the fundamental decisions when designing STAR Maths involved the choice of how to administer the test. Because of the numerous advantages offered by computer-administered tests, it was decided to develop STAR Maths as a computer software product.
The primary advantage of using computer software to administer the STAR Maths test is the ability to tailor each student’s test based on the student’s specific responses to previous items. Paper-and-pencil tests are obviously far different from this: every student must respond to the same items in the same sequence. Using computer-adaptive procedures, however, it is possible for students to be tested using items that appropriately match their current level of proficiency. Adaptive Branching, the item selection procedure used in the STAR Maths test, effectively customises every test to the student’s current achievement level.
Adaptive Branching offers significant advantages in terms of test reliability, testing time and student motivation. First, reliability improves over paper-and-pencil tests because the test difficulty matches each individual’s performance level; students do not have to fit a “one test fits all” model. With a computer-adaptive test, most of the test items to which students respond are at levels of difficulty that closely match their achievement levels. Testing time decreases because, unlike in paper-and-pencil tests, students need not be exposed to a broad range of material, some of which is inappropriate because it is either too easy for high achievers or too difficult for those with low levels of performance. Finally, computer-adaptive assessments improve student motivation simply because of the aforementioned issues: test time is minimised and test content is neither too difficult nor too easy. Not surprisingly, most students enjoy taking STAR Maths tests and many report that it increases their confidence in maths.
Another fundamental STAR Maths design decision involved the format of the test items. The items had to be easily administered and objectively marked by a computer and also provide the breadth of construct coverage necessary for an assessment of maths achievement. The traditional four-item multiple-choice format was chosen, based on considerations of efficiency of assessment, objectivity and simplicity of scoring.
The final fundamental design decision involved determining the organisation of the content in STAR Maths. Because of the great amount of overlap in content in the maths construct, it is difficult to create distinct categories or “strands” for a mathematics achievement instrument. After reviewing the STAR Maths test’s content, curricular materials and similar maths achievement instruments, the following eight strands were identified and included in STAR Maths: Numeration Concepts, Computation Processes, Word Problems, Approximation, Data Analysis and Statistics, Shape and Space, Measurement and Algebra.
IntroductionDesign of STAR Maths
4STAR Maths™Technical Manual
The STAR Maths test is further divided into two parts. The first part of the test, the first sixteen items, includes items only from the Numeration Concepts and the Computation Processes strands. The first eight test items (items 1–8) are from the Numeration Concepts strand and the following eight test items (items 9–16) are from the Computation Processes strand.
The second part of the test, or the final eight items, includes items from all of the remaining strands. Hence, items 17–24 are drawn from the following six strands: Word Problems, Approximation, Data Analysis and Statistics, Shape and Space, Measurement and Algebra. The specific makeup of the strands used in the final eight items depends on the student’s year. For example, a student in Year 2 will not receive items from the Approximation strand, but items from this strand could be administered to a post-secondary student.
The decision to weight the test heavily towards Numeration Concepts and Computation Processes resulted from the fact that these strands are fundamental to all others and they include the content about which teachers desire the most information. Although this approach emphasises the two strands in the first part of the test, it provides adequate content balance to assure valid assessment. Additionally, factor analysis of the various content strands supports the fundamental unidimensionality of the construct being measured in the STAR Maths test; therefore, splitting the test in this way does not impact the measurement validity.
Each STAR Maths item was developed in association with a very specific content objective (described in “Content and Test Design” on page 13). In addition, the calibration trials included items that were expressed differently in textbooks and other reference materials and only the item formats that provided the best psychometric properties were retained in the final item bank. For example, many questions were crafted both with and without graphics supporting the text of the question. For items containing text in either the question stem or the response choices, great care was taken to keep the text simple and the reading level as low as practical. This is particularly important with computer-adaptive testing because high-performing, lower-year students may receive higher year questions.
In an attempt to minimise the administration of inappropriate items to students, each item in the item bank is assigned a curricular placement value corresponding to the earliest year where instruction for this content would occur. During testing, students receive items with a maximum curricular placement value of three years higher than their current year. Although this constraint does not limit the attainable scores in any way, since very difficult items still exist in the item bank within these constraints, it does help to minimise presentation of items for which the student has not yet had any formal instruction.

IntroductionDesign of STAR Maths
5STAR Maths™Technical Manual
Improvements to the STAR Maths Test
Since its introduction in the US in 1998, the STAR Maths test has undergone a process of continuous research and improvement. Version 2.0 was an entirely new test, with new content and several technical innovations. The following improvements were introduced in version 2.0.
The item bank was expanded by 38%, from 1,434 items to 1,974 items.
The content of the item bank was expanded as well. The item bank covered 214 objectives, compared to 176 in the STAR Maths 1.x. Many of the new objectives covered topics in US high school (upper years) algebra, resulting in an improvement in STAR Maths’ usefulness for assessing students who planned to continue their education after Year 13. Other new objectives covered simpler maths topics to accommodate the addition of US grades 1 and 2 (Years 2 and 3) to the STAR Maths product.
The test specifications were changed to limit the number of items measuring a single objective that could be administered. This ensured diversity in terms of content objectives and provided a more balanced assessment of the maths construct.
Content balancing specifications, grounded in curricula, were implemented. This ensured that every test would include items assessing student proficiency in a variety of maths content areas.
The distribution of items among Numeration Concepts, Computation Processes and other applications (all other STAR Maths strands) were changed. In STAR Maths 2.x and higher, one-third of the items in each test came from each of those three broad areas.
The difficulty level of the test was eased to enhance student motivation and minimise student frustration. In US and UK versions, the STAR Maths 2.x and higher adaptive brancher would select items that each student could answer correctly about 75% of the time. In STAR Maths 1.x, the adaptive brancher selected items that each student could answer correctly about 50% of the time. This modification in STAR Maths 2.x and higher resulted in a testing session with items that were neither too hard nor too easy.
New norms were developed to provide the most accurate and up-to-date scores possible.
The Diagnostic Report underwent major changes to provide educators with detailed information about each student’s current maths achievement.
A new Accelerated Maths Library Report was created that provided educators with a simple method for placing their students in the appropriate Accelerated Maths library after a STAR Maths test.
Versions 3.x RP and higher are adaptations of version 2.x designed specifically for use on a computer with web access. All management and test

IntroductionDesign of STAR Maths
6STAR Maths™Technical Manual
administration functions are controlled using a management system which is accessed on the web. (The content in STAR Maths version 3.0 is identical to the content in STAR Maths version 2.x.) This makes a number of new features possible:
Multiple schools can share a central database, such as a school network-level database. Records of students transferring between schools will be maintained; the only information that needs revision following a transfer is the student’s school and class assignments.
The same database that contains STAR Maths data can contain data on other STAR tests, including STAR Early Literacy and STAR Reading. Renaissance Place is a powerful, online information management program that allows you to manage all your school network, school, personnel, parent and student data in one place. Changes made to school network, school, teacher, parent and student data for any of these programs, as well as other Renaissance Place software, are reflected in every other Renaissance Place program that shares the central database.
Multiple levels of access are available, from the test administrator within a school or class, to teachers, head teachers and school network administrators.
Renaissance Place takes reporting to a new level. Not only can you generate reports from the student level all the way up to the school level, but you can also limit reports to specific groups, subgroups and combinations of subgroups. This supports “disaggregated” reporting; for example, a report might be specific to students eligible for free or reduced school meals, to English language learners or to students who fit both categories. It also supports compiling reports by teacher, class, school, year (US grade) within a school and many other criteria such as a specific date range. In addition, the Renaissance Place consolidated reports allow you to gather data from more than one program (such as STAR Maths and Accelerated Maths) at the teacher, class, school and school network levels and display the information in one report.
Since Renaissance Place is accessed through a web browser, teachers (and administrators) will be able to access the program from home—provided the school network or school gives them that access.
In UK versions, the difficulty level of the test was revised to improve measurement precision. The adaptive brancher in UK STAR Maths versions 3.x and higher selects items that each student can answer correctly about 67.5% of the time.
Beginning July 2009, STAR Maths can be used to test Year 1 students, at the teacher’s discretion.

IntroductionTest Security
7STAR Maths™Technical Manual
Test SecuritySTAR Maths software includes a variety of features intended to provide adequate security to protect the content of the test and to maintain the confidentiality of the test results.
Split Application Model
In the STAR Maths RP software, when students log in, they do not have access to the same functions that teachers, administrators and other personnel can access. Students are allowed to test, but they have no other tasks available in STAR Maths RP; therefore, they have no access to confidential information. When teachers and administrators log in, they can manage student and class information, set preferences, register students for testing and create informative reports about student test performance.
Individualised Tests
Using Adaptive Branching, every STAR Maths test consists of items chosen from a large number of items of similar difficulty based on the student’s estimated ability. Because each test is individually assembled based on the student’s past and present performance, identical sequences of items are rare. This feature, while motivated chiefly by psychometric considerations, contributes to test security by limiting the impact of item exposure.
Data Encryption
A major defence against unauthorised access to test content and student test scores is data encryption. All of the items and export files are encrypted. Without the appropriate decryption code, it is practically impossible to read the STAR Maths data or access or change it with other software.
Access Levels and Capabilities
Each user’s level of access to a Renaissance Place program depends on the primary position assigned to that user and the capabilities the user has been granted in Renaissance Place. Each primary position is part of a user group. There are six user groups: school network administrator (Renaissance Place Administrator), school network staff, school administrator, school staff, teacher and student. By default, each user group is granted a specific set of capabilities. Each capability corresponds to one or more tasks that can be performed in the program. The capabilities in these sets can be changed; capabilities can also be granted or removed on an individual level. Since users can be assigned to the school network and/or one or more schools (and be assigned different primary positions at the different locations), and since the capabilities granted to a user can be customised, there are many, varied levels of access an individual user can have.

IntroductionTest Administration Procedures
8STAR Maths™Technical Manual
Renaissance Place also allows you to restrict students’ access to certain computers. This prevents students from taking STAR Maths tests from unauthorised computers (such as a home computer). For more information on student access security, see the Renaissance Place Software Manual.
The security of the STAR Maths data is also protected by each person’s user name (which must be unique) and password. User names and passwords identify users, and the program only allows them access to the data and features that they are allowed based on their primary position and the capabilities that they have been granted. Personnel who log in to Renaissance Place (teachers, administrators and staff) must enter a user name and password before they can access the data and create reports. Without an appropriate user name and password, personnel cannot use the STAR Maths RP software.
Test Monitoring/Password Entry
Test monitoring is another useful STAR Maths security feature. Test monitoring is implemented using the Testing Password preference, which specifies whether teaching assistants must enter an authorisation password at the start of a test. Students are required to enter a user name and password to log in before taking a test. This ensures that students cannot take tests using other students’ names.
Final Caveat
While STAR Maths software can do much to provide specific measures of test security, the most important line of defence against unauthorised access or misuse of the program is user responsibility. Teachers and teaching assistants need to be careful not to leave the program running unattended and to monitor all testing to prevent students from cheating, copying down questions and answers or performing “print screens” during a test session.
They should also ensure that scratch paper used in the testing process is gathered and discarded after each testing session. Taking these simple precautionary steps will help maintain STAR Maths’ security and the quality and validity of its scores.
Test Administration ProceduresSTAR Maths 3.x and higher uses the norms developed for STAR Maths 2.0. In order to ensure consistency and comparability of test results to the STAR Maths 2.0 norms, teachers administering a STAR Maths 3.x and higher test should follow the recommended administration procedures. These same procedures were used by the norming participants. It is also a good idea to make sure that the testing environment is as free from distractions for the student as possible.

IntroductionTest Interface
9STAR Maths™Technical Manual
During the US STAR Maths 2.0 standardisation, the program was designed so that teachers could not deactivate the proctoring (test-monitoring) options. This was necessary to ensure that the norming data gathered were as reliable as possible. During norming, test monitors had responsibility for test security and were required to provide access to the test for each student. In the final US and UK versions of the software, teachers can turn off the requirement for test monitoring using the Testing Password preference, but it is not recommended that they do so.
Also during STAR Maths 2.0 standardisation, all participants received the same set of test instructions contained in the Pretest Instructions included with the STAR Maths 3.x and higher program. These instructions describe the standard test orientation procedures that teachers should follow to prepare their students for the STAR Maths test. These instructions are intended for use with students of all ages and have been successfully field-tested with students ranging from US grades 1–12 (equivalent to UK Years 2–13). It is important to use these same instructions with all students prior to STAR Maths 3.x and higher testing. While the Pretest Instructions should be used prior to each student’s first STAR Maths test, it is not necessary to administer them prior to a student’s second or subsequent tests.
Test InterfaceThe STAR Maths test interface was designed to be both simple and effective. Students can use either the keyboard or the mouse to input answers.
If using the keyboard, students press one of the four letter keys (A, B, C and D) and the Enter key (or the return key on Macintosh computers).
If using the mouse, students click the answer of choice and click Next to complete the test.
Practice SessionThe practice session before the STAR Maths test allows students to become comfortable with the test interface and to make sure that they know how to operate the software properly. Students can pass the practice session and proceed to the actual STAR Maths test by answering two out of the three practice questions correctly. If a student does not do this, the program presents three more questions, and the student can pass the practice session by answering two of those three questions correctly. If the student does not pass after the second attempt, the student will not proceed to the actual STAR Maths test.
Even students with low maths and reading skills should be able to answer the practice questions correctly. However, STAR Maths will halt the testing session and tell the student to ask the teacher for help if the student does not pass after the second attempt.

IntroductionAdaptive Item Selection
10STAR Maths™Technical Manual
Students may experience difficulty with the practice questions for a variety of reasons. The student may not understand maths even at the most basic level or may be confused by the “not given” response option presented in some of the practice questions. Alternatively, the student may need help using the keyboard. If this is the case, the teacher (or teaching assistant) should help the student through the practice session during the student’s next STAR Maths test. If a student still struggles with the practice questions with teacher assistance, he or she may not yet be ready to complete a STAR Maths test.
Adaptive Item SelectionSTAR Maths’ item selection branching algorithm uses a proprietary approach somewhat more complex than the simple Rasch Maximum Information IRT model. The approach used in the STAR Maths test was designed to yield reliable test results by adjusting item difficulty to the responses of the individual being tested while striving to minimise test length and student frustration.
As an added measure to minimise student frustration, the first administration of the test begins with items that have a difficulty level substantially below what a typical student at a given year can handle—usually one or two years below the student’s current year in school.
Teachers can override the student’s current year for determining starting difficulty by entering the current level of mathematics instruction for the student using the MIL (Maths Instruction Level). When an MIL is provided, the program uses that value to raise or lower the starting difficulty of the first test. On the second and subsequent administrations, the test begins about one year lower than the ability last demonstrated within 75 days.
Once the testing session is underway, STAR Maths software administers 24 items of varying difficulty, adapting the difficulty level of the items dynamically according to the student’s responses. It should be noted that unlike traditional tests, the time required for completion increases with ability. For example, students performing at and above the 90th percentile will on average require about 13 minutes to complete the test, while students performing at or below the 10th percentile require only 10 minutes.
Test RepetitionSTAR Maths data can be used for multiple purposes such as screening, placement, planning instruction, benchmarking and outcomes measurement. The frequency with which the assessment is administered depends on the purpose for assessment and how the data will be used. Renaissance Learning recommends assessing students only as frequently as necessary to get the data needed. Schools that use STAR for screening purposes typically administer it two to five times per year. Teachers who want to monitor student

IntroductionItem Time Limits
11STAR Maths™Technical Manual
progress more closely or use the data for instructional planning may use it more frequently. STAR may be administered as frequently as weekly for progress monitoring purposes.
The STAR Maths 3.x or higher item bank contains more than 1,900 items created from eight different content strands. Because the STAR Maths software keeps track of the specific items presented to each student from test session to test session, it does not present the same item more than once in any 75-day period. By doing so, the software keeps item reuse to a minimum. In addition, if a student is progressing in mathematics development throughout the year and from year to year, item exposure should not be an issue at all.
More information on the content of the STAR Maths item bank is available in “Content and Test Design” on page 13.
Item Time LimitsThe STAR Maths test has a fixed three-minute time limit for individual test items and a fixed ninety-second time limit for practice items. A fixed time limit was chosen to avoid the complexity and confusion associated with a variable time-out period. Three minutes was chosen on the basis of calibration and US standardisation timing data and general content testing experience.1
When a student has only 15 seconds remaining for a given item, a picture of a clock appears in the upper-right corner of the screen, indicating that he or she should make a final selection and move on. Items that time out are counted as incorrect responses unless the student has the correct answer selected and has not yet pressed Enter or return before the item times out. In that case, the answer is accepted as correct.
The items were crafted with one minute as the maximum amount of time that a student who knew how to do the mathematics would require to complete the solution and respond. During the US STAR Maths 2.0 standardisation, the mean item response time was 27 seconds with a standard deviation of 25 seconds. The median was 19 seconds, and nearly all (99.7%) item responses were made within the three-minute time limit. Mean and median response times were similar at all US grades. Although the incidence of maximum time limits was somewhat higher at the lowest three US grades than in other US grades, fewer than half of one per cent of item responses reached the time limit. This was true even for US first-grade (second-year) students. This suggests that the time limits used for STAR Maths 3.x allow ample time for nearly all students to complete the questions.
1. After July 2009, teachers gained the ability to extend time limits for questions for students who have special needs. The standard time limits are 90 seconds for practice questions and 180 seconds for actual test questions; the extended time limits allow 180 seconds for practice questions and 360 seconds for actual test questions.

IntroductionItem Time Limits
12STAR Maths™Technical Manual
Time Limits and the STAR Maths Diagnostic Report
The STAR Maths Diagnostic Report includes a conditional text section in the event that a student completes the test in much less time than normal. There are two parts of the test considered in the report explanation.
The first part includes the first 16 items that appear in the test. If the student completes the first part in 107 seconds or less, the following text appears in the report:
Time for First Part: # seconds Time for Second Part: # seconds
The time required to complete the first part of the test was very low. It may be that (Name) can do maths very quickly, or that (Name) did not try very hard on the first part of the test. If you suspect the latter to be true, you may want to discuss the situation with the student and retest.
The second part includes the last 8 items that appear in the test. If the student completes the second part in 49 seconds or less, the following text appears in the report:
Time for First Part: # seconds Time for Second Part: # seconds
The time required to complete the second part of the test was very low. It may be that (Name) can do maths very quickly, or that (Name) did not try very hard on the second part of the test. If you suspect the latter to be true, you may want to discuss the situation with the student and retest.
If the student completes both parts of the test within the respective time frames, the following text appears in the report:
Time for First Part: # seconds Time for Second Part: # seconds
The times required to complete both parts of the test were very low. It may be that (Name) can do maths very quickly, or that (Name) did not try very hard on the test. If you suspect the latter to be true, you may want to discuss the situation with the student and retest.

13STAR Maths™Technical Manual
Content and Test Design
Content of the STAR Maths test evolved through three stages of development. The first stage involved specifying the curriculum content to be reflected in the test. Because rules for writing the items influenced the exact ways in which this content finally appeared in the test, these rules may be considered part of this first stage of development. The following section describes these rules. In the second stage, items were empirically tested in a calibration research program, and items most suited to the test model were retained. The third stage occurs dynamically as each student completes a STAR Maths test. The content of each STAR Maths test depends on the selection of items for that individual student according to the computer-adaptive testing mode.
Content SpecificationSTAR Maths test content is intended to reflect the objectives commonly taught in the mathematics curricula of contemporary schools. The following major sources helped to define this curriculum content:
National Curriculum (UK)
National Numeracy Strategies (UK)
National Foundation for Educational Research—NFER (UK organisation)
Trends in International Mathematics and Science Study (TIMSS)
Principles and Standards for School Mathematics of the National Council of Teachers of Mathematics (US organisation)
Content specifications for the National Assessment of Educational Progress (US assessment)
An extensive review of content covered in leading textbook series
Curriculum guides and lists of objectives
There is reasonable, although not universal, agreement among these sources about the content of mathematics curricula.
The final STAR Maths content specifications were intended to cover the objectives most frequently found in these sources. The STAR maths content is organised into eight strands. There are 693 objectives within the eight strands.
Numeration Concepts
The Numeration Concepts strand encompasses 103 objectives. This strand concentrates on the conceptual development of the decimal number system. At the lowest levels, it covers cardinal and original numbers through ten (the ones). The strand then proceeds to treatment of the decades (tens), hundreds, thousands and then larger numbers such as hundred thousands and millions,

Content and Test DesignContent Specification
14STAR Maths™Technical Manual
all in the whole-number realm. At each of these levels of the number system, specific objectives relate to place value identification, number-numeral correspondence and expanded notation. Following treatment of the whole numbers, the Numeration Concepts strand moves to fractions and decimals. Coverage includes representation of fractions and decimals on a number line, conversions between fractions with different denominators, conversion between fractions and decimals and number-numeral correspondence for decimals and rounding decimals.
Included in this category are specific objectives on roots, index notation and scientific notation. Because items in the Numeration Concepts Strand emphasise understanding basic concepts, they are deliberately written to minimise computational burden.
Computational Processes
The Computational Processes strand includes 115 specific objectives. This strand covers the four basic operations (addition, subtraction, multiplication and division) with whole numbers, fractions, decimals and percentages. Ratios and proportions are also included in this strand. Coverage of computational skill begins with the basic facts of addition and subtraction, starting with the fact families having sums to 10, then with sums to 18. The strand progresses to addition and subtraction of two-digit and three-digit numbers without regrouping, then with regrouping. At about the same level, basic facts of multiplication and division are introduced. Then, the four operations are applied to more difficult regrouping problems with whole numbers. Fractions are first introduced by way of addition and subtraction of fractions with like denominators. These are relatively easy for students in the US. However, the strand next includes operations with fractions with unlike denominators, mixed numbers and decimal problems requiring place change, all of which are relatively difficult for students. The Computation Processes strand concludes with a series of objectives requiring operations with percentages, ratios and proportions.
Although the Computation Processes strand can be subdivided into nearly an infinite number of objectives, the STAR Maths item bank provides a representative sampling of computational problems that cover the major types of problems students are likely to encounter. Indeed, the item bank does not purport to cover every conceivable computational nuance. In addition, among the more difficult problems involving computation with whole numbers, there are number combinations for which one would ordinarily use a calculator. However, it is expected that students will know how to perform these operations by hand, and hence, a number of such items are included in the STAR Maths item bank.
The Numerations Concepts and Computation Processes strands are considered by many to be the heart of the basic mathematics curriculum. Students must know the four operations with whole numbers, fractions,

Content and Test DesignContent Specification
15STAR Maths™Technical Manual
decimals and percentages. Students must know numeration concepts to have an understanding of how the operations work, particularly for regrouping, changing denominators in fractions and changing places with decimals and percentages. As noted above, these two strands constitute the first two-thirds of the STAR Maths test. Mathematical development within these two strands also serves as the principal basis for teaching and learning recommendations provided in the STAR Maths Diagnostic Report.
The remaining strands comprise the latter third of the STAR Maths test. This part might be labelled “applications” since many—although not all—of the objectives in this part can be considered practical applications of mathematical content and procedures. It is important to note that research conducted at the item calibration stage of STAR Maths development demonstrated that the items in the various strands were strongly unidimensional, thus justifying the use of a single score for purposes of reporting.
Approximations
The Approximations strand includes 23 objectives. The Approximations strand is also designed to parallel the Computational Processes strand in terms of the types of operations required. Again, many, but not all computational objectives are reflected in this strand. Obviously, in the Approximations strand, students are not required to compute a final answer. With number combinations similar to those represented in the Computation Processes strand, students are asked to approximate an answer. To discourage students from actually computing answers, response options are generally given in round numbers. The range of numerical value used in the options is generally set so that a reasonable approximate is adequate.
Shape and Space
The Shape and Space strand includes 84 objectives. The Shape and Space strand in STAR Maths begins with simple recognition of plane shapes and their properties. The majority of objectives in the Shape and Space strand concentrate on the treatment of perimeters and areas, usually covered in the middle years, and recognition and use of parallels, intersections and perpendiculars, covered in the middle and upper years. At the more difficult levels, this strand includes application of principles about triangles, the properties of quadrilaterals, the properties of solid figures and the Pythagorean theorem.
Measures
The Measures strand includes 47 objectives. Although many curricular sources combine shape and space and measures in a single strand, the STAR Maths test represents them separately. At the lowest level, the Measures strand includes objectives on temperature and time (clocks, days of the week and

Content and Test DesignContent Specification
16STAR Maths™Technical Manual
months of the year). The strand provides coverage of both metric and customary (imperial) units. Metric objectives include use of the metric prefixes (milli-, centi-, etc.) and the conversion of metric and imperial units. The Measures strand also includes objectives on measures of angles, perimeter and area, which are examples of the overlap between the shape and space and measures areas.
Data Analysis and Statistics
The Data Analysis and Statistics strand includes 40 objectives. This strand begins with simple, straightforward extraction of information from tables, bar graphs and pie charts. In these early objectives, information needed to answer the question is given directly in the table, chart or graph. At the next higher level of complexity, students must combine or compare two or more pieces of information in the table, chart or graph in order to answer the question. This strand also includes several objectives related to probability and statistics. Curricular placement of probability and statistic objectives varies from one source to another. In contrast, using tables, charts and graphs is commonly encountered across a wide range of years in nearly all mathematics curriculum materials.
Word Problems
The Word Problems strand includes 92 objectives. The Word Problems strand includes simple situational applications of computations. In fact, the Word Problems strand is deliberately structured to parallel the Computation Processes strand in terms of the types of operations required.
Most computation objectives are paralleled in the Word Problems strand. For all items in the Word Problems strands, students are presented with a practical problem, and to answer the item correctly, they must determine what type of computational process to use and then correctly apply that process. The reading level of the problems is kept at a low level to ensure valid assessment of ability to solve word problems.
Algebra
The Algebra strand includes 189 objectives. The final strand in the curricular structure of the STAR Maths item bank is Algebra. Although algebra is sometimes thought of as a higher-level course, elements of algebra are actually introduced much earlier in the contemporary mathematics curriculum. The use of simple number sentences and the translation of word problems into equations (at a very simple level) are introduced even in the lower years. Such objectives are included at the lowest level of the STAR Maths Algebra strand. The objectives progress rapidly in difficulty to those found in the formal algebra course. These more difficult objectives include operating with polynomial, quadratic equations and graphs of linear and non-linear functions.

Content and Test DesignContent Specification
17STAR Maths™Technical Manual
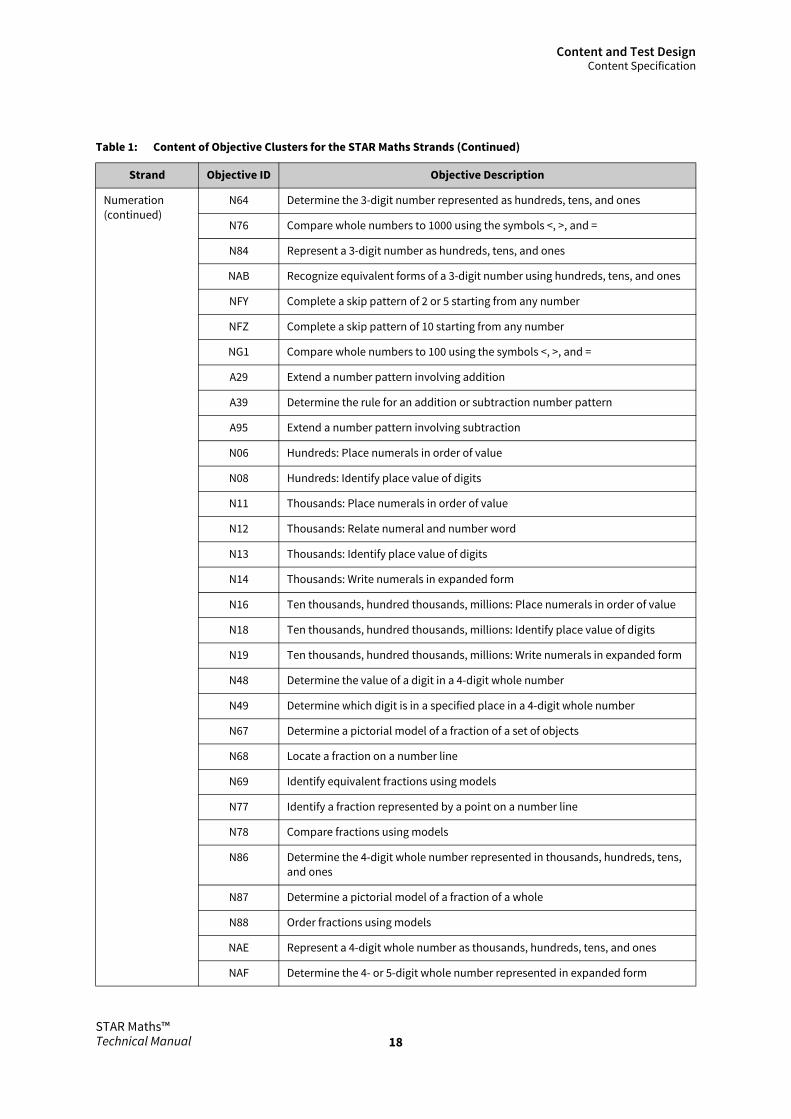
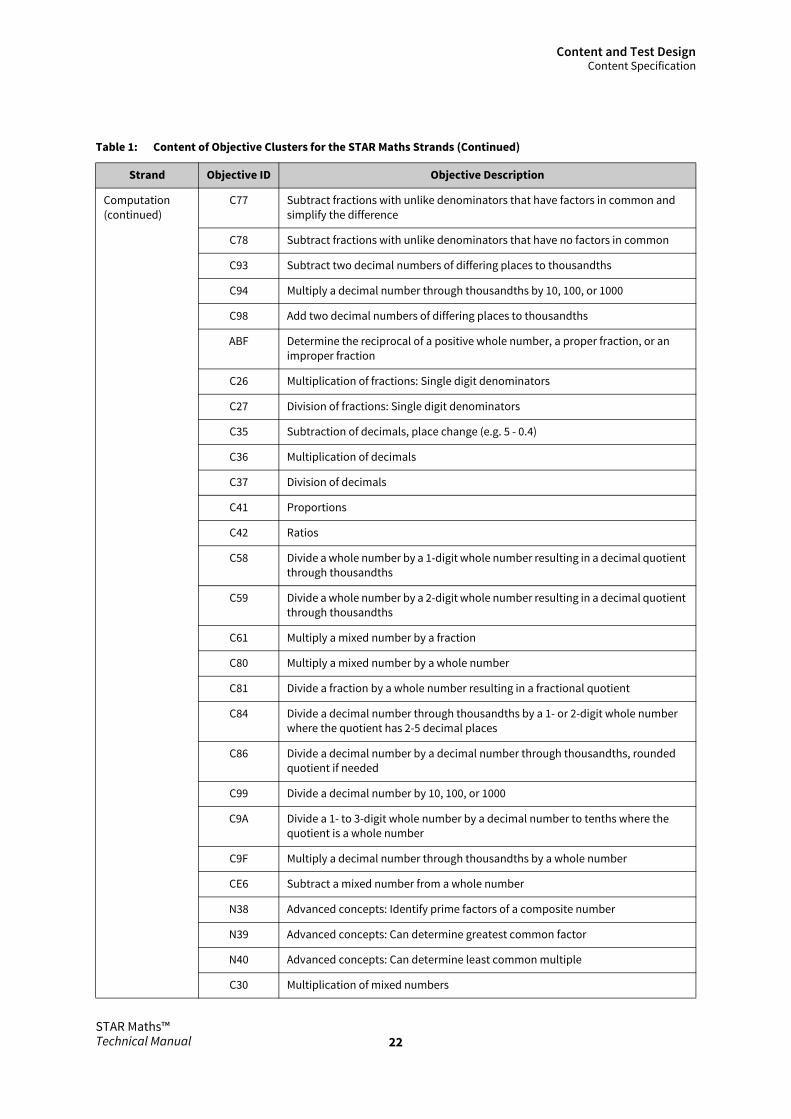
Table 1: Content of Objective Clusters for the STAR Maths Strands
Strand Objective ID Objective Description
Numeration NA1 Ones: Placing numerals in order
N00 Ones: Locate numbers on a number line
N01 Tens: Place numerals (10-99) in order of value
N02 Tens: Associate numeral with group of objects
N03 Tens: Relate numeral and number word
N04 Tens: Identify one more/one less across decades
N05 Tens: Understand the concept of zero
N42 Count on by ones from a number less than 100
N43 Count back by ones from a number less than 20
N56 Count objects to 20
N57 Identify a number to 20 represented by a point on a number line
N58 Determine one more than or one less than a given number
N59 Count by 2s to 50 starting from a multiple of 2
N61 Compare whole numbers to 100 using words
N62 Order whole numbers to 100 in ascending order
N74 Represent a 2-digit number as tens and ones
N82 Locate a number to 20 on a number line
N83 Determine the value of a digit in a 2-digit number
N95 Determine ten more than or ten less than a given number
N96 Count by 5s or 10s to 100 starting from a multiple of 5 or 10, respectively
N98 Determine the 2-digit number represented as tens and ones
N99 Determine equivalent forms of a number, up to 10
NA2 Ones: Using numerals to indicate quantity
NA3 Ones: Relate numerals and number words
NA4 Ones: Use ordinal numbers
NM5 Compare groups of objects using most or least
C88 Determine a number pair that totals 100
N07 Hundreds: Relate numeral and number word
N09 Hundreds: Write numerals in expanded form
N45 Complete a skip pattern starting from a multiple of 2, 5, or 10
N46 Count on by 100s from any number
Content and Test DesignContent Specification
18STAR Maths™Technical Manual
Numeration(continued)
N64 Determine the 3-digit number represented as hundreds, tens, and ones
N76 Compare whole numbers to 1000 using the symbols <, >, and =
N84 Represent a 3-digit number as hundreds, tens, and ones
NAB Recognize equivalent forms of a 3-digit number using hundreds, tens, and ones
NFY Complete a skip pattern of 2 or 5 starting from any number
NFZ Complete a skip pattern of 10 starting from any number
NG1 Compare whole numbers to 100 using the symbols <, >, and =
A29 Extend a number pattern involving addition
A39 Determine the rule for an addition or subtraction number pattern
A95 Extend a number pattern involving subtraction
N06 Hundreds: Place numerals in order of value
N08 Hundreds: Identify place value of digits
N11 Thousands: Place numerals in order of value
N12 Thousands: Relate numeral and number word
N13 Thousands: Identify place value of digits
N14 Thousands: Write numerals in expanded form
N16 Ten thousands, hundred thousands, millions: Place numerals in order of value
N18 Ten thousands, hundred thousands, millions: Identify place value of digits
N19 Ten thousands, hundred thousands, millions: Write numerals in expanded form
N48 Determine the value of a digit in a 4-digit whole number
N49 Determine which digit is in a specified place in a 4-digit whole number
N67 Determine a pictorial model of a fraction of a set of objects
N68 Locate a fraction on a number line
N69 Identify equivalent fractions using models
N77 Identify a fraction represented by a point on a number line
N78 Compare fractions using models
N86 Determine the 4-digit whole number represented in thousands, hundreds, tens, and ones
N87 Determine a pictorial model of a fraction of a whole
N88 Order fractions using models
NAE Represent a 4-digit whole number as thousands, hundreds, tens, and ones
NAF Determine the 4- or 5-digit whole number represented in expanded form
Table 1: Content of Objective Clusters for the STAR Maths Strands (Continued)
Strand Objective ID Objective Description

Content and Test DesignContent Specification
19STAR Maths™Technical Manual
Numeration(continued)
NM2 Determine the value of a digit in a 5-digit whole number
NM3 Determine which digit is in a specified place in a 5-digit whole number
N51 Locate a decimal number to tenths on a number line
N70 Round a 4-digit whole number to a specified place
N79 Compare decimal numbers through the hundredths place
N89 Order decimal numbers through the hundredths place
NB1 Determine the decimal number equivalent to a fraction model
NB2 Determine the fraction equivalent to a decimal number model
NBA Identify a decimal number to tenths represented by a point on a number line
NG3 Relate 1/4, 1/2, and 3/4 to an equivalent decimal number using models
NM4 Round a 5- to 6-digit whole number to a specified place
N17 Ten thousands, hundred thousands, millions: Relate numeral and number word
N21 Fractions and decimals: Convert fraction to equivalent fraction
N24 Fractions and decimals: Read word names for decimals to thousandths
N25 Fractions and decimals: Identify place value of digits in decimals
N27 Fractions and decimals: Identify position of fractions on number line
N28 Fractions and decimals: Convert improper fraction to mixed number
N29 Fractions and decimals: Round decimals to tenths, hundredths
N72 Convert a mixed number to an improper fraction
N80 Compare decimal numbers of differing places to thousandths
N91 Compare fractions with unlike denominators
NB3 Order fractions with unlike denominators in ascending or descending order
NB5 Order decimal numbers of differing places to thousandths in ascending or descending order
N22 Determine a decimal equivalent of a fraction with a denominator of 10 or 100
N23 Relate a decimal number to a equivalent fraction with a denominator of 10 or 100
N26 Fractions and decimals: Identify position of decimals on number line
N30 Fractions and decimals: Relate decimals to percentages
N54 Represent a decimal number in expanded form using powers of ten
N55 Determine the decimal number represented in expanded form using powers of ten
N81 Compare numbers in decimal and fractional forms
Table 1: Content of Objective Clusters for the STAR Maths Strands (Continued)
Strand Objective ID Objective Description

Content and Test DesignContent Specification
20STAR Maths™Technical Manual
Numeration(continued)
N92 Order numbers in decimal and fractional forms
NG4 Relate a decimal number to a equivalent fraction with a denominator of 1000
NM1 Determine a decimal equivalent of a fraction with a denominator of 1000
N31 Advanced concepts: Determine square roots of perfect squares
N37 Advanced concepts: Can use scientific notation
N32 Advanced concepts: Give approximate square roots of a number
NBB Determine the square root of a perfect-square fraction or decimal
NBC Determine the two closest integers to a given square root
NBD Approximate the location of a square root on a number line
AJ1 Compare expressions involving unlike forms of real numbers
AJB Compare monomial numerical expressions using the properties of powers
Computation A28 Determine a missing addend in a basic addition-fact number sentence
A38 Determine the missing portion in a partially screened (hidden) collection of up to 10 objects
A81 Determine a missing subtrahend in a basic subtraction-fact number sentence
C01 Addition of basic facts to 10
C02 Subtraction of basic facts to 10
C03 Addition of basic facts to 18
C05 Addition of three single digit addends
C06 Addition beyond basic facts, no regrouping (2d+1d)
C07 Subtraction beyond basic facts, no regrouping (2d-1d)
C44 Know basic subtraction facts to 20 minus 10
C04 Subtraction of basic facts to 18
C08 Addition beyond basic facts with regrouping (2d+1d, 2d+2d)
N97 Identify odd and even numbers less than 100
A01 Simple number sentence
C09 Subtraction beyond basic facts with regrouping (2d-1d, 2d-2d)
C10 Addition beyond basic facts with double regrouping (3d+2d, 3d+3d)
C12 Multiplication basic facts
C13 Division basic facts
C14 Multiplication beyond basic facts, no regrouping (2dx1d)
C72 Use a multiplication sentence to represent an area or an array model
Table 1: Content of Objective Clusters for the STAR Maths Strands (Continued)
Strand Objective ID Objective Description

Content and Test DesignContent Specification
21STAR Maths™Technical Manual
Computation(continued)
C73 Know basic division facts to 100 ÷ 10
A31 Identify a missing term in a multiplication or a division number pattern
A44 Generate a table of paired numbers based on a rule
AA4 Determine a rule that relates two variables
C11 Subtraction beyond basic facts with double regrouping (3d-2d, 3d-3d)
C15 Division beyond basic facts, no remainders (2d/1d)
C16 Multiplication with regrouping (2dx1d, 2dx2d)
C17 Division with remainders (2d/1d, 3d/1d)
C18 Addition of whole numbers: any difficulty
C19 Subtract two 2- to 4-digit whole numbers
C22 Add fractions with the same denominator within one whole
C23 Subtraction of fractions: Like single digit denominators
C51 Determine money amounts that total £10
C52 Multiply a 1- or 2-digit whole number by a multiple of 10, 100, or 1,000
C74 Multiply a 2-digit whole number by a 2-digit whole number
C90 Use a division sentence to represent objects divided into equal groups
CHV Subtract whole numbers with more than 4 digits
CHW Add fractions with the same denominator beyond one whole
CHX Multiply a 4-digit whole number by a 1-digit whole number
A32 Determine the variable expression with one operation for a table of paired numbers
C21 Division of whole numbers: any difficulty
C24 Addition of fractions: Unlike single digit denominators
C25 Subtraction of fractions: Unlike single digit denominators
C28 Addition of mixed numbers
C29 Subtraction of mixed numbers
C33 Addition of decimals, place change (e.g. 2 + 0.45)
C55 Divide a multi-digit whole number by a 2-digit whole number, with a remainder and at least one zero in the quotient
C56 Divide a multi-digit whole number by a 2-digit whole number and express the quotient as a mixed number
C57 Add fractions with unlike denominators that have factors in common and simplify the sum
Table 1: Content of Objective Clusters for the STAR Maths Strands (Continued)
Strand Objective ID Objective Description
Content and Test DesignContent Specification
22STAR Maths™Technical Manual
Computation(continued)
C77 Subtract fractions with unlike denominators that have factors in common and simplify the difference
C78 Subtract fractions with unlike denominators that have no factors in common
C93 Subtract two decimal numbers of differing places to thousandths
C94 Multiply a decimal number through thousandths by 10, 100, or 1000
C98 Add two decimal numbers of differing places to thousandths
ABF Determine the reciprocal of a positive whole number, a proper fraction, or an improper fraction
C26 Multiplication of fractions: Single digit denominators
C27 Division of fractions: Single digit denominators
C35 Subtraction of decimals, place change (e.g. 5 - 0.4)
C36 Multiplication of decimals
C37 Division of decimals
C41 Proportions
C42 Ratios
C58 Divide a whole number by a 1-digit whole number resulting in a decimal quotient through thousandths
C59 Divide a whole number by a 2-digit whole number resulting in a decimal quotient through thousandths
C61 Multiply a mixed number by a fraction
C80 Multiply a mixed number by a whole number
C81 Divide a fraction by a whole number resulting in a fractional quotient
C84 Divide a decimal number through thousandths by a 1- or 2-digit whole number where the quotient has 2-5 decimal places
C86 Divide a decimal number by a decimal number through thousandths, rounded quotient if needed
C99 Divide a decimal number by 10, 100, or 1000
C9A Divide a 1- to 3-digit whole number by a decimal number to tenths where the quotient is a whole number
C9F Multiply a decimal number through thousandths by a whole number
CE6 Subtract a mixed number from a whole number
N38 Advanced concepts: Identify prime factors of a composite number
N39 Advanced concepts: Can determine greatest common factor
N40 Advanced concepts: Can determine least common multiple
C30 Multiplication of mixed numbers
Table 1: Content of Objective Clusters for the STAR Maths Strands (Continued)
Strand Objective ID Objective Description

Content and Test DesignContent Specification
23STAR Maths™Technical Manual
Computation(continued)
C31 Division of mixed numbers
C38 Convert fraction to percentage
C39 Calculate percentage of quantity
C40 Reverse percentages
C62 Add integers
C63 Subtract integers
C65 Multiply integers
C66 Divide integers
N34 Advanced concepts: Recognise meaning of index notation (2-10)
N41 Advanced concepts: Use of negative numbers
N93 Evaluate a numerical expression of four or more operations, with parentheses, using order of operations
C97 Determine a percent of a number given a percent that is not a whole percent
C9C Determine the percent one number is of another number
C9D Determine a number given a part and a decimal percentage or a percentage more than 100%
CE8 Add or subtract signed fractions or mixed numbers
CEA Evaluate a numerical expression involving nested parentheses
N94 Evaluate a numerical expression involving integer exponents and/or integer bases
NB6 Evaluate an integer raised to a whole number power
AA1 Simplify a monomial numerical expression involving the square root of a whole number
AFM Apply the product of powers property to a monomial numerical expression
AFN Apply the power of a power property to a monomial numerical expression
AFP Apply the quotient of powers property to monomial numerical expressions
AG8 Multiply monomial numerical expressions involving radicals
AG9 Divide monomial numerical expressions involving radicals
AJE Add and/or subtract numerical radical expressions
AJF Multiply a binomial numerical radical expression by a numerical radical expression
AJG Rationalize the denominator of a numerical radical expression
N35 Advanced concepts: Recognise meaning of index notation (negative indices)
N33 Advanced concepts: Recognise meaning of nth root
Table 1: Content of Objective Clusters for the STAR Maths Strands (Continued)
Strand Objective ID Objective Description

Content and Test DesignContent Specification
24STAR Maths™Technical Manual
Computation(continued)
AGZ Simplify nth roots
AH2 Operations on complex numbers
AH9 Exponential equations to logarithmic form
AHB Find logarithms by converting to exponential form
AJV Simplify expressions with fractional exponents
AJW Add and subtract radical expressions
AJY Write imaginary numbers: bi
AJZ Raise i to powers
N36 Advanced concepts: Recognise meaning of index notation (fractional indices)
Approximations E18 Approximations: Addition of whole numbers, any difficulty
E19 Approximations: Subtraction of whole numbers, any difficulty
E06 Approximations: Addition beyond basic facts, no regrouping (2d+1d)
E07 Approximations: Subtraction beyond basic facts, no regrouping (2d-1d)
E41 Approximate a sum or difference of 2- to 3-digit whole numbers using any method
E5B Approximate a sum or difference of 3- to 4-digit whole numbers using any method
E14 Approximations: Multiplication beyond basic facts, no regrouping (2dx1d)
E15 Approximations: Division beyond basic facts, no remainders (2d/1d)
E20 Approximations: Multiplication of whole numbers, any difficulty
E21 Approximations: Division of whole numbers, any difficulty
E28 Approximations: Addition of mixed numbers
E32 Approximations: Addition of decimals, no place change (e.g. 2.34+10.32)
E33 Approximations: Addition of decimals, place change (e.g. 2 + 0.45)
E45 Estimate the sum of two decimal numbers through thousandths and less than 1 by rounding to a specified place
E24 Approximations: Addition of fractions, unlike single digit denominators
E25 Approximations: Subtraction of fractions, unlike single digit denominators
E29 Approximations: Subtraction of mixed numbers
E34 Approximations: Subtraction of decimals, no place change (e.g. 0.53 - 0.42)
E35 Approximations: Subtraction of decimals, place change (e.g. 5 - 0.4)
E44 Estimate the difference of two decimal numbers through thousandths and less than 1 by rounding to a specified place
Table 1: Content of Objective Clusters for the STAR Maths Strands (Continued)
Strand Objective ID Objective Description

Content and Test DesignContent Specification
25STAR Maths™Technical Manual
Approximations (continued)
E38 Approximations: Convert fraction to percentage
E39 Approximations: Calculate percentage of quantity
E40 Approximations: Reverse percentages
Word Problems W03 Solve one-step problems that involve addition of two numbers, using pictorial representations
W04 WP: Subtraction of basic facts
W06 WP: Addition beyond basic facts, no regrouping (2d+1d)
WXP WP: Subtract a 1-digit number from a 2-digit number without regrouping
WXQ WP: Add two 2-digit numbers without regrouping
WXR WP: Subtract a 2-digit number from a 2-digit number without regrouping
WXS WP: Determine a missing addend in a basic addition-fact number sentence
WXT WP: Determine a missing subtrahend in a basic subtraction-fact number sentence
WXU WP: Determine a basic addition-fact number sentence for a given situation
WXV WP: Determine a basic subtraction-fact number sentence for a given situation
WY4 WP: Use basic addition facts to solve problems
W08 WP: Addition beyond basic facts with regrouping (2d+1d, 2d+2d)
W53 WP: Divide objects into equal groups by sharing
WXW WP: Add two 3-digit numbers without regrouping
WXY WP: Subtract a 3-digit number from a 3-digit number without regrouping
A30 WP: Determine the operation needed for a given situation
W09 WP: Subtraction beyond basic facts with regrouping (2d-1d, 2d-2d)
W12 WP: Multiplication of basic facts
W14 WP: Multiplication beyond basic facts, no regrouping (2dx1d)
W18 WP: Addition of whole numbers, any difficulty
W54 WP: Determine the amount of change from whole pound amounts
W65 WP: Multiply using basic facts to 10 x 10
W66 WP: Divide using basic facts to 100 ÷ 10
W67 WP: Determine a multiplication or division sentence for a given situation
W7B WP: Approximate a sum or difference of two 3- digit whole numbers using any method
WY3 WP: Approximate a sum or difference of two 4-digit whole numbers using any method
Table 1: Content of Objective Clusters for the STAR Maths Strands (Continued)
Strand Objective ID Objective Description

Content and Test DesignContent Specification
26STAR Maths™Technical Manual
Word Problems(continued)
W13 WP: Division of basic facts
W15 WP: Division beyond basic facts, no remainders (2d/1d)
W16 WP: Multiplication with regrouping (2dx1d, 2dx2d)
W19 WP: Subtraction of whole numbers, any difficulty
W22 WP: Addition of fractions, like single digit denominators
W23 WP: Subtraction of fractions, like single digit denominators
W2S WP: Solve a 2-step whole number problem using addition and subtraction
W46 WP: Multiply a 3-digit whole number by a 1-digit whole number
W7C WP: Divide a 3-digit whole number by a 1-digit whole number with a remainder in the quotient
W90 WP: Divide a 3-digit whole number by a 1-digit whole number with no remainder in the quotient
WCE WP: Subtract fractions with like denominators no greater than 10 and simplify the difference
WY1 WP: Solve a 2-step whole number problem using more than one operation
WY2 WP: Multiply a 4-digit whole number by a 1-digit whole number
W17 WP: Division with remainders (2d/1d, 3d/1d)
W20 WP: Multiplication of whole numbers, any difficulty
W21 WP: Division of whole numbers, any difficulty
W24 WP: Addition of fractions, unlike single digit denominators
W25 WP: Subtraction of fractions, unlike single digit denominators
W33 WP: Addition of decimals, place change (e.g. 2+.45)
W49 WP: Solve a 2-step problem involving whole numbers
W58 WP: Estimate a quotient using any method
W8F WP: Estimate a product of two whole numbers using any method
W94 WP: Add or subtract decimal numbers through thousandths
W95 WP: Add or subtract a decimal number through thousandths and a whole number
W96 WP: Estimate the sum or difference of two decimal numbers through thousandths using any method
WA2 WP: Use a unit rate, with a whole number or whole cent value, to solve a problem
WX2 WP: Subtract fractions with like denominators and simplify the difference
WX3 WP: Add mixed numbers with like denominators and simplify the sum
WX4 WP: Subtract mixed numbers with like denominators and simplify the difference
WXZ WP: Add fractions with like denominators and simplify the sum
Table 1: Content of Objective Clusters for the STAR Maths Strands (Continued)
Strand Objective ID Objective Description
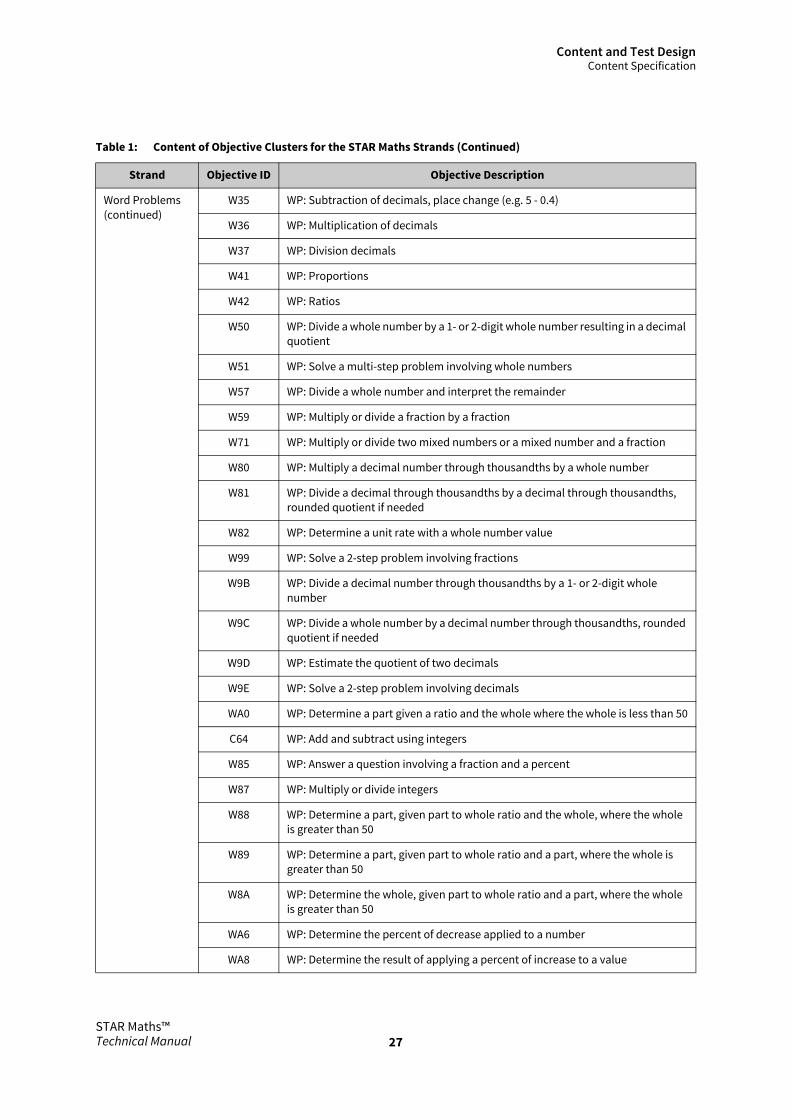
Content and Test DesignContent Specification
27STAR Maths™Technical Manual
Word Problems(continued)
W35 WP: Subtraction of decimals, place change (e.g. 5 - 0.4)
W36 WP: Multiplication of decimals
W37 WP: Division decimals
W41 WP: Proportions
W42 WP: Ratios
W50 WP: Divide a whole number by a 1- or 2-digit whole number resulting in a decimal quotient
W51 WP: Solve a multi-step problem involving whole numbers
W57 WP: Divide a whole number and interpret the remainder
W59 WP: Multiply or divide a fraction by a fraction
W71 WP: Multiply or divide two mixed numbers or a mixed number and a fraction
W80 WP: Multiply a decimal number through thousandths by a whole number
W81 WP: Divide a decimal through thousandths by a decimal through thousandths, rounded quotient if needed
W82 WP: Determine a unit rate with a whole number value
W99 WP: Solve a 2-step problem involving fractions
W9B WP: Divide a decimal number through thousandths by a 1- or 2-digit whole number
W9C WP: Divide a whole number by a decimal number through thousandths, rounded quotient if needed
W9D WP: Estimate the quotient of two decimals
W9E WP: Solve a 2-step problem involving decimals
WA0 WP: Determine a part given a ratio and the whole where the whole is less than 50
C64 WP: Add and subtract using integers
W85 WP: Answer a question involving a fraction and a percent
W87 WP: Multiply or divide integers
W88 WP: Determine a part, given part to whole ratio and the whole, where the whole is greater than 50
W89 WP: Determine a part, given part to whole ratio and a part, where the whole is greater than 50
W8A WP: Determine the whole, given part to whole ratio and a part, where the whole is greater than 50
WA6 WP: Determine the percent of decrease applied to a number
WA8 WP: Determine the result of applying a percent of increase to a value
Table 1: Content of Objective Clusters for the STAR Maths Strands (Continued)
Strand Objective ID Objective Description

Content and Test DesignContent Specification
28STAR Maths™Technical Manual
Word Problems(continued)
WAB WP: Determine a part, given part to part ratio and a part, where the whole is greater than 50
WAC WP: Determine a unit rate
WAD WP: Use a unit rate to solve a problem
W38 WP: Convert fraction to percentage
W39 WP: Calculate percentage of quantity
W40 WP: Reverse percentages
W8B WP: Determine a given percent of a number
W8D WP: Determine a number given a part and a decimal percentage or a percentage more than 100%
WB1 WP: Estimate a given percent of a number
Measures MA1 Use simple vocabulary of measurement
M00 Order months of the year
M09 Measure length in centimetres
MA5 Tell time to the hour and half hour
MA7 Order days of the week
MA9 Measure length in inches
C89 Determine the pence amount that totals a pound
M15 Tell time to the quarter hour
M16 Tell time to 5-minute intervals
MA4 Understand the value of groups of UK coins to £1
N75 Translate between a pound sign and a pence sign
NAC Convert money amounts in words to amounts in symbols
G05 Perimeter: triangle
M10 Tell time to the minute
MA6 Read a thermometer
MAA Read a thermometer in degrees Celsius
G03 Perimeter: square
G04 Perimeter: rectangle
GAB Determine the perimeter of a rectangle given a picture showing length and width
G06 Area: Square
G07 Area: Rectangle
Table 1: Content of Objective Clusters for the STAR Maths Strands (Continued)
Strand Objective ID Objective Description

Content and Test DesignContent Specification
29STAR Maths™Technical Manual
Measures (continued)
GAF Determine the missing side length of a rectangle given a side length and the area
M01 Understand imperial units of length
M05 Convert within metric units of mass, length, and capacity using numbers up to two decimal places
M08 Estimate length with metric units
M17 Calculate elapsed time exceeding an hour with regrouping
MDC Convert within metric units of mass, length, and capacity using numbers with three decimal places
W56 WP: Determine the area of a rectangle
W68 WP: Calculate elapsed time exceeding an hour with regrouping hours
W98 WP: Determine the area of a square or rectangle
G08 Area: Right triangle
G25 Determine the area of a complex shape
M07 Estimate angles
W70 WP: Determine a missing dimension given the area and another dimension
WA4 WP: Determine the perimeter of a complex shape
G09 Area: Circle
M06 Know equivalents of metric and imperial units
W69 WP: Determine the area of a triangle
M18 WP: Determine a measure of length, weight or mass, or capacity or volume using proportional relationships
GGT Determine a length given the area of a parallelogram
GGU Determine the area of a sector of a circle
GGV Determine the length of the radius or the diameter of a circle given the area of a sector
GGX Determine the measure of an arc or an angle given the area of a sector of a circle
GJ3 Determine the area or circumference of a circle given an equation of the circle
GKP Determine an expression or equation that can represent the area or perimeter of a figure
GN3 Determine a length given the area of a kite or rhombus
GN4 Determine a length given the area of a trapezium
Table 1: Content of Objective Clusters for the STAR Maths Strands (Continued)
Strand Objective ID Objective Description

Content and Test DesignContent Specification
30STAR Maths™Technical Manual
Shape and Space GA4 Compare common objects to basic shapes
GA6 Recognise features of basic shapes
G00 Recognise simple fractions: halves, thirds, and quarters
GA2 Identify common plane shapes
GA3 Identify common plane shapes when rotated
G37 Determine the common attributes in a set of geometric shapes
GA1 Use basic terms to describe position
GA5 Understand basic reflective symmetry
GA7 Identify common solid shapes
G01 Continue number patterns
G14 Identify parallel lines
G16 Identify perpendicular lines
G21 Classify angles (obtuse, etc.)
G30 Classify an angle given its measure
GA8 Determine lines of symmetry
AAC Use a table to represent the values from a first-quadrant graph
G02 Circle terms
G10 Volume: Rectangular prism
GFV Determine the ordered pair of a point in any quadrant
G22 Calculate angles in a triangle
G27 Determine a missing dimension given two similar shapes
G18 Use properties of intersecting lines
G19 Use properties of perpendicular lines
G20 Vertical and supplementary angles
G34 Determine the volume of a rectangular or a triangular prism
GN5 Determine the measure of an angle in a figure involving parallel lines
WB5 WP: Use the Pythagorean theorem to find a length or a distance
G17 Use properties of parallel lines
G23 Use Pythagoras’ theorem
GE4 Determine the midpoint of a line segment given the coordinates of the endpoints
GE6 Determine the measure of an angle formed by parallel lines and one or more transversals given an angle measure
Table 1: Content of Objective Clusters for the STAR Maths Strands (Continued)
Strand Objective ID Objective Description
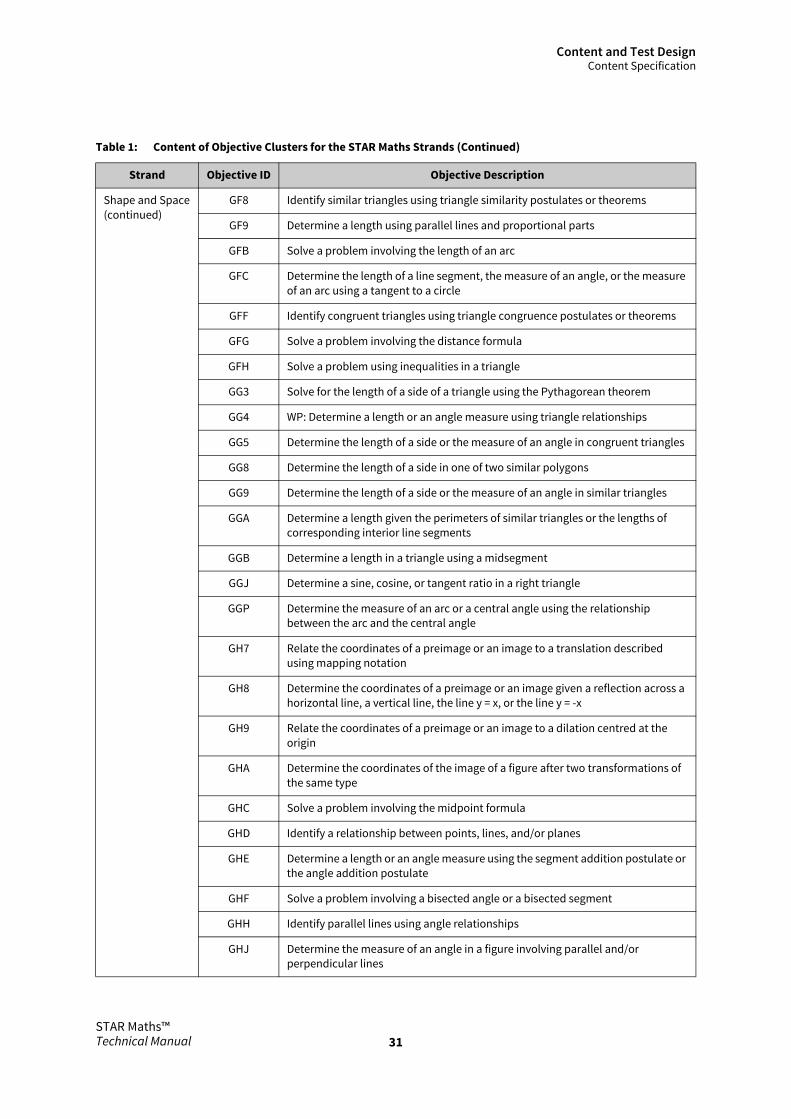
Content and Test DesignContent Specification
31STAR Maths™Technical Manual
Shape and Space(continued)
GF8 Identify similar triangles using triangle similarity postulates or theorems
GF9 Determine a length using parallel lines and proportional parts
GFB Solve a problem involving the length of an arc
GFC Determine the length of a line segment, the measure of an angle, or the measure of an arc using a tangent to a circle
GFF Identify congruent triangles using triangle congruence postulates or theorems
GFG Solve a problem involving the distance formula
GFH Solve a problem using inequalities in a triangle
GG3 Solve for the length of a side of a triangle using the Pythagorean theorem
GG4 WP: Determine a length or an angle measure using triangle relationships
GG5 Determine the length of a side or the measure of an angle in congruent triangles
GG8 Determine the length of a side in one of two similar polygons
GG9 Determine the length of a side or the measure of an angle in similar triangles
GGA Determine a length given the perimeters of similar triangles or the lengths of corresponding interior line segments
GGB Determine a length in a triangle using a midsegment
GGJ Determine a sine, cosine, or tangent ratio in a right triangle
GGP Determine the measure of an arc or a central angle using the relationship between the arc and the central angle
GH7 Relate the coordinates of a preimage or an image to a translation described using mapping notation
GH8 Determine the coordinates of a preimage or an image given a reflection across a horizontal line, a vertical line, the line y = x, or the line y = -x
GH9 Relate the coordinates of a preimage or an image to a dilation centred at the origin
GHA Determine the coordinates of the image of a figure after two transformations of the same type
GHC Solve a problem involving the midpoint formula
GHD Identify a relationship between points, lines, and/or planes
GHE Determine a length or an angle measure using the segment addition postulate or the angle addition postulate
GHF Solve a problem involving a bisected angle or a bisected segment
GHH Identify parallel lines using angle relationships
GHJ Determine the measure of an angle in a figure involving parallel and/or perpendicular lines
Table 1: Content of Objective Clusters for the STAR Maths Strands (Continued)
Strand Objective ID Objective Description
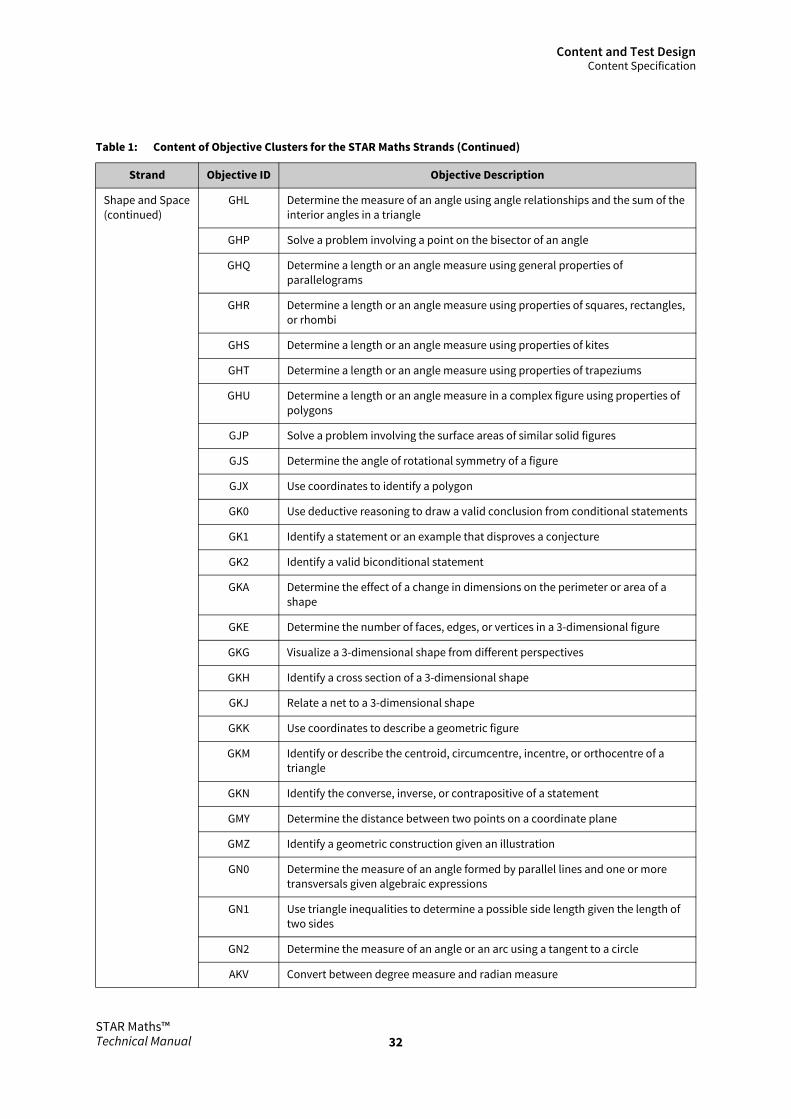
Content and Test DesignContent Specification
32STAR Maths™Technical Manual
Shape and Space(continued)
GHL Determine the measure of an angle using angle relationships and the sum of the interior angles in a triangle
GHP Solve a problem involving a point on the bisector of an angle
GHQ Determine a length or an angle measure using general properties of parallelograms
GHR Determine a length or an angle measure using properties of squares, rectangles, or rhombi
GHS Determine a length or an angle measure using properties of kites
GHT Determine a length or an angle measure using properties of trapeziums
GHU Determine a length or an angle measure in a complex figure using properties of polygons
GJP Solve a problem involving the surface areas of similar solid figures
GJS Determine the angle of rotational symmetry of a figure
GJX Use coordinates to identify a polygon
GK0 Use deductive reasoning to draw a valid conclusion from conditional statements
GK1 Identify a statement or an example that disproves a conjecture
GK2 Identify a valid biconditional statement
GKA Determine the effect of a change in dimensions on the perimeter or area of a shape
GKE Determine the number of faces, edges, or vertices in a 3-dimensional figure
GKG Visualize a 3-dimensional shape from different perspectives
GKH Identify a cross section of a 3-dimensional shape
GKJ Relate a net to a 3-dimensional shape
GKK Use coordinates to describe a geometric figure
GKM Identify or describe the centroid, circumcentre, incentre, or orthocentre of a triangle
GKN Identify the converse, inverse, or contrapositive of a statement
GMY Determine the distance between two points on a coordinate plane
GMZ Identify a geometric construction given an illustration
GN0 Determine the measure of an angle formed by parallel lines and one or more transversals given algebraic expressions
GN1 Use triangle inequalities to determine a possible side length given the length of two sides
GN2 Determine the measure of an angle or an arc using a tangent to a circle
AKV Convert between degree measure and radian measure
Table 1: Content of Objective Clusters for the STAR Maths Strands (Continued)
Strand Objective ID Objective Description

Content and Test DesignContent Specification
33STAR Maths™Technical Manual
Algebra A00 Count in twos, fives, and tens
A03 Linear equations: 1 unknown
A05 Reciprocals of rational numbers
A33 Evaluate a 2-variable expression, with two or three operations, using whole number substitution
A42 Use a 2-variable equation to construct an input-output table
A45 Solve a 1-step equation involving whole numbers
A46 Use a 2-variable equation to represent a relationship expressed in a table
W72 WP: Evaluate a 1- or 2-variable expression or formula using whole numbers
W7E WP: Generate a table of paired numbers based on a variable expression with one operation
W83 WP: Use a 2-variable linear equation to represent a situation
WA3 WP: Use a 2-variable equation to represent a situation involving a direct proportion
A02 Translate word problem to equation
A22 Sequences and series: Find specified term of arithmetic sequences
A36 Evaluate a 2-variable expression, with two or three operations, using integer substitution
A37 Solve a proportion involving decimals
A43 Solve a 2-step linear equation involving integers
A47 Solve a 1-step linear equation involving integers
WAF WP: Use a 1-variable 1-step equation to represent a situation
A07 Linear Inequalities: 1 unknown
A13 Polynomials: Multiplication
A18 Factorise algebraic expressions
A21 Sequences and series: Common differences in arithmetic sequences
A48 Determine the graph of a 1-operation linear function
A61 Simplify an algebraic expression by combining like terms
A97 Multiply two monomial algebraic expressions
A98 Solve a 1-step equation involving rational numbers
A99 Solve a 2-step equation involving rational numbers
AA5 Determine the table of values that represents a linear equation with rational coefficients in two variables
AA6 Determine a linear equation in two variables that represents a table of values
Table 1: Content of Objective Clusters for the STAR Maths Strands (Continued)
Strand Objective ID Objective Description

Content and Test DesignContent Specification
34STAR Maths™Technical Manual
Algebra (continued)
AA7 Determine the graph of a 2-operation linear function
AA8 Determine the gradient of a line given its graph or a graph of a line with a given gradient
AA9 Determine the x- or y-intercept of a line given its graph
AAA Solve a 2-step linear inequality in one variable
W75 WP: Solve a problem involving a 1-variable, 2-step equation
W76 WP: Interpret the meaning of the gradient of a graphed line
W8E WP: Use a 1-variable equation with rational coefficients to represent a situation involving two operations
WB2 WP: Use a 2-variable equation with rational coefficients to represent a situation
WB4 WP: Solve a problem involving a 2-step linear inequality in one variable
A04 Linear equations: 2 unknowns
A06 Graph of linear equation (integers add, subtract)
A09 Represent linear inequalities
A12 Polynomials: Addition and subtraction
A14 Solve pair of linear equations
A19 Determine gradient
A20 Determine intercept
A50 Evaluate a function written in function notation for a given value
A51 Solve a 1-variable linear equation with the variable on both sides
A52 Determine the graph of a linear equation
A53 Determine an equation of a line in standard form given the gradient and y-intercept
A54 Solve a radical equation that leads to a quadratic equation
A55 Simplify a rational expression involving polynomial terms
A56 Multiply rational expressions
A57 Divide a polynomial expression by a monomial
A60 Solve a rational equation involving terms with polynomial denominators
A83 Determine an equation for a line given the gradient of the line and a point on the line that is not the y-intercept
A84 Determine an equation of a line given two points on the line
A87 Apply the product of powers property to a monomial algebraic expression
A88 Apply the power of a power property to a monomial algebraic expression
A89 Apply the power of a product property to a monomial algebraic expression
Table 1: Content of Objective Clusters for the STAR Maths Strands (Continued)
Strand Objective ID Objective Description

Content and Test DesignContent Specification
35STAR Maths™Technical Manual
Algebra (continued)
A8A Apply the quotient of powers property to monomial algebraic expressions
A8B Apply the power of a quotient property to monomial algebraic expressions
A8E Multiply two binomials of the form (ax +/- b)(cx +/- d)
A8F Factorise the HCF from a polynomial expression
A90 Factorise trinomials that result in factors of the form (ax +/- b)(cx +/- d)
A91 Determine the graph of a given quadratic function
A9A WP: Determine a reasonable domain or range for a function in a given situation
A9B Solve a 1-variable linear inequality with the variable on both sides
A9E Determine the gradient of a line given an equation
AA0 Determine the graph of a line using given information
AA2 Simplify a monomial algebraic radical expression
AA3 Solve a radical equation that leads to a linear equation
AAE Apply terminology related to polynomials
AAF Multiply two binomials of the form (x +/- a)(x +/- b)
ACA Select the algebraic notation which generalizes the pattern represented by data in a given table
ACB Translate a verbal sentence into an algebraic equation.
ADC Solve a 1-variable linear inequality with the variable on one side
AF1 Solve a number problem that can be represented by a linear system of equations
AF7 Determine if a function is linear or nonlinear
AF9 Solve a 1-variable linear equation that requires simplification and has the variable on one side
AFA WP: Solve a direct- or inverse-variation problem
AFB Solve a 1-variable compound inequality
AFD Determine an equation for a line that goes through a given point and is parallel or perpendicular to a given line
AFG Solve a system of linear equations in two variables by substitution
AFH Solve a system of linear equations in two variables by elimination
AFJ Determine the number of solutions to a system of linear equations
AFL Determine the graph of the solution set of a system of linear inequalities in two variables
AFQ Simplify a polynomial expression by combining like terms
AFR Multiply a polynomial by a monomial
Table 1: Content of Objective Clusters for the STAR Maths Strands (Continued)
Strand Objective ID Objective Description

Content and Test DesignContent Specification
36STAR Maths™Technical Manual
Algebra (continued)
AFS Multiply two binomials of the form (ax +/- by)(cx +/- dy)
AFV Multiply a trinomial by a binomial
AFW Factorise trinomials that result in factors of the form (x +/- a)(x +/- b)
AFX Factorise trinomials that result in factors of the form (ax +/- by)(cx +/- dy)
AFY Factorise the difference of two squares
AFZ Factorise a perfect-square trinomial
AG1 Solve a quadratic equation by taking the square root
AG2 Determine the solution(s) of an equation given in factorised form
AGA Multiply monomial algebraic radical expressions
AGB Divide monomial algebraic radical expressions
AGG Divide a polynomial expression by a binomial
AGJ Add or subtract two rational expressions with like denominators
AGK Add or subtract two rational expressions with unlike monomial denominators
AGL Solve a proportion that generates a linear or quadratic equation
AJ2 Determine the independent or dependent variable in a given situation
AJ4 Determine if a table or an equation represents a direct variation, an inverse variation, or neither
AJ6 Solve a 2-variable linear inequality for the dependent variable
AJ7 Determine if an ordered pair is a solution to a 2-variable linear inequality
AJ8 Determine a 2-variable linear inequality represented by a graph
AJC Apply properties of exponents to monomial algebraic expressions
AJD Factorise a polynomial that has a HCF and two linear binomial factors
AJH Rationalize the denominator of an algebraic radical expression
AJJ Add or subtract algebraic radical expressions
AM3 WP: Represent a proportional relationship as a linear equation
AM5 Determine the effect of a change in the gradient and/or y-intercept on the graph of a line
AM8 Determine the result of a change in a or c on the graph of y=ax^2 + c
AMJ Determine the gradient of a line given a table of values
APE Determine the x- or y-intercept of a line given a 2-variable equation
APF Determine the gradient of a line given the graph of the line
APG Determine an equation of a line given the gradient and y-intercept
Table 1: Content of Objective Clusters for the STAR Maths Strands (Continued)
Strand Objective ID Objective Description
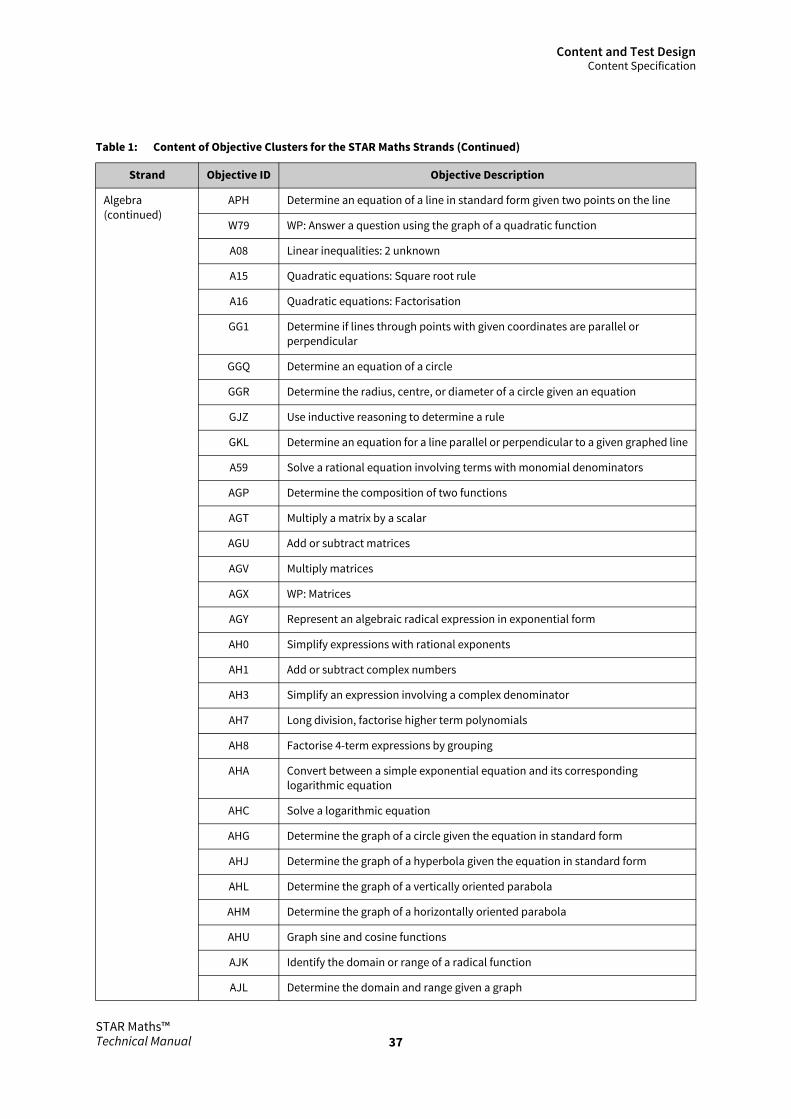
Content and Test DesignContent Specification
37STAR Maths™Technical Manual
Algebra (continued)
APH Determine an equation of a line in standard form given two points on the line
W79 WP: Answer a question using the graph of a quadratic function
A08 Linear inequalities: 2 unknown
A15 Quadratic equations: Square root rule
A16 Quadratic equations: Factorisation
GG1 Determine if lines through points with given coordinates are parallel or perpendicular
GGQ Determine an equation of a circle
GGR Determine the radius, centre, or diameter of a circle given an equation
GJZ Use inductive reasoning to determine a rule
GKL Determine an equation for a line parallel or perpendicular to a given graphed line
A59 Solve a rational equation involving terms with monomial denominators
AGP Determine the composition of two functions
AGT Multiply a matrix by a scalar
AGU Add or subtract matrices
AGV Multiply matrices
AGX WP: Matrices
AGY Represent an algebraic radical expression in exponential form
AH0 Simplify expressions with rational exponents
AH1 Add or subtract complex numbers
AH3 Simplify an expression involving a complex denominator
AH7 Long division, factorise higher term polynomials
AH8 Factorise 4-term expressions by grouping
AHA Convert between a simple exponential equation and its corresponding logarithmic equation
AHC Solve a logarithmic equation
AHG Determine the graph of a circle given the equation in standard form
AHJ Determine the graph of a hyperbola given the equation in standard form
AHL Determine the graph of a vertically oriented parabola
AHM Determine the graph of a horizontally oriented parabola
AHU Graph sine and cosine functions
AJK Identify the domain or range of a radical function
AJL Determine the domain and range given a graph
Table 1: Content of Objective Clusters for the STAR Maths Strands (Continued)
Strand Objective ID Objective Description

Content and Test DesignContent Specification
38STAR Maths™Technical Manual
Algebra (continued)
AJM Determine if functions are one-to-one
AJN Graph inverses of linear functions
AJP Verify ordered triples are solutions to systems
AJQ Solve systems, three equations
AK1 Write quadratic equations given solutions
AK2 Solve cubic equations
AK4 Relate a quadratic inequality in two variables to its graph
AK6 Factorise the difference of squares
AK8 Factorise polynomials into binomials and trinomials
AKC Rational expressions, domains
AKD Circles, write equations given centres and radii
AKE Graph ellipses
AKL Find terms of arithmetic sequence (1st term and common diff)
AKM Find specified term of arithmetic sequence
AKN Find terms of arithmetic sequence (formula for nth term)
AKP WP: Solve a problem that can be represented by an arithmetic sequence
AKR Find ratios of geometric sequences
AKS Find specified term of geometric sequence given first 3 terms
ANH Determine the explicit formula for an arithmetic sequence
ANJ Identify a given sequence as arithmetic, geometric, or neither
ANN Determine the graph of a piecewise-defined function
ANP Determine the component form of a vector represented on a graph
ANQ Relate a graph to a polynomial function given in factorised form
ANR Identify a complex number represented as a vector on a coordinate plane
ANS Relate a graph to a square or cube root function
ANT Determine values of the inverse of a function using a table or a graph
ANU Simplify a monomial algebraic expression that includes fractional exponents and/or nth roots
ANV Multiply or divide functions
AP2 Represent a system of linear equations as a single matrix equation
AP4 Multiply complex numbers
AP6 Add or subtract vectors component-wise
Table 1: Content of Objective Clusters for the STAR Maths Strands (Continued)
Strand Objective ID Objective Description

Content and Test DesignContent Specification
39STAR Maths™Technical Manual
Algebra (continued)
AP7 Evaluate a linear combination of vectors
AP8 Identify the vertex, axis of symmetry, or direction of the graph of a quadratic function
AP9 Identify the end behaviour, asymptotes, excluded values, or behaviour near excluded values of a rational function
APB Determine if the inverse of a function is a function
APC Determine the equation of the inverse of a linear, rational root, or polynomial function
APD Determine the equation of a function resulting from a translation and/or scaling of a given function
AQS Simplify a monomial algebraic expression that includes nth roots
AQT Determine an equation of a circle with centre at the origin
A17 Quadratic equations: Completing the square
Data Analysis & Probability
SA1 Read tally charts
SD7 Read a 2-category tally chart
SD8 Use a 2-category tally chart to represent groups of objects (1 symbol = 1 object)
S00 Read a simple pictograph (1 symbol = 1 object)
S02 Read bar graph
S03 Read pie chart
S17 Use a pictograph to represent data (1 symbol = more than 1 object)
S19 Answer a question using information from a bar graph with a y-axis scale by 2s
S26 Use a bar graph with a y-axis scale by 2s to represent data
SD9 Answer a question using information from a 2-category tally chart
SE7 Read a simple pictograph (1 symbol = more than 1 object)
S01 Read table
S04 Interpret table
S05 Interpret bar graph
S06 Process data given in a pie chart
S18 Answer a question using information from a pictograph (1 symbol = more than 1 object)
SDC Read a line plot
SDD Answer a question using information from a line plot
S20 Use a line graph to represent data
S21 Read a double-bar graph
Table 1: Content of Objective Clusters for the STAR Maths Strands (Continued)
Strand Objective ID Objective Description

Content and Test DesignContent Specification
40STAR Maths™Technical Manual
On the STAR Maths 3.x and higher Diagnostic Report, the shaded region of each bar chart reflects the amount of material within each strand that the student has most likely mastered. These estimates are based on the US STAR Maths 2.0 norming data, and mastery is defined as 70% proficient. Therefore, if a student’s ability estimate suggests that she could answer 70% or more correct on a specific objective cluster, such as Hundreds, she will have “mastered” that objective cluster and that box will be shaded on her Diagnostic Report. Because the content in the strands included in the objective clusters is hierarchical, students most likely master the objective clusters in sequential order. The solid black line on the bar chart points to the objective cluster that the student is currently developing or the lowest objective that she has not mastered.
Data Analysis & Probability (continued)
S22 Answer a question using information from a double-bar graph
SA2 Read a line graph
SA3 Use a double-bar graph to represent data
S13 Answer a question using information from a line graph
S14 Determine the median of an odd number of data values
SDE Read a double- or stacked-bar graph
SD3 Determine the median of an even number of data values
S07 Statistics: Mean
S08 Statistics: Grouped data
S11 Probability: Simple
S12 Probability: Joint
S15 Use a circle graph to represent percentage data
S16 Use a histogram to represent data
S23 Answer a question using information from a circle graph using percentage calculations
S24 Answer a question using information from a histogram
SE4 Answer a question using information from a Venn diagram containing summarized data
S25 Use a proportion to make an estimate, related to a population, based on a sample
SE6 Answer a question using information from a scatter plot
AME Determine if a scatter plot shows a positive relationship, a negative relationship, or no relationship between the variables
AMF Make a prediction based on a scatter plot
Table 1: Content of Objective Clusters for the STAR Maths Strands (Continued)
Strand Objective ID Objective Description

Content and Test DesignRules for Writing Items
41STAR Maths™Technical Manual
Rules for Writing ItemsWhen preparing specific items to test student knowledge of the content selected for STAR Maths, several item-writing rules were employed. These rules helped to shape the final appearance of the content and hence, became part of the content specifications:
The first and perhaps most important rule was to have the item content, wording and format reflect the typical appearance of the content in curricular materials. In some testing applications, one might want the item to look different from how the content typically appears in curricular materials. However, the target for the STAR Maths test was to have the items reflect how the content appears in curricular materials that students are likely to have used.
Second, every effort was made to keep item content simple and to keep the required reading levels low. Although there may be some situations in which one would want to make test items appear complex or use higher levels of reading difficulty, for the STAR Maths test, the intent was to simplify when possible.
Third, efforts were made both in the item-writing and in the item-editing phases to minimise cultural loading, gender stereotyping and ethnic bias in the items.
Fourth, the items had to be written in such a way as to be presented in the computer-adaptive format. More specifically, items had to be presentable on the types of computer screens commonly found in schools. This rule had one major implication that influenced item presentation: artwork was limited to fairly simple line drawings, and colours were kept to a minimum.
Finally, items were all to be presented in a multiple-choice format. Answer choices were to be laid out in either a 4 × 1 matrix, a 2 × 2 matrix or a 1 × 4 matrix.
In all cases, the distracters chosen were representative of the most common errors for the particular question stem. A “not given” response option was included only for the Computation Processes strand. This option was included to minimise estimation as a response strategy and to encourage the student to actually work the problem to completion.
Computer-Adaptive Test DesignAn additional level of content specification is determined by the student’s performance during testing. In conventional paper-and-pencil standardised tests, items retained from the item tryout or item calibration program are organised by level. Then, each student takes all items within a given test level. Thus, the student is only tested on those mathematical operations and concepts deemed to be appropriate for the student’s year.

Content and Test DesignComputer-Adaptive Test Design
42STAR Maths™Technical Manual
On the other hand, in computer-adaptive tests, such as STAR Maths, the items taken by a student are dynamically selected in light of that student’s performance during the testing session. Thus, a low-performing student’s knowledge of maths operations may branch to easier operations to better estimate maths achievement level, and high-performing students may branch to more challenging operations or concepts to better determine the breadth of their maths knowledge and their maths achievement level.
During an adaptive test, a student may be “routed” to items at the lowest level of difficulty within the overall pool of items, dependent upon the student’s performance during the testing session. In general, when an item is responded to correctly, the student is routed to a more difficult item. When an item is answered incorrectly, the student is instead routed to an easier item. The Adaptive Branching procedure aims to select items such that a student is expected to have a 67.5 per cent chance of answering each item correctly, given the student’s estimated ability and the item’s known difficulty.
A STAR Maths test consists of a fixed-length, 24-item adaptive test. Students who have not taken a STAR Maths 2.x or higher test within 180 days initially receive an item whose difficulty level is relatively easy for students at that year. This minimises any effects of initial anxiety that students may have when starting the test and serves to better facilitate the students’ initial reactions to the test. The starting points vary by year and are based on research conducted as part of the norming process described in “Reliability and Measurement Precision” on page 56.
When a student has taken a STAR Maths test within the previous 75 days, the appropriate starting point is based on the student’s previous test score information. Following the administration of the initial item, and after the student has entered an answer, the program determines an updated estimate of the student’s maths achievement level. Then, it selects the next item randomly from among all of the available items having a difficulty level that closely match this estimated achievement level. Randomisation of items with difficulty values near the student’s maths achievement level allows the program to avoid overexposure of test items.
The items in the first part of the test (items 1–16) are dynamically selected from an item bank consisting of all the retained items from the Numeration Concepts and Computation Processes strands. Although the second part of the test selects items from a pool that consists of the remaining six content strands, content balancing rules ensure that every strand appropriate to the student’s year is represented. Table 2 shows the content-balancing design of STAR Maths strands by US grade.

Content and Test DesignComputer-Adaptive Test Design
43STAR Maths™Technical Manual
As can be seen in Table 2, all students in all years receive eight items from Computation Processes and eight items from Numeration Concepts during the first sixteen items of the test. The specific type of question administered within these strands will vary with the student’s year and estimated ability level. The next seven items are selected according to the student’s year, according to Table 2. A zero means that no minimum criterion exists, but students may receive items from that strand if it would be consistent with the software’s estimated ability level. The final and 24th item of a STAR Maths test will be selected from any available strands in Other Applications that are consistent with the student’s estimated ability level.
Items that have been administered to the same student within the past 75 days are not available for administration. In addition, to avoid frustration, items that are intended to measure advanced mathematical concepts and operations that are more than three US grade levels beyond the student’s US grade level, as determined by where such concepts or operations are typically introduced in maths textbooks, are also not available for administration.
Because the item pools make a large number of items available for selection, these minor constraints have a negligible impact on the quality of each STAR Maths computer-adaptive test.
Table 2: Content-Balancing Design of STAR Maths Strands by US Grade–Minimum Distribution of Items by Strands
Strand
Year First 16 Items (1–16)
2 3 4 5 6 7 8 9 10 11 12 13
Computation Processes 8 8 8 8 8 8 8 8 8 8 8 8
Numeration Concepts 8 8 8 8 8 8 8 8 8 8 8 8
Total 16 16 16 16 16 16 16 16 16 16 16 16
Strand
Year
Last 8 Items (17–24)
2 3 4 5 6 7 8 9 10 11 12 13
Algebra 0 0 0 0 0 0 0 0 2 2 2 2
Approximationa
a. Students in Years 1–3 will not receive items from the Approximation strand.
– – 1 1 1 1 1 1 0 0 0 0
Data Analysis and Statistics 1 1 1 1 1 1 1 1 1 1 1 1
Measurement 2 2 2 2 2 1 1 1 1 1 1 1
Shape and Space 2 2 1 1 1 2 2 2 2 2 2 2
Word Problems 2 2 2 2 2 2 2 2 1 1 1 1
Total 7 7 7 7 7 7 7 7 7 7 7 7

Content and Test DesignSTAR Maths Scoring
44STAR Maths™Technical Manual
STAR Maths ScoringFollowing the administration of each STAR Maths item, and after the student has selected a response, an updated estimate of the student’s underlying maths achievement level is computed based on the student’s responses to all of the items administered up to that point. A proprietary Bayesian-mode item response theory estimation method is used for scoring until the student has answered at least one item correctly and at least one item incorrectly. Once the student has met this 1-correct/1-incorrect criterion, STAR Maths software uses a proprietary Maximum-Likelihood IRT estimation procedure to avoid any potential bias in the Scaled Scores.
This approach to scoring enables STAR Maths software to provide Scaled Scores that are statistically consistent and efficient. Accompanying each Scaled Score is an associated measure of the degree of uncertainty, called the standard error of measurement (SEM). Unlike conventional paper-and-pencil tests, the SEM values for STAR Maths scores will be unique for each student dependent upon the particular items in the student’s individual test and the student’s performance on those items. Because the STAR Maths test is computer-adaptive, however, the SEM values are relatively consistent by the end of the 24-item test.
Scaled Scores are expressed on a common scale that spans all years covered by the STAR Maths test. Because STAR Maths software expresses Scaled Scores on a common scale, Scaled Scores are directly comparable with each other, regardless of US grade level or UK year.

45STAR Maths™Technical Manual
Calibration Study and Item Analysis
In the development of US STAR Maths 1.0, approximately 2,450 items were prepared according to the defined STAR Maths content specifications. These items were subjected to empirical tryout in 1997 in a national sample of students in US grades 3–12. Following both traditional and item response theory (IRT) analyses of the resulting item response data, 1,434 of the items were chosen for use in the STAR Maths 1.x item bank.
STAR Maths 3.x and higher uses the same item bank that was developed for STAR Maths 2.0. In the development of STAR Maths 2.0, about 1,100 new items were written. The new items extended the content of the STAR Maths item bank to include US grades 1–12 and expanded the algebra coverage by adding a number of new algebra objectives. Where needed, items measuring other objectives were written to supplement existing items.
All of the new items had to be calibrated on the same difficulty scale as the original STAR Maths item bank. Because a number of changes in item display features were introduced with STAR Maths 2.0, Renaissance Learning decided to recalibrate the STAR Maths 1.x adaptive item bank simultaneously with the new items written specifically for STAR Maths 2.x. During the STAR Maths 2.0 Calibration Study, 2,471 items, including both the existing and the new items, were administered to a national sample of more than 44,000 students in US grades 1–12 in the spring of 2001.
Calibration SampleTo obtain a sample that was representative of the diversity of mathematics achievement in the US school population, school districts, specific schools and individual students were selected to participate in the Calibration Study. The sampling frame consisted of all US schools, stratified on three key variables: geographic region of the country, school size and socioeconomic status. The STAR Maths 2.0 calibration sample included students from 261 schools from 45 of the 50 US states. Tables 3 and 4 present the characteristics of the calibration sample.
Table 3: Sample Characteristics, STAR Maths US 2.0 Calibration Study—Spring 2001 (N = 44,939 Students)
Students
National % Sample %
Geographic Region Northeast 20.4% 7.8%
Midwest 23.5% 22.1%
Southeast 24.3% 37.3%
West 31.8% 32.9%

Calibration Study and Item AnalysisCalibration Sample
46STAR Maths™Technical Manual
In STAR Maths US 1.0, all test items were stored in bitmap format and displayed on top of a bitmap image replicating a sheet of yellow graph paper. However, for STAR Maths 2.x and higher, all items were converted from bitmap format to a vector-based format. Additionally, in STAR Maths 2.x and higher, many of the new primary level maths items contain bright and colourful graphics that would not reproduce well on top of the colour yellow. Therefore, the yellow graph paper element common to all STAR Maths 1.x items was replaced by a neutral, off-white field in STAR Maths 2.0. This item field was also increased in size so graphic elements could be enlarged. Because these changes in the display format and display size could affect items’ psychometric properties in STAR Maths 2.x and higher, calibration response data were collected by means of computer-administered testing, and STAR
District Socioeconomic Status
Low 28.4% 30.2%
Average 29.6% 38.9%
High 31.8% 23.1%
Non-Public 10.2% 8.1%
School Type and District Enrolment
Public
< 200 15.8% 24.2%
200–499 19.1% 26.2%
500–1,999 30.2% 26.4%
> 2,000 24.7% 15.1%
Non-Public 10.2% 8.1%
Table 4: Ethnic Group and Gender Participation, STAR Maths US 2.0 Calibration Study—Spring 2001 (N = 44,939 Students)
Students
National % Sample %
Ethnic Group Asian 3.9% 2.8%
Black 16.8% 14.9%
Hispanic 14.7% 10.3%
Native American 1.1% 1.6%
White 63.5% 70.4%
Response Rate 86.2% 35.7%
Gender Female Not available 49.8%
Male Not available 50.2%
Response Rate 0.0% 55.9%
Table 3: Sample Characteristics, STAR Maths US 2.0 Calibration Study—Spring 2001 (N = 44,939 Students) (Continued)
Students
National % Sample %

Calibration Study and Item AnalysisData Collection
47STAR Maths™Technical Manual
Maths 1.0 items were recalibrated along with the items newly developed for STAR Maths 2.0.
Data CollectionThe calibration data were collected by administering test items on-screen, with display characteristics identical to those to be implemented in the STAR Maths 2.0 product. However, the calibration items were administered in forms consisting of fixed sequences of items, as opposed to the adaptive testing format.
Seven levels of test forms were constructed corresponding to varying US grade levels. Because growth in mathematics is much more rapid in the lower US grades, there was only one US grade per level for the first four levels. As US grade level increases, there is more variation among both students and school curricula, so a single test level can cover more than one US grade level. US grades were assigned to test levels after extensive consultation with mathematics instruction experts, and assignments were consistent both with the STAR Maths item development framework and with assignments used in other maths achievement tests. To create the levels of test forms, therefore, items were assigned to US grade levels such that resulting test forms sampled an appropriate range of objectives from each of the strands that are typically represented at or near the targeted US grade levels. Table 5 describes the various test form designations used for the STAR Maths 2.0 Calibration Study.
Students in US grades 1–4 (Years 2–5) for Levels A, B, C and D took 36-item tests consisting of three practice items and 33 actual test items. Expected testing time for these students was 30 minutes. Students in US grades 5–12/Years 6–13 (Levels E, F and G) took 46-item tests consisting of three practice items and 43 actual test items. Expected testing time for these students was 40 minutes.
Items within each level were distributed among a number of test forms. Consistent with STAR Maths 1.0, the content of each form was balanced
Table 5: Test Form Levels, US Grades, Numbers of Items per Form and Numbers of Test Forms, STAR Maths US 2.0 Calibration Study—Spring 2001
Level US Grades Items per Form Forms Items
A 1 36 14 152
B 2 36 22 215
C 3 36 32 310
D 4 36 34 290
E 5–6 46 36 528
F 7–9 46 32 516
G 10–12 46 32 464

Calibration Study and Item AnalysisItem Analysis
48STAR Maths™Technical Manual
between two broad categories of items: items measuring Numeration Concepts and Computation Processes and items measuring Other Applications. Each form was organised into three sections: A, B and C. Sections A and C each consisted of approximately 40% of the test length and contained items from both of the categories. Section A began with items measuring Numeration Concepts and Computation Processes, followed by items measuring Other Applications. Section C reversed this order, with Other Applications items preceding Numeration Concepts and Computation Processes items.
Section B comprised approximately 20% of the test length and contained two types of anchor items. “Horizontal anchors” were common to a number of test forms at the same level, and “vertical anchors” were common to forms at adjacent levels. The anchor items were used to facilitate later analyses that placed all item difficulty parameters on a common scale.
With the exception of Levels A and G, approximately half of the vertical anchor items in each form came from the next lower level, and the other half came from the next higher level. Items chosen as vertical anchor items were selected partially based on their difficulty; items expected to be answered correctly by more than 80 per cent or fewer than 50 per cent of out-of-level students were not used as vertical anchor items.
Two versions of each form were used: version A and version B. Each version A form consisted of Sections A, B and C in that order. Each version B form contained the same items, arranged in reverse order, with Section C followed by Sections B and A. The alternate forms counterbalanced the order of item presentation, as a defence against possible order effects influencing the psychometric properties of the items.
In all three test sections, items were chosen so that content was balanced at each level, with the numbers of items measuring each of the content domains roughly proportional to the distribution of items among the domains at each level.
In Levels A–G combined, there were 101 unique sets of test items. Each was arranged in two alternate forms, versions A and B, that differed only in terms of item presentation order. Therefore, there was a total of 202 test forms.
Item AnalysisFollowing extensive quality control checks, the STAR Maths 2.0 calibration item response data were analysed by level, using both traditional item analysis techniques and Item Response Theory (IRT) methods. For each test item, the following information was derived using traditional psychometric item analysis techniques:
The number of students who attempted to answer the item.

Calibration Study and Item AnalysisItem Difficulty
49STAR Maths™Technical Manual
The number of students who did not attempt to answer the item.
The percentage of students who answered the item correctly (a traditional measure of difficulty).
The percentage of students answering each option and the alternatives.
The correlation between answering the item correctly and the total score (a traditional measure of discrimination).
The correlation between the endorsement of each alternative answer and the total score.
Item DifficultyThe difficulty of an item in traditional item analysis is the percentage (or proportion) of students who answer the item correctly. This is typically referred to as the “p-value” of the item. Low p-values (such as 15%) indicate that the item is difficult since only a small percentage of students answered it correctly. High p-values indicate that the majority of students answered the item correctly and thus, the item is easy. It should be noted that the p-value only has meaning for a particular item relative to the characteristics of the sample of students who responded to it.
Item DiscriminationThe traditional measure of the discrimination of an item is the correlation between the “mark” on the item (correct or incorrect) and the total test score. Items that correlate highly with total test score will also tend to correlate with one another more highly and produce a test with more internal consistency. For the correct answer, the higher the correlation between the item mark and the total score, the better the item is at discriminating between low-scoring and high-scoring individuals. When the correlation between the correct answer and the total test is low (or negative), the item is most likely not performing as intended. The correlation between endorsing incorrect answers and the total score should generally be low, since there should not be a positive relationship between selecting an incorrect answer and scoring higher on the overall test.
Item Response FunctionIn addition to traditional item analyses, the US STAR Maths 2.0 calibration data were analysed using item response theory (IRT) methods. IRT methods develop mathematical models of the relationship of student ability to the difficulty of specific test questions; more specifically, they model the probability of a correct response to each test question as a function of student ability. Although IRT methods encompass a family of mathematical models, the one-parameter (or Rasch) IRT model was selected for the STAR Maths 2.0

Calibration Study and Item AnalysisItem Response Function
50STAR Maths™Technical Manual
data both for its simplicity and its ability to accurately model the performance of the STAR Maths 2.x items.
Within IRT, the probability of answering an item correctly is a function of the student’s ability and the difficulty of the item. Since IRT places the item difficulty and student ability on the same scale, this relationship can be represented graphically in the form of an item response function (IRF).
Figure 1 is a plot of three item response functions: one for an easy item, one for a more difficult one and one for a very difficult item. Each plot is a continuous S-shaped (ogive) curve. The horizontal axis is the scale of student ability, ranging from very low ability (–5.0 on the scale) to very high ability (+5.0 on the scale). The vertical axis is the per cent of students expected to answer each of the three items correctly at any given point on the ability scale. Notice that the expected per cent correct increases as student ability increases, but varies from one item to another.
Figure 1: Three Examples of Item Response Functions
Item response theory expresses both item difficulty and student ability on the same scale. In Figure 1, each item’s difficulty is the scale point where the expected per cent correct is exactly 50. These points are depicted by vertical lines going from the 50% point to the corresponding locations on the ability scale. The easiest item has a difficulty scale value of about –1.67; this means that students located at –1.67 on the ability scale have a 50-50 chance of answering that item right. The scale values of the other two items are approximately +0.20 and +1.25, respectively.
Calibration of test items estimates the IRT difficulty parameter for each test item and places all of the item parameters onto a common scale. The difficulty parameter for each item is estimated, along with measures to indicate how

Calibration Study and Item AnalysisReview of Calibrated Items
51STAR Maths™Technical Manual
well the item conforms to (or “fits”) the theoretical expectations of the presumed IRT model.
Also plotted in Figure 1 are the actual percentages of correct responses of groups of students to all three items. Each group is represented as a small triangle, circle or diamond. Each of those geometric symbols is a plot of the per cent correct against the average ability level of the group. Ten groups’ data are plotted for each item; the triangular points represent the groups responding to the easiest item. The circles and diamonds, respectively, represent the groups responding to the moderate and to the most difficult item.
Review of Calibrated ItemsFollowing these analyses, each test item, along with both traditional and IRT analysis information (including IRF and EIRF plots) and information about the test level, form and item identifier were stored in a specialised item statistics database system. A panel of internal and external content reviewers then examined each item within content strands to determine whether the item met all criteria for inclusion in the bank of items that would be used in the norming version of the US STAR Maths 2.0 test. The item statistics database system allowed experts easy access to all available information about an item in order to interactively designate items that, in their opinion, did not meet acceptable standards for inclusion in the STAR Maths 2.x item bank.
Rules for Item Retention
Items were eliminated if any of the following occurred:
The item-total correlation (item discrimination) was less than 0.30.
At least one of an item’s distracters had a positive item discrimination.
The sample size of students attempting the item was less than 300.
The traditional item difficulty indicated that the item was too difficult or too easy.
The item did not appear to fit the Rasch IRT model.
After each content reviewer had designated certain items for elimination, those recommendations were combined and a second review was conducted to resolve issues where there was not uniform agreement among all reviewers.
Of the initial 2,471 items administered in the STAR Maths 2.0 Calibration Study, approximately 2,000 (81%) were deemed of sufficient quality to be retained for further analyses. About 1,200 of these retained items were STAR Maths 1.x items.
Traditional item-level analyses were conducted again on the reduced data set. In these analyses, the dimensionality assumption of combining the first and

Calibration Study and Item AnalysisDynamic Calibration
52STAR Maths™Technical Manual
second parts of the test was re-evaluated to ensure that all items could be placed onto a single scale. In the final IRT calibration, all test forms and levels were equated based on the information provided by the embedded anchor items within each test form so that the resulting IRT item difficulty parameters were placed onto a single scale spanning US grades 1–12.
Dynamic CalibrationAn important new feature has been added to the assessment—dynamic calibration. This new feature allows response data on new test items to be collected during the STAR testing sessions for the purpose of field testing and calibrating those items.
When dynamic calibration is active, it works by embedding one or more new items at random points during a STAR test. These items do not count toward the student’s STAR test score, but item responses are stored for later psychometric analysis. Students may take as many as three additional items per test; in some cases, no additional items will be administered. On average, this will only increase testing time by one to two minutes. The new, non-calibrated items will not count towards the student’s final scores, but will be analysed in conjunction with the responses of hundreds of other students.
Student identification does not enter into the analyses; they are statistical analyses only. The response data collected on new items allows for continual evaluation of new item content and will contribute to continuous improvement in STAR tests’ assessment of student performance.

53STAR Maths™Technical Manual
Score Definitions
The UK edition of STAR Maths software provides four types of scores: scaled scores, criterion-referenced scores, normed referenced standardised scores and estimated National Curriculum Levels.
Types of Test Scores Scaled scores measure student performance on a continuous scale that
extends from Years 1–13.
Criterion-referenced scores describe a student’s performance relative to a specific content domain or to a standard. Such scores may be expressed either on a continuous score scale or as a classification. An example of a criterion-referenced score on a continuous scale is a per cent-correct score, which expresses what proportion of test questions the student can answer correctly in the content domain. One example of a criterion-referenced classification is a proficiency category on a standards-based assessment: the student may be said to be “proficient” or not, depending on whether his score equals, exceeds or falls below a specific criterion (the “standard”) used to define “proficiency” on the standards-based test. The Numeration and Computation mastery classification charts in the Diagnostic Report are criterion-referenced.
Norm-referenced scores compare a student’s test results to the results of other students who have taken the same test. In this case, scores provide a relative measure of student achievement compared to the performance of a group of students at a given time. The Normed Referenced Standardised Score and Percentile Rank are the primary norm-referenced scores available in STAR Maths software.
National Curriculum Level–Maths (NCL–M) is an estimate of a student’s standing on the National Curriculum based on their STAR Maths performance. This score is an approximation based on the demonstrated relationship between STAR Maths scale scores and teacher’s judgment through their teacher assessment (TA) of student’s obtained skills. It should not be taken to be the student’s actual national curriculum level, but rather an estimate of the level at which the child is most likely performing. Stating this another way, the NCL from STAR Maths is an estimate of the individual’s standing in the national curriculum framework based on a modest number of STAR Maths test items, selected to match the student’s estimated ability level. A student’s actual NCL is obtained through national testing and assessment protocols. The estimated score is meant to provide information useful for decisions with respect to a student’s present level of functioning when no current value of the actual NCL is available.

Score DefinitionsTypes of Test Scores
54STAR Maths™Technical Manual
National Curriculum Level–Maths (NCL–M)
The NCL score is reported in the following format: the estimated national curriculum level followed by a sublevel category, labeled a, b or c. The sublevels can be used to monitor student progress more finely, as they provide an indication of how far a student has progressed within a specific national curriculum level. For instance, an NCL–M of “4c” would indicate that an individual is estimated to have just obtained level 4, while another student with “4a” is estimated to be approaching level 5.
It is sometimes difficult to identify whether or not a student is in the top of one level (for instance, 4a) or just beginning the next higher level (for instance, 5c). Therefore, a transition category is used to indicate that a student is performing around the cusp of two adjacent levels. These transition categories are indicated by concatenation of the contiguous levels and sublevel categories. For instance, a student whose skills appear to range between levels 4 and 5, indicating they are probably starting to transition from one level to the next, would obtain an NCL of 4a/5c. These transition scores are provided only at the junction of one level and the next highest. There are no transition categories within a level, for instance there are no 4c/4b or 4b/4a categories.
Table 6 correlates National Curriculum Level–Maths (NCL–M) Scores to Scaled Scores.
Normed Referenced Standardised Score (NRSS)
The Normed Referenced Standardised Score is an age-standardised score that converts a student’s “raw score” to a standardised score which takes into account the student’s age in years and months and gives an indication of how the student is performing relative to a national sample of students of the same age. The average score is 100. A higher score is above average and a lower score is below average.
Table 6: Relation of National Curriculum Level–Maths (NCL–M) Scores to Scaled Scores
Scaled Score Range NCL–M
Scaled Score Range NCL–M
0–235 1b 664–721 4b
236–340 1a/2c 722–763 4a/5c
341–478 2b 764–832 5b
479–548 2a/3c 833–909 5a/6c
549–620 3b 910–1073 6b
621–663 3a/4c 1074–1400 6a/7c

Score DefinitionsTypes of Test Scores
55STAR Maths™Technical Manual
Percentile Rank (PR) and Percentile Rank Range
Percentile Ranks range from 1–99 and express student ability relative to the scores of other students in the same year. For a particular student, this score indicates the percentage of students in the norms group who obtained lower scores. For example, if a student has a PR of 85, the student’s maths skills are greater than 85% of other students in the same year.
The PR Range reflects the amount of statistical variability in a student’s PR score. If the student were to take the STAR Maths test many times in a short period of time, the score would likely fall in this range.
Scaled Score (SS)
STAR Maths 3.x and higher software creates a virtually unlimited number of test forms as it dynamically interacts with the students taking the test. In order to make the results of all tests comparable, and in order to provide a basis for deriving the norm-referenced scores, all STAR Maths test scores are converted to a common scale, creating Scaled Scores. The STAR Maths 3.x and higher software does this in two steps. First, maximum likelihood is used to estimate each student’s location on the Rasch ability scale, based on the difficulty of the items administered, and the pattern of right and wrong answers. Second, using a linear transformation to make all scores positive integers, the Rasch ability scores are converted to STAR Maths Scaled Scores. STAR Maths 3.x and higher Scaled Scores range from 0–1400.
STAR Maths Scaled Scores are expressed on the same scale used in the previous versions, STAR Maths 1.x and 2.x. STAR Maths Scaled Scores provide a single scale for measuring the maths achievement of students from Years 2–13.

56STAR Maths™Technical Manual
Reliability and Measurement Precision
Reliability is a measure of the degree to which test scores are consistent across repeated administrations of the same or similar tests to the same group or population. To the extent that a test is reliable, its scores are free from errors of measurement. In educational assessment, however, some degree of measurement error is inevitable. One reason for this is that a student’s performance may vary from one occasion to another. Another reason is that variation in the content of the test from one occasion to another may cause scores to vary.
In a computer-adaptive test such as STAR Maths 3.x and higher, content varies from one administration to another, and it also varies according to the level of each student’s performance. Another feature of computer-adaptive tests based on Item Response Theory (IRT) is that the degree of measurement error can be expressed for each student’s test individually.
The STAR Maths 3.x and higher test provides two ways to evaluate the reliability of its scores: reliability coefficients, which indicate the overall precision of a set of test scores, and conditional standard errors of measurement (SEM), which provide an index of the degree of error in an individual test score. A reliability coefficient is a summary statistic that reflects the average amount of measurement precision in a specific examinee group or in a population as a whole. In STAR Maths 3.x and higher, the SEM is an estimate of the unreliability of each individual test score. While a reliability coefficient is a single value that applies to the overall test, the magnitude of the SEM may vary substantially from one person’s test score to another.
This chapter presents three different types of reliability coefficients: generic reliability, split-half reliability and alternate forms reliability. This is followed by statistics on the conditional standard error of measurement of STAR Maths 3.x and higher test scores.
UK Study ResultsDuring October and November 2006, 28 schools in England participated in a study to investigate the reliability of scores for STAR Maths across Years 2 to 9. Estimates of the generic reliability were obtained from completed assessments. In addition to the reliability estimates, the conditional standard error of measurement was computed for each individual student and summarised by school year (see Table 7).

Reliability and Measurement PrecisionGeneric Reliability
57STAR Maths™Technical Manual
Generic ReliabilityTest reliability is generally defined as the proportion of test score variance that is attributable to true variation in the trait the test measures. This can be expressed analytically as:
where σ2error is the variance of the errors of measurement, and σ2
total is the variance of the test scores. In STAR Maths, the variance of the test scores is easily calculated from Scaled Score data. The variance of the errors of measurement may be estimated from the conditional standard error of measurement (SEM) statistics that accompany each of the IRT-based test scores, including the Scaled Scores, as depicted here
where the summation is over the squared values of the reported SEM for students i = 1 to n. In each STAR Maths 3.x and higher test, SEM is calculated along with the IRT ability estimate and Scaled Score. Squaring and summing the SEM values yields an estimate of total squared error; dividing by the number of observations yields an estimate of mean squared error, which in this case is tantamount to error variance. “Generic” reliability is then estimated by calculating the ratio of error variance to Scaled Score variance and subtracting that ratio from 1.
Using this technique with the STAR Maths 2.0 US norming data resulted in the generic reliability estimates shown in the rightmost column of Table 8. Because this method is not susceptible to error variance introduced by repeated testing, multiple occasions and alternate forms, the resulting
Table 7: Reliability and Conditional SEM Estimates by Year in the UK Sample
UK YearNumber of Students
Generic Reliability Average SEM
Standard Deviation of
SEM
2 326 0.90 36.80 4.23
3 351 0.89 36.14 3.69
4 588 0.87 36.15 2.25
5 467 0.87 36.14 2.49
6 412 0.90 35.84 2.38
7 680 0.90 36.12 3.03
8 527 0.90 35.83 2.86
9 527 0.90 35.83 2.86
reliability = 1 –σ2
error
σ2total
SEM2σ2error i
1n= Σ
n
Reliability and Measurement PrecisionSplit-Half Reliability
58STAR Maths™Technical Manual
estimates of reliability are generally higher than the more conservative alternate forms reliability coefficients. These generic reliability coefficients are, therefore, plausible upper-bound estimates of the actual reliability of the STAR Maths computer-adaptive test.
While generic reliability does provide a plausible estimate of measurement precision, it is a theoretical estimate, as opposed to traditional reliability coefficients, which are more firmly based on item response data. Traditional internal consistency reliability coefficients such as Cronbach’s alpha and Kuder-Richardson Formula 20 (KR-20) cannot be calculated for adaptive tests. However, an estimate of internal consistency reliability can be calculated using the split-half method. This is discussed in the next section.
Split-Half ReliabilityIn classical test theory, before the advent of digital computers automated the calculation of internal consistency reliability measures such as Cronbach’s alpha, approximations such as the split-half method were sometimes used. A split-half reliability coefficient is calculated in three steps. First, the test is divided into two halves, and scores are calculated for each half. Second, the correlation between the two resulting sets of scores is calculated; this correlation is an estimate of the reliability of a half-length test. Third, the resulting reliability value is adjusted, using the Spearman-Brown formula, to estimate the reliability of the full-length test.
In internal simulation studies, the split-half method provided accurate estimates of the internal consistency reliability of adaptive tests, and so it has been used to provide estimates of STAR Maths 3.x and higher reliability. These split-half reliability coefficients are independent of the generic reliability approach discussed above and more firmly grounded in the item response data. The fifth column of Table 8 contains split-half reliability estimates for STAR Maths 3.x and higher, calculated from the US Norming Study data.
Alternate Form ReliabilityAnother method of evaluating the reliability of a test is to administer the test twice to the same examinees. Next, a reliability coefficient is obtained by calculating the correlation between the two sets of test scores. This is called a retest reliability coefficient if the same test was administered both times and an alternate forms reliability coefficient if different, but parallel, tests were used.
This approach was used for STAR Maths 2.0, as part of the US Norming Study, and the results are presented in the third column of Table 8. Participating schools were asked to administer two US norming tests, each on a different day, to about one-fourth of the overall sample. Figure 2 is a scatterplot of their scores. This resulted in an alternate forms reliability subsample of more than

Reliability and Measurement PrecisionAlternate Form Reliability
59STAR Maths™Technical Manual
7,000 students who took different forms of the 24-item STAR Maths 2.0 US norming test. The interval between the first and second tests averaged four days. The interval varied widely, however. For example, in some cases both tests were given on the same day; in other cases, the interval ranged from one to as many as 40 days.
Figure 2: Scatterplot of Test Scores from the STAR Maths 2.0 US Norming Alternate Forms Reliability Study
Errors of measurement due to both content sampling and temporal changes in individuals’ performance can affect alternate forms reliability coefficients, usually making them appreciably lower than internal consistency reliability coefficients. In addition, any growth in the trait that takes place in the interval between tests can also lower the correlation. The actual reliability of STAR Maths is probably higher than the alternate forms estimates presented in Table 8.
Table 8 lists the detailed results of the generic, split-half and alternate forms reliability analyses of STAR Maths 2.0 Scaled Scores, both overall and by US grade.
The split-half and generic reliability estimates, which are based on the entire STAR Maths 2.0 norms sample of 29,228 students, are very similar to one another, with the split-half values generally slightly lower. In the overall sample, these reliability estimates were approximately 0.94. By US grade, they range from 0.78 to 0.88, with a median of 0.85.
The alternate forms reliability estimates are based on the 7,517 students who participated in the reliability study, about one-fourth of the norms sample. In the overall sample, the alternate forms reliability estimates were approximately 0.91. By US grade, the values ranged from approximately 0.72 to 0.80, with a median value of 0.74.

Reliability and Measurement PrecisionStandard Error of Measurement
60STAR Maths™Technical Manual
Standard Error of MeasurementWhen interpreting any educational test scores, the test user must bear in mind that the scores include some degree of error. The size of the test score reliability coefficient provides an indication of the overall magnitude of that error. The standard error of measurement (SEM) arguably provides a measure that is more useful for score interpretation, as the SEM is expressed in the same units used to express the test score.
For the STAR Maths 3.x and higher Scaled Score, a conditional SEM is calculated for each individual, but is not listed on the score reports. In the following section, aggregate SEMs are presented. For the Scaled Score, these SEMs represent averages of the conditional SEMs, overall and by grade (year). The averages presented here are useful for purposes of both score interpretation and test evaluation.
Table 8: Reliability Estimates by US Grade from the US Norming Study—STAR Maths 2.0 Scaled Scores
US Grade N
Alternate Forms
Reliability NSplit Half
ReliabilityGeneric
Reliability
1 745 0.731 3,076 0.824 0.834
2 866 0.753 3,193 0.777 0.790
3 853 0.741 2,972 0.781 0.798
4 840 0.733 2,981 0.790 0.813
5 813 0.789 3,266 0.803 0.826
6 729 0.734 2,555 0.836 0.838
7 698 0.721 2,896 0.857 0.864
8 714 0.736 2,598 0.877 0.876
9 381 0.793 1,771 0.856 0.862
10 304 0.799 1,556 0.874 0.877
11 255 0.756 1,419 0.865 0.868
12 191 0.722 945 0.882 0.872
Overall 7,389 0.908 29,228 0.944 0.947

61STAR Maths™Technical Manual
Validity
The key concept used to judge an instrument’s usefulness is its validity. The validity of a test is the degree to which it assesses what it claims to measure. Determining the validity of a test is a difficult process because there are actually many aspects of validity that can be examined. For example, the content validity of the test deals with the relevance of the questions, strands and objectives sampled by the test. These content validity issues were discussed in detail in “Content and Test Design” on page 13. and were an integral part of the design and construction of the STAR Maths test. Construct validity, addressed in this chapter, includes the extent to which a test measures the construct that it claims to be assessing.
Establishing construct validity involves the use of data and other information external to the test instrument itself. For example, the STAR Maths test claims to provide an estimate of a child’s mathematical achievement level for use in placement. Therefore, demonstration of STAR Maths’ construct validity rests on the evidence that the test in fact provides such an estimate.
There are a number of ways to demonstrate this. One method includes examining the relationship between students’ STAR Maths Scaled Scores and their US grade levels. Since mathematical ability varies significantly within and across US grade levels and improves as a student’s US grade level increases, STAR Maths data should demonstrate these anticipated relationships. Tables 40 and 41 on page 119 show a consistent pattern of US grade over grade (year over year) increases in average US STAR Maths 2.0 Scaled Scores. As STAR Maths 3.x (and higher) and 2.0 are psychometrically identical, this pattern is consistent with the proposition that the STAR Maths 2.x and higher test effectively measures the mathematics achievement of students.
Another source of evidence for construct validity is the relationship between students’ STAR Maths scores and their scores on other measures of mathematics achievement. If it is a valid assessment, the STAR Maths test should correlate highly with other accepted procedures and measures that are used to determine mathematics achievement level. Among other things, students’ STAR Maths scores should correlate highly with their scores on other established tests of mathematics proficiency and achievement. Additionally, these scores should be highly related to teachers’ assessments of their students’ proficiency in mathematics.
In the remainder of this chapter, validity evidence of two kinds will be presented. First, data that demonstrate a strong and positive correlation between STAR Maths 2.0 scores and scores on other standardised tests will be presented. Second, data that show a strong degree of relationship between STAR Maths 2.0 scores and teacher ratings of their students’ proficiency in

ValidityUK Study Results
62STAR Maths™Technical Manual
selected maths skills will be presented. All evidence supporting the validity of STAR Maths 2.0 applies perforce to STAR Maths 3.x and higher.
UK Study ResultsA large validation study was conducted in partnership with the National Foundation for Educational Research (NFER) in the UK across Years 2–9. The study was undertaken during the 2006–2007 academic year to investigate the validity of STAR Maths in a sample of students attending schools in England. Over 250 students from each year were recruited and evaluated on both STAR Maths and the norm-referenced test Progress in Maths 4-14 Series by nferNelson.2 In addition, all participants had their teachers provide a teacher assessment (TA) of their present mathematics skills with respect to the National Curriculum Level.
Students from 28 schools participated in the study. Descriptive statistics are found in Table 9.
As STAR Maths is a vertically scaled assessment reporting scores on a developmental score scale, scores are expected to increase over time and provide adequate separation between contiguous years. The correlation between STAR Maths scale scores and student age at time of testing was 0.71. Results in Table 9 indicate that the median scores (50th percentile rank) and all other score distribution points gradually increased across years, except at the 95th percentile rank between Years 8 and 9.
2. Clausen-May, T., Vappula, H., & Ruddock, G. (2004). Progress in Maths 4-14 Series. London: nferNelson.
Table 9: Selected Percentiles of Students’ Scale Scores on STAR Maths
YearNumber of Students
Percentile Rank
5 25 50 75 95
2 326 176 284 348 437 529
3 310 213 367 416 496 586
4 588 335 452 514 578 674
5 467 395 503 566 635 736
6 410 448 545 618 696 803
7 680 459 577 659 745 820
8 527 514 626 693 780 876
9 280 545 635 716 786 854

ValidityUK Study Results
63STAR Maths™Technical Manual
In addition, a single-factor ANOVA was computed to evaluate the significance of differences between means at each year (see Table 10).
The ANOVA shows that there are statistically significantly different test scores between regions in terms of relative achievement. The regression shows that this is driven by higher average test scores in Scotland and lower average test scores in the Southeast. Bear in mind that the Southeast contributed very many scores to this standardisation, while Scotland contributed very few.
The results indicated significant differences between years, F(7,3580) = 510.90, p < 0.001, η2 = 0.50, with observed power of 0.99. Follow-up analyses using Games-Howell post-hoc testing found significant differences, p < 0.01, between all years, except Years 8 and 9, where the difference was not found to be statistically significant.
The time to complete each STAR Maths assessment was recorded. Percentiles of test times by year are provided in Table 11. Results indicate about half of the students finished within 11 minutes while about 75% finished within 15 minutes.
Table 10: ANOVA Test of Differences in Mean Test Scores Between Regionsa
a. Number of obs = 24309; R-squared = 0.0066; Root MSE = 14.9166; Adj R-squared = 0.0065.
Source Partial SS df MS F Probability > F
Model 35976.9959 3 11992.332 53.90 0.0000
Region 35976.9959 3 11992.332 53.90 0.0000
Residual 5407957 24305 222.503888
Total 5443933.99 24308 223.956475
Regression
Standard Score Coefficient Std. Error t P > |t| [95% Conf. Interval]
North Base Category
Scotland 4.303 0.7360 5.85 0.000 2.860 5.745
Southeast –2.087 0.2441 –8.55 0.000 –2.566 –1.609
Southwest 0.0032 0.395 0.01 0.993 –0.7728 0.7793
Constant 101.388 0.215 469.68 0.000 100.9 101.812

ValidityUK Study Results
64STAR Maths™Technical Manual
Concurrent Validity
A single-group, cross-sectional design was used with counterbalanced test administrations. Students took both the STAR Maths assessment and the Progress in Maths 4-14 Series (nferNelson, 2004).3 Years 2–9 took levels 6–13, respectively, in Progress in Maths. Student age-standardised scores were computed for performance on Progress in Maths, and as all students at a given year took the same test form, the total correct score was also computed. On STAR Maths, each student’s scale score was computed. In addition to gathering external test data from the Progress in Maths 4-14 Series, students’ teachers were asked to provide the student’s present National Curriculum Level in Mathematics by means of the teacher assessment (TA).
Descriptive data for STAR Maths scale scores (STAR) and Progress in Maths age-standardised scores and total score for each year are provided in Table 12. Correlations between STAR scale scores and PIM scores for Years 2–9 ranged from 0.67–0.77, except in Year 2 where lower correlations were found, 0.52 and 0.58, for age-standardised score and total score, respectively. The median correlation across all years for age-standardised score was 0.72, and for total correct score it was 0.73.
The overall correlation between STAR Maths scale scores and the teacher assessment (TA-NCL) of the present level of attainment in the mathematics National Curriculum are provided in Table 13. As the National Curriculum spans all the years in this study, and STAR Maths is a vertically scaled assessment, concurrent validity was estimated by correlating the TA and student scale score on STAR Maths for the entire sample. The overall correlation was 0.81 with student attainment levels.
Table 11: Total Test Time, in Minutes, for a STAR Maths Test by Year (Given in Percentiles)
Year N
Time to Complete a STAR Maths Test
5th Percentile
25th Percentile
50th Percentile
75th Percentile
95th Percentile
2 326 4.46 8.05 10.78 15.61 25.78
3 351 4.83 7.79 10.50 13.70 21.11
4 588 5.69 8.47 11.03 14.37 20.64
5 467 5.48 7.90 10.72 14.30 20.13
6 412 5.67 7.87 10.08 13.45 19.00
7 680 5.00 8.07 10.57 13.68 20.22
8 527 5.00 7.57 9.53 11.93 17.62
9 280 4.35 6.98 8.78 11.10 16.68
3. Clausen-May, T., Vappula, H., & Ruddock, G. (2004). Progress in Maths 4-14 Series. London: nferNelson.

ValidityUK Study Results
65STAR Maths™Technical Manual
Table 12: Descriptive Statistics and Validity Coefficients by Years (Scores Rounded to Nearest Integer)
Year Test Score Na
a. Number of students with both SM/SS and PM/SS.
MeanStandard Deviation
Correlation with STAR
2 STAR Scale Score 275 355 108
PIM Total Score 19 6 0.58
PIM Standardised Score 93 16 0.52
3 STAR Scale Score 288 434 106
PIM Total Score 18 5 0.73
PIM Standardised Score 92 14 0.67
4 STAR Scale Score 387 520 99
PIM Total Score 22 8 0.73
PIM Standardised Score 97 16 0.72
5 STAR Scale Score 402 573 100
PIM Total Score 26 10 0.75
PIM Standardised Score 97 15 0.74
6 STAR Scale Score 337 626 110
PIM Total Score 25 11 0.77
PIM Standardised Score 95 14 0.76
7 STAR Scale Score 253 668 121
PIM Total Score 32 12 0.73
PIM Standardised Score 96 14 0.71
8 STAR Scale Score 311 709 103
PIM Total Score 29 10 0.72
PIM Standardised Score 102 14 0.72
9 STAR Scale Score 232 720 99
PIM Total Score 23 12 0.71
PIM Standardised Score 99 13 0.69
Table 13: Overall Correlation between Teacher Assessments of Student National Curriculum Level Attainment and STAR Maths Scale Scores
N Correlation
TA-NCL 2,485 0.81
ValidityRelationship of STAR Maths 2.0 Scores to Scores on Other Tests of Mathematics Achievement
66STAR Maths™Technical Manual
Relationship of STAR Maths 2.0 Scores to Scores on Other Tests of Mathematics Achievement
The STAR Maths 1.x Technical Manual listed correlations between scores on that test and those on a number of other standardised measures of maths achievement, obtained in 1998 for more than 9,000 students who participated in STAR Maths 1.0 US norming. The standardised tests included a variety of well-established instruments including the California Achievement Test (CAT), the Comprehensive Test of Basic Skills (CTBS), the Iowa Tests of Basic Skills (ITBS), the Metropolitan Achievement Test (MAT), the Stanford Achievement Test and several statewide tests.
During the 2002 US norming of STAR Maths 2.0, scores on other standardised tests were obtained for more than 10,000 additional students. All of the standardised tests listed above were included, plus others such as Northwest Evaluation Association (NWEA) and TerraNova. Scores on state assessments from the following states were also included: Connecticut, Delaware, Florida, Georgia, Kentucky, Indiana, Illinois, Maryland, Michigan, Mississippi, New York, North Carolina, Ohio, Oklahoma, Oregon, Pennsylvania, Rhode Island, Texas, Virginia and Washington. The extent that the STAR Maths 2.0 test correlates with these tests provides support for its construct validity. That is, strong and positive correlations between STAR Maths 2.0 and these other instruments provide support for the claim that STAR Maths 2.x effectively measures mathematics achievement.
Tables 14–17 present the correlation coefficients between the scores on the STAR Maths 2.0 test and each of the other test instruments for which data were received. Tables 14 and 15 displays “concurrent validity” data, that is, correlations between STAR Maths 2.0 US Norming Study test scores and other tests administered at close to the same time. Tests listed in Tables 14 and 15 were administered during the spring of 2002, the same quarter in which the STAR Maths 2.0 US Norming Study took place. Tables 16 and 17 displays all other correlations of STAR Maths 2.0 US norming tests and external tests; the external test scores were administered at various times prior to spring 2002 and were obtained from student records.
Subsequent to the introduction of STAR Maths 2.0, some data have become available for analysis of the predictive validity of STAR Maths. Tables 18 and 19 present predictive validity coefficients. Predictive validity provides an estimate of the extent to which scores on the STAR Maths test predicted scores on criterion measures given at a later point in time, operationally defined as more than 2 months between the STAR test (predictor) and the criterion test. It provides an estimate of the linear relationship between STAR scores and scores on measures covering a similar academic domain. Predictive correlations are attenuated by time due to the fact that students are gaining skills in the interim between testing occasions, and also by differences between the tests’ content specifications.

ValidityRelationship of STAR Maths 2.0 Scores to Scores on Other Tests of Mathematics Achievement
67STAR Maths™Technical Manual
Tables 14–19 are presented in two parts. Tables 14, 16 and 18 display validity coefficients for US grades 1–6 and Tables 15, 17 and 19 display the validity coefficients for US grades 7–12. The bottom of each table presents a US grade-by-grade summary, including the total number of students for whom test data were available, the number of validity coefficients for that US grade and the average value of the validity coefficients.
The within-grade average concurrent validity coefficients for grades 1–6 varied from 0.63–0.71, with an overall average of 0.67. The within-grade average concurrent validity for grades 7–12 ranged from 0.47–0.73, with an overall average of 0.68. The other validity coefficient within-grade averages varied from 0.56–0.70; the overall average was 0.63. Predictive validity coefficients ranged from 0.55–0.73 in grades 1–6 with an average of 0.67. In grades 7–12 the predictive validity coefficients ranged from 0.75–0.80, with an average of 0.76.
The process of establishing the validity of a test is laborious, and it usually takes a significant amount of time. As a result, the validation of the STAR Maths test is an ongoing activity, with the target of establishing evidence of the test’s validity for a variety of settings and students. STAR Maths users who collect relevant data are encouraged to contact Renaissance Learning.
Since correlation coefficients are available for many different test editions, forms and dates of administration, many of the tests have several validity coefficients associated with them. Where test data quality could not be verified and when sample size was very small, those data were omitted from the tabulations. Correlations were computed separately on tests according to the unique combination of test edition/form and time when testing occurred. Testing data for other standardised tests administered prior to spring 1998 were excluded from the validity analyses.
In general, these correlation coefficients reflect very well on the validity of the STAR Maths test as a tool for placement in mathematics. In fact, the correlations are similar in magnitude to the validity coefficients of these measures with each other. These validity results, combined with the supporting evidence of reliability and minimisation of SEM estimates for the STAR Maths 2.x test, provide quantitative demonstration of how well this innovative instrument in mathematics achievement assessment performs.

ValidityRelationship of STAR Maths 2.0 Scores to Scores on Other Tests of Mathematics Achievement
68STAR Maths™Technical Manual
Table 14: Concurrent Validity—STAR Maths US 2.0 Correlation Coefficients (r) with External Tests Administered in Spring 2002, US Grades 1–6a
1 2 3 4 5 6
Test Version Date Score n r n r n r n r n r n r
California Achievement Test
CAT 5th Ed. S 02 NCE – – – – 17 0.50* – – – – – –
Comprehensive Test of Basic Skills
CTBS A–13 S 02 SS – – – – – – – – 21 0.66* – –
CTBS S 02 NCE – – – – – – – – – – 32 0.65*
Delaware Student Testing Program—Mathematics
Spr 03 Scaled – – – – 258 0.72* – – 296 0.73* – –
Spr 05 Scaled – – – – 66 0.67* – – – – – –
Spr 06 Scaled – – 140 0.66* 127 0.70* 134 0.56* 151 0.75* 44 0.77*
Florida Comprehensive Assessment Test
Spr 06 SSS – – – – 58 0.85* 40 0.63* – – – –
Idaho Standards Achievement Test
Fall 02 Scaled – – – – 192 0.68* 188 0.75* 194 0.75* 221 0.74*
Spr 03 Scaled – – – – 224 0.74* 209 0.83* 222 0.78* 231 0.82*
Iowa Tests of Basic Skills
ITBS Form A S 02 NCE – – – – – – 50 0.66* 79 0.72* – –
ITBS Form K S 02 SS – – – – – – – – – – 70 0.69*
ITBS Form L S 02 NCE – – 7 0.78* 23 0.57* 17 0.70* 21 0.66* – –
ITBS Form M S 02 NCE 14 0.56* 11 0.58 – – – – – – – –
ITBS Form M S 02 SS – – – – 17 0.72* – – – – – –
McGraw Hill Mississippi/Criterion Referenced
McGraw S 02 SS – – – – – – – – 44 0.73* – –
Metropolitan Achievement Test
MAT 6th Ed. S 02 NCE 69 0.55* – – – – – – – – – –
MAT 8th Ed. S 02 SS – – – – – – 38 0.83* – – – –
Michigan Educational Assessment Program—Mathematics
Fall 04 Scaled – – – – – – 154 0.81* – – – –
Fall 05 Scaled – – – – 71 0.75* 69 0.78* 77 0.83* 89 0.77*
Fall 06 Scaled – – – – 162 0.72* – – 53 0.67* 123 0.69*

ValidityRelationship of STAR Maths 2.0 Scores to Scores on Other Tests of Mathematics Achievement
69STAR Maths™Technical Manual
Minnesota Comprehensive Assessment
Spr 03 Scaled – – – – 85 0.71* – – 81 0.76* – –
Spr 04 Scaled – – – – 91 0.74* – – 83 0.76* – –
Mississippi Curriculum Test (CTB-McGraw Hill)
CTB Miss S 02 SS – – – – – – 10 0.62 – – – –
Spr 03 Scaled – – – – 117 0.71* 154 0.77* 119 0.78* 52 0.43*
North Carolina End of Grade
NCEOG S 02 NCE – – – – 70 0.60* – – – – – –
NCEOG S 02 SS – – – – 62 0.73* – – – – – –
NWEA NALT & MAP
Fall 02 Scaled – – – – 81 0.75* – – 77 0.86* – –
Spr 03 Scaled – – – – 85 0.82* – – 80 0.85* – –
Fall 03 Scaled – – 77 0.69* 92 0.73* 75 0.82* 79 0.86* – –
Spr 04 Scaled – – 80 0.72* 92 0.84* 65 0.84* 82 0.86* – –
Fall 04 Scaled – – – – 63 0.53* 77 0.78* 86 0.84* – –
Spr 05 Scaled – – – – 63 0.74* 80 0.87* 96 0.87* – –
Oklahoma Core Curriculum Test
Spr 06 Scaled – – – – 77 0.71* 92 0.61* 66 0.68* 60 0.63*
Oregon State Assessment
Oregon S 02 SS – – – – – – 73 0.65* – – – –
Pennsylvania System of School Assessment
PSSA S 02 SS – – – – – – – – – – 62 0.76*
Stanford Achievement Test
SAT9 S 02 NCE – – 113 0.56* 39 0.83* 46 0.54* 103 0.70* 49 0.65*
SAT9 S 02 SS 20 0.76* 16 0.68* 18 0.59* 19 0.57* 71 0.49* 84 0.62*
TerraNova
TerraNova S 02 NCE 7 0.66 14 0.46 125 0.68* 18 0.67* 17 0.79* 15 0.64*
Fall 03 Scaled – – 177 0.55* 172 0.45* 119 0.67* 160 0.78* – –
Spr 04 Scaled – – 150 0.75* 205 0.71* 149 0.71* 182 0.78* – –
Table 14: Concurrent Validity—STAR Maths US 2.0 Correlation Coefficients (r) with External Tests Administered in Spring 2002, US Grades 1–6a (Continued)
1 2 3 4 5 6
Test Version Date Score n r n r n r n r n r n r

ValidityRelationship of STAR Maths 2.0 Scores to Scores on Other Tests of Mathematics Achievement
70STAR Maths™Technical Manual
Texas Assessment of Academic Achievement (TAAS)
Spr 01 Scaled – – – – 1,036 0.56* 1,047 0.50* 1,066 0.65* 991 0.61*
Spr02 Scaled – – – – 674 0.65* 669 0.63* 677 0.64* 885 0.64*
Texas Assessment of Knowledge and Skills (TAKS)
Spr 03 Scaled – – – – 1,134 0.63* 1,129 0.62* 1,086 0.70* – –
Summary
US Grade(s) All 1 2 3 4 5 6
Number of students 19,469 110 725 5,596 4,721 5,309 3,008
Number of coefficients
118 4 11 32 26 29 16
Average validity – 0.63 0.66 0.65 0.64 0.71 0.66
Overall average 0.67
a. n = Sample size.* Denotes correlation coefficients that are statistically significant at the 0.05 level.
Table 15: Concurrent Validity—STAR Maths US 2.0 Correlation Coefficients (r) with External Tests Administered in Spring 2002, US Grades 7–12a
7 8 9 10 11 12
Test Version Date Score n r n r n r n r n r n r
Delaware Student Testing Program
Spr 03 Scaled – – 254 0.78* – – – – – – – –
Florida Comprehensive Assessment Test
FCAT S 02 NCE – – – – – – 51 0.64* 57 0.66* 38 0.75*
Idaho Standards Achievement Test
Fall 02 Scaled 206 0.81* 170 0.81* – – – – – – – –
Spr 03 Scaled 227 0.85* 174 0.82* – – – – – – – –
Iowa Tests of Basic Skills
ITBS Form M S 02 SS 37 0.40* – – – – – – – – – –
Michigan Comprehensive Assessment Test
MCAS S 02 SS – – – – – – – – 112 0.66* – –
Table 14: Concurrent Validity—STAR Maths US 2.0 Correlation Coefficients (r) with External Tests Administered in Spring 2002, US Grades 1–6a (Continued)
1 2 3 4 5 6
Test Version Date Score n r n r n r n r n r n r

ValidityRelationship of STAR Maths 2.0 Scores to Scores on Other Tests of Mathematics Achievement
71STAR Maths™Technical Manual
Michigan Educational Assessment Program—Mathematics
Fall 05 Scaled 65 0.72* 71 0.80* – – – – – – – –
Fall 06 Scaled 122 0.84* 123 0.58* – – – – – – – –
New Standards Reference Mathematics Exam (Rhode Island)
NSRME RI S 02 SS – – – – – – – – 67 0.67* 9 0.66
Ohio Proficiency Test
Ohio S 02 SS – – – – 23 0.67* 26 0.40* 24 0.77* 24 0.69*
Oklahoma Core Curriculum Test
Spr 06 Scaled 55 0.63* 68 0.70* – – – – – – – –
Otis Lennon School Ability Test
OLSAT S 02 NCE – – – – – – 12 0.36 13 0.91* 6 0.72
Palmetto Achievement Challenge Test 2001
PACT 2001 S 02 SS – – 161 0.72* – – – – – – – –
Stanford Achievement Test
SAT9 S 02 NCE – – – – – – – – – – 15 0.54*
SAT9 S 02 SS 59 0.57* 9 0.85* – – – – – – – –
Texas Assessment of Academic Achievement (TAAS)
Spr 01 Scaled 892 0.60* 825 0.67* – – – – – – – –
Spr 02 Scaled 768 0.62* 809 0.68* – – – – – – – –
Texas Assessment of Academic Skills, 2001
TAAS 2001 S 02 TLI – – – – 163 0.69* – – – – – –
Summary
US Grade(s) All 7 8 9 10 11 12
Number of students
5,735 2,431 2,664 186 89 273 92
Number of coefficients
34 9 10 2 3 5 5
Average validity – 0.66 0.71 0.68 0.47 0.73 0.67
a. n = Sample size.* Denotes correlation coefficients that are statistically significant at the 0.05 level.
Table 15: Concurrent Validity—STAR Maths US 2.0 Correlation Coefficients (r) with External Tests Administered in Spring 2002, US Grades 7–12a (Continued)
7 8 9 10 11 12
Test Version Date Score n r n r n r n r n r n r

ValidityRelationship of STAR Maths 2.0 Scores to Scores on Other Tests of Mathematics Achievement
72STAR Maths™Technical Manual
Table 16: Other External Validity Data—STAR Maths US 2.0 Correlation Coefficients (r) with External Tests Administered Prior to Spring 2002, US Grades 1–6a
1 2 3 4 5 6
Test Version Date Score n r n r n r n r n r n r
Achievement Level (RIT) Test
RIT F 01 SS – – – – – – – – – – 150 0.69*
California Achievement Test
CAT 5th Ed. S 01 SS – – – – 46 0.52* – – – – – –
Cognitive Abilities Test
CogAT F 00 SS – – – – 41 0.61* – – – – – –
CogAT F 01 SS – – 45 0.73* – – – – – – – –
Comprehensive Test of Basic Skills
CTBS 4th Ed. S 01 GE – – – – – – 43 0.67* – – – –
CTBS A–13 S 00 NCE – – – – – – 65 0.60* – – – –
CTBS A–13 S 00 SS – – – – – – – – 44 0.70* – –
CTBS A–13 S 01 GE – – – – – – – – – – 56 0.69*
CTBS A–13 S 01 NCE – – – – – – – – 67 0.72* – –
CTBS A–13 S 01 SS – – – – – – 42 0.61* – – – –
Connecticut Mastery Test
Conn 2nd F 00 SS – – – – – – – – 35 0.51* – –
Conn 3rd F 01 SS – – – – – – 42 0.64* – – 27 0.52*
Des Moines Public School (US Grade 2 pretest)
DMPS F 01 NCE – – 25 0.76* – – – – – – – –
Educational Development Series
EDS 13C S 01 GE – – – – 30 0.69* – – – – – –
EDS 14C S 00 GE – – – – – – 32 0.44* – – – –
EDS 15C F 01 GE – – – – – – – – 37 0.68* – –
Florida Comprehensive Assessment Test
FCAT S 01 NCE – – – – – – – – 73 0.65* – –

ValidityRelationship of STAR Maths 2.0 Scores to Scores on Other Tests of Mathematics Achievement
73STAR Maths™Technical Manual
Iowa Tests of Basic Skills
ITBS Form A S 01 NCE – – – – 73 0.45* 78 0.65* – – – –
ITBS Form A F 01 NCE – – – – 25 0.41* 25 0.35 23 0.33 86 0.81*
ITBS Form A F 01 SS – – – – – – – – – – 73 0.64*
ITBS Form K F 00 SS – – – – – – – – – – 20 0.92*
ITBS Form K S 01 NCE – – 101 0.67* 74 0.64* 31 0.25 11 0.58 31 0.62*
ITBS Form K F 01 NCE – – – – 10 0.78* 16 0.78* 9 0.54 18 0.63*
ITBS Form K F 01 SS – – – – – – – – 75 0.77* 68 0.71*
ITBS Form L S 01 NCE – – – – 13 0.50 46 0.81* 13 0.73* – –
ITBS Form L S 01 SS – – – – – – 11 0.81* – – – –
ITBS Form L F 01 NCE – – – – – – – – 69 0.66* – –
ITBS Form M S 99 NCE – – – – – – – – – – 19 0.68*
ITBS Form M S 00 NCE – – – – – – – – 28 0.65* – –
ITBS Form M S 01 NCE – – 19 0.81* – – 43 0.78* – – – –
ITBS Form M S 01 SS – – – – 47 0.39* 32 0.55* – – – –
ITBS Form M F 01 NCE 5 0.88* – – – – 15 0.82* – – – –
McGraw Hill Mississippi/Criterion Referenced
McGraw S 01 SS – – – – – – – – 121 0.52* – –
Metropolitan Achievement Test
MAT 7th Ed. F 01 NCE – – – – – – – – – – 15 0.84*
Michigan Education Assessment Program
MEAP S 01 SS – – – – – – – – 88 0.72* – –
Multiple Assessment Series (US Primary Grades)
Multiple S 01 NCE – – 14 0.52 19 0.54* – – – – – –
New York State Maths Assessment
NYSMA S 01 SS – – – – – – – – 50 0.79* – –
North Carolina End of Grade
NCEOG F 01 SS – – – – 85 0.57* – – – – – –
Table 16: Other External Validity Data—STAR Maths US 2.0 Correlation Coefficients (r) with External Tests Administered Prior to Spring 2002, US Grades 1–6a (Continued)
1 2 3 4 5 6
Test Version Date Score n r n r n r n r n r n r

ValidityRelationship of STAR Maths 2.0 Scores to Scores on Other Tests of Mathematics Achievement
74STAR Maths™Technical Manual
Northwest Evaluation Association Levels Test
NWEA S 01 NCE – – – – – – – – 83 0.81* 64 0.78*
NWEA F 01 NCE – – – – 50 0.56* 49 0.54* 99 0.70* – –
Ohio Proficiency Test
Ohio S 01 SS – – – – 113 0.65* – – – – – –
Stanford Achievement Test
SAT9 S 99 SS – – – – – – – – 55 0.65* – –
SAT9 S 00 SS – – – – – – – – – – 15 0.50
SAT9 F 00 NCE – – – – 17 0.84* 20 0.83* – – – –
SAT9 F 00 SS – – – – – – – – – – 46 0.58*
SAT9 S 01 NCE – – – – 43 0.69* – – 50 0.38* – –
SAT9 S 01 SS 64 0.52* – – – – 58 0.41* 52 0.58* 51 0.65*
SAT9 F 01 SS – – – – – – 90 0.54* 32 0.67* 24 0.57*
Tennessee Comprehensive Assessment Program, 2001
TCAP 2001 S 01 SS – – – – – – – – 48 0.56* – –
TerraNova
TerraNova S 00 NCE – – – – – – – – – – 43 0.60*
TerraNova S 00 SS – – – – – – – – 11 0.61* – –
TerraNova F 00 SS – – – – – – – – 108 0.62* – –
TerraNova S 01 NCE – – – – – – – – 69 0.40* 85 0.62*
TerraNova S 01 SS – – – – – – 104 0.50* 62 0.59* 131 0.71*
TerraNova F 01 NCE – – 58 0.38* 63 0.56* 70 0.74* 85 0.61* – –
Test of New York State Standards
TONYSS S 01 SS – – – – 55 0.75* 68 0.47* – – – –
Texas Assessment of Academic Skills
TAAS 2001 S 01 SS – – – – – – 78 0.52* – – – –
TAAS 2001 S 01 TLI – – – – – – – – – – 82 0.42*
Virginia Standards of Learning
Virginia S 00 SS – – – – – – – – 24 0.73* – –
Table 16: Other External Validity Data—STAR Maths US 2.0 Correlation Coefficients (r) with External Tests Administered Prior to Spring 2002, US Grades 1–6a (Continued)
1 2 3 4 5 6
Test Version Date Score n r n r n r n r n r n r

ValidityRelationship of STAR Maths 2.0 Scores to Scores on Other Tests of Mathematics Achievement
75STAR Maths™Technical Manual
Washington Assessment of Student Learning
Wash S 00 SS – – – – – – – – – – 90 0.54*
Wide Range Achievement Test
WRAT III F 01 NCE – – – – – – 44 0.32* 44 0.66* – –
Summary
US Grade(s) All 1 2 3 4 5 6
Number of students 4,996 69 262 804 1,102 1,565 1,194
Number of coefficients
98 2 6 17 23 29 21
Average validity – 0.70 0.65 0.60 0.59 0.62 0.65
Overall average 0.62
a. n = Sample size.* Denotes correlation coefficients that are statistically significant at the 0.05 level.
Table 17: Other External Validity Data—STAR Maths US 2.0 Correlation Coefficients (r) with External Tests Administered Prior to Spring 2002, US Grades 7–12a
7 8 9 10 11 12
Test Version Date Score n r n r n r n r n r n r
American College Testing Program
ACT F 01 NCE – – – – – – – – – – 26 0.87*
California Achievement Tests
CAT 5th Ed. F 01 NCE – – – – 64 0.73* – – – – – –
CAT 5th Ed. F 01 SS 170 0.54* – – – – – – – – – –
Comprehensive Test of Basic Skills
CTBS 4th Ed. S 00 SS 67 0.67* 75 0.73* – – – – – – – –
CTBS A–13 S 00 SS – – 31 0.65* – – – – – – – –
CTBS A–13 S 01 SS 23 0.82* – – – – 48 0.63* – – – –
Delaware Student Testing Program
DSTP S 01 SS – – – – 94 0.27* – – – – – –
Differential Aptitude Tests
DAT Level 1 F 01 NCE – – – – 41 0.70* – – – – – –
Explore Tests
Explore F 01 NCE – – 64 0.54* – – – – – – – –
Table 16: Other External Validity Data—STAR Maths US 2.0 Correlation Coefficients (r) with External Tests Administered Prior to Spring 2002, US Grades 1–6a (Continued)
1 2 3 4 5 6
Test Version Date Score n r n r n r n r n r n r

ValidityRelationship of STAR Maths 2.0 Scores to Scores on Other Tests of Mathematics Achievement
76STAR Maths™Technical Manual
Georgia High School Graduation Test
Georgia S 01 NCE – – – – – – – – – – 23 0.71*
Indiana Statewide Testing for Educational Progress
ISTEP F01 NCE – – – – 51 0.57* 22 0.58* – – – –
Iowa Tests of Basic Skills
ITBS Form A F 01 SS 66 0.71* – – – – – – – – – –
ITBS Form K S 01 NCE 73 0.80* 18 0.52* – – – – – – – –
ITBS Form K F 01 NCE 6 0.72 14 0.69* – – – – – – – –
ITBS Form L S 01 NCE 36 0.74* 32 0.53* – – 19 0.67* 32 0.84* – –
ITBS Form M S 99 NCE – – 5 0.89* – – – – 11 0.80* – –
ITBS Form M S 00 NCE – – – – – – 9 0.94* – – – –
ITBS Form M S 01 NCE 49 0.52* 48 0.51* – – – – – – – –
Kentucky Core Content Test
KCCT S 01 NCE – – – – 45 0.43* – – – – – –
Maryland High School Placement Test
Maryland S 01 NCE – – – – 47 0.60* – – – – – –
McGraw Hill Mississippi/Criterion Referenced
McGraw S 01 SS – – – – 73 0.56* – – – – – –
Metropolitan Achievement Test
MAT 7th Ed. F 01 NCE 5 0.80 11 0.82* – – – – – – – –
North Carolina End of Grade Tests
NCEOG S 01 SS – – 177 0.59* – – – – – – – –
Oklahoma School Testing Program Core Curriculum Tests
Oklahoma S 01 SS – – – – 26 0.67* – – – – – –
Oregon State Assessment
Oregon S 01 NCE 46 0.49* 45 0.53* – – – – – – – –
PLAN
PLAN F 99 SS – – – – – – – – – – 10 0.42
PLAN F 00 SS – – – – – – – – 40 0.28 – –
PLAN F 01 NCE – – – – – – 63 0.61* – – – –
Table 17: Other External Validity Data—STAR Maths US 2.0 Correlation Coefficients (r) with External Tests Administered Prior to Spring 2002, US Grades 7–12a (Continued)
7 8 9 10 11 12
Test Version Date Score n r n r n r n r n r n r

ValidityRelationship of STAR Maths 2.0 Scores to Scores on Other Tests of Mathematics Achievement
77STAR Maths™Technical Manual
Preliminary SAT/National Merit Scholarship Qualifying Test
PSAT/NMSQT NMSQT F 00 NCE – – – – – – – – – – 37 0.63*
PSAT/NMSQT NMSQT F 01 NCE – – – – – – – – 72 0.64* – –
Stanford Achievement Test
SAT9 S 98 NCE 11 0.84* – – – – – – – – – –
SAT9 S 99 NCE 14 0.71* – – – – – – – – – –
SAT9 F 00 SS – – 45 0.85* – – – – – – – –
SAT9 S 01 NCE 45 0.71* 105 0.81* 11 0.69* – – – – – –
SAT9 S 01 SS 54 0.76* 109 0.69* 19 0.27 77 0.59* 67 0.76* 71 0.65*
SAT9 F 01 SS 104 0.84* – – – – – – – – – –
TerraNova
TerraNova S 99 NCE 35 0.61* 47 0.62* – – – – – – – –
TerraNova S 00 SS 18 0.73* – – – – – – – – – –
TerraNova S 01 NCE 17 0.29 17 0.52* – – – – – – – –
TerraNova S 01 SS – – 99 0.74* – – – – – – – –
TerraNova F 01 SS – – 38 0.74* – – – – – – – –
Test of Achievement Proficiency
TAP F 01 NCE – – – – 8 0.70 7 0.70 – – – –
Texas Assessment of Academic Skills, 2001
TAAS 2001 S 01 SS 66 0.44* 69 0.33* – – – – – – – –
Virginia Standards of Learning
Virginia S 00 SS 25 0.71* – – – – – – – – – –
Summary
US Grade(s) All 7 8 9 10 11 12
Number of students 3,066 930 1,049 479 245 222 141
Number of coefficients 66 20 19 11 7 5 4
Average validity – 0.67 0.65 0.56 0.67 0.66 0.60
Overall average 0.64
a. n = Sample size.* Denotes correlation coefficients that are statistically significant at the 0.05 level.
Table 17: Other External Validity Data—STAR Maths US 2.0 Correlation Coefficients (r) with External Tests Administered Prior to Spring 2002, US Grades 7–12a (Continued)
7 8 9 10 11 12
Test Version Date Score n r n r n r n r n r n r

ValidityRelationship of STAR Maths 2.0 Scores to Scores on Other Tests of Mathematics Achievement
78STAR Maths™Technical Manual
Table 18: Predictive Validity Data: STAR Maths Scaled Scores Predicting Later Performance for US Grades 1–6a
Predictor Date
Criterion Dateb
1 2 3 4 5 6
n r n r n r n r n r n r
Delaware Student Testing Program
Fall 02 Spr 03 – – – – 191 0.70* – – 228 0.70* – –
Fall 04 Spr 05 – – – – 171 0.67* – – – – – –
Win 05 Spr 05 – – – – 149 0.76* – – – – – –
Spr 05 Spr 06P – – – – 132 0.64* 172 0.63* 185 0.62* – –
Fall 05 Spr 06 – – 206 0.64* 219 0.66* 249 0.67* 265 0.68* – –
Win 05 Spr 06 – – 242 0.61* 226 0.61* 269 0.62* 277 0.68* – –
Florida Comprehensive Assessment Test
Fall 05 Spr 06 – – – – 54 0.79* 42 0.69* – – – –
Michigan Educational Assessment Program
Fall 04 Fall 05P – – – – – – 64 0.70* 74 0.85* 81 0.74*
Win 05 Fall 05P – – – – – – 65 0.80* 75 0.87* 42 0.72*
Spr 05 Fall 05P – – – – 66 0.63* 65 0.73* 75 0.83* 84 0.71*
Minnesota Comprehensive Assessment
Fall 02 Spr 03 – – – – 81 0.64* – – 78 0.72* – –
Win 03 Spr 03 – – – – 86 0.66* – – 81 0.77* – –
Fall 03 Spr 04 – – – – 87 0.53* – – 79 0.69* – –
Win 04 Spr 04 – – – – 93 0.60* – – 82 0.75* – –
Mississippi Curriculum Test
Fall 02 Spr 03 – – – – 48 0.64* 33 0.82* 73 0.80* – –
Fall 03 Spr 04 – – – – 109 0.51* 164 0.72* 156 0.69* – –
NWEA NALT & MAP
Fall 02 Spr 03 – – – – 80 0.65* – – 77 0.86* – –
Win 03 Spr 03 – – – – 85 0.78* – – 80 0.90* – –
Fall 03 Spr 04 – – – – 86 0.68* 69 0.81* 78 0.87* – –
Win 04 Spr 04 – – – – 92 0.80* 68 0.80* 81 0.93* – –
Oklahoma Core Curriculum Test
Fall 05 Spr 06 – – – – 87 0.71* 88 0.61* 77 0.55* 83 0.56*

ValidityRelationship of STAR Maths 2.0 Scores to Scores on Other Tests of Mathematics Achievement
79STAR Maths™Technical Manual
STAR Maths
Fall 01 Spr 02 – – – – 1,036 0.61* 1,047 0.63* 1,006 0.65* 991 0.65*
Fall 05 Spr 06 2,605 0.50* 7,195 0.63* 11,716 0.67* 13,295 0.69* 10,343 0.70* 6,823 0.75*
Fall 06 Spr 07 4,687 0.58* 12,464 0.62* 16,474 0.66* 17,161 0.70* 16,181 0.71* 12,026 0.73*
Fall 05 Fall 06P 1,147 0.51* 3,181 0.62* 4,894 0.67* 5,254 0.70* 2,164 0.69* 1,474 0.74*
Fall 05 Spr 07P 1,147 0.42* 3,181 0.57* 4,894 0.62* 5,254 0.64* 2,164 0.65* 1,474 0.73*
Spr 06 Fall 06P 1,147 0.66* 3,181 0.69* 4,894 0.73* 5,254 0.74* 2,164 0.73* 1,474 0.80*
Spr 06 Spr 07P 1,147 0.62* 3,181 0.63* 4,894 0.69* 5,254 0.70* 2,164 0.71* 1,474 0.78*
Texas Assessment of Academic Achievement (TAAS)
Fall 01 Spr 02 – – – – 1,036 0.51* 1,047 0.42* 1,006 0.60* 991 0.61*
Texas Assessment of Knowledge and Skills (TAKS)
Fall 02 Spr 03 – – – – 262 0.64* 135 0.49* 228 0.70* 646 0.69*
TerraNova
Fall 03 Spr 04 – – 117 0.69* 165 0.58* 116 0.75* 154 0.54* – –
Win 04 Spr 04 – – 128 0.58* 197 0.47* 120 0.71* 173 0.77* – –
Summary
Grade(s) All 1 2 3 4 5 6
Number of students
219,837 11,880 33,076 52,604 55,285 39,869 27,663
Number of coefficients
111 6 10 30 23 29 13
Average validity
– 0.55 0.63 0.66 0.69 0.70 0.73
Overall validity
0.67
a. Grade given in the column signifies the grade within which the Predictor variable was given (as some validity estimates span contiguous grades).
b. P indicates a criterion measure was given in a subsequent grade from the predictor.* Denotes significant correlation (p < 0.05).
Table 18: Predictive Validity Data: STAR Maths Scaled Scores Predicting Later Performance for US Grades 1–6a (Continued)
Predictor Date
Criterion Dateb
1 2 3 4 5 6
n r n r n r n r n r n r

ValidityRelationship of STAR Maths 2.0 Scores to Scores on Other Tests of Mathematics Achievement
80STAR Maths™Technical Manual
Table 19: Predictive Validity Data: STAR Maths Scaled Scores Predicting Later Performance for US Grades 7–12a
Predictor DateCriterion
Dateb
7 8 9 10 11 12
n r n r n r n r n r n r
Delaware Student Testing Program
Fall 02 Spr 03 242 0.74* – – – – – – – – – –
Spr 05 Spr 06P 227 0.71* 175 0.75* – – – – – – – –
Michigan Educational Assessment Program—Mathematics
Fall 04 Fall 05P 56 0.78* – – – – – – – – – –
Win 05 Fall 05P 56 0.78* – – – – – – – – – –
Spr 05 Fall 05P 37 0.86* – – – – – – – – – –
Oklahoma Core Curriculum Test
Fall 06 Spr 06 74 0.57* 70 0.67* – – – – – – – –
STAR Maths
Fall 01 Spr 02 892 0.72* 825 0.78* – – – – – – – –
Fall 05 Spr 06 3,551 0.75* 2,693 0.76* 668 0.79* 508 0.79* 572 0.79* 378 0.76*
Fall 06 Spr 07 7,564 0.76* 7,122 0.77* 1,017 0.78* 876 0.76* 693 0.83* 507 0.77*
Fall 05 Fall 06P 1,191 0.75* 127 0.84* 215 0.78* 213 0.83* 164 0.75* – –
Fall 05 Spr 07P 1,191 0.71* 127 0.77* 215 0.78* 213 0.81* 164 0.75* – –
Spr 06 Fall 06P 1,191 0.79* 127 0.82* 215 0.80* 213 0.85* 164 0.79* – –
Spr 06 Spr 07P 1,191 0.77* 127 0.82* 215 0.76* 213 0.82* 164 0.77* – –
Texas Assessment of Academic Achievement (TAAS)
Fall 01 Spr 02 892 0.59* 825 0.67* – – – – – – – –
Texas Assessment of Knowledge and Skills (TAKS)
Fall 02 Spr 03 564 0.74* 562 0.74* – – – – – – – –
Summary
Grade(s) All 7 8 9 10 11 12
Number of students 39,286 18,919 12,780 2,545 2,236 1,921 885
Number of coefficients
46 15 11 6 6 6 2
Average validity – 0.75 0.76 0.78 0.79 0.80 0.77
Overall validity 0.76
a. Grade given in the column signifies the grade within which the Predictor variable was given (as some validity estimates span contiguous grades).
b. P indicates a criterion measure was given in a subsequent grade from the predictor.* Denotes significant correlation (p < 0.05).

ValidityMeta-Analysis of the STAR Maths Validity Data
81STAR Maths™Technical Manual
Meta-Analysis of the STAR Maths Validity DataMeta-analysis is a set of statistical procedures that combines results from different sources or studies. When applied to a set of correlation coefficients that estimate test validity, meta-analysis combines the observed correlations and sample sizes to yield estimates of overall validity, as well as standard errors and confidence intervals, both overall and within US grades. To conduct a meta-analysis of the STAR Maths validity data, the 276 correlations first reported in the STAR Maths 2.0 Technical Manual were combined and analysed using a fixed effects model for meta-analysis. The results are displayed in Table 20. The table lists results for the correlations within each US grade, as well as results with all twelve US grades’ data combined. For each set of results, the table lists an estimate of the true validity, a standard error and the lower and upper limits of a 95 per cent confidence interval for the validity coefficient.
Using the 276 correlation coefficients, the overall estimate of the validity of STAR Maths is 0.64, with a standard error of 0.005. The true validity is estimated to lie within the range of 0.63 to 0.65, with a 95 per cent confidence level.
The probability of observing the 276 correlations reported in Tables 14–17, if the true validity were zero, is virtually zero. Because the 276 correlations were obtained with widely different tests and among students from twelve different US grades, these results provide support for the validity of STAR Maths as a measure of maths skills.
Table 20: Results of the Meta-Analysis of STAR Maths US 2.0 Correlations with Other Tests
US Grade
Effect Size 95% Confidence Interval
Validity Estimate
Standard Error Lower Limit Upper Limit
1 0.58 0.05 0.48 0.68
2 0.61 0.03 0.55 0.67
3 0.61 0.02 0.58 0.65
4 0.59 0.02 0.55 0.62
5 0.64 0.01 0.61 0.67
6 0.66 0.01 0.64 0.67
7 0.64 0.02 0.60 0.68
8 0.65 0.02 0.62 0.69
9 0.57 0.03 0.52 0.63
10 0.60 0.04 0.53 0.67
11 0.68 0.03 0.62 0.72
12 0.68 0.03 0.61 0.75
All US Grades 0.64 0.00 0.63 0.65

ValidityRelationship of STAR Maths 2.0 Scores to Teacher Ratings
82STAR Maths™Technical Manual
Relationship of STAR Maths 2.0 Scores to Teacher RatingsIn order to have a common measure of each student’s maths skills independent of STAR Maths 2.0, Renaissance Learning constructed two 12-item checklists for teachers to use during the US Norming Study.
On this worksheet, teachers were asked to rate each student’s ability to complete a wide range of tasks related to developing maths skills. The intent of this checklist was to provide teachers with a single, brief instrument they could use to rate any student.
For simplicity, two rating forms were developed: one for US grades 1–5 and another for US grades 6–12. This section presents the skills rating instrument itself, its psychometric properties as observed in the US Norming Study and the relationship between student skills ratings on the instrument and their Scaled Scores on STAR Maths 2.0.
The Rating Instruments
To gather ratings of maths skills from teachers, these instruments were intended to specify a sequence of skills that the teacher could quickly assess for each student and were ordered such that a student who could correctly perform the nth skill in the list could almost certainly perform all of the preceding skills correctly as well. Such a list, even though quite short, provided a reliable method for sorting students from US first–twelfth grade into an ordered set of maths skill categories.
To construct the two ratings instruments, nineteen skill-related items were written, ranked from easiest to hardest and assembled into two rating instruments. The first twelve items—the twelve easiest skills—formed the rating instrument used for US grades 1–5. The eighth through the nineteenth items—the twelve hardest skills—made up the instrument used for US grades 6–12.
Teachers were asked to dichotomously rate their students participating in the STAR Maths 2.0 US Norming Study on each skill using the rating form appropriate to the student’s US grade. To assist with this process, the US Norming Study software incorporated a feature enabling it to print a ratings worksheet for each participating US grade. The printed ratings worksheet consisted of a checklist of the twelve skill-related performance tasks, pre-printed with the names of the participating students. To complete the instrument, teachers had to simply mark, for each student, any task they believed the student could perform. The items forming both rating forms are shown on the following two pages.

ValidityRelationship of STAR Maths 2.0 Scores to Teacher Ratings
83STAR Maths™Technical Manual
US Grade 1–5 Math Skills Rating WorksheetSTAR Math 2.0 Norming for Grades 1–5
Sorted by: Student Name School Name: _____________________________________
Primary Contact: __________________________________
In the table below, please identify which of the following tasks each of your students can probably do correctly.
1. Identify the longest pencil among 3 pencils of different lengths.2. Add 2 to 4.3. State how many cents a dime is worth.4. Determine the number that shows “ones” in 162.5. Subtract 7 from 35.6. Determine the number that follows in the sequence 2, 6, 10, 14, ____.7. Divide 18 by 3.8. Write 78,318 in expanded form.9. Read aloud the word name for 0.914.
10. Solve the problem 4/9 + 8/9.11. Translate the statement “36 divided by a number is 12” into an equation. 12. Divide 11,540 by 577.
Renaissance Learning, Inc. and its subsidiaries maintain high standards of confidentiality with all data acquired for research and development purposes. Renaissance Learning assures you that all school and student data derived from these activities will only be used for research and development purposes that are intended to validate and/or improve design specifications for general product release into the education market. Individual teacher and student names, grades and ages will be kept strictly confidential; access to this data will be limited to personnel with relevant research and development responsibilities.
Mark an “X” for the tasks that each student probably can do correctlyand an “O” for the tasks that each student probably cannot do correctly:
Student No. Student Name 1 2 3 4 5 6 7 8 9 10 11 12
Not Rated
1 Bartles, Amanda2 Bowers, Erica3 Driggon, Haley4 Edmond, Mason5 Edwards, Robert6 Halstead, Matthew7 Jackson, Wesley8 Kendricks, Marcy9 Lyons, Freda
10 Renquist, Ryan

ValidityRelationship of STAR Maths 2.0 Scores to Teacher Ratings
84STAR Maths™Technical Manual
US Grade 6–12 Math Skills Rating WorksheetSTAR Math 2.0 Norming for Grades 6–12
Sorted by: Student Name School Name: _____________________________________
Primary Contact: __________________________________
In the table below, please identify which of the following tasks each of your students can probably do correctly.
1. Write 78,318 in expanded form.2. Read aloud the word name for 0.914.3. Solve the problem 4/9 + 8/9.4. Translate the statement “36 divided by a number is 12” into an equation.5. Divide 11,540 by 577.6. Solve a word problem requiring the calculation of proportions.7. Solve the problem “14 is 50% of what number?”8. Solve a word problem requiring the calculation of 80% of 112.9. Simplify the expression (x + 1)(x + 4)
10. Solve the equation x2 = 16x.11. Calculate vertical and supplementary angles.12. Determine 6–2.
Renaissance Learning, Inc. and its subsidiaries maintain high standards of confidentiality with all data acquired for research and development purposes. Renaissance Learning assures you that all school and student data derived from these activities will only be used for research and development purposes that are intended to validate and/or improve design specifications for general product release into the education market. Individual teacher and student names, grades and ages will be kept strictly confidential; access to this data will be limited to personnel with relevant research and development responsibilities.
Mark an “X” for the tasks that each student probably can do correctlyand an “O” for the tasks that each student probably cannot do correctly:
Student No. Student Name 1 2 3 4 5 6 7 8 9 10 11 12
Not Rated
1 Bailey, Amanda2 Blake, Erica3 Duey, Haley4 Eaton, Mason5 Erlings, Robert6 Gable, Matthew7 James, Wesley8 Koore, Marcy9 Lipton, Freda
10 Taylor, Ryan

ValidityRelationship of STAR Maths 2.0 Scores to Teacher Ratings
85STAR Maths™Technical Manual
Psychometric Properties of the Skills Ratings
Teachers completed skills ratings for 17,326 of the 29,185 students in the US norms group. The skills rating items were calibrated on an IRT scale using the Rasch model, with item parameters from both levels placed on a common scale. This allowed the skills ratings for students at both levels to be assigned a score on the same Rasch metric.
The resulting Rasch scores ranged from –14.47 to 11.1. The lower value corresponds to students in US grades 1 to 5 rated as possessing none of the maths skills, and the higher value corresponds to students in US grades 6–12 rated as possessing all of them. Table 21 lists data about the psychometric properties of the rating scale, overall and by US grade, including the correlations between skills ratings and STAR Maths 2.0 Scaled Scores. The internal consistency reliability of the rating scale was estimated as 0.93, using Cronbach’s alpha.
Relationship of STAR Maths 2.0 Scaled Scores to Maths Skills Ratings
As the data in Table 21 show, the mean scaled skills ratings increased directly with US grade, from 6.6 at US grade 1 to 10.03 at US grade 12. The correlation between the skills ratings and STAR Maths 2.0 Scaled Scores was significant at
Table 21: Psychometric Characteristics of the Skills Rating Scale and its Relationship to Scaled Scores, by US Grade
Skills RatingSTAR Maths 2.0
Scaled Score
Correlation of Skills Ratings and Scaled Scoresa
a. Asterisks denote correlation coefficients that are statistically significant at the 0.05 level.
US Grade N MeanStandard Deviation Mean
Standard Deviation
1 1,916 –6.60 2.95 385 89 0.40*
2 2,043 –3.67 2.41 503 84 0.47*
3 1,817 0.04 3.06 589 87 0.52*
4 1,820 1.26 2.83 651 90 0.58*
5 2,072 2.97 2.84 713 97 0.50*
6 1,637 5.50 2.07 763 100 0.44*
7 1,465 5.57 2.18 785 109 0.50*
8 1,639 6.96 2.50 811 117 0.54*
9 1,036 6.88 2.87 798 110 0.52*
10 688 8.78 2.38 824 119 0.38*
11 737 9.81 2.30 847 123 0.39*
12 456 10.03 2.05 876 127 0.42*
Overall 17,326 2.42 5.60 672 177 0.85*

ValidityRelationship of STAR Maths 2.0 Scores to Teacher Ratings
86STAR Maths™Technical Manual
every US grade level. The overall correlation was 0.85, indicating a substantial degree of relationship between the computer-adaptive STAR Maths 2.x test and teachers’ ratings of their students’ maths skills.
Figure 3 displays the relationships of each of the nineteen rating scale items to STAR Maths 2.0 Scaled Scores. These relationships were obtained by fitting mathematical models to the response data for each of the rating items. Each of the curves in the figure is a graphical depiction of the respective model. As the curves show, the proportion of students rated as possessing each of the 19 rated skills increases with the STAR Maths 2.0 Scaled Score.
Figure 3: The Relationship of Teachers’ Ratings of Student Maths Skills to STAR Maths Scaled Scores
The relative positions of the curves provide one indication of the relative difficulty of the 19 rated skills. The rating items’ Rasch difficulty parameters, displayed in Table 22 on the next page, provide a somewhat different indication; the skills rating items are listed in the table from easiest to most difficult, by Rasch difficulty. The first column of Table 22 indicates the relative difficulty of the nineteen rating items, where relative difficulty 1 is the easiest and 19 is most difficult. The second and third columns list the item numbers and text of the skills rating items. The fourth column lists the Rasch difficulty scale value for each item. The fifth column lists the correlations between students’ ratings and their STAR Maths 2.0 Scaled Scores.

ValidityRelationship of STAR Maths 2.0 Scores to Teacher Ratings
87STAR Maths™Technical Manual
Notice that the first two rating scale items (“Identify the longest pencil among 3 pencils of different lengths” and “Add 2 to 4”) had extremely low Rasch difficulty indices and correlations with Scaled Scores that were near zero. As can be seen in Figure 3, these items were endorsed for nearly 100% of the students, regardless of their STAR Maths 2.0 Scaled Scores.
As a result, they did not discriminate among students with high and low levels of developed maths ability, as measured by the STAR Maths 2.0 test.
Although teachers endorsed items 3–6 somewhat less often than items 1 and 2, they still considered these maths tasks relatively easy for their students to
Table 22: The Nineteen Rating Scale Items Listed in Order of Difficulty with Rasch Difficulty Parameters
Relative Difficulty Item Rating Scale ItemRasch
DifficultyCorrelation with
Scaled Scorea
a. Asterisks denote correlation coefficients that are statistically significant at the 0.05 level.
Easiest—1
Most Difficult—19
1 Identify the longest pencil among 3 pencils of different lengths.
–14.58 0.06*
2 Add 2 to 4. –14.30 0.09*
3 State how many cents a dime is worth. –10.28 0.26*
4 Determine the number that shows “ones” in 162. –7.26 0.43*
5 Subtract 7 from 35. –6.12 0.55*
6 Determine the number that follows in the sequence 2, 6, 10, 14, ____.
–5.42 0.49*
7 Divide 18 by 3. –1.85 0.71*
8 Write 78,318 in expanded form. 1.22 0.67*
10 Solve the problem 4/9 + 8/9. 2.09 0.70*
9 Read aloud the word name for 0.914. 2.51 0.70*
11 Translate the statement “36 divided by a number is 12” into an equation.
2.59 0.67*
12 Divide 11,540 by 577. 3.89 0.68*
14 Solve the problem “14 is 50% of what number?” 4.54 0.40*
15 Solve a word problem requiring the calculation of 80% of 112.
4.75 0.34*
13 Solve a word problem requiring the calculation of proportions.
5.12 0.35*
18 Calculate vertical and supplementary angles. 6.85 0.35*
16 Simplify the expression (x + 1)(x + 4). 8.10 0.37*
19 Determine 6–2. 9.03 0.36*
17 Solve the equation x2 = 16x. 9.12 0.33*

ValidityRelationship of STAR Maths 2.0 Scores to Teacher Ratings
88STAR Maths™Technical Manual
complete. The correlations with STAR Maths 2.0 Scaled Scores for items 3–6 were higher than those for the first two items, but still only moderate. This may have occurred because the skills associated with items 3–6 are almost completely mastered (defined as 80% proficiency) by a student obtaining a STAR Maths 2.0 Scaled Score of 500.
Teachers’ responses to items 7–12 suggest that their corresponding maths tasks are considerably more difficult for their students to complete. This is reflected both in their Rasch difficulty parameters in Table 22 and in Figure 3. The figure suggests that mastery of these skills occurs between 700 and 800 on the STAR Maths 2.0 Score Scale. The slopes of the curves for these are all steep relative to other skills items, suggesting that these skills develop rapidly, compared to the others. The correlations between these items and Scaled Scores support this hypothesis, as items 7–12 show the highest correlations with STAR Maths 2.0 Scaled Scores.
Items 13–19 measure the most difficult of the skills. This is indicated by their Rasch difficulty parameters in Table 22 and is also confirmed by the locations at which 80% mastery occurs, illustrated in Figure 3, which suggests that these skills develop much later than all others. In fact, all students may not master these skills. Moreover, all of these items have only moderate correlations with STAR Maths 2.0 Scaled Scores, suggesting that growth of these skills is relatively gradual.

89STAR Maths™Technical Manual
Norming
The data for this standardisation were mostly gathered during the academic year 2009–2010, starting August 1, 2009, although much of the data came before this, going back to 2006).
Before the norming process could begin, the data needed cleaning.
The STAR Maths test scores were scaled to create a standard score, which centred the mean scores by age. We followed these steps:
1. First, we deleted entries for any schools outside the UK and for those students whose raw test score was below 5 and rounded decimal places to whole numbers.
2. Next, we calculated the age in months of students when tested using the difference between their date of birth and their age at the time of testing.
3. Next, using the raw test score we generated standardised test scores. This standardised score is a scaling of the raw score which has an average of 100 points and a standard deviation of 15 test points for each age by month on the day of the test.
4. Next, using the transformation in the previous step we created a table of conversion of Raw Test score to Standardised Scores per age in months.
5. Finally, we constructed a table which gives percentile ranks for the Standardised Score including 90% confidence interval (see Table 26).
Sample Characteristics
Regional Distribution
We considered whether the regional distribution of Scaled Scores was proportionally representative of the school population of these regions in the UK. Table 23 gives the distribution of tests by region (with the number in each region expressed as a percentage of the total number of tests in all regions), then the school population of the regions.

NormingSample Characteristics
90STAR Maths™Technical Manual
Overall, in primary, the vast majority of test scores come from the Southeast region. In primary, the Southwest has more cases than the North. In secondary, scores are equally likely to come from the Southeast and North regions. Scotland is very under-represented in both categories. These differences are highly statistically significant.
In primary the Southeast is very much above the expected numbers, even though the Southeast is the biggest region. In secondary both Southeast and North are above the expected numbers.
Consequently, we cannot say with certainty that the standardisation equally represents all areas of the UK. However, it is not unusual for standardisations to be done which do not represent all areas of the UK.
Standardised Scores
Student age at time of testing in Years and Months was established by subtracting their date of testing from their date of birth. Students within the same Month of age were treated as equal and aggregated.
All students with a given month had their test scores analysed and a new variable of Standardised Score was created with a mean of 100, a standard deviation of 15, and consistent and regular psychometric properties.
Table 24 is a list of all ages in Years:Months with the number of students (frequencies) who were at each Month of Age. It is evident that much younger and much older students were not well represented. There were less than 100 students at every age below 7:05, and at every age above 13:07. These limits
Table 23: Distribution of Test Results by Region
Region
TotalNorth Scotland Southeast Southwest
Distribution of Tests
Primary School 829 234 12,593 1,341 14,997
5.53% 1.56% 83.97% 8.94% 100%
Secondary School 3,951 216 4,493 678 9,338
42.31% 2.31% 48.12% 7.26% 100%
Total 4,780 450 17,086 2,019 24,335
19.64% 1.85% 70.21% 8.3% 100%
School Population of Regions
Primary School 1,509,674 703,781 1,587,115 1,397,178 5,197,748
Secondary School 1,272,036 581,914 1,340,884 1,252,343 4,447,177
Total 2,781,710 1,285,695 2,927,999 2,649,521 9,644,925

NormingSample Characteristics
91STAR Maths™Technical Manual
are markedly worse than is the case for the norming study for STAR Reading. By contrast, at the age of 11:10, there were 366 students for STAR Maths, compared to 22,981 students for STAR Reading). At extremes of age the standardisation may not be entirely reliable owing to small numbers of students.
Table 24: Number of Students at Each Month of Age
Age in Months
Number of
StudentsAge in
Months
Number of
StudentsAge in
Months
Number of
StudentsAge in
Months
Number of
Students
6:01 10 9:00 193 12:00 323 15:00 36
6:02 31 9:01 191 12:01 261 15:01 38
6:03 37 9:02 207 12:02 280 15:02 46
6:04 36 9:03 228 12:03 267 15:03 37
6:05 28 9:04 222 12:04 247 15:04 30
6:06 28 9:05 244 12:05 246 15:05 88
6:07 34 9:06 224 12:06 269 15:06 48
6:08 35 9:07 244 12:07 222 15:07 43
6:09 28 9:08 260 12:08 205 15:08 40
6:10 39 9:09 258 12:09 248 15:09 19
6:11 36 9:10 445 12:10 210 15:10 22
7:00 55 9:11 256 12:11 211 15:11 23
7:01 70 10:00 323 13:00 195 16:00 24
7:02 75 10:01 297 13:01 189 16:01 32
7:03 79 10:02 296 13:02 165 16:02 23
7:04 85 10:03 260 13:03 143 16:03 13
7:05 102 10:04 256 13:04 159 16:04 7
7:06 121 10:05 276 13:05 104 16:05 2
7:07 110 10:06 254 13:06 99 16:06 5
7:08 126 10:07 222 13:07 110
7:09 121 10:08 223 13:08 95
7:10 127 10:09 202 13:09 95
7:11 135 10:10 268 13:10 62
8:00 141 10:11 178 13:11 59
8:01 150 11:00 209 14:00 66
8:02 165 11:01 208 14:01 41

NormingSample Characteristics
92STAR Maths™Technical Manual
Within Table 24, only existing Standard Scores based on the data have been inserted—it is possible to extrapolate and insert others at intermediate points to smooth the scale, but these intermediate points would be guesses not based on data.
How Standardised Scores Are Calculated for Students
Standardised Scores are very commonly used in tests. The average is 100 and the standard deviation (a measure of variance) is 15. Standardised Scores are very precise and psychometrically regular. This is less true of other measures of mathematics skill (see below).
The STAR Maths test automatically gives you a Scaled Score. The age of the student is calculated to the Year and Month at the date of testing by subtracting the student’s date of birth from the date of testing.
Table 25 has categories of Scaled Scores (at 50-point intervals) down the left hand column and the Age of the Student at Date of Testing in Years and Month across the top row (at one-year intervals, data from the second month of each year). This is a small subset of the available data, which shows all Scaled Score values from 1–1400 and age categories ranging from 4:02–17:07.
Considering the Year:Month and Scaled Score you have for a student, you would find the Scaled Score in the left-hand column and the Year:Month in the top row. Look across from the Scaled Score and down from the Year:Month to the cell where these two lines meet. In that cell you would find the Standardised Score for that student’s performance.
8:03 148 11:02 226 14:02 51
8:04 157 11:03 247 14:03 48
8:05 160 11:04 275 14:04 39
8:06 152 11:05 280 14:05 47
8:07 169 11:06 253 14:06 34
8:08 157 11:07 290 14:07 34
8:09 177 11:08 305 14:08 49
8:10 183 11:09 305 14:09 41
8:11 204 11:10 366 14:10 38
11:11 355 14:11 44
Table 24: Number of Students at Each Month of Age (Continued)
Age in Months
Number of
StudentsAge in
Months
Number of
StudentsAge in
Months
Number of
StudentsAge in
Months
Number of
Students
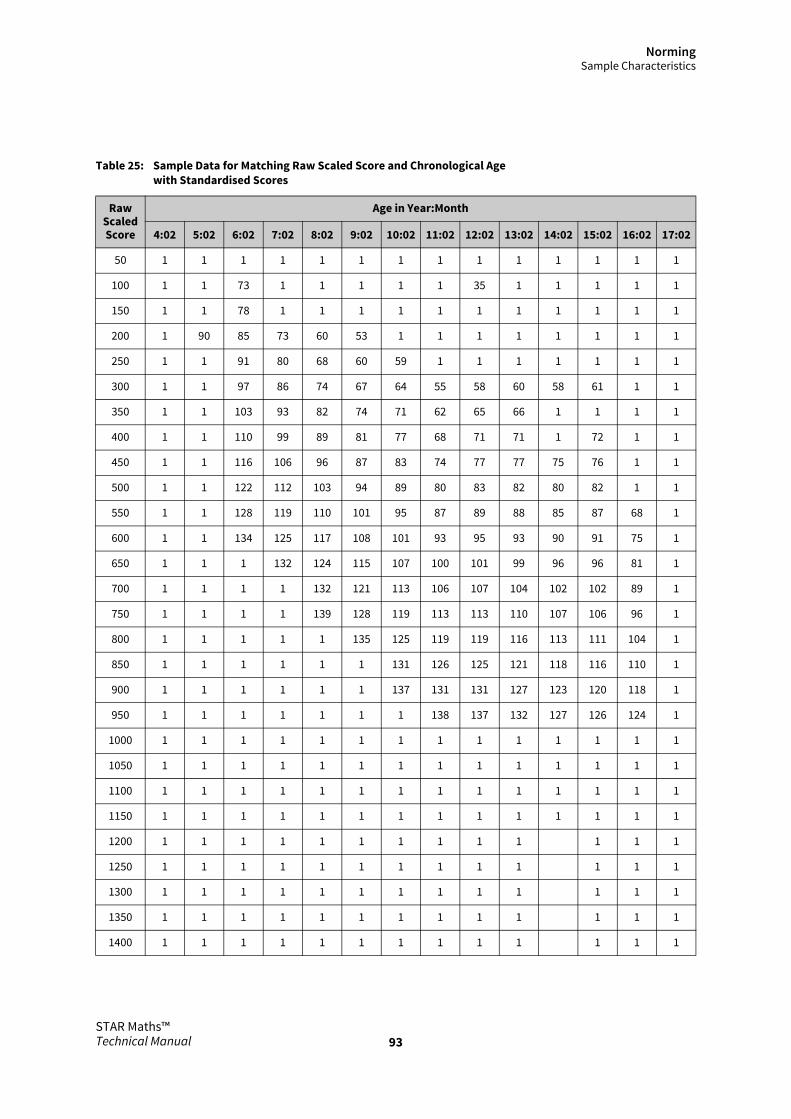
NormingSample Characteristics
93STAR Maths™Technical Manual
Table 25: Sample Data for Matching Raw Scaled Score and Chronological Age with Standardised Scores
Raw Scaled Score
Age in Year:Month
4:02 5:02 6:02 7:02 8:02 9:02 10:02 11:02 12:02 13:02 14:02 15:02 16:02 17:02
50 1 1 1 1 1 1 1 1 1 1 1 1 1 1
100 1 1 73 1 1 1 1 1 35 1 1 1 1 1
150 1 1 78 1 1 1 1 1 1 1 1 1 1 1
200 1 90 85 73 60 53 1 1 1 1 1 1 1 1
250 1 1 91 80 68 60 59 1 1 1 1 1 1 1
300 1 1 97 86 74 67 64 55 58 60 58 61 1 1
350 1 1 103 93 82 74 71 62 65 66 1 1 1 1
400 1 1 110 99 89 81 77 68 71 71 1 72 1 1
450 1 1 116 106 96 87 83 74 77 77 75 76 1 1
500 1 1 122 112 103 94 89 80 83 82 80 82 1 1
550 1 1 128 119 110 101 95 87 89 88 85 87 68 1
600 1 1 134 125 117 108 101 93 95 93 90 91 75 1
650 1 1 1 132 124 115 107 100 101 99 96 96 81 1
700 1 1 1 1 132 121 113 106 107 104 102 102 89 1
750 1 1 1 1 139 128 119 113 113 110 107 106 96 1
800 1 1 1 1 1 135 125 119 119 116 113 111 104 1
850 1 1 1 1 1 1 131 126 125 121 118 116 110 1
900 1 1 1 1 1 1 137 131 131 127 123 120 118 1
950 1 1 1 1 1 1 1 138 137 132 127 126 124 1
1000 1 1 1 1 1 1 1 1 1 1 1 1 1 1
1050 1 1 1 1 1 1 1 1 1 1 1 1 1 1
1100 1 1 1 1 1 1 1 1 1 1 1 1 1 1
1150 1 1 1 1 1 1 1 1 1 1 1 1 1 1
1200 1 1 1 1 1 1 1 1 1 1 1 1 1
1250 1 1 1 1 1 1 1 1 1 1 1 1 1
1300 1 1 1 1 1 1 1 1 1 1 1 1 1
1350 1 1 1 1 1 1 1 1 1 1 1 1 1
1400 1 1 1 1 1 1 1 1 1 1 1 1 1

NormingSample Characteristics
94STAR Maths™Technical Manual
Note that for very young and very old students the standardisation was based on smaller numbers of students. Consequently at these ages (below 6.01 and above 16.06) you will not find a Standardised Score in each cell. Here you will have to extrapolate—look at the Standardised Scores in the nearest occupied cell above and below and work out an average between them which reflects how far away each score was from the empty cell you are interested in.
Remember that if a student gets a Standardised Score of 100 at the current testing and then a Standardised Score of 100 one year later, it means that the student’s mathematics skill has progressed at a normal pace, since the standardisation automatically accounts for natural rates of progress.
Percentile Ranks (PR)
From the Standardised Scores, Percentile Ranks were developed (see Table 26). All Percentile Ranks from 1 to 100 are listed with the mean Standardised Score which goes with each item. For each Percentile Rank, the 90% Confidence Limits are also given.
Table 26: Percentile Ranks Developed from Mean Standardised Scores
Percentile Standard ScoreStd. Dev.
90% Confidence Interval Percentile Standard Score
Std. Dev.
90% Confidence Interval
1 53 5.78 52.74 54.14 51 100 0.10 100.40 100.42
2 64 1.61 63.61 64.00 52 101 0.10 100.74 100.76
3 68 0.87 67.65 67.87 53 101 0.10 101.10 101.13
4 71 0.81 70.80 70.99 54 101 0.11 101.46 101.49
5 73 0.66 73.32 73.48 55 102 0.13 101.88 101.92
6 75 0.49 75.40 75.52 56 102 0.09 102.27 102.29
7 77 0.46 76.97 77.08 57 103 0.11 102.62 102.65
8 78 0.34 78.36 78.45 58 103 0.12 103.00 103.03
9 80 0.35 79.54 79.62 59 103 0.10 103.38 103.40
10 81 0.28 80.64 80.71 60 104 0.12 103.73 103.76
11 82 0.27 81.62 81.69 61 104 0.14 104.17 104.20
12 83 0.23 82.55 82.61 62 105 0.11 104.58 104.60
13 83 0.24 83.40 83.46 63 105 0.12 105.00 105.03
14 84 0.19 84.12 84.16 64 105 0.12 105.42 105.45
15 85 0.18 84.75 84.79 65 106 0.13 105.81 105.84
16 85 0.19 85.39 85.43 66 106 0.13 106.26 106.30
17 86 0.16 86.03 86.07 67 107 0.11 106.71 106.74
18 87 0.19 86.61 86.66 68 107 0.14 107.13 107.17
19 87 0.16 87.24 87.28 69 108 0.14 107.61 107.64

NormingSample Characteristics
95STAR Maths™Technical Manual
20 88 0.15 87.80 87.83 70 108 0.14 108.06 108.10
21 88 0.14 88.32 88.35 71 109 0.14 108.54 108.58
22 89 0.15 88.81 88.84 72 109 0.16 109.06 109.10
23 89 0.13 89.33 89.36 73 110 0.13 109.57 109.60
24 90 0.15 89.82 89.86 74 110 0.15 110.05 110.09
25 90 0.13 90.33 90.36 75 111 0.15 110.57 110.61
26 91 0.12 90.76 90.79 76 111 0.16 111.09 111.13
27 91 0.13 91.20 91.23 77 112 0.15 111.59 111.63
28 92 0.13 91.66 91.69 78 112 0.15 112.11 112.15
29 92 0.13 92.14 92.17 79 113 0.16 112.63 112.67
30 93 0.14 92.59 92.63 80 113 0.17 113.20 113.24
31 93 0.12 93.05 93.08 81 114 0.17 113.75 113.79
32 93 0.11 93.45 93.48 82 114 0.13 114.28 114.31
33 94 0.11 93.83 93.86 83 115 0.13 114.70 114.73
34 94 0.12 94.25 94.27 84 115 0.14 115.18 115.22
35 95 0.11 94.65 94.67 85 116 0.13 115.64 115.67
36 95 0.13 95.02 95.05 86 116 0.16 116.13 116.17
37 95 0.11 95.40 95.43 87 117 0.15 116.67 116.71
38 96 0.12 95.77 95.80 88 117 0.15 117.19 117.23
39 96 0.11 96.15 96.18 89 118 0.16 117.73 117.77
40 97 0.10 96.53 96.56 90 118 0.17 118.27 118.31
41 97 0.10 96.89 96.91 91 119 0.17 118.85 118.89
42 97 0.09 97.22 97.24 92 120 0.23 119.53 119.58
43 98 0.11 97.57 97.59 93 120 0.21 120.31 120.36
44 98 0.10 97.95 97.97 94 121 0.30 121.10 121.17
45 98 0.09 98.29 98.31 95 122 0.32 122.20 122.28
46 99 0.10 98.65 98.67 96 123 0.37 123.26 123.35
47 99 0.11 99.02 99.05 97 125 0.46 124.64 124.76
48 99 0.09 99.36 99.39 98 127 0.59 126.50 126.65
49 100 0.10 99.71 99.73 99 129 1.10 129.12 129.39
50 100 0.11 100.06 100.08
Table 26: Percentile Ranks Developed from Mean Standardised Scores (Continued)
Percentile Standard ScoreStd. Dev.
90% Confidence Interval Percentile Standard Score
Std. Dev.
90% Confidence Interval
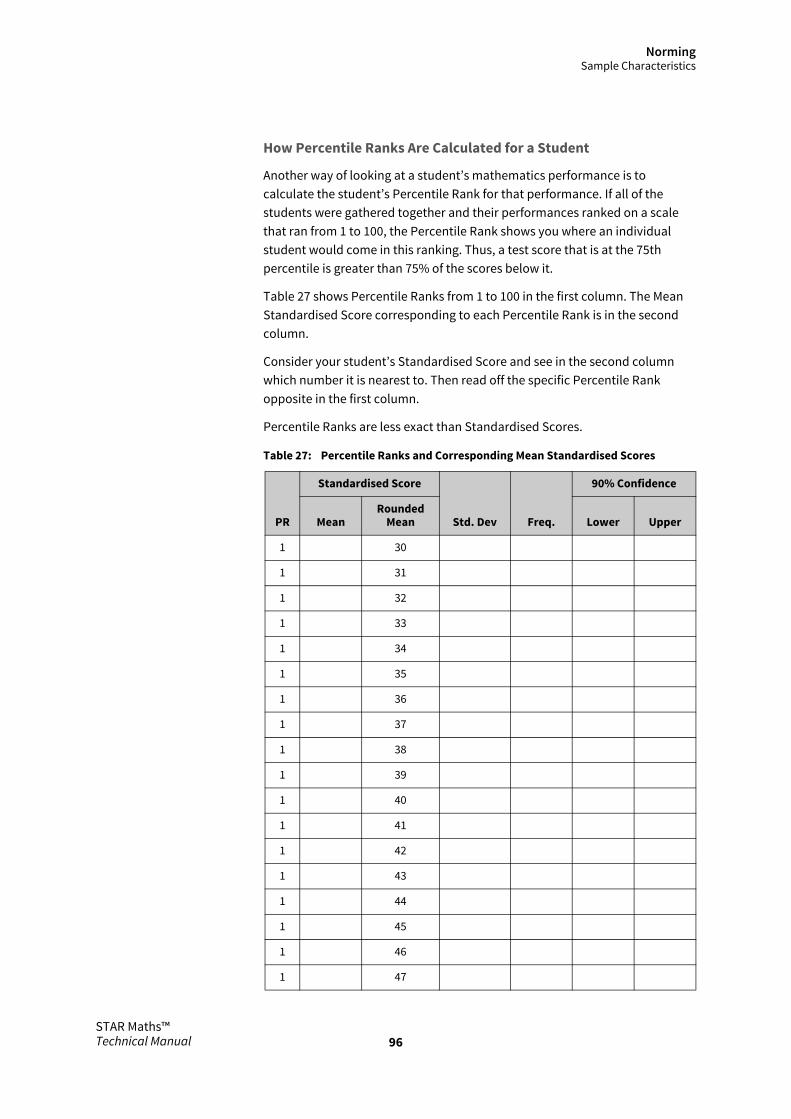
NormingSample Characteristics
96STAR Maths™Technical Manual
How Percentile Ranks Are Calculated for a Student
Another way of looking at a student’s mathematics performance is to calculate the student’s Percentile Rank for that performance. If all of the students were gathered together and their performances ranked on a scale that ran from 1 to 100, the Percentile Rank shows you where an individual student would come in this ranking. Thus, a test score that is at the 75th percentile is greater than 75% of the scores below it.
Table 27 shows Percentile Ranks from 1 to 100 in the first column. The Mean Standardised Score corresponding to each Percentile Rank is in the second column.
Consider your student’s Standardised Score and see in the second column which number it is nearest to. Then read off the specific Percentile Rank opposite in the first column.
Percentile Ranks are less exact than Standardised Scores.
Table 27: Percentile Ranks and Corresponding Mean Standardised Scores
PR
Standardised Score
Std. Dev Freq.
90% Confidence
MeanRounded
Mean Lower Upper
1 30
1 31
1 32
1 33
1 34
1 35
1 36
1 37
1 38
1 39
1 40
1 41
1 42
1 43
1 44
1 45
1 46
1 47

NormingSample Characteristics
97STAR Maths™Technical Manual
1 48
1 49
1 50
1 51
1 52
1 53.27 53 6.26 289 42.97 63.57
1 53.27 54 6.26 289 42.97 63.57
1 53.27 55 6.26 289 42.97 63.57
1 53.27 56 6.26 289 42.97 63.57
1 53.27 57 6.26 289 42.97 63.57
2 63.79 58 1.59 290 61.18 66.40
2 63.79 59 1.59 290 61.18 66.40
2 63.79 60 1.59 290 61.18 66.40
2 63.79 61 1.59 290 61.18 66.40
2 63.79 62 1.59 290 61.18 66.40
2 63.79 63 1.59 290 61.18 66.40
2 63.79 64 1.59 290 61.18 66.40
2 63.79 65 1.59 290 61.18 66.40
3 68.18 66 1.00 289 66.53 69.82
3 68.18 67 1.00 289 66.53 69.82
3 68.18 68 1.00 289 66.53 69.82
3 68.18 69 1.00 289 66.53 69.82
4 71.32 70 0.88 289 69.87 72.77
4 71.32 71 0.88 289 69.87 72.77
5 73.85 72 0.60 289 72.86 74.84
5 73.85 73 0.60 289 72.86 74.84
5 73.85 74 0.60 289 72.86 74.84
6 75.76 75 0.48 290 74.97 76.55
6 75.76 76 0.48 290 74.97 76.55
7 77.29 77 0.43 289 76.57 78.00
Table 27: Percentile Ranks and Corresponding Mean Standardised Scores
PR
Standardised Score
Std. Dev Freq.
90% Confidence
MeanRounded
Mean Lower Upper

NormingSample Characteristics
98STAR Maths™Technical Manual
8 78.58 78 0.36 289 77.98 79.17
9 79.80 79 0.32 290 79.26 80.33
10 80.90 80 0.29 289 80.42 81.38
11 81.81 81 0.24 289 81.41 82.21
12 82.67 82 0.25 290 82.27 83.08
13 83.46 83 0.22 289 83.09 83.83
14 84.25 84 0.23 290 83.88 84.62
16 85.62 85 0.17 290 85.35 85.90
17 86.20 86 0.17 289 85.93 86.48
19 87.31 87 0.16 290 87.05 87.58
22 88.83 88 0.15 291 88.58 89.07
24 89.81 89 0.13 289 89.58 90.03
26 90.70 90 0.12 289 90.50 90.91
28 91.61 91 0.13 289 91.39 91.83
30 92.51 92 0.13 288 92.30 92.72
32 93.36 93 0.12 289 93.17 93.55
35 94.55 94 0.12 289 94.36 94.75
38 95.64 95 0.11 288 95.46 95.83
40 96.40 96 0.11 288 96.22 96.58
43 97.48 97 0.11 290 97.30 97.66
46 98.58 98 0.10 289 98.42 98.74
49 99.57 99 0.10 290 99.40 99.74
52 100.71 100 0.11 289 100.52 100.89
54 101.45 101 0.11 291 101.27 101.63
57 102.49 102 0.11 289 102.32 102.67
60 103.72 103 0.12 288 103.52 103.92
62 104.51 104 0.12 289 104.30 104.71
64 105.36 105 0.12 289 105.17 105.56
67 106.67 106 0.13 290 106.46 106.88
69 107.57 107 0.13 290 107.36 107.77
Table 27: Percentile Ranks and Corresponding Mean Standardised Scores
PR
Standardised Score
Std. Dev Freq.
90% Confidence
MeanRounded
Mean Lower Upper
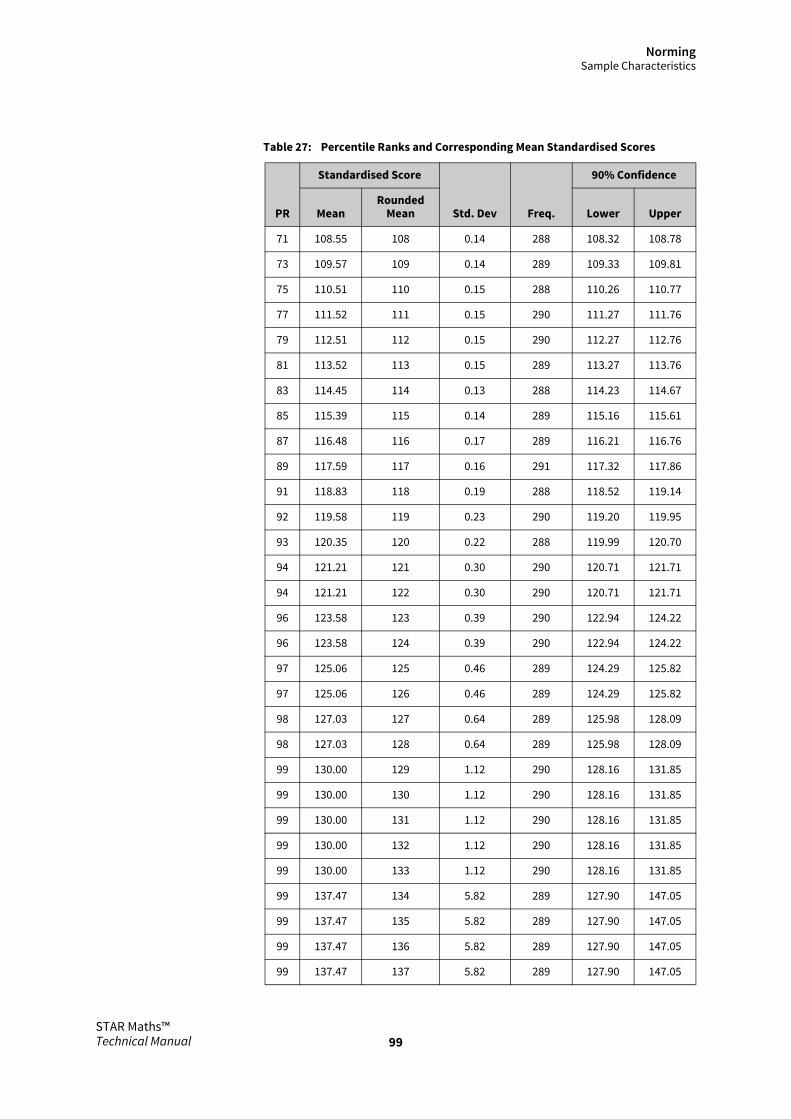
NormingSample Characteristics
99STAR Maths™Technical Manual
71 108.55 108 0.14 288 108.32 108.78
73 109.57 109 0.14 289 109.33 109.81
75 110.51 110 0.15 288 110.26 110.77
77 111.52 111 0.15 290 111.27 111.76
79 112.51 112 0.15 290 112.27 112.76
81 113.52 113 0.15 289 113.27 113.76
83 114.45 114 0.13 288 114.23 114.67
85 115.39 115 0.14 289 115.16 115.61
87 116.48 116 0.17 289 116.21 116.76
89 117.59 117 0.16 291 117.32 117.86
91 118.83 118 0.19 288 118.52 119.14
92 119.58 119 0.23 290 119.20 119.95
93 120.35 120 0.22 288 119.99 120.70
94 121.21 121 0.30 290 120.71 121.71
94 121.21 122 0.30 290 120.71 121.71
96 123.58 123 0.39 290 122.94 124.22
96 123.58 124 0.39 290 122.94 124.22
97 125.06 125 0.46 289 124.29 125.82
97 125.06 126 0.46 289 124.29 125.82
98 127.03 127 0.64 289 125.98 128.09
98 127.03 128 0.64 289 125.98 128.09
99 130.00 129 1.12 290 128.16 131.85
99 130.00 130 1.12 290 128.16 131.85
99 130.00 131 1.12 290 128.16 131.85
99 130.00 132 1.12 290 128.16 131.85
99 130.00 133 1.12 290 128.16 131.85
99 137.47 134 5.82 289 127.90 147.05
99 137.47 135 5.82 289 127.90 147.05
99 137.47 136 5.82 289 127.90 147.05
99 137.47 137 5.82 289 127.90 147.05
Table 27: Percentile Ranks and Corresponding Mean Standardised Scores
PR
Standardised Score
Std. Dev Freq.
90% Confidence
MeanRounded
Mean Lower Upper

NormingSample Characteristics
100STAR Maths™Technical Manual
National Curriculum Level–Maths (NCL–M)
The NCL score is reported in the following format: the estimated national curriculum level followed by a sublevel category, labeled a, b or c. The sublevels can be used to monitor student progress more finely, as they provide an indication of how far a student has progressed within a specific national curriculum level. For instance, an NCL–M of “4c” would indicate that an individual is estimated to have just obtained level 4, while another student with “4a” is estimated to be approaching level 5.
It is sometimes difficult to identify whether or not a student is in the top of one level (for instance, 4a) or just beginning the next higher level (for instance, 5c). Therefore, a transition category is used to indicate that a student is performing around the cusp of two adjacent levels. These transition categories are indicated by concatenation of the contiguous levels and sublevel categories. For instance, a student whose skills appear to range between levels 4 and 5, indicating they are probably starting to transition from one level to the next, would obtain an NCL of 4a/5c. These transition scores are provided only at the junction of one level and the next highest. There are no transition categories within a level, for instance there are no 4c/4b or 4b/4a categories.
99 138
99 139
99 140
99 141
99 142
99 143
99 144
99 145
99 146
99 147
99 148
99 149
99 150
99 151
Total 100 14.962101 28,930
Table 27: Percentile Ranks and Corresponding Mean Standardised Scores
PR
Standardised Score
Std. Dev Freq.
90% Confidence
MeanRounded
Mean Lower Upper

NormingSample Characteristics
101STAR Maths™Technical Manual
Table 28 correlates National Curriculum Level–Maths (NCL–M) Scores to Scaled Scores.
Gender
Having established the basic standardisation, further studies could then be conducted. One investigation explored whether boys and girls had significantly different outcomes in terms of test scores and standardised scores (see Table 29).
Female test scores are statistically significantly higher than male test scores. However, statistical significance is affected by the very large numbers here. When the actual difference between female and male scores is considered (100.089 versus 99.386) the difference is not very large. Consequently there is no need to produce separate norming tables for boys and girls.
It is worth noticing that considerably more boys than girls have been tested (11,859 versus 9,850). This suggests that there is more concern about male maths standards than female.
Table 28: Relation of National Curriculum Level–Maths (NCL–M) Scores to Scaled Scores
Scaled Score Range NCL–M
Scaled Score Range NCL–M
0–235 1b 664–721 4b
236–340 1a/2c 722–763 4a/5c
341–478 2b 764–832 5b
479–548 2a/3c 833–909 5a/6c
549–620 3b 910–1073 6b
621–663 3a/4c 1074–1400 6a/7c
Table 29: Test of Differences between Females and Males
Group Obs. Mean Std. Err. Std. Dev. 95% Conf. Interval
Female 9,850 100.089 0.1427911 14.17161 99.80908 100.3689
Male 11,859 99.386 0.1446384 15.75098 99.10233 99.6694
Combined 21,709 99.705 0.1022036 15.05865 99.50455 99.9052
Diffa
a. diff = mean(Female) – mean(Male)Ho: diff = 0 T = 3.4259 degrees of freedom = 21707Ha: diff < 0 Pr(T < t) = 0.9997Ha: diff !=0 Pr(|T| > |t|) = 0.0006Ha: diff > 0 Pr(T > t) = 0.0003.
0.70313 0.205 0.3008496 1.10541

NormingSample Characteristics
102STAR Maths™Technical Manual
Regional Differences in Outcome
A further interesting question is whether students in the four regions of the UK (Southeast, Southwest, North, Scotland and Northern Ireland) have significantly different outcomes. Of course, if they did it would not say necessarily anything about the relative effectiveness of schools or degree of socio-economic disadvantage in these areas, only whether the test is targeted on more or less able students. Chi-square tests of consistency in primary and secondary school frequencies (between observed and total numbers) are shown in Tables 30 and 31.
Analysis of Variance shows that there are statistically significantly different test scores between regions in terms of relative achievement. The regression shows that this is driven by higher average test scores in Scotland and lower average test scores in the Southeast. Bear in mind that the Southeast contributed very many scores to this standardisation, while Scotland contributed very few. However, this pattern is similar to that for Reading.
Table 30: Chi-Square Test of Consistency in Primary School Frequencies Between Observed and Total Numbers
H null: Frequencies Are Consistent
Pearson chi2(3) = 135.2766 Probability = 0.000
Likelihood-ratio chi2(3) = 125.0968 Probability = 0.000
Residuals
Region Observed Expected Classic Chi2 Pearson Chi2
North 5% 29% –24.040 –4.461
Scotland 2% 14% –11.540 –3.136
Southeast 84% 30% 53.470 9.677
Southwest 9% 27% –17.880 –3.449
Table 31: Chi-Square Test of Consistency in Secondary School Frequencies Between Observed and Total Numbers
H null: Frequencies Are Consistent
Pearson chi2(3) = 42.6163 Probability = 0.000
Likelihood-ratio chi2(3) = 52.1008 Probability = 0.000
Residuals
Region Observed Expected Classic Chi2 Pearson Chi2
North 43% 29% 14.000 2.600
Scotland 2% 13% –11.000 3.051
Southeast 48% 30% 18.000 3.286
Southwest 7% 28% –21.000 3.969

NormingReliability
103STAR Maths™Technical Manual
ReliabilityThe question of the reliability of the test was approached in two ways: by calculating split-half reliability (for both Scaled Scores and Standardised Scores) and by calculating test-retest reliability.
Split-Half Reliability
Split-half reliability for Scaled Score showed an overall mean of 100.19 and standard deviation of 15.10. The Spearman-Brown Coefficient was 0.867. This indicates a good level of reliability, although this is a little less than was the case for Reading.
Test-Retest Reliability
Calculating Test-Retest Reliability was more complex, since it required obtaining a sample of cases from the most recent full year of testing (August 1, 2009–July 31, 2010) and comparing their scores to those of the same cases in the previous year (August 1st, 2008–July 31, 2009). Ensuring that only scores for the same students on both occasions were entered in this analysis took a great deal of time. All cases with more than one testing in each of these periods were deleted. In the current year only 278 of these were the same students, many fewer than for Reading (see Tables 32, 33, and 34). Note that in the PASW file of 278 matched cases, there is an additional binary variable “outlier” which equals 1 for the 8 outlier cases and 0 for all other cases. This variable can be used as a filter in order to reproduce both the correlations reported in Tables 33 and 34.
Table 32: Number of Cases in Dataseta
a. Both datasets have been restricted as per the instructions. All cases with duplicate students have been removed.
Original Data 2,750
Pre-test Data 1,627
Matched Between Datasets 278
Table 33: Pearson Correlation Statistic for Matched Student Dataset, Idbownerid × iuserid (All Matches)
Correlations pre_iscaledscore iscaledscore
pre_iscaledscore Pearson Correlation 1 0.767a
a. Correlation is significant at the 0.01 level (2-tailed).
Sig. (2-tailed) 0.000
N 278 278
iscaledscore Pearson Correlation 0.767a 1
Sig. (2-tailed) 0.000
N 278 278

NormingReliability
104STAR Maths™Technical Manual
A histogram of Current Scaled Score × Previous Scaled Score was then constructed to determine whether the distribution was relatively normal and to establish the presence of outlier or rogue results (see Figure 4). Figure 5 shows this as a histogram.
Figure 4: Scatter Diagram of iScaled Score × pre_iScaled Score, Showing Outliers
Table 34: Pearson Correlation Statistic for Matched Student Dataset, Idbownerid × userid (8 Outliers Removed)
Correlations pre_iscaledscore iscaledscore
pre_iscaledscore Pearson Correlation 1 0.862a
Sig. (2-tailed) 0.000
N 270 270
iscaledscore Pearson Correlation 0.862a 1
Sig. (2-tailed) 0.000
N 270 270
a. Correlation is significant at the 0.01 level (2-tailed).

NormingReliability
105STAR Maths™Technical Manual
Figure 5: Histogram of the Difference between iScaledScore and pre_iScaledScore, Showing Outliers
Any outlier results were then deleted. In fact, 8 outlier results were deleted (see Figure 6).
Figure 6: Histogram of the Difference Between iScaledScore and pre_iScaledScore, with 8 Outliers Removed (Difference > 250)
A total of 278 students could be matched from one year to the next with singular test results in each year.
The initial Pearson correlation between Current Scaled Score and Previous Scaled Score was 0.767. When the 8 outliers were removed, this improved to 0.862 (n = 278). Both of these correlations were highly statistically significant. Although slightly less than Reading, this latter is still very comparable. This shows good reliability.
NormingValidity
106STAR Maths™Technical Manual
ValidityValidity information reported here is drawn from the National Foundation for Educational Research (NFER) (2007). NFER reported the correlations between the Progress in Mathematics 6-14 Scales for each year group and the STAR Reading Test as follows: PiM 6 0.58, PiM 7 0.73, PiM 8 0.74, PiM 9 0.74, PiM10 0.75, PiM11 0.74, PiM12 0.70 and PiM13 0.73.
There was a reasonable correlation (above 0.70) for almost all levels, the exception being PiM 6 where the correlation was only 0.58.
The mathematics test also correlated well with teacher assessments, with a coefficient of 0.81 based on 2,460 students. The mathematics test also correlated well with teacher assigned National Curriculum Levels. These are almost all satisfactorily high.
Other IssuesExamining differences by socio-economic disadvantage of school or ethnic minority of student would have been of interest, but unfortunately data was not available on these factors.
ReferenceNational Foundation for Educational Research (2007). Renaissance Learning
Equating Study: Report. Slough: NFER.

107STAR Maths™Technical Manual
Frequently Asked Questions
The STAR Maths computer-adaptive test is designed to be user-friendly. However, because the topics of psychometrics and standardised assessment are quite complex, this section answers questions commonly asked about STAR Maths.
What Is the Primary Purpose of the STAR Maths Assessment? Why Have So Many Schools Purchased It, and How Are They Using the Results?
STAR Maths tests serve the same purposes as the highly recognised STAR Reading tests, only in a different content area. The STAR Maths software allows teachers to:
Place new students in the appropriate level of maths teaching and learning materials or in the appropriate Accelerated Maths library.
Measure growth in maths skills or the effectiveness of a maths intervention program like the adoption of Accelerated Maths throughout the school year.
Predict how students will do on national tests while there is still time to intervene.
Because the STAR Maths computer-adaptive maths test is the only class-based assessment that can give teachers this kind of information in just 15 minutes, many educators find STAR Maths an invaluable tool.
How Can STAR Maths Accurately Determine a Student’s Maths Level with Only 24 Test Questions and in Just 15 Minutes?
A low number of test questions and a short test time are possible because of STAR Maths’ advanced computer-adaptive technology. Adaptive Branching allows the test to very quickly adapt to the student’s level of proficiency. The STAR Maths program acquires new information about the student’s maths ability with each and every item and updates its knowledge of the student’s ability after every question. This means that STAR Maths tests are much more efficient than conventional paper-and-pencil tests that administer the same items regardless of how the student is doing. By obtaining more information from every item administered and by using that information to continuously tailor items for the student, STAR Maths tests are able to achieve measurement precision comparable to much longer conventional tests. This results in an efficient and reliable assessment for teachers and a positive testing experience for students.

Frequently Asked Questions
108STAR Maths™Technical Manual
What Evidence Do We Have that STAR Maths Performs as Claimed?
Evidence of STAR Maths’ performance is gathered in two forms: reliability and validity.
Reliability is the extent to which a test yields consistent results from one administration to another and from one test form to another. Internal research studies suggest that STAR Maths 2.x and higher test scores have a very high level of internal consistency reliability, as well as a high degree of alternate-form reliability.
Validity is the degree to which a test measures what it claims to measure. STAR Maths 2.x and higher test score validity is evidenced by the high correlation to overall maths scores on many national standardised tests, as well as the high correlation between STAR Maths 2.x and higher Scaled Scores and teachers’ ratings of their students’ maths skills.
See “Reliability and Measurement Precision” on page 56 for more information on STAR Maths 2.x and higher reliability, and see “Validity” on page 61 for information on its validity.
There Do Not Seem to Be Any Calculus Items. What Are the Most Difficult Questions in the Test?
Because most of the items at the top of the difficulty scale are from the Shape and Space and Numeration Concepts (e.g. fractional exponents) content objectives, the STAR Maths software may administer items from these strands to very high-performing students. The following features of the STAR Maths test should also be noted:
Algebra items are limited to the last section of the test. Content balancing considerations limit the number of algebra items administered during any test. At the highest US grades and performance levels, at least two but no more than three algebra items will be administered. At lower US grades and performance levels, algebra items will seldom be administered.
Calculus items were not included on the test because typical US secondary school students, both in the national norming sample and in the US population as a whole, have not taken calculus.
When I Take a STAR Maths Test, I Keep Getting Difficult Questions Even Though I Entered Myself as a Lower Year Student. Why?
You are probably answering items correctly that a student at that year would normally get wrong. The year you select for yourself only affects the difficulty of the first item on your first test. After that, the adaptive brancher takes over based on your responses. Subsequent tests begin just below your previously tested ability, regardless of your year.

Frequently Asked Questions
109STAR Maths™Technical Manual
To simulate the experience of a lower year student, you would need to answer several questions incorrectly. (Alternating correct and incorrect responses will approximately maintain the difficulty level, while more correct or incorrect answers will cause it to move up or down the difficulty scale, respectively.) Because it is quite difficult for most adults to “act like” young students when completing a STAR Maths test, teachers wishing to evaluate the software should observe an actual administration with a student.
There Does Not Seem to Be Any Pattern to the Types of STAR Maths Test Questions Posed. How Does It Select the Maths Objectives to Be Tested On?
All STAR Maths 3.x and higher tests follow a similar pattern: the first eight items measure Numeration Concepts, the ninth through sixteenth items measure Computation Processes and the last eight items measure other applications in six strands of maths objectives.
During a STAR Maths test, items are also selected so that they are the appropriate difficulty for each student. All of the questions in the item bank, from all maths content and objective areas, were placed on the same difficulty scale through a process called calibration. During a STAR Maths 3.x and higher test, the adaptive brancher moves up and down that difficulty scale, selecting the next item based on the student’s current ability estimate. Item selection is based primarily on the calibrated difficulty of the questions.
Finally, steps are also taken to ensure a variety of objectives are assessed. The probability of receiving an item from a specific topic area or objective depends largely on the concentration of such items in the pool around the estimated ability level on the difficulty scale.
See “Content and Test Design” on page 13 for information about the content strands and objectives.
My Students Get Items on Material We Have Not Covered Yet. Can This Be Prevented?
Not entirely. This is the nature of computer-adaptive testing, the technology that permits you to get accurate test results in only 15 minutes. If a student is performing well, the STAR Maths software continues to administer more difficult items until it finds a level at which the student cannot answer questions correctly. Just as STAR Reading tests may “branch up” to vocabulary the student has not been exposed to, STAR Maths tests may move up to content objectives a student has not yet reached. However, to minimise this phenomenon, the STAR Maths software will not administer items that are four or more years above the student’s specified year. In addition, because, on average, students answer about 67.5 per cent of STAR Maths 3.x and higher items correctly, students should not receive items on unfamiliar content frequently within a test.
Frequently Asked Questions
110STAR Maths™Technical Manual
The STAR Maths Test Seems Too Difficult and Frustrating for My Higher-Performing Primary School Students.
The adaptive brancher is set so that, on average, students will answer about two thirds (67.5 per cent) of the test items correctly. High-performing students in particular may be accustomed to getting much higher percentages correct on tests. These students should be instructed to expect a difficult test and to do their best without worrying about the number of correct or incorrect items.
May Students Use Calculators or Reference Materials During a STAR Maths Test?
No. STAR Maths tests are standardised, so the test should be administered in the same way it was during the US norming study. During that study, students were allowed to use blank scratch paper and a pencil, but not calculators or any reference materials. All STAR Maths 3.x and higher kits include Pretest Instructions that teachers can also use to make sure that the test administration is standardised. Because any variance from these procedures could affect students’ scores, teachers should closely follow these instructions.
Does the STAR Maths Test Assess Problem-Solving or Critical Thinking Skills?
Yes. The STAR Maths item bank includes a Word Problems strand that closely parallels the Computation Processes strand. These word problems ensure that students can perform simple situational analyses. More difficult word problems also require a second computation or include extraneous information.
Why Did You Choose to Use Multiple-Choice Questions to Measure Problem-Solving Skills Rather Than Open-Ended Questions?
The STAR Maths test is designed to gather the maximum amount of information on problem solving and other maths skills and to provide scores in the shortest period of time. Only multiple-choice type questions fit this purpose. Open-ended questions are more appropriate for teachers to use in a class setting when diagnosing any difficulties a particular student might be having.
How Often Should We Administer STAR Maths Tests?
Renaissance Learning recommends administering STAR assessments two to five times a year for purposes including screening, placement, diagnostic assessment, benchmark assessment and outcomes measurement. It may be used as often as weekly in progress monitoring programs. New students, or students for whom you occasionally need additional information, may be tested at any time.

Frequently Asked Questions
111STAR Maths™Technical Manual
The US National Center for Student Progress Monitoring recommends testing at least once a month during the school year, and STAR Maths may be used that often for progress monitoring purposes. It is important to keep in mind, however, that an individual student’s scores are unlikely to move upward consistently. Students making appropriate progress may nonetheless show an erratic growth trajectory. This is a consequence of both normal variability in student performance over short intervals and of the inevitable measurement error inherent in educational tests. All tests administered monthly or more often will show up and down fluctuations in an individual student’s scores. STAR Maths is no exception to this rule. However, while individual scores may seem to show erratic progress, averages for classes, years and larger groups should show an upward trend over the course of the school year.
Are STAR Maths Test Results Really Very Useful at the Secondary School Level?
Yes. STAR Maths tests measure a wide range of maths abilities at the secondary school level. In the US, Scaled Scores range from about 500–1200 for US 12th graders, with a median of 852. The STAR Maths test also does a very good job of measuring the maths skills of incoming students and therefore helps secondary school maths teachers quickly assess how prepared new students are for their maths classes.
Is There a Way for the Teacher to See Which Questions a Student Answered Correctly and Incorrectly?
No. This is prevented for the following two reasons. First, in computer-adaptive normative testing, the student’s performance on individual items is not as meaningful as the pattern of the student’s responses on the entire test. The student’s pattern of performance on all items taken together forms the basis of the scores in STAR Maths reports. Second, for purposes of test security, preventing item review protects the test items from compromise and overexposure.
Explain What “Calibration” and “Norming” Mean.
Development of the STAR Maths 2.x and higher normative assessment required two major phases of student testing: calibration and norming.
Calibration is the process of placing individual test items on a difficulty scale. Calibration occurs by having a large number of students test on all of the questions to be included in the item bank and analysing the resulting item response data. The difficulty scale is then used by STAR Maths software for item selection using the Adaptive Branching algorithm, and to estimate the student’s maths ability level.
Norming is the process of determining how a nationally representative sample of students at each year level performs on the overall test. For STAR Maths 2.0, a large number of students from grades 1–12 were tested

Frequently Asked Questions
112STAR Maths™Technical Manual
using the final computer-adaptive test. An analysis of their ability estimates was then conducted in order to derive the Percentile Rank (PR) scoring tables.
Why Do Some of My Students Who Took STAR Maths Have Scores That Are Widely Varying from the Results of Our Other Standardised Test Program?
The simple answer is that at least three factors work to make scores different on different tests: score scale differences, measurement error in both testing instruments and differences between their norms groups. Scale scores obtained on different tests—such as Progress in Maths and STAR Maths—are not comparable, so we should not expect students to get the same scale scores on both tests, any more than we would expect the same results when measuring weights using one scale calibrated in pounds and another calibrated in kilograms. If norm-referenced scores (such as Age scores) are being compared, scores will certainly differ to some extent because of sampling differences between the two tests’ respective norms groups. Finally, even if the score scales were made comparable, or the norms groups were identical, measurement error in both tests would cause the scores to be different in most cases.
Although actual scores will differ because of the factors discussed above, the statistical correlation between scores on STAR Maths and other standardised tests is generally high. That is, the higher students’ scores are on STAR Maths, the higher their scores on another test tend to be.
All standardised test scores have measurement error. The STAR Maths measurement error is comparable to most other standardised tests. When one compares the results from different tests taken at different times, it is not unusual to see differences in test scores ranging from 2–5 year levels. This is true when comparing results from other test instruments as well. Standardised tests provide approximate measurements. The STAR Maths test is no different in this regard, but its adaptive nature makes its scores more reliable than conventional test scores near the minimum and maximum scores on a given form. A common shortcoming of conventional tests involves “floor” and “ceiling” effects at each test level. The STAR Maths test is not subject to this shortcoming because of its adaptive branching and large item bank. Other factors, such as student motivation and the testing environment, are also different for STAR Maths and high-stakes tests.
Why Do We See a Significant Number of Our Students Performing at a Lower Level Now Than They Were Nine Weeks Ago?
This is a result of measurement error. As mentioned previously, all psychometric instruments, including STAR Maths, have some level of measurement error associated with them. Measurement error causes students’ scores to fluctuate around their “true scores.” About half of all

Frequently Asked Questions
113STAR Maths™Technical Manual
observed scores are smaller than the students’ true scores; the result is that some students’ capabilities are underestimated to some extent.
If a group of students were to take a test twice on the same day, without repeating any items, about half of their scores would increase on the second test, while the other half would decline; the size of the individual score variations is an indicator of measurement error. Although measurement error affects all scores to some degree, the average scores on the two tests would be very similar to one another.
Scores on a second test taken after a longer time interval will tend to increase as a result of growth; however, if the amount of growth is small relative to the amount of measurement error, an appreciable percentage of students may show score declines, even though the majority of scores increase.
The degree of variation due to measurement error is expressed as the “standard error of measurement.” The “Reliability and Measurement Precision” chapter discusses standard error of measurement (SEM) in depth (beginning on page 60); it should be referred to in order to better understand this issue.

114STAR Maths™Technical Manual
Appendix A: US Norming Study
US NormingVersions of STAR Maths released between 2002 and 2011, including STAR Math Enterprise, use the STAR Maths version 2 Scaled Score norms developed in 2002. In 2012, updated test score norms were computed for the STAR Maths Service version, for introduction at the beginning of the 2012–13 school year. This chapter describes the 2012 norming of the STAR Maths Service version.
In addition to Scaled Score norms, Renaissance Learning has developed growth norms for STAR Maths. The section on growth norms in this chapter describes the development and use of the growth norms, which have been in use since 2008. Growth norms are very different from test score norms, having different meaning and different uses. Users interested in growth norms should familiarise themselves with the differences, which are made clear in the growth norms section (see page 123).
Sample CharacteristicsStudents’ STAR Maths data in the Renaissance Learning Hosted Learning Environment ranging from fall 2008 to spring 2011 were used for the 2012 STAR Maths norming study. The 2012 STAR Norming Sample included students from 48 US states and the District of Columbia. The US states not represented in the 2012 norming sample were Rhode Island and Vermont. School and school network demographic data when recorded were obtained from Market Data Retrieval (MDR), National Center for Education Statistics (NCES) and the US Bureau of Census. Students’ demographic data included Gender, Race/Ethnicity, Bilingual Status, Free Lunch, Reduced Lunch, Learning Disability, Physical Disability, English Language Learner, Gifted and Talented, Limited English Proficient, Title 1 and Special Education.
To obtain a representative sample of the US school population, a multi-stage stratified random sampling process was used. The stratification variables are described below. The first sampling stage selected representative samples from different geographic regions (East, Midwest and West) and metropolitan classification codes (rural, suburban and urban).The second sampling stage selected representative samples from different school sizes and socioeconomic status classifications. Socioeconomic status included four classification levels for the percentage of students in the school that qualified for free and reduced school lunch. The third sampling stage selected representative samples from US grades 1–10 (Years 2–11) and ten deciles (deciles 1–10 of STAR Maths scores) within each US grade. From the norming sample completed in the first three stages described above, the fourth and final sampling stage selected equal sample sizes from the last three years of

Appendix A: US Norming StudySample Characteristics
115STAR Maths™Technical Manual
STAR Maths data (fall 2008–spring 2009, fall 2009–spring 2010 and fall 2010–spring 2011). The fourth and final sampling stage merely assured representative sampling from the last three years of STAR Maths data.
The key stratification variables were:
Geographic Region. Using the categories established by the National Center for Education Statistics (NCES), students were grouped into three geographic regions: East (including Northeast and Southeast), Midwest and West.
East
Connecticut, Maine, Massachusetts, New Hampshire, Rhode Island, Vermont, Delaware, District of Columbia, Maryland, New Jersey, New York, Pennsylvania, Alabama, Arkansas, Florida, Georgia, Kentucky, Louisiana, Mississippi, North Carolina, South Carolina, Tennessee, Virginia and West Virginia.
Midwest
Illinois, Indiana, Michigan, Ohio, Wisconsin, Iowa, Kansas, Minnesota, Missouri, Nebraska, North Dakota and South Dakota.
West
Arizona, New Mexico, Oklahoma, Texas, Alaska, California, Colorado, Hawaii, Idaho, Montana, Nevada, Oregon, Utah, Washington and Wyoming.
School Metropolitan Classification. Using the categories from Market Data Retrieval (MDR), schools were classified as rural (non-metropolitan), suburban and urban schools. Rural schools are classified as schools with rural and non-metropolitan postal ZIP codes that do not fall within the boundaries of a Metropolitan Area (MA). Suburban schools have postal ZIP codes that fall within the geographical confines of an MA, but fall outside the central cities. Urban schools have postal ZIP codes that include the central city that gives its name to the MA.
School Size. Based on total school enrolment, schools were classified into one of three school size groups: small schools had under 500 students enrolled, medium schools had between 500–999 students enrolled and large schools had 1,000 or more students enrolled.
Socioeconomic Status as Indexed by the Percentage of School Students with Free and Reduced Lunch. Schools were classified into one of four classifications based on the percentage of students in the school who had free or reduced lunch. The classifications were coded as follows:
1 High Socioeconomic Status (0%–24%)
2 Above Median Socioeconomic Status (25%–49%)

Appendix A: US Norming StudySample Characteristics
116STAR Maths™Technical Manual
3 Below Median Socioeconomic Status (50%–74%)
4 Low Socioeconomic Status (75%–100%)
No students were sampled from the school classifications that did not report the percentage of school students with Free and Reduced Lunch. The implication of this factor for the norming cannot be determined. The norming sample also included many private and parochial schools as described below.
US Grade. The STAR Maths 2012 norming sample comprised students from US grades 1–10 (Years 2–11). There was insufficient data for sampling students and computing norms for Kindergarten (Reception) and US grades 11 and 12 (Years 12 and 13).
Deciles. Students’ STAR Maths scaled scores were grouped into 10 deciles from the fall 2008–spring 2011 data and then students were randomly sampled from each of the ten deciles classifications within each US grade level.
School Year. Data were selected from fall 2008–spring 2011, with equal samples drawn from each school year.
Tables 35 to 39 summarise some key variables from the fall 2008 to spring 2011 norming sample.
Table 35: Sample Characteristics, STAR Maths Norming Study—Fall 2008–Spring 2011 (N = 450,007 Students)
Students
National % Sample %
Geographic Region
East 53.92% 51.75%
Midwest 21.49% 21.33%
West 24.59% 26.92%
School Network Socioeconomic Status (Percentage of Free/Reduced Lunch)
High (0%–24%) 25.3% 23.60%
Above Median (25%–49%) 26.3% 24.47%
Below Median (50%–74%) 24.8% 25.21%
Low (75%–100%) 22.1% 26.73%
School Size
1–599 Students 45.30% 46.38%
600–999 Students 42.30% 58.63%
1,000+ Students 12.40% 4.98%

Appendix A: US Norming StudySample Characteristics
117STAR Maths™Technical Manual
The STAR Maths 2012 norming sample included 89.96% public schools, 4.14% Catholic schools, 3.00% state-operated schools, 2.29% private schools, 0.47%
Table 36: School Locations, STAR Maths Norming Study—Spring 2012 (N = 450,007 Students)
Students
National % Sample %
Rural 37.25% 34.01%
Suburban 36.10% 33.24%
Urban 26.65% 32.76%
Total 100.00% 100.00%
Table 37: Gender and Ethnic Group Participation, STAR Maths Norming Study—Spring 2012 (N = 450,007 Students)
Students
National % Sample %
Ethnic Group Asian/Pacific Islander 4.3% 2.72%
Black 14.1% 19.51%
Hispanic 21.8% 10.02%
Native American 0.9% 4.11%
White 56.1% 39.36%
Other 3.0% 0.63%
Unrecorded N/A 69.03%a
Gender Female 48.95% 38.18%
Male 51.05% 39.14%
Unrecorded N/A 25.68%
a. The data for ethnic group participation should not be considered representative of the US population since there was only a 30% response rate for ethnic group recording.
Table 38: Type of School
National % Sample %
Public & Charter 80.3% 90.0%
Private 13.7% 2.3%
Catholic 6.1% 4.1%
Othera – 3.7%
All Types 100% 100%
a. Other schools in the sample included state-operated schools (3.0%), county-operated schools (0.13%), colleges (0.01%), regional centers (0.0%, 10 regional center schools) and Bureau of Indian Affairs schools (0.47%).

Appendix A: US Norming StudyData Analysis
118STAR Maths™Technical Manual
Bureau of Indian Affairs schools, 0.13% county-operated schools, 0.01% school network schools, 0.01% schools affiliated with colleges and ten schools (0.00%) associated with regional centers.
The STAR Maths 2012 norming sample included 76 bilingual students, 6,531 students who qualified for free lunch, 417 students with learning disabilities, 59 students with physical disabilities, 1,579 students who were English Language Learners (ELL), 1,946 students who were gifted and talented (G&T), 2,740 Title I students and 3,117 Special Education students.
Data AnalysisAfter selecting a stratified random sample of US students from US grades 1–10 (Years 2–11), sample characteristics were summarised to determine the degree of correspondence to the national population. These sample summaries are shown in Tables 35 and 39. Unweighted scores were used for compiling the norms due to the similarity of the sample proportions to the national population proportions based on the characteristics of geographic region, socioeconomic status, school size and school location. Due to the high proportion of missing data for gender and ethnic group participation, the norming sample proportions should not be considered as representative of the national population.
Both fall and spring scores were used in the norming study. Table 40 shows the fall 2008–fall 2011 Scale Score summary statistics by US grade whereas Table 41 shows the spring 2008–spring 2011 Scale Score summary statistics, also by US grade.
Table 39: School Network/School Poverty Level Code
School Network Poverty Level Code
National School Networks % National Schools % Sample %
A 0%–5.9% 13.2% 10.8% 2.2%
B 6%–15.9% 43.6% 41.1% 33.4%
C 16%–30.9% 37.2% 42.5% 50.3%
D 31% or More 6.0% 5.7% 11.9%
E Unclassified – – 2.1%
Total 100.0% 100.0% 100.0%

Appendix A: US Norming StudyData Analysis
119STAR Maths™Technical Manual
The sample sizes per US grade for Tables 40 and 41 are identical because students were selected for the norming sample if there were matched fall and spring scores from the same students.
Table 40: Comparison of Scaled Scores, STAR Maths Norming Study—Fall 2008–Fall 2011 (N = 425,007 Students)
US Grade
Sample Size
Scaled Score Means
Scaled Score Standard
Deviations
Scaled Score
Medians
Minimum Scaled Score
Maximum Scaled Score
1 20,240 267 93 263 1 813
2 53,422 408 87 414 1 811
3 91,485 495 86 500 1 937
4 80,970 579 92 585 82 1,007
5 69,478 645 98 650 1 1,064
6 47,215 711 103 718 68 1,112
7 30,360 747 110 757 125 1,187
8 21,450 777 118 790 123 1,318
9a
a. US grades 9 and 10 (Years 10 and 11) had substantially lower sample sizes.
6,105 790 117 802 180 1,215
10a 4,462 793 123 806 152 1,337
Table 41: Comparison of Scaled Scores, STAR Maths Norming Study—Spring 2008–Spring 2011 (N = 425,007 Students)
US Grade
Sample Size
Scaled Score Means
Scaled Score Standard
Deviations
Scaled Score
Medians
Minimum Scaled Score
Maximum Scaled Score
1 20,240 406 91 406 1 813
2 53,422 514 86 513 1 980
3 91,485 597 93 605 1 991
4 80,790 656 97 663 1 1,078
5 69,478 710 100 717 72 1,192
6 47,215 763 106 769 122 1,279
7 30,360 785 114 794 100 1,379
8 21,450 813 123 819 90 1,374
9a
a. US grades 9 and 10 (Years 10 and 11) had substantially lower sample sizes.
6,105 819 118 822 58 1,256
10a 4,462 823 127 828 90 1,289

Appendix A: US Norming StudyAdditional Information Regarding the Norming Sample
120STAR Maths™Technical Manual
The norm-referenced scores are determined from both the fall and spring testing periods used for the norming. The date range for the fall scores was August 1 to October 15 of the school year, and the spring scores were obtained between April 15 and the end of school year. For the STAR Maths 2012 norms, September was selected as the testing month for fall scores, and June was selected for the spring scores. Scores were linearly interpolated between fall (September) and spring (June) assuming equal growth for each of the ten school months (September–June) and no expected growth for the summer months of July and August. Summer norms were not computed.
Additional Information Regarding the Norming Sample Table 42 shows the frequency and percentage of test records selected from each of the last three school years. This table shows that 141,669 cases were selected from the sample for each school year.
Table 43 displays the frequency and percentage for School Enrolment Size Code for the norms sample. Table 43 shows classifications for seven school enrolment size codes. These classifications are from Market Data Retrieval. In many Market Data Retrieval reports the seven classifications are reduced to three school-size classifications as described above.
Table 42: Frequency and Percentage of STAR Mathematics Records by School Year Included in the STAR Maths 2012 Spring Norm Sample (N = 425,007 Students)
School Year Frequency Percentage
2008–2009 141,669 33.33%
2009–2010 141,669 33.33%
2010–2011 141,669 33.33%
Table 43: Frequency and Percentage for School Enrolment Size Code STAR Maths—Spring 2012 (N = 425,007 Students)
School Enrol Code Frequency Percentage
A 1–99 Students 2,970 0.70%
B 100–199 Students 18,246 4.29%
C 200–299 Students 38,235 9.00%
D 300–499 Students 137,670 32.40%
E 500–999 Students 206,667 48.63%
F 1,000–2,499 Students 19,927 4.69%
G 2,500 or More Students 1,225 0.29%
Frequency Missing 67 0.02%

Appendix A: US Norming StudyAdditional Information Regarding the Norming Sample
121STAR Maths™Technical Manual
Table 44 shows the frequency and percentage for the School Network Enrolment Size Code for the norms sample. This table shows the school network enrolment classification according to the seven Market Data Retrieval classifications for school network enrolment of students.
Table 45 indicates the School Level and Type.
Table 44: Frequency and Percentage for School Network Enrolment Size Code STAR Maths—Spring 2012 (N = 425,007 Students)
School Network Enrolment Frequency Percentage
A 1–599 Students 19,369 5.07%
B 600–1,199 Students 26,189 6.85%
C 1,200–2,499 Students 53,010 13.86%
D 2,500–4,999 Students 65,001 17.00%
E 5,000–9,999 Students 73,388 19.19%
F 10,000–24,999 Students 75,093 19.64%
G 25,000 or More Students 70,328 18.39%
Frequency Missing 42,629 10.03%
Table 45: Frequency and Percentage of School Level and Type, STAR Norming Study—Spring 2012 (N = 425,007 Students)
School Type Frequency Percentage
A Adult School 1 0.00%
C Combined School 17,612 4.14%
E Elementary School 334,156 78.63%
G College Related 28 0.01%
J Junior High School 8,511 2.00%
M Middle School 50,262 11.83%
P Special School 1,707 0.40%
S Senior High School 11,721 2.76%
V Vocational/Tech School 970 0.23%
Frequency Missing 39 0.009%

Appendix A: US Norming StudyAdditional Information Regarding the Norming Sample
122STAR Maths™Technical Manual
Table 46 indicates the School Administrative Classification as state, county, school network, public schools, private schools, Catholic schools, colleges, Bureau of Indian Affairs and Regional Centers.
Table 46: Frequency and Percentage for School Administrative Classification, STAR Norming Study—Spring 2012 (N = 425,007 Students)
School Administrative Classification Frequency Percentage
2 State-Operated Schools 12,731 3.00%
4 County-Operated Schools 567 0.13%
5 School Networks 29 0.01%
7 Public Schools 382,349 89.96%
9 Private Schools 9,724 2.29%
10 Catholic Schools 17,578 4.14%
12 Colleges 28 0.01%
13 Bureau of Indian Affairs 1,991 0.47%
14 Regional Centers 10 0.00%
Frequency Missing 0 0.00%

123STAR Maths™Technical Manual
References
Clausen-May, T., Vappula, H., & Ruddock, G. (2004). Progress in Maths 4–14 Series. London: nferNelson.
MDR. (2001). A D&B Company: Shelton, CT. Market Data Retrieval. (2001). A D&B Company: Shelton, CT.
Sewell, J., Sainsbury, M., Pyle, K., Keogh, N. & Styles, B. (2007). Renaissance Learning Equating Study Report. Slough, Berkshire, England: NFER, March.

124STAR Maths™Technical Manual
Index
AAccess levels, 7Adaptive Branching, 3, 7, 10, 41Administering the test, 8Algebra, 16Alternate-form reliability, 58ANOVA, 63Approximations, 15
CCalibrated items, review, 51Calibration, 111Calibration sample, 45Calibration study, 45
calibration sample, 45data collection, 47
Capabilities, 7Computation Processes, 4, 42Computational Processes, 14Computer-adaptive test design, 41Concurrent validity, 64Content
development, 13organisation, strands/categories, 3
Content specification, 13Algebra, 16Approximations, 15Computation Processes, 14Data Analysis and Statistics, 16Meeasures, 15Numeration Concepts, 13Shape and Space, 15Word Problems, 16
Criterion-referenced scores, 53Cronbach’s alpha, 58, 85
DData Analysis and Statistics, 16Data collection, 47Data encryption, 7Description of program, 1Design
interface, 9of the program, 3of the test, 13
Diagnostic Report, 15, 40and time limits, 12
Dynamic Calibration, 52
EExtended time limits, 11
FFormative classroom assessments, 1Frequently asked questions, 107
calculus, 108critical thinking skills, 110definitions of “calibration” and “norming”, 111determining maths levels quickly, 107difficult questions given to lower-year pupils, 108evidence that program performs as claimed, 108frequency of testing, 110how schools are using STAR Maths, 107method of objective selection during a test, 109most difficult questions, 108multiple-choice versus open-ended questions, 110primary purpose of STAR Maths, 107problem-solving skills, 110pupils performing at a lower level with passage of
time, 112STAR Maths at secondary school, 111test results widely varying from other standardised
tests, 112testing on material not covered yet, 109too difficult for high-performing primary school
pupils, 110using calculators or reference materials, 110viewing pupil responses, 111
GGender, 101Generic reliability, 57
IImprovements to the program
versions 2.x and higher, 5versions 3.x RP and higher, 5
Individualised tests, 7Interim periodic assessments, 1IRF (item response function), 49

Index
125STAR Maths™Technical Manual
IRT (Item Response Theory), 48Maximum-Likelihood estimation procedure, 44one-parameter/Rasch model, 49Rasch Maximum Information model, 10Rasch model, 85
Item analysis, 45, 48IRF (item response function), 49item difficulty, 49item discrimination, 49
Item difficulty, 49Item discrimination, 49Item response function. See IRFItem Response Theory. See IRTItem retention, rules for, 51Items in test bank, 11
KKeyboard, 9KR-20 (Kuder-Richardson Formula 20), 58
LLevels of pupil information
Tier 1: formative classroom assessments, 1Tier 2: interim periodic assessments, 1Tier 3: summative assessments, 2
MMaths Instruction Level. See MILMaximum-Likelihood IRT estimation procedure, 44Measurement
precision, 56SEM (standard error of measurement), 60
Measures, 15Meta-analysis of STAR Maths validity data, 81MIL (Maths Instruction Level), 10Mouse, 9
NNCL–M (National Curriculum Level–Maths), 53, 54, 100Norming, 89, 111, 114
data cleaning, 89gender, 101PR (Percentile Ranks), 94regional differences in outcome, 102regional distribution, 89reliability, 103sample characteristics, 89, 114standardised scores, 90US data analysis, 118
US sample characteristics, additional information, 120
US stratification variables, 115validity, 106
Norm-referenced scores, 53NRSS (Normed Referenced Standardised Score), 54Numeration Concepts, 4, 13, 42
OObjective clusters, 17One-parameter IRT model, 49
PPassword entry, 8Percentile Rank Range, 55Percentile Ranks (PR)
calculating for students, 96PR (Percentile Ranks), 55, 94
calculating for students, 96Practice session, 9Program design, 3
improvements to the program, versions 2.x and higher, 5
improvements to the program, versions 3.x RP and higher, 5
Psychometric properties of skills ratings, 85
RRasch difficulty, 86Rasch IRT model, 49Rasch Maximum Information IRT model, 10Rasch model, 85Rating instruments, 82Regional differences in outcome, 102Relationship of STAR Maths 2.0 Scaled Scores to maths
skills ratings, 85Relationship of STAR Maths 2.0 scores to scores on other
tests of mathematics achievement, 66Relationship of STAR Maths 2.0 scores to teacher ratings,
82psychometric properties of skills ratings, 85rating instruments, 82skills rating worksheet, 83
Reliability, 56, 103, 108alternate-form reliability, 58generic reliability, 57split-half, 103split-half reliability, 58test-retest, 103UK study results, 56
Repeating a test, 10

Index
126STAR Maths™Technical Manual
ReportsDiagnostic, 15
Reports, Diagnostic Report, 40Review of calibrated items, 51
rules for item retention, 51Rules
for item retention, 51for writing test items, 41
SSample characteristics, 114Scaled Score. See SSScores
criterion-referenced, 53definitions, types of test scores, 53NCL–M (National Curriculum Level–Maths), 53, 54,
100norm-referenced, 53NRSS (Normed Referenced Standardised Score), 54Percentile Rank Range, 55PR (Percentile Ranks), 55, 94SS (Scaled Score), 44, 55
Scoring, 44Security. See test securitySEM (standard error of measurement), 44, 57, 60Shape and Space, 15Skills rating worksheet, 83Split application model, 7Split-half reliability, 58, 103SS (Scaled Score), 44, 53, 55
relationship of STAR Maths 2.0 Scaled Scores to Maths Skills Ratings, 85
Standard error of measurement. See SEMStandardised scores, 90
calculating for students, 92STAR Maths
program description, 1purpose of the program, 2
Strands, 3, 11, 17Algebra, 16Approximations, 15Computation Processes, 4, 42Computational Processes, 14Data Analysis and Statistics, 16Measures, 15Numeration Concepts, 4, 13, 42Shape and Space, 15Word Problems, 16
Summative assessments, 2
TTeacher ratings, relationship to STAR Maths 2.0 scores, 82Test administration procedures, 8Test design, 13
computer adaptive, 41Test interface, 9Test items, rules for writing, 41Test monitoring/password entry, 8Test repetition, 10Test scores
criterion-referenced scores, 53NCL–M (National Curriculum Level–Maths), 53SS (Scaled Score), 53types of, 53
Test scoring, 44Test security, 7
access levels, 7capabilities, 7data encryption, 7individualised tests, 7split application model, 7test monitoring/password entry, 8
Testing procedure, 42practice session, 9time limits, 11time required, 10
Test-retest reliability, 103Time limits, 11
and the STAR Maths Diagnostic Report, 12Time required to test, 10Types of test scores. See test scores, types of
VValidity, 106, 108
concurrent validity, 64definition, 61meta-analysis of STAR Maths validity data, 81Rasch difficulty, 86relationship of STAR Maths 2.0 scores to scores on
other tests of mathematics achievement, 66relationship of STAR Maths 2.0 scores to teacher
ratings, 82UK study results, 62
WWord Problems, 16


43851.151121
Renaissance Learning™
32 Harbour Exchange Square London, E14 9GE +44 (0)20 7184 4000 www.renlearn.co.uk
About Renaissance Learning
Renaissance Learning is a leading provider of cloud-based assessment technology for primary and secondary schools. A member of the British Educational Suppliers Association (BESA), we also support the National Literacy Trust (NLT), Chartered Institute of Library and Information Professionals (CILIP) and World Book Day.
Our STAR Assessments for reading, maths and early learning incorporate learning progressions built by experts at the National Foundation for Educational Research (NFER), and provide detailed skill-based feedback on student performance, linked to the new curriculum.
The short, computer-adaptive tests provide feedback when it is most valuable—immediately—and bridge assessment and instruction. The reports identify not only the skills students know but also the skills they are ready to learn next. STAR also reports Student Growth Percentiles (SGPs), a measure of student growth new to the UK market.
Our Accelerated Reader (AR) and Accelerated Maths (AM) software programmes help to enhance literacy and numeracy skills. They support differentiated instruction and personalised practice, motivating students to work towards ambitious but realistic targets.
AR and AM are motivational because they provide teachers with immediate feedback to students and their teachers, giving opportunities for praise and for directing future learning. A comprehensive set of reports allow teachers to make monitor and measure growth.
Related Documents