Star Assessments™ for Math Technical Manual

Welcome message from author
This document is posted to help you gain knowledge. Please leave a comment to let me know what you think about it! Share it to your friends and learn new things together.
Transcript

Star Assessments™ for Math Technical Manual

Renaissance LearningPO Box 8036Wisconsin Rapids, WI 54495-8036Telephone: (800) 338-4204(715) 424-3636
Outside the US: 1.715.424.3636Fax: (715) 424-4242Email (general questions): [email protected] (technical questions): [email protected] (international support): [email protected]: www.renaissance.com
Copyright NoticeCopyright © 2018 Renaissance Learning, Inc. All Rights Reserved.
This publication is protected by US and international copyright laws. It is unlawful to duplicate or reproduce any copyrighted material without authorization from the copyright holder. This document may be reproduced only by staff members in schools that have a license for the Star Math software. For more information, contact Renaissance Learning, Inc. at the address shown above.
All logos, designs, and brand names for Renaissance’s products and services, including, but not limited to, Accelerated Math, Accelerated Reader, Accelerated Reader 360, AccelScan, English in a Flash, MathFacts in a Flash, Renaissance, Renaissance Flow 360, Renaissance Growth Platform, Renaissance Growth Alliance, Renaissance Learning, Renaissance-U, Renaissance Smart Start, Star, Star 360, Star Custom, Star Early Literacy, Star Early Literacy Spanish, Star Math, Star Math Spanish, Star Reading, Star Reading Spanish, and Star Spanish are trademarks of Renaissance Learning, Inc. All other product and company names should be considered the property of their respective companies and organizations.
Macintosh is a trademark of Apple Inc., registered in the U.S. and other countries.
3/2018 SM

Contents
Introduction . . . . . . . . . . . . . . . . . . . . . . . . . . . . . . . . . . . . . . . . .1Star Math: Screening and Progress-Monitoring Assessment . . . . . . . . . . . . . . . . . . .1Star Math Purpose . . . . . . . . . . . . . . . . . . . . . . . . . . . . . . . . . . . . . . . . . . . . . . . . . . . . . . . .1Design of Star Math . . . . . . . . . . . . . . . . . . . . . . . . . . . . . . . . . . . . . . . . . . . . . . . . . . . . . . .2
Two Generations of Star Math Assessments . . . . . . . . . . . . . . . . . . . . . . . . . . . . . . . . . . . . . 2Overarching Design Considerations . . . . . . . . . . . . . . . . . . . . . . . . . . . . . . . . . . . . . . . . . . . . . 4Test Interface. . . . . . . . . . . . . . . . . . . . . . . . . . . . . . . . . . . . . . . . . . . . . . . . . . . . . . . . . . . . . . . . . 5Practice Session . . . . . . . . . . . . . . . . . . . . . . . . . . . . . . . . . . . . . . . . . . . . . . . . . . . . . . . . . . . . . . 6
Adaptive Branching/Test Length . . . . . . . . . . . . . . . . . . . . . . . . . . . . . . . . . . . . . . . . . . . .6Test Length . . . . . . . . . . . . . . . . . . . . . . . . . . . . . . . . . . . . . . . . . . . . . . . . . . . . . . . . . . . . . . . . . . 7Test Repetition . . . . . . . . . . . . . . . . . . . . . . . . . . . . . . . . . . . . . . . . . . . . . . . . . . . . . . . . . . . . . . . 8Item Time Limits . . . . . . . . . . . . . . . . . . . . . . . . . . . . . . . . . . . . . . . . . . . . . . . . . . . . . . . . . . . . . . 9
Test Security . . . . . . . . . . . . . . . . . . . . . . . . . . . . . . . . . . . . . . . . . . . . . . . . . . . . . . . . . . . .10Split Application Model . . . . . . . . . . . . . . . . . . . . . . . . . . . . . . . . . . . . . . . . . . . . . . . . . . . . . . . 10Individualized Tests . . . . . . . . . . . . . . . . . . . . . . . . . . . . . . . . . . . . . . . . . . . . . . . . . . . . . . . . . . 10Data Encryption. . . . . . . . . . . . . . . . . . . . . . . . . . . . . . . . . . . . . . . . . . . . . . . . . . . . . . . . . . . . . . 10Access Levels and Capabilities . . . . . . . . . . . . . . . . . . . . . . . . . . . . . . . . . . . . . . . . . . . . . . . . 10Test Monitoring/Password Entry. . . . . . . . . . . . . . . . . . . . . . . . . . . . . . . . . . . . . . . . . . . . . . . 11Final Caveat . . . . . . . . . . . . . . . . . . . . . . . . . . . . . . . . . . . . . . . . . . . . . . . . . . . . . . . . . . . . . . . . . 11
Test Administration Procedures . . . . . . . . . . . . . . . . . . . . . . . . . . . . . . . . . . . . . . . . . . .11
Content and Item Development. . . . . . . . . . . . . . . . . . . . . . 13Content Specification: Star Math . . . . . . . . . . . . . . . . . . . . . . . . . . . . . . . . . . . . . . . . . . .13
Star Math and the Reorganization of Objective Clusters . . . . . . . . . . . . . . . . . . . . . . . . . . 15Calculator and Formula Reference Sheets . . . . . . . . . . . . . . . . . . . . . . . . . . . . . . . . . . . . . . 16Read-Aloud Audio Guidance . . . . . . . . . . . . . . . . . . . . . . . . . . . . . . . . . . . . . . . . . . . . . . . . . . . 17
Content Specification: Star Math Progress Monitoring. . . . . . . . . . . . . . . . . . . . . . . .17Item Development Guidelines: Star Math. . . . . . . . . . . . . . . . . . . . . . . . . . . . . . . . . . . .18Item Development Guidelines: Star Math Progress Monitoring. . . . . . . . . . . . . . . . .19
Renaissance Learning Progression for Math . . . . . . . . . 21Star Math and the Renaissance Learning Progression for Math. . . . . . . . . . . . . . . .21
Item and Scale Calibration . . . . . . . . . . . . . . . . . . . . . . . . . . 23Background . . . . . . . . . . . . . . . . . . . . . . . . . . . . . . . . . . . . . . . . . . . . . . . . . . . . . . . . . . . . .23
iStar Assessments™ for MathTechnical Manual

Contents
The Rasch Item Response Model . . . . . . . . . . . . . . . . . . . . . . . . . . . . . . . . . . . . . . . . . .24Calibration of Star Math for Use in Version 2 . . . . . . . . . . . . . . . . . . . . . . . . . . . . . . . .27
Sample Description . . . . . . . . . . . . . . . . . . . . . . . . . . . . . . . . . . . . . . . . . . . . . . . . . . . . . . . . . . 27Item Presentation . . . . . . . . . . . . . . . . . . . . . . . . . . . . . . . . . . . . . . . . . . . . . . . . . . . . . . . . . . . . 28
Calibration of New Items for Current Star Math Versions . . . . . . . . . . . . . . . . . . . . .30Traditional Item Difficulty . . . . . . . . . . . . . . . . . . . . . . . . . . . . . . . . . . . . . . . . . . . . . . . . .33Item Discriminating Power . . . . . . . . . . . . . . . . . . . . . . . . . . . . . . . . . . . . . . . . . . . . . . . .33Rules for Item Retention . . . . . . . . . . . . . . . . . . . . . . . . . . . . . . . . . . . . . . . . . . . . . . . . . .34Computer-Adaptive Test Design . . . . . . . . . . . . . . . . . . . . . . . . . . . . . . . . . . . . . . . . . . .35Scoring in the Star Math Tests. . . . . . . . . . . . . . . . . . . . . . . . . . . . . . . . . . . . . . . . . . . . .36A New Scale for Reporting Star Math Test Scores. . . . . . . . . . . . . . . . . . . . . . . . . . . .36
Reliability and Measurement Precision . . . . . . . . . . . . . . 3934-Item Star Math Tests . . . . . . . . . . . . . . . . . . . . . . . . . . . . . . . . . . . . . . . . . . . . . . . . . .40
Generic Reliability . . . . . . . . . . . . . . . . . . . . . . . . . . . . . . . . . . . . . . . . . . . . . . . . . . . . . . . . . . . . 40Split-Half Reliability. . . . . . . . . . . . . . . . . . . . . . . . . . . . . . . . . . . . . . . . . . . . . . . . . . . . . . . . . . . 42Alternate Form Reliability . . . . . . . . . . . . . . . . . . . . . . . . . . . . . . . . . . . . . . . . . . . . . . . . . . . . . 43Standard Error of Measurement . . . . . . . . . . . . . . . . . . . . . . . . . . . . . . . . . . . . . . . . . . . . . . . 44
24-Item Star Math Progress Monitoring Tests . . . . . . . . . . . . . . . . . . . . . . . . . . . . . . .47Reliability Coefficients . . . . . . . . . . . . . . . . . . . . . . . . . . . . . . . . . . . . . . . . . . . . . . . . . . . . . . . . 47Standard Error of Measurement . . . . . . . . . . . . . . . . . . . . . . . . . . . . . . . . . . . . . . . . . . . . . . . 48
Validity . . . . . . . . . . . . . . . . . . . . . . . . . . . . . . . . . . . . . . . . . . . 50Content Validity . . . . . . . . . . . . . . . . . . . . . . . . . . . . . . . . . . . . . . . . . . . . . . . . . . . . . . . . . .50Construct Validity . . . . . . . . . . . . . . . . . . . . . . . . . . . . . . . . . . . . . . . . . . . . . . . . . . . . . . . .50
Internal Evidence: Evaluation of Unidimensionality of Star Math . . . . . . . . . . . . . . . . . . . 51Relationship of Star Math Scores to Scores on Other Tests of Mathematics
Achievement . . . . . . . . . . . . . . . . . . . . . . . . . . . . . . . . . . . . . . . . . . . . . . . . . . . . . . . . . . . . 55Meta-Analysis of the Star Math Validity Data . . . . . . . . . . . . . . . . . . . . . . . . . . . . . . . .60
Linking Star and State Assessments: Comparing Student- and School-Level Data . . . . . . . . . . . . . . . . . . . . . . . . . . . . . . . . . . . . . . . . . . . . . . . . . . . . . . . . . . . . . . . . . . . . 61
Relationship of Star Math Scores to Scores on Multi-State Consortium Tests in Math. . . . . . . . . . . . . . . . . . . . . . . . . . . . . . . . . . . . . . . . . . . . . . . . . . . . . . . . . . . . 62
Classification Accuracy of Star Math . . . . . . . . . . . . . . . . . . . . . . . . . . . . . . . . . . . . . . .63Accuracy for Predicting Proficiency on a State Math Assessment . . . . . . . . . . . . . . . . . 63Evidence of Technical Adequacy for Informing Screening and Progress
Monitoring Decisions . . . . . . . . . . . . . . . . . . . . . . . . . . . . . . . . . . . . . . . . . . . . . . . . . . . . . 64Screening . . . . . . . . . . . . . . . . . . . . . . . . . . . . . . . . . . . . . . . . . . . . . . . . . . . . . . . . . . . . . . . . . . . 65Progress Monitoring. . . . . . . . . . . . . . . . . . . . . . . . . . . . . . . . . . . . . . . . . . . . . . . . . . . . . . . . . . 69
Additional Research on Star Math as a Progress Monitoring Tool. . . . . . . . . . . . . . 72Summary of Star Math Validity Evidence. . . . . . . . . . . . . . . . . . . . . . . . . . . . . . . . . . . .73
iiStar Assessments™ for MathTechnical Manual

Contents
Norming. . . . . . . . . . . . . . . . . . . . . . . . . . . . . . . . . . . . . . . . . . . 74Background . . . . . . . . . . . . . . . . . . . . . . . . . . . . . . . . . . . . . . . . . . . . . . . . . . . . . . . . . . . . .74
The 2017 Star Math Norms . . . . . . . . . . . . . . . . . . . . . . . . . . . . . . . . . . . . . . . . . . . . . . . . . . . 74Sample Characteristics . . . . . . . . . . . . . . . . . . . . . . . . . . . . . . . . . . . . . . . . . . . . . . . . . . .75Test Administration . . . . . . . . . . . . . . . . . . . . . . . . . . . . . . . . . . . . . . . . . . . . . . . . . . . . . .79Data Analysis . . . . . . . . . . . . . . . . . . . . . . . . . . . . . . . . . . . . . . . . . . . . . . . . . . . . . . . . . . . .79Growth Norms . . . . . . . . . . . . . . . . . . . . . . . . . . . . . . . . . . . . . . . . . . . . . . . . . . . . . . . . . . .81
Score Definitions. . . . . . . . . . . . . . . . . . . . . . . . . . . . . . . . . . . 83Types of Test Scores . . . . . . . . . . . . . . . . . . . . . . . . . . . . . . . . . . . . . . . . . . . . . . . . . . . . .83
Grade Equivalent (GE) . . . . . . . . . . . . . . . . . . . . . . . . . . . . . . . . . . . . . . . . . . . . . . . . . . . . . . . . 84Grade Equivalent Cap. . . . . . . . . . . . . . . . . . . . . . . . . . . . . . . . . . . . . . . . . . . . . . . . . . . . . 85
Comparing Star Math GEs with Those from Conventional Tests . . . . . . . . . . . . . . . . . . . 86Percentile Rank (PR). . . . . . . . . . . . . . . . . . . . . . . . . . . . . . . . . . . . . . . . . . . . . . . . . . . . . . . . . . 86Normal Curve Equivalent (NCE) . . . . . . . . . . . . . . . . . . . . . . . . . . . . . . . . . . . . . . . . . . . . . . . . 87Student Growth Percentile (SGP). . . . . . . . . . . . . . . . . . . . . . . . . . . . . . . . . . . . . . . . . . . . . . . 88
Grade Placement. . . . . . . . . . . . . . . . . . . . . . . . . . . . . . . . . . . . . . . . . . . . . . . . . . . . . . . . .90Indicating the Appropriate Grade Placement . . . . . . . . . . . . . . . . . . . . . . . . . . . . . . . . . . . . 90Compensating for Incorrect Grade Placements . . . . . . . . . . . . . . . . . . . . . . . . . . . . . . . . . . 91
Conversion Tables . . . . . . . . . . . . . . . . . . . . . . . . . . . . . . . . . 92
Appendix A: Star Math Blueprint Skills . . . . . . . . . . . . . 104
Appendix B: Detailed Evidence of Star Math Validity . . . . . . . . . . . . . . . . . . . . . . . . . . . . . . . . . . . . . . . . . . 137
Relationship of Star Math Scores to Scores on Other Tests of Math Achievement . . . . . . . . . . . . . . . . . . . . . . . . . . . . . . . . . . . . . . . . . . . . . . . . . . . . . . . . . . 137Relationship of Star Math Scores to Teacher Ratings. . . . . . . . . . . . . . . . . . . . . . . 159
The Rating Instruments. . . . . . . . . . . . . . . . . . . . . . . . . . . . . . . . . . . . . . . . . . . . . . . . . . . . . .159Psychometric Properties of the Skills Ratings . . . . . . . . . . . . . . . . . . . . . . . . . . . . . . . . . .162
Relationship of Star Math Scaled Scores to Math Skills Ratings . . . . . . . . . . . . . 163Linking Star and State Assessments: Comparing Student- and School-Level Data . . . . . . . . . . . . . . . . . . . . . . . . . . . . . . . . . . . . . . . . . . . . . . . . . . . . . . 166
Methodology Comparison. . . . . . . . . . . . . . . . . . . . . . . . . . . . . . . . . . . . . . . . . . . . . . . . . . . .167Student-Level Data . . . . . . . . . . . . . . . . . . . . . . . . . . . . . . . . . . . . . . . . . . . . . . . . . . . . . .167School-Level Data . . . . . . . . . . . . . . . . . . . . . . . . . . . . . . . . . . . . . . . . . . . . . . . . . . . . . . .168
Accuracy Comparisons . . . . . . . . . . . . . . . . . . . . . . . . . . . . . . . . . . . . . . . . . . . . . . . . . . . . . .168
iiiStar Assessments™ for MathTechnical Manual

Contents
References . . . . . . . . . . . . . . . . . . . . . . . . . . . . . . . . . . . . . . . 172
Index. . . . . . . . . . . . . . . . . . . . . . . . . . . . . . . . . . . . . . . . . . . . . 175
ivStar Assessments™ for MathTechnical Manual

Introduction
Star Math: Screening and Progress-Monitoring AssessmentSince the 2011–2012 school year, two different versions of Star Math have been available for use in assessing the mathematical abilities of students in grades K–12. The comprehensive version is a 34-item standards-based adaptive assessment, aligned to state and national curriculum standards, that takes an average of less than 25 minutes. A shorter, 24-item version takes an average of less than 14 minutes, making it a popular choice for progress monitoring in programs such as Response to Intervention. Both versions provide immediate feedback to teachers and administrators on each student’s mathematical ability.
Star Math PurposeAs a periodic progress-monitoring assessment, Star Math progress monitoring serves three purposes. First, it provides educators with quick and accurate estimates of students’ instructional math levels. Second, it assesses math levels relative to national norms. Third, it provides the means for tracking growth in a consistent manner longitudinally for all students. This is especially helpful to school- and district-level administrators.
The lengthier Star Math test serves similar purposes. While the Star Math test provides accurate normed data like traditional norm-referenced tests, it is not intended to be used as a “high-stakes” test. Generally, states are required to use high-stakes assessments to document growth, adequate yearly progress, and mastery of state standards. These high-stakes tests are also used to report end-of-period performance to parents and administrators or to determine eligibility for promotion or placement. Star Math is not intended for these purposes. Rather, because of the high correlation between the Star Math test and high-stakes instruments, classroom teachers can use Star Math scores to fine-tune instruction while there is still time to improve performance before the regular test cycle. At the same time, school- and district-level administrators can use Star Math to predict performance on high-stakes tests. Furthermore, Star Math results can easily be disaggregated to identify and address the needs of various groups of students.
1Star Assessments™ for MathTechnical Manual

IntroductionDesign of Star Math
The Star Math test’s repeatability and flexible administration provide specific advantages for everyone responsible for the education process:
For students, Star Math software provides a challenging, interactive, and brief test that builds confidence in their math ability.
For teachers, the Star Math test facilitates individualized instruction by identifying children who need remediation or enrichment most.
For principals, the Star Math software provides regular, accurate reports on performance at the class, grade, and building level.
For district administrators and assessment specialists, it provides a wealth of reliable and timely data on math growth at each school and districtwide. It also provides a valid basis for comparing data across schools, grades, and special student populations.
This manual documents the suitability of Star Math computer-adaptive testing for these purposes and demonstrates quantitatively how well this innovative instrument in math assessment performs.
Star Math is similar in many ways to the Star Math progress monitoring version, but with some enhanced features, including additional reports and expanded benchmark management.
Design of Star Math
Two Generations of Star Math AssessmentsThe introduction of the current version of Star Math in 2011 marked the second generation of Star Math assessments. The first generation consisted of the Star Math Progress Monitoring version, which is a fixed-length 24-item adaptive assessment of math levels. This original version of Star Math was published in 1998 and used Item Response Theory (IRT) as the psychometric foundation for adaptive item selection and scoring. Star Math’s original item bank contained 2,000+ items spanning more than 200 objectives.
A fundamental design decision involved determining the organization of the content in Star Math Progress Monitoring. Because of the great amount of overlap in content in the math construct, it is difficult to create distinct categories or “strands” for a mathematics achievement instrument. After reviewing the Star Math Progress Monitoring test’s content, curricular materials, and similar math achievement instruments, the following eight strands were identified and included in the original Star Math test: Numeration Concepts; Computation Processes; Word Problems; Estimation, Data Analysis and Statistics; Geometry; Measurement; and Algebra.
2Star Assessments™ for MathTechnical Manual

IntroductionDesign of Star Math
The Star Math Progress Monitoring test is further divided into two parts. The first part of the test, the first sixteen items, includes items only from the Numeration Concepts and the Computation Processes strands. The first eight test items (items 1–8) are from the Numeration Concepts strand, and the following eight test items (items 9–16) are from the Computation Processes strand.
The second part of the test, or the final eight items, includes items from all of the remaining strands. Hence, items 17–24 are drawn from the following six strands: Word Problems; Estimation; Data Analysis and Statistics; Geometry; Measurement; and Algebra. The specific makeup of the strands used in the final eight items depends on the student’s grade level. For example, a student in grade 1 will not receive items from the Estimation strand, but items from this strand could be administered to a student in grade 12.
The decision to weight the test heavily toward Numeration Concepts and Computation Processes resulted from the fact that these strands are fundamental to all others, and they include the content about which teachers desire the most information. Although this approach emphasizes the two strands in the first part of the test, it provides adequate content balance to assure valid assessment. Additionally, factor analysis of the various content strands supports the fundamental unidimensionality of the construct being measured in the Star Math Progress Monitoring test.
The second generation is the current version of Star Math published in 2011. This is the first version of Star Math to be designed as a standards-based test. The organization of the content in Star Math differs from that of the original Star Math test—the Star Math Progress Monitoring test. Star Math’s content organization reflects current thinking, as embodied in many different sets of national and local curriculum standards. The following four domains were identified and included in Star Math: Numbers and Operations; Algebra; Geometry & Measurement; and Data Analysis, Statistics & Probability. Within each of these domains, skills are organized into skill sets; there are 54 skill sets in all, comprising a total of over 790 core skills.
The Star Math test is a 34-item standards-based version, administered as 6 blocks of items in a single section. Each block of items contains a blend of items from the 4 domains. The number of items administered in a block varies by grade band. The item sequencing calls for more content balance at the beginning, middle, and end of the test by “spiraling” the content throughout the test, thus ensuring that the math ability estimate at any point during a test is based on a broad range of content, rather than on a limited sample of skills.
Thus, this second generation differed from the first in three major respects: It organized the content differently, its test length increased to 34 items, and the
3Star Assessments™ for MathTechnical Manual

IntroductionDesign of Star Math
size of the item banks grew to over 6,000 items. Like the first generation of Star Math tests, the second generation continues to measure a single construct: mathematical achievement.
Overarching Design ConsiderationsOne of the fundamental Star Math design decisions involved the choice of how to administer the test. The primary advantage of using computer software to administer Star Math tests is the ability to tailor each student’s test based on his or her responses to previous items. Conventional assessments, including paper-and-pencil tests, typically entail fixed test forms: every student must respond to the same items in the same sequence. Using computer-adaptive procedures, it is possible for students to test on items that appropriately match their current level of proficiency. The item selection procedures, termed Adaptive Branching, effectively customize the test for each student’s achievement level.
Adaptive Branching offers significant advantages in terms of test reliability, testing time, and student motivation. Reliability improves over fixed-form tests because the test difficulty is adjusted to each individual’s performance level; students do not have to fit a “one test fits all” model. Most of the test items that students respond to are at levels of difficulty that closely match their achievement level. Testing time decreases because, unlike in paper-and-pencil tests, there is no need to expose every student to a broad range of material, portions of which are inappropriate because they are either too easy for high achievers or too difficult for those with low current levels of performance. Finally, student motivation improves simply because of these issues—test time is minimized and test content is neither too difficult nor too easy.
Another fundamental Star Math design decision involved the choice of the content and format of items for the test. Many types of stimulus and response procedures were explored, researched, discussed, and prototyped. The traditional multiple-choice format was chosen. This decision was made for interrelated reasons of efficiency, breadth of construct coverage, and objectivity and simplicity of scoring.
In both Star Math Progress Monitoring and Star Math, all management and test administration functions are controlled using a management system which is accessed by means of a computer with web access. This makes a number of features possible:
It makes it possible for multiple schools to share a central database, such as a district-level database. Records of students transferring between schools within the district will be maintained in the database; the only
4Star Assessments™ for MathTechnical Manual

IntroductionDesign of Star Math
information that needs revision following a transfer is the student’s updated school and class assignments.
The same database that contains Star Math data can contain data on other Star tests, including Star Early Literacy and Star Reading. The Renaissance program is a powerful information management program that allows you to manage all your district, school, personnel, and student data in one place. Changes made to district, school, teacher, and student data for any of these products, as well as other Renaissance software, are reflected in every other Renaissance program sharing the central database.
Multiple levels of access are available, from the test administrator within a school or classroom to teachers, principals, and district administrators.
Renaissance takes reporting to a new level. Not only can you generate reports from the student level all the way up to the school level, but you can also limit reports to specific groups, subgroups, and combinations of subgroups. This supports “disaggregated” reporting; for example, a report might be specific to students eligible for free or reduced lunch, to English language learners, or to students who fit both categories. It also supports compiling reports by teacher, class, school, grade within a school, and many other criteria such as a specific date range. In addition, the Renaissance consolidated reports allow you to gather data from more than one program (such as Star Math and Accelerated Math) at the teacher, class, school, and district level and display the information in one report.
Since the Renaissance software is accessed through a web browser, teachers (and administrators) will be able to access the program from home.
For both versions of Star Math, all shortcuts to the student program will automatically redirect to the browser-based program (the Renaissance Welcome page) each time they are used.
Test InterfaceThe Star Math test interface was designed to be both simple and effective. Students can use either the mouse or the keyboard to answer questions.
If using the keyboard, students press one of the four letter keys (A, B, C, and D) and then press the Enter key (or the return key on Macintosh computers).
If using the mouse, students click the answer of choice and then click Next to enter the answer.
On a tablet, students tap their answer choice; then, they tap Next.
5Star Assessments™ for MathTechnical Manual

IntroductionAdaptive Branching/Test Length
Practice SessionStar Math software includes a provision for a brief practice test preceding the test itself. The practice session allows students to get comfortable with the test interface and to make sure that they know how to operate it properly. As soon as a student has answered two out of three practice questions correctly, the program takes the student into the actual test. If the student has not successfully answered two of the three items by the end of the practice session, Star Math will present three more questions, and the student can pass the practice session by answering two of those questions correctly. If the student does not pass after the second attempt, the student will not proceed to the actual Star Math test. Even students with low math and reading skills should be able to answer the practice questions correctly. However, Star Math will halt the testing session and tell the student to ask the teacher for help if the student does not pass the practice session after the second attempt.
Students may experience difficulty with the practice questions for a variety of reasons. The student may not understand math even at the most basic level or may be confused by the “not given” response option presented in some of the practice questions. Alternatively, the student may need help using the keyboard or mouse. If this is the case, the teacher (or monitor) should help the student through the practice session during the student’s next Star Math test. If a student still struggles with the practice questions with teacher assistance, he or she may not yet be ready to complete a Star Math test.
Once a student has successfully passed a practice session, the student will not be presented with practice items again on a test of the same type taken within the next 180 days.
Adaptive Branching/Test LengthStar Math’s branching control uses a proprietary approach somewhat more complex than the simple Rasch maximum information IRT model. The Star Math approach was designed to yield reliable test results for both the criterion-referenced and norm-referenced scores by adjusting item difficulty to the responses of the individual being tested while striving to minimize test length and student frustration.
In order to minimize student frustration, the first administration of the Star Math test begins with items that have a difficulty level that is below what a typical student at a given grade can handle—usually one or two grades below grade placement. On the average, about 85 percent of students will be able to answer the first item correctly. Teachers can override the use of grade placement for determining starting difficulty by entering the current level of
6Star Assessments™ for MathTechnical Manual

IntroductionAdaptive Branching/Test Length
mathematics instruction for the student using the MIL (Math Instructional Level). When an MIL is provided, the program uses that value to raise or lower the starting difficulty of the first test. On the second and subsequent administrations, the test begins about one grade lower than the ability last demonstrated within 180 days. Students generally have an 85 percent chance of answering the first item correctly on second and subsequent tests.
Test LengthOnce the testing session is underway, the Star Math test administers 34 items (or 24 items for the Star Math Progress Monitoring test) of varying difficulty based on the student’s responses; this is sufficient information to obtain a reliable Scaled Score and to determine the student’s math Level.
The length of time needed to complete a Star Math test varies across students.
Table 1 provides an overview of the testing time by grade for the students who took the full-length 34-item version of Star Math during the 2015–2016 school year. The results of the analysis of test completion time indicate that half or more of students completed the test in less than 25 minutes, depending on grade, and even in the slowest grade (grade 6) 95% of students finished their Star Math test in less than 39 minutes.
Table 1: Average and Percentiles of Total Time to Complete the 34-item Star Math Assessment During the 2015–2016 School Year
Grade Sample Size
Time to Complete Test (in Minutes)
MeanStandard Deviation
5th Percentile
50th Percentile
95th Percentile
99th Percentile
1 1,377,043 15.12 5.81 8.62 13.70 26.55 34.50
2 2,229,776 17.66 6.60 9.28 16.42 30.32 38.07
3 2,357,502 21.67 7.74 10.73 20.67 36.12 43.45
4 2,270,155 22.73 7.66 11.60 21.85 36.90 43.92
5 2,148,471 23.37 7.63 12.18 22.55 37.40 44.25
6 1,726,466 24.53 7.85 12.65 23.85 38.68 45.15
7 1,456,696 24.24 7.80 12.37 23.62 38.22 44.57
8 1,376,422 23.65 7.67 12.08 23.00 37.40 43.85
9 601,818 21.88 7.75 10.70 20.98 36.15 42.97
10 441,361 21.50 7.83 10.33 20.53 35.93 42.75
11 279,412 21.19 7.86 10.08 20.20 35.73 42.43
12 145,551 20.84 8.01 9.77 19.72 35.75 42.95
7Star Assessments™ for MathTechnical Manual

IntroductionAdaptive Branching/Test Length
Table 2 provides an overview of the Star Math Progress Monitoring testing time by grade for the students using data from the 2015–16 school year. For that version of the test, about half of the students at every grade completed the Star Math Progress Monitoring test in less than 13 minutes, and even in the slowest grade (grade 4) 95 percent of students finished in less than 23 minutes.
Test RepetitionStar Math score data can be used for multiple purposes such as screening, placement, planning instruction, benchmarking, and outcomes measurement. The frequency with which the assessment is administered depends on the purpose for assessment and how the data will be used. Renaissance Learning recommends assessing students only as frequently as necessary to get the data needed. Schools that use Star for screening purposes typically administer it two to five times per year. Teachers who want to monitor student progress more closely or use the data for instructional planning may use it more frequently. Star Math may be administered monthly for progress monitoring purposes, and as often as weekly when needed.
Star Math keeps track of the questions presented to each student from test session to test session and will not ask the same question more than once in any 75-day period.
Table 2: Average and Percentiles of Total Time to Complete the 24-item Star Math Progress Monitoring Assessment During the 2015–2016 School Year
Grade Sample Size
Time to Complete Test (in Minutes)
MeanStandard Deviation
5th Percentile
50th Percentile
95th Percentile
99th Percentile
1 45,961 9.99 4.15 5.45 8.95 17.97 23.75
2 89,504 11.09 4.69 5.67 10.05 19.98 26.13
3 109,487 12.58 5.14 6.08 11.65 22.12 28.40
4 105,352 13.14 5.03 6.42 12.38 22.42 28.22
5 95,278 13.18 4.91 6.55 12.43 22.23 27.83
6 56,421 13.13 4.90 6.52 12.40 22.20 27.77
7 39,245 13.09 5.03 6.40 12.30 22.45 27.93
8 32,222 12.62 4.93 6.18 11.83 21.72 27.35
9 8,804 11.74 4.69 5.85 10.88 20.30 25.57
10 8,045 11.38 4.48 5.75 10.57 19.85 24.92
11 7,357 11.48 4.50 5.80 10.62 20.07 24.95
12 4,719 11.67 4.79 5.80 10.68 20.58 26.40
8Star Assessments™ for MathTechnical Manual

IntroductionAdaptive Branching/Test Length
Item Time LimitsThe Star Math tests place no limits on total testing time. However, there are time limits for each test item. The per-item time limits are generous, and ensure that more than 90 percent of students can complete each item within the normal time limits. Each practice question has a 90-second time limit and each test question has a 3-minute time limit.
Standard Time Limits:
Practice questions: 90 seconds (1.5 minutes) for each question
Test questions 180 seconds (3 minutes) for each question
Star Math also provides the option of extended time limits for selected students who, in the judgment of the test administrator, require more than the standard amount of time to read and answer the test questions. Extended time limits are twice as long as standard time limits.
Extended Time Limits:
Practice questions: 180 seconds (3 minutes) for each question
Test questions: 360 seconds (6 minutes) for each question
Extended time may be a valuable accommodation for English language learners as well as for some students with disabilities. Test users who elect the extended time limit for their students should be aware that Star Math norms, as well as other technical data such as reliability and validity, are based on test administration using the standard time limits. When the extended time limit accommodation is elected, students have two times longer than the standard time limits to answer each question.
At all grades, regardless of the extended time limit setting, when a student has only 15 seconds remaining for a given item, a time-out warning appears, indicating that he or she should make a final selection and move on. Items that time out are counted as incorrect responses unless the student has the correct answer selected when the item times out. If the correct answer is selected at that time, the item will be counted as a correct response.
If a student doesn’t respond to an item, the item times out and briefly gives the student a message describing what has happened. Then the next item is presented. The student does not have an opportunity to take the item again. If a student doesn’t respond to any item, all items are scored as incorrect.
9Star Assessments™ for MathTechnical Manual

IntroductionTest Security
Test SecurityStar Math software includes a number of security features to protect the content of the test and to maintain the confidentiality of the test results.
Split Application ModelWhen students log into Star Math, they do not have access to the same functions that teachers, administrators, and other personnel can access. Students are allowed to take the test, but no other features available in Star Math are available to them; therefore, they have no access to confidential information. When teachers and administrators log in, they can manage student and class information, set preferences, and create informative reports about student test performance.
Individualized TestsUsing Adaptive Branching, every Star Math test consists of items chosen from a large number of items of similar difficulty based on the student’s estimated ability. Because each test is individually assembled based on the student’s past and present performance, identical sequences of items are rare. This feature, while motivated chiefly by psychometric considerations, contributes to test security by limiting the impact of item exposure.
Data EncryptionA major defense against unauthorized access to test content and student test scores is data encryption. All of the items and export files are encrypted. Without the appropriate decryption code, it is practically impossible to read the Star Math data or access or change it with other software.
Access Levels and CapabilitiesEach user’s level of access to a Renaissance program depends on the primary position assigned to that user. Each primary position is part of a user permission group. There are six of these groups: district level administrator, district dashboard owner, district staff, school level administrator, school staff, and teacher. By default, each user permission group is granted a specific set of user permissions; each user permission corresponds to one or more tasks that can be performed in the program. The user permissions for these groups can be changed, and user permissions can be granted or removed on an individual level.
10Star Assessments™ for MathTechnical Manual

IntroductionTest Administration Procedures
Renaissance also allows you to restrict students’ access to certain computers. This prevents students from taking Star Math tests from unauthorized computers (such as home computers). For more information, see https://help2.renaissance.com/setup/22509.
The security of the Star Math data is also protected by each person’s user name (which must be unique) and password. User names and passwords identify users, and the program only allows them access to the data and features that they are allowed based on their position and the user permissions that they have been granted. Personnel who log in to Renaissance (teachers, administrators, or staff) must enter a user name and password before they can access the data and create reports. Without an appropriate user name and password, personnel cannot use the Star Math software.
Test Monitoring/Password EntryTest monitoring is another useful Star Math security feature. Test monitoring is implemented using the Password Requirement preference, which specifies whether monitors must enter their passwords at the start of a test. Students are required to enter a user name and password to log in before taking a test. This ensures that students cannot take tests using other students’ names.
Final CaveatWhile Star Math software can do much to provide specific measures of test security, the most important line of defense against unauthorized access or misuse of the program is the user’s responsibility. Teachers and test monitors need to be careful not to leave the program running unattended and to monitor all testing to prevent students from cheating, copying down questions and answers, or performing “print screens” during a test session. Taking these simple precautionary steps will help maintain Star Math’s security and the quality and validity of its scores.
Test Administration ProceduresIn order to ensure consistency and comparability of results to the Star Math norms, students taking Star Math tests should follow standard administration procedures. The testing environment should be as free from distractions for the student as possible.The Test Administration Manual included with the Star Math product (https://help2.renaissance.com/US/PDF/SM/SM_TAM.pdf) describes the standard test orientation procedures that teachers should follow to prepare
11Star Assessments™ for MathTechnical Manual

IntroductionTest Administration Procedures
their students for the Star Math test. These instructions are intended for use with students of all ages and were successfully field-tested with students ranging from grades 1–12. It is important to use these same instructions with all students before they take the Star Math test.
12Star Assessments™ for MathTechnical Manual

Content and Item Development
Content of the Star Math test has evolved through three stages of development. The first stage involved specifying the curriculum content to be reflected in the test. Because rules for writing the items influenced the exact ways in which this content finally appeared in the test, these rules may be considered part of this first stage of development. The following section describes these rules. In the second stage, items were empirically tested in a calibration research program, and items most suited to the test model were retained. The third stage occurs dynamically as each student completes a Star Math test. The content of each Star Math test depends on the selection of items for that individual student according to the computer-adaptive testing mode.
Content Specification: Star MathSince the introduction of the initial version of the Star Math test in 1998, it has undergone a process of continuous research and improvement, and has evolved into the two distinct versions now in use. The Star Math Progress Monitoring version is the direct descendant of Star Math version 1: a 24-item test of general math achievement based on content that is heavily weighted towards numeration concepts and operations. Star Math itself is now a 34-item standards-based assessment, with a content distribution that changes as grade levels increase between the primary and high school grades.
Relative to Star Math Progress Monitoring, Star Math is an expanded test with new content and several technical innovations. The Star Math item bank has expanded from the original bank of 1,900 test items to more than 6,200 test items and will continue to grow as standards and curriculums evolve. The Star Math test content began with 210 skills and has expanded to include 790 skills that significantly enhance the test’s ability to measure math skills in various state learning progressions.
For information regarding the development of Star Math items, see “Item Development Guidelines: Star Math” on page 18. Before inclusion in the Star Math item bank, all Star Math items are reviewed to ensure they meet the content specifications for Star Math item development. Items that do not meet the specifications are revised and recalibrated or discarded. All new item development adheres to the content specifications.
The first stage of the expanded Star Math development was identifying the set of skills to be assessed. Multiple resources were consulted to determine the
13Star Assessments™ for MathTechnical Manual

Content and Item DevelopmentContent Specification: Star Math
set of skills most appropriate for assessing the mathematics development of K–12 US students, typical mathematics curricula, and current mathematics standards. The resources include, but are not limited to:
Common Core State Standards for Mathematics
National Mathematics Advisory Panel, Foundations for Success: The final report of the National Mathematics Advisory Panel
National Council of Teachers of Mathematics (NCTM), Curriculum Focal Points for Prekindergarten Through Grade 8 Mathematics
NCTM, Principles and Standards for School Mathematics
US State standards from all 50 states, updated annually
Singapore primary and secondary mathematics standards
National Assessment of Educational Progress (NAEP)
Trends in International Mathematics and Science Study (TIMSS)
The development of the skills list included iterative reviews by mathematicians, mathematics educators, assessment experts, and psychometricians specializing in educational assessment. See “Appendix A: Star Math Blueprint Skills” on page 104 for the Star Math Skills List.
For the purpose of content development, the skills list has been organized into four domains: Numbers and Operations; Algebra; Geometry and Measurement; and Data Analysis, Statistics, and Probability. To ensure appropriate distribution of items within each individual test, the assessment blueprint uses six content domains by treating Numbers, Operations, Geometry, and Measurement as separate domains.
The second development stage included item creation and calibration. Assessment items are developed according to established specifications for grade-level appropriateness and then reviewed to ensure the items meet the specifications. Grade-level appropriateness is determined by multiple factors, including math skill, reading level, cognitive load, vocabulary grade level, sentence structure, sentence length, subject matter, and interest level. All writers and editors have content-area expertise and relevant classroom experience and use those qualifications in determining grade-level appropriateness for subject matter and interest level. A strict development process is maintained to ensure quality item development.
Assessment items, once written, edited, and reviewed, are field tested and calibrated to estimate their Rasch difficulty parameters and goodness of fit to the model. Field testing and calibration are conducted in a single step. This is done by embedding new items in appropriate, random positions within the
14Star Assessments™ for MathTechnical Manual

Content and Item DevelopmentContent Specification: Star Math
Star assessments to collect the item response data needed for psychometric evaluation and calibration analysis.
Following these analyses, each assessment item, along with both traditional and IRT analysis information (including fit plots) and information about the test level, form, and item identifier, are stored in an item statistics database. A panel of content reviewers then examines each item to determine whether the item meets all criteria for use in an operational assessment. More detailed information about the field testing and calibration of Star Math items may be found in the Item and Scale Calibration chapter of this manual.
Star Math and the Reorganization of Objective Clusters The original version of Star Math organized items into 8 content strands, spanning 17 skill sets and 210 discrete skills. Star Math assesses 790 skills in four standards-based blueprint domains, as outlined in Table 3:
Many of the Star Math Progress Monitoring strands are still represented in the new domains; they are just grouped differently. The organization of Star Math domains and skill sets is modeled after the state standards and the Renaissance Learning Progression for Math.
Within each domain, skills are organized into sets of closely related skills sets. The resulting hierarchical structure is blueprint domain, blueprint skill set, and blueprint skill. There are four math domains, 54 skill sets, and 790 skills. See “Appendix A: Star Math Blueprint Skills” on page 104 for a complete list of the Star Math blueprint domains, blueprint skill sets, and blueprint skills.
Table 3: Comparison of Domains and Skill Sets: Star Math Progress Monitoring versus Star Math
Star Math Progress Monitoring Strands Star Math Blueprint Domains
Skills assessed in: 1. Numeration2. Computation3. Word Problems4. Geometry5. Measurement6. Algebra7. Estimation8. Data Analysis and Statistics
1. Numbers and Operations2. Algebra3. Geometry & Measurements4. Data Analysis, Statistics &
Probability
Skill sets 17 54
Number of skills 210 790
15Star Assessments™ for MathTechnical Manual

Content and Item DevelopmentContent Specification: Star Math
Calculator and Formula Reference SheetsFor specific Star Math skills, a calculator or formula reference sheet is made available to the student alongside of the test item. Depending on the item and the skill addressed, either the calculator, a formula reference sheet specific to the skill, or both may be used. For the purpose of test validity, these tools are provided in the application rather than the student using their own to ensure that they are used only for appropriately identified skills.
Calculator or Formula Reference sheets are available for two general circumstances: 1) the calculation is overly difficult to perform without either a calculator or a reference chart or 2) the ability to perform the calculations is not the focus of the skill, and the calculations are difficult or time-consuming (e.g., word problems, solving equations, or finding the terms of a sequence).
Formula reference sheets are available for upper-grade skills in which the formula and math relations needed are not expected for student memorization. This decision is based on analysis of the ACT, SAT, ADP, and formula reference sheets used on state end-of-year tests.
An analysis of state assessments produced the following guidelines in determining when a calculator should be made available for Star Math:
Table 4: Determination of Calculator Availability in Star Math
Calculation Upper Limits of Not Using a Calculatora
a. When calculation is not the focus of the skill.
Division (1–2 step problems) Divisors may be 1-digit, multiples of 25, fractions with 1-digit denominators, or related to basic math facts (1440/120). Other 2-digit divisors may be included if the division is carried out to only 2 or 3 places.
Multiplication (1–2 step problems) 3-digit by 2-digit, 1-digit by 4-digit (non-zero digits).
Multi-step problems (3+ steps) 2-digit by 2-digit multiplication, 1-digit divisors, other limits listed below.
Powers 2-digit numbers squared, 1-digit numbers raised to the 4th power, 2 or 3 raised to a higher power.
Square roots Perfect squares related to square of the numbers 1–13 (e.g., square root of 144).
Nth roots Cube roots resulting in one-digit numbers, nth roots resulting in 2 or 3.
Mean (average) Up to 6 one- or two-digit numbers or 4 multi-digit numbers.
16Star Assessments™ for MathTechnical Manual

Content and Item DevelopmentContent Specification: Star Math Progress Monitoring
Read-Aloud Audio GuidanceFor students challenged by textual reading and the language involved in a Star Math test, read-aloud audio guidance was developed as an accommodation. Read-aloud guidance is turned off for all students by default, but teachers may choose to turn it on either for individual students or an entire class. The accommodation is not intended to be used for all students, blind or low-vision students, but instead is intended to assist teachers to work with students whose language skills are at a lower level than their math skills or who have reading challenges that might prevent them from understanding the item. Audio scripts are not intended to read the entire item aloud for students who cannot read or have extreme visual disabilities.
In order to ensure students receiving read-aloud audio guidance do not have an advantage over other students, some items receive a standard audio prompt of “Choose the best answer.” Examples of items receiving this prompt would be if the stem included a single below-grade word such as “solve,” or “simplify.” Another example would be an item that includes a graphic of a coin and the student is asked to identify the value. Referring to the coin as “a quarter” in the audio prompt may make the item easier for a student who knows a quarter is worth $.25, but cannot identify the quarter visually. For content-specific scripts, only numbers and math expressions embedded within sentences are read. Audio is not included for labels on charts and graphs. Content-specific scripts will be provided for answer choices in items that would pose significant difficulty for struggling readers.
For technical reasons, a single audio file is used for each item requiring audio support, even when audio support contains both the stem and answer options. Students may replay the audio at any time, and may answer the item before the audio has finished playing.
Content Specification: Star Math Progress MonitoringItem development for the original Star Math Progress Monitoring test predates the bank for Star Math, although both tests were developed with the same overarching goals in mind: to accurately measure the target skill in an accurate and concise manner.
Prior to development of the current Star Math test, content for Star Math Progress Monitoring was intended to reflect the objectives commonly taught in the mathematics curriculum of contemporary schools (primarily in the United States). Four major sources helped to define this curriculum content. First, an extensive review of content covered by leading mathematics textbook series was conducted. Second, state curriculum guides or lists of objectives
17Star Assessments™ for MathTechnical Manual

Content and Item DevelopmentItem Development Guidelines: Star Math
were reviewed. Third, the Principles and Standards for School Mathematics of the National Council of Teachers of Mathematics (NCTM) was employed. Finally, content specifications from the National Assessment of Educational Progress (NAEP) and the Trends in International Mathematics and Science Study (TIMSS) were consulted. There is reasonable, although not universal, agreement among these sources about the content of mathematics curricula.
The final Star Math content specifications were intended to cover the objectives most frequently found in these four sources. In the end, the Star Math content was organized into eight strands: Numeration Concepts; Computation Processes; Word Problems; Estimation; Data Analysis and Statistics; Geometry; Measurement; and Algebra.
Item Development Guidelines: Star MathStar Math assesses more than 790 grade-specific blueprint skills. Item development is skill-specific. Each item in the item bank is developed for and clearly aligned to one skill. Answering an item correctly does not require math knowledge beyond the expected knowledge for the skill being assessed. The reading level and math level of the item are grade-level appropriate.The ATOS readability formula is used to identify reading level.
Star Math items are multiple-choice. Most items have four answer choices. An item may have two or three answer choices if appropriate for the skill. Items are distributed among difficulty levels. Correct answer choices are equally distributed by difficulty level.
Item development meets established demographic and contextual goals that are monitored during development to ensure the item bank is demographically and contextually balanced. Goals are established and tracked in the following areas: gender, ethnicity, occupation, age, and disability. Items adhere to strict bias and fairness criteria. Items are free of stereotyping, representing different groups of people in non-stereotypical settings. Items do not refer to inappropriate content that includes, but is not limited to content that presents stereotypes based on ethnicity, gender, culture, economic class, or religion; presents any ethnicity, gender, culture, economic class, or religion unfavorably; introduces inappropriate information, settings, or situations; references illegal activities; references sinister or depressing subjects; references religious activities or holidays based on religious activities; references witchcraft; or references unsafe activities.
The majority of items within a skill are homogeneous in presentation, format, or scenario, but have differing computations. A skill may have two or three scenarios which serve as the basis for homogeneous groupings of items
18Star Assessments™ for MathTechnical Manual

Content and Item DevelopmentItem Development Guidelines: Star Math Progress Monitoring
within a skill. All items for a skill are unique. Text is typically presented as 18-point Arial, but smaller text may be necessary to label charts or graphs. Every complete item is presented on screen with stimulus, stem and answer choices visible. Scroll bars are never used, to minimize cognitive load and confusion created by not having all relevant information available at once. Graphics are included in an item only when necessary to solve the problem.
Item stems meet the following criteria with limited exceptions. When possible, the stem is presented in purely mathematic form or may be limited to a single direction such as “simplify.” When an item requires more complex language, the question is concise, direct, and a complete sentence. The question is written so students can answer it without reading the distractors. Generally, completion (blank) stems are not used. If a completion stem is necessary, the stem contains enough information for the student to complete the stem without reading the distractors, and the completion blank is as close to the end of the stem as possible. The stem does not include verbal or other clues that hint at correct or incorrect distractors. The syntax and grammar are straightforward and appropriate for the grade level.
Negative construction is avoided. The stem does not contain more than one question or part. Concepts and information presented in the items are accurate, up-to-date, and verifiable. This includes but is not limited to dates, measurements, locations, and events.
Distractors meet the following criteria with limited exceptions. All distractors are plausible and reasonable. Distractors do not contain clues that hint at correct or incorrect distractors. Incorrect answers are created based on common student mistakes. Distractors that are not common mistakes may vary between being close to the correct answer or close to a distractor that is the result of a common mistake. Distractors are independent of each other, are approximately the same length, have grammatically parallel structure, and are grammatically consistent with the stem. None of these, none of the above, not given, all of the above, and all of these are generally avoided as distractors.
Item Development Guidelines: Star Math Progress MonitoringWhen preparing specific items to test student knowledge of the content selected for Star Math Progress Monitoring, several item-writing rules were employed. These rules helped to shape the final appearance of the content and hence became part of the content specifications:
The first and perhaps most important rule was to have the item content, wording, and format reflect the typical appearance of the content in curricular materials. In some testing applications, one might want the item
19Star Assessments™ for MathTechnical Manual

Content and Item DevelopmentItem Development Guidelines: Star Math Progress Monitoring
to look different from how the content typically appears in curricular materials. However, the goal for the Star Math test was to have the items reflect how the content appears in curricular materials that students are likely to have used.
Second, every effort was made to keep item content simple and to keep the required reading levels low. Although there may be some situations in which one would want to make test items appear complex or use higher levels of reading difficulty, for the Star Math test, the intent was to simplify when possible.
Third, efforts were made both in the item-writing and in the item-editing phases to minimize cultural loading, gender stereotyping, and ethnic bias in the items.
Fourth, the items had to be written in such a way as to be presented in the computer-adaptive format. More specifically, items had to be presentable on the types of computer screens commonly found in schools. This rule had one major implication that influenced item presentation: artwork was limited to fairly simple line drawings, and colors were kept to a minimum.
Finally, items were all to be presented in a multiple-choice format. Answer choices were to be laid out in either a 4 × 1 matrix, a 2 × 2 matrix, or a 1 × 4 matrix.
In all cases, the distracters chosen were representative of the most common errors for the particular question stem. A “not given” response option was included only for the Computation Processes strand. This option was included to minimize estimation as a response strategy and to encourage the student to actually work the problem to completion.
20Star Assessments™ for MathTechnical Manual

Renaissance Learning Progression for Math
Star Math and the Renaissance Learning Progression for Math
Star Math bridges assessment and instruction through a research-based Renaissance learning progression for math to help teachers make effective instructional decisions and to adjust instruction to meet the needs of students at different achievement levels. All 50 US states have their own individualized learning progression, which is based on their own state’s standards and updated yearly as standards change. The Renaissance learning progression for math identifies the continuum—or instructional sequence—of math concepts written as skills spanning from early numeracy through high-school level algebra and geometry. It was developed in consultation with leading experts in mathematics and supported by calibration data and psychometric analysis.
To map the Renaissance learning progression and Star Math, developers created Star Math items to assess the skills in the Renaissance learning progression. These items were then calibrated to the Star Math scale, and the skill difficulty was determined from the calibrated difficulty of each skill’s items. Examination of the item calibration results found that the rank order of the difficulty of the Star Math items correlates closely to the sequential order of the skills in the Renaissance learning progression for math. Figure 1 on page 22 illustrates the relationship between the sequential order of skills according to the learning progression for math (represented by the trend lines) and the empirical difficulty levels of the skills determined through calibration (represented by the data points).
21Star Assessments™ for MathTechnical Manual

Renaissance Learning Progression for MathStar Math and the Renaissance Learning Progression for Math
Figure 1: Skill Difficulty by Domain
This validation process is ongoing. Its purpose is to compare the research-based order of skills against the empirical results of calibration to ensure that movement in the learning progression for math is an accurate representation of the order in which students learn math skills and concepts. To that end, response data collected from Star Math is continuously used to validate and refine learning progressions.
Renaissance now develops individualized learning progressions for all 50 states, which are updated yearly as state standards change. Star Math subskills were developed to align to skills within state learning progressions. There are currently 790 Star Math skills found within state learning progressions. Star Math skills are organized into closely related skill sets. There are 54 skill sets for the Star Math test blueprint. Skill sets are further organized into 4 domain groups within the Star Math test blueprint: Numbers and Operations; Algebra; Geometry and Measurement; and Data Analysis, Statistics, and Probability.
22Star Assessments™ for MathTechnical Manual

Item and Scale Calibration
BackgroundItem calibration entails estimating the scaled difficulty of test items by administering them to examinees whose ability is known or estimated, then fitting response models that express the probability of a correct response to each item as a function of examinee ability. To provide accurate item difficulty parameter estimates requires an adequate number of responses to each item, from examinees spanning a broad range of ability. The distribution of ability in the examinee samples need not be closely representative of the distribution of ability in the population, but it needs to be diverse, with large enough numbers of observations above and below the middle of the ability range, as well as from the middle itself.
The introduction of the second generation of Star Math marks the third major evolution in the calibration of Star Math items. For the original 1998 version of Star Math, data for item calibration were collected using printed test booklets and answer sheets, in which the items were formatted to closely match the appearance those items would later take when displayed on computer screens. For the first revision of Star Math in 2002, data collection was done entirely by computer, using a special-purpose application program that administered fixed test forms, but did so on screen, with the same display format and user interface later used in the adaptive version of Star Math 2 (the current Progress Monitoring version). For Star Math versions released since 2011, new test items to be calibrated were embedded as unscored items in Star Math itself, and the data for calibration were collected by the Star Math software. Renaissance Learning calls this data collection process dynamic calibration.
For the original version of Star Math, approximately 2,450 items were prepared according to the defined Star Math content specifications. These items were subjected to empirical tryout in 1997 in a national sample of students in grades 3–12. Following both traditional and item response theory (IRT) analyses of the resulting item response data, 1,434 of the items were chosen for use in the original Star Math item bank.
In the development of Star Math 2, about 1,100 new items were written. The new items extended the content of the Star Math item bank to include grades 1–12 and expanded the algebra coverage by adding a number of new algebra objectives. Where needed, items measuring other objectives were written to supplement existing items. (Later versions of the program used this same item bank.)
23Star Assessments™ for MathTechnical Manual

Item and Scale CalibrationThe Rasch Item Response Model
All of the new items had to be calibrated on the same difficulty scale as the original Star Math item bank. Because a number of changes in item display features were introduced with Star Math 2, Renaissance Learning decided to recalibrate the original Star Math adaptive item bank simultaneously with the new items written specifically for Star Math 2. During that Calibration Study, 2,471 items, including both the existing and the new items, were administered to a national sample of more than 44,000 students in grades 1–12 in the spring of 2001.
For the development of the 34-item Star Math, several thousand new items spanning content appropriate for grades 1–10 were developed. Data for calibrating them were collected using the dynamic calibration feature of Star Math. Using that feature, which was introduced in 2008, small numbers of new, uncalibrated items are randomly selected for each student, and embedded at appropriate random points in Star Math tests. Each student may be administered a small number of these new, uncalibrated items. When a sufficient quantity of response data on the new items has accumulated, calibration analyses take place. Star Math is an application of the Rasch, 1-parameter logistic item response model. For each new item, its location on the Rasch difficulty scale is estimated by fitting a logistic response function to the item responses and Rasch ability scores of the participating examinees. This chapter will describe Rasch item response model, and the criteria applied to screen calibrated items for inclusion in the Star Math item banks. Following that, it will summarize two major item calibration efforts.
The first of these was the calibration of items for use in Star Math Version 2. As noted above, that effort included re-calibration of the original Star Math items, along with new items developed specifically for Star Math 2. Those analyses established the Star Math Rasch ability/item difficulty scale that continues in use today with both versions of Star Math: the 24-item Star Math Progress Monitoring version, an assessment of general math achievement; and the current Star Math, a 34-item standards-based assessment.
The second calibration effort described below was done in advance of the introduction of the current Star Math, a 34-item standards-based version first introduced in 2011. To support the longer test, which assesses a more extensive variety of math skills, a much larger item bank was developed.
The Rasch Item Response ModelIn addition to traditional item analyses, the Star Math calibration data are analyzed using item response theory (IRT) methods. Item response theory is widely recognized as the most sophisticated testing approach today.
24Star Assessments™ for MathTechnical Manual

Item and Scale CalibrationThe Rasch Item Response Model
With IRT, the performance of students and the items they answer are placed on the same scale. To accomplish this, every test question is calibrated. Calibration is an IRT-based analytical method for estimating the location of a test question on a common scale used to measure both examinee ability and item difficulty. It is done by administering each question to hundreds and sometimes thousands of students with known performance levels. As a result of calibration, Star “knows” the relative difficulty of every item from kindergarten through grade 12, and expresses it on a developmental scale spanning from the easiest to the hardest questions in the item bank. After taking a Star assessment, a student’s score can be plotted on this developmental scale. Placing students and items on the same scale is the breakthrough of IRT because it makes it possible to assign scores on the same scale even though students take different tests. IRT also provides a means to estimate what skills a student knows and doesn’t know, without explicitly testing each and every skill.
IRT methods develop mathematical models of the relationship of student ability to the difficulty of specific test questions; more specifically, they model the probability of a correct response to each test question as a function of student ability. Although IRT methods encompass a family of mathematical models, the one-parameter (or Rasch) IRT model was selected for the Star Math data both for its simplicity and its ability to accurately model the performance of the Star Math items.
Within IRT, the probability of answering an item correctly is a function of the student’s ability and the difficulty of the item. Since IRT places the item difficulty and student ability on the same scale, this relationship can be represented graphically in the form of an item response function (IRF).
Figure 2 on page 26 is a plot of three item response functions: one for an easy item, one for a more difficult one, and one for an even harder item. Each plot is a continuous S-shaped (ogive) curve. The horizontal axis is the scale of student ability, ranging from very low ability (–5.0 on the scale) to very high ability (+5.0 on the scale). The vertical axis is the percent of students expected to answer each of the three items correctly at any given point on the ability scale. Notice that the expected percent correct increases as student ability increases, but varies from one item to another.
25Star Assessments™ for MathTechnical Manual

Item and Scale CalibrationThe Rasch Item Response Model
Figure 2: Three Examples of Item Response Functions
In Figure 2, each item’s difficulty is the scale point where the expected percent correct is exactly 50. These points are depicted by vertical lines going from the 50% point to the corresponding locations on the ability scale. The easiest item has a difficulty scale value of about –1.67; this means that students located at –1.67 on the ability scale have a 50-50 chance of answering that item right. The scale values of the other two items are approximately +0.20 and +1.25, respectively.
Calibration of test items estimates the IRT difficulty parameter for each test item and places all of the item parameters onto a single scale used to assess the difficulty of test items, and the ability of students, ranging from Kindergarten through 12th grade level. The difficulty parameter for each item is estimated, along with measures to indicate how well the item conforms to (or “fits”) the theoretical expectations of the presumed IRT model.
Also plotted in Figure 2 are the actual percentages of correct responses of groups of students to all three items. Each group is represented as a small triangle, circle, or diamond. Each of those geometric symbols is a plot of the percent correct against the average ability level of the group. Ten groups’ data are plotted for each item; the triangular points represent the groups responding to the easiest item. The circles and diamonds, respectively, represent the groups responding to the moderate and to the most difficult item.
26Star Assessments™ for MathTechnical Manual

Item and Scale CalibrationCalibration of Star Math for Use in Version 2
Calibration of Star Math for Use in Version 2This section summarizes the psychometric research and development undertaken to prepare the large pool of calibrated math test items for use in Star Math version 2 (now called Star Math Progress Monitoring). As already described above, about 1,100 items spanning grades 1 to 12 were added to the Star Math Version 1 items in the Star Math 2 calibration. Data were collected in the Spring of 2001. The calibration analyses of those items established the underlying Star Math Rasch scale that persists today. The methodology used to develop that scale is summarized below.
Sample DescriptionTo obtain a sample that was representative of the diversity of mathematics achievement in the US school population, school districts, specific schools, and individual students were selected to participate in the Star Math 2 Calibration Study. The sampling frame consisted of all US schools, stratified on three key variables: geographic region of the country, school size, and socioeconomic status. The Star Math calibration sample included students from 261 schools from 45 of the 50 United States. Tables 5 and 6 present the characteristics of the calibration sample.
Table 5: Sample Characteristics, Star Math 2 Calibration Study—Spring 2001 (N = 44,939 Students)
Students
National % Sample %
Geographic Region Northeast 20.4% 7.8%
Midwest 23.5% 22.1%
Southeast 24.3% 37.3%
West 31.8% 32.9%
District Socioeconomic Status Low 28.4% 30.2%
Average 29.6% 38.9%
High 31.8% 23.1%
Non-Public 10.2% 8.1%
School Type and District Enrollment
Public
< 200 15.8% 24.2%
200–499 19.1% 26.2%
500–1,999 30.2% 26.4%
2,000 or More 24.7% 15.1%
Non-Public 10.2% 8.1%
27Star Assessments™ for MathTechnical Manual

Item and Scale CalibrationCalibration of Star Math for Use in Version 2
Item PresentationThe Star Math 2 calibration data were collected by administering test items on screen, with display characteristics identical to those implemented in the earlier Star Math version. However, the calibration items were administered in forms consisting of fixed sequences of items, as opposed to the adaptive testing format.
Seven levels of test forms were constructed corresponding to varying grade levels. Because growth in mathematics is much more rapid in the lower grades, there was only one grade per level for the first four levels. As grade level increases, there is more variation among both students and school curricula, so a single test level can cover more than one grade level. Grades were assigned to test levels after extensive consultation with mathematics instruction experts, and assignments were consistent both with the Star Math item development framework and with assignments used in other math achievement tests. To create the levels of test forms, therefore, items were assigned to grade levels such that resulting test forms sampled an appropriate range of objectives from each of the strands that are typically represented at or near the targeted grade levels. Table 7 on page 29 describes the various test form designations used for the Star Math 2 Calibration Study.
Table 6: Ethnic Group and Gender Participation, Star Math 2 Calibration Study—Spring 2001 (N = 44,939 Students)
Students
National % Sample %
Ethnic Group Asian 3.9% 2.8%
Black 16.8% 14.9%
Hispanic 14.7% 10.3%
Native American 1.1% 1.6%
White 63.5% 70.4%
Gender Female Not available 49.8%
Male Not available 50.2%
28Star Assessments™ for MathTechnical Manual

Item and Scale CalibrationCalibration of Star Math for Use in Version 2
Students in grades 1–4 (Levels A, B, C, and D) took 36-item tests consisting of three practice items and 33 actual test items. Expected testing time for these students was 30 minutes. Students in grades 5–12 (Levels E, F, and G) took 46-item tests consisting of three practice items and 43 actual test items. Expected testing time for these students was 40 minutes.
Items within each level were distributed among a number of test forms. Consistent with the previous version of Star Math, the content of each form was balanced between two broad categories of items: items measuring Numeration Concepts and Computation Processes and items measuring Other Applications. Each form was organized into three sections: A, B, and C. Sections A and C each consisted of approximately 40% of the test length, and contained items from both of the categories.
Section A began with items measuring Numeration Concepts and Computation Processes, followed by items measuring Other Applications. Section C reversed this order, with Other Applications items preceding Numeration Concepts and Computation Processes items.
Section B comprised approximately 20% of the test length, and contained two types of anchor items. “Horizontal anchors” were common to a number of test forms at the same level, and “vertical anchors” were common to forms at adjacent levels. The anchor items were used to facilitate later analyses that placed all item difficulty parameters on a common scale.
With the exception of Levels A and G, approximately half of the vertical anchor items in each form came from the next lower level, and the other half came from the next higher level. Items chosen as vertical anchor items were selected partially based on their difficulty; items expected to be answered correctly by more than 80 percent or fewer than 50 percent of out-of-level students were not used as vertical anchor items. Two versions of each form
Table 7: Test Form Levels, Grades, Numbers of Items per Form and Numbers of Test Forms, Star Math 2 Calibration Study—Spring 2001
Level GradesItems per
Form Forms Items
A 1 36 14 152
B 2 36 22 215
C 3 36 32 310
D 4 36 34 290
E 5–6 46 36 528
F 7–9 46 32 516
G 10–12 46 32 464
29Star Assessments™ for MathTechnical Manual

Item and Scale CalibrationCalibration of New Items for Current Star Math Versions
were used: version A and version B. Each version A form consisted of Sections A, B, and C in that order. Each version B form contained the same items, arranged in reverse order, with Section C followed by Sections B and A. The alternate forms counterbalanced the order of item presentation, as a defense against possible order effects influencing the psychometric properties of the items. In all three test sections, items were chosen so that content was balanced at each level, with the numbers of items measuring each of the content domains roughly proportional to the distribution of items among the domains at each level.
In Levels A–G combined, there were 101 unique sets of test items. Each set was arranged in two alternate forms, versions A and B, that differed only in terms of item presentation order. Therefore, there was a total of 202 test forms.
Calibration of New Items for Current Star Math VersionsAs described above, beginning in 2008 and continuing with the current version of Star Math, data needed for item calibration have been collected on-line, by embedding small numbers of uncalibrated items within Star Math tests. After sufficient numbers of item responses have accumulated, the Rasch difficulty of each new item is estimated by fitting a logistic model to the item response data and the Star Math Rasch scores of the students’ tests. Renaissance Learning calls this overall process “dynamic calibration.”
Typically, dynamic calibration is done in batches of several hundred new test items. Each student’s test may include between 1 and 5 uncalibrated items. Each item is tagged with a grade level, and is typically administered only to students at that grade level and the next higher grade. The selection of the uncalibrated items to be administered to each student is at random, resulting in nearly equivalent distributions of student ability for each item at a given grade level.
Both traditional and IRT item analyses are conducted of the item response data collected. The traditional analyses yielded proportion correct statistics, as well as biserial and point-biserial correlations between scores on the new items and actual scores on the Star Math tests.
For dynamic calibration, a minimum of 1,000 responses per item is the data collection target. In practice, because of the very large number of Star Math tests administered each year, the average number of students responding to each new test item is typically several times the target. The calibration analysis proceeds one item at a time, using SAS/STAT™ software to estimate the threshold (difficulty) parameter of every new item by calculating the
30Star Assessments™ for MathTechnical Manual

Item and Scale CalibrationCalibration of New Items for Current Star Math Versions
non-linear regression of each new item score (0 or 1) on the Star Math Rasch ability estimates. The accuracy of the non-linear regression approach has been corroborated by conducting parallel analyses using Winsteps software. In tests, the two methods yielded virtually identical results.
The “dynamic calibration” approach taken to obtain response data for Star Math new item calibration today is quite different from the approaches taken in the development of item banks for the original Star Math and Star Math 2.
The earlier approaches employed multiple fixed-form field tests as the vehicle for new item response data collection; the analyses themselves fit response models to the new items, using the response data itself as the basis for estimating examinee ability. In today’s Star Math, items to be calibrated are embedded as unscored items in Star Math, and the Star Math scores are employed as the ability estimates against which the response models are fit. To ensure a broad diversity of examinee ability, uncalibrated items are selected randomly and administered to students at the target grade level of each item, as well as one grade level above the target, and in some cases one grade level below. Although a nationally representative examinee sample is not required for item calibration, it is useful to evaluate the diversity of the samples who contributed to the calibration data.
This section describes an example of one large dynamic calibration cycle. Tables 8, 9, and 10 on the next page summarize demographic data on about 1.5 million students and 2,473 new items that were part of this process between February 2010 and July 2011. Similar-sized student and item samples were calibrated during other periods, throughout the 2008, 2009, and 2010 school years.
Over 1.5 million students from 7,340 schools in 49 states in addition to Canada and the US Virgin Islands contributed to the overall response data set. Many of those students took two or more Star Math tests during that interval; the total number of tests taken was over 3 million. The number of responses per item ranged from 520 to 58,805, with a median of 2,561.
Of the students participating, 1,446,760 were in US schools; selected demographic data on the U.S. students are in the following tables. Table 8 displays the recorded demographic characteristics of those examinees. Table 9 displays the distribution of the examinees by region of the US; examinees from Canada and outside North America also participated, but their numbers were quite small and are not reported here. Table 10 displays the distribution by gender. Entering the data for each of these analyses was optional; each
31Star Assessments™ for MathTechnical Manual

Item and Scale CalibrationCalibration of New Items for Current Star Math Versions
table tallies only those cases for which the relevant data elements were recorded.
Star Math calibration analyses since 2008 followed similar courses. Following extensive quality control checks, the item response data are analyzed using both traditional item analysis techniques and item response theory (IRT) methods. For each test item, the following information is derived using traditional psychometric item analysis techniques:
The number of students who attempted to answer the item.
The number of students who did not attempt to answer the item.
Table 8: Sample Ethnicity, Star Math Calibration Study—February 2010–July 2011 (N = 1,446,760 US Students)
Ethnicity Description ObservationsObserved
PercentagePopulation Percentage
American Indian or Alaskan Native 16,058 2.99 1.1
Asian or Pacific Islander 16,332 3.04 3.9
Black 156,416 29.13 16.8
Hispanic 105,433 19.64 14.7
Other Race or Ethnicity 1,577 0.29 –
White 241,103 44.90 63.5
Total Observations 536,919
Table 9: Sample by US Region, Star Math Calibration Study—February 2010–July 2011 (N = 1,446,760 US Students)
Region ObservationsObserved
PercentagePopulation Percentage
Midwest 169,311 26.13 23.50
Northeast 39,810 6.14 20.40
Southeast 231,819 35.78 24.30
West 207,042 31.95 31.80
Total 647,982
Table 10: Sample by Gender, Star Math Calibration Study—February 2010–July 2011 (N = 1,446,760 US Students)
Gender ObservationsObserved
PercentagePopulation Percentage
Female 490,357 48.22 Not available
Male 526,471 51.78
Total 1,016,828
32Star Assessments™ for MathTechnical Manual

Item and Scale CalibrationTraditional Item Difficulty
The percentage of students who answered the item correctly (a traditional measure of difficulty).
The percentage of students answering each option and the alternatives.
The correlation between answering the item correctly and the total score (a traditional measure of discrimination).
The correlation between the endorsement of each alternative answer and the total score.
Traditional Item DifficultyThe difficulty of an item in traditional item analysis is the percentage (or proportion) of students who answer the item correctly. This is typically referred to as the “p-value” of the item. Low p-values (such as 15%) indicate that the item is difficult since only a small percentage of students answered it correctly. High p-values indicate that the majority of students answered the item correctly and thus, the item is easy. It should be noted that the p-value only has meaning for a particular item relative to the characteristics of the sample of students who responded to it.
Item Discriminating PowerThe traditional measure of the discriminating power of an item is the correlation between the “score” on the item (correct or incorrect) and the total test score. Items that correlate highly with total test score will also tend to correlate with one another more highly and produce a test with more internal consistency. For the correct answer, the higher the correlation between the item score and the total score, the better the item is at discriminating between low-scoring and high-scoring individuals. When the correlation between the correct answer and the total test is low (or negative), the item is most likely not performing as intended. The correlation between endorsing incorrect answers and the total score should generally be negative, since there should not be a positive relationship between selecting an incorrect answer and scoring higher on the overall test.
At least two different correlation coefficients are commonly used during item analysis: the point-biserial and the biserial coefficients. The former is a traditional product-moment correlation that is readily calculated, but is known to be somewhat biased in the case of items with p-values that deviate from 0.50. The biserial correlation is derived from the point-biserial and the p-value, and is preferred by many because it in effect corrects for the point-biserial’s bias at low and high p-values. For item analysis of Star Math 2 data, the correlation coefficient of choice was the biserial.
33Star Assessments™ for MathTechnical Manual

Item and Scale CalibrationRules for Item Retention
Urry (1975) demonstrated that in cases where items could be answered correctly by guessing (e.g., multiple choice items) the value of the biserial correlation is itself attenuated at p-values different from 0.50, and particularly as the p-value approaches the chance level. He derived a correction for this attenuation, which we will refer to as the “Urry biserial correlation.” Urry demonstrated that multiple choice adaptive tests are more efficient than conventional tests only if the adaptive tests use items with Urry biserial values that are considerably higher than the target levels often used to select items for conventional test use. His suggestion was to reject items with Urry biserial values lower than 0.62. Item analyses of the Star Math have used the Urry biserial as the correlation coefficient of choice; item selection/rejection decisions have been based in part on his suggested target of 0.62.
Rules for Item RetentionFollowing these analyses, each test item, along with both traditional and IRT analysis information (including IRF and EIRF plots), and information about the test level, form, and item identifier, is stored in a specialized item statistics database system. A panel of internal reviewers then examines each item’s statistics to determine whether the item met all criteria for inclusion in the bank of Star Math items. The item statistics database system allows experts easy access to all available information about an item in order to interactively designate items that, in their opinion, meet acceptable standards for inclusion in the Star Math item bank.
Items are eliminated when they meet one or more of the following criteria:
Item-total correlation (item discrimination) less than the minimum (Urry biserial < 0.62)
One or more incorrect answer options has a positive item discrimination value
Sample size of students responding to the item less than 1,000
The traditional item difficulty indicated that the item was too difficult or too easy
The item does not appear to fit the Rasch IRT model
In the case of the batch of 2,473 items used in the example of Star Math item calibration above, 884 items (36%) met all the retention rules above, and were accepted for operational use as part of the Star Math adaptive test item bank. Another 538 items met all criteria except the Urry biserial target. Such items would meet commonly applied criteria for use in most conventional tests; those 538 items were retained for use for certain analytical purposes, but will not be used for adaptive testing in Star Math.
34Star Assessments™ for MathTechnical Manual

Item and Scale CalibrationComputer-Adaptive Test Design
Computer-Adaptive Test DesignAn additional level of content specification is determined by the student’s performance during testing. In conventional paper-and-pencil standardized tests, items retained from the item tryout or item calibration program are organized by level. Then, each student takes all items within a given test level. Thus, the student is only tested on those mathematical operations and concepts deemed to be appropriate for his or her grade level.
On the other hand, in computer-adaptive tests, such as Star Math, the items taken by a student are dynamically selected in light of that student’s performance during the testing session. Thus, a low-performing student’s knowledge of math operations may branch to easier operations to better estimate math achievement level, and high-performing students may branch to more challenging operations or concepts to better determine the breadth of their math knowledge and their math achievement level.
During an adaptive test, a student may be “routed” to items at the lowest level of difficulty within the overall pool of items, dependent upon the student’s unfolding performance during the testing session. In general, when an item is answered correctly, the student is routed to a more difficult item. When an item is answered incorrectly, the student is instead routed to an easier item. In the case of Star Math, the brancher selects items with a 67 percent expectation of a correct response, given the student’s estimated ability, and the item’s calibrated difficulty.
A Star Math test consists of a fixed-length, 34-item adaptive test; Star Math Progress Monitoring tests are 24 items in length. Students who have not taken a Star Math test within 180 days initially receive an item whose difficulty level is relatively easy for students at that grade level. This minimizes any effects of initial anxiety that students may have when starting the test and serves to better facilitate the students’ initial reactions to the test. The starting points vary by grade level and are based on research conducted as part of the norming process.
When a student has taken a Star Math test within the previous 180 days, the appropriate starting point is based on his or her previous test score information. Following the administration of the initial item, and after the student has entered an answer, the program determines an updated estimate of the student’s math achievement level. Then, it selects the next item randomly from among all of the available items having a difficulty level that closely match a target based on the estimated achievement level. Randomization of items with difficulty values near the target level allows the program to avoid overexposure of test items.
35Star Assessments™ for MathTechnical Manual

Item and Scale CalibrationScoring in the Star Math Tests
Items that have been administered to the same student within the past 75 days are not available for administration. In addition, to avoid frustration, items that are intended to measure advanced mathematical concepts and operations that are more than three grade levels beyond the student’s grade level, as determined by where such concepts or operations are typically introduced in math textbooks, are also not available for administration. Because the item pools make a large number of items available for selection, these minor constraints have a negligible impact on the quality of each Star Math computer-adaptive test.
Scoring in the Star Math TestsFollowing the administration of each Star Math item, and after the student has selected a response, an updated estimate of the student’s underlying math achievement level is computed based on the student’s responses to all of the items administered up to that point. A proprietary Bayesian-modal item response theory estimation method is used for scoring until the student has answered at least one item correctly and at least one item incorrectly. Once the student has met this 1-correct/1-incorrect criterion, the software uses a proprietary Maximum-Likelihood IRT estimation procedure to avoid any potential bias in the Scaled Scores.
This approach to scoring enables the software to provide Scaled Scores that are statistically consistent and efficient. Scaled Scores are expressed on a common scale that spans all grade levels covered by the Star Math test. Because the software expresses Scaled Scores on a common scale, Scaled Scores are directly comparable with each other, regardless of grade level. Other scores, such as Percentile Ranks and Grade Equivalents, are derived from the Scaled Scores obtained during the Star Math norming studies.
A New Scale for Reporting Star Math Test ScoresIn 1998, Renaissance Learning released the initial 24-item version of Star Math. In 2011, the 34-item standards-based Star Math test was published. Although Star Math measures constructs that are different from those assessed in Star Reading, a common scale—the Unified Score Scale—that can be used to report scores on both tests was recently developed. The Unified Score Scale was introduced into use in the 2017–2018 school year as an optional alternative scale for reporting achievement on all Star tests.
The Unified Score Scale is derived from the Star Reading Rasch scale of ability and difficulty, which was first introduced with the development of Star Reading Version 2.
36Star Assessments™ for MathTechnical Manual

Item and Scale CalibrationA New Scale for Reporting Star Math Test Scores
The Unified Star Math scale was developed by performing the following steps:
The Rasch scale used by Star Math was linked (transformed) to the Star Reading Rasch scale.
A linear transformation of the transformed Rasch scale was developed that spans the entire range of knowledge and skills measured by both Star Math and Star Reading.
Details of these two steps are presented below.
1. The Rasch scale used by Star Math was linked to the Star Reading Rasch scale.
In this step, a linear transformation of the Star Math Rasch scale to the Rasch scale used by Star Reading was developed, using a method for linear equating of IRT (item response theory) scales described by Kolen and Brennan (2004, pages 162–165).
2. Because Rasch scores are expressed as decimal fractions, and may be either negative or positive, a more user-friendly scale score was developed that uses positive integer numbers only. A linear transformation of the extended Star Reading Rasch scale was developed that spans the entire range of knowledge and skills measured by both Star Math and Star Reading. The transformation formula is as follows:
Unified Scale Score = INT (42.93 * Star Reading Rasch Score + 958.74)
where the Star Reading Rasch score has been extended downwards to values as low as –20.00.
Following are some features and considerations in the development of that scale, called here the “Unified scale.”
a. For both Star Math and Star Reading, the range of reported Unified scales is from 600 to 1400. Anchor points were chosen such that the Unified scale score of 600 is approximately equivalent to a Star Math scale score of 0, and a Unified score of 1400 is the approximate equivalent of 1300 on the Star Math scale.
b. The scale is extensible upwards and downwards. Currently, the highest reported Star Math Unified scale score is 1400, but there is no theoretical limit: if Star Math content were extended beyond the high school level, the range of the new scale can be extended upward without limit, as needed. The lowest point is now set at 600, but the Unified scale can readily be extended downward as low as 0, if a reason arises to do so.
37Star Assessments™ for MathTechnical Manual

Item and Scale CalibrationA New Scale for Reporting Star Math Test Scores
Table 11 contains a table of selected Star Math Rasch ability scores and their equivalents on the Star Math and Unified Score scales.
Table 11: Some Star Math Rasch Scores and their Equivalents on the Star Math and Unified Score Scales
Minimum Rasch Score Star Math Scaled Score Unified Scale Score
–8.35 0 600
–7.72 50 638
–7.08 100 668
–6.45 150 699
–5.81 200 730
–5.18 250 761
–4.54 300 791
–3.91 350 822
–3.27 400 853
–2.64 450 884
–2.00 500 914
–1.37 550 945
–0.74 600 976
–0.10 650 1007
0.54 700 1037
1.17 750 1068
1.81 800 1099
2.44 850 1130
3.07 900 1160
3.71 950 1191
4.34 1000 1222
4.98 1050 1253
5.61 1100 1283
6.25 1150 1314
6.88 1200 1345
7.52 1250 1376
8.15 1300 1400
38Star Assessments™ for MathTechnical Manual

Reliability and Measurement Precision
Measurement is subject to error. A measurement that is subject to a great deal of error is said to be imprecise; a measurement that is subject to relatively little error is said to be reliable. In psychometrics, the term reliability refers to the degree of measurement precision, expressed as a proportion. A test with perfect score precision would have a reliability coefficient equal to 1, meaning that 100 percent of the variation among persons’ scores is attributable to variation in the attribute the test measures, and none of the variation is attributable to error. Perfect reliability is probably unattainable in educational measurement; for example, a test with a reliability coefficient of 0.90 is more likely. On such a test, 90 percent of the variation among students’ scores is attributable to the attribute being measured, and 10 percent is attributable to errors of measurement. Another way to think of score reliability is as a measure of the consistency of test scores. Two kinds of consistency are of concern when evaluating a test’s measurement precision: internal consistency and consistency between different measurements. First, internal consistency refers to the degree of confidence one can have in the precision of scores from a single measurement. If the test’s internal consistency is 95 percent, just 5 percent of the variation of test scores is attributable to measurement error.
Second, reliability as a measure of consistency between two different measurements indicates the extent to which a test yields consistent results from one administration to another and from one test form to another. Tests must yield somewhat consistent results in order to be useful; this reliability co-efficient is obtained by calculating the coefficient of correlation between students’ scores on two different occasions, or on two alternate versions of the test given at the same occasion.
Because the amount of the attribute being measured may change over time, and the content of tests may differ from one version to another, the internal consistency reliability coefficient is generally higher than the correlation between scores obtained on different administrations.
There are a variety of methods of estimating the reliability coefficient of a test. Methods such as Cronbach’s alpha and split-half reliability are single administration methods and assess internal consistency. Coefficients of correlation calculated between scores on alternate forms, or on similar tests administered two or more times on different occasions, are used to assess alternate forms reliability, or test-retest reliability (stability).
In a computerized adaptive test such as Star Math, content varies from one administration to another, and it also varies with each student’s performance.
39Star Assessments™ for MathTechnical Manual

Reliability and Measurement Precision34-Item Star Math Tests
Another feature of computerized adaptive tests based on Item Response Theory (IRT) is that the degree of measurement error can be expressed for each student’s test individually.
The Star Math tests provide two ways to evaluate the reliability of scores: reliability coefficients, which indicate the overall precision of a set of test scores, and conditional standard errors of measurement (CSEM), which provide an index of the degree of error in an individual test score. A reliability coefficient is a summary statistic that reflects the average amount of measurement precision in a specific examinee group or in a population as a whole. In Star Math, the CSEM is an estimate of the unreliability of each individual test score. While a reliability coefficient is a single value that applies to the test in general, the magnitude of the CSEM may vary substantially from one person’s test score to another’s.
This chapter presents three different types of reliability coefficients: generic reliability, split-half reliability, and alternate forms (test-retest) reliability. This is followed by statistics on the conditional standard error of measurement of Star Math test scores.
The reliability and measurement error presentation is divided into two sections below: First is a section describing the reliability coefficients and conditional standard errors of measurement for the 34-item Star Math tests. Second, another brief section presents reliability and measurement error data for the 24-item Star Math progress monitoring tests. The reliability coefficients and conditional standard errors of measurement are presented for scores expressed on both the Enterprise Star Math Scale and the newly developed Star Unified Scale.
34-Item Star Math Tests
Generic ReliabilityTest reliability is generally defined as the proportion of test score variance that is attributable to true variation in the trait the test measures. This can be expressed analytically as:
where σ2error is the variance of the errors of measurement, and σ2
total is the variance of test scores. In Star Math, the variance of the test scores is easily calculated from Scaled Score data. The variance of the errors of measurement may be estimated from the conditional standard error of measurement (CSEM) statistics that accompany each of the IRT-based test scores, including the Scaled Scores, as depicted on the next page.
Reliability = 1 –σ2
errorσ2
total
Star Assessments™ for MathTechnical Manual
40
Reliability and Measurement Precision34-Item Star Math Tests
where the summation is over the squared values of the reported CSEM for students i = 1 to n. In each Star Math test, CSEM is calculated along with the IRT ability estimate and Scaled Score. Squaring and summing the CSEM values yields an estimate of total squared error; dividing by the number of observations yields an estimate of mean squared error, which in this case is tantamount to error variance. “Generic” reliability is then estimated by calculating the ratio of error variance to Scaled Score variance, and subtracting that ratio from 1.
Using this technique with the Star Math norming data resulted in the generic reliability estimates shown in the third column of Table 12. Because this method is not susceptible to error variance introduced by repeated testing, multiple occasions, and alternate forms, the resulting estimates of reliability are generally higher than the more conservative alternate forms reliability coefficients. These generic reliability coefficients are, therefore, plausible upper-bound estimates of the internal consistency reliability of the Star Math computer-adaptive test.
Table 12: Reliability Estimates from the Star Math 2015–2016 Data on both the Unified Scale and the Enterprise Scale
Grade N
Reliability Estimates: For Both Unified and Enterprise Scales
Generic Split-Half Alternate Forms
ρxx ρxx N ρxxAverage Days
between Testing
1 18,369 0.90 0.89 45,400 0.74 85
2 17,616 0.91 0.90 45,400 0.79 84
3 16,475 0.91 0.91 45,400 0.80 85
4 16,226 0.92 0.91 45,400 0.82 87
5 16,013 0.93 0.92 45,400 0.84 88
6 15,713 0.93 0.92 45,400 0.84 95
7 15,969 0.94 0.93 45,400 0.84 99
8 16,439 0.93 0.93 45,400 0.84 100
9 17,054 0.93 0.93 45,400 0.83 112
10 17,368 0.94 0.93 45,400 0.82 112
11 17,484 0.94 0.94 45,400 0.81 111
12 17,539 0.95 0.94 45,400 0.78 110
Overall 202,265 0.97 0.97 544,800 0.94 97
SEM2σ2error i
1n= Σ
n
Star Assessments™ for MathTechnical Manual
41
Reliability and Measurement Precision34-Item Star Math Tests
Generic reliability estimates for scores on both the Unified score scale and the Enterprise score scale are shown in Table 12. Because both the Unified scaled and the Enterprise scale are linear transformations of the underlying Star Math Rasch scores, the reliability estimates are the same across both scales. Results in Table 12 indicate that the overall generic reliability of the scores was about 0.97. Coefficients ranged from a low of 0.90 in grade 1 to a high of 0.95 in grade 12.
As the data in Table 12 show, Star Math generic reliability is quite high, grade by grade and overall. Star Math also demonstrates high test-retest consistency as shown in the rightmost columns of the same table. Star Math’s technical quality for an interim assessment is on a virtually equal footing with the highest-quality summative assessments in use today.
Split-Half ReliabilityWhile generic reliability does provide a plausible estimate of measurement precision, it is a theoretical estimate, as opposed to traditional reliability coefficients, which are more firmly based on item response data. Traditional internal consistency reliability coefficients such as Cronbach’s alpha and Kuder-Richardson Formula 20 (KR-20) are not meaningful for adaptive tests. However, an estimate of internal consistency reliability can be calculated using the split-half method.
A split-half reliability coefficient is calculated in three steps. First, the test is divided into two halves, and scores are calculated for each half. Second, the correlation between the two resulting sets of scores is calculated; this correlation is an estimate of the reliability of a half-length test. Third, the resulting reliability value is adjusted, using the Spearman-Brown formula, to estimate the reliability of the full-length test.
In internal simulation studies, the split-half method provided accurate estimates of the internal consistency reliability of adaptive tests, and so it has been used to provide estimates of Star Math reliability. These split-half reliability coefficients are independent of the generic reliability approach discussed earlier and more firmly grounded in the item response data. Split-half scores were based on all of the 34 items of the Star Math tests; scores based on the odd- and the even-numbered items were calculated separately. The correlations between the two sets of scores were corrected to a length of 34 items, yielding the split-half reliability estimates displayed in Table 12.
Results indicated that the overall split-half reliability of scores was 0.97. The coefficients ranged from a low of 0.89 in grade 1 to a high of 0.94 in grade 12. These reliability estimates are quite consistent across grades 1–12, and quite
42Star Assessments™ for MathTechnical Manual

Reliability and Measurement Precision34-Item Star Math Tests
high, again a result of the measurement efficiency inherent in the adaptive nature of the Star Math test.
Alternate Form ReliabilityAnother method of evaluating the reliability of a test is to administer the test twice to the same examinees. Next, a reliability coefficient is obtained by calculating the correlation between the two sets of test scores. This is called a test-retest reliability coefficient if the same test was administered both times and an alternate forms reliability coefficient if different, but parallel, tests were used.
Content sampling, temporal changes in individuals’ performance, and growth or decline over time can affect alternate forms reliability coefficients, usually making them appreciably lower than internal consistency reliability coefficients.
The alternate form reliability study provided estimates of Star Math reliability using a variation of the test-retest method. In the traditional approach to test-retest reliability, students take the same test twice, with a short time interval, usually a few days, between administrations. In contrast, the Star Math alternate form reliability study administered two different tests by avoiding during the second test the use of any items the student had encountered in the first test. All other aspects of the two tests were identical. The correlation coefficient between the scores on the two tests was taken as the reliability estimate.
The alternate form reliability estimates for the Star Math test were calculated using both the Star Math Unified scaled scores and the Enterprise scaled scores. Checks were made for valid test data on both test administrations and to remove cases of apparent motivational discrepancies.
Table 12 on page 41 includes overall and within-grade alternate reliability, along with an indication of the average number of days between testing occasions. The average number of days between testing occasions ranged from 84–112 days. Results indicated that the overall reliability of the scores was about 0.94. The alternate form coefficients ranged from a low of 0.74 in grade1 to a high of 0.84 in grades 5 to 8.
Because errors of measurement due to content sampling and temporal changes in individuals’ performance can affect this correlation coefficient, this type of reliability estimate provides a conservative estimate of the reliability of a single Star Math administration. In other words, the actual Star Math reliability is likely higher than the alternate form reliability estimates indicate.
43Star Assessments™ for MathTechnical Manual

Reliability and Measurement Precision34-Item Star Math Tests
Star Math was designed to be a standards-based assessment, meaning that its item bank measures skills identified by exhaustive analysis of national and state standards in Math, from grades K–12 including Algebra and Geometry. The 34-item Star Math content covers many more skills than previous versions of Star Math, which administered only 24 items.
The increased length of the current version of Star Math, combined with its increased breadth of skills coverage and enhanced technical quality, was expected to result in improved measurement precision; this showed up as slightly increased reliability, in both internal consistency reliability and alternate form reliability as shown in Table 12. For comparison, see Table 15 on page 47.
Standard Error of MeasurementWhen interpreting the results of any test instrument, it is important to remember that the scores represent estimates of a student’s true ability level. Test scores are not absolute or exact measures of performance. Nor is a single test score infallible in the information that it provides. The standard error of measurement can be thought of as a measure of how precise a given score is. The standard error of measurement describes the extent to which scores would be expected to fluctuate because of chance. If measurement errors follow a normal distribution, an SEM of 18 means that if a student were tested repeatedly, his or her scores would fluctuate within 18 points of his or her first score about 68 percent of the time, and within 36 points (twice the SEM) roughly 95 percent of the time. Since reliability can also be regarded as a measure of precision, there is a direct relationship between the reliability of a test and the standard error of measurement for the scores it produces: as reliability increases, standard error of measurement decreases.
The Star Math tests differ from traditional tests in at least two respects with regard to the standard error of measurement. First, Star Math software computes the SEM for each individual student based on his or her performance, unlike most traditional fixed tests that report the same SEM value for every examinee. Each administration of Star Math yields a unique “conditional” SEM (CSEM) that reflects the amount of information estimated to be in the specific combination of items that a student received in his or her individual test. Second, because the Star Math test is adaptive, the CSEM will tend to be lower than that of a conventional test, particularly at the highest and lowest score levels, where conventional tests’ measurement precision is weakest. Because the adaptive testing process attempts to provide equally precise measurement, regardless of the student’s ability level, the average CSEMs for the IRT ability estimates are very similar for all students.
44Star Assessments™ for MathTechnical Manual

Reliability and Measurement Precision34-Item Star Math Tests
Tables 13 and 14 on page 46 contain two different sets of estimates of Star Math measurement error: conditional standard error of measurement (CSEM) and global standard error of measurement (SEM). Conditional SEM was just described; the estimates of CSEM in Tables 13 and 14 are the average CSEM values observed for each grade.
Global standard error of measurement is based on the traditional SEM estimation method, using internal consistency reliability and the variance of the test scores to estimate the SEM:
SEM = SQRT(1 – ρ) σx
where
SQRT() is the square root operator
ρ is the estimated internal consistency reliability
σx is the standard deviation of the observed scores (in this case, Scaled Scores)
Tables 13 and 14 summarize the distribution of CSEM values for the 2015–2016 data, overall and by grade level. The overall average CSEM on the Unified scale across all grades was 18 scaled score units and ranged from a low of 18 in grades 1–10 to a high of 19 in grades 11 and 12 (Table 13). The average CSEM based on the Unified scale is similar across all grades. Table 14 shows the average CSEM values on the Enterprise Star Math scale. The overall average CSEM on the Enterprise scale across all grades was 29 scaled score units and ranged from a low of 29 in grades 1–8 to a high of 30 in grades 9–12.
Because the standard error of measurement (SEM) is scale dependent, there are differences in the reported SEMs between the Star Math Unified and Enterprise scales. Overall, the lower SEM values in Table 13, compared to those in Table 14 reflect the differences between the Unified and Enterprise scale score ranges. Neither of these is “better,” as the reliability estimates are the same for both scales.
45Star Assessments™ for MathTechnical Manual

Reliability and Measurement Precision34-Item Star Math Tests
Table 13: Standard Error of Measurement for the 2015–2016 Star Math data on the Unified Scale
Grade Sample Size
Standard Error of Measurement—Unified Scale
Conditional
GlobalAverage Standard Deviation
1 18,369 18 1.1 19
2 17,616 18 1.2 19
3 16,475 18 1.2 18
4 16,226 18 1.2 18
5 16,013 18 1.4 19
6 15,713 18 1.2 19
7 15,969 18 1.4 19
8 16,439 18 1.6 19
9 17,054 18 1.4 19
10 17,368 18 1.5 19
11 17,484 19 1.7 19
12 17,539 19 2.0 19
All 202,265 18 1.4 19
Table 14: Standard Error of Measurement for the 2015–2016 Star Math data on the Enterprise Scale
Grade Sample Size
Standard Error of Measurement—Enterprise Scale
Conditional
GlobalAverage Standard Deviation
1 18,369 29 1.8 31
2 17,616 29 1.9 31
3 16,475 29 1.9 30
4 16,226 29 2.0 30
5 16,013 29 2.2 31
6 15,713 29 2.0 31
7 15,969 29 2.3 31
8 16,439 29 2.5 31
9 17,054 30 2.3 31
10 17,368 30 2.4 31
11 17,484 30 2.8 31
12 17,539 30 3.2 31
All 202,265 29 2.3 31
46Star Assessments™ for MathTechnical Manual

Reliability and Measurement Precision24-Item Star Math Progress Monitoring Tests
24-Item Star Math Progress Monitoring TestsStar Math is used for both universal screening and progress monitoring. The 34-item Star Math test is widely used for universal screening. A shorter version—the 24-item Star Math progress monitoring test—exists for use in progress monitoring. The following section summarizes the reliability and the standard error of measurement of the progress monitoring version of Star Math.
Reliability CoefficientsTable 15 shows the reliability estimates of the Star Math progress monitoring test on both the Unified scale and the Enterprise scale.
The progress monitoring Star Math reliability estimates are also quite high and consistent across grades 1–12, for a test composed of only 24 items.
Overall, these coefficients also compare very favorably with the reliability estimates provided for other published math achievement tests, which typically contain far more items than the 24-item Star Math progress
Table 15: Reliability Estimates from the Star Math Progress Monitoring Tests on both the Unified Scale and the Enterprise Scale
Grade
Progress Monitoring Reliability Estimates for Both the Unified and Enterprise Scale
Generic Split-Half Alternate Forms
N ρxx N ρxx N ρxxAverage Days
between Testing
1 50,000 0.87 9,095 0.88 10,000 0.67 90
2 50,000 0.85 8,808 0.87 10,000 0.72 90
3 50,000 0.86 8,509 0.86 10,000 0.74 91
4 50,000 0.87 8,403 0.89 10,000 0.74 92
5 50,000 0.88 8,447 0.89 10,000 0.79 93
6 50,000 0.9 8,519 0.91 10,000 0.82 107
7 30,000 0.91 8,483 0.92 10,000 0.83 111
8 30,000 0.91 8,706 0.92 9,000 0.83 109
9 7,500 0.92 4,452 0.93 1,000 0.83 113
10 7,500 0.92 4,474 0.93 1,000 0.81 109
11 7,500 0.92 4,442 0.92 1,000 0.85 116
12 5,000 0.91 4,407 0.92 900 0.84 110
Overall 387,500 0.95 86,745 0.96 82,900 0.91 98
47Star Assessments™ for MathTechnical Manual

Reliability and Measurement Precision24-Item Star Math Progress Monitoring Tests
monitoring tests. The Star Math progress monitoring test’s high reliability with minimal testing time is a result of careful test item construction and an effective and efficient adaptive-branching procedure.
Standard Error of MeasurementTables 16 and 17 show the conditional standard error of measurement (CSEM) and the global standard error of measurement (SEM), overall and by grade level.
Table 16: Estimates of Star Math Progress Monitoring Measurement Precision by Grade and Overall on the Unified Scale
Grade
Progress Monitoring Standard Error of Measurement—Unified Scale
Conditional Global
Sample Size Average
Standard Deviation
Sample Size SEM
1 50,000 23 2.7 9,095 22
2 50,000 23 2.6 8,808 22
3 50,000 23 2.5 8,509 22
4 50,000 24 2.7 8,403 22
5 50,000 24 2.9 8,447 22
6 50,000 24 3.0 8,519 22
7 30,000 24 3.1 8,483 22
8 30,000 24 3.4 8,706 22
9 7,500 23 3.0 4,452 22
10 7,500 24 3.2 4,474 22
11 7,500 24 3.3 4,442 22
12 5,000 24 3.3 4,407 22
All 387,500 23 2.9 86,745 22
48Star Assessments™ for MathTechnical Manual

Reliability and Measurement Precision24-Item Star Math Progress Monitoring Tests
Comparing the estimates of reliability and measurement error of Star Math (Tables 12, 13, and 14) with those of Star Math progress monitoring (Tables 15, 16, and 17) confirms that Star Math is slightly superior to the shorter Star Math progress monitoring assessments in terms of reliability and measurement precision. The degree of superiority of the 34-item Star Math reliability and measurement statistics is consistent with its longer test length.
Table 17: Estimates of Star Math Progress Monitoring Measurement Precision by Grade and Overall on the Unified Scale
Grade
Progress Monitoring Standard Error of Measurement—Enterprise Scale
Conditional Global
Sample Size Average
Standard Deviation
Sample Size SEM
1 50,000 38 4.2 9,095 36
2 50,000 39 4.2 8,808 36
3 50,000 38 4.1 8,509 36
4 50,000 39 4.4 8,403 37
5 50,000 39 4.6 8,447 37
6 50,000 39 4.8 8,519 37
7 30,000 39 4.9 8,483 36
8 30,000 39 5.4 8,706 36
9 7,500 39 4.9 4,452 37
10 7,500 39 5.1 4,474 36
11 7,500 39 5.3 4,442 37
12 5,000 39 5.4 4,407 37
All 387,500 39 4.6 86,745 37
49Star Assessments™ for MathTechnical Manual

Validity
Test validity was long described as the degree to which a test measures what it is intended to measure. A more current description is that a test is valid to the extent that there are evidentiary data to support specific claims as to what the test measures; the interpretation of its scores; and the uses for which it is recommended or applied. Evidence of test validity is often indirect and incremental, consisting of a variety of data that in the aggregate are consistent with the theory that the test measures the intended construct(s), or is suitable for its intended uses and interpretations of its scores. Determining the validity of a test involves the use of data and other information both internal and external to the test instrument itself.
Content ValidityOne touchstone is content validity, which is the relevance of the test questions to the attributes or dimensions intended to be measured by the test. The content of the item bank and the content balancing specifications that govern the administration of each test together form the foundation for “content validity” for the Star Math assessments. These content validity issues were discussed in detail in “Content and Item Development” and were an integral part of the test items that are the basis of the Star Math version.
Construct ValidityConstruct validity, which is the overarching criterion for evaluating a test, investigates the extent to which a test measures the construct(s) that it claims to be assessing. Establishing construct validity involves the use of data and other information external to the test instrument itself. For example, Star Math claims to provide an estimate of a child’s mathematics achievement level. Therefore, demonstration of Star Math construct validity rests on the evidence that the test provides such estimates. There are a number of ways to demonstrate this.
Since mathematics ability varies significantly within and across grade levels and improves as a student’s grade placement increases, scores within Star Math should demonstrate these anticipated internal relationships; in fact, they do. Additionally, scores for Star Math should correlate highly with other accepted measures of mathematics achievement and competence. This section deals with both internal and external evidence of the validity of Star Math as an assessment of Mathematics achievement and competence.
50Star Assessments™ for MathTechnical Manual
ValidityConstruct Validity
Internal Evidence: Evaluation of Unidimensionality of Star MathStar Math is a 34-item computerized-adaptive assessment that measures mathematics achievement. Its items are selected adaptively for each student, from a very large bank of mathematics test items, each of which is aligned to one of four blueprint domains:
Numeration & Operations (NUM)
Algebra (ALG)
Geometry & Measurement (GEO)
Data Analysis, Statistics & Probability (DAT)
Star Math is an application of item response theory (IRT); each test item’s difficulty has been calibrated using the Rasch 1-parameter logistic IRT model. One of the assumptions of the Rasch model is unidimensionality: that a test measures only a single construct such as mathematics achievement in the case of Star Math. To evaluate whether Star Math measures a single construct, factor analyses were conducted. Factor analysis is a statistical technique used to determine the number of dimensions or constructs that a test measures. Both exploratory and confirmatory factor analyses were conducted across grade bands K to 2, 3 to 5, 6 to 8 and 9 to 12.
To begin, a large sample of student Star Math data was assembled. The overall sample consisted of 202,000 student records. The overall sample was investigated with confirmatory factor analysis to investigate unidimensionality followed by a variety of exploratory factor analyses.
For the overall sample, each student’s 34 Star Math item responses were divided into subsets of items aligned to each of the 4 blueprint domains. Tests administered in grades K–8 included items from all four domains. Tests given in grades 9–12 included items from just 3 domains with no items measuring data analysis, probability and statistics domain.
For each student, separate Rasch ability estimates (subtest scores) were calculated from each domain-specific subset of item responses. A Bayesian sequential procedure developed by Owen (1969, 1975) was used for the subtest scoring. Across all grade bands, the number of items included in each math subtest ranged from 3 to 23 items for the NUM domain, 1 to 18 items for the ALG domain, 5 to 13 items for the GEO domain, and 0 to 3 items for the DAT domain, following the Star Math test blueprints, which specify different numbers of items per domain, depending on the student’s grade level.
Intercorrelations of the blueprint domain-specific Rasch subtest scores were analyzed using exploratory factor analysis (EFA) to evaluate the number of dimensions/ factors underlying Star Math domain scores. In each grade band,
51Star Assessments™ for MathTechnical Manual

ValidityConstruct Validity
the EFA analyses retained a single dominant underlying dimension based on either the MINEIGEN (eigenvalue greater than 1) or the PROPORTION criterion (proportion of variance explained by the factor), as expected. An example of a scree plot from grade band K to 2 based on the PROPORTION criterion is shown in Figure 3. Similar scree plots showing a single dominant factor for the first eigenvalue and extracted factor were found at all grade bands and across grade bands. EFA analyses using both SAS and SPSS software showed one significant factor at each grade band and across all grade bands for principal components analysis, unweighted least squares factors, generalized least squares factors, maximum likelihood factors, alpha factors, image factors. Standardized factor loadings for each domain were always above 0.80 for the first extracted factor.
Figure 3: Example Scree and Variance Explained Plots from the Grade Band K to 2 Exploratory Factor Analysis in Star Math
Confirmatory factor analyses (CFA) were also conducted using the subtest scores from the CFA analysis. A separate confirmatory analysis was conducted for each grade band. The CFA models tested a single underlying model as shown in Figure 4. One CFA model with four domains was fitted for students in grade bands K to 2, 3 to 5, and 6 to 8; a second CFA model with three domains was fitted for students in grade band 9 to 12 since the test blueprint did not administer items from the domain for Data Analysis, Probability and Statistics.
52Star Assessments™ for MathTechnical Manual

ValidityConstruct Validity
Figure 4: Confirmatory Factor Analyses (CFA) in Star Math
The results of the CFA analyses by grade band and across all grade bands are summarized in Table 19 on page 54. Grade Band ALL4 shows results across all grade bands for four math domains (ALG, GEO, DAT, and NUM); Grade Band ALL3 shows results across all grade bands for three math domains (ALG GEO and NUM). The CFA models for Grade band grades 9 to 12 and for Grade band ALL3 were just-identified statistical models and required fixing the expected error variance for one estimated analysis parameter. The analyst fixed the error variance for the NUM domain at its computed value for these analyses, since the NUM domain had the least number of blueprint specified items for grade band 9 to 12 which also affected estimation of grade band ALL3 at the high school level.
Table 18: Domain Scores Included in the CFA Models for Star Math, by Grade Banda
a. Math Domain Key:ALG = Algebra DomainGEO = Geometry and Measurement DomainDAT = Data Analysis, Statistics, and Probability DomainNUM = Numeration and Operations Domain
Grade Bands
Domains
1 2 3 4
K to 2 ALG GEO DAT NUM
3 to 5 ALG GEO DAT NUM
6 to 8 ALG GEO DAT NUM
9 to 12 ALG GEO NUM
53Star Assessments™ for MathTechnical Manual

ValidityConstruct Validity
As Table 19 indicates, sample sizes ranged from 32,095 to 69,133 within grade bands; because the chi-square (χ2) test is not a reliable test of model fit when sample sizes are large, a variety of fit indices are presented. The comparative fit index (CFI), goodness of fit index (GFI), and the normed fit index (NFI) are shown; for these indices, values are either 1 or very close to 1, indicating strong evidence of a single construct/dimension for Star Math. In addition, the root mean square error of approximation (RMSEA), and the standardized root mean square residual (SRMR) are presented. RMSEA and SRMR values less than 0.08 indicate good fit. Cutoffs for the indices are presented in Hu and Bentler, 1999. Overall, the CFA results strongly support a single underlying dimension.
Table 20 presents the CFA Factor Loadings for the four math content domains for Algebra (ALG), Geometry and Measurement (GEO), Data Analysis, Statistics and Probability (DAT) and Numeration and Operations (NUM). These results show consistently high factor loadings within grade bands across the three to four math domains, and across grade bands within each math domain cluster. The CFA factor loading range from 0.78 to 0.93 show congruence of factor loadings within domains across grade bands, and within grade bands across the math content domains. Grade Band ALL4 shows results across all grade bands for four math domains (ALG, GEO, DAT, and NUM). Grade Band ALL3 shows results across all grade bands for three math domains (ALG, GEO, and NUM).
Table 19: Summary of the Goodness-of-Fit of the CFA Models for Star Math by Grade Band
Grade Band N χ2 df CFI GFI NFI RMSEA SRMR
K to 2 35,216 95.8252 2 0.9990 0.9986 0.9990 0.0365 0.0055
3 to 5 32,095 26.0192 2 0.9997 0.9996 0.9997 0.0193 0.0025
6 to 8 47,477 165.487 2 0.9989 0.9983 0.9989 0.0415 0.0047
9to12 69,133 354.493 1 0.9977 0.9966 0.9977 0.0715 0.0139
ALL4 131,221 173.930 2 0.9997 0.9993 0.9997 0.0256 0.0014
ALL3 201,088 584.864 1 0.9991 0.9980 0.9869 0.0539 0.0032
Table 20: Summary of the CFA Factor Loadings for Star Math by Grade Band and Math Domain
Grade Band
CFA Factor Loadings
ALG GEO DAT NUM
K to 2 0.7799 0.8581 0.7994 0.9168
3 to 5 0.8104 0.8682 0.8213 0.9321
6 to 8 0.8681 0.8652 0.8259 0.9350
9 to 12 0.9275 0.9254 NA* 0.8099
ALL4 0.9320 0.9400 0.9165 0.9690
ALL3 0.9465 0.9523 NA* 0.9356
54Star Assessments™ for MathTechnical Manual

ValidityConstruct Validity
Table 21 summarizes principal components and principal axis Exploratory Factor analysis (EFA) factor loadings for Star Math domains across all grade bands. These results show independent support of the CFA analyses’ results for the unidimensionality for Star Math. Note, the component and factor loadings for the DAT math domain are estimated from grades K to 8 but were not available for grades 9 to 12 due to the test blueprint.
The EFA analyses were conducted using the factor procedure in SAS 9.4 software and in IBM SPSS version 19 software, while the CFA analysis was conducted using the calis procedure in the SAS 9.4 software (SAS Institute, Cary NC).
Relationship of Star Math Scores to Scores on Other Tests of Mathematics Achievement
The technical manual for the earliest version of Star Math listed correlations between scores on that test and those on a number of other standardized measures of math achievement, obtained in 1998 for more than 9,000 students who participated in Star Math norming for that version of the program. The standardized tests included a variety of well-established instruments, including the California Achievement Test (CAT), the Comprehensive Test of Basic Skills (CTBS), the Iowa Tests of Basic Skills (ITBS), the Metropolitan Achievement Test (MAT), the Stanford Achievement Test (SAT), and several statewide tests.
During a subsequent norming of Star Math, scores on other standardized tests were obtained for more than 30,000 additional students. All of the standardized tests listed above were included, plus others such as Northwest Evaluation Association (NWEA) and TerraNova. Scores on state assessments from the following states were also included: Arkansas, Connecticut, Delaware, Florida, Georgia, Kentucky, Idaho, Indiana, Illinois, Maryland, Michigan, Minnesota, Mississippi, New York, North Carolina, Ohio, Oklahoma, Oregon,
Table 21: Summary of Principal Components and Principal Axis EFA Factor Loadings Across All Grade Bands for Star Math Domains
Principal Components Principal Axis
Math Domain
Component Factor
1 1
ALG 0.951 0.932
DAT 0.944 0.918
GEO 0.955 0.940
NUM 0.970 0.968
55Star Assessments™ for MathTechnical Manual

ValidityConstruct Validity
Pennsylvania, Rhode Island, South Dakota, Texas, Virginia, and Washington. The extent that the Star Math test correlates with these tests provides support for its construct validity. That is, strong and positive correlations between Star Math and these other instruments provide support for the claim that Star Math effectively measures mathematics achievement.
Tables 22–25 (beginning on page 59) summarize the correlation coefficients between the scores on the Star Math test and each of the other test instruments for which data were received. “Detailed Evidence of Star Math Validity” on page 137 contains detailed correlational data behind the summaries in Tables 22–25.
Tables 22 and 23 summarize “concurrent validity” data, that is, correlations between Star Math norming study test scores and other tests administered within a two-month time period.
In addition to the concurrent validity estimates summarized in Tables 22 and 23, data concerning Star Math’s predictive validity are summarized in Tables 24 and 25. Predictive validity provides an estimate of the extent to which scores on the Star Math test predicted scores on criterion measures given at a later point in time, operationally defined as more than 2 months between the Star test (predictor) and the criterion test. It provides an estimate of the linear relationship between Star scores and scores on measures covering a similar academic domain. Predictive correlations are typically attenuated by time due to the fact that students are gaining skills in the interim between testing occasions, and also by differences between the tests’ content specifications.
The following is a partial list of math assessments for which there is evidence of correlations with Star Math reported in this technical manual.
Achievement level (RIT) Test
ACT Aspire
American College Testing Program
Arkansas Augmented Benchmark Examination (AABE)
California Achievement Test
Canadian Achievement Test
Cognitive Abilities Test
Comprehensive Test of Basic Skills
Connecticut Mastery Test
Delaware Student Testing Program (DSTP)
Des Moines Public School (Grade 2 pretest)
Differential Aptitude Tests
56Star Assessments™ for MathTechnical Manual

ValidityConstruct Validity
Educational Development Series
Explore Tests
Florida Comprehensive Assessment Test (FCAT)
Florida Standards Assessments (FSA)
Georgia Milestones
Georgia High School Graduation Test
Idaho Standards Achievement Test (ISAT)
Indiana Statewide Testing for Educational Progress
Iowa Assessment
Iowa Test of Basic Skills (ITBS)
Kansas State Assessment Program (KSAP)
Kentucky Core Content Test (KCCT)
Kentucky Core Content Test
Key Stage 2 Standardised Attainment Tests (UK KS2 SATs)
Maryland High School Placement Test
McGraw Hill Mississippi/Criterion Referenced
Metropolitan Achievement Test (MAT)
Michigan Educational Assessment Program
Minnesota Comprehensive Assessment (MCA)
Mississippi Academic Assessment Program (MAAP)
Mississippi Curriculum Test (MCT2)
Missouri Assessment Program (MAP) Grade-Level Tests
Multiple Assessment Series ({Primary Grades)
New Jersey Assessment of Skills and Knowledge (NJASK)
New Standards Reference Mathematics Exam (Rhode Island)
New York State Assessment Program
New York State Math Assessment
North Carolina End-of-Grade (NCEOG) Test
Northwest Evaluation Association Levels Test
NWEA, NALT, & MAP
Ohio Achievement Assessment
Ohio Proficiency Test (OPT)
Ohio State Tests (OST)
Oklahoma Core Curriculum Test (OCCT)
57Star Assessments™ for MathTechnical Manual

ValidityConstruct Validity
Oklahoma School Testing Program Core Curriculum Tests
Oregon State Assessment
Otis Lennon School Ability Test (OLSAT)
Palmetto Achievement Challenge Test (PACT), 2001
Partnership for Assessment of Readiness for College and Careers (PARCC)
Pennsylvania System of School Assessment (PSSA)
PLAN
Preliminary SAT/National Merit Scholarship Qualifying Test
Smarter Balanced Assessment (SBA)
South Dakota State Test of Educational Progress (DSTEP)
Stanford Achievement Test
Star Math
State of Texas Assessments of Academic Readiness Standards Test 2
Tennessee Comprehensive Assessment Program (TCAP)
TerraNova
Test of Achievement Proficiency
Test of New York State Standards
Texas Assessments of Academic Readiness Standards
Texas Assessment of Academic Skills (TAAS), 2001
Texas Assessment of Knowledge and Skills (TAKS)
Transitional Colorado Assessment Program (TCAP)
Virginia Standards of Learning
Washington Assessment of Student Learning
West Virginia Educational Standards Test 2
Wide Range Achievement Test
Wisconsin Forward Exam
Wisconsin Knowledge and Concepts Examination (WKCE)
Tables 22 through 25 contain summaries of some of the correlational data in support of Star Math validity. Table 22 summarizes the within-grade average concurrent validity coefficients for grades 1–6; these varied from 0.64–0.74, with an overall average of 0.69. Table 23 summarizes the concurrent validity for grades 7–12; correlations ranged from 0.56–0.75, with an overall average of 0.69.
58Star Assessments™ for MathTechnical Manual

ValidityConstruct Validity
Tables 24 and 25 contain similar summaries of predictive validity coeffients. Table 24 summarizes the grades 1–6 data; coefficients ranged from 0.55–0.72, with an average of 0.55. Table 25 does the same for grade 7–12 predictive validity; obtained coefficients ranged from 0.72–0.80, with an average of 0.76.
In general, these correlation coefficients reflect very well on the validity of the Star Math test as a tool for placement in mathematics. In fact, the correlations are similar in magnitude to the validity coefficients of these measures with each other. These validity results, combined with the supporting evidence of reliability and minimization of SEM estimates for the Star Math test, provide a quantitative demonstration of how well this innovative instrument in mathematics achievement assessment performs.
Table 22: Summary of Concurrent Validity Statistics for Grades 1–6: Star Math Correlations (r) with External Tests Administered Between 2002 and 2016
Summary
Grade(s) N 1 2 3 4 5 6
Number of students 370,651 215 951 104,603 99,768 93,810 71,304
Number of coefficients 241 5 11 64 56 62 43
Average validity – 0.65 0.64 0.72 0.73 0.75 0.72
Overall average 0.73
Table 23: Summary of Concurrent Validity Statistics for Grades 7–12: Star Math Correlations (r) with External Tests Administered Between 2002 and 2016
Summary
Grade(s) N 7 8 9 10 11 12
Number of students 123,819 60,917 51,442 5,335 4,528 1,494 103
Number of coefficients 95 36 36 5 7 6 5
Average validity – 0.73 0.74 0.65 0.58 0.70 0.56
Overall average 0.71
Table 24: Summary of Predictive Validity Data, Grades 1–6: Star Fall-to-Spring Correlations (r) with External Tests Administered Between 2001 and 2016
Summary
Grade(s) N 1 2 3 4 5 6
Number of students 662,040 11,880 33,076 176,784 175,330 152,693 112,277
Number of coefficients 285 6 10 77 69 74 49
Average validity – 0.55 0.63 0.72 0.74 0.73 0.74
Overall average 0.72
59Star Assessments™ for MathTechnical Manual

ValidityMeta-Analysis of the Star Math Validity Data
Meta-Analysis of the Star Math Validity DataMeta-analysis is a set of statistical procedures that combines results from different sources or studies. When applied to a set of correlation coefficients that estimate test validity, meta-analysis combines the observed correlations and sample sizes to yield estimates of overall validity, as well as standard errors and confidence intervals, both overall and within grades.
To conduct a meta-analysis of the Star Math validity data, the 747 correlations summarized in Tables 22 through 25, observed in data from Star Math tests of more than 1.3 million students, were combined and analyzed using a fixed effects model for meta-analysis. The results are displayed in Table 26. The table lists results for the correlations within each grade, as well as results with all twelve grades’ data combined. For each set of results, the table lists an estimate of the true validity, a standard error, and the lower and upper limits of a 95 percent confidence interval for the validity coefficient. Based on the 747 correlation coefficients, the overall estimate of the validity of Star Math is 0.758, with a standard error of 0.001. The probability of observing the 747 correlations reported in Tables 22–25, if the true validity were zero, is virtually zero. Because the correlations were obtained with widely different tests, and among students from twelve different grades, these results provide strong support for the validity of Star Math as a measure of math skills.
Table 25: Summary of Predictive Validity Data, Grades 7–12: Star Fall-to-Spring Correlations (r) with External Tests Administered Between 2001 and 2016
Summary
Grade(s) N 7 8 9 10 11 12
Number of students 160,323 75,876 59,960 7,971 8,708 6,831 977
Number of coefficients 126 51 46 8 9 9 3
Average validity – 0.75 0.74 0.75 0.77 0.72 0.65
Overall average 0.74
Table 26: Results of the Meta-Analysis of Star Math Correlations with Other Tests
Grade
Effect Size 95% Confidence Interval
Total Correlations Total NValidity Estimate
Standard Error Lower Limit Upper Limit
1 0.558 0.009 0.545 0.570 11 12,095
2 0.627 0.005 0.620 0.633 21 34,027
3 0.755 0.002 0.753 0.756 141 281,387
4 0.760 0.002 0.759 0.762 125 275,098
60Star Assessments™ for MathTechnical Manual

ValidityMeta-Analysis of the Star Math Validity Data
Linking Star and State Assessments: Comparing Student- and School-Level DataWith an increasingly large emphasis on end-of-the-year summative state tests, many educators seek out informative and efficient means of gauging student performance on state standards—especially those hoping to make instructional decisions before the year-end assessment date.
For many teachers, this is an informal process in which classroom assessments are used to monitor student performance on state standards. While this may be helpful, such assessments may be technically inadequate when compared to more standardized measures of student performance. Recently the assessment scale associated with Star Math has been linked to the scales used for summative mathematics tests in most states. Linking Star Math assessments to state tests allows educators to reliably predict student performance on their state assessment using Star Math scores. More specifically, it places teachers in a position to identify
which students are on track to succeed on the year-end summative state test, and
which students might need additional assistance to reach proficiency.
Educators using Star Math assessments can access Star Performance Reports that allow access to students’ Pathway to Proficiency. These reports indicate whether individual students or groups of students (by class, grade, or demographic characteristics) are likely to be on track to meet a particular state’s criteria for mathematics proficiency. In other words, these reports allow instructors to evaluate student progress toward proficiency and make data-based instructional decisions well in advance of the annual state tests.
5 0.765 0.002 0.764 0.767 136 246,503
6 0.777 0.002 0.775 0.779 92 183,581
7 0.770 0.003 0.768 0.772 87 136,793
8 0.754 0.003 0.751 0.756 82 111,402
9 0.708 0.009 0.699 0.716 13 13,306
10 0.751 0.009 0.744 0.759 16 13,236
11 0.740 0.011 0.730 0.750 15 8,325
12 0.731 0.030 0.702 0.758 8 1,080
All Grades 0.758 0.001 0.757 0.759 747 1,316,833
Table 26: Results of the Meta-Analysis of Star Math Correlations with Other Tests (Continued)
Grade
Effect Size 95% Confidence Interval
Total Correlations Total NValidity Estimate
Standard Error Lower Limit Upper Limit
61Star Assessments™ for MathTechnical Manual

ValidityMeta-Analysis of the Star Math Validity Data
Additional reports automatically generated by Star Math help educators screen for later difficulties and progress monitor students’ responsiveness to interventions.
Relationship of Star Math Scores to Scores on Multi-State Consortium Tests in Math
In recent years, the National Governors’ Association, in collaboration with the Council of Chief State School Officers (CCSSO), developed a proposed set of curriculum standards in English Language Arts and Math, called the Common Core State Standards. Forty-five states voluntarily adopted those standards; subsequently, many states have dropped them, but more than 20 states continue to use them or base their own state standards on them. Two major consortia were formed to develop assessments systems that embodied those standards: the Smarter Balanced Assessment Consortium (SBAC) and Partnership for Assessment of Readiness for College and Careers (PARCC). SBAC and PARCC end-of-year assessments have been administered in numerous states in place of those states’ previous annual accountability assessments. Renaissance Learning was able to obtain SBAC and PARCC scores of many students who had taken Star Math earlier in the same school years. Tables 27 and 28 below contain coefficients of correlation between Star Math and the consortium tests. The average of the concurrent correlations was approximately 0.88 for SBAC and 0.83 for PARCC. The average predictive correlation was approximately 0.89 with the SBAC assessments, and 0.85 for PARCC.
Table 27: Concurrent and Predictive Validity Data: Star Math Scaled Scores Predicting Later Performance for Grades 3–8 on Smarter Balanced Assessment Consortium Tests
Star Math Concurrent and Predictive Correlations with Smarter Balanced Assessment Scores
Grade All 3 4 5 6 7 8
Concurrent N 10,800 10,582 9,750 7,852 6,344 5,424
Correlation 0.86 0.88 0.89 0.87 0.88 0.87
Predictive N 8,593 8,571 8,595 8,575 8,623 8,859
Correlation 0.89 0.90 0.90 0.89 0.89 0.86
62Star Assessments™ for MathTechnical Manual

ValidityClassification Accuracy of Star Math
Classification Accuracy of Star Math
Accuracy for Predicting Proficiency on a State Math AssessmentStar Math test scores have been linked statistically to numerous state Math assessment scores. The linked values have been employed to use Star Math to predict student proficiency in Math on those state tests. One example of this is a linking study conducted using a multi-state sample of students’ scores on the PARCC consortium assessment.1 Table 29 presents classification accuracy statistics for grades 3 through 8.
Table 28: Concurrent and Predictive Validity Data: Star Math Scaled Scores Correlations for Grades 3–8 with PARCC Assessment Consortium Test Scores
Star Math Concurrent and Predictive Correlations with PARCC Assessment Scores
Grade All 3 4 5 6 7 8
Concurrent N 3,635 4,008 3,653 4,150 4,066 3,748
Correlation 0.83 0.86 0.82 0.83 0.81 0.80
Predictive N 4,103 4,787 4,266 5,050 4,368 4,196
Correlation 0.83 0.82 0.78 0.79 0.80 0.77
1. Renaissance Learning (2016). Relating Star Reading® and Star Math® to the Colorado Measure of Academic Success (CMAS) (PARCC Assessments) Performance.
Table 29: Classification Diagnostics for Predicting Students’ Math Proficiency on the PARCC Consortium Assessment from Earlier Star Math Scores
Measure
Grade
3 4 5 6 7 8
Overall classification accuracy 89% 90% 92% 91% 91% 90%
Sensitivity 71% 58% 57% 66% 59% 59%
Specificity 94% 97% 98% 97% 97% 96%
Positive predictive value (PPV) 75% 82% 83% 79% 77% 77%
Negative predictive value (NPV) 93% 91% 93% 93% 93% 92%
Observed proficiency rate (OPR) 20% 19% 15% 17% 16% 17%
Projected proficiency rate (PPR) 19% 13% 10% 14% 12% 13%
Proficiency status projection error –1% –6% –5% –3% –4% –4%
Area Under the ROC Curve 0.94 0.94 0.94 0.95 0.95 0.94
63Star Assessments™ for MathTechnical Manual

ValidityClassification Accuracy of Star Math
As the table shows, overall classification accuracy ranged from 89 to 92%, depending on grade. Area Under the Curve (AUC) was at least 0.94 for all grades. Specificity was especially high, and the projected proficiency rates were very close to the observed proficiency rates at all grades.
Numerous other reports of linkages between Star Math and state accountability tests have been conducted. Reports are available at research.renaissance.com/.
Evidence of Technical Adequacy for Informing Screening and Progress Monitoring Decisions
Many school districts use tiered models such as Response to Intervention (RTI) or Multi-Tiered Systems of Support (MTSS) to guide instructional decision making and improve outcomes for students. These models represent a more proactive, data-driven approach for better serving students as compared with prior decision-making practices, including processes to:
Screen all students to understand where each is in the progression of learning in reading, math, or other disciplines
Identify at-risk students for intervention at the earliest possible moment
Intervene early for students who are struggling or otherwise at-risk of falling behind; and
Monitor student progress in order to make decisions as to whether they are responding adequately to the instruction/intervention
Assessment data are central to both screening and progress monitoring, and Star Math is widely used for both purposes. This chapter includes technical information about Star Math’s ability to accurately screen students according to risk and to help educators make progress monitoring decisions. Much of this information has been submitted to and reviewed by the Center on Response to Intervention https://rti4success.org/ and/or the National Center on Intensive Intervention https://intensiveintervention.org/, two technical assistance groups funded by the US Department of Education.
For several years running, Star Math has enjoyed favorable technical reviews for its use in informing screening and progress monitoring decision by the CRTI and NCII, respectively. The most recent reviews by CRTI indicate that Star Math has a “convincing” level of evidence (the highest rating awarded) in the core screening categories, including classification accuracy, reliability, and validity. CRTI also notes that the extent of the technical evidence is “Broad” (again, the highest rating awarded) and notes that not only is the overall evidence compelling, but there are disaggregated data as well that shows Star Math works equally well among subgroups. The most recent reviews by NCII
64Star Assessments™ for MathTechnical Manual

ValidityClassification Accuracy of Star Math
indicate that there is fully “convincing” evidence of Star Math’s psychometric quality for progress monitoring purposes, including reliability, validity, reliability of the slope, and validity of the slope. Furthermore, they find fully “convincing” evidence that Star Math is sufficiently sensitive to student growth, has adequate alternate forms, and provides data-based guidance to educators on end-of-year benchmarks and when an intervention should be changed, among other categories. Readers may find additional information on Star Math on those sites and should note that the reviews are updated on a regular basis, as their review standards are adjusted and new technical evidence for Star Math and other assessments are evaluated.
ScreeningAccording to the Center on Response to Intervention, “Screening is conducted to identify or predict students who may be at risk for poor learning outcomes. Universal screening assessments are typically brief, conducted with all students at a grade level, and followed by additional testing or short-term progress monitoring to corroborate students’ risk status.”2
Most commonly, screening is conducted with all students at the beginning of the year and then another two to four times throughout the school year. Star Math is widely used for this purpose. In this section, the technical evidence supporting its use to inform screening decisions is summarized.
Organizations of RTI/MTSS experts such as the Center on Response to Intervention and the RTI Action Network3 are generally consistent in how measurement tools should be evaluated for their appropriateness as screeners. Key categories include the following:
1. Validity and reliability. See the “Reliability and Measurement Precision” chapter and the earlier sections of this “Validity” chapter for a summary of the available evidence supporting Star Math’s reliability and validity.
2. Practicality and efficiency. Screening measures should not require much teacher or student time. Because most students can complete a Star Math test in 15–20 minutes or less, and because it is group administered and scored automatically, Star Math is an exceptionally efficient general outcomes measure for mathematics.
3. Classification accuracy metrics including sensitivity, specificity, and overall predictive accuracy. These are arguably the most important indicators, addressing the main purpose of screening: When a brief
2. https://rti4success.org/essential-components-rti/universal-screening3. http://www.rtinetwork.org/learn/research/universal-screening-within-a-rti-model
65Star Assessments™ for MathTechnical Manual

ValidityClassification Accuracy of Star Math
screening tool indicates a student either is or is not at risk of later difficulties in mathematics, how often is it accurate, and what types of errors are made?
It is common to use high-stakes indicators such as state summative assessments as criterion measures for classification accuracy evaluation. Star Math is linked to virtually every state summative assessment in the US as well as the United Kingdom’s Key Stage 2 Standardised Attainment Tests for Maths, as well as the ACT and SAT college entrance exams. The statistical linking of the Star Math scale with these other measures’ scales, combined with Star Math growth norms (discussed in the Growth Norms section, on page 81 of the Norming chapter) empowers Star Math reports, dashboards, and data extracts to make predictions throughout the school year about future student performance. These predictions inform educator screening decisions in schools using an RTI/MTSS framework. (Educators are also free to use norm-referenced scores such as Percentile Ranks to inform screening decisions.)
Star Math’s classification accuracy results from several recent predictive studies are summarized in Table 30 on page 67. Each study evaluated the extent to which Star Math accurately predicted whether a student achieved a specific performance level on another mathematics measure. The specific performance level (cut point) varies by assessment and grade. Cut points are set by assessment developers and sponsors, which in the case of state summative exams usually means the state department of education and/or state board of education. State assessments generally have between three and five performance levels, and the cut point used in these analyses refers to the level the state has determined indicates meeting grade level mathematics standards. For instance, the cut point on California’s CAASPP is Level 3, also known as “Standard Met.” On Louisiana’s LEAP 2025 the cut point is at the “Mastery” level. In the case of ACT and SAT, the cut point established by the developers (ACT and College Board, respectively) indicates an estimated level of readiness for success in college.
66Star Assessments™ for MathTechnical Manual

ValidityClassification Accuracy of Star Math
Table 30: Summary of Classification Accuracy Metrics from Recent Studies Linking Star Math with Summative Mathematics Measures
AssessmentGrade/s Covered
Date Study Completed
Study Sample
Size
Average Result Across All Grades
Overall Classification
Accuracy Sensitivity SpecificityArea under ROC Curve
ACT Mathematics (college readiness)
11 4/22/2016 6,328 89% 67% 98% 0.93
ACT Aspire 3–8 6/1/2017 37,581 85% 81% 80% 0.92
California Assessment of Student Performance and Progress (CAASPP) (Smarter Balanced)
3–8 10/30/2015 51,816 87% 84% 88% 0.94
Florida Standards Assessments (FSA)
3–8 6/30/2015 16,071 83% 83% 81% 0.91
Georgia Milestones 3–8 7/1/2017 44,745 89% 77% 93% 0.94
Illinois Partnership for Assessment of Readiness for College and Careers (PARCC) Assessments
3–8 7/13/2016 23,260 91% 62% 96% 0.94
Louisiana Educational Assessment Program (LEAP 2025)
3–8 1/31/2018 7,713 84% 73% 87% 0.91
Maine Educational Assessment (MEA)
3–8 7/1/2017 895 86% 78% 88% 0.91
Mississippi Academic Assessment Program (MAAP)
3–8 2/1/2017 10,954 85% 78% 88% 0.92
Missouri Assessment Program (MAP) Grade-Level Tests
3–8 3/14/2017 19,442 84% 79% 86% 0.94
North Carolina READY End-of-Grade (EOG)
3–8 2/16/2015 125,932 81% 78% 82% 0.89
Ohio State Tests 3–8 12/20/2016 19,682 83% 79% 86% 0.92
Pennsylvania’s System of School Assessment (PSSA)
3–8 12/19/2016 3,436 87% 87% 86% 0.94
SAT (college entrance) 11
South Carolina College-and Career-Ready Assessments (SC READY)
3–8 12/5/2016 8,909 87% 83% 89% 0.94
67Star Assessments™ for MathTechnical Manual

ValidityClassification Accuracy of Star Math
Notes:
Some tests, such as the Smarter Balanced (indicated above for California) and PARCC (indicated above for Illinois) are used in multiple states, so those results may apply to other states not listed here.
Overall classification accuracy refers to the percentage of correct classifications.
Sensitivity refers to the rate at which Star Math identifies students as being at-risk who demonstrate a poor learning outcome at a later point in time. Sensitivity can be thought of as the true positive rate. Screening tools with high sensitivity help ensure that students who truly need intervention will be identified to receive it.
Specificity refers to the rate at which Star Math identifies students as being not at-risk who perform satisfactorily at a later point in time. Specificity can be thought of as a true negative rate. Screening tools with high specificity help ensure that scarce resources are not invested in students who do not require extra assistance.
Area under the ROC (Receiver Operating Characteristic) curve is a powerful indicator of overall accuracy. The ROC curve is a plot of the true positive rate (sensitivity) against the false positive rate (1-specificity) for the full range of possible screener (Star Math) cut points. The area under ROC Curve (AUC) is an overall indication of the diagnostic accuracy of the
State of Texas Assessments of Academic Readiness (STAAR)
3–7 7/1/2017 642 84% 80% 85% 0.91
State of Texas Assessments of Academic Readiness (STAAR) Algebra 1 End of Course (EOC) Test
Algebra I 2/9/2017 3,292 76% 85% 60% 0.82
UK Key Stage 2 Standardised
Year 6 9/1/2017 815 89% 89% 90% 0.97
Attainment Tests (SATs) Maths
Wisconsin Forward Exam 3–8 12/22/2016 39,812 91% 71% 96% 0.96
Table 30: Summary of Classification Accuracy Metrics from Recent Studies Linking Star Math with Summative Mathematics Measures (Continued)
AssessmentGrade/s Covered
Date Study Completed
Study Sample
Size
Average Result Across All Grades
Overall Classification
Accuracy Sensitivity SpecificityArea under ROC Curve
68Star Assessments™ for MathTechnical Manual

ValidityClassification Accuracy of Star Math
curve. AUC values range between 0 and 1 with 0.5 indicating a chance level of accuracy. The Center for Response to Intervention considers results at or above 0.85 to be an indication of convincing evidence of classification accuracy.4
Note that many states tend to not use the same assessment system for more than a few consecutive years, and Renaissance endeavors to keep the Star Math classification reporting as up to date as possible. Those interested in reviewing the full technical reports for these or other state assessments are encouraged to visit http://research.renaissance.com/advancedsearch.asp and search by state name for the Star Math linking reports (e.g., “Wisconsin linking”).
Progress MonitoringAccording to the National Center on Intensive Intervention, “progress monitoring is used to assess a student’s performance, to quantify his or her rate of improvement or responsiveness to intervention, to adjust the student’s instructional program to make it more effective and suited to the student’s needs, and to evaluate the effectiveness of the intervention.”5
In an RTI/MTSS context, progress monitoring involves frequent assessment—usually occurring once every 1–4 weeks—and often involves only those students who are receiving additional instruction after been identified as at-risk via the screening process. Ultimately, educators use progress monitoring data to determine whether a student is responding adequately to the instruction, or whether adjustments need to be made to the instructional intensity or methods. The idea is to get to a decision quickly, with as little testing as possible, so that valuable time is not wasted on ineffective approaches. Educators make these decisions by comparing their performance against a goal set by the educator. Goals should be “reasonable yet ambitious”6 as recommended by Shapiro (2008), and Star Math offers educators a variety of guidance to set normative or criterion-referenced goals that meet these criteria.
The RTI Action Network, National Center on Intensive Intervention, and other organizations offering technical assistance to schools implementing RTI/MTSS models are generally consistent in encouraging educators to select assessments for progress monitoring that have certain characteristics. A
4. https://rti4success.org/resources/tools-charts/screening-tools-chart/screening-tools-chart-rating-system
5. https://intensiveintervention.org/ncii-glossary-terms#Progress Monitoring 6. Shapiro, E. S. (2008). Best practices in setting progress-monitoring monitoring goals for
academic skill improvement. In A. Thomas & J. Grimes (Eds.), Best practices in school psychology V (pp. 141–157). Bethesda, MD: National Association of School Psychologists.
69Star Assessments™ for MathTechnical Manual

ValidityClassification Accuracy of Star Math
summary of those characteristics and relevant information about Star Math is provided below.
1. Evidence of psychometric quality.
a. Reliability and validity. See the “Reliability and Measurement Precision” chapter and the earlier sections of this “Validity” chapter for a summary of the available evidence supporting Star Math’s reliability and validity.
b. Reliability of the slope. Because progress monitoring decisions often involve the student’s rate of progress over multiple test administrations, the characteristics of the student’s slope of improvement, or trend line, are also important. A study was conducted in 2017 by Renaissance Learning to evaluate reliability of slope for at-risk students who were being progress monitored during the 2016–17 school year. Specifically, the sample included 96,209 students who began the school year at-risk (defined as placing below the 30th Percentile Rank in Star Math) and were assessed 10 or more times during the school year, with a minimum of 140 days between first and last test.
Every student’s Star Math test records were sorted in chronological order. Each test record was coded as either an odd- or even-numbered test. Slopes were estimated for each student’s odd-number tests and also for the even-numbered tests using ordinary least squares regression. Then, the odd and even slopes were correlated. The table below summarizes the Pearson correlation coefficients by grade, indicating a consistently strong association between even and odd numbered test slopes.
Table 31: Star Math Reliability of the Slope Coefficients by grade, 1–12
Grade n Coefficient
1 8,987 0.92
2 18,460 0.93
3 16,696 0.93
4 14,738 0.93
5 12,411 0.93
6 8,627 0.94
7 6,379 0.93
8 5,317 0.93
9 2,129 0.94
10 1,265 0.94
11 803 0.94
70Star Assessments™ for MathTechnical Manual

ValidityClassification Accuracy of Star Math
2. Produce a sufficient number of forms. Because Star Math is computer-adaptive with an item bank comprising more than six thousand items, there are at a minimum, several hundred alternate forms for a student at a given ability level. This should be more than sufficient for even the most aggressive progress monitoring testing schedule.
A variety of grade-specific evidence is available to demonstrate the extent to which Star Math can reliably produce consistent scores across repeated administrations of the same or similar tests to the same individual or group. These include:
a. Generic reliability, defined as the proportion of test score variance that is attributable to true variation in and the trait or construct the test measures. Grade-level results are summarized in Table 12 on page 41 and Table 15 on page 47.
a. Alternate forms reliability, defined as the correlation between test scores on repeated administrations to the same examinees. Grade-level results are summarized in Table 12 on page 41 and Table 15 on page 47.
b. Practicality and efficiency. As mentioned above, most students complete Star Math in 15–20 minutes. It is auto-scored and can be group administered, requiring very little educator involvement, making it an efficient progress monitoring solution.
3. Specify criteria for adequate growth and benchmarks for end-of-year performance levels. Goal-setting decisions are handled by local educators, who know their students best and are familiar with the efficacy and intensity of the instructional supports that will be offered. That said, publishers of assessments used for progress monitoring are expected to provide empirically based guidance to educators on setting goals.
Star Math provides guidance to inform goal setting using a number of different metrics, including the following:
a. Student Growth Percentile. SGP describes a student’s velocity (slope) relative to a national sample of academic peers—those students in the same grade with a similar score history. SGPs work like Percentile Ranks (1–99 scale) but once an SGP goal has been set, it is converted to a Scaled Score goal at the end date specified by the teacher. An SGP-defined goal can be converted into an
12 397 0.94
Table 31: Star Math Reliability of the Slope Coefficients by grade, 1–12
Grade n Coefficient
71Star Assessments™ for MathTechnical Manual

ValidityClassification Accuracy of Star Math
average weekly increase in a Scaled Score metric if educators prefer to use that. Many teachers select either SGP 50 (indicating typical or expected growth) as minimum acceptable growth, or something indicating accelerated growth, such as 65 or 75. A helpful feature of SGP is that it can be used as a “reality check” for any goal, whether it be in an SGP metric or something else (e.g., Scaled Score, Percentile Rank). SGP estimates the likelihood that the student will achieve a level of growth or later performance. For example, a goal associated with an SGP of 75 indicates that only about 25 percent of the student’s academic peers would be expected to achieve that level of growth.
b. State test proficiency. As described in the Screening section, the fact that Star Math is linked to virtually every state assessment enables educators to select values on the Star scale that are approximately equivalent to states’ defined proficiency level cut points for each grade.
c. Percentile Rank and Scaled Score. Educators may also enter custom goals using Percentile Rank or Scaled Score metrics.
Additional Research on Star Math as a Progress Monitoring Tool
A 2016 study by Cormier & Bulut7 evaluated Star Math as a progress monitoring tool, concluding:
Although relatively little research exists on using computer adaptive measures for progress monitoring as opposed to curriculum based measurement probes, the study concluded it was possible to use Star Math for progress monitoring purposes.
Sufficiently reliable progress monitoring slopes could be generated in as few as five Star Math administrations.
The duration of Star Math progress monitoring (i.e., over how many weeks should be conducted) is a function of the amount of typical growth by grade in relation to measurement error. For earlier grades (when student rates of growth are greatest), that amount of time could be as little as six weeks. For middle grades, 20 weeks should be sufficient.
These two findings challenge popular rules of thumb about progress monitoring frequency and duration (most of which are derived from CBM
7. Cormier, D. & Bulut, O. (2016). Developing psychometrically sound decision rules for Star Math. Report prepared for Renaissance Learning.
72Star Assessments™ for MathTechnical Manual

ValiditySummary of Star Math Validity Evidence
probe studies), which often involve weekly testing over periods of time that are selected due to popular convention rather than empirical evidence.
Using Theil-Sen regression procedures to estimate slope as opposed to OLS could reduce the influence of outlier scores, and thus provide a more accurate picture of student growth.
Summary of Star Math Validity EvidenceThe validity data presented in this technical manual includes evidence of Star Math’s concurrent, predictive, and construct validity, as well as classification accuracy statistics; strong measures of association with math achievement levels on state and multi-state accountability assessments; and extensive evidence of its technical adequacy for screening and progress monitoring. Exploratory and confirmatory factor analyses provided evidence that Star Reading measures a unidimensional construct, consistent with the assumption underlying its use of the Rasch 1-parameter logistic item response model. The Meta-Analysis section showed the average uncorrected correlation between Star Math and all other math tests to be 0.758. (Many meta-analyses adjust the correlations for range restriction and attenuation to less than perfect reliability; had we done that here, the average correlation would have exceeded 0.80.) Correlations with specific measures of math ability were often higher than this average. For example, correlations with PARCC assessments averaged 0.83, and those with Smarter-Balanced Assessment scores averaged 0.88. The overall pattern of hundreds of correlations between Star Math and scores on other recognized math assessments provides strong support for the claim that Star Math is a measure of math achievement.
Finally, the data showing the relationship between the current, standards-based Star Math Enterprise test and scores on specific state accountability tests and on the SBAC and PARCC Common Core consortium tests show that the correlations with these important measures are consistent with the meta-analysis findings.
73Star Assessments™ for MathTechnical Manual

Norming
Two distinct kinds of norms are described in this chapter: test score norms and growth norms. The former refers to distributions of test scores themselves. The latter refers to distributions of changes in test scores over time; such changes are generally attributed to growth in the attribute that is measured by a test. Hence distributions of score changes over time may be called “growth norms.”
BackgroundNational norms for Star Math were first developed in 2002, for Version 1 of the assessment. In 2012, Star Math norms were updated. Those norms were used until new norms were developed, for introduction at the start of the 2017–18 school year. This chapter describes the development of the 2017 norms.
The current version of Star Math, introduced in June 2011, is the first standards-based version of that test; it assesses a wide variety of skills and instructional standards. In the 2012 norming study, scores from the previous version of Star Math were used to compute the norms. An equating study developed minor adjustments to transform scores on the current Star Math version to the scale of the previous version. This allowed the 2012 norms be applied to both the current and previous versions of the test.
The 2017 Star Math NormsPrior to the development of the 2017 Star Math norms, a new reporting scale was developed, called the Unified scale. The Unified scale is a new linear transformation of the Star Math Rasch scores to a scale that shares features with a new scale developed for use with Star Reading and Star Early Literacy. The introduction of the Star Unified Scale provides a common scale that makes it possible for the first time to report performance on all Star assessments on the same scale.
The original Star Math scale is now referred to as the “Enterprise” score scale and will be available during the planned transition to the Unified scale as the default reporting scale. This chapter includes displays of normative summary data using both the Enterprise and the Unified scales
The 2017 Star Math norms are based on user Star Math data collected over the course of one full school year: 2014–2015. Separate early fall and late
74Star Assessments™ for MathTechnical Manual

NormingSample Characteristics
spring norms were developed for grades 1 through 12. Students participating in the norming study took assessments between August 15, 2014 and June 30, 2015. Students took the Star Math tests under normal test administration conditions. No specific norming test was developed and no deviations were made from the usual test administration. Thus, students in the norming sample took Star Math tests as they are administered in everyday use.
Sample CharacteristicsDuring the norming period, a total of 3,667,513 US students in grades 1–12 took Star Math tests administered using Renaissance servers hosted by Renaissance Learning. The first step in sampling was to select a representative sample of students who had tested in the fall, in the spring, or in both the fall and spring of the 2014–2015 school year. From the fall and the spring samples, stratified subsamples were randomly drawn based on student grade and ability decile. The grade and decile sampling was necessary to ensure adequate and similar numbers of students in each grade, and each decile within grade. Because these norming data were a convenience sample drawn from the Star Math customer base, steps were taken to ensure the resulting norms were nationally representative of grades 1–12 US student population with regard to certain important characteristics. A post-stratification procedure was used to adjust the sample proportions to the approximate national proportions on three key variables: geographic region, district socio-economic status, and district/school size. These three variables were chosen because they had previously been used in Star Math norming studies to draw nationally representative samples, are known to be related to test scores, and were readily available for the schools in the Renaissance hosted database.
The final norming sample size, after selecting only students with test scores in either the fall or the spring or both fall and spring in the norming year and further sampling by grade and ability decile was 1,917,271 students in grades 1–12. There were 1,347,950 students in the fall norming sample and 976,130 students in the spring norming sample; 406,809 students were included in both norming samples. These students came from 11,313 schools across 50 states and the District of Columbia.
75Star Assessments™ for MathTechnical Manual

NormingSample Characteristics
Tables 32 and 33 provide a breakdown of the number of students participating per grade in the fall and spring, respectively.
National estimates of US student population characteristics were obtained from two entities: the National Center for Educational Statistics (NCES) and Market Data Retrieval (MDR).
National population estimates of students’ demographics (ethnicity and gender) in grades 1–12 were obtained from NCES; these estimates were from 2013–14 for private schools and 2014–15 for public schools, the most recent data available. National estimates of race/ethnicity were computed using the NCES data based on single race/ethnicity and also a multiple-race category. The NCES data reflect the most recent census data from the US census bureau.
National estimates of school-related characteristics were obtained from May 2016 Market Data Retrieval (MDR) information. The MDR database contains the most recent data on schools, some of which may not be reflected in the NCES data.
Table 34 on page 78 shows national percentages of children in grades 1–12 by region, school/district enrollment, district socio-economic status, and location, along with the corresponding percentages in the norming sample. MDR estimates of geographic region were based on the four broad areas identified by the National Educational Association as Northeastern, Midwestern,
Table 32: Numbers of Students per Grade in the Fall Norms Sample
Grade N Grade N Grade N
1 27,790 5 204,210 9 35,600
2 161,730 6 200,070 10 47,160
3 186,040 7 180,280 11 18,160
4 205,000 8 70,160 12 11,750
Total 1,347,950
Table 33: Numbers of Students per Grade in the Spring Norms Sample
Grade N Grade N Grade N
1 46,320 5 141,650 9 16,290
2 139,830 6 143,660 10 18,720
3 136,730 7 114,830 11 11,680
4 148,970 8 53,230 12 4,220
Total 976,130
76Star Assessments™ for MathTechnical Manual

NormingSample Characteristics
Southeastern, and Western regions. The specific states in each region are shown below.
Geographic Region
Using the categories established by the National Center for Education Statistics (NCES), students were grouped into four geographic regions as defined below: Northeast, Southeast, Midwest, and West.
Northeast
Connecticut, District of Columbia, Delaware, Massachusetts, Maryland, Maine, New Hampshire, New Jersey, New York, Pennsylvania, Rhode Island, Vermont
Southeast
Alabama, Arkansas, Florida, Georgia, Kentucky, Louisiana, Mississippi, North Carolina, South Carolina, Tennessee, Virginia, West Virginia
Midwest
Iowa, Illinois, Indiana, Kansas, Minnesota, Missouri, North Dakota, Nebraska, Ohio, South Dakota, Michigan, Wisconsin
West
Alaska, Arizona, California, Colorado, Hawaii, Idaho, Montana, New Mexico, Nevada, Oklahoma, Oregon, Texas, Utah, Washington, Wyoming
School size
Based on total school enrollment, schools were classified into one of three school size groups: small schools had under 200 students enrolled, medium schools had 200–499 students enrolled, and large schools had 500 or more students enrolled.
Socioeconomic status as indexed by the percent of school students with free and reduced lunch
Schools were classified into one of four classifications based on the percentage of students in the school who had free or reduced student lunch. The classifications were coded as follows:
High socioeconomic status (0%–24%)
Above-median socioeconomic status (25%–49%)
Below-median socioeconomic status (50%–74%)
Low socioeconomic status (75%–100%)
77Star Assessments™ for MathTechnical Manual

NormingSample Characteristics
No students were sampled from the schools that did not report the percent of school students with free and reduced lunch.
The norming sample also included private schools, Catholic schools, students with disabilities, and English Language Learners as described below.
Table 35 on page 79 provides information on the demographic characteristics of students in the sample and national percentages provided by NCES. No weighting was done on the basis of these demographic variables; they are provided to help describe the sample of students and the schools they attended. Because Star assessment users do not universally enter individual student demographic information such as gender and ethnicity/race, some students were missing demographic data, and the sample summaries in Table 35 are based on only those students that had gender and ethnicity information available. In addition to the student demographics shown, an estimated 6.9% of the students in the norming sample were gifted and talented (G&T) as approximated by the 2011–2012 school data collected by the Office of Civil Rights (OCR). OCR is a subsidiary of the US Department of Education.
Table 34: Sample Characteristics Along with National Population Estimates and Sample Estimates
National Estimates
Fall Norming Sample
Spring Norming Sample
Region Midwest 20.9% 25.6% 21.8%
Northeast 19.2% 14.0% 16.1%
Southeast 24.6% 32.4% 28.8%
West 35.3% 28.0% 33.3%
School Enrollment < 200 4.0% 3.2% 3.5%
200–499 26.8% 37.5% 37.4%
≥ 500 69.1% 59.3% 59.1%
District Socioeconomic Status Low 19.5% 24.1% 24.7%
Below Median 24.3% 30.4% 28.2%
Above Median 25.2% 24.5% 24.5%
High 31.1% 21.0% 22.5%
Location Rural 14.1% 22.8% 20.6%
Suburban 42.3% 35.9% 37.6%
Town 11.7% 18.2% 18.4%
Urban 31.9% 23.1% 23.4%
78Star Assessments™ for MathTechnical Manual

NormingTest Administration
School type was defined to be either public (including charter schools) or non-public (private, Catholic).
Test AdministrationAll students took current version Star Math tests under normal administration procedures. Some students in the normative sample took the assessment two or more times within the norming windows; scores from their initial test administration in the fall and the last test administration in the spring were used for computing the norms.
Data AnalysisStudent test records were compiled from the complete database of Star Math Renaissance users. Data spanned one school year from August 2014 to June 2015. Students’ Unified scale Rasch scores on their first Star Math test taken during the first or the second month of the school year based on grade
Table 35: Student Gender and School Information: National Estimates and Samples Percentages
National Estimate
Fall Norming Sample
Spring Norming Sample
Gender Public Female 48.6% 49.6% 50.1%
Male 51.4% 50.4% 49.9%
Non-Public Female – 51.7% 52.4%
Male – 48.3% 47.6%
Race/Ethnicity Public American Indian 1.0% 1.9% 1.9%
Asian 5.3% 4.3% 4.3%
Black 15.5% 19.5% 19.9%
Hispanic 25.4% 18.3% 19.5%
White 49.6% 56.1% 54.4%
Multiple Racea
a. Students identified as belonging to two or more races.
3.2% – –
Non-Public American Indian 0.5% 3.1% 2.7%
Asian 6.6% 4.4% 7.9%
Black 9.1% 27.6% 12.4%
Hispanic 10.7% 31.7% 50.9%
White 69.2% 33.3% 26.2%
Multiple Racea 3.9% – –
79Star Assessments™ for MathTechnical Manual

NormingData Analysis
placement were used to compute norms for the fall; students’ Unified scale Rasch scores on the last Star Math test taken during the 8th or the 9th month of the school year were used to compute norms for the spring. Interpolation was used to estimate norms for times of the year between the first month in the fall and the last month in the spring. The norms were based on the distribution of Unified scale Rasch scores for each grade.
As noted above, a post-stratification procedure was used to approximate the national proportions on key characteristics. Post stratification weights from the regional, district socio-economic status, and school size strata were computed and applied to each student’s unified Rasch ability estimate. Norms were developed based on the weighted Rasch ability estimates and then transformed to both Star Math Enterprise and Unified scaled scores. Table 36 provides descriptive statistics for each grade with respect to the normative sample performance, in the Unified scaled score units. Table 37 provides descriptive statistics for each grade with respect to the normative sample performance, in the Enterprise scaled score units.
Table 36: Descriptive Statistics for Weighted Scaled Scores by Grade for the Norming Sample in the Unified Scale
Grade
Fall Unified Scaled Scores Spring Unified Scaled Scores
N MeanStandard Deviation Median N Mean
Standard Deviation Median
1 27,790 773 55 771 46,320 851 54 850
2 161,730 862 52 863 139,830 918 50 918
3 186,040 915 52 916 136,730 970 55 974
4 205,000 966 56 970 148,970 1,009 58 1,013
5 204,210 1,007 60 1,010 141,650 1,043 59 1,046
6 200,070 1,047 63 1,052 143,660 1,077 64 1,081
7 180,280 1,070 68 1,078 114,830 1,092 71 1,097
8 70,160 1,090 74 1,097 53,230 1,110 75 1,114
9 35,600 1,095 72 1,103 16,290 1,113 74 1,115
10 47,160 1,097 75 1,104 18,720 1,115 76 1,117
11 18,160 1,114 74 1,117 11,680 1,124 76 1,126
12 11,750 1,124 75 1,125 4,220 1,130 77 1,133
80Star Assessments™ for MathTechnical Manual

NormingGrowth Norms
Growth NormsStudent achievement typically is thought of in terms of status: a student’s performance at one point in time. However, this ignores important information about a student’s learning trajectory—how much students are growing over a period of time. When educators are able to consider growth information—the amount or rate of change over time—alongside current status, a richer picture of the student emerges, empowering educators to make better instructional decisions.
To facilitate deeper understanding of achievement, Renaissance Learning maintains growth norms for Star Assessments that provide insight both on growth to date and likely growth in the future. Growth norms are currently available for Star Math, Star Reading, and Star Early Literacy, and may be available for additional Star adaptive assessments in the coming years.
Table 37: Descriptive Statistics for Weighted Scaled Scores by Grade for the Norming Sample in the Enterprise Scale
Grade
Fall Enterprise Scaled Scores Spring Enterprise Scaled Scores
N MeanStandard Deviation Median N Mean
Standard Deviation Median
1 27,790 270 89 266 46,320 397 88 395
2 161,730 415 85 417 139,830 507 81 506
3 186,040 500 84 503 136,730 591 89 597
4 205,000 584 91 590 148,970 654 94 660
5 204,210 651 98 656 141,650 709 97 715
6 200,070 716 103 724 143,660 764 104 770
7 180,280 753 110 766 114,830 789 116 797
8 70,160 785 120 798 53,230 818 122 824
9 35,600 794 117 807 16,290 822 120 826
10 47,160 796 121 809 18,720 826 124 830
11 18,160 825 120 829 11,680 840 124 844
12 11,750 841 121 843 4,220 851 125 856
81Star Assessments™ for MathTechnical Manual

NormingGrowth Norms
The growth model used by Star Assessments is Student Growth Percentile (Betebenner, 2009). SGPs were developed by Dr. Damian Betebenner, originally in partnership with several state departments of education.8 It should be noted that the initial development of SGP involved annual state summative tests with reasonably constrained testing periods within each state. Because Star tests may be taken at multiple times throughout the year, a number of adaptations to the original model were made. For more information about Star Math SGPs, please refer to this overview: http://doc.renlearn.com/KMNet/R00571375CF86BBF.pdf
SGPs are norm-referenced estimates that compare a student’s growth to that of his or her academic peers nationwide. Academic peers are defined as those students in the same grade with a similar score history. SGPs are generated via a process that uses quantile regression to provide a measure of how much a student changed from one Star testing window to the next relative to other students with similar score histories.
SGPs range from 1–99 and are interpreted similarly to Percentile Ranks, with 50 indicating typical or expected growth. For instance, an SGP score of 37 means that a student grew as much or more than 37 percent of her academic peers, and less than about 63 percent of her academic peers.
The Star Math SGP package also produces a range of future growth estimates. Those are mostly hidden from users but are presented in goal-setting and related applications to help users understand what typical or expected growth looks like for a given student. They are particularly useful for setting future goals and understanding the likelihood of reaching future benchmarks, such as likely achievement of proficient on an upcoming state summative assessment.
At present, the Star Math SGP growth norms are based on a sample of 5.4 million student records across grades 1–12, with grade-specific samples ranging from about 60,000 to 700,000. Star Math SGP norms are updated annually.
8. Core SGP documentation and source code are publicly available at https://cran.r-project.org/web/packages/SGP/index.html.
82Star Assessments™ for MathTechnical Manual

Score Definitions
Types of Test ScoresIn a broad sense, Star Math software provides three different types of test scores that measure student performance in different ways:
Scaled scores. Star Math creates a virtually unlimited number of test forms as it dynamically interacts with the students taking the test. In order to make the results of all tests comparable, and in order to provide a basis for deriving the other types of test scores described below, it is necessary to convert the results of Star Math tests to scores on a common scale. Star Math software does this in two steps. First, maximum likelihood is used to estimate each student’s score on the Rasch ability scale, based on the difficulty of the items administered, and the pattern of right and wrong answers. Second, the Rasch ability scores are converted to scaled scores. Two different score scales are now available in Star assessments: the original scaled scores, which are referred to as “Enterprise” scaled scores; and a new score, expressed on the “Unified” score scale, which was introduced with the 2017–2018 school year.
Enterprise Scale Scores
For Star Math, the “Enterprise” scale scores are the same scores that have been reported continuously since Star Math Version 1 was introduced in 1998. The range of reported Star Math Enterprise scores extends from 0 to 1400.
Unified Scale Scores
Renaissance developed a single score scale that applies to all Star assessments: the Unified score scale. That development began with equating each test’s underlying Rasch ability scales to a common Rasch scale; the result was the “unified Rasch scale,” which is an extension of the Rasch scale used in Star Reading. The next step was to develop an integer scale based on the unified Rasch scale, with scale scores anchored to important points on the original Enterprise score scales of both tests. The end result was a reported score scale that extends from 200 to 1400.
Star Math and Star Reading Unified reported scale scores range from 600 to 1400. Star Early Literacy Unified reported scale scores range from 200 to 1100. One benefit of the Unified scale is an improvement in certain properties of the scale scores: scores on both tests are much less variable from grade to grade; measurement error is likewise less variable; and Unified score reliability is slightly higher than that of the Enterprise scores.
83Star Assessments™ for MathTechnical Manual

Score DefinitionsTypes of Test Scores
Criterion-referenced scores describe what a student knows or can do, relative to a specific content domain or to a standard. Such scores may be expressed either on a continuous score scale or as a classification. An example of a criterion-referenced score on a continuous scale is a percent-correct score, which expresses what proportion of test questions the student can answer correctly in the content domain. An example of a criterion-referenced classification is a proficiency category on a standards-based assessment: the student may be said to be “proficient” or not, depending on whether his score equals, exceeds, or falls below a specific criterion (the “standard”) used to define “proficiency” on the standards-based test. The domain scores and mastery classification charts in the Diagnostic Report are criterion-referenced.
Norm-referenced scores compare a student’s test results to the results of other students who have taken the same test. In this case, scores provide a relative measure of student achievement compared to the performance of a group of students at a given time. Percentile Ranks and Grade Equivalents are the two primary norm-referenced scores provided by Star Math software. Both of these scores are based on a comparison of a student’s test results to the data collected during the development of the 2017 Star Math norms.
Grade Equivalent (GE)A Grade Equivalent (GE) indicates the normal grade placement of students for whom a particular score is typical. If a student receives a GE of 10.0, this means that the student scored as well on Star Math as did the typical student at the beginning of grade 10. It does not necessarily mean that the student has mastered math objectives at a tenth-grade level, only that he or she obtained a Scaled Score as high as the average beginning tenth-grade student in the norms group.
GE scores are often misinterpreted as though they convey information about what a student knows or can do—that is, as if they were criterion-referenced scores. To the contrary, GE scores are norm-referenced.
GEs in Star Math range from 0.0 to 12.9+. The scale divides the academic year into 10 monthly increments, and is expressed as a decimal with the unit denoting the grade level and the individual “months” in tenths. Table 38 indicates how the GE scale corresponds to the various calendar months. For example, if a student obtained a GE of 4.6 on a Star Math assessment, this would suggest that the student was performing similarly to the average student in the fourth grade at the sixth month (March) of the academic year. Because Star Math norms are based on fall and spring score data only,
84Star Assessments™ for MathTechnical Manual

Score DefinitionsTypes of Test Scores
monthly GE scores are derived through interpolation by fitting a curve to the grade-by-grade medians. Table 40, “Scaled Score to Grade Equivalent Conversions” on page 92 in the Conversion Tables chapter, contains the Star Math Scaled Score to GE conversions for both Unified and Enterprise scaled scores.
The GE scale is not an equal-interval scale. For example, an increase of 50 Scaled Score points might represent only three or four months of GE change at the lower grades, but this same increase in Scaled Scores may signify over a year of GE change in the high school grades. This occurs because student growth in math proficiency (and other academic areas) is not linear; proficiency develops much more rapidly in the lower grades than in the middle to upper grades. Consideration of this phenomenon should be made when averaging GE scores, especially those spanning two or more grades.
Grade Equivalent Cap
For customers who are using either Star Math or Star Math Enterprise on the Renaissance hosted platform, GE scores will be capped when they exceed three grade levels above the student’s actual grade placement. When a student’s Scaled Score produces a GE that is greater than the start of three grades above the student’s current grade, Star Math will report that student’s GE is greater than the cap grade but will not report the specific GE score. Because this cannot happen to students in tenth grade or above, the potential for a capped GE will only exist for K–9 students. When applicable, the GE cap will now appear on all Star Math reports—even those showing test scores from tests taken prior to this update.
For example, a fourth grade student cannot receive a GE score above 7.0 at any time of the year. If their GE score is above a 7.0, the reports will show a capped GE score of “> 7”.
Table 38: Incremental Grade Placement Values per Month
MonthDecimal
Increment MonthDecimal
Increment
July 0.0 or 0.99a
a. Depends on the school year entered.
January 0.4
August 0.0 or 0.99a February 0.5
September 0.0 March 0.6
October 0.1 April 0.7
November 0.2 May 0.8
December 0.3 June 0.9
85Star Assessments™ for MathTechnical Manual

Score DefinitionsTypes of Test Scores
Comparing Star Math GEs with Those from Conventional Tests Because Star Math adapts to the proficiency level of the student being tested, the GE scores that Star Math provides are more consistently accurate across the achievement spectrum than those provided by conventional paper-and-pencil test instruments. In addition, Grade Equivalent scores obtained using conventional test instruments are less accurate when a student’s grade placement and GE score differ markedly. It is not uncommon for a fourth-grade student to obtain a GE score of 8.9 when using a conventional test instrument. However, this does not necessarily mean that the student is performing at a level typical of an end-of-year eighth-grader. More likely, it means that the student answered all, or nearly all, of the items correctly on the conventional test and thus performed beyond the range of the fourth-grade test.
On the other hand, Star Math GE scores are more consistently accurate, even as a student’s achievement level deviates from the level of grade placement. A student may be tested on any level of material up to three grade levels above grade placement, depending upon his or her actual performance on the test. Throughout a Star Math test, students are tested on items of an appropriate level of difficulty, based on their individual level of achievement.
Percentile Rank (PR)Percentile Rank (PR) scores indicate the percentage of students in the same grade and at the same point of time in the school year who obtained scores lower than the score of a particular student. In other words, Percentile Ranks show how an individual student’s performance compares to that of his or her same-grade peers on the national level. For example, a Percentile Rank of 85 means that the student is performing at a level that exceeds 85% of other students in that grade at the same time of the year. Percentile Ranks simply indicate how a student performed compared to others who took Star Math tests as a part of the national norming study. PRs range from 1–99.
The PR scale is not an equal-interval scale. For example, a grade placement of 7.7 and a Star Math Enterprise Scaled Score of 1224 correspond to a PR of 80,
Table 39: Grade Equivalents with GE Cap
Grade Placement Grade Equivalent Grade Equivalent Reported As
4.6 6.9 6.9
4.6 7.0 7.0
4.6 7.1 > 7
86Star Assessments™ for MathTechnical Manual

Score DefinitionsTypes of Test Scores
and, using the same grade placement, a Star Math Scaled Score of 1320 corresponds to a PR of 90. Thus, a difference of 96 Scaled Score points represents a 10-point difference in PR.
However, for another student at the same grade placement, a Scaled Score of 887 corresponds to a PR of 50, and a Star Math Scaled Score of 958 corresponds to a PR of 60. While there is now only a 71-point difference in Scaled Scores, there is still a 10-point difference in PR. For this reason, PR scores should not be averaged or otherwise algebraically manipulated. NCE scores, described below, are much more appropriate for these types of calculations.
Table 41 on page 95 and Table 42 on page 99 in the “Conversion Tables” chapter contain abridged versions of both the Unified and the Enterprise Scaled Score to Percentile Rank conversion tables used by Star Math. The unabridged table includes data for all of the monthly grade placement values from 1.0–12.9. Because the Fall norming of Star Math occurred in the first month of the school year, the first-month values for each grade are empirically based; these are the values in Tables 41 and 42. The remaining monthly values were estimated by interpolating between the empirical points for the Fall and Spring norms.
Normal Curve Equivalent (NCE)Normal Curve Equivalents (NCEs) are scores that have been scaled in such a way that they have a normal distribution, with a mean of 50 and a standard deviation of 21.06 in the normative sample for a specific grade for a given test. Because NCEs range from 1 to 99, they appear similar to Percentile Ranks, but they have the advantage of being based on an equal interval scale. That is, the difference between two successive scores on the scale has the same meaning throughout the scale. Because of this feature, NCEs are useful for purposes of statistically manipulating norm-referenced test results, such as interpolating test scores, calculating averages, and computing correlation coefficients between different tests. For example, in Star Math score reports, average Percentile Ranks are obtained by first converting the PR values to NCE values, averaging the NCE values, and then converting the average NCE back to a PR.
Table 43 on page 102 in the Conversion Tables chapter lists the NCEs corresponding to integer PR values and facilitates the conversion of PRs to NCEs. Table 44 on page 103 provides the conversions from NCE to PR. The NCE values are given as a range of scores that convert to the corresponding PR value.
87Star Assessments™ for MathTechnical Manual

Score DefinitionsTypes of Test Scores
Student Growth Percentile (SGP)Student Growth Percentiles (SGPs) are a norm-referenced quantification of individual student growth derived using quantile regression techniques. An SGP compares a student’s growth to that of his or her academic peers nationwide with a similar achievement history on Star assessments. Academic peers are students who
are in the same grade,
had the same scores on the current test and (up to) two prior tests from different testing windows, and
took the most recent test and the first prior test on the same dates.
SGPs provide a measure of how a student changed from one Star testing window9 to the next relative to other students with similar starting Star Math scores. SGPs range from 1–99 and interpretation is similar to that of Percentile Rank scores; lower numbers indicate lower relative growth and higher numbers show higher relative growth. For example, an SGP of 70 means that the student’s growth from one test window to another exceeds the growth of 70% of students nationwide in the same grade with a similar Star Math score history. All students, no matter their starting Star score, have an equal chance to demonstrate growth at any of the 99 percentiles.
SGPs are often used to indicate whether a student’s growth is more or less than can be expected. For example, without an SGP, a teacher would not know if a Scaled Score increase of 100 represents good, not-so-good, or average growth. This is because students of differing achievement levels in different grades grow at different rates relative to the Star Math scale. For example, a high-achieving second-grader grows at a different rate than a low-achieving second-grader.
Similarly, a high-achieving second-grader grows at a different rate than a high-achieving eighth-grader.
SGPs can be aggregated to describe typical growth for groups of students—for example, a class, grade, or school as a whole—by calculating the group’s median, or middle, growth percentile. No matter how SGPs are aggregated, whether at the class, grade, or school level, the statistic and its interpretation remain the same. For example, if the students in one class have a median SGP of 62, that particular group of students, on average, achieved higher growth than their academic peers.
9. We collect data for our growth norms during three different time periods: fall, winter, and spring. More information about these time periods is provided on page 89.
88Star Assessments™ for MathTechnical Manual

Score DefinitionsTypes of Test Scores
SGP is calculated for students who have taken at least two tests (a current test and a prior test) within at least two different testing windows (Fall, Winter, or Spring). The current test is the most recent test the student has taken in the most recent window that the student has tested in within the last 18 months. The prior test(s) are from the most recent SGP test window before the one that the current test falls in.
If a student has taken more than one test in a single test window, the SGP calculation is based off the following tests:
The current test is always the last test taken in a testing window.
The test used as the prior test depends on what testing window it falls in:
Fall window: The first test taken in the Fall window is used.
Winter window: The test taken closest to January 15 in the Winter window is used.
Spring window: The last test taken in the Spring window is used.
Most Recent Test Is
In...Type of SGP Calculated
Test Windows in Prior School Years
Test Windows in Current School Year*
Fall8/1–11/30
Winter12/1–3/31
Spring4/1–7/31
Fall8/1–11/30
Winter12/1–3/31
Spring4/1–7/31
Fall8/1–11/30
Winter12/1–3/31
Spring4/1–7/31
Fall8/1–11/30
Winter12/1–3/31
Spring4/1–7/31
the
Curr
ent S
choo
l Yea
r Fall–Spring
Fall–Winter
Winter–Spring
Spring–Fall
Spring–Spring
Fall–Fall
a P
rior S
choo
l Yea
r Fall–Spring
Fall–Winter
Winter–Spring
Spring–Fall
Spring–Spring
Fall–Fall
most recent test
skipped Test WindowIf more than one test was taken in a prior test
window, which is used to calculate SGP?Fall Window First test taken
Winter Window
Spring Window Last test taken
89Star Assessments™ for MathTechnical Manual

Score DefinitionsGrade Placement
Grade PlacementStar Math software uses students’ grade placement values when determining norm-referenced scores. The values of PR (Percentile Rank) and NCE (Normal Curve Equivalent) are based not only on what Scaled Score the student achieved, but also on the grade placement of the student at the time of the test. For example, a second-grader in the seventh month with a Scaled Score of 534 would have a PR of 92, while a third-grader in the seventh month with the same Scaled Score would have a PR of 74.
Thus, it is crucial that student records indicate the proper grade and month within grade when students take a Star Math test, and that any testing in July or August reflects the proper understanding of how Star software deals with those months in determining grade placement.
Indicating the Appropriate Grade PlacementThe numeric representation of a student’s grade placement is based on the specific month in which he or she takes a test. Although teachers indicate a student’s grade level or Math Instructional Level (MIL) using whole numbers, the Star Math software automatically adds fractional increments to that grade based on the month of the test. To determine the appropriate increment, Star Math considers the standard school year to run from September–June and assigns increment values of 0.0–0.9 to these months. The increment values for July and August depend on the school year setting:
If teachers will use the July and August test scores to evaluate the student’s math performance at the beginning of the year, in the Renaissance program, make sure the start date for that school year is before your testing in July and August. Grades are automatically increased by one level in each successive school year, so promoting students is not necessary. In this case, the increment value for July and August is 0.00 because these months are at the beginning of the school year.
If teachers will use the test scores to evaluate the student’s math performance at the end of the school year, make sure the end date for that school year falls after your testing in July and August. In this case, the increment value for July and August is 0.99 because these months are at the end of the school year that has passed.
Table 38, “Incremental Grade Placement Values per Month,” on page 85 summarizes the increment values assigned to each month.
90Star Assessments™ for MathTechnical Manual

Score DefinitionsGrade Placement
If your school follows the standard school calendar used in Star Math and you will not be testing in the summer, assigning the appropriate grade placements for your students is automatic.
However, if you’re going to test students in July or August, whether it is for a summer program or because your normal calendar extends into these months, grade placements become an extremely important issue.
To ensure the accurate determination of norm-referenced scores when testing in the summer, you must determine whether to include the summer months in the past school year or in the next school year. Student grade levels are automatically increased in the new school year. In most cases, you can use the above guidelines.
Instructions for specifying school years and grade assignments can be found at https://help.renaissance.com/RP and https://help2.renaissance.com/setup.
Compensating for Incorrect Grade PlacementsTeachers cannot make retroactive corrections to a student’s grade placement by editing the grade assignments in a student’s record or by adjusting the increments for the summer months after students have tested. In other words, the Star Math software cannot go back in time and correct scores resulting from erroneous grade placement information. Thus, it is extremely important for the test administrator to make sure that the proper grade placement procedures are followed.
91Star Assessments™ for MathTechnical Manual

Conversion Tables
Table 40: Scaled Score to Grade Equivalent Conversions
Grade Equivalent
Unified Scaled Score Enterprise Scaled Score
Low High Low High
1 600 777 0 278
1.1 778 785 279 291
1.2 786 794 292 304
1.3 795 802 305 317
1.4 803 810 318 330
1.5 811 816 331 342
1.6 817 824 343 355
1.7 825 832 356 366
1.8 833 839 367 379
1.9 840 847 380 390
2 848 853 391 402
2.1 854 861 403 413
2.2 862 867 414 424
2.3 868 875 425 436
2.4 876 881 437 447
2.5 882 888 448 457
2.6 889 894 458 468
2.7 895 900 469 478
2.8 901 906 479 488
2.9 907 914 489 499
3 915 920 500 509
3.1 921 925 510 519
3.2 926 931 520 527
3.3 932 936 528 537
3.4 937 942 538 546
3.5 943 948 547 555
3.6 949 953 556 564
3.7 954 959 565 572
3.8 960 964 573 581
3.9 965 968 582 589
92Star Assessments™ for MathTechnical Manual

Conversion Tables
4 969 973 590 597
4.1 974 978 598 605
4.2 979 984 606 613
4.3 985 989 614 621
4.4 990 992 622 628
4.5 993 998 629 636
4.6 999 1001 637 642
4.7 1002 1006 643 649
4.8 1007 1009 650 655
4.9 1010 1015 656 663
5 1016 1018 664 670
5.1 1019 1021 671 675
5.2 1022 1026 676 681
5.3 1027 1029 682 688
5.4 1030 1032 689 693
5.5 1033 1037 694 699
5.6 1038 1040 700 704
5.7 1041 1043 705 709
5.8 1044 1046 710 715
5.9 1047 1049 716 720
6 1050 1053 721 725
6.1 1054 1056 726 730
6.2 1057 1057 731 733
6.3 1058 1060 734 738
6.4 1061 1063 739 743
6.5 1064 1065 744 746
6.6 1066 1068 747 751
6.7 1069 1071 752 755
6.8 1072 1073 756 759
6.9 1074 1076 760 763
7 1077 1077 764 766
7.1 1078 1079 767 769
Table 40: Scaled Score to Grade Equivalent Conversions (Continued)
Grade Equivalent
Unified Scaled Score Enterprise Scaled Score
Low High Low High
93Star Assessments™ for MathTechnical Manual

Conversion Tables
7.2 1080 1082 770 772
7.3 1083 1084 773 776
7.4 1085 1085 777 779
7.5 1086 1087 780 781
7.6 1088 1088 782 784
7.7 1089 1090 785 787
7.8 1091 1091 788 789
7.9 1092 1093 790 792
8 1094 1095 793 794
8.1 1096 1096 795 797
8.2 1097 1098 798 798
8.3 1099 1099 799 800
8.4 1100 1099 801 802
8.5 1100 1101 803 805
8.6 1102 1102 806 807
8.7 1103 1104 808 808
8.8 1105 1104 809 810
8.9 1105 1105 811 811
9 1106 1106 812 813
9.1 1107 1107 814 815
9.3 1108 1109 816 816
9.4 1110 1110 817 818
9.5 1111 1111 819 820
9.6 1112 1112 821 821
9.8 1113 1113 822 823
9.9 1114 1114 824 824
10.1 1115 1115 825 826
10.3 1116 1116 827 828
10.5 1117 1117 829 829
10.6 1118 1118 830 831
10.8 1119 1119 832 833
11 1120 1120 834 834
Table 40: Scaled Score to Grade Equivalent Conversions (Continued)
Grade Equivalent
Unified Scaled Score Enterprise Scaled Score
Low High Low High
94Star Assessments™ for MathTechnical Manual

Conversion Tables
11.2 1121 1121 835 836
11.4 1122 1122 837 837
11.6 1123 1123 838 839
11.7 1124 1124 840 841
11.9 1125 1125 842 842
12 1126 1126 843 844
12.2 1127 1127 845 846
12.3 1128 1128 847 847
12.4 1129 1129 848 849
12.5 1130 1130 850 850
12.6 1131 1131 851 852
12.7 1132 1132 853 854
12.8 1133 1133 855 855
12.9 1134 1134 856 857
Table 41: Scaled Score to Percentile Ranks Conversion by Grade on the Unified Scale
PR
Grade (First Month)
1 2 3 4 5 6 7 8 9 10 11 12
1 600 600 600 600 600 600 600 600 600 600 600 600
2 672 749 797 828 859 899 915 924 933 928 950 963
3 679 760 809 844 877 917 932 941 947 944 967 982
4 682 767 817 855 890 929 944 952 958 955 983 992
5 687 773 824 864 901 939 952 961 969 966 994 1003
6 689 777 830 872 909 946 959 970 978 976 1003 1011
7 693 781 836 878 916 951 966 977 986 983 1011 1019
8 695 785 840 884 921 957 973 984 993 989 1017 1026
9 697 788 845 889 927 962 979 989 998 995 1024 1031
10 700 792 849 894 932 966 984 995 1002 1000 1029 1036
11 702 796 851 898 936 970 988 1000 1007 1005 1032 1039
12 707 800 854 902 939 975 992 1004 1012 1010 1036 1042
Table 40: Scaled Score to Grade Equivalent Conversions (Continued)
Grade Equivalent
Unified Scaled Score Enterprise Scaled Score
Low High Low High
95Star Assessments™ for MathTechnical Manual

Conversion Tables
13 708 803 857 906 943 978 996 1008 1017 1015 1039 1045
14 712 805 860 909 946 982 999 1013 1021 1019 1042 1048
15 714 808 862 912 948 985 1002 1017 1025 1023 1045 1051
16 716 810 864 914 951 988 1005 1020 1028 1027 1048 1054
17 719 812 867 917 954 991 1008 1024 1032 1030 1050 1058
18 720 815 869 919 957 993 1011 1027 1035 1034 1053 1061
19 722 817 870 922 959 996 1014 1030 1038 1037 1056 1064
20 723 819 873 924 961 999 1017 1033 1040 1040 1060 1067
21 726 821 875 926 964 1001 1020 1036 1043 1042 1062 1070
22 727 823 876 928 966 1003 1023 1038 1046 1045 1064 1073
23 729 825 878 930 968 1005 1026 1041 1048 1048 1067 1076
24 731 827 880 932 970 1007 1028 1043 1050 1050 1069 1078
25 733 829 882 933 972 1009 1031 1046 1053 1053 1071 1081
26 734 831 884 935 974 1011 1033 1048 1056 1056 1073 1083
27 735 832 885 936 976 1013 1035 1050 1058 1058 1075 1085
28 737 834 887 938 978 1015 1037 1053 1061 1061 1077 1087
29 739 836 888 939 980 1017 1039 1055 1063 1064 1079 1089
30 740 837 890 941 982 1019 1041 1057 1066 1067 1081 1091
31 741 839 891 943 983 1021 1043 1059 1069 1069 1083 1094
32 743 840 893 944 985 1023 1045 1062 1071 1072 1086 1096
33 745 842 894 946 986 1025 1046 1064 1073 1074 1088 1098
34 746 843 896 947 988 1027 1048 1066 1075 1076 1090 1100
35 747 844 897 949 989 1029 1050 1068 1077 1079 1092 1102
36 749 846 898 950 991 1031 1052 1070 1079 1081 1094 1104
37 750 847 900 952 992 1032 1054 1072 1081 1083 1096 1105
38 752 849 901 953 994 1034 1056 1074 1083 1085 1098 1107
39 753 850 902 955 995 1036 1058 1077 1085 1086 1099 1109
40 755 851 904 956 996 1037 1059 1079 1087 1088 1101 1110
41 757 853 905 958 998 1039 1061 1081 1089 1090 1103 1112
42 758 854 907 959 999 1040 1063 1083 1091 1092 1104 1114
43 760 855 908 960 1000 1042 1065 1085 1093 1094 1106 1115
44 762 856 909 962 1002 1043 1067 1087 1094 1095 1107 1117
Table 41: Scaled Score to Percentile Ranks Conversion by Grade on the Unified Scale (Continued)
PR
Grade (First Month)
1 2 3 4 5 6 7 8 9 10 11 12
96Star Assessments™ for MathTechnical Manual

Conversion Tables
45 763 857 911 963 1003 1045 1068 1089 1095 1097 1109 1118
46 764 859 912 964 1005 1046 1070 1091 1097 1098 1111 1120
47 766 860 913 966 1006 1048 1072 1093 1099 1100 1112 1121
48 767 861 914 967 1007 1049 1074 1094 1100 1101 1114 1123
49 769 862 915 968 1009 1051 1076 1096 1101 1103 1115 1124
50 770 863 916 970 1010 1052 1078 1097 1103 1104 1117 1126
51 772 864 918 971 1012 1054 1080 1098 1104 1106 1119 1128
52 774 866 919 972 1013 1056 1081 1100 1105 1108 1121 1129
53 775 867 920 974 1014 1057 1083 1101 1107 1109 1122 1131
54 777 868 921 975 1016 1059 1085 1103 1108 1111 1123 1133
55 779 869 923 976 1017 1060 1086 1104 1109 1112 1125 1134
56 780 870 924 978 1018 1062 1088 1106 1111 1114 1127 1136
57 782 871 925 979 1020 1063 1090 1108 1112 1116 1128 1137
58 784 872 926 981 1021 1065 1091 1109 1113 1117 1130 1138
59 785 873 928 982 1022 1067 1093 1111 1115 1119 1131 1140
60 787 875 929 983 1024 1068 1094 1113 1117 1121 1133 1142
61 788 876 930 985 1025 1070 1096 1115 1119 1122 1135 1144
62 790 878 931 986 1027 1072 1097 1117 1121 1123 1136 1145
63 791 879 933 987 1029 1074 1098 1119 1122 1125 1138 1147
64 793 880 934 988 1030 1075 1100 1120 1123 1127 1140 1148
65 794 881 935 990 1032 1077 1101 1122 1125 1128 1142 1151
66 796 883 936 991 1033 1079 1102 1124 1127 1130 1143 1152
67 798 884 937 992 1035 1080 1104 1125 1129 1131 1145 1154
68 799 886 938 993 1036 1082 1105 1127 1130 1133 1147 1156
69 801 887 940 995 1038 1084 1107 1129 1132 1135 1148 1158
70 802 888 941 996 1039 1085 1109 1131 1134 1137 1151 1160
71 804 890 943 998 1041 1087 1110 1132 1136 1139 1152 1161
72 806 891 944 999 1043 1088 1112 1134 1138 1141 1155 1163
73 807 893 946 1001 1044 1090 1114 1136 1139 1143 1156 1165
74 809 894 947 1002 1046 1091 1116 1138 1141 1145 1158 1167
75 811 896 949 1004 1048 1093 1117 1140 1143 1146 1160 1169
76 813 897 950 1005 1049 1094 1119 1142 1145 1148 1162 1171
Table 41: Scaled Score to Percentile Ranks Conversion by Grade on the Unified Scale (Continued)
PR
Grade (First Month)
1 2 3 4 5 6 7 8 9 10 11 12
97Star Assessments™ for MathTechnical Manual

Conversion Tables
77 814 899 952 1007 1051 1095 1121 1144 1146 1150 1165 1174
78 816 901 953 1009 1053 1097 1123 1146 1148 1152 1167 1177
79 818 903 955 1010 1055 1098 1124 1147 1150 1154 1170 1180
80 820 904 957 1012 1057 1100 1126 1149 1152 1156 1172 1183
81 823 906 959 1014 1059 1102 1128 1151 1154 1158 1175 1184
82 825 908 961 1016 1061 1104 1130 1153 1156 1160 1177 1187
83 827 910 963 1018 1063 1106 1132 1156 1158 1162 1179 1190
84 830 912 965 1020 1065 1108 1134 1158 1160 1165 1182 1192
85 833 914 967 1022 1067 1110 1137 1161 1163 1167 1185 1195
86 836 916 969 1024 1069 1112 1139 1164 1166 1170 1188 1199
87 839 919 972 1026 1072 1114 1142 1168 1170 1173 1192 1203
88 843 921 974 1029 1075 1116 1144 1172 1174 1177 1196 1206
89 847 923 976 1031 1077 1118 1146 1174 1179 1182 1202 1211
90 849 926 979 1034 1081 1121 1148 1175 1180 1183 1207 1216
91 853 930 983 1037 1085 1123 1150 1177 1182 1186 1209 1221
92 856 934 987 1040 1088 1125 1152 1179 1184 1189 1213 1225
93 859 938 991 1043 1092 1128 1155 1182 1187 1191 1217 1230
94 865 942 995 1047 1095 1132 1157 1185 1189 1194 1222 1236
95 870 948 998 1052 1099 1136 1160 1189 1193 1198 1227 1242
96 877 955 1003 1057 1104 1140 1164 1196 1197 1203 1235 1248
97 885 964 1008 1063 1110 1145 1169 1206 1202 1208 1242 1257
98 895 974 1016 1072 1118 1151 1176 1222 1209 1217 1253 1269
99 912 989 1033 1089 1130 1164 1195 1245 1225 1233 1267 1291
Table 41: Scaled Score to Percentile Ranks Conversion by Grade on the Unified Scale (Continued)
PR
Grade (First Month)
1 2 3 4 5 6 7 8 9 10 11 12
98Star Assessments™ for MathTechnical Manual

Conversion Tables
Table 42: Scaled Score to Percentile Ranks Conversion by Grade on the Enterprise Scale
PR
Grade (First Month)
1 2 3 4 5 6 7 8 9 10 11 12
1 0 0 0 0 0 0 0 0 0 0 0 0
2 105 230 308 360 409 474 500 512 531 521 557 565
3 117 248 326 385 438 504 529 541 554 546 583 598
4 121 260 341 403 460 523 547 560 572 564 609 619
5 130 269 352 417 478 539 560 575 590 583 629 635
6 133 276 362 430 491 551 573 590 604 599 642 651
7 139 282 372 440 502 560 585 603 617 611 655 664
8 143 289 378 450 510 569 595 612 627 621 666 676
9 146 294 386 458 520 577 604 621 637 630 676 687
10 151 300 393 466 528 583 612 630 643 638 684 695
11 154 307 396 474 534 591 619 638 651 647 690 702
12 162 312 401 479 541 598 625 647 660 655 697 707
13 165 317 406 486 546 604 632 653 666 661 702 712
14 169 321 411 491 551 609 637 660 673 669 707 716
15 173 326 414 495 556 614 642 666 679 676 710 721
16 177 330 417 499 559 619 647 671 686 682 716 728
17 182 333 422 504 564 624 653 677 690 687 720 733
18 183 338 425 507 569 629 658 682 695 692 725 738
19 186 341 427 512 572 632 661 687 700 699 729 741
20 188 344 432 515 575 637 668 692 705 703 736 747
21 193 347 435 518 580 640 671 697 708 707 739 752
22 195 351 437 521 583 643 676 700 713 712 742 757
23 198 354 440 525 586 647 681 705 716 716 747 760
24 201 357 443 528 590 650 684 708 721 720 751 765
25 204 360 447 531 593 655 689 713 725 725 754 770
26 206 364 450 533 596 656 692 716 729 729 757 773
27 208 365 451 536 599 660 695 721 734 733 760 777
28 211 369 455 538 603 663 699 725 738 738 764 780
29 214 372 456 541 606 666 702 729 742 742 767 783
30 216 373 460 542 609 669 705 733 746 747 770 786
31 217 377 461 546 611 673 708 736 751 751 773 790
32 221 378 465 549 614 677 712 739 754 756 778 793
33 222 382 466 551 616 679 715 742 757 759 782 796
99Star Assessments™ for MathTechnical Manual

Conversion Tables
34 225 383 469 552 619 682 716 746 760 762 785 799
35 227 385 471 556 621 686 720 749 765 765 790 803
36 230 388 473 557 624 689 723 754 767 770 791 806
37 232 390 476 560 625 690 726 757 770 773 795 809
38 235 393 478 562 629 694 729 760 773 777 798 812
39 237 395 479 565 630 697 733 764 777 778 799 814
40 240 396 482 567 634 699 736 767 780 782 803 817
41 243 399 484 570 635 702 738 772 783 785 806 821
42 245 401 487 572 637 703 741 775 786 788 809 824
43 248 403 489 573 640 707 744 778 790 791 812 825
44 250 404 491 577 642 708 747 780 791 793 814 829
45 253 406 494 578 643 712 751 783 795 796 817 832
46 255 409 495 580 647 713 752 786 796 798 819 834
47 258 411 497 583 648 716 756 790 799 801 821 837
48 260 412 499 585 651 718 759 793 801 803 824 838
49 263 414 500 586 653 721 762 795 803 804 825 840
50 264 416 502 590 655 723 765 796 806 808 829 843
51 268 417 505 591 658 726 769 799 808 811 830 847
52 271 421 507 593 660 729 772 801 809 814 834 848
53 273 422 508 596 663 731 773 804 812 816 837 851
54 276 424 512 598 664 734 777 806 814 819 838 853
55 279 425 513 601 666 736 780 809 816 821 842 856
56 281 427 515 603 668 739 782 811 819 824 843 860
57 282 429 516 604 671 741 785 814 821 825 847 861
58 286 430 518 608 673 744 786 817 822 829 848 864
59 289 434 521 609 676 747 790 821 825 832 851 866
60 292 435 523 611 677 749 791 824 829 834 853 869
61 294 437 525 614 681 752 795 827 832 837 856 873
62 297 440 526 616 682 756 796 829 835 838 860 874
63 300 442 529 617 686 759 798 832 837 842 863 877
64 302 443 531 621 687 760 801 835 840 843 866 881
65 305 445 533 622 690 764 803 837 842 847 868 884
66 307 448 534 624 692 767 804 840 845 850 871 887
67 308 450 536 625 695 769 808 843 848 851 874 889
Table 42: Scaled Score to Percentile Ranks Conversion by Grade on the Enterprise Scale (Continued)
PR
Grade (First Month)
1 2 3 4 5 6 7 8 9 10 11 12
100Star Assessments™ for MathTechnical Manual

Conversion Tables
68 312 453 538 627 699 772 809 845 850 855 876 892
69 313 455 541 630 700 775 812 848 853 858 879 895
70 317 456 542 632 703 777 816 851 856 860 882 899
71 320 460 546 635 705 780 819 855 860 864 886 902
72 323 461 547 637 708 782 821 858 863 868 889 905
73 325 465 551 640 712 785 824 860 866 871 892 908
74 328 466 552 642 713 786 827 863 868 873 895 910
75 331 469 556 645 716 790 830 866 871 876 899 913
76 333 473 557 648 720 791 832 869 874 879 902 916
77 336 474 560 650 721 793 835 873 876 882 905 921
78 339 478 562 653 725 796 838 876 879 886 910 926
79 343 481 565 655 728 798 840 877 882 889 913 931
80 346 484 569 658 731 801 843 881 886 892 918 934
81 349 486 572 661 734 804 847 884 887 895 921 938
82 352 489 575 664 738 808 850 887 890 899 925 942
83 357 492 578 668 741 811 853 892 894 902 928 946
84 362 495 582 671 744 814 856 895 899 907 933 951
85 367 499 585 674 747 817 861 900 902 912 938 956
86 372 502 588 677 752 821 864 905 908 915 942 962
87 377 507 591 681 756 824 869 912 913 921 949 968
88 383 510 596 686 760 827 873 918 921 926 957 975
89 390 515 599 689 765 832 876 921 929 934 967 981
90 393 518 604 694 770 835 879 923 931 938 973 990
91 399 525 611 699 777 838 882 926 934 941 978 998
92 404 531 617 703 782 843 886 929 938 946 983 1004
93 411 538 624 710 788 847 890 934 942 949 990 1012
94 419 546 629 715 793 853 894 939 946 956 998 1022
95 427 556 635 723 799 860 899 946 952 960 1007 1032
96 440 567 643 731 808 866 905 957 959 968 1019 1042
97 453 580 651 741 817 874 913 973 967 977 1032 1056
98 468 598 664 757 830 886 925 999 978 991 1050 1076
99 494 622 690 783 851 905 956 1037 1004 1019 1073 1112
Table 42: Scaled Score to Percentile Ranks Conversion by Grade on the Enterprise Scale (Continued)
PR
Grade (First Month)
1 2 3 4 5 6 7 8 9 10 11 12
101Star Assessments™ for MathTechnical Manual

Conversion Tables
Table 43: Percentile Rank to Normal Curve Equivalent Conversions
PR NCE PR NCE PR NCE PR NCE
1 1.0 26 36.5 51 50.5 76 64.9
2 6.7 27 37.1 52 51.1 77 65.6
3 10.4 28 37.7 53 51.6 78 66.3
4 13.1 29 38.3 54 52.1 79 67.0
5 15.4 30 39.0 55 52.6 80 67.7
6 17.3 31 39.6 56 53.2 81 68.5
7 18.9 32 40.1 57 53.7 82 69.3
8 20.4 33 40.7 58 54.2 83 70.1
9 21.8 34 41.3 59 54.8 84 70.9
10 23.0 35 41.9 60 55.3 85 71.8
11 24.2 36 42.5 61 55.9 86 72.8
12 25.3 37 43.0 62 56.4 87 73.7
13 26.3 38 43.6 63 57.0 88 74.7
14 27.2 39 44.1 64 57.5 89 75.8
15 28.2 40 44.7 65 58.1 90 77.0
16 29.1 41 45.2 66 58.7 91 78.2
17 29.9 42 45.8 67 59.3 92 79.6
18 30.7 43 46.3 68 59.9 93 81.1
19 31.5 44 46.8 69 60.4 94 82.7
20 32.3 45 47.4 70 61.0 95 84.6
21 33.0 46 47.9 71 61.7 96 86.9
22 33.7 47 48.4 72 62.3 97 89.6
23 34.4 48 48.9 73 62.9 98 93.3
24 35.1 49 49.5 74 63.5 99 99.0
25 35.8 50 50.0 75 64.2
102Star Assessments™ for MathTechnical Manual

Conversion Tables
Table 44: Normal Curve Equivalent to Percentile Rank Conversions
NCE Range Low–High PR
NCE Range Low–High PR
NCE Range Low–High PR
NCE Range Low–High PR
1.0–4.0 1 36.1–36.7 26 50.3–50.7 51 64.6–65.1 76
4.1–8.5 2 36.8–37.3 27 50.8–51.2 52 65.2–65.8 77
8.6–11.7 3 37.4–38.0 28 51.3–51.8 53 65.9–66.5 78
11.8–14.1 4 38.1–38.6 29 51.9–52.3 54 66.6–67.3 79
14.2–16.2 5 38.7–39.2 30 52.4–52.8 55 67.4–68.0 80
16.3–18.0 6 39.3–39.8 31 52.9–53.4 56 68.1–68.6 81
18.1–19.6 7 39.9–40.4 32 53.5–53.9 57 68.7–69.6 82
19.7–21.0 8 40.5–40.9 33 54.0–54.4 58 69.7–70.4 83
21.1–22.3 9 41.0–41.5 34 54.5–55.0 59 70.5–71.3 84
22.4–23.5 10 41.6–42.1 35 55.1–55.5 60 71.4–72.2 85
23.6–24.6 11 42.2–42.7 36 55.6–56.1 61 72.3–73.1 86
24.7–25.7 12 42.8–43.2 37 56.2–56.6 62 73.2–74.1 87
25.8–26.7 13 43.3–43.8 38 56.7–57.2 63 74.2–75.2 88
26.8–27.6 14 43.9–44.3 39 57.3–57.8 64 75.3–76.3 89
27.7–28.5 15 44.4–44.9 40 57.9–58.3 65 76.4–77.5 90
28.6–29.4 16 45.0–45.4 41 58.4–58.9 66 77.6–78.8 91
29.5–30.2 17 45.5–45.9 42 59.0–59.5 67 78.9–80.2 92
30.3–31.0 18 46.0–46.5 43 59.6–60.1 68 80.3–81.7 93
31.1–31.8 19 46.6–47.0 44 60.2–60.7 69 81.8–83.5 94
31.9–32.6 20 47.1–47.5 45 60.8–61.3 70 83.6–85.5 95
32.7–33.3 21 47.6–48.1 46 61.4–61.9 71 85.6–88.0 96
33.4–34.0 22 48.2–48.6 47 62.0–62.5 72 88.1–91.0 97
34.1–34.7 23 48.7–49.1 48 62.6–63.1 73 91.1–95.4 98
34.8–35.4 24 49.2–49.7 49 63.2–63.8 74 95.5–99.0 99
35.5–36.0 25 49.8–50.2 50 63.9–64.5 75
103Star Assessments™ for MathTechnical Manual

Appendix A: Star Math Blueprint Skills
To ensure appropriate distribution of items, the assessment blueprint uses six content domains by treating Numbers and Operations and Geometry and Measurement as separate domains.
Table 45: Star Math Blueprint Skills
Blueprint Domain Blueprint Skillset
Skill Code Star Math US Blueprint Skill
Numbers & Operations
Count with objects and numbers
N02 Count objects grouped in tens and ones
N04 Determine one more than or one less than a given number across decades
N42 Count on by ones from a number less than 100
N43 Count back by ones from a number less than 20
N45 Complete a skip pattern starting from a multiple of 2, 5, or 10
N46 Count on by 100s from any number
N56 Count objects to 20
N57 Identify a number to 20 represented by a point on a number line
N58 Determine one more than or one less than a given number
N59 Count by 2s to 50 starting from a multiple of 2
N60 Count objects grouped in tens and ones
N82 Locate a number to 20 on a number line
N95 Determine ten more than or ten less than a given number
N96 Count by 5s or 10s to 100 starting from a multiple of 5 or 10, respectively
NA1 Complete a sequence of numbers to 10
NA4 Answer a question involving an ordinal number up to “tenth”
NFY Complete a skip pattern of 2 or 5 starting from any number
NFZ Complete a skip pattern of 10 starting from any number
Identify odd and even numbers N97 Identify odd and even numbers less than 100
Identify, compare, and order fractions
AJB Compare monomial numerical expressions using the properties of powers
E5A Estimate fractions of a whole
N21 Identify a fraction equivalent to a given fraction
N27 Locate a mixed number on a number line
104Star Assessments™ for MathTechnical Manual

Appendix A: Star Math Blueprint Skills
Numbers & Operations (continued)
Identify, compare, and order fractions (continued)
N67 Determine a pictorial model of a fraction of a set of objects
N68 Locate a fraction on a number line
N69 Identify equivalent fractions using models
N77 Identify a fraction represented by a point on a number line
N78 Compare fractions using models
N87 Determine a pictorial model of a fraction of a whole
N88 Order fractions using models
N91 Compare fractions with unlike denominators
NB3 Order fractions with unlike denominators in ascending or descending order
NG1 Compare fractions with like denominators
Relate a decimal number to a percent
N0W Convert a decimal number in thousandths to a percentage
N30 Convert a percentage to its decimal equivalent
NFT Convert a decimal number to a percentage
Relate a decimal to a fraction AJ1 Compare expressions involving unlike forms of real numbers
N22 Convert a fraction or mixed number in hundredths or thousandths to a decimal number
N23 Convert a decimal number in hundredths or thousandths to a fraction
N81 Compare numbers in decimal and fractional forms
NB1 Determine the decimal number equivalent to a fraction model
NB2 Determine the fraction equivalent to a decimal number model
Relate place and value to a decimal number
N24 Relate a decimal number through ten-thousandths to its word form
N25 Identify the place of a digit in a decimal number through hundredths
N26 Estimate a decimal number from its position on a number line
N29 Round a decimal number to a specified place through hundredths
N50 Read a decimal number through the hundredths place
N51 Locate a decimal number to tenths on a number line
Table 45: Star Math Blueprint Skills (Continued)
Blueprint Domain Blueprint Skillset
Skill Code Star Math US Blueprint Skill
105Star Assessments™ for MathTechnical Manual
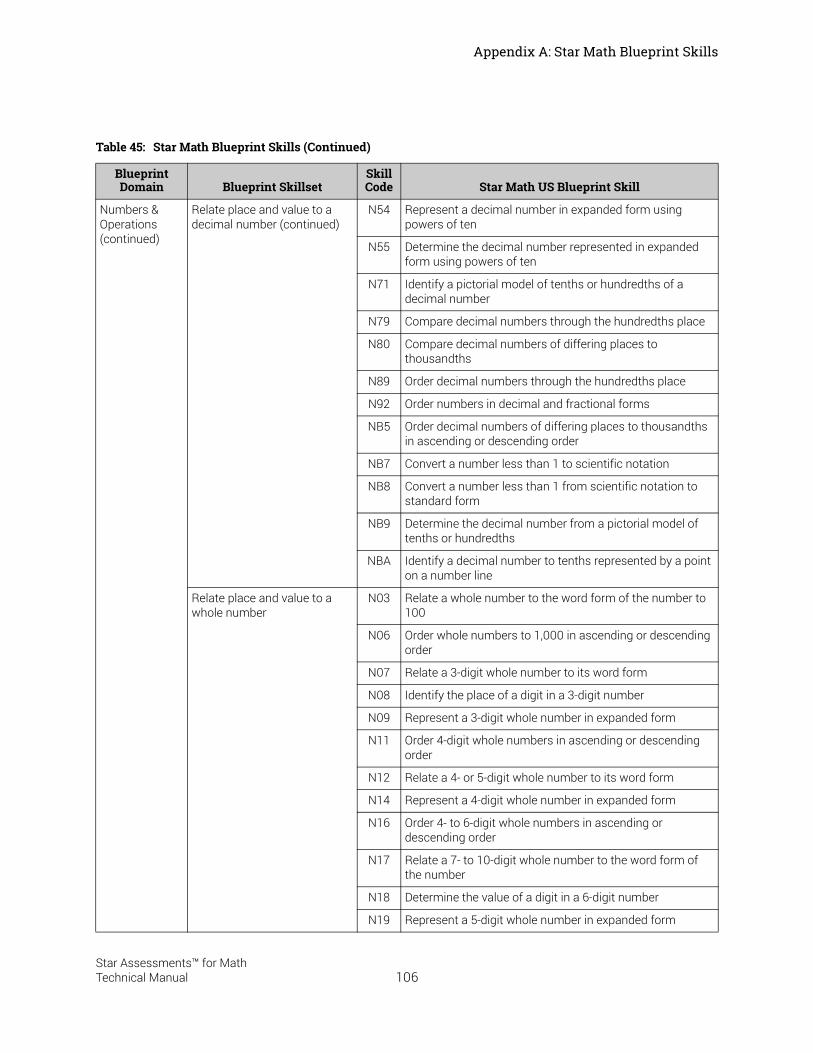
Appendix A: Star Math Blueprint Skills
Numbers & Operations (continued)
Relate place and value to a decimal number (continued)
N54 Represent a decimal number in expanded form using powers of ten
N55 Determine the decimal number represented in expanded form using powers of ten
N71 Identify a pictorial model of tenths or hundredths of a decimal number
N79 Compare decimal numbers through the hundredths place
N80 Compare decimal numbers of differing places to thousandths
N89 Order decimal numbers through the hundredths place
N92 Order numbers in decimal and fractional forms
NB5 Order decimal numbers of differing places to thousandths in ascending or descending order
NB7 Convert a number less than 1 to scientific notation
NB8 Convert a number less than 1 from scientific notation to standard form
NB9 Determine the decimal number from a pictorial model of tenths or hundredths
NBA Identify a decimal number to tenths represented by a point on a number line
Relate place and value to a whole number
N03 Relate a whole number to the word form of the number to 100
N06 Order whole numbers to 1,000 in ascending or descending order
N07 Relate a 3-digit whole number to its word form
N08 Identify the place of a digit in a 3-digit number
N09 Represent a 3-digit whole number in expanded form
N11 Order 4-digit whole numbers in ascending or descending order
N12 Relate a 4- or 5-digit whole number to its word form
N14 Represent a 4-digit whole number in expanded form
N16 Order 4- to 6-digit whole numbers in ascending or descending order
N17 Relate a 7- to 10-digit whole number to the word form of the number
N18 Determine the value of a digit in a 6-digit number
N19 Represent a 5-digit whole number in expanded form
Table 45: Star Math Blueprint Skills (Continued)
Blueprint Domain Blueprint Skillset
Skill Code Star Math US Blueprint Skill
106Star Assessments™ for MathTechnical Manual

Appendix A: Star Math Blueprint Skills
Numbers & Operations (continued)
Relate place and value to a whole number (continued)
N37 Convert a whole number greater than 10 to scientific notation
N48 Determine the value of a digit in a 4- or 5-digit whole number
N49 Determine which digit is in a specified place in a 4- or 5-digit whole number
N61 Compare whole numbers to 100 using words
N62 Order whole numbers to 100 in ascending order
N64 Determine the 3-digit number represented as hundreds, tens, and ones
N70 Round a 4- to 6-digit whole number to a specified place
N74 Represent a 2-digit number as tens and ones
N76 Compare whole numbers to 1,000 using the symbols <, >, and =
N83 Determine the value of a digit in a 2-digit number
N84 Represent a 3-digit number as hundreds, tens, and ones
N86 Determine the 4-digit whole number represented in thousands, hundreds, tens, and ones
N98 Determine the 2-digit number represented as tens and ones
NAB Recognize equivalent forms of a 3-digit number using hundreds, tens, and ones
NAE Represent a 4-digit whole number as thousands, hundreds, tens, and ones
NAF Determine the 4- or 5-digit whole number represented in expanded form
NG0 Compare 4- or 5-digit whole numbers using the symbols <, >, and =
NKE Determine the expanded form, written in powers of ten, of a whole number to 1,000,000
Add and subtract fractions with like denominators
C22 Add fractions with like 1-digit denominators
C23 Subtract fractions with like 1-digit denominators
W22 WP: Add fractions with like denominators no greater than 10 and simplify the sum
W23 WP: Subtract fractions with like denominators no greater than 10
WCE WP: Subtract fractions with like denominators no greater than 10 and simplify the difference
Table 45: Star Math Blueprint Skills (Continued)
Blueprint Domain Blueprint Skillset
Skill Code Star Math US Blueprint Skill
107Star Assessments™ for MathTechnical Manual

Appendix A: Star Math Blueprint Skills
Numbers & Operations (continued)
Add and subtract fractions with like denominators (continued)
WX2 WP: Subtract fractions with like denominators and simplify the difference
WX3 WP: Add mixed numbers with like denominators and simplify the sum
WX4 WP: Subtract mixed numbers with like denominators and simplify the difference
WXZ WP: Add fractions with like denominators and simplify the sum
Add and subtract fractions with unlike denominators
C24 Add fractions with unlike 1-digit denominators
C25 Subtract fractions with unlike 1-digit denominators
C28 Add mixed numbers with unlike denominators
C29 Subtract mixed numbers with unlike denominators
C57 Add fractions with unlike denominators that have factors in common and simplify the sum
C76 Add fractions with unlike denominators that have no factors in common
C77 Subtract fractions with unlike denominators that have factors in common and simplify the difference
C78 Subtract fractions with unlike denominators that have no factors in common
CA7 Add fractions with unlike denominators and do not simplify the sum
E24 Estimate the sum of fractions with unlike 1-digit denominators
E25 Estimate the difference between fractions with unlike 1-digit denominators
E28 Estimate the sum of mixed numbers
E29 Estimate the difference between mixed numbers with unlike denominators
W24 WP: Add fractions with unlike 1-digit denominators
W25 WP: Subtract fractions with unlike 1-digit denominators
W28 WP: Add mixed numbers with unlike denominators
W29 WP: Subtract mixed numbers with unlike denominators
Table 45: Star Math Blueprint Skills (Continued)
Blueprint Domain Blueprint Skillset
Skill Code Star Math US Blueprint Skill
108Star Assessments™ for MathTechnical Manual

Appendix A: Star Math Blueprint Skills
Numbers & Operations (continued)
Add and subtract whole numbers with regrouping
C05 Add three 1-digit numbers
C08 Add a 2-digit number and a 1- or 2-digit number with regrouping
C09 Subtract a 1- or 2-digit number from a 2-digit number with one regrouping
C11 Subtract a 2- or 3-digit number from a 3-digit number with two regroupings
C18 Add four 1- to 4-digit whole numbers
C19 Subtract two 2- to 6-digit whole numbers
C47 Add 2- and 3-digit numbers with no more than one regrouping
C49 Add 3- and 4-digit whole numbers with regrouping
C50 Subtract 3- and 4-digit whole numbers with regrouping
C69 Add two 3-digit numbers with one regrouping
C70 Subtract a 1- or 2-digit number from a 3-digit number with one regrouping
C71 Subtract a 3-digit number from a 3-digit number with one regrouping
C88 Determine a number pair that totals 100
CEL Subtract a smaller number from a 3- or 4-digit whole number in expanded form
W08 WP: Add a 2-digit number and a 1- or 2-digit number with regrouping
W09 WP: Subtract a 1- or 2-digit number from a 2-digit number with one regrouping
W18 WP: Add 3- and 4-digit whole numbers with regrouping
W19 WP: Subtract 3- and 4-digit whole numbers with regrouping
Add and subtract whole numbers without regrouping
A38 Determine the missing portion in a partially screened (hidden) collection of up to 10 objects
C06 Add a 2-digit number and a 1-digit number without regrouping
C07 Subtract a 1-digit number from a 2-digit number without regrouping
C43 Know basic addition facts to 10 plus 10
C44 Know basic subtraction facts to 20 minus 10
C67 Add two 2-digit numbers without regrouping
Table 45: Star Math Blueprint Skills (Continued)
Blueprint Domain Blueprint Skillset
Skill Code Star Math US Blueprint Skill
109Star Assessments™ for MathTechnical Manual

Appendix A: Star Math Blueprint Skills
Numbers & Operations (continued)
Add and subtract whole numbers without regrouping (continued)
C87 Subtract a 2-digit number from a 2-digit number without regrouping
E08 Estimate the sum of two 2-digit numbers
E09 Estimate the difference of whole numbers less than 100
E41 Estimate a sum or difference of 2- to 4-digit whole numbers using any method
E55 Estimate a sum or difference of whole numbers to 10,000 by rounding
N05 Add or subtract zero to or from any number less than 100
N99 Determine equivalent forms of a number, up to 10
W03 WP: Use basic addition facts to solve problems
W04 WP: Use basic subtraction facts to solve problems
W06 WP: Add a 2-digit number and a 1-digit number without regrouping
W7B WP: Estimate a sum or difference of two 3- or 4-digit whole numbers using any method
WXP WP: Subtract a 1-digit number from a 2-digit number without regrouping
WXQ WP: Add two 2-digit numbers without regrouping
WXR WP: Subtract a 2-digit number from a 2-digit number without regrouping
WXU WP: Determine a basic addition-fact number sentence for a given situation
WXV WP: Determine a basic subtraction-fact number sentence for a given situation
WXW WP: Add two 3-digit numbers without regrouping
WXY WP: Subtract a 3-digit number from a 3-digit number without regrouping
Add or Subtract Decimal Numbers
C33 Determine the sum of a whole number and a decimal number to hundredths
C35 Subtract a decimal number from a whole number
C51 Determine money amounts that total $10
C79 Add decimal numbers and whole numbers
C93 Subtract two decimal numbers of differing places to thousandths
C98 Add two decimal numbers of differing places to thousandths
Table 45: Star Math Blueprint Skills (Continued)
Blueprint Domain Blueprint Skillset
Skill Code Star Math US Blueprint Skill
110Star Assessments™ for MathTechnical Manual

Appendix A: Star Math Blueprint Skills
Numbers & Operations (continued)
Add or Subtract Decimal Numbers (continued)
CEB Add or subtract cent amounts to or from whole dollar amounts
CEC Add dollars and cents to cents
CED Add dollars and cents to dollars
CEE Subtract cents from dollars and cents
E32 Estimate the sum of two decimal numbers
E33 Estimate the sum of a whole number and a decimal number
E34 Estimate the difference of two decimal numbers
E35 Estimate the difference of a whole number and a decimal number
E44 Estimate the difference of two decimal numbers through thousandths and less than 1 by rounding to a specified place
E45 Estimate the sum of two decimal numbers through thousandths and less than 1 by rounding to a specified place
W33 WP: Determine the sum of a decimal number and a whole number
W35 WP: Subtract a decimal number from a whole number
W54 WP: Determine the amount of change from whole dollar amounts
W94 WP: Add or subtract decimal numbers through thousandths
W95 WP: Add or subtract a decimal number through thousandths and a whole number
W96 WP: Estimate the sum or difference of two decimal numbers through thousandths using any method
Convert between an improper fraction and a mixed number
N28 Convert an improper fraction to a mixed number
N72 Convert a mixed number to an improper fraction
Determine a square root N31 Evaluate the positive square root of a perfect square
N32 Determine an approximate square root of a number
NBB Determine the square root of a perfect-square fraction or decimal
NBC Determine the two closest integers to a given square root
NBD Approximate the location of a square root on a number line
NFV Determine both square roots of a perfect square
Table 45: Star Math Blueprint Skills (Continued)
Blueprint Domain Blueprint Skillset
Skill Code Star Math US Blueprint Skill
111Star Assessments™ for MathTechnical Manual

Appendix A: Star Math Blueprint Skills
Numbers & Operations (continued)
Divide a whole number resulting in a decimal quotient
C58 Divide a whole number by a 1-digit whole number resulting in a decimal quotient through thousandths
C59 Divide a whole number by a 2-digit whole number resulting in a decimal quotient through thousandths
W50 WP: Divide a whole number by a 1- or 2-digit whole number resulting in a decimal quotient
Divide whole numbers with a remainder in the quotient
C17 Divide a 2- or 3-digit whole number by a 1-digit whole number with a remainder in the quotient
C55 Divide a multi-digit whole number by a 2-digit whole number, with a remainder and at least one zero in the quotient
C56 Divide a multi-digit whole number by a 2-digit whole number and express the quotient as a mixed number
W17 WP: Divide a 2- or 3-digit whole number by a 1-digit whole number with a remainder in the quotient
W49 WP: Solve a 2-step problem involving whole numbers
W57 WP: Divide a whole number and interpret the remainder
W7C WP: Divide a 3-digit whole number by a 1-digit whole number with a remainder in the quotient
Divide Whole Numbers without a Remainder in the Quotient
AMQ Recognize equivalent multiplication or division expressions involving basic facts
C15 Divide a 2-digit whole number by a 1-digit whole number with no remainder in the quotient
C21 Divide whole numbers with no remainder in the quotient
C73 Know basic division facts to 100 ÷ 10
CEG Know basic division facts for 11 and 12
CEH Complete a multiplication and division fact family
CEP Divide a multi-digit whole number by 10 or 100 with no remainder
E15 Estimate the quotient of a 2-digit whole number divided by a 1-digit whole number with no remainder in the quotient
E21 Estimate a quotient using any method
W15 WP: Divide a 2-digit whole number by a 1-digit whole number with no remainder in the quotient
W21 WP: Divide whole numbers with no remainder in the quotient
W2S WP: Solve a 2-step whole number problem using more than one operation
Table 45: Star Math Blueprint Skills (Continued)
Blueprint Domain Blueprint Skillset
Skill Code Star Math US Blueprint Skill
112Star Assessments™ for MathTechnical Manual

Appendix A: Star Math Blueprint Skills
Numbers & Operations (continued)
Divide Whole Numbers without a Remainder in the Quotient (continued)
W53 WP: Divide objects into equal groups by sharing
W58 WP: Estimate a quotient using any method
W66 WP: Divide using basic facts to 100 ÷ 10
W90 WP: Divide a 3-digit whole number by a 1-digit whole number with no remainder in the quotient
Evaluate a Numerical Expression
A49 Evaluate a numerical expression involving one or more exponents and multiple forms of rational numbers
AA1 Simplify a monomial numerical expression involving the square root of a whole number
AFM Apply the product of powers property to a monomial numerical expression
AFN Apply the power of a power property to a monomial numerical expression
AFP Apply the quotient of powers property to monomial numerical expressions
AG8 Multiply monomial numerical expressions involving radicals
AG9 Divide monomial numerical expressions involving radicals
AGT Multiply a matrix by a scalar
AGU Add or subtract matrices
AGV Multiply matrices
AGZ Simplify an nth root
AH1 Add or subtract complex numbers
AH3 Simplify an expression involving a complex denominator
AH9 Determine the logarithmic form of an exponential equation
AHB Evaluate a logarithm by converting it to exponential form
AJ0 Evaluate a multi-step numerical expression involving absolute value
AJE Add and/or subtract numerical radical expressions
AJF Multiply a binomial numerical radical expression by a numerical radical expression
AJG Rationalize the denominator of a numerical radical expression
AJR Determine the determinant of a matrix
AJV Simplify an expression with a fractional exponent
AJW Add and subtract radical expressions
Table 45: Star Math Blueprint Skills (Continued)
Blueprint Domain Blueprint Skillset
Skill Code Star Math US Blueprint Skill
113Star Assessments™ for MathTechnical Manual

Appendix A: Star Math Blueprint Skills
Numbers & Operations (continued)
Evaluate a Numerical Expression (continued)
AJY Write an imaginary number in standard form
AMT Evaluate a numeric expression involving two operations
AP3 Determine the inverse of a matrix
AP4 Multiply complex numbers
AP5 Determine the magnitude of a vector
AP6 Add or subtract vectors component-wise
AP7 Evaluate a linear combination of vectors
N33 Evaluate the nth root of a whole number
N34 Evaluate a whole number raised to a whole number power
N35 Evaluate a whole number raised to a negative power
N36 Evaluate a whole number raised to a fractional power
N93 Evaluate a numerical expression of four or more operations, with parentheses, using order of operations
N94 Evaluate a numerical expression involving integer exponents and/or integer bases
NB6 Evaluate an integer raised to a whole number power
NM6 Write a whole number raised to a whole number power as a product
Find prime factors, common factors, and common multiples
N38 Identify the prime factors of a 2-digit number
N39 Determine the greatest common factor of two whole numbers
N40 Determine the least common multiple of two whole numbers
Multiply and divide with decimals
C36 Multiply two decimal numbers
C37 Divide decimal numbers
C83 Multiply decimal numbers less than one in hundredths or thousandths
C84 Divide a decimal number through thousandths by a 1- or 2-digit whole number where the quotient has 2–5 decimal places
C85 Divide a 1- to 3-digit whole number by a decimal number to tenths where the quotient is a decimal number to thousandths
C86 Divide a decimal number by a decimal number through thousandths, rounded quotient if needed
Table 45: Star Math Blueprint Skills (Continued)
Blueprint Domain Blueprint Skillset
Skill Code Star Math US Blueprint Skill
114Star Assessments™ for MathTechnical Manual

Appendix A: Star Math Blueprint Skills
Numbers & Operations (continued)
Multiply and divide with decimals (continued)
C94 Multiply a decimal number through thousandths by 10, 100, or 1,000
C99 Divide a decimal number by 10, 100, or 1,000
C9A Divide a 1- to 3-digit whole number by a decimal number to tenths where the quotient is a whole number
C9B Divide a 2- or 3-digit whole number by a decimal number to hundredths or thousandths, rounded quotient if needed
C9F Multiply a decimal number through thousandths by a whole number
CA0 Multiply decimal numbers greater than one where the product has 2 or 3 decimal places
W36 WP: Multiply two decimal numbers
W37 WP: Divide a whole number by a decimal number
W60 WP: Estimate the product of two decimals
W80 WP: Multiply a decimal number through thousandths by a whole number
W81 WP: Divide a decimal through thousandths by a decimal through thousandths, rounded quotient if needed
W86 WP: Solve a multi-step problem involving decimal numbers
W9B WP: Divide a decimal number through thousandths by a 1- or 2-digit whole number
W9C WP: Divide a whole number by a decimal number through thousandths, rounded quotient if needed
W9D WP: Estimate the quotient of two decimals
W9E WP: Solve a 2-step problem involving decimals
Multiply and divide with fractions
ABF Determine the reciprocal of a positive whole number, a proper fraction, or an improper fraction
AF5 Determine the reciprocal of a negative rational number
C26 Multiply a fraction by a fraction
C27 Divide a fraction by a fraction
C30 Multiply mixed numbers
C31 Divide mixed numbers
C61 Multiply a mixed number by a fraction
C80 Multiply a mixed number by a whole number
C81 Divide a fraction by a whole number resulting in a fractional quotient
Table 45: Star Math Blueprint Skills (Continued)
Blueprint Domain Blueprint Skillset
Skill Code Star Math US Blueprint Skill
115Star Assessments™ for MathTechnical Manual

Appendix A: Star Math Blueprint Skills
Numbers & Operations (continued)
Multiply and divide with fractions (continued)
C82 Divide a whole number by a fraction resulting in a fractional quotient
W59 WP: Multiply or divide a fraction by a fraction
W71 WP: Multiply or divide two mixed numbers or a mixed number and a fraction
W99 WP: Solve a 2-step problem involving fractions
WA9 WP: Solve a multi-step problem involving fractions or mixed numbers
Multiply whole numbers C14 Multiply a 2-digit whole number by a 1-digit whole number with no regrouping
C16 Multiply a 2-digit whole number by a 1- or 2-digit whole number with regrouping
C52 Multiply a 1- or 2-digit whole number by a multiple of 10, 100, or 1,000
C53 Apply the distributive property to multiply a multi-digit number by a 1-digit number
C54 Multiply a 3- or 4-digit whole number by a 1-digit whole number
C72 Use a multiplication sentence to represent an area or an array model
C74 Multiply a 2-digit whole number by a 2-digit whole number
C91 Know basic multiplication facts to 10 × 10
CE0 Know multiplication tables for 2, 5, and 10
CEF Know basic multiplication facts for 11 and 12
CEJ Multiply a 1-digit whole number by a multiple of 10 to 100
CEM Multiply a 3-digit whole number by a 2-digit whole number
CEN Multiply three 1- and 2-digit whole numbers
E14 Estimate the product of a 2-digit number and a 1-digit number
E20 Estimate the product of whole numbers using any method
W14 WP: Multiply a 2-digit whole number by a 1-digit whole number without regrouping
W16 WP: Multiply a 2-digit whole number by a 1- or 2-digit whole number
W20 WP: Multiply whole numbers
W46 WP: Multiply a multi-digit whole number by a 1-digit whole number
Table 45: Star Math Blueprint Skills (Continued)
Blueprint Domain Blueprint Skillset
Skill Code Star Math US Blueprint Skill
116Star Assessments™ for MathTechnical Manual

Appendix A: Star Math Blueprint Skills
Numbers & Operations (continued)
Multiply whole numbers (continued)
W51 WP: Solve a multi-step problem involving whole numbers
W65 WP: Multiply using basic facts to 10 × 10
W8F WP: Estimate a product of two whole numbers using any method
Perform operations with integers
C62 Add integers
C63 Subtract integers
C64 WP: Add and subtract using integers
C65 Multiply integers
C66 Divide integers
W87 WP: Multiply or divide integers
Solve a problem involving percents
C97 Determine a percent of a number given a percent that is not a whole percent
C9C Determine the percent one number is of another number
C9D Determine a number given a part and a decimal percentage or a percentage more than 100%
W38 WP: Determine the percent a whole number is of another whole number, with a result less than 100%
W39 WP: Determine a percent of a whole number using percents less than 100
W40 WP: Determine a whole number given a part and a percent
W84 WP: Determine the result of applying a percent of decrease to a value
W85 WP: Answer a question involving a fraction and a percent
W8B WP: Determine a given percent of a number
W8C WP: Determine the percent one number is of another number
W8D WP: Determine a number given a part and a decimal percentage or a percentage more than 100%
WA6 WP: Determine the percent of decrease applied to a number
WA7 WP: Determine the percent of increase applied to a number
WA8 WP: Determine the result of applying a percent of increase to a value
WB1 WP: Estimate a given percent of a number
Table 45: Star Math Blueprint Skills (Continued)
Blueprint Domain Blueprint Skillset
Skill Code Star Math US Blueprint Skill
117Star Assessments™ for MathTechnical Manual
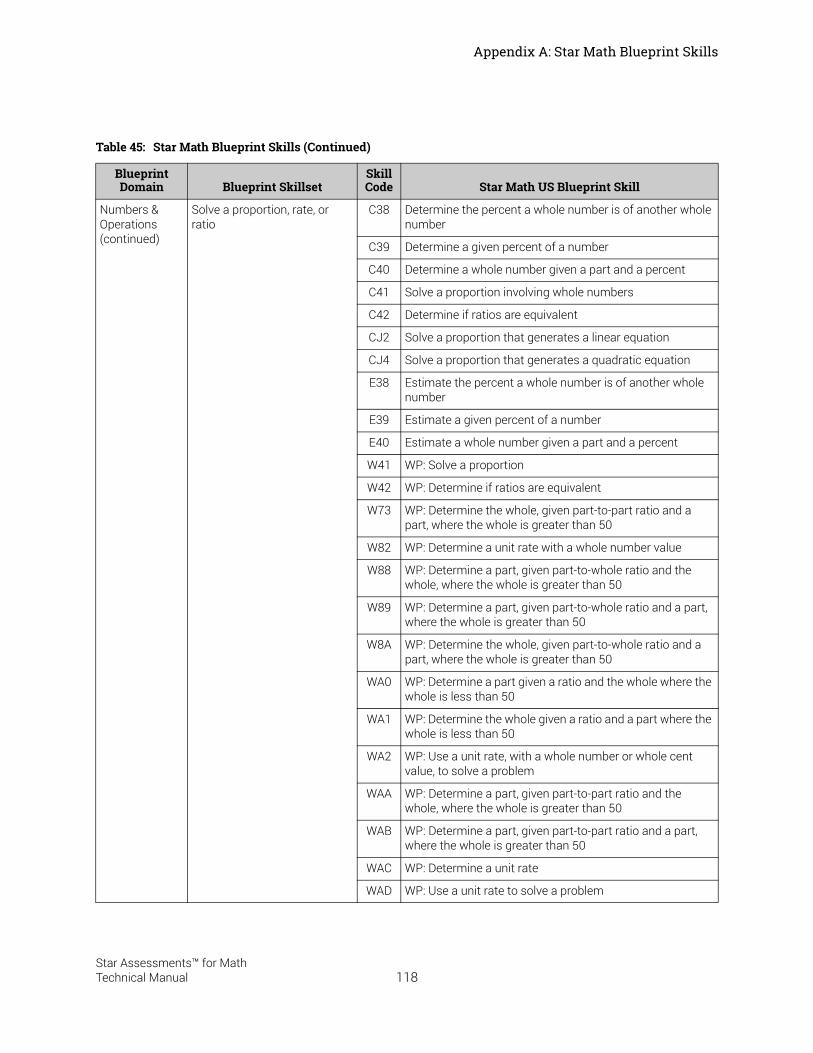
Appendix A: Star Math Blueprint Skills
Numbers & Operations (continued)
Solve a proportion, rate, or ratio
C38 Determine the percent a whole number is of another whole number
C39 Determine a given percent of a number
C40 Determine a whole number given a part and a percent
C41 Solve a proportion involving whole numbers
C42 Determine if ratios are equivalent
CJ2 Solve a proportion that generates a linear equation
CJ4 Solve a proportion that generates a quadratic equation
E38 Estimate the percent a whole number is of another whole number
E39 Estimate a given percent of a number
E40 Estimate a whole number given a part and a percent
W41 WP: Solve a proportion
W42 WP: Determine if ratios are equivalent
W73 WP: Determine the whole, given part-to-part ratio and a part, where the whole is greater than 50
W82 WP: Determine a unit rate with a whole number value
W88 WP: Determine a part, given part-to-whole ratio and the whole, where the whole is greater than 50
W89 WP: Determine a part, given part-to-whole ratio and a part, where the whole is greater than 50
W8A WP: Determine the whole, given part-to-whole ratio and a part, where the whole is greater than 50
WA0 WP: Determine a part given a ratio and the whole where the whole is less than 50
WA1 WP: Determine the whole given a ratio and a part where the whole is less than 50
WA2 WP: Use a unit rate, with a whole number or whole cent value, to solve a problem
WAA WP: Determine a part, given part-to-part ratio and the whole, where the whole is greater than 50
WAB WP: Determine a part, given part-to-part ratio and a part, where the whole is greater than 50
WAC WP: Determine a unit rate
WAD WP: Use a unit rate to solve a problem
Table 45: Star Math Blueprint Skills (Continued)
Blueprint Domain Blueprint Skillset
Skill Code Star Math US Blueprint Skill
118Star Assessments™ for MathTechnical Manual

Appendix A: Star Math Blueprint Skills
Algebra Determine a linear equation A02 Use a 1-variable, 1-step equation to represent a verbal statement
A06 Determine an equation for a line given a graph
A42 Use a 2-variable equation to construct an input-output table
A46 Use a 2-variable equation to represent a relationship expressed in a table
A53 Determine an equation of a line in slope-intercept form given the slope and y-intercept
A83 Determine an equation for a line given the slope of the line and a point on the line that is not the y-intercept
A84 Determine an equation of a line in point-slope or slope-intercept form given two points on the line
A9C Determine the slope-intercept form or the standard form of a linear equation
AA5 Determine the table of values that represents a linear equation with rational coefficients in two variables
AA6 Determine a linear equation in two variables that represents a table of values
AFD Determine an equation for a line that goes through a given point and is parallel or perpendicular to a given line
AKX WP: Determine a trigonometric function that represents a situation
AM3 Represent a proportional relationship as a linear equation
AN4 Use a table to represent a linear function
AP0 WP: Determine an exponential function that represents a situation such as exponential growth or decay
APG Determine an equation of a line in standard form given the slope and y-intercept
APH Determine an equation of a line in standard form given two points on the line
GKL Determine an equation for a line parallel or perpendicular to a given graphed line
W83 Use a 2-variable linear equation to represent a situation
W8E WP: Use a 1-variable equation with rational coefficients to represent a situation involving two operations
WA3 Use a 2-variable equation to represent a situation involving a direct proportion
Table 45: Star Math Blueprint Skills (Continued)
Blueprint Domain Blueprint Skillset
Skill Code Star Math US Blueprint Skill
119Star Assessments™ for MathTechnical Manual

Appendix A: Star Math Blueprint Skills
Algebra (continued)
Determine a linear equation (continued)
WAF WP: Use a 1-variable 1-step equation to represent a situation
WB2 WP: Use a 2-variable equation with rational coefficients to represent a situation
Determine a system of linear equations
AP2 Represent a system of linear equations as a single matrix equation
W74 WP: Determine a system of linear equations that represents a given situation
Determine the operation given a situation
A30 WP: Determine the operation needed for a given situation
ACB Translate a verbal statement into an algebraic equation
AMR Determine the operation needed to make a number sentence true
C90 Use a division sentence to represent objects divided into equal groups
W67 WP: Determine a multiplication or division sentence for a given situation
Evaluate an algebraic expression or function
A33 Evaluate a 2-variable expression, with two or three operations, using whole number substitution
A36 Evaluate a 2-variable expression, with two or three operations, using integer substitution
A50 Evaluate a function written in function notation for a given value
AK1 Write a quadratic equation given its solutions
ANT Determine values of the inverse of a function using a table or a graph
W72 WP: Evaluate a 1- or 2-variable expression or formula using whole numbers
Graph a 1-variable inequality A09 Relate a 1-variable inequality to its graph
Graph on a coordinate plane A08 Relate a graph to a 2-variable linear inequality
A25 Relate a graph to an equation of a parabola
A26 Relate a graph of an ellipse centered at the origin to its equation
A48 Determine the graph of a 1-operation linear function
A52 Determine the graph of a linear equation given in slope-intercept, point-slope, or standard form
A91 Determine the graph of a given quadratic function
AA0 Determine the graph of a line using given information
Table 45: Star Math Blueprint Skills (Continued)
Blueprint Domain Blueprint Skillset
Skill Code Star Math US Blueprint Skill
120Star Assessments™ for MathTechnical Manual

Appendix A: Star Math Blueprint Skills
Algebra (continued)
Graph on a coordinate plane(continued)
AA7 Determine the graph of a 2-operation linear function
AA8 Determine the slope of a line given its graph or a graph of a line with a given slope
AAC Use a table to represent the values from a first-quadrant graph
AFE Determine the graph of a 2-variable absolute value equation
AFL Determine the graph of the solution set of a system of linear inequalities in two variables
AHG Determine the graph of a circle given the equation in standard form
AHJ Determine the graph of a hyperbola given the equation in standard form
AHL Determine the graph of a vertically oriented parabola
AHM Determine the graph of a horizontally oriented parabola
AHV Determine the graph of a sine, cosine or tangent function
AJ8 Determine a 2-variable linear inequality represented by a graph
AJA Determine the graph of a 1-variable absolute value inequality
AJN Graph the inverse of a linear function
AK4 Relate a quadratic inequality in two variables to its graph
AKE Graph an ellipse
ANN Determine the graph of a piecewise-defined function
ANP Determine the component form of a vector represented on a graph
ANQ Relate a graph to a polynomial function given in factored form
ANR Identify a complex number represented as a vector on a coordinate plane
ANS Relate a graph to a square or cube root function
GFS Determine the ordered pair of a point in the first quadrant
GFV Determine the ordered pair of a point in any quadrant
GM3 Determine the location of an ordered pair in any quadrant
W79 WP: Answer a question using the graph of a quadratic function
Table 45: Star Math Blueprint Skills (Continued)
Blueprint Domain Blueprint Skillset
Skill Code Star Math US Blueprint Skill
121Star Assessments™ for MathTechnical Manual

Appendix A: Star Math Blueprint Skills
Algebra (continued)
Identify characteristics of a linear equation or function
AMJ Determine the slope of a line given a table of values
A19 Determine the slope of a line given the coordinates of two points on the line
A20 Determine the x- or y-intercept of a line given a 1-variable equation
A9A WP: Determine a reasonable domain or range for a function in a given situation
A9E Determine the slope of a line given an equation in point-slope or slope-intercept form
AA9 Determine the x- or y-intercept of a line given its graph
AF6 Determine if a relation is a function
AF7 Determine if a function is linear or nonlinear
AF8 Determine whether a graph or a table represents a linear or nonlinear function
AJ2 Determine the independent or dependent variable in a given situation
AJ3 Determine the domain or range of a function
AJ4 Determine if a table or an equation represents a direct variation, an inverse variation, or neither
AJK Identify the domain or range of a radical function
AJL Determine the domain and range of a graphed function
AKC Determine the domain of a rational function
AM5 Determine the effect of a change in the slope and/or y-intercept on the graph of a line
AM8 Determine the result of a change in a or c on the graph of y=ax^2 + c
AP8 Identify the vertex, axis of symmetry, or direction of the graph of a quadratic function
AP9 Identify the end behavior, asymptotes, excluded values, or behavior near excluded values of a rational function
APA WP: Interpret an interest rate, rate of change, initial amount, frequency of compounding and other parameters of an exponential function
APB Determine if the inverse of a function is a function
APC Determine the equation of the inverse of a linear, rational root, or polynomial function
Table 45: Star Math Blueprint Skills (Continued)
Blueprint Domain Blueprint Skillset
Skill Code Star Math US Blueprint Skill
122Star Assessments™ for MathTechnical Manual

Appendix A: Star Math Blueprint Skills
Algebra (continued)
Identify characteristics of a linear equation or function (continued)
APD Determine the equation of a function resulting from a translation and/or scaling of a given function
APE Determine the x- or y-intercept of a line given a 2-variable equation
APF Determine the slope of a line given the graph of the line
GG1 Determine if lines through points with given coordinates are parallel or perpendicular
GG2 Determine the coordinates of a point through which a line must pass in order to be parallel or perpendicular to a given line
W76 WP: Interpret the meaning of the slope of a graphed line
WB3 WP: Interpret the meaning of the y-intercept of a graphed line
Relate a rule to a pattern A21 Determine the common difference in an arithmetic sequence
A22 Find a specified term in an arithmetic sequence
A29 Extend a number pattern involving addition
A31 Identify a missing term in a multiplication or a division number pattern
A32 Determine the variable expression with one operation for a table of paired numbers
A39 Determine the rule for an addition or subtraction number pattern
A40 Identify a missing figure in a growing pictorial or non-numeric pattern
A44 Generate a table of paired numbers based on a rule
A95 Extend a number pattern involving subtraction
AA4 Determine a rule that relates two variables
ACA Determine the algebraic equation that describes a pattern represented by data in a table
AKL Find a specified term of an arithmetic sequence given the first term and the common difference
AKM Find a specified term of an arithmetic sequence
AKN Find a specified term of an arithmetic sequence given the formula for the nth term
AKP WP: Solve a problem that can be represented by an arithmetic sequence
Table 45: Star Math Blueprint Skills (Continued)
Blueprint Domain Blueprint Skillset
Skill Code Star Math US Blueprint Skill
123Star Assessments™ for MathTechnical Manual

Appendix A: Star Math Blueprint Skills
Algebra (continued)
Relate a rule to a pattern(continued)
AKR Find a specified term of a geometric sequence
AKS Find a specified term of a geometric sequence given the first three terms of the sequence
AMS Extend a number pattern
ANH Determine the explicit formula for an arithmetic sequence
ANJ Identify a given sequence as arithmetic, geometric, or neither
ANK Find a specified term of a binomial expression raised to a positive integer power
ANL WP: Solve a problem that can be represented by a geometric sequence
ANM WP: Solve a problem that can be represented by a finite geometric series
GJZ Use inductive reasoning to determine a rule
W7E WP: Generate a table of paired numbers based on a variable expression with one operation
W97 WP: Determine the variable expression with one operation for a table of paired numbers
Simplify an Algebraic Expression
A12 Add or subtract polynomial expressions
A13 Multiply two binomials
A18 Factor a common term from a binomial expression
A55 Simplify a rational expression involving polynomial terms
A56 Multiply rational expressions
A57 Divide a polynomial expression by a monomial
A58 Add or subtract two rational expressions with unlike polynomial denominators
A61 Simplify an algebraic expression by combining like terms
A87 Apply the product of powers property to a monomial algebraic expression
A88 Apply the power of a power property to a monomial algebraic expression
A89 Apply the power of a product property to a monomial algebraic expression
A8A Apply the quotient of powers property to monomial algebraic expressions
A8B Apply the power of a quotient property to monomial algebraic expressions
Table 45: Star Math Blueprint Skills (Continued)
Blueprint Domain Blueprint Skillset
Skill Code Star Math US Blueprint Skill
124Star Assessments™ for MathTechnical Manual

Appendix A: Star Math Blueprint Skills
Algebra (continued)
Simplify an Algebraic Expression (continued)
A8E Multiply two binomials of the form (ax +/– b)(cx +/– d)
A8F Factor the GCF from a polynomial expression
A90 Factor trinomials that result in factors of the form (ax +/– b)(cx +/– d)
A97 Multiply two monomial algebraic expressions
AA2 Simplify a monomial algebraic radical expression
AAE Apply terminology related to polynomials
AAF Multiply two binomials of the form (x +/– a)(x +/– b)
AFQ Simplify a polynomial expression by combining like terms
AFR Multiply a polynomial by a monomial
AFS Multiply two binomials of the form (ax +/– by)(cx +/– dy)
AFV Multiply a trinomial by a binomial
AFW Factor trinomials that result in factors of the form (x +/– a)(x +/– b)
AFX Factor a trinomial that results in factors of the form (ax +/– by)(cx +/– dy)
AFY Factor the difference of two squares
AFZ Factor a perfect-square trinomial
AGA Multiply monomial algebraic radical expressions
AGB Divide monomial algebraic radical expressions
AGF Divide rational expressions
AGG Divide a polynomial expression by a binomial
AGJ Add or subtract two rational expressions with like denominators
AGK Add or subtract two rational expressions with unlike monomial denominators
AGP Determine the composition of two functions
AGY Represent an algebraic radical expression in exponential form
AH0 Simplify an expression with rational exponents
AH7 Factor a polynomial using long division
AH8 Factor a polynomial by grouping
AHA Convert between a simple exponential equation and its corresponding logarithmic equation
Table 45: Star Math Blueprint Skills (Continued)
Blueprint Domain Blueprint Skillset
Skill Code Star Math US Blueprint Skill
125Star Assessments™ for MathTechnical Manual

Appendix A: Star Math Blueprint Skills
Algebra (continued)
Simplify an Algebraic Expression (continued)
AJC Apply properties of exponents to monomial algebraic expressions
AJD Factor a polynomial that has a GCF and two linear binomial factors
AJH Rationalize the denominator of an algebraic radical expression
AJJ Add or subtract algebraic radical expressions
AK6 Factor a difference of squares
AK7 Factor the sum or difference of 2 cubes
AK8 Factor a polynomial into a binomial and trinomial
ANU Simplify a monomial algebraic expression that includes fractional exponents and/or nth roots
ANV Multiply or divide functions
AP1 Identify equivalent logarithmic expressions using the properties of logarithms
Solve a linear equation A01 Determine a missing addend in a number sentence involving 2-digit numbers
A04 Determine a solution to a 2-variable linear equation
A28 Determine a missing addend in a basic addition-fact number sentence
A37 Solve a proportion involving decimals
A43 Solve a 2-step linear equation involving integers
A45 Solve a 1-step equation involving whole numbers
A47 Solve a 1-step linear equation involving integers
A51 Solve a 1-variable linear equation with the variable on both sides
A81 Determine a missing subtrahend in a basic subtraction-fact number sentence
A98 Solve a 1-step equation involving rational numbers
A99 Solve a 2-step equation involving rational numbers
AAB Rewrite an equation to solve for a specified variable
AF9 Solve a 1-variable linear equation that requires simplification and has the variable on one side
AFA Solve a direct or inverse variation problem
AMN Determine the missing subtrahend in a number sentence involving 3-digit numbers
Table 45: Star Math Blueprint Skills (Continued)
Blueprint Domain Blueprint Skillset
Skill Code Star Math US Blueprint Skill
126Star Assessments™ for MathTechnical Manual

Appendix A: Star Math Blueprint Skills
Algebra (continued)
Solve a linear equation(continued)
AMP Determine the missing dividend or divisor in a number sentence involving basic facts
W75 WP: Solve a problem involving a 1-variable, 2-step equation
WXS WP: Determine a missing addend in a basic addition-fact number sentence
WXT WP: Determine a missing subtrahend in a basic subtraction-fact number sentence
Solve a Linear Inequality A07 Determine the solution set of a 1-variable linear inequality
A62 Determine the graph of the solutions to a 2-step linear inequality in one variable
A9B Solve a 1-variable linear inequality with the variable on both sides
AAA Solve a 2-step linear inequality in one variable
ADC Solve a 1-variable linear inequality with the variable on one side
AFB Solve a 1-variable compound inequality
AJ6 Solve a 2-variable linear inequality for the dependent variable
AJ7 Determine if an ordered pair is a solution to a 2-variable linear inequality
WB4 WP: Solve a problem involving a 2-step linear inequality in one variable
Solve a Nonlinear Equation A15 Solve a quadratic equation using the square root rule
A16 Solve a quadratic equation by factoring
A17 Determine the term needed to complete the square in a quadratic equation
A54 Solve a radical equation that leads to a quadratic equation
A59 Solve a rational equation involving terms with monomial denominators
A60 Solve a rational equation involving terms with polynomial denominators
A85 Solve a 1-variable absolute value inequality
A93 Solve a quadratic equation using the quadratic formula
AA3 Solve a radical equation that leads to a linear equation
AG1 Solve a quadratic equation by taking the square root
AG2 Determine the solution(s) of an equation given in factored form
Table 45: Star Math Blueprint Skills (Continued)
Blueprint Domain Blueprint Skillset
Skill Code Star Math US Blueprint Skill
127Star Assessments™ for MathTechnical Manual

Appendix A: Star Math Blueprint Skills
Algebra (continued)
Solve a Nonlinear Equation(continued)
AG3 Use the discriminant to determine the number of real solutions
AH5 Solve a quadratic equation with complex solutions
AHC Solve a logarithmic equation
AJ5 Solve a 1-variable absolute value equation
AK2 Solve a cubic equation
AKD Write the equation of a circle given its center and radius
ANZ Solve a problem involving the Pythagorean identity sin^2(theta) + cos^2(theta) = 1
GGQ Determine an equation of a circle
GGR Determine the radius, center, or diameter of a circle given an equation
Solve a system of linear equations
A14 Solve a system of linear equations in two variables using any method
AF1 Solve a number problem that can be represented by a linear system of equations
AFJ Determine the number of solutions to a system of linear equations
AGX Solve a problem involving matrices
AJQ Solve a system of three equations
Geometry & Measurement
Determine a missing figure in a pattern
A96 Identify a missing figure in a repeating pictorial or non-numeric pattern
G01 Identify a missing figure in a geometric pattern
Determine a missing measure or dimension of a shape
G02 Relate the radius to the diameter in a circle
G22 Determine a missing angle measure in a triangle
G23 Use the Pythagorean theorem to determine a length
G27 Determine a missing dimension given two similar shapes
GE4 Determine the midpoint of a line segment given the coordinates of the endpoints
GE6 Determine the measure of an angle formed by parallel lines and one or more transversals given an angle measure
GF6 Determine the measure of an angle or the sum of the angles in a polygon
GF9 Determine a length using parallel lines and proportional parts
Table 45: Star Math Blueprint Skills (Continued)
Blueprint Domain Blueprint Skillset
Skill Code Star Math US Blueprint Skill
128Star Assessments™ for MathTechnical Manual

Appendix A: Star Math Blueprint Skills
Geometry & Measurement(continued)
Determine a missing measure or dimension of a shape (continued)
GFA Determine a length using the properties of a 45-45-90 degree triangle or a 30-60-90 degree triangle
GFB Solve a problem involving the length of an arc
GFC Determine the length of a line segment, the measure of an angle, or the measure of an arc using a tangent to a circle
GFD Determine a length using a line segment tangent to a circle and the radius that intersects the tangent
GFE Determine the measure of an arc or an angle using the relationship between an inscribed angle and its intercepted arc
GFG Solve a problem involving the distance formula
GFH Solve a problem using inequalities in a triangle
GFJ Determine a length in a complex figure using the Pythagorean theorem
GG3 Solve for the length of a side of a triangle using the Pythagorean theorem
GG4 WP: Determine a length or an angle measure using triangle relationships
GG5 Determine the length of a side or the measure of an angle in congruent triangles
GG6 WP: Solve a problem using the properties of angles and/or sides of polygons
GG8 Determine the length of a side in one of two similar polygons
GG9 Determine the length of a side or the measure of an angle in similar triangles
GGA Determine a length given the perimeters of similar triangles or the lengths of corresponding interior line segments
GGB Determine a length in a triangle using a midsegment
GGE WP: Determine a length using similarity
GGP Determine the measure of an arc or a central angle using the relationship between the arc and the central angle
GHC Solve a problem involving the midpoint formula
GHE Determine a length or an angle measure using the segment addition postulate or the angle addition postulate
GHF Solve a problem involving a bisected angle or a bisected segment
Table 45: Star Math Blueprint Skills (Continued)
Blueprint Domain Blueprint Skillset
Skill Code Star Math US Blueprint Skill
129Star Assessments™ for MathTechnical Manual

Appendix A: Star Math Blueprint Skills
Geometry & Measurement(continued)
Determine a missing measure or dimension of a shape (continued)
GHJ Determine the measure of an angle in a figure involving parallel and/or perpendicular lines
GHL Determine the measure of an angle using angle relationships and the sum of the interior angles in a triangle
GHM Determine a length in a triangle using a median
GHP Solve a problem involving a point on the bisector of an angle
GHQ Determine a length or an angle measure using general properties of parallelograms
GHR Determine a length or an angle measure using properties of squares, rectangles, or rhombi
GHS Determine a length or an angle measure using properties of kites
GHT Determine a length or an angle measure using properties of trapezoids
GHU Determine a length or an angle measure in a complex figure using properties of polygons
GKA Determine the effect of a change in dimensions on the perimeter or area of a shape
GMY Determine the distance between two points on a coordinate plane
GN0 Determine the measure of an angle formed by parallel lines and one or more transversals given algebraic expressions
GN1 Use triangle inequalities to determine a possible side length given the length of two sides
GN2 Determine the measure of an angle or an arc using a tangent to a circle
WB0 WP: Solve a problem involving similar shapes
WB5 WP: Use the Pythagorean theorem to find a length or a distance
Identify congruence and similarity of geometric shapes
GA3 Identify figures that are the same size and shape
GA4 Compare common objects to basic shapes
GA8 Determine lines of symmetry
GB0 Determine the result of a reflection, rotation, or translation
GE7 Identify a triangle congruence postulate that justifies a congruence statement
GF7 Identify a triangle similarity postulate that justifies a similarity statement
Table 45: Star Math Blueprint Skills (Continued)
Blueprint Domain Blueprint Skillset
Skill Code Star Math US Blueprint Skill
130Star Assessments™ for MathTechnical Manual
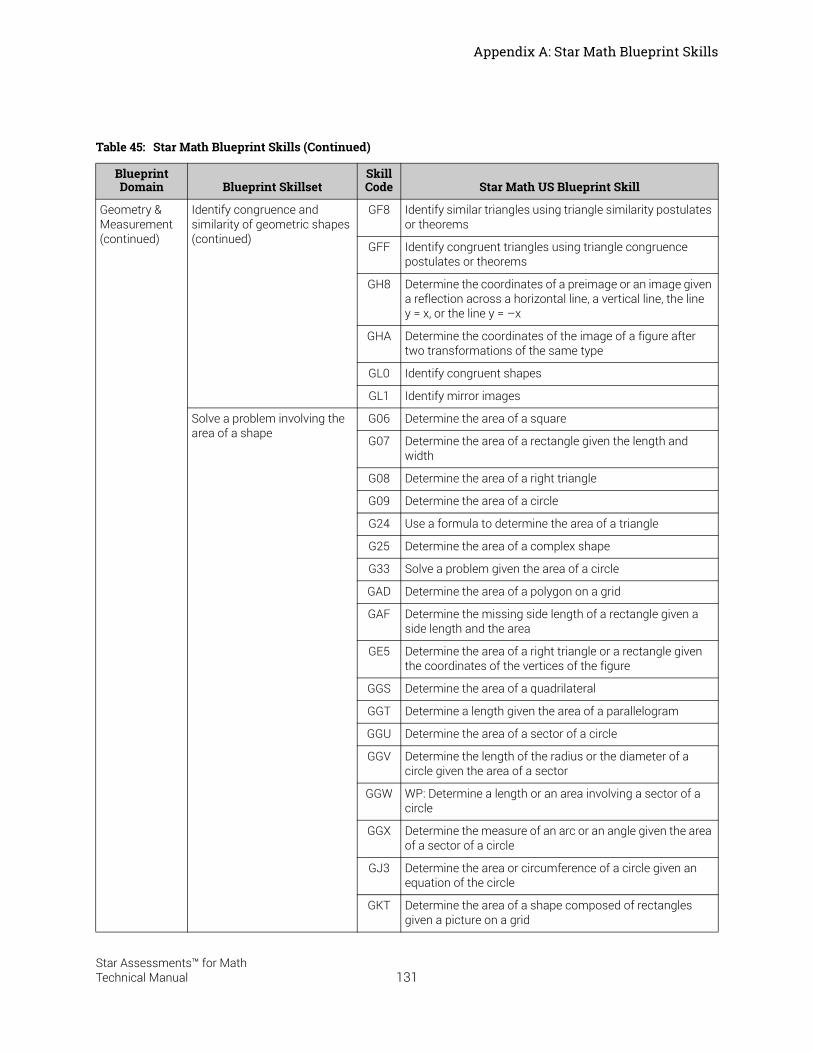
Appendix A: Star Math Blueprint Skills
Geometry & Measurement(continued)
Identify congruence and similarity of geometric shapes(continued)
GF8 Identify similar triangles using triangle similarity postulates or theorems
GFF Identify congruent triangles using triangle congruence postulates or theorems
GH8 Determine the coordinates of a preimage or an image given a reflection across a horizontal line, a vertical line, the line y = x, or the line y = –x
GHA Determine the coordinates of the image of a figure after two transformations of the same type
GL0 Identify congruent shapes
GL1 Identify mirror images
Solve a problem involving the area of a shape
G06 Determine the area of a square
G07 Determine the area of a rectangle given the length and width
G08 Determine the area of a right triangle
G09 Determine the area of a circle
G24 Use a formula to determine the area of a triangle
G25 Determine the area of a complex shape
G33 Solve a problem given the area of a circle
GAD Determine the area of a polygon on a grid
GAF Determine the missing side length of a rectangle given a side length and the area
GE5 Determine the area of a right triangle or a rectangle given the coordinates of the vertices of the figure
GGS Determine the area of a quadrilateral
GGT Determine a length given the area of a parallelogram
GGU Determine the area of a sector of a circle
GGV Determine the length of the radius or the diameter of a circle given the area of a sector
GGW WP: Determine a length or an area involving a sector of a circle
GGX Determine the measure of an arc or an angle given the area of a sector of a circle
GJ3 Determine the area or circumference of a circle given an equation of the circle
GKT Determine the area of a shape composed of rectangles given a picture on a grid
Table 45: Star Math Blueprint Skills (Continued)
Blueprint Domain Blueprint Skillset
Skill Code Star Math US Blueprint Skill
131Star Assessments™ for MathTechnical Manual

Appendix A: Star Math Blueprint Skills
Geometry & Measurement(continued)
Solve a problem involving the area of a shape (continued)
GN3 Determine a length given the area of a kite or rhombus
GN4 Determine a length given the area of a trapezoid
W56 WP: Determine the area of a rectangle
W69 WP: Determine the area of a triangle
W70 WP: Determine a missing dimension given the area and another dimension
W98 WP: Determine the area of a square or rectangle
Solve a problem involving the perimeter of a shape
G03 Determine the perimeter of a square
G04 WP: Determine the perimeter of a rectangle
G05 Determine the perimeter of a triangle
G26 Solve a problem involving the circumference of a circle
GAB Determine the perimeter of a rectangle given a picture showing length and width
GAC Determine the missing side length of a rectangle given a side length and the perimeter
WA4 WP: Determine the perimeter or the area of a complex shape
Solve a problem involving the surface area or volume of a solid
G10 Determine the volume of a rectangular prism
G31 Determine the surface area of a rectangular prism
G32 WP: Find the surface area of a rectangular prism
G34 Determine the volume of a rectangular or a triangular prism
GGY Determine a length given the surface area of a right cylinder or a right prism that has a rectangle or a right triangle as a base
GH0 Solve a problem involving the volume of a right pyramid or a right cone
GH1 Determine the surface area of a sphere
GH2 Determine the volume of a sphere or hemisphere
GJP Solve a problem involving the surface areas of similar solid figures
W61 WP: Solve a problem involving the volume of a geometric solid
W62 WP: Determine the surface area of a geometric solid
W7F WP: Determine the volume of a rectangular prism
Table 45: Star Math Blueprint Skills (Continued)
Blueprint Domain Blueprint Skillset
Skill Code Star Math US Blueprint Skill
132Star Assessments™ for MathTechnical Manual

Appendix A: Star Math Blueprint Skills
Geometry & Measurement(continued)
Use the vocabulary of geometry and measurement
G12 Identify rays
G13 Identify line segments
G14 Identify parallel lines
G15 Identify intersecting line segments
G16 Identify perpendicular lines
G19 Identify perpendicular or parallel lines when given a transversal
G21 Classify an obtuse angle or an acute angle given a picture
G30 Classify an angle given its measure
G37 Determine the common attributes in a set of geometric shapes
GA1 Use basic terms to describe position
GA2 Identify a circle, a triangle, a square, or a rectangle
GA5 Identify a line of symmetry
GA6 Identify a shape with given attributes
GA7 Identify a common solid shape
GFZ Classify a right angle or a straight angle given a picture
GH7 Relate the coordinates of a preimage or an image to a translation described using mapping notation
GH9 Relate the coordinates of a preimage or an image to a dilation centered at the origin
GHD Identify a relationship between points, lines, and/or planes
GHG Identify angle relationships formed by multiple lines and transversals
GHH Identify parallel lines using angle relationships
GJS Determine the angle of rotational symmetry of a figure
GK0 Use deductive reasoning to draw a valid conclusion from conditional statements
GK1 Identify a statement or an example that disproves a conjecture
GK2 Identify a valid biconditional statement
GKE Determine the number of faces, edges, or vertices in a 3-dimensional figure
GKH Identify a cross section of a 3-dimensional shape
GKJ Relate a net to a 3-dimensional shape
Table 45: Star Math Blueprint Skills (Continued)
Blueprint Domain Blueprint Skillset
Skill Code Star Math US Blueprint Skill
133Star Assessments™ for MathTechnical Manual

Appendix A: Star Math Blueprint Skills
Geometry & Measurement(continued)
Use the vocabulary of geometry and measurement (continued)
GKN Identify the converse, inverse, or contrapositive of a statement
GKV Determine attributes of a triangle or a quadrilateral from a model
GKW Relate a model of a triangle or a quadrilateral to a list of attributes
GKX Identify a picture of a 3-dimensional shape
GKY Name a 3-dimensional shape from a picture
GMZ Identify a geometric construction given an illustration
MA1 Compare objects using the vocabulary of measurement
Calculate elapsed time M17 Calculate elapsed time exceeding an hour with regrouping
MDB Calculate elapsed time within an hour, given two clocks, with regrouping
W68 WP: Calculate elapsed time exceeding an hour with regrouping hours
Determine a measurement AKV Convert between degree measure and radian measure
AKY Determine the value of an inverse sine, cosine, or tangent expression
G17 Identify angle relationships formed by parallel lines cut by a transversal
G18 Identify angle relationships formed by intersecting lines
G20 Determine the measure of a vertical angle or a supplementary angle
GGJ Determine a sine, cosine, or tangent ratio in a right triangle
M01 Convert between inches, feet, and yards
M02 Estimate the height or length of a common object in customary units
M04 Convert between customary units of capacity
M05 Convert within metric units of mass, length, and capacity
M06 Determine the approximate value of a unit converted between customary and metric measures
M07 Identify an angle given its measure
M08 Estimate the height of a common object in metric units
M09 Measure length in centimeters
M11 Convert a rate from one unit to another with a change in one unit
Table 45: Star Math Blueprint Skills (Continued)
Blueprint Domain Blueprint Skillset
Skill Code Star Math US Blueprint Skill
134Star Assessments™ for MathTechnical Manual
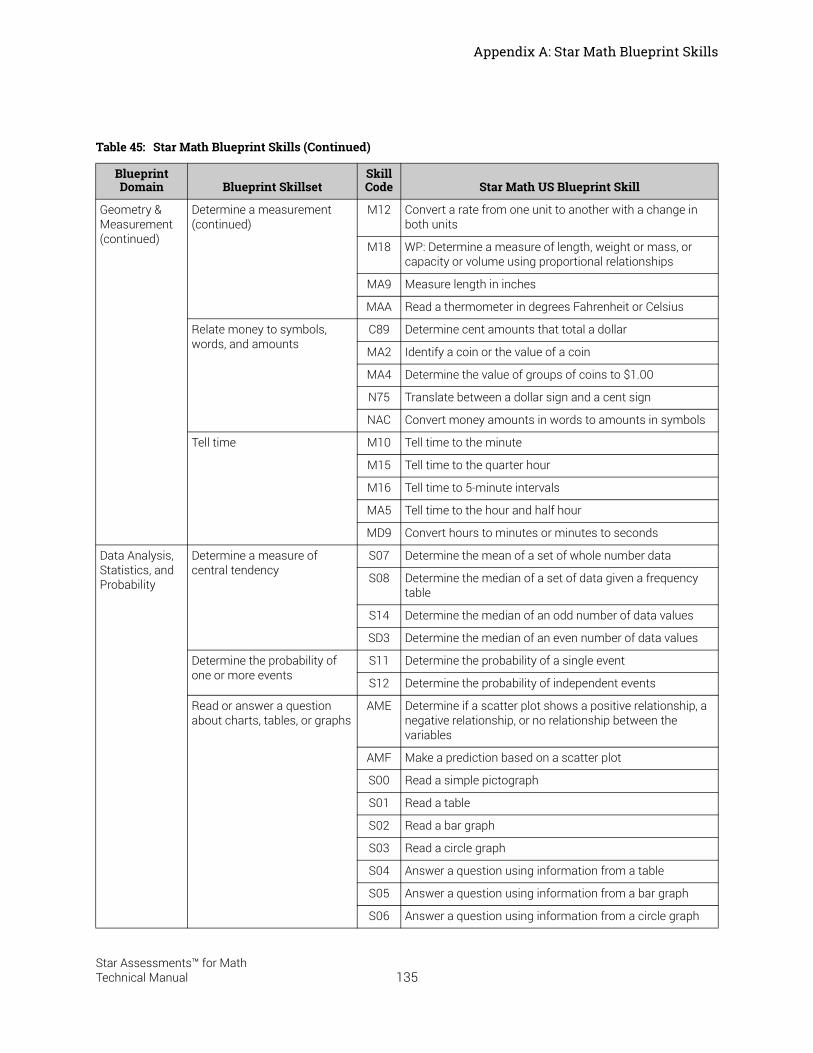
Appendix A: Star Math Blueprint Skills
Geometry & Measurement(continued)
Determine a measurement(continued)
M12 Convert a rate from one unit to another with a change in both units
M18 WP: Determine a measure of length, weight or mass, or capacity or volume using proportional relationships
MA9 Measure length in inches
MAA Read a thermometer in degrees Fahrenheit or Celsius
Relate money to symbols, words, and amounts
C89 Determine cent amounts that total a dollar
MA2 Identify a coin or the value of a coin
MA4 Determine the value of groups of coins to $1.00
N75 Translate between a dollar sign and a cent sign
NAC Convert money amounts in words to amounts in symbols
Tell time M10 Tell time to the minute
M15 Tell time to the quarter hour
M16 Tell time to 5-minute intervals
MA5 Tell time to the hour and half hour
MD9 Convert hours to minutes or minutes to seconds
Data Analysis, Statistics, and Probability
Determine a measure of central tendency
S07 Determine the mean of a set of whole number data
S08 Determine the median of a set of data given a frequency table
S14 Determine the median of an odd number of data values
SD3 Determine the median of an even number of data values
Determine the probability of one or more events
S11 Determine the probability of a single event
S12 Determine the probability of independent events
Read or answer a question about charts, tables, or graphs
AME Determine if a scatter plot shows a positive relationship, a negative relationship, or no relationship between the variables
AMF Make a prediction based on a scatter plot
S00 Read a simple pictograph
S01 Read a table
S02 Read a bar graph
S03 Read a circle graph
S04 Answer a question using information from a table
S05 Answer a question using information from a bar graph
S06 Answer a question using information from a circle graph
Table 45: Star Math Blueprint Skills (Continued)
Blueprint Domain Blueprint Skillset
Skill Code Star Math US Blueprint Skill
135Star Assessments™ for MathTechnical Manual

Appendix A: Star Math Blueprint Skills
Data Analysis, Statistics, and Probability (continued)
Read or answer a question about charts, tables, or graphs (continued)
S13 Answer a question using information from a line graph
S18 Answer a question using information from a pictograph (1 symbol = more than 1 object)
S19 Answer a question using information from a bar graph with a y-axis scale by 2s
S21 Read a double-bar graph
S22 Answer a question using information from a double-bar graph
S23 Answer a question using information from a circle graph using percentage calculations
S24 Answer a question using information from a histogram
SA1 Read a tally chart
SA2 Read a line graph
SD7 Read a 2-category tally chart
SD9 Answer a question using information from a 2-category tally chart
SDC Read a line plot
SDD Answer a question using information from a line plot
SE6 Answer a question using information from a scatter plot
Use a chart, table, or graph to represent data
S15 Use a circle graph to represent percentage data
S16 Use a histogram to represent data
S17 Use a pictograph to represent data (1 symbol = more than 1 object)
S20 Use a line graph to represent data
S26 Use a bar graph with a y-axis scale by 2s to represent data
SA3 Use a double-bar graph to represent data
SD1 Use a line plot to represent data
SD5 Use a scatter plot to organize data
SD8 Use a 2-category tally chart to represent groups of objects (1 symbol = 1 object)
Use a proportion to make an estimate
S25 Use a proportion to make an estimate, related to a population, based on a sample
Table 45: Star Math Blueprint Skills (Continued)
Blueprint Domain Blueprint Skillset
Skill Code Star Math US Blueprint Skill
136Star Assessments™ for MathTechnical Manual

Appendix B: Detailed Evidence of Star Math Validity
The Validity chapter of this technical manual places its emphasis on summaries of Star Math validity evidence, and on recent evidence which comes primarily from the 34-item, standards-based version of the assessment, which was introduced in 2011. However, the abundance of earlier evidence, and evidence related to the 24-item Star Math versions, is all part of the accumulation of technical support for the validity and usefulness of Star Math. Much of that cumulative evidence is presented in this appendix, to ensure that the historical continuity of research in support of Star Math validity is not lost. The material that follows touches on the following list of topics:
Relationship of Star Math Scores to Scores on Other Tests of Math Achievement
Relationship of Star Math Scores to Teacher Ratings
Linking Star and State Assessments: Comparing Student- and School-Level Data
Classification Accuracy and Screening Data Reported to The National Center on Response to Intervention (NCRTI)
Relationship of Star Math Scores to Scores on Other Tests of Math Achievement
The technical manual for the earliest version of Star Math listed correlations between scores on that test and those on a number of other standardized measures of math achievement, obtained in 1998 for more than 9,000 students who participated in Star Math norming for that version of the program. The standardized tests included a variety of well-established instruments, including the California Achievement Test (CAT), the Comprehensive Test of Basic Skills (CTBS), the Iowa Tests of Basic Skills (ITBS), the Metropolitan Achievement Test (MAT), the Stanford Achievement Test (SAT), and several statewide tests. During the development of Star Math Version 2, additional correlations with external tests were obtained from a total of more than 8,000 tests administered in 2000 and 2001.
During the 2014 norming of Star Math, scores on other standardized tests were obtained for more than 30,000 additional students. All of the standardized tests listed above were included, plus others such as Northwest Evaluation Association (NWEA) and TerraNova. Scores on state assessments
137Star Assessments™ for MathTechnical Manual

Appendix B: Detailed Evidence of Star Math ValidityRelationship of Star Math Scores to Scores on Other Tests of Math Achievement
from the following states were also included: Arkansas, Connecticut, Delaware, Florida, Georgia, Kentucky, Idaho, Indiana, Illinois, Maryland, Michigan, Minnesota, Mississippi, New York, North Carolina, Ohio, Oklahoma, Oregon, Pennsylvania, Rhode Island, South Dakota, Texas, Virginia, and Washington. The extent that the Star Math test correlates with these tests provides support for its construct validity. That is, strong and positive correlations between Star Math and these other instruments provide support for the claim that Star Math effectively measures mathematics achievement.
Tables 46 and 47 present the correlational data from the 2000–2001 development of Star Math 2. Table 46 lists the correlational details for 4,996 students in grades 1–6; Table 47 lists counterpart data for 3,066 students in grades 7–12.
Tables 48 through 51 present the correlation coefficients between the scores on the Star Math test and other test instruments subsequent to the Star Math 2 development in years ranging from 2002 through 2016. Tables 48 and 49 display “concurrent validity” data, that is, correlations between Star Math norming study test scores and other tests administered within a two-month time period. Tests listed in Tables 48 and 49 were administered between the fall of 2001 and the spring of 2013.
Tables 50 and 51 display predictive validity data from the same period. Predictive validity provides an estimate of the extent to which scores on the Star Math test predicted scores on criterion measures given at a later point in time, operationally defined as more than 2 months between the Star test (predictor) and the criterion test. It provides an estimate of the linear relationship between Star scores and scores on measures covering a similar academic domain.
Table 46: External Validity Data—Star Math 2.0 Correlation Coefficients (r) with External Tests Administered Prior to Spring 2002, Grades 1–6a
Test Version Date Score
1 2 3 4 5 6
n r n r n r n r n r n r
Achievement Level (RIT) Test
RIT F 01 SS – – – – – – – – – – 150 0.69*
California Achievement Test
CAT 5th Ed. S 01 SS – – – – 46 0.52* – – – – – –
Cognitive Abilities Test
CogAT F 00 SS – – – – 41 0.61* – – – – – –
CogAT F 01 SS – – 45 0.73* – – – – – – – –
138Star Assessments™ for MathTechnical Manual

Appendix B: Detailed Evidence of Star Math ValidityRelationship of Star Math Scores to Scores on Other Tests of Math Achievement
Comprehensive Test of Basic Skills
CTBS 4th Ed. S 01 GE – – – – – – 43 0.67* – – – –
CTBS A-13 S 00 NCE – – – – – – 65 0.60* – – – –
CTBS A-13 S 00 SS – – – – – – – – 44 0.70* – –
CTBS A-13 S 01 GE – – – – – – – – – – 56 0.69*
CTBS A-13 S 01 NCE – – – – – – – – 67 0.72* – –
CTBS A-13 S 01 SS – – – – – – 42 0.61* – – – –
Connecticut Mastery Test
Conn 2nd F 00 SS – – – – – – – – 35 0.51* – –
Conn 3rd F 01 SS – – – – – – 42 0.64* – – 27 0.52*
Des Moines Public School (Grade 2 pretest)
DMPS F 01 NCE – – 25 0.76* – – – – – – – –
Educational Development Series
EDS 13C S 01 GE – – – – 30 0.69* – – – – – –
EDS 14C S 00 GE – – – – – – 32 0.44* – – – –
EDS 15C F 01 GE – – – – – – – – 37 0.68* – –
Florida Comprehensive Assessment Test
FCAT S 01 NCE – – – – – – – – 73 0.65* – –
Iowa Tests of Basic Skills
ITBS Form A S 01 NCE – – – – 73 0.45* 78 0.65* – – – –
ITBS Form A F 01 NCE – – – – 25 0.41* 25 0.35 23 0.33 86 0.81*
ITBS Form A F 01 SS – – – – – – – – – – 73 0.64*
ITBS Form K F 00 SS – – – – – – – – – – 20 0.92*
ITBS Form K S 01 NCE – – 101 0.67* 74 0.64* 31 0.25 11 0.58 31 0.62*
ITBS Form K F 01 NCE – – – – 10 0.78* 16 0.78* 9 0.54 18 0.63*
ITBS Form K F 01 SS – – – – – – – – 75 0.77* 68 0.71*
ITBS Form L S 01 NCE – – – – 13 0.5 46 0.81* 13 0.73* – –
ITBS Form L S 01 SS – – – – – – 11 0.81* – – – –
ITBS Form L F 01 NCE – – – – – – – – 69 0.66* – –
ITBS Form M S 99 NCE – – – – – – – – – – 19 0.68*
ITBS Form M S 00 NCE – – – – – – – – 28 0.65* – –
Table 46: External Validity Data—Star Math 2.0 Correlation Coefficients (r) with External Tests Administered Prior to Spring 2002, Grades 1–6a (Continued)
Test Version Date Score
1 2 3 4 5 6
n r n r n r n r n r n r
139Star Assessments™ for MathTechnical Manual

Appendix B: Detailed Evidence of Star Math ValidityRelationship of Star Math Scores to Scores on Other Tests of Math Achievement
Iowa Tests of Basic Skills (continued)
ITBS Form M S 01 NCE – – 19 0.81* – – 43 0.78* – – – –
ITBS Form M S 01 SS – – – – 47 0.39* 32 0.55* – – – –
ITBS Form M F 01 NCE 5 0.88* – – – – 15 0.82* – – – –
McGraw Hill Mississippi/Criterion Referenced
McGraw S 01 SS – – – – – – – – 121 0.52* – –
Metropolitan Achievement Test
MAT 7th Ed. F 01 NCE – – – – – – – – – – 15 0.84*
Michigan Education Assessment Program
MEAP S 01 SS – – – – – – – – 88 0.72* – –
Multiple Assessment Series (Primary Grades)
Multiple S 01 NCE – – 14 0.52 19 0.54* – – – – – –
New York State Math Assessment
NYSMA S 01 SS – – – – – – – – 50 0.79* – –
North Carolina End of Grade
NCEOG F 01 SS – – – – 85 0.57* – – – – – –
Northwest Evaluation Association Levels Test
NWEA S 01 NCE – – – – – – – – 83 0.81* 64 0.78*
NWEA F 01 NCE – – – – 50 0.56* 49 0.54* 99 0.70* – –
Ohio Proficiency Test
Ohio S 01 SS – – – – 113 0.65* – – – – – –
Stanford Achievement Test
SAT9 S 99 SS – – – – – – – – 55 0.65* – –
SAT9 S 00 SS – – – – – – – – – – 15 0.5
SAT9 F 00 NCE – – – – 17 0.84* 20 0.83* – – – –
SAT9 F 00 SS – – – – – – – – – – 46 0.58*
SAT9 S 01 NCE – – – – 43 0.69* – – 50 0.38* – –
SAT9 S 01 SS 64 0.52* – – – – 58 0.41* 52 0.58* 51 0.65*
SAT9 F 01 SS – – – – – – 90 0.54* 32 0.67* 24 0.57*
Tennessee Comprehensive Assessment Program, 2001
TCAP 2001 S 01 SS – – – – – – – – 48 0.56* – –
Table 46: External Validity Data—Star Math 2.0 Correlation Coefficients (r) with External Tests Administered Prior to Spring 2002, Grades 1–6a (Continued)
Test Version Date Score
1 2 3 4 5 6
n r n r n r n r n r n r
140Star Assessments™ for MathTechnical Manual

Appendix B: Detailed Evidence of Star Math ValidityRelationship of Star Math Scores to Scores on Other Tests of Math Achievement
TerraNova
TerraNova S 00 NCE – – – – – – – – – – 43 0.60*
TerraNova S 00 SS – – – – – – – – 11 0.61* – –
TerraNova F 00 SS – – – – – – – – 108 0.62* – –
TerraNova S 01 NCE – – – – – – – – 69 0.40* 85 0.62*
TerraNova S 01 SS – – – – – – 104 0.50* 62 0.59* 131 0.71*
TerraNova F 01 NCE – – 58 0.38* 63 0.56* 70 0.74* 85 0.61* – –
Test of New York State Standards
TONYSS S 01 SS – – – – 55 0.75* 68 0.47* – – – –
Texas Assessment of Academic Skills
TAAS 2001 S 01 SS – – – – – – 78 0.52* – – – –
TAAS 2001 S 01 TLI – – – – – – – – – – 82 0.42*
Virginia Standards of Learning
Virginia S 00 SS – – – – – – – – 24 0.73* – –
Washington Assessment of Student Learning
Wash S 00 SS – – – – – – – – – – 90 0.54*
Wide Range Achievement Test
WRAT III F 01 NCE – – – – – – 44 0.32* 44 0.66* – –
Summary
Grade(s) All 1 2 3 4 5 6
Number of students 4,996 69 262 804 1,102 1,565 1,194
Number of coefficients 98 2 6 17 23 29 21
Average validity – 0.7 0.65 0.6 0.59 0.62 0.65
Overall average 0.62
a. n = Sample size.* Denote correlation coefficients that are statistically significant at the 0.05 level.
Table 46: External Validity Data—Star Math 2.0 Correlation Coefficients (r) with External Tests Administered Prior to Spring 2002, Grades 1–6a (Continued)
Test Version Date Score
1 2 3 4 5 6
n r n r n r n r n r n r
141Star Assessments™ for MathTechnical Manual

Appendix B: Detailed Evidence of Star Math ValidityRelationship of Star Math Scores to Scores on Other Tests of Math Achievement
Table 47: External Validity Data—Star Math 2.0 Correlation Coefficients (r) with External Tests Administered Prior to Spring 2002, Grades 7–12a
Test Version Date Score
7 8 9 10 11 12
n r n r n r n r n r n r
American College Testing Program
ACT F 01 NCE – – – – – – – – – – 26 0.87*
California Achievement Tests
CAT 5th Ed. F 01 NCE – – – – 64 0.73* – – – – – –
CAT 5th Ed. F 01 SS 170 0.54* – – – – – – – – – –
Comprehensive Test of Basic Skills
CTBS 4th Ed. S 00 SS 67 0.67* 75 0.73* – – – – – – – –
CTBS A-13 S 00 SS – – 31 0.65* – – – – – – – –
CTBS A-13 S 01 SS 23 0.82* – – – – 48 0.63* – – – –
Delaware Student Testing Program
DSTP S 01 SS – – – – 94 0.27* – – – – – –
Differential Aptitude Tests
DAT Level 1 F 01 NCE – – – – 41 0.70* – – – – – –
Explore Tests
Explore F 01 NCE – – 64 0.54* – – – – – – – –
Georgia High School Graduation Test
Georgia S 01 NCE – – – – – – – – – – 23 0.71*
Indiana Statewide Testing for Educational Progress
ISTEP F01 NCE – – – – 51 0.57* 22 0.58* – – – –
Iowa Tests of Basic Skills
ITBS Form A F 01 SS 66 0.71* – – – – – – – – – –
ITBS Form K S 01 NCE 73 0.80* 18 0.52* – – – – – – – –
ITBS Form K F 01 NCE 6 0.72 14 0.69* – – – – – – – –
ITBS Form L S 01 NCE 36 0.74* 32 0.53* – – 19 0.67* 32 0.84* – –
ITBS Form M S 99 NCE – – 5 0.89* – – – – 11 0.80* – –
ITBS Form M S 00 NCE – – – – – – 9 0.94* – – – –
ITBS Form M S 01 NCE 49 0.52* 48 0.51* – – – – – – – –
Kentucky Core Content Test
KCCT S 01 NCE – – – – 45 0.43* – – – – – –
Maryland High School Placement Test
Maryland S 01 NCE – – – – 47 0.60* – – – – – –
142Star Assessments™ for MathTechnical Manual

Appendix B: Detailed Evidence of Star Math ValidityRelationship of Star Math Scores to Scores on Other Tests of Math Achievement
McGraw Hill Mississippi/Criterion Referenced
McGraw S 01 SS – – – – 73 0.56* – – – – – –
Metropolitan Achievement Test
MAT 7th Ed. F 01 NCE 5 0.8 11 0.82* – – – – – – – –
North Carolina End of Grade Tests
NCEOG S 01 SS – – 177 0.59* – – – – – – – –
Oklahoma School Testing Program Core Curriculum Tests
Oklahoma S 01 SS – – – – 26 0.67* – – – – – –
Oregon State Assessment
Oregon S 01 NCE – – 45 0.53* – – – – – – – –
PLAN
PLAN F 99 SS – – – – – – – – – – – 0.42
PLAN F 00 SS – – – – – – – – 40 0.28 – –
PLAN F 01 NCE – – – – – – 63 0.61* – – – –
Preliminary SAT/National Merit Scholarship Qualifying Test
PSAT/NMSQT NMSQT F 00 NCE – – – – – – – – – – – 0.63*
PSAT/NMSQT NMSQT F 01 NCE – – – – – – – – 72 0.64* – –
Stanford Achievement Test
SAT9 S 98 NCE 11 0.84* – – – – – – – – – –
SAT9 S 99 NCE 14 0.71* – – – – – – – – – –
SAT9 F 00 SS – – 45 0.85* – – – – – – – –
SAT9 S 01 NCE 45 0.71* 105 0.81* 11 0.69* – – – – – –
SAT9 S 01 SS 54 0.76* 109 0.69* 19 0.27 77 0.59* 67 0.76* 71 0.65*
SAT9 F 01 SS 104 0.84* – – – – – – – – – –
TerraNova
TerraNova S 99 NCE 35 0.61* 47 0.62* – – – – – – – –
TerraNova S 00 SS 18 0.73* – – – – – – – – – –
TerraNova S 01 NCE 17 0.29 17 0.52* – – – – – – – –
TerraNova S 01 SS – – 99 0.74* – – – – – – – –
TerraNova F 01 SS – – 38 0.74* – – – – – – – –
Test of Achievement Proficiency
TAP F 01 NCE – – – – 8 0.7 7 0.7 – – – –
Table 47: External Validity Data—Star Math 2.0 Correlation Coefficients (r) with External Tests Administered Prior to Spring 2002, Grades 7–12a
Test Version Date Score
7 8 9 10 11 12
n r n r n r n r n r n r
143Star Assessments™ for MathTechnical Manual

Appendix B: Detailed Evidence of Star Math ValidityRelationship of Star Math Scores to Scores on Other Tests of Math Achievement
Texas Assessment of Academic Skills, 2001
TAAS 2001 S 01 SS 66 0.44* 69 0.33* – – – – – – – –
Virginia Standards of Learning
Virginia S 00 SS 25 0.71* – – – – – – – – – –
Summary
Grade(s) All 7 8 9 10 11 12
Number of students 3,066 930 1,049 479 245 222 141
Number of coefficients 66 20 19 11 7 5 4
Average validity – 0.67 0.65 0.56 0.67 0.66 0.6
Overall average 0.64
a. n = Sample size.* Denotes correlation coefficients that are statistically significant at the 0.05 level.
Table 48: Concurrent Validity Data—Star Math Correlation Coefficients (r) with External Tests Administered Between 2002 and 2016, Grades 1–6a
Test Form Date Score
1 2 3 4 5 6
n r n r n r n r n r n r
Arkansas Augmented Benchmark Examination (AABE)
AABE S 08 SS – – – – 725 0.68* 686 0.70* 634 0.70* 297 0.66*
ACT Aspire
ACT Aspire – Mathematics
S 14–16 SS – – – – 5212 0.78* 5005 0.76* 4796 0.78* 4311 0.77*
California Achievement Test (CAT) 5th Edition
CAT S 02 NCE – – – – 17 0.50* – – – – – –
CAT/5 F 10–11 SS 105 0.74* 166 0.64* 209 0.65* 242 0.54* 202 0.71* 186 0.66*
Canadian Achievement Test
CAT/2 F 10–11 SS – – – – – – 24 0.74* 21 0.63* – –
Comprehensive Test of Basic Skills (CTBS)
CTBS–A13 S 02 SS – – – – – – – – 21 0.66* – –
CTBS S 02 NCE – – – – – – – – – – 32 0.65*
Table 47: External Validity Data—Star Math 2.0 Correlation Coefficients (r) with External Tests Administered Prior to Spring 2002, Grades 7–12a
Test Version Date Score
7 8 9 10 11 12
n r n r n r n r n r n r
144Star Assessments™ for MathTechnical Manual

Appendix B: Detailed Evidence of Star Math ValidityRelationship of Star Math Scores to Scores on Other Tests of Math Achievement
Delaware Student Testing Program (DSTP)
DSTP S 03 SS – – – – 258 0.72* – – 296 0.73* – –
DSTP S 05 SS – – – – 66 0.67* – – – – – –
DSTP S 06 SS – – 140 0.66* 58 0.85* 40 0.63* 151 0.75* 44 0.77*
Florida Comprehensive Assessment Test (FCAT)
FCAT S 06 SS – – – – 58 0.85* 40 0.63* – – – –
FCAT S 06–08 SS – – – – 2,338 0.74* 2,211 0.74* 2,078 0.74* 279 0.65*
Florida Standards Assessments (FSA)
FSA S 15 SS – – – – 1,508 0.78* 1,944 0.79* 2,637 0.82* 1,434 0.84*
Georgia Milestones
Milestones – Mathematics
S 15 SS – – – – 11262 0.79* 10434 0.79* 10925 0.79 6732 0.79*
Idaho Standards Achievement Test (ISAT)
ISAT F 02 SS – – – – 192 0.68* 188 0.75* 194 0.75* 221 0.74*
ISAT S 03 SS – – – – 224 0.74* 209 0.83* 222 0.78* 231 0.82*
ISAT S 07–09 SS – – – – 798 0.70* 699 0.60* 727 0.62* 217 0.69*
Iowa Test of Basic Skills (ITBS)
ITBS–A S 02 NCE – – – – – – 50 0.66* 79 0.72* – –
ITBS–K S 02 SS – – – – – – – – – – 70 0.69*
ITBS–L S 02 NCE – – 7 0.78* 23 0.57* 17 0.70* 21 0.66* – –
ITBS–M S 02 NCE 14 0.56* 11 0.58* – – – – – – – –
ITBS–M S 02 SS – – – – 17 0.72* – – – – – –
Kansas State Assessment Program (KSAP)
KSAP S 06–08 SS – – – – 915 0.59* 947 0.67* 752 0.66* 402 0.67*
Kentucky Core Content Test (KCCT)
KCCT S 08–10 SS – – – – 3,777 0.69* 3,115 0.70* 2,228 0.66* 1,785 0.66*
Key Stage 2 Standardised Attainment Tests (KS2 SATs)
Maths S 16 SS – – – – – – – – 815 0.84* – –
Maths S 16 Raw – – – – – – – – 815 0.83* – –
McGraw Hill Mississippi/Criterion Referenced
S 02 SS – – – – – – – – 44 0.73* – –
Table 48: Concurrent Validity Data—Star Math Correlation Coefficients (r) with External Tests Administered Between 2002 and 2016, Grades 1–6a (Continued)
Test Form Date Score
1 2 3 4 5 6
n r n r n r n r n r n r
145Star Assessments™ for MathTechnical Manual

Appendix B: Detailed Evidence of Star Math ValidityRelationship of Star Math Scores to Scores on Other Tests of Math Achievement
Metropolitan Achievement Test (MAT)
MAT–6th Ed. S 02 NCE 69 0.55* – – – – – – – – – –
MAT–8th Ed. S 02 SS – – – – – – 38 0.83* – – – –
Michigan Educational Assessment Program (MEAP) – Mathematics
MEAP F 04 SS – – – – – – 154 0.81* – – – –
MEAP F 05 SS – – – – 71 0.75* 69 0.78* 77 0.83* 89 0.77*
MEAP F 06 SS – – – – 162 0.72* – – 53 0.67* 123 0.69*
Minnesota Comprehensive Assessment (MCA)
MCA S 03 SS – – – – 85 0.71* – – 81 0.76* – –
MCA S 04 SS – – – – 91 0.74* – – 83 0.73* – –
Mississippi Academic Assessment Program (MAAP)
MAAP – Mathematics
S 16 SS – – – – 2058 0.78* 1633 0.79* 2045 0.72* 2145 0.74*
Mississippi Curriculum Test (MCT2)
CTB S 02 SS – – – – – – 10 0.62* – – – –
CTB S 03 SS – – – – 117 0.71* 154 0.77* 119 0.78* 52 0.43*
MCT S 03 SS – – – – 117 0.71* 154 0.77* 110 0.78* 52 0.43*
MCT2 S 08 SS – – – – 1,786 0.72* 1,757 0.72* 1,531 0.73* 1,180 0.78*
Missouri Assessment Program (MAP) Grade-Level Tests
MAP – Mathematics
S 16 SS – – – – 4403 0.84* 4276 0.83* 4239 0.83* 2266 0.84*
New Jersey Assessment of Skills and Knowledge (NJASK)
NJASK S 13 SS – – – – 1,589 0.82* 1,715 0.82* 1,485 0.85* 389 0.76*
New York State Assessment Program
NYSTP S 13 SS – – – – 122 0.73* – – – – – –
North Carolina End-of-Grade (NCEOG) Test
NCEOG S 02 NCE – – – – 70 0.60*
NCEOG S 02 SS 62 0.73*
NCEOG S 06–08 SS – – – – 1,100 0.72* 751 0.72* 482 0.65* 202 0.77*
NCEOG S 14 SS – – – – 9,235 0.76* 8,324 0.76* 7,866 0.77* 4,618 0.78*
Table 48: Concurrent Validity Data—Star Math Correlation Coefficients (r) with External Tests Administered Between 2002 and 2016, Grades 1–6a (Continued)
Test Form Date Score
1 2 3 4 5 6
n r n r n r n r n r n r
146Star Assessments™ for MathTechnical Manual

Appendix B: Detailed Evidence of Star Math ValidityRelationship of Star Math Scores to Scores on Other Tests of Math Achievement
NWEA, NALT, & MAP
F 02 SS – – – – 81 0.75* – – 77 0.86* – –
S 03 SS – – – – 85 0.82* – – 80 0.85* – –
F 03 SS – – 77 0.69* 92 0.73* 75 0.82* 79 0.86* – –
S 04 SS – – 80 0.72* 92 0.84* 65 0.84* 82 0.86* – –
F 04 SS – – – – 63 0.53* 77 0.78* 86 0.84* – –
S 05 SS – – – – 63 0.74* 80 0.87* 96 0.87* – –
Ohio Achievement Assessment
OAA S 13 SS – – – – 1,725 0.76* 1,594 0.75* 1,605 0.76* 1,601 0.69*
Ohio State Tests (OST)
OST – Mathematics
S 16 SS – – – – 4397 0.82* 3870 0.83* 3514 0.80* 3752 0.77*
Oklahoma Core Curriculum Test (OCCT)
OCCT S 06 SS – – – – 77 0.71* 92 0.61* 66 0.68* 60 0.63*
Partnership for Assessment of Readiness for College and Careers (PARCC)
PARCC S 15 SS – – – – 4,103 0.8 4,787 0.83* 4,266 0.79* 5,050 0.8*
Pennsylvania System of School Assessment (PSSA)
PSSA S 02 SS – – – – – – – – – – 62 0.76*
PSSA S 13 SS – – – – 87 0.76* 76 0.86* 70 0.64* – –
South Dakota State Test of Educational Progress (DSTEP)
DSTEP S 08–10 SS – – – – 2,092 0.74* 1,555 0.74* 1,309 0.72* 837 0.74*
Stanford Achievement Test (SAT9)
SAT9 S 02 NCE – – 113 0.56* 39 0.83* 46 0.54* 103 0.70* 49 0.65*
SAT9 S 02 SS 20 0.76* 16 0.68* 18 0.59* 19 0.57* 71 0.49* 84 0.62*
Smarter Balanced Assessment (SBA)
SBA S 15 SS – – – – 608 0.85* 640 0.87* 513 0.85* 561 0.86*
SBA S 15 SS – – – – 10,800 0.84* 10,582 0.86* 9,750 0.86* 7,852 0.86*
State of Texas Assessments of Academic Readiness Standards Test 2
STAAR S 12–13 SS – – – – 5,794 0.73* 6,141 0.75* 5,538 0.71* 4,437 0.75*
STAAR S 11–14 SS – – – – 6,424 0.77* 6,138 0.76* 1,833 0.78* 5,331 0.73*
Table 48: Concurrent Validity Data—Star Math Correlation Coefficients (r) with External Tests Administered Between 2002 and 2016, Grades 1–6a (Continued)
Test Form Date Score
1 2 3 4 5 6
n r n r n r n r n r n r
147Star Assessments™ for MathTechnical Manual

Appendix B: Detailed Evidence of Star Math ValidityRelationship of Star Math Scores to Scores on Other Tests of Math Achievement
Tennessee Comprehensive Assessment Program (TCAP)
TCAP S 11 SS – – – – 35 0.78* – – – – – –
TCAP S 12 SS – – – – 72 0.76* 98 0.69* 74 0.85* – –
TCAP S 13 SS – – – – 172 0.74* 232 0.63* 286 0.68* – –
TerraNova
TerraNova S 02 NCE 7 0.66* 14 0.46* 125 0.68* 18 0.67* 17 0.79* 15 0.64*
TerraNova F 03 SS – – 177 0.55* 172 0.45* 119 0.67* 160 0.78* – –
TerraNova S 04 SS – – 150 0.75* 205 0.71* 149 0.71* 182 0.78* – –
Texas Assessment of Academic Achievement (TAAS)
TAAS S 01 SS – – – – 1,036 0.56* 1,047 0.50* 1,006 0.65* 991 0.61*
TAAS S 02 SS – – – – 674 0.65* 669 0.63* 677 0.64* 885 0.64*
Texas Assessment of Knowledge and Skills (TAKS)
TAKS S 03 SS – – – – 1,134 0.63* 1,129 0.62* 1,086 0.70* – –
Transitional Colorado Assessment Program (TCAP)
TCAP S 12–13 SS – – – – 3,185 0.84* 3,211 0.88* 3,183 0.89* 3,111 0.90*
West Virginia Educational Standards Test 2
WESTEST 2 S 12 SS – – – – 2,386 0.74* 2,725 0.75* 2,324 0.75* 1,153 0.73*
Wisconsin Forward Exam
WI Forward – Mathematics
S 16 SS – – – – 8720 0.79* 8255 0.76* 8047 0.73* 6941 0.82*
Wisconsin Knowledge and Concepts Examination (WKCE)
WKCE F 06–10 SS – – – – 1,322 0.71* 1,393 0.72* 1,801 0.73* 1,175 0.75*
Summary
Grade(s) All 1 2 3 4 5 6
Number of students 370,651 215 951 104,603 99,768 93,810 71,304
Number of coefficients 241 5 11 64 56 62 43
Average validity – 0.65 0.64 0.72 0.73 0.75 0.72
Overall average 0.73
a. n = Sample size.* Denotes correlation coefficients that are statistically significant at the 0.05 level.
Table 48: Concurrent Validity Data—Star Math Correlation Coefficients (r) with External Tests Administered Between 2002 and 2016, Grades 1–6a (Continued)
Test Form Date Score
1 2 3 4 5 6
n r n r n r n r n r n r
148Star Assessments™ for MathTechnical Manual

Appendix B: Detailed Evidence of Star Math ValidityRelationship of Star Math Scores to Scores on Other Tests of Math Achievement
Table 49: Concurrent Validity Data—Star Math Correlation Coefficients (r) with External Tests Administered Between 2002 and 2016, Grades 7–12a
Test Form Date Score
7 8 9 10 11 12
n r n r n r n r n r n r
Arkansas Augmented Benchmark Examination (AABE)
AABE S 08 SS 99 0.56* 74 0.77* – – – – – – – –
ACT
ACT – Mathematics
S 08– 15 SS – – – – 14 0.54* 177 0.47* 1278 0.66* 26 –0.04
ACT Aspire
ACT Aspire – Mathematics
S 14–16 SS 3351 0.81* 3377 0.82* 5083 0.65* 3981 0.76* – – – –
California Achievement Test (CAT) 5th Edition
CAT/5 F 10–11 SS 166 0.73* 129 0.64* 52 0.71* 33 0.68* – – – –
Delaware Student Testing Program (DSTP)
DSTP S 03 SS – – 254 0.78* – – – – – – – –
Florida Comprehensive Assessment Test (FCAT)
FCAT S 02 SS – – – – – – 51 0.64* 57 0.66* 38 0.75*
FCAT S 06–08 SS 195 0.65* 89 0.60* – – – – – – – –
Florida Standards Assessments (FSA)
FSA S 15 SS 1,211 0.82* 936 0.71* – – – – – – – –
Georgia Milestones
Milestones – Mathematics
S 15 SS 5877 0.77* 6049 0.74* – – – – – – – –
Idaho Standards Achievement Test (ISAT)
ISAT F 02 SS 206 0.81* 170 0.81* – – – – – – – –
ISAT S 03 SS 227 0.85* 174 0.82* – – – – – – – –
ISAT S 06–08 SS 289 0.71* 328 0.77* – – – – – – – –
Iowa Test of Basic Skills (ITBS)
ITBS–M S 02 SS 37 0.40* – – – – – – – – – –
Kansas State Assessment Program (KSAP)
KSAP S 06–08 SS 271 0.74* 137 0.75* – – – – – – – –
Kentucky Core Content Test (KCCT)
KCCT S 08–10 SS 788 0.68* 362 0.64* – – – – – – – –
Measures of Academic Progress (MAP)
MAP S 15 SS 413 0.82 646 0.82 – – – – – – – –
149Star Assessments™ for MathTechnical Manual

Appendix B: Detailed Evidence of Star Math ValidityRelationship of Star Math Scores to Scores on Other Tests of Math Achievement
Michigan Educational Assessment Program (MEAP) – Mathematics
MEAP F 05 SS 65 0.72* 71 0.80* – – – – – – – –
MEAP F 06 SS 122 0.84* 123 0.58* – – – – – – – –
Mississippi Academic Assessment Program (MAAP)
MAAP – Mathematics
S 16 SS 1417 0.73* 1185 0.70* – – – – – – – –
Mississippi Curriculum Test (MCT2)
MCT2 S 08 SS 721 0.66* 549 0.71* – – – – – – – –
Missouri Assessment Program (MAP) Grade-Level Tests
MAP – Mathematics
S 16 SS 1874 0.76* 1294 0.73* – – – – – – – –
New Standards Reference Mathematics Exam (Rhode Island)
NRSME S 02 SS – – – – – – – – 67 0.67* 9 0.66*
North Carolina End-of-Grade (NCEOG) Test
NCEOG S 06–08 SS 216 0.70* 39 0.81* – – – – – – – –
NCEOG S 14 SS 3,947 0.73* 3,302 0.72* – – – – – – – –
New Jersey Assessment of Skills and Knowledge (NJASK)
NJASK S 13 SS 620 0.79* 611 0.78* – – – – – – – –
Ohio Achievement Assessment
OAA S 13 SS 1,412 0.65* 1,380 0.65* – – – – – – – –
Ohio State Tests (OST)
OST – Mathematics
S 16 SS 3412 0.77* 2883 0.73* – – – – – – – –
Ohio Proficiency Test (OPT)
OPT S 02 SS – – – – 23 0.67* 26 0.40* 24 0.77* 24 0.69*
Oklahoma Core Curriculum Test (OCCT)
OCCT S 06 SS 55 0.63* 68 0.70* – – – – – – – –
Otis Lennon School Ability Test (OLSAT)
OLSAT S 02 NCE – – – – – – 12 0.36 13 0.91* 6 0.72*
Palmetto Achievement Challenge Test (PACT), 2001
PACT S 02 SS – – 161 0.72* – – – – – – – –
Partnership for Assessment of Readiness for College and Careers (PARCC)
PARCC S 15 SS 4,368 0.77* 4,196 0.75* – – – – – – – –
Table 49: Concurrent Validity Data—Star Math Correlation Coefficients (r) with External Tests Administered Between 2002 and 2016, Grades 7–12a (Continued)
Test Form Date Score
7 8 9 10 11 12
n r n r n r n r n r n r
150Star Assessments™ for MathTechnical Manual

Appendix B: Detailed Evidence of Star Math ValidityRelationship of Star Math Scores to Scores on Other Tests of Math Achievement
South Dakota State Test of Educational Progress (DSTEP)
DSTEP S 08–10 SS 525 0.73* 535 0.73* – – – – – – – –
Smarter Balanced Assessment (SBA)
SBA S 15 SS 569 0.82* 432 0.79* – – – – 55 0.52 – –
SBA S 15 SS 6,344 0.86* 5,424 0.83* – – – – – – – –
State of Texas Assessments of Academic Readiness Standards Test 2
STAAR S 12–13 SS 4,171 0.71* 3,379 0.68* – – – – – – – –
STAAR S 11–14 SS 4,437 0.74* – – – – – – – – – –
Texas Assessment of Academic Achievement (TAAS)
TAAS S 01 SS 892 0.60* 825 0.67* – – – – – – – –
TAAS S 02 SS 768 0.62* 809 0.68* – – – – – – – –
Texas Assessment of Academic Skills (TAAS), 2001
TAAS S 02 TLI – – – – 163 0.69* – – – – – –
Transitional Colorado Assessment Program (TCAP)
TCAP S 12–13 SS 3,173 0.90* 3,114 0.88* – – – – – – – –
West Virginia Educational Standards Test 2
WESTEST 2 S 12 SS 1,184 0.76* 1,215 0.69* – – – – – – – –
Wisconsin Forward Exam
WI Forward – Mathematics
S 16 SS 6855 0.74 6355 0.7 – – – – – – – –
Wisconsin Knowledge and Concepts Examination (WKCE)
WKCE F 06–10 SS 640 0.79* 767 0.76* – – 248 0.73* – – – –
Summary
Grade(s) All 7 8 9 10 11 12
Number of students 123,819 60,917 51,442 5,335 4,528 1,494 103
Number of coefficients 95 36 36 5 7 6 5
Average validity – 0.73 0.74 0.65 0.58 0.7 0.56
Overall average 0.71
a. n = Sample size.* Denotes correlation coefficients that are statistically significant at the 0.05 level.
Table 49: Concurrent Validity Data—Star Math Correlation Coefficients (r) with External Tests Administered Between 2002 and 2016, Grades 7–12a (Continued)
Test Form Date Score
7 8 9 10 11 12
n r n r n r n r n r n r
151Star Assessments™ for MathTechnical Manual

Appendix B: Detailed Evidence of Star Math ValidityRelationship of Star Math Scores to Scores on Other Tests of Math Achievement
Table 50: Predictive Validity Data—Star Math Correlation Coefficients (r) with External Tests Administered Between 2002 and 2016, Grades 1–6a
Test Form Date Score1 2 3 4 5 6
n r n r n r n r n r n rArkansas Augmented Benchmark Examination (AABE)
AABE F 07 SS – – – – 1,196 0.69* 1,128 0.67* 994 0.73* 638 0.71*
ACT Aspire
ACT Aspire S 14 SS – – – – 373 0.77* 392 0.67* 380 0.61* 359 0.70*
ACT Aspire – Mathematics
F 13–S 16 SS – – – – 5117 0.80* 4994 0.78* 5096 0.78* 4090 0.78*
Delaware Student Testing Program (DSTP)
DSTP F 02 SS – – – – 191 0.70* – – 228 0.70* – –
DSTP F 04 SS – – – – 171 0.67* – – – – – –
DSTP W 05 SS – – – – 149 0.76* – – – – – –
DSTP S 05 SS – – – – 132 0.64* 172 0.63* 185 0.62* – –
DSTP F 05 SS – – 206 0.64* 219 0.66* 249 0.67* 265 0.68* – –
DSTP W 05 SS – – 242 0.61* 226 0.61* 269 0.62* 277 0.68*
Florida Comprehensive Assessment Test (FCAT)
FCAT F 05 SS – – – – 54 0.79* 42 0.69* – – – –
FCAT F 05–07 SS – – – – 5,292 0.74* 5,020 0.73* 4,895 0.77* 1,015 0.66*
Florida Standards Assessments (FSA)
FSA S 15 SS – – – – 4,188 0.81* 4,133 0.82* 4,107 0.81* 1,398 0.84*
Georgia Milestones
Milestones – Mathematics
F 14–S 15 SS – – – – 8279 0.82* 7868 0.81* 7802 0.82* 6965 0.80*
Idaho Standards Achievement Test (ISAT)
ISAT F 08–10 SS – – – – 1,875 0.67* 1,908 0.63* 2,312 0.69* 1,809 0.73*
Iowa Assessment
IA F 12 SS – – – – 770 0.67* 885 0.65* 896 0.56* 732 0.48*
IA W 12 SS – – – – 1,299 0.61* 997 0.62* 923 0.58* 918 0.64*
IA S 12 SS – – – – 299 0.66* 301 0.67* 268 0.62* 204 0.62*
Kentucky Core Content Test (KCCT)
KCCT F 07–09 SS – – – – 5,821 0.68* 5,325 0.67* 4,199 0.66* 3,172 0.63*
Kentucky Performance Rating for Educational Progress (K-PREP)
K-PREP S 12 SS – – – – 557 0.82* 556 0.87* 537 0.85* 43 0.66*
Louisiana Educational Assessment Program (LEAP 2025)
LEAP 2025 – Mathematics
F 15–S 16 SS – – – – 1965 0.80* 1964 0.80* 1653 0.77* 703 0.80*
152Star Assessments™ for MathTechnical Manual
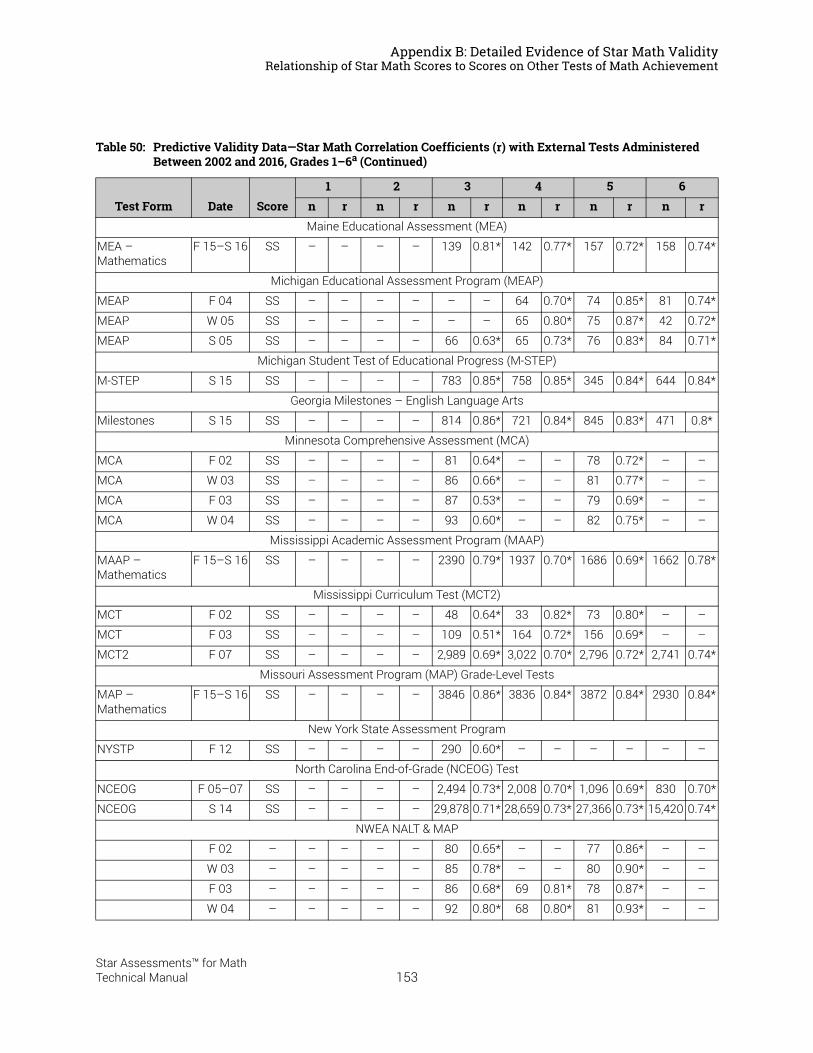
Appendix B: Detailed Evidence of Star Math ValidityRelationship of Star Math Scores to Scores on Other Tests of Math Achievement
Maine Educational Assessment (MEA)
MEA – Mathematics
F 15–S 16 SS – – – – 139 0.81* 142 0.77* 157 0.72* 158 0.74*
Michigan Educational Assessment Program (MEAP)
MEAP F 04 SS – – – – – – 64 0.70* 74 0.85* 81 0.74*
MEAP W 05 SS – – – – – – 65 0.80* 75 0.87* 42 0.72*
MEAP S 05 SS – – – – 66 0.63* 65 0.73* 76 0.83* 84 0.71*
Michigan Student Test of Educational Progress (M-STEP)
M-STEP S 15 SS – – – – 783 0.85* 758 0.85* 345 0.84* 644 0.84*
Georgia Milestones – English Language Arts
Milestones S 15 SS – – – – 814 0.86* 721 0.84* 845 0.83* 471 0.8*
Minnesota Comprehensive Assessment (MCA)
MCA F 02 SS – – – – 81 0.64* – – 78 0.72* – –
MCA W 03 SS – – – – 86 0.66* – – 81 0.77* – –
MCA F 03 SS – – – – 87 0.53* – – 79 0.69* – –
MCA W 04 SS – – – – 93 0.60* – – 82 0.75* – –
Mississippi Academic Assessment Program (MAAP)
MAAP – Mathematics
F 15–S 16 SS – – – – 2390 0.79* 1937 0.70* 1686 0.69* 1662 0.78*
Mississippi Curriculum Test (MCT2)
MCT F 02 SS – – – – 48 0.64* 33 0.82* 73 0.80* – –
MCT F 03 SS – – – – 109 0.51* 164 0.72* 156 0.69* – –
MCT2 F 07 SS – – – – 2,989 0.69* 3,022 0.70* 2,796 0.72* 2,741 0.74*
Missouri Assessment Program (MAP) Grade-Level Tests
MAP – Mathematics
F 15–S 16 SS – – – – 3846 0.86* 3836 0.84* 3872 0.84* 2930 0.84*
New York State Assessment Program
NYSTP F 12 SS – – – – 290 0.60* – – – – – –
North Carolina End-of-Grade (NCEOG) Test
NCEOG F 05–07 SS – – – – 2,494 0.73* 2,008 0.70* 1,096 0.69* 830 0.70*
NCEOG S 14 SS – – – – 29,878 0.71* 28,659 0.73* 27,366 0.73* 15,420 0.74*
NWEA NALT & MAP
F 02 – – – – – 80 0.65* – – 77 0.86* – –
W 03 – – – – – 85 0.78* – – 80 0.90* – –
F 03 – – – – – 86 0.68* 69 0.81* 78 0.87* – –
W 04 – – – – – 92 0.80* 68 0.80* 81 0.93* – –
Table 50: Predictive Validity Data—Star Math Correlation Coefficients (r) with External Tests Administered Between 2002 and 2016, Grades 1–6a (Continued)
Test Form Date Score1 2 3 4 5 6
n r n r n r n r n r n r
153Star Assessments™ for MathTechnical Manual

Appendix B: Detailed Evidence of Star Math ValidityRelationship of Star Math Scores to Scores on Other Tests of Math Achievement
Oklahoma Core Curriculum Test (OCCT)
OCCT F 05 SS – – – – 87 0.71* 88 0.61* 77 0.55* 83 0.56*
Ohio Achievement Assessment
OAA F 12 SS – – – – 47 0.82* 43 0.76* 34 0.71* 32 0.61*
Ohio State Tests (OST)
OST – Mathematics
F 15–S 16 SS – – – – 3846 0.83* 3588 0.84* 3255 0.81* 3371 0.80*
Partnership for Assessment of Readiness for College and Careers (PARCC)
PARCC S 15 SS – – – – 3,635 0.83* 4,008 0.83* 3,653 0.8* 4,150 0.82*
Pennsylvania System of School Assessment (PSSA)
PSSA S 12 SS – – – – 92 0.82* 84 0.88* 74 0.7* – –
PSSA F 12 SS – – – – 87 0.79* 74 0.81* 72 0.59* – –
PSSA F 12 SS – – – – 84 0.82* 70 0.79* 73 0.65* – –
PSSA W 13 SS – – – – 86 0.78* 74 0.81* 72 0.66* – –
PSSA W 13 SS – – – – 86 0.8* 75 0.85* 75 0.61* – –
PSSA S 13 SS – – – – 85 0.76* 74 0.84* 73 0.65* – –
PSSA S 13 SS – – – – 85 0.78* 69 0.84* 71 0.71* – –
PSSA S 15 SS – – – – 580 0.85* 717 0.84* 606 0.82* 575 0.85*
South Carolina College-and Career-Ready Assessments (SC READY)
SC READY – Mathematics
F 15–S 16 SS – – – – 2224 0.82* 2047 0.79* 1428 0.82* 1092 0.79*
South Dakota State Test of Educational Progress (DSTEP)
DSTEP F 07–09 SS – – – – 3,886 0.73* 3,665 0.75* 3,084 0.72* 2,328 0.75*
Smarter Balanced Assessment (SBA)
SBA F 14 SS – – – – 608 0.82* 640 0.81* 513 0.83* 561 0.82*
SBA W 14 SS – – – – 608 0.83* 640 0.84* 513 0.83* 561 0.84*
SBA S 15 SS – – – – 8,593 0.87* 8,571 0.88* 8,595 0.88* 8,575 0.88*
STAR Math
STAR–M F 01 SS – – – – 1,036 0.61* 1,047 0.63* 1,006 0.65* 991 0.65*
STAR–M F 05 SS 2,605 0.50* 7,195 0.63* 11,716 0.67* 13,295 0.69* 10,343 0.70* 6,823 0.75*
STAR–M F 06 SS 4,687 0.58* 12,464 0.62* 16,474 0.66* 17,161 0.70* 16,181 0.71* 12,026 0.73*
STAR–M F 05 SS 1,147 0.51* 3,181 0.62* 4,894 0.67* 5,254 0.70* 2,164 0.69* 1,474 0.74*
STAR–M F 05 SS 1,147 0.42* 3,181 0.57* 4,894 0.62* 5,254 0.64* 2,164 0.73* 1,474 0.80*
STAR–M S 06 SS 1,147 0.66* 3,181 0.69* 4,894 0.73* 5,254 0.74* 2,164 0.73* 1,474 0.80*
STAR–M S 06 SS 1,147 0.62* 3,181 0.63* 4,894 0.69* 5,254 0.70* 2,164 0.71* 1,474 0.78*
Table 50: Predictive Validity Data—Star Math Correlation Coefficients (r) with External Tests Administered Between 2002 and 2016, Grades 1–6a (Continued)
Test Form Date Score1 2 3 4 5 6
n r n r n r n r n r n r
154Star Assessments™ for MathTechnical Manual

Appendix B: Detailed Evidence of Star Math ValidityRelationship of Star Math Scores to Scores on Other Tests of Math Achievement
State of Texas Assessments of Academic Readiness Standards Test 2
STAAR F 11–12 SS – – – – 4,788 0.75* 4,945 0.76* 4,740 0.76* 4,353 0.74*
STAAR S 14–15 SS – – – – 4,744 0.8* 4,613 0.77* 3,878 0.77* 4,878 0.74*
Tennessee Comprehensive Assessment Program (TCAP)
TCAP F 10 SS – – – – 329 0.51* 305 0.58* 307 0.63* – –
TCAP F 11 SS – – – – 328 0.58* 229 0.60* 406 0.64* – –
TCAP F 12 SS – – – – 591 0.62* 522 0.65* 649 0.67* 290 0.75*
TCAP S 14 SS – – – – 127 0.82* 122 0.87* – – – –
Texas Assessment of Academic Achievement (TAAS)
TAAS F 01 SS – – – – 1,036 0.51* 1,047 0.42* 1,006 0.60* 991 0.61*
Texas Assessment of Knowledge and Skills (TAKS)
TAKS F 02 SS – – – – 262 0.64* 135 0.49* 228 0.70* 646 0.69*
TerraNova
TerraNova F 03 – – – 117 0.69* 165 0.58* 116 0.75* 154 0.54* – –
TerraNova W 04 – – – 128 0.58* 197 0.47* 120 0.71* 173 0.77* – –
West Virginia Educational Standards Test 2
WESTEST 2 F 11 SS – – – – 2,447 0.75* 2,536 0.77* 2,298 0.78* 1,533 0.77*
Wisconsin Forward Exam
WI Forward – Mathematics
F 15–S 16 SS – – – – 895 0.81* 800 0.79* 785 0.73* 711 0.84*
Wisconsin Knowledge and Concepts Examination (WKCE)
WKCE S 05–09 SS – – – – 4,645 0.66* 4,980 0.68* 5,345 0.74* 4,702 0.75*
SummaryGrade(s) All 1 2 3 4 5 6
Number of students 662,040 11,880 33,076 176,784 175,330 152,693 112,277
Number of coefficients 285 6 10 77 69 74 49
Average validity – 0.55 0.63 0.72 0.74 0.73 0.74
Overall average 0.72a. n = Sample size.
* Denotes correlation coefficients that are statistically significant at the 0.05 level.
Table 50: Predictive Validity Data—Star Math Correlation Coefficients (r) with External Tests Administered Between 2002 and 2016, Grades 1–6a (Continued)
Test Form Date Score1 2 3 4 5 6
n r n r n r n r n r n r
155Star Assessments™ for MathTechnical Manual

Appendix B: Detailed Evidence of Star Math ValidityRelationship of Star Math Scores to Scores on Other Tests of Math Achievement
Table 51: Predictive Validity Data—Star Math Correlation Coefficients (r) with External Tests Administered Between 2002 and 2016, Grades 7–12a
Test Form Date Score
7 8 9 10 11 12
n r n r n r n r n r n r
Arkansas Augmented Benchmark Examination (AABE)
AABE F 07 SS 369 0.67* 296 0.76* – – – – – – – –
ACT
ACT – Mathematics
F 07–S 15 SS – – – – 68 0.59* 1368 0.53* 4800 0.74* 92 0.43*
ACT Aspire
ACT Aspire S 14 SS 376 0.67* 349 0.79* – – – – – – – –
ACT Aspire – Mathematics
F 13–S 16 SS 4065 0.80* 4046 0.82* 5358 0.72* 4815 0.78* – – – –
Delaware Student Testing Program (DSTP)
DSTP F 02 SS 242 0.74* – – – – – – – – – –
DSTP S 05 SS 227 0.71* 175 0.75* – – – – – – – –
Florida Comprehensive Assessment Test (FCAT)
FCAT F 05–07 SS 783 0.72* 336 0.70* – – – – – – – –
Florida Standards Assessments (FSA)
FSA S 15 SS 1,267 0.83* 978 0.73* – – – – – – – –
Georgia Milestones
Milestones – Mathematics
F 14–S 15 SS 6743 0.79* 7088 0.76* – – – – – – – –
Idaho Standards Achievement Test (ISAT)
ISAT F 05–07 SS 588 0.75* 484 0.75* – – – – – – – –
Iowa Assessment
IA F 12 SS 809 0.61* 787 0.65* – – – – – – – –
IA W 12 SS 620 0.66* 470 0.73* – – – – – – – –
IA S 12 SS 172 0.67* 164 0.67* – – – – – – – –
Kentucky Core Content Test (KCCT)
KCCT F 07–09 SS 1,789 0.65* 1,153 0.59* – – – – – – – –
Kentucky Performance Rating for Educational Progress (K-PREP)
K-PREP S 12 SS 46 0.68* 323 0.78* – – – – – – – –
Louisiana Educational Assessment Program (LEAP 2025)
LEAP 2025 – Mathematics
F 15–S 16 SS 865 0.82* 563 0.74* – – – – – – – –
156Star Assessments™ for MathTechnical Manual

Appendix B: Detailed Evidence of Star Math ValidityRelationship of Star Math Scores to Scores on Other Tests of Math Achievement
Maine Educational Assessment (MEA)
MEA – Mathematics
F 15–S 16 SS 138 0.70* 161 0.61* – – – – – – – –
Michigan Educational Assessment Program (MEAP)
MEAP F 04 SS 56 0.78* – – – – – – – – – –
MEAP W 05 SS 56 0.78* – – – – – – – – – –
MEAP S 05 SS 37 0.86* – – – – – – – – – –
Michigan Student Test of Educational Progress (M-STEP)
M-STEP S 15 SS 1053 0.84* 677 0.8* – – – – – – – –
Georgia Milestones – English Language Arts
Milestones S 15 SS 453 0.8* 463 0.77* – – – – – – – –
Mississippi Academic Assessment Program (MAAP)
MAAP – Mathematics
F 15–S 16 SS 1644 0.77* 1635 0.75* – – – – – – – –
Mississippi Curriculum Test (MCT2)
MCT2 F 07 SS 2,127 0.71* 2,190 0.70* – – – – – – – –
Missouri Assessment Program (MAP) Grade-Level Tests
MAP – Mathematics
F 15–S 16 SS 2734 0.74* 2224 0.73* – – – – – – – –
North Carolina End-of-Grade (NCEOG) Test
NCEOG F 05–07 SS 443 0.78* 397 0.71* – – – – – – – –
NCEOG S 14 SS 1,267 0.83* 978 0.73* – – – – – – – –
Oklahoma Core Curriculum Test (OCCT)
OCCT F 05 SS 74 0.57* 70 0.67* – – – – – – – –
Ohio Achievement Assessment
OAA F 12 SS 60 0.63* 45 0.49* – – – – – – – –
Ohio State Tests (OST)
OST – Mathematics
F 15–S 16 SS 3029 0.80* 2593 0.76* – – – – – – – –
Partnership for Assessment of Readiness for College and Careers (PARCC)
PARCC S 15 SS 4,066 0.8* 3,748 0.76* – – – – – – – –
Table 51: Predictive Validity Data—Star Math Correlation Coefficients (r) with External Tests Administered Between 2002 and 2016, Grades 7–12a (Continued)
Test Form Date Score
7 8 9 10 11 12
n r n r n r n r n r n r
157Star Assessments™ for MathTechnical Manual

Appendix B: Detailed Evidence of Star Math ValidityRelationship of Star Math Scores to Scores on Other Tests of Math Achievement
Pennsylvania System School Assessment (PSSA)
PSSA – Mathematics
F 14–S 15 SS 532 0.83* 426 0.80* – – – – – – – –
South Carolina College-and Career-Ready Assessments (SC READY)
SC READY – Mathematics
F 15–S 16 SS 1077 0.78* 1041 0.76* – – – – – – – –
South Dakota State Test of Educational Progress (DSTEP)
DSTEP F 07–09 SS 1,851 0.74* 1,522 0.75* – – – – – – – –
Smarter Balanced Assessment (SBA)
SBA F 14 SS 569 0.81* 432 0.79* – – – – 55 0.5 – –
SBA W 14 SS 569 0.81* 432 0.77* – – – – 55 0.59 – –
SBA S 15 SS 4,066 0.8* 3,748 0.76* – – – – – – – –
STAR Math
STAR–M F 01 – 892 0.72* 825 0.78* – – – – – – – –
STAR–M F 05 – 3,551 0.75* 2,693 0.76* 668 0.79* 508 0.79* 572 0.79* 378 0.76*
STAR–M F 06 – 7,564 0.76* 7,122 0.77* 1,017 0.78* 876 0.76* 693 0.83* 507 0.77*
STAR–M F 05 – 1,191 0.75* 127 0.84* 215 0.78* 213 0.83* 164 0.75* – –
STAR–M F 05 – 1,191 0.71* 127 0.77* 215 0.78* 213 0.81* 164 0.75* – –
STAR–M S 06 – 1,191 0.79* 127 0.82* 215 0.80* 213 0.85* 164 0.79* – –
STAR–M S 06 – 1,191 0.77* 127 0.82* 215 0.76* 213 0.82* 164 0.77* – –
State of Texas Assessments of Academic Readiness Standards Test 2
STAAR F 11–12 SS 4,177 0.72* 3,508 0.72* – – – – – – – –
STAAR S 14–15 SS 4,350 0.76* – – – – – – – – – –
Tennessee Comprehensive Assessment Program (TCAP)
TCAP F 12 SS 273 0.80* 169 0.59* – – – – – – – –
Texas Assessment of Academic Achievement (TAAS)
TAAS F 01 SS 892 0.59* 825 0.67* – – – – – – – –
Texas Assessment of Knowledge and Skills (TAKS)
TAKS F 02 SS 564 0.74* 562 0.74* – – – – – – – –
West Virginia Educational Standards Test 2
WESTEST 2 F 11 SS 1,437 0.78* 1,377 0.72* – – – – – – – –
Table 51: Predictive Validity Data—Star Math Correlation Coefficients (r) with External Tests Administered Between 2002 and 2016, Grades 7–12a (Continued)
Test Form Date Score
7 8 9 10 11 12
n r n r n r n r n r n r
158Star Assessments™ for MathTechnical Manual

Appendix B: Detailed Evidence of Star Math ValidityRelationship of Star Math Scores to Teacher Ratings
Relationship of Star Math Scores to Teacher RatingsIn order to have a common measure of each student’s math skills independent of Star Math, Renaissance Learning constructed two 12-item checklists for teachers to use during the 2014 norming study.
On this worksheet, teachers were asked to rate each student’s ability to complete a wide range of tasks related to developing math skills. The intent of this checklist was to provide teachers with a single, brief instrument they could use to rate any student.
For simplicity, two rating forms were developed: one for grades 1–5, and another for grades 6–12. This section presents the skills rating instrument itself, its psychometric properties as observed in the norming study, and the relationship between student skills ratings on the instrument and their Scaled Scores on Star Math.
The Rating InstrumentsTo gather ratings of math skills from teachers, these instruments were intended to specify a sequence of skills that the teacher could quickly assess for each student. The skills were ordered such that a student who could correctly perform the nth skill in the list could almost certainly perform all of
Wisconsin Forward Exam
WI Forward – Mathematics
F 15–S 16 SS 667 0.74* 635 0.73* – – – – – – – –
Wisconsin Knowledge and Concepts Examination (WKCE)
WKCE S 05–09 SS 1,883 0.79* 1,742 0.76* – – 289 0.76* – – – –
Summary
Grade(s) All 7 8 9 10 11 12
Number of students 160,323 75,876 59,960 7,971 8,708 6,831 977
Number of coefficients 126 51 46 8 9 9 3
Average validity – 0.75 0.74 0.75 0.77 0.72 0.65
Overall average 0.74
a. n = Sample size.* Denotes correlation coefficients that are statistically significant at the 0.05 level.
Table 51: Predictive Validity Data—Star Math Correlation Coefficients (r) with External Tests Administered Between 2002 and 2016, Grades 7–12a (Continued)
Test Form Date Score
7 8 9 10 11 12
n r n r n r n r n r n r
159Star Assessments™ for MathTechnical Manual

Appendix B: Detailed Evidence of Star Math ValidityRelationship of Star Math Scores to Teacher Ratings
the preceding skills correctly as well. Such a list, even though quite short, provided a reliable method for sorting students from first through twelfth grade into an ordered set of math skill categories.
To construct the two ratings instruments, nineteen skill-related items were written, ranked from easiest to hardest, and assembled into two rating instruments. The first twelve items—the twelve easiest skills—formed the rating instrument used for grades 1–5. The eighth through nineteenth items—the twelve hardest skills—made up the instrument used for grades 6–12.
Each teacher was asked to dichotomously rate his or her students participating in the Star Math norming study on each skill using the rating form appropriate to the student’s grade. To assist with this process, the norming study software incorporated a feature enabling it to print a ratings worksheet for each participating grade. The printed ratings worksheet consisted of a checklist of the twelve skill-related performance tasks, pre-printed with the names of the participating students. To complete the instrument, the teacher had to simply mark, for each student, any task he or she believed the student could perform. The items forming both rating forms are shown on the following page.
160Star Assessments™ for MathTechnical Manual

Appendix B: Detailed Evidence of Star Math ValidityRelationship of Star Math Scores to Teacher Ratings
Grade 1–5 Math Skills Rating Worksheet
In the table below, please identify which of the following tasks each of your students can probably do correctly.
1. Identify the longest pencil among 3 pencils of different lengths.
2. Add 2 to 4.
3. State how many cents a dime is worth.
4. Determine the number that shows “ones” in 162.
5. Subtract 7 from 35.
6. Determine the number that follows in the sequence 2, 6, 10, 14, _____.
7. Divide 18 by 3.
8. Write 78,318 in expanded form.
9. Read aloud the word name for 0.914.
10. Solve the problem 4/9 + 8/9.
11. Translate the statement “36 divided by a number is 12” into an equation.
12. Divide 11,540 by 577.
Grade 6–12 Math Skills Rating Worksheet
In the table below, please identify which of the following tasks each of your students can probably do correctly.
1. Write 78,318 in expanded form.
2. Read aloud the word name for 0.914.
3. Solve the problem 4/9 + 8/9.
4. Translate the statement “36 divided by a number is 12” into an equation.
5. Divide 11,540 by 577.
6. Solve a word problem requiring the calculation of proportions.
7. Solve the problem “14 is 50% of what number?”
8. Solve a word problem requiring the calculation of 80% of 112.
9. Simplify the expression (x + 1)(x + 4)
10. Solve the equation x2 = 16x.
11. Calculate vertical and supplementary angles.
12. Determine 6–2.
161Star Assessments™ for MathTechnical Manual

Appendix B: Detailed Evidence of Star Math ValidityRelationship of Star Math Scores to Teacher Ratings
Participating teachers were asked to complete the following rating checklist for all students in their math class:
Psychometric Properties of the Skills RatingsTeachers completed skills ratings for 17,326 of the 29,185 students in the US norms group. The skills rating items were calibrated on an IRT scale using the Rasch model, with item parameters from both levels placed on a common scale. This allowed the skills ratings for students at both levels to be assigned a score on the same Rasch metric.
The resulting Rasch scores ranged from –14.47 to 11.1. The lower value corresponds to students in grades 1 to 5 rated as possessing none of the math skills, and the higher value corresponds to students in grades 6–12 rated as possessing all of them. Table 52 on page 163 lists data about the psychometric properties of the rating scale, overall and by grade, including the correlations between skills ratings and Star Math Scaled Scores. The internal consistency reliability of the rating scale was estimated as 0.93, using Cronbach’s alpha.
Student No. Student Name
Mark an “X” for the tasks that each student probably can do correctly and an “O” for the tasks that each student probably cannot do correctly:
1 2 3 4 5 6 7 8 9 10 11 12Not
Rated
1 Bartles, Amanda
2 Bowers, Erica
3 Driggon, Haley
4 Edmond, Mason
5 Edwards, Robert
6 Halstead, Matthew
7 Jackson, Wesley
8 Kendricks, Marcy
9 Lyons, Freda
162Star Assessments™ for MathTechnical Manual

Appendix B: Detailed Evidence of Star Math ValidityRelationship of Star Math Scaled Scores to Math Skills Ratings
Relationship of Star Math Scaled Scores to Math Skills Ratings
As the data in Table 52 show, the mean ratings increased directly with grade, from 6.6 at grade 1 to 10.03 at grade 12. The correlation between the skills ratings and Star Math Scaled Scores was significant at every grade level. The overall correlation was 0.85, indicating a substantial degree of relationship between the computer-adaptive Star Math test and teachers’ ratings of their students’ math skills.
Figure 5 displays the relationships of each of the nineteen rating scale items to Star Math Scaled Scores. These relationships were obtained by fitting mathematical models to the response data for each of the rating items. Each of the curves in the figure is a graphical depiction of the respective model. As the curves show, the proportion of students rated as possessing each of the 19 rated skills increases with the Star Math Scaled Score.
Table 52: Psychometric Characteristics of the Skills Rating Scale and its Relationship to Scaled Scores, by Grade
Grade N
Skills RatingSTAR Math
Scaled Score Correlation of Skills Ratings and Scaled
Scoresa
a. Asterisks denote correlation coefficients that are statistically significant at the 0.05 level.
Mean S.D. Mean S.D.
1 1,916 –6.60 2.95 385 89 0.40*
2 2,043 –3.67 2.41 503 84 0.47*
3 1,817 0.04 3.06 589 87 0.52*
4 1,820 1.26 2.83 651 90 0.58*
5 2,072 2.97 2.84 713 97 0.50*
6 1,637 5.5 2.07 763 100 0.44*
7 1,465 5.57 2.18 785 109 0.50*
8 1,639 6.96 2.5 811 117 0.54*
9 1,036 6.88 2.87 798 110 0.52*
10 688 8.78 2.38 824 119 0.38*
11 737 9.81 2.3 847 123 0.39*
12 456 10.03 2.05 876 127 0.42*
Overall 17,326 2.42 5.6 672 177 0.85*
163Star Assessments™ for MathTechnical Manual

Appendix B: Detailed Evidence of Star Math ValidityRelationship of Star Math Scaled Scores to Math Skills Ratings
Figure 5: The Relationship of Teachers’ Ratings of Student Math Skills to Star Math Scaled Scores
The relative positions of the curves provide one indication of the relative difficulty of the 19 rated skills. The rating items’ Rasch difficulty parameters, displayed in Table 53 on page 165, provide a somewhat different indication; the skills rating items are listed in the table from easiest to most difficult, by Rasch difficulty. The first column of Table 53 indicates the relative difficulty of the nineteen rating items, where relative difficulty 1 is the easiest and 19 is most difficult. The second and third columns list the item numbers and text of the skills rating items. The fourth column lists the Rasch difficulty scale value for each item.
The fifth column lists the correlations between students’ ratings and their Star Math Scaled Scores.
164Star Assessments™ for MathTechnical Manual
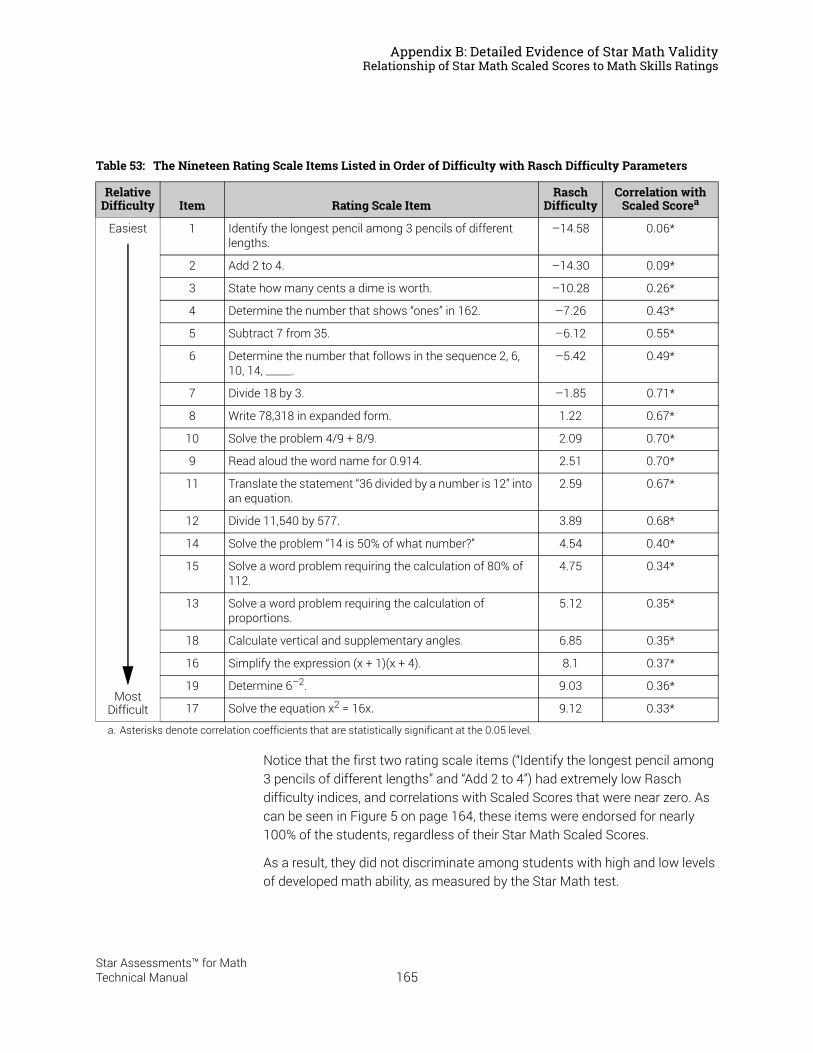
Appendix B: Detailed Evidence of Star Math ValidityRelationship of Star Math Scaled Scores to Math Skills Ratings
Notice that the first two rating scale items (“Identify the longest pencil among 3 pencils of different lengths” and “Add 2 to 4”) had extremely low Rasch difficulty indices, and correlations with Scaled Scores that were near zero. As can be seen in Figure 5 on page 164, these items were endorsed for nearly 100% of the students, regardless of their Star Math Scaled Scores.
As a result, they did not discriminate among students with high and low levels of developed math ability, as measured by the Star Math test.
Table 53: The Nineteen Rating Scale Items Listed in Order of Difficulty with Rasch Difficulty Parameters
Relative Difficulty Item Rating Scale Item
Rasch Difficulty
Correlation with Scaled Scorea
a. Asterisks denote correlation coefficients that are statistically significant at the 0.05 level.
Easiest
Most Difficult
1 Identify the longest pencil among 3 pencils of different lengths.
–14.58 0.06*
2 Add 2 to 4. –14.30 0.09*
3 State how many cents a dime is worth. –10.28 0.26*
4 Determine the number that shows “ones” in 162. –7.26 0.43*
5 Subtract 7 from 35. –6.12 0.55*
6 Determine the number that follows in the sequence 2, 6, 10, 14, _____.
–5.42 0.49*
7 Divide 18 by 3. –1.85 0.71*
8 Write 78,318 in expanded form. 1.22 0.67*
10 Solve the problem 4/9 + 8/9. 2.09 0.70*
9 Read aloud the word name for 0.914. 2.51 0.70*
11 Translate the statement “36 divided by a number is 12” into an equation.
2.59 0.67*
12 Divide 11,540 by 577. 3.89 0.68*
14 Solve the problem “14 is 50% of what number?” 4.54 0.40*
15 Solve a word problem requiring the calculation of 80% of 112.
4.75 0.34*
13 Solve a word problem requiring the calculation of proportions.
5.12 0.35*
18 Calculate vertical and supplementary angles. 6.85 0.35*
16 Simplify the expression (x + 1)(x + 4). 8.1 0.37*
19 Determine 6–2. 9.03 0.36*
17 Solve the equation x2 = 16x. 9.12 0.33*
165Star Assessments™ for MathTechnical Manual

Appendix B: Detailed Evidence of Star Math ValidityLinking Star and State Assessments: Comparing Student- and School-Level Data
Although teachers endorsed items 3–6 somewhat less often than items 1 and 2, they still considered these math tasks relatively easy for their students to complete. The correlations with Star Math Scaled Scores for items 3–6 were higher than those for the first two items, but still only moderate. This may have occurred because the skills associated with items 3–6 are almost completely mastered (defined as 80% proficiency) by a student obtaining a Star Math Scaled Score of 500.
Teachers’ responses to items 7–12 suggest that their corresponding math tasks are considerably more difficult for their students to complete. This is reflected both in their Rasch difficulty parameters in Table 53 on page 165 and in Figure 5 on page 164. The figure suggests that mastery of these skills occurs between 700 and 800 on the Star Math Score Scale. The slopes of the curves for these are all steep relative to other skills items, suggesting that these skills develop rapidly, compared to the others. The correlations between these items and Scaled Scores support this hypothesis, as items 7–12 show the highest correlations with Star Math Scaled Scores.
Items 13–19 measure the most difficult of the skills. This is indicated by their Rasch difficulty parameters in Table 53 and is also confirmed by the locations at which 80% mastery occurs, illustrated in Figure 5, which suggests that these skills develop much later than all others. In fact, all students may not master these skills. Moreover, all of these items have only moderate correlations with Star Math Scaled Scores, suggesting that growth of these skills is relatively gradual.
Linking Star and State Assessments: Comparing Student- and School-Level Data
With an increasingly large emphasis on end-of-the-year summative state tests, many educators seek out informative and efficient means of gauging student performance on state standards—especially those hoping to make instructional decisions before the year-end assessment date.
For many teachers, this is an informal process in which classroom assessments are used to monitor student performance on state standards. While this may be helpful, such assessments may be technically inadequate when compared to more standardized measures of student performance. Recently the assessment scale associated with Star Math has been linked to the scales used for summative mathematics tests in nearly every state in the US. Linking Star Math assessments to state tests allows educators to reliably predict student performance on their state assessment using Star Math scores. More specifically, it places teachers in a position to identify
166Star Assessments™ for MathTechnical Manual

Appendix B: Detailed Evidence of Star Math ValidityLinking Star and State Assessments: Comparing Student- and School-Level Data
which students are on track to succeed on the year-end summative state test, and
which students might need additional assistance to reach proficiency.
Educators using Star Math assessments can access Star Performance Reports that allow access to students’ Pathway to Proficiency. These reports indicate whether individual students or groups of students (by class, grade, or demographic characteristics) are likely to be on track to meet a particular state’s criteria for mathematics proficiency. In other words, these reports allow instructors to evaluate student progress toward proficiency and make data-based instructional decisions well in advance of the annual state tests. Additional reports automatically generated by Star Math help educators screen for later difficulties and progress monitor students’ responsiveness to interventions.
An overview of two methodologies used for linking Star Math to state assessments is provided in the following sections.
Methodology ComparisonRenaissance Learning has developed linkages between Star Math Scaled Scores and scores on the accountability tests of most states. Depending on the kind of data available for such linking, these linkages have been accomplished using one of two different methods. One method used student-level data, where both Star and state test scores were available for the same students. The other method used school-level data; this method was applied when approximately 100% of students in a school had taken Star Math, but individual students’ state test scores were not available.
Student-Level Data
Using individual data to link scores between distinct assessments is commonly used when student-level data are readily available for both assessments. In this case, the distribution of standardized scores on one test (e.g. percentile ranks) may be compared to the distribution of standardized scores on another test in an effort to establish concordance. When available, individual state test data for linking purposes allowed for the comparison of Star assessments to state test scores. Star test comparison scores were obtained within an eight-week window around the median state test date (+/–4 weeks).
Typically, states classify students into one of three, four, or five performance levels on the basis of cut scores (e.g. Below Basic, Basic, Proficient, or Advanced). After each testing period, a distribution of students falling into
167Star Assessments™ for MathTechnical Manual

Appendix B: Detailed Evidence of Star Math ValidityLinking Star and State Assessments: Comparing Student- and School-Level Data
each of these categories will always exist (e.g. 30% in Basic, 25% in Proficient, etc.). Because Star data were available for the same students who completed the state test, the distributions could be linked via equipercentile linking analysis (see Kolen & Brennan, 2004) to scores on the state test. This process creates tables of approximately equivalent scores on each assessment, allowing for the lookup of Star scale scores that correspond to the cut scores for different performance levels on the state test. For example, if 20% of students were “Below Basic” on the state test, the lowest Star cut score would be set at a score that partitioned only the lowest 20% of scores.
School-Level Data
While using student-level data is still common, obstacles associated with individual data often lead to a difficult and time-consuming process of obtaining and analyzing data. In light of the time-sensitive needs of schools, obtaining student-level data is not always an option. As an alternative, school-level data may be used in a similar manner. These data are publicly available, thus making the linking process more efficient.
School-level data were analyzed for some of the states included in the student-level linking analysis. In an effort to increase sample size, the school-level data presented here represent “projected” Scaled Scores. Each Star score was projected to the mid-point of the state test administrations window using decile-based growth norms. The growth norms are both grade- and subject-specific and are based on the growth patterns of more than one million students using Star assessments over a three-year period. Again, the linking process used for school-level data is very similar to the previously described process—the distribution of state test scores is compared to projected Star scores and using the observed distribution of state-test scores, equivalent cut scores are created for the Star assessments (the key difference being that these comparisons are made at the group level).
Accuracy ComparisonsAccuracy comparisons between student- and school-level data are particularly important given the marked resource differences between the two methods. These comparisons are presented for three states10 in Tables 54–56. With few exceptions, results of linking using school-level data were nearly identical to student-level data on measures of specificity, sensitivity, and overall accuracy. McLaughlin and Bandeira de Mello (2002) employed similar methods in their
10.Data were available for Arkansas, Florida, Idaho, Kansas, Kentucky, Mississippi, North Carolina, South Dakota, and Wisconsin; however, only North Carolina, Mississippi, and Kentucky are included in the current analysis.
168Star Assessments™ for MathTechnical Manual

Appendix B: Detailed Evidence of Star Math ValidityLinking Star and State Assessments: Comparing Student- and School-Level Data
comparison of NAEP scores and state assessment results, and this method has been used several times since then (McLaughlin & Bandeira de Mello, 2003; Bandeira de Mello, Blankenship, & McLaughlin, 2009; Bandeira et al., 2008).
In a similar comparison study using group-level data, Cronin et al. (2007) observed cut score estimates comparable to those requiring student-level data.
Table 54: Number of Students Included in Student-Level and School-Level Linking Analyses by State, Grade, and Subject
State Grade
Math
Student School
NC 3 1,100 524
4 751 890
5 482 551
6 202 515
7 216 67
8 39 372
MS 3 1,786 4,309
4 1,757 4,584
5 1,531 5,294
6 1,180 5,190
7 721 3,390
8 549 1,896
KY 3 3,777 935
4 3,155 1,797
5 2,228 1,430
6 1,785 1,497
7 788 984
8 362 1,036
169Star Assessments™ for MathTechnical Manual

Appendix B: Detailed Evidence of Star Math ValidityLinking Star and State Assessments: Comparing Student- and School-Level Data
Table 55: Comparison of School Level and Student Level Classification Diagnostics for Mathematics
State Grade
Sensitivitya
a. Sensitivity refers to the proportion of correct positive predictions.
Specificityb
b. Specificity refers to the proportion of negatives that are correctly identified (e.g. student will not meet a particular cut score).
False + Ratec
c. False + rate refers to the proportion of students incorrectly identified as “at-risk.”
False – Rated
d. False – rate refers to the proportion of students incorrectly identified as not “at-risk.”
Overall Rate
Student School Student School Student School Student School Student School
NC 3 92% 81% 53% 73% 47% 27% 8% 19% 80% 78%
4 90% 78% 52% 73% 48% 27% 10% 22% 80% 78%
5 83% 83% 62% 57% 38% 43% 17% 17% 75% 74%
6 94% 87% 42% 65% 58% 35% 6% 13% 74% 83%
7 91% 88% 61% 69% 39% 31% 9% 12% 81% 84%
8 89% 77% 58% 76% 42% 24% 11% 23% 77% 77%
MS 3 78% 70% 77% 83% 23% 17% 22% 30% 77% 76%
4 73% 73% 81% 81% 19% 19% 27% 27% 77% 77%
5 71% 68% 83% 84% 17% 16% 29% 32% 77% 76%
6 71% 66% 81% 85% 19% 15% 29% 34% 76% 76%
7 83% 84% 82% 81% 18% 19% 17% 16% 83% 83%
8 56% 66% 89% 83% 11% 17% 44% 34% 76% 76%
KY 3 95% 92% 45% 54% 55% 46% 5% 8% 83% 83%
4 92% 87% 47% 60% 53% 40% 8% 13% 80% 80%
5 90% 90% 51% 50% 49% 50% 10% 10% 77% 77%
6 82% 80% 64% 68% 36% 32% 18% 20% 75% 75%
7 72% 68% 81% 85% 19% 15% 28% 32% 76% 76%
8 59% 66% 89% 85% 11% 15% 41% 34% 74% 76%
170Star Assessments™ for MathTechnical Manual

Appendix B: Detailed Evidence of Star Math ValidityLinking Star and State Assessments: Comparing Student- and School-Level Data
Table 56: Comparison of Differences Between Achieved and Forecasted Performance Levels in Math (Forecast % – Achieved %)
State Grade Student School Student School Student School Student School
NC Level I Level II Level III Level IV
3 –2.6% –1.6% –2.8% 0.80% 15.60% 2.10% –10.2% –1.3%
4 –4.0% –0.4% –2.5% 1.20% 14.70% 1.50% –8.2% –2.3%
5 –2.7% –0.9% 1.60% –3.9% 10.00% 11.60% –8.9% –6.7%
6 –7.3% –5.3% –8.2% –4.5% 18.60% 7.10% –3.1% 2.70%
7 –1.3% –0.6% –5.0% –1.1% 15.10% 1.10% –8.8% 0.60%
8 –4.2% –4.4% –5.6% –2.9% 2.50% –1.2% 7.40% 8.60%
MS Minimal Basic Proficient Advanced
3 2.70% 10.10% 0.00% 0.20% 1.10% –15.0% –3.9% 4.60%
4 1.50% 9.90% 4.40% –3.4% –3.7% –10.7% –2.1% 4.20%
5 0.80% 9.40% 5.30% –1.0% –3.5% –11.3% –2.7% 2.80%
6 4.70% 12.60% –0.8% –4.3% –1.8% –11.6% –2.1% 3.30%
7 0.70% 2.80% –0.5% –3.7% 0.00% –1.8% –0.2% 2.80%
8 5.80% 7.00% 4.60% –4.4% –9.9% –4.1% –0.5% 1.50%
KY Novice Apprentice Proficient Distinguished
3 –3.2% –2.0% –4.8% –2.6% 12.10% 3.30% –4.0% 1.40%
4 –4.1% –2.7% –3.9% 1.00% 5.60% 1.60% 2.40% 0.10%
5 –3.7% –0.2% –5.4% –9.7% 11.40% 8.40% –2.3% 1.60%
6 –3.9% –0.4% 0.10% –0.5% 5.80% 0.50% –2.1% 0.20%
7 –1.9% 7.10% 10.50% 3.60% 1.20% –3.0% –9.6% –7.5%
8 1.50% 4.30% 13.80% 4.90% –5.0% –1.9% –10.2% –7.3%
171Star Assessments™ for MathTechnical Manual

References
Allington, R., & McGill-Franzen, A. (2003). Use students’ summer-setback months to raise minority achievement. Education Digest, 69(3), 19–24.
Alonzo, A. C., & Gearhart, M. (2006). Considering learning progressions from a classroom assessment perspective. Measurement, 14(1 & 2), 99–104.
Bandeira de Mello, V., Blankenship, C., & McLaughlin, D. H. (2009). Mapping state proficiency standards onto NAEP Scales: 2005–2007 (NCES 2010-456). Washington, DC: National Center for Education Statistics, Institute of Education Sciences, U.S. Department of Education.
Betebenner, D. W. (2009). Norm- and criterion-referenced student growth. Educational Measurement: Issues and Practice, 28(4), 42–51.
Betebenner, D. W. (2010). New directions for student growth models. Retrieved from the National Network of State Teachers of the Year (NNSTOY) website: https://www.nnstoy.org/download/evalution/LinkClick%20Betebenner.pdf
Betebenner, D. W., & Iwaarden, A. V. (2011a). SGP: An R package for the calculation and visualization of student growth percentiles [Computer Software manual]. (R package version 0.4-0.0 available at http://cran.r-project.org/web/packages/SGP/)
Betebenner, D. W. (2011b). A technical overview of the student growth percentile methodology: Student growth percentiles and percentile growth trajectories/projections. The National Center for the Improvement of Educational Assessment. Retrieved from http://www.nj.gov/education/njsmart/performance/SGP_Technical_Overview.pdf
Bock, R. D., Thissen, D., & Zimowski, M. F. (1997). IRT estimation of domain scores. Journal of Educational Measurement, 34, 197–211.
Bracey, G. (2002). Summer loss: The phenomenon no one wants to deal with. Phi Delta Kappan, 84(1), 12–13.
Corcoran, T., Mosher, F. A., & Rogat, A. (2009). Learning progressions in science: An evidence-based approach to reform of teaching. (CPRE Research Report # RR-63). New York: Consortium for Policy Research.
Cormier, D. & Bulut, O. (Manuscript under review.) Using computer-adaptive tests to monitor student progress: optimal slope estimates, administration frequency, and data points.
Cronin, J., Kingsbury, G. G., Dahlin, M., & Bowe, B. (2007). Alternate methodologies for estimating state standards on a widely used computer
172Star Assessments™ for MathTechnical Manual

References
adaptive test. Paper presented at the American Educational Research Association, Chicago, IL.
Deno, S. (2003). Developments in curriculum-based measurement. Journal of Special Education, 37(3), 184–192.
Fuchs, D., & Fuchs, L. S. (2006). Introduction to Response to Intervention: What, why, and how valid is it? Reading Research Quarterly, 41(1), 93–99.
Hedges, L. V., & Olkin, I. (1985). Statistical methods for meta-analysis. Orlando, FL: Academic Press.
Heritage, M. (2008). Learning progressions: Supporting instruction and formative assessment. Washington, DC: Chief Council of State School Officers.
Hu, L., & Bentler, P. M. (1999). Cutoff criteria for fit indexes in covariance structure analysis: Conventional criteria versus new alternatives. Structural Equation Modeling, 6, 1–55.
Kolen, M., & Brennan, R. (2004). Test equating, scaling, and linking (2nd ed.). New York: Springer.
Leahy, S., & Wiliam, D. (2011). Devising learning progressions assessment. Paper presented at the Annual Meeting of the American Educational Research Association, New Orleans, LA.
McLaughlin, D. H., & Bandeira de Mello, V. (2002). Comparison of state elementary school mathematics achievement standards using NAEP 2000. Paper presented at the annual meeting of the American Educational Research Association, New Orleans, LA.
McLaughlin, D. H., & Bandeira de Mello, V. (2003). Comparing state reading and math performance standards using NAEP. Paper presented at the National Conference on Large-Scale Assessment, San Antonio, TX.
McLaughlin, D. H., Bandeira de Mello, V., Blankenship, C., Chaney, K., Esra, P., Hikawa, H., et al. (2008). Comparison between NAEP and state reading assessment results: 2003 (NCES 2008-474). Washington, DC: U.S. Department of Education, Institute of Education Sciences, National Center for Education Statistics.
Market Data Retrieval. (2001). A D&B Company: Shelton, CT.
Monaghan, W. (2006). The facts about subscores (ETS R&D Connections No. 4). Princeton, NJ: Educational Testing Services. Available online: http://www.ets.org/Media/Research/pdf/RD_Connections4.pdf.
National Council of Teachers of Mathematics. (2006). Curriculum focal points for prekindergarten through grade 8 mathematics. Reston, VA.
173Star Assessments™ for MathTechnical Manual

References
National Mathematics Advisory Panel. (2008). Foundations for success: The final report of the National Mathematics Advisory Panel. Washington, DC: U.S. Department of Education. Available online: http://www.ed.gov/about/bdscomm/list/mathpanel/report/final-report.pdf.
Neter, J., Kutner, M., Nachtsheim, C., & Wasserman, W. (1996). Applied linear statistical models (4th ed.). New York: WCB McGraw-Hill.
Owen, R. J. (1969) A Bayesian approach to tailored testing. Research Bulletin 69-92. Princeton, N. J.: Educational Testing Service.
Owen, R. J. (1975) A Bayesian sequential procedure for quantal response in the context of adaptive mental testing. Journal of the American Statistical Association, 70, 351–356.
Pepe M. S., Janes, H., Longton, G. Leisenring, W., & Newcomb, P. (2004). Limitations of the odds ratio in gauging the performance of a diagnostic, prognostic, or screening marker. American Journal of Epidemiology, 159, 882–890.
Popham, W. J. (2007). The lowdown on learning progressions. Educational Leadership, 64(7), 83–84.
Skoupski, W.P., & Carvajal, J. (2010). A comparison of approaches for improving the reliability of objective scores. Educational and Psychological Measurement, 70(3), 357–375.
Urry, V. W. (1975). The effects of guessing on parameters of item discriminatory power. TN 75-2. Washington DC: Personnel Research and Development Center, US Civil Service Commission, May.
VanDerHeyden, A., & Burns, M. (2008). Examination of the Utility of Various Measures of Mathematics Proficiency. Assessment for Effective Intervention, 33(4), 215–224.
Zhou, X. H., Obuchowski, N. A., & Obushcowski, D. M. (2002). Statistical methods in diagnostic medicine. Wiley & Sons: New York.
174Star Assessments™ for MathTechnical Manual

Index
Numerics24-Item Star Math Progress Monitoring Tests, 4734-Item Star Math Tests, 40
AAccelerated Math, 5Access levels, 10ACT, 16, 66Adaptive Branching, 4, 6, 10, 35Administering the test, 11ADP, 16Algebra, 2, 3, 14, 15, 18, 22, 51Alternate forms reliability, 39, 40, 43ATOS readability formula, 18Audio guidance, 17
BBiserial correlation coefficient, 33
CCalculator, 16Calibration, 14, 25, 27, 28
of new items for current Star Math versions, 30California Achievement Test (CAT), 55, 137Capabilities, 10CBM probe studies, 72Center on Response to Intervention, 64Classification accuracy, 63Common Core State Standards, 62Comparing Star Math GEs with conventional tests,
86Compensating for incorrect grade placement, 91Comprehensive Test of Basic Skills (CTBS), 55, 137Computation, 15Computation Processes, 2, 3, 18Computer-adaptive test design, 35Conditional SEM (CSEM), 40, 41, 44, 48
17Star Assessments™ for MathTechnical Manual
Confirmatory factor analyses, 52Construct validity, 50Content development, 13Content specification
calibration, 14item creation, 14resources consulted, 13Star Math, 13Star Math Progress Monitoring, 17
Content validity, 50Conversion tables (scores), 92Core Progress learning progression for math, 21Correlation coefficients
biserial, 33point-biserial, 33
Council of Chief State School Officers (CCSSO), 62Criterion-referenced scores, 84Cronbach’s alpha, 39, 42
DData Analysis and Statistics, 2, 15, 18Data Analysis, Statistics, and Probability, 3, 14, 15,
22, 51Data encryption, 10Definitions of scores, 83Design
of the program, 2of the test, 13
Design considerations, 4Domains, 15Dynamic calibration, 23, 30
EEnglish Language Learners, 9Enterprise Scale Scores, 74, 83Estimation, 2, 15, 18Exploratory factor analysis, 51, 55Extended time limits, 9
5

Index
FFormula reference sheets, 16
GGE (Grade Equivalent), 84
cap, 85comparing Star Math GEs with conventional
tests, 86Generic reliability, 40Geometry, 2, 15, 18Geometry & Measurement, 3, 14, 15, 22, 51Grade placement, 90
compensating for incorrect grade placement, 91
indicating appropriate grade placement, 90Growth norms, 81
IIndicating appropriate grade placement, 90Individualized tests, 10Iowa Tests of Basic Skills (ITBS), 55, 137IRT (item response theory), 2, 24, 40, 41, 51
analysis, 15Maximum-Likelihood estimation procedure, 36Rasch Maximum Information model, 6
Item analysisitem difficulty, 33item discriminating power, 33traditional item difficulty, 33
Item and scale calibration, background, 23Item bank, 13Item creation, 14Item difficulty, 33Item discriminating power, 33Item retention, 34
KKey Stage 2 Standardised Attainment Tests for
Maths, 66Kuder-Richardson Formula 20, 42
LLearning progressions, 22
17Star Assessments™ for MathTechnical Manual
MMarket Data Retrieval (MDR), 76Math Instructional Level (MIL), 7Maximum-Likelihood IRT estimation procedure, 36Measurement, 2, 15, 18Measurement precision, 39Metropolitan Achievement Test (MAT), 55, 137MINEIGEN, 52Multi-state consortium tests, 62Multi-Tiered Systems of Support (MTSS), 64
NNational Assessment of Educational Progress
(NAEP), 14, 18National Center on Intensive Intervention (NCII), 64,
69National Council of Teachers of Mathematics
(NCTM), 14, 18National Mathematics Advisory Panel (NMAP), 14NCE (Normal Curve Equivalent), 87Norming, 74
2017 Star Math norms, 74background, 74data analysis, 79final norming sample size, 75growth norms, 81sample characteristics, 75test administration, 79
Norm-referenced scores, 84Northwest Evaluation Association (NWEA), 55, 137Numbers and Operations, 3, 14, 15, 22Numeration, 15Numeration & Operations, 51Numeration Concepts, 2, 3, 18
OObjective clusters, 15
PPartnership for Assessment of Readiness for
College and Careers (PARCC), 62Password entry, 11Point-biserial correlation coefficient, 33
6

Index
PR (Percentile Rank), 66, 86Practice session, 6Program design, 2Progress monitoring, 69
additional research, 72PROPORTION, 52
RRasch 1-parameter logistic IRT model, 24, 51Rasch difficulty parameters, 14Rasch Item Response Model, 24Rasch Maximum Information IRT model, 6Reliability, definition, 39Renaissance Learning Progression for Math, 21Repeating a test, 8Reporting, 5Response to Intervention (RTI), 64Root mean square error of approximation, 54RTI Action Network, 69Rules
for writing Star Math Progress Monitoring test items, 19
for writing Star Math test items, 18Rules for item retention, 34
SSample characteristics, 75SAS, 52SAS/STAT, 30SAT, 16Scores
compared to teacher ratings, 159comparing Star Math GEs with conventional
tests, 86conversion tables, 92definitions, 83GE (Grade Equivalent), 84NCE (Normal Curve Equivalent), 87PR (Percentile Rank), 86relationship to math skills ratings, 163relationship to state assessments, 166SGP (Student Growth Percentile), 88SS (Scaled Score), 36, 83Star Math compared to other tests, 55, 137use of grade placement in Star Math 3.x and
higher, 90
17Star Assessments™ for MathTechnical Manual
Scoring, 36Screening, 65Security. See test securitySEM (Standard Error of Measurement), 44, 48SGP (Student Growth Percentile), 82, 88Skill Sets, 15Smarter Balanced Assessment Consortium (SBAC),
62Spearman-Brown, 42Split application model, 10Split-half reliability, 39, 40, 42SPSS, 52SS (Scaled Score), 36, 83Standardized root mean square residual, 54Stanford Achievement Test (SAT), 55, 66, 137Star Early Literacy, 5Star Math
objective clusters, 15purpose of the program, 1versions, 1
Star Math Blueprint Skills, 104Star Math Progress Monitoring, 13Star Performance Reports, 167Star Reading, 5State assessments, 61
predicting proficiency, 63State assessments, comparing student- and
school-level data, 166accuracy comparisons, 168methodology comparison, 167
Subskills, 22
TTeacher ratings, 159
psychometric properties of the skills ratings, 162
rating instrument, 159Technical adequacy, evidence of, 64TerraNova, 55, 137Test administration procedures, 11Test design, 13
computer adaptive, 35Test interface, 5Test items, rules for writing
Star Math, 18Star Math Progress Monitoring, 19
Test length, 6, 7
7

Index
Test monitoring/password entry, 11Test repetition, 8Test scores
criterion-referenced scores, 84norm-referenced scores, 84types of, 83
Test scoring, 36Test security, 10
access levels, 10access levels and capabilities, 10capabilities, 10data encryption, 10individualized tests, 10split application model, 10test monitoring/password entry, 11
Testing procedure, 35practice session, 6time limits, 9
Test-retest reliability, 39, 43Theil-Sen regression, 73Time limits, 9
extended, 9standard, 9
Traditional item difficulty, 33Trends in International Mathematics and Science,
14, 18
17Star Assessments™ for MathTechnical Manual
UUnified scale, 36, 74, 83Urry biserial, 34
VValidity
construct, 50content, 50definition, 50internal evidence, 51linking Star and state assessments, 61meta-analysis of data, 60relationship to multi-state tests, 62summary of evidence, 73
WWinsteps, 31Word Problems, 2, 15, 18
8


About Renaissance
Renaissance® transforms data about how students learn into instruments of empowerment for classroom teachers, enabling them to guide all students to achieve their full potentials. Through smart, data-driven educational technology solutions that amplify teachers’ effectiveness, Renaissance helps teachers teach better, students learn better, and school administrators lead better. By supporting teachers in the classroom but not supplanting them, Renaissance solutions deliver tight learning feedback loops: between teachers and students, between assessment of skills mastery and the resources to spur progress, and between each student’s current skills and future academic growth.
R54119.180315
© Copyright 2018 Renaissance Learning, Inc. All rights reserved. (800) 338-4204 www.renaissance.com
All logos, designs, and brand names for Renaissance’s products and services, including but not limited to Star Math, and Renaissance are trademarks of Renaissance Learning, Inc., and its subsidiaries, registered, common law, or pending registration in the United States.
Fremont | London | Madison | Minneapolis | New York | Sydney | Toronto | Vancouver | Wisconsin Rapids
Related Documents


