Stanford VLF Remote Sensing Science, Engineering, Educational outreach Morris Cohen Along with Phil Scherrer, Deborah Scherrer, Umran Inan, Ray Mitchell, Justin Tan Space, Telecommunications and Radioscience Laboratory Stanford University Stanford, California 94305 http://www-star.stanford.edu/~vlf/ http://sun.stanford.edu

Welcome message from author
This document is posted to help you gain knowledge. Please leave a comment to let me know what you think about it! Share it to your friends and learn new things together.
Transcript

Stanford VLF Remote SensingScience, Engineering, Educational outreach
Morris CohenAlong with Phil Scherrer, Deborah Scherrer, Umran Inan,
Ray Mitchell, Justin Tan
Space, Telecommunications and Radioscience Laboratory
Stanford UniversityStanford, California 94305
http://www-star.stanford.edu/~vlf/http://sun.stanford.edu

2
Stanford VLF Remote Sensing
� The collaborators
� Ionosphere/magnetosphere overview
� Electromagnetic effects
� SID Receiver
� AWESOME Receiver
� Educational Outreach

3
The Stanford Collaborators
� Phil/Deborah Scherrer
� Ray Mitchell
� Umran Inan
� Morris Cohen
� Justin Tan
� Center for Integrated Space Weather Modeling (CISM)

4
The Ionosphere
Source: HAARP

5
The Magnetosphere
Source: NASA, Rice University

6
Electromagnetic Effects
� Solar Flare Detection
� Cosmic Gamma Rays
� Chorus Emissions
� Lightning
� Whistler waves
� LEP Events, hurricane studies
� Early/fast Events
� Mesospheric lightning discharges� Sprites, elves, blue jets, TGFs

7
Sudden Ionospheric Disturbance
� Strong solar flares penetrate to lower ionospheric region, cause transient changes

8
VLF Transmitters
Source: Great Circle Mapper, Karl Swartz

9
SID Event – an Example
2
2.5
3
3.5
4
4.5
5
07:0
0:0
3
07:3
1:2
6
08:0
2:4
8
08:3
4:1
1
09:0
5:3
4
09:3
6:5
6
10:0
8:1
9
10:3
9:4
2
11:1
1:0
5
11:4
2:2
7
12:1
3:5
0
12:4
5:1
3
13:1
6:3
5
13:4
7:5
8
14:1
9:2
1
14:5
0:4
4
15:2
2:0
6
15:5
3:2
9
16:2
4:5
2
16:5
6:1
4
17:2
7:3
7
17:5
9:0
0
18:3
0:2
3
19:0
1:4
5
19:3
3:0
8
20:0
4:3
1
20:3
5:5
3
21:0
7:1
6
21:3
8:3
9
22:1
0:0
1
22:4
1:2
4
23:1
2:4
7
23:4
4:1
0
00:1
5:3
2
00:4
6:5
5
01:1
8:1
8
01:4
9:4
0
02:2
1:0
3
02:5
2:2
6
03:2
3:4
9
03:5
5:1
1
04:2
6:3
4
04:5
7:5
7
05:2
9:1
9
06:0
0:4
2
06:3
2:0
5
Local Nighttime DaytimeSunrise Local Nighttime
0
0.5
1
1.5
2
2.5
3
07:0
0:0
3
07:3
5:3
1
08:1
0:5
9
08:4
6:2
7
09:2
1:5
6
09:5
7:2
4
10:3
2:5
2
11:0
8:2
0
11:4
3:4
8
12:1
9:1
6
12:5
4:4
4
13:3
0:1
2
14:0
5:4
0
14:4
1:0
8
15:1
6:3
6
15:5
2:0
4
16:2
7:3
2
17:0
3:0
0
17:3
8:2
8
18:1
3:5
6
18:4
9:2
4
19:2
4:5
3
20:0
0:2
1
20:3
5:4
9
21:1
1:1
7
21:4
6:4
5
22:2
2:1
3
22:5
7:4
1
23:3
3:0
9
00:0
8:3
7
00:4
4:0
5
01:1
9:3
3
01:5
5:0
1
02:3
0:2
9
03:0
5:5
7
03:4
1:2
5
04:1
6:5
3
04:5
2:2
1
05:2
7:5
0
06:0
3:1
8
06:3
8:4
6
Quiet
Day
Active
Day
NLK
24.8 kHz
Source: Ray Mitchell

10
SID Event – an Example
2
2.5
3
3.5
4
4.5
5
07:0
0:0
3
07:3
1:2
6
08:0
2:4
8
08:3
4:1
1
09:0
5:3
4
09:3
6:5
6
10:0
8:1
9
10:3
9:4
2
11:1
1:0
5
11:4
2:2
7
12:1
3:5
0
12:4
5:1
3
13:1
6:3
5
13:4
7:5
8
14:1
9:2
1
14:5
0:4
4
15:2
2:0
6
15:5
3:2
9
16:2
4:5
2
16:5
6:1
4
17:2
7:3
7
17:5
9:0
0
18:3
0:2
3
19:0
1:4
5
19:3
3:0
8
20:0
4:3
1
20:3
5:5
3
21:0
7:1
6
21:3
8:3
9
22:1
0:0
1
22:4
1:2
4
23:1
2:4
7
23:4
4:1
0
00:1
5:3
2
00:4
6:5
5
01:1
8:1
8
01:4
9:4
0
02:2
1:0
3
02:5
2:2
6
03:2
3:4
9
03:5
5:1
1
04:2
6:3
4
04:5
7:5
7
05:2
9:1
9
06:0
0:4
2
06:3
2:0
5
Local Nighttime DaytimeSunrise Local Nighttime
GOES
Data
Active
Day
NLK
24.8 kHz
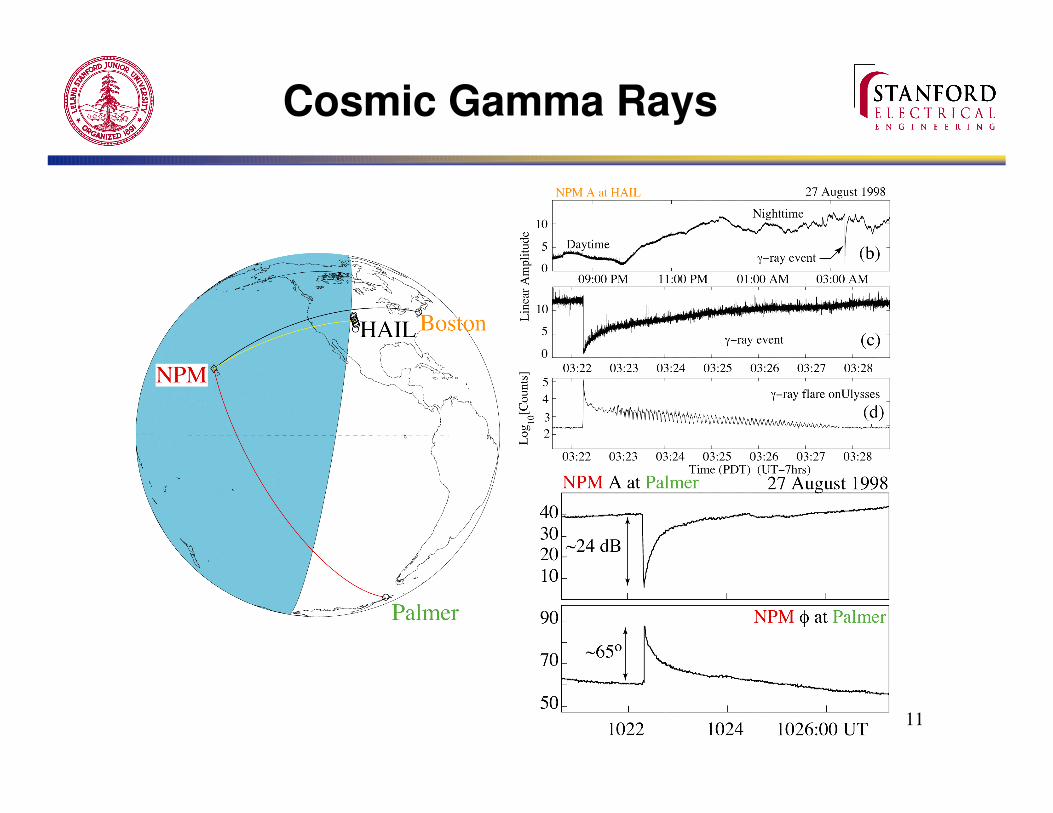
11
Cosmic Gamma Rays

12
Chorus Emissions

13
Lightning Detection
EW
NSIncident wave S
Φ

14
Whistlers in the Magnetosphere

15
Whistler Wave – an Example
Sferics
Whistler
Triggered
emissions
Palmer Station, Antarctica 2 March 1992 0839:06 UT

16
Lightning Induced Electron Precipitation (LEP Events)
Source: Bill Peter

17
LEP Events – an Example
Hurricane
Isabel

18
Early Fast Events
Source: Bill Peter

19
Mesospheric Phenomenon
Source: Nikolai Lehtinen

20
Runaway Electrons
Source: Nikolai Lehtinen

21
Sprites and Early/Fast Events
Early fast events are highly correlated with
sprites, indicating connection with ionospheric
heating and runaway electronsSource: Robert Marshall

22
TGFs and Sferics

23
The Hardware
� SID Detector
� AWESOME Receiver
A tmosphericW eatherE ducationalS ystem forO bservation andM odeling ofE ffects

24
The SID Detector
� Designed by Ray Mitchell
� Low cost, compact, easy to use
� Narrowband amplitude receiver
� 1 sample per 5 seconds

25
The SID Detector – Overview
Pre-Amp
24.8KHzFilter
SignalStrength
DATAQComputer
RS-232
Coax
=
All frequencies
DC voltageLevel
10 bit, Analog to DigitalConversion Sample every
5 Seconds
Source: Ray Mitchell

26
SID Detector - Pictures
Pre-Amp DataQPost-Amp
Wire Loop Antenna
Source: Ray Mitchell

27
The AWESOME Receiver
� Designed by Morris Cohen, Justin Tan
� Ultra sensitive
� Medium cost (~$2000)
� Narrowband amplitude/phase
� Broadband 100kHz data
� Deployed worldwide
� Auto-calibration
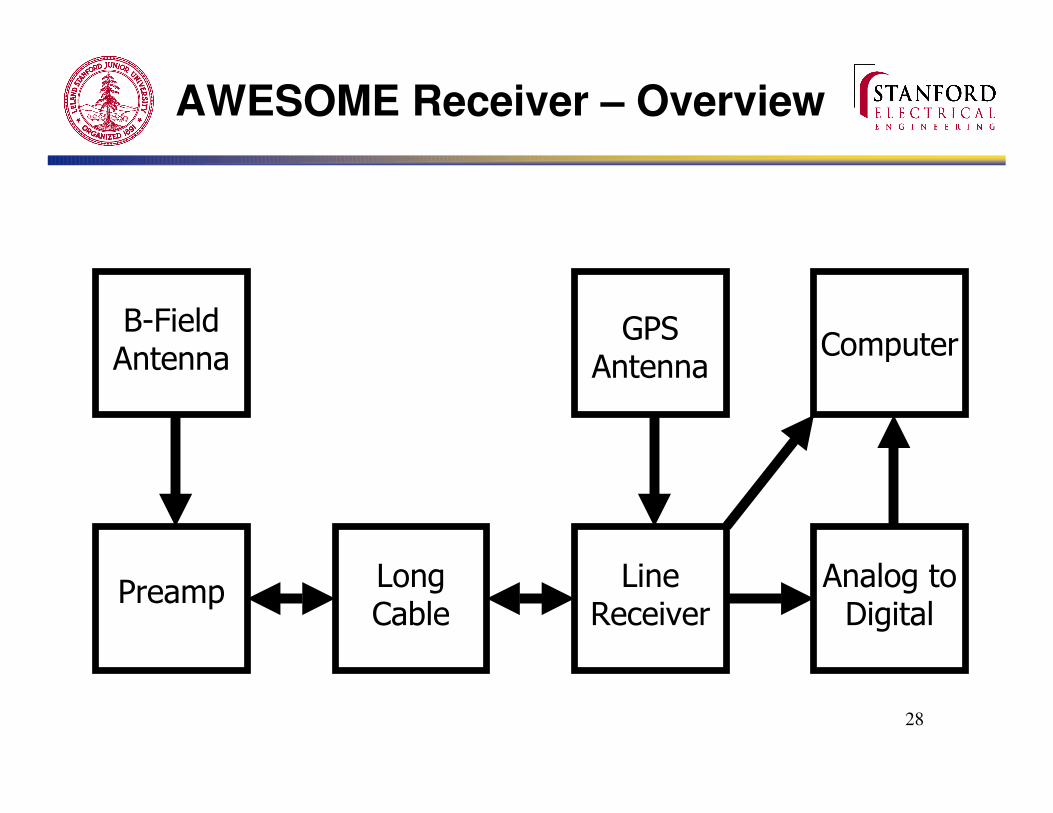
28
AWESOME Receiver – Overview
B-Field Antenna
PreampLong Cable
Line Receiver
Analog to Digital
ComputerGPS
Antenna

29
AWESOME Receiver – Pictures

30
AWESOME Receiver – Data
Data taken from Palmer Station, Antarctica

31
More Data, Calibration
Data taken from Homer, Alaska

32
Educational Outreach
� Center for Integrated Space Weather Modeling (CISM)� Run by Boston University
� Stanford selected for educational outreach
� Distribute SID detectors widely� 3 Beta sites working
� 100 units in production
� 3 foreign sites planned (Tanzania, India, Tibet)
� Distribute selected AWESOME detectors

33
Educational Outreach (con’t)
� Research purpose� data sent to Stanford via internet, DVDs
� Educational purposes� Monitor solar flares/VLF activity� Build antenna, maintain electronics� Participate in research campaigns
� Promote in developing countries through UN?
� http://solar-center.stanford.edu/~SID� http://www-star.stanford.edu/~hail/

34
nQ e it ou s s
Related Documents


