Stanford University Boolean Analysis of Large Gene-expression Datasets Debashis Sahoo PhD Candidate, Electrical Engineering Joint work with David Dill, Andrew Gentles, Rob Tibshirani, Sylvia Plevritis

Stanford University Boolean Analysis of Large Gene-expression Datasets Debashis Sahoo PhD Candidate, Electrical Engineering Joint work with David Dill,
Dec 28, 2015
Welcome message from author
This document is posted to help you gain knowledge. Please leave a comment to let me know what you think about it! Share it to your friends and learn new things together.
Transcript
Stanford University
Boolean Analysis of Large Gene-expression Datasets
Debashis SahooPhD Candidate, Electrical Engineering
Joint work with David Dill, Andrew Gentles, Rob Tibshirani, Sylvia Plevritis
Stanford University
Outline
Standard microarray work flowData collection and preprocessingBoolean analysisBiological insightsConclusion and future work
Stanford University
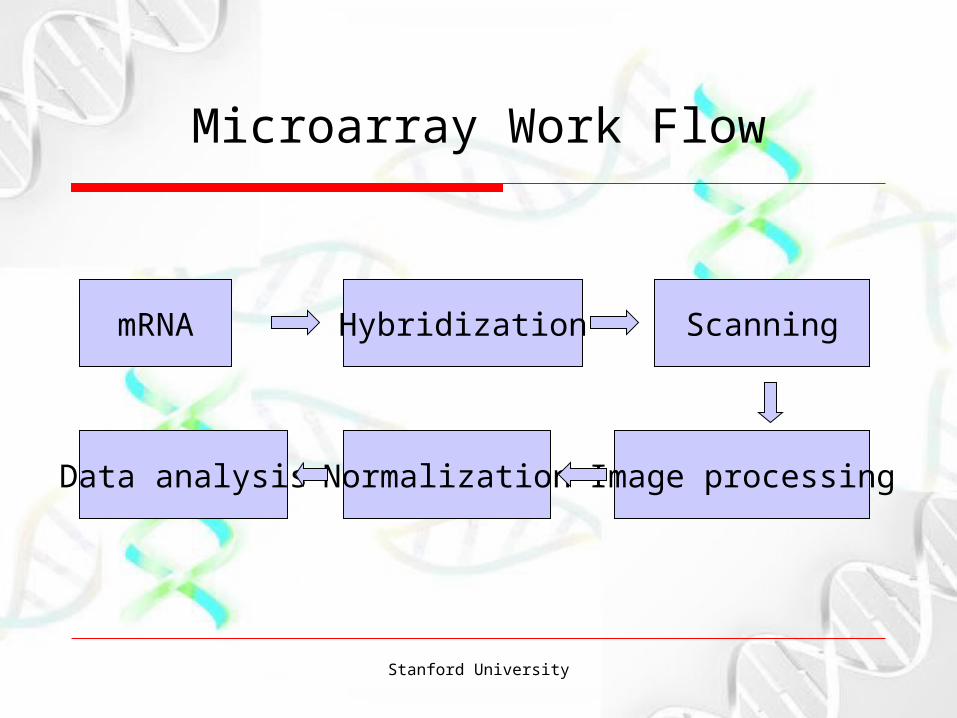
Microarray Work Flow
mRNA Hybridization Scanning
Image processingNormalizationData analysis
Stanford University
Data Collection
There are thousands of microarray freely available
GEOArrayExpressSMDCelsius
Stanford University
Preprocessing
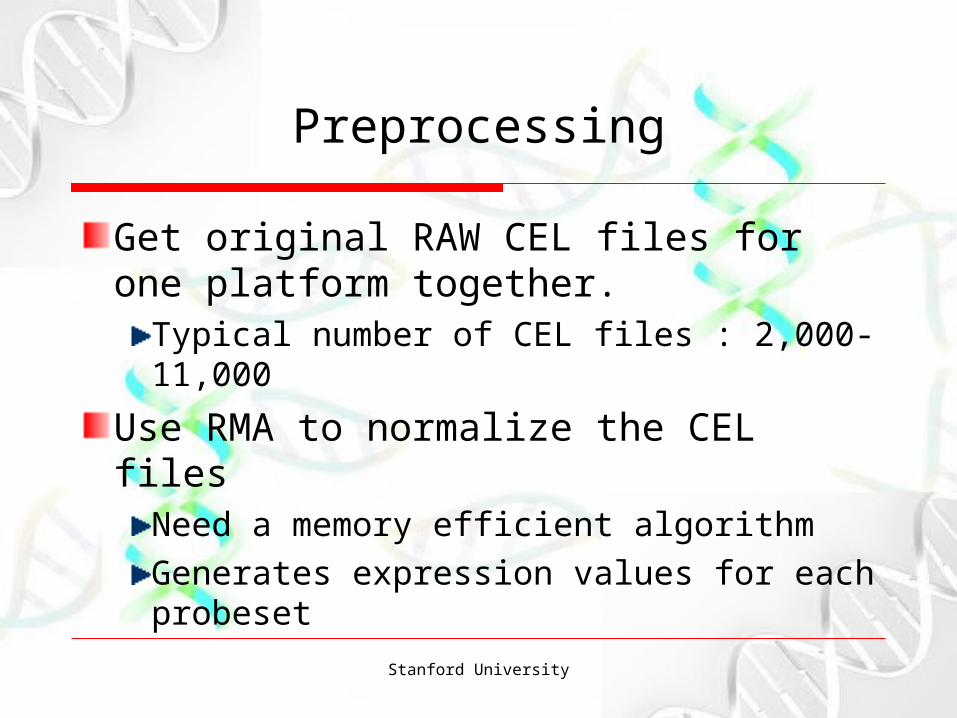
Get original RAW CEL files for one platform together.
Typical number of CEL files : 2,000-11,000
Use RMA to normalize the CEL filesNeed a memory efficient algorithmGenerates expression values for each probeset

Stanford University
Existing Methods
Correlation analysisConditional probabilityMutual information

Stanford University
Boolean Analysis
Get RAW Data Normalize
Determine thresholds
Discover Boolean relationshipsNew Biology
Stanford University
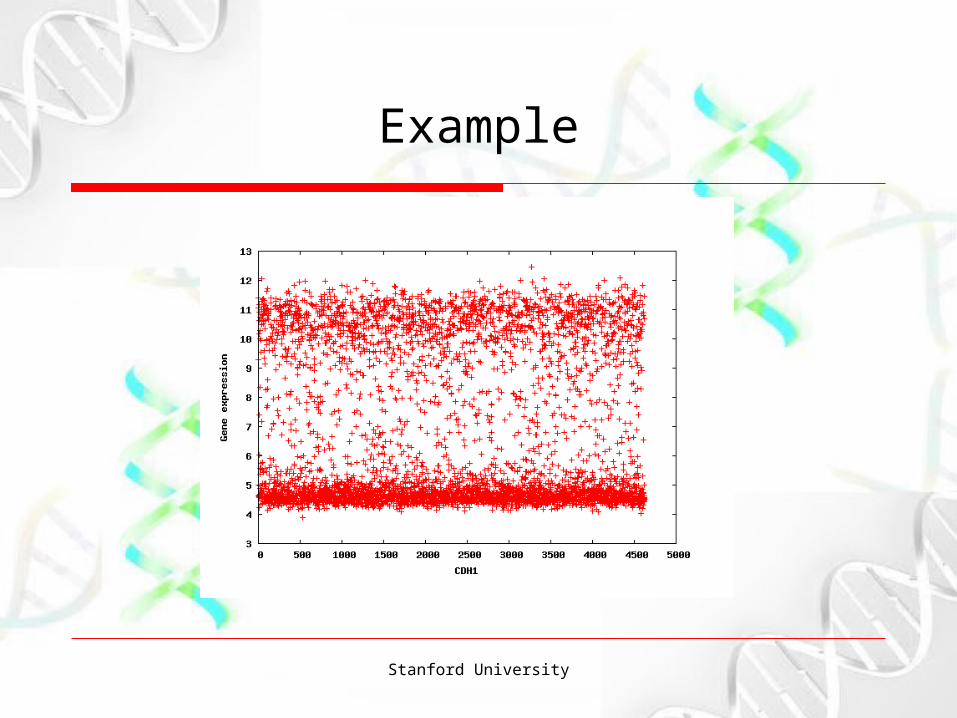
Example
Stanford University
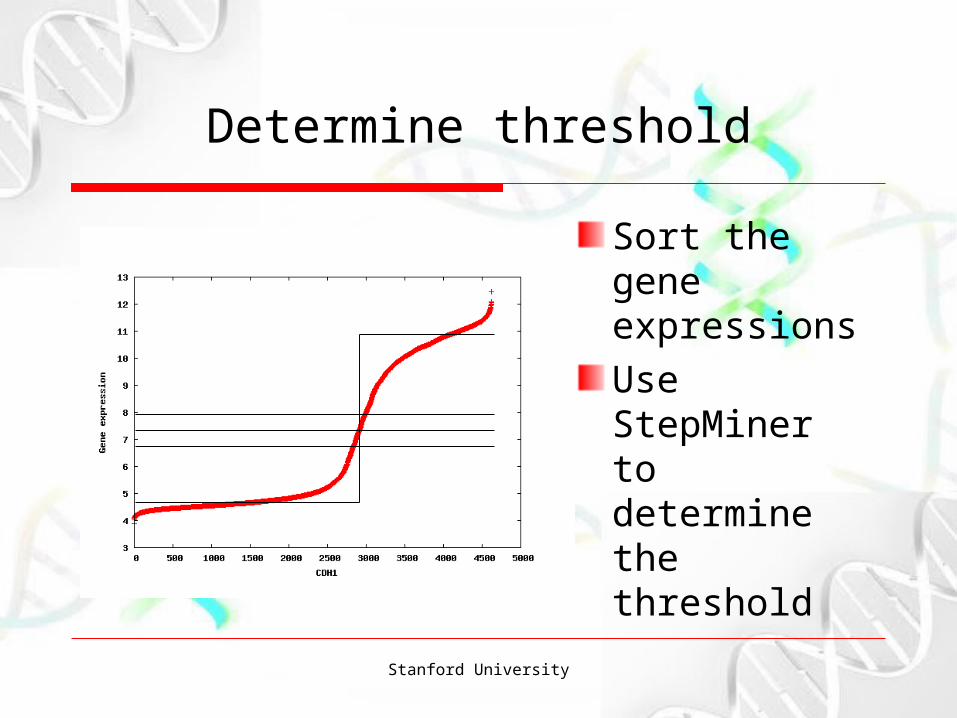
Determine threshold
Sort the gene expressionsUse StepMiner to determine the threshold
Stanford University
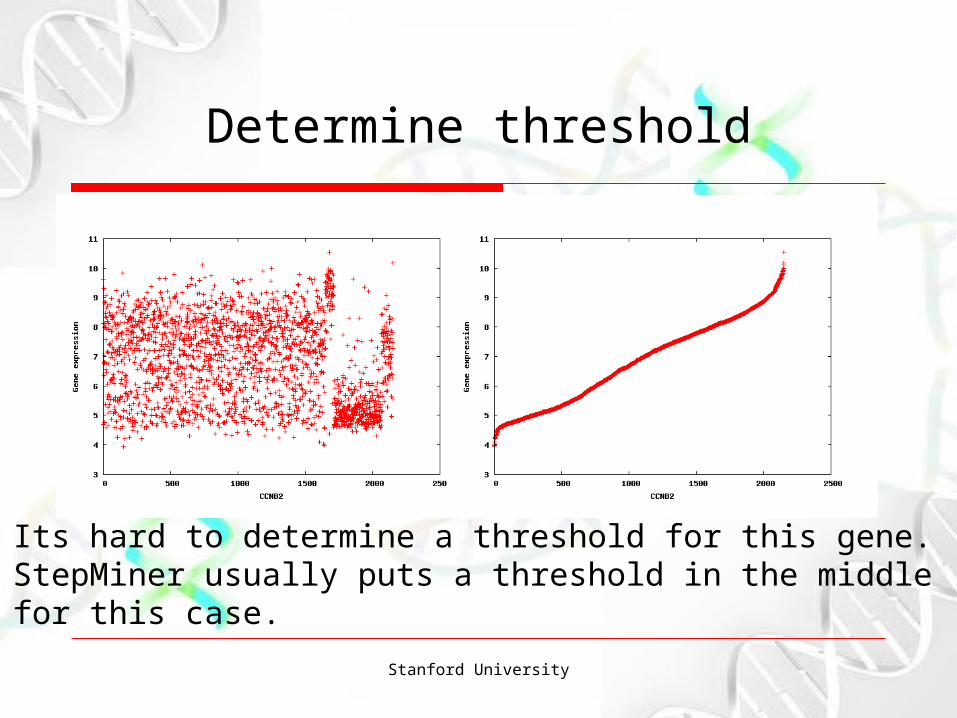
Determine threshold
Its hard to determine a threshold for this gene.StepMiner usually puts a threshold in the middle for this case.

Stanford University
Discover Boolean Relationships
Analyze scatter plots between two genes.Divide the space into four different regions using the thresholds (quadrants).Determine sparse quadrants.Determine the Boolean relationships.
WNT5A high PAX5 low
0
1 3
2

Stanford University
Statistical Tests
Compute the expected number of points under the independence model
Compute maximum likelihood estimate of the error rate
statistic =(expected – observed)
expected√
a00
(a00+ a01)
a00
(a00+ a10)+( )1
2error rate =
a00
a01 a11
a10

Stanford University
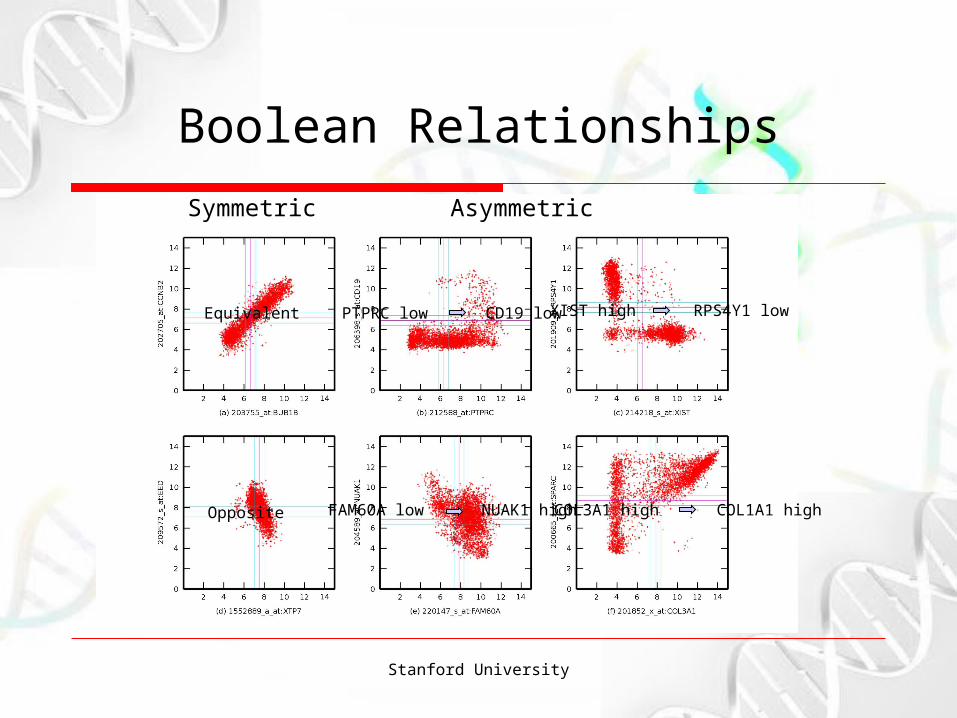
Boolean Relationships
Tightly co-regulated genes forms two sparse quadrants.There are six possible Boolean relationships
EquivalentOppositeA low B lowA low B highA high B lowA high B high
Stanford University
Boolean Relationships
Equivalent
Opposite
PTPRC low CD19 low XIST high RPS4Y1 low
COL3A1 high COL1A1 highFAM60A low NUAK1 high
Symmetric Asymmetric
Stanford University
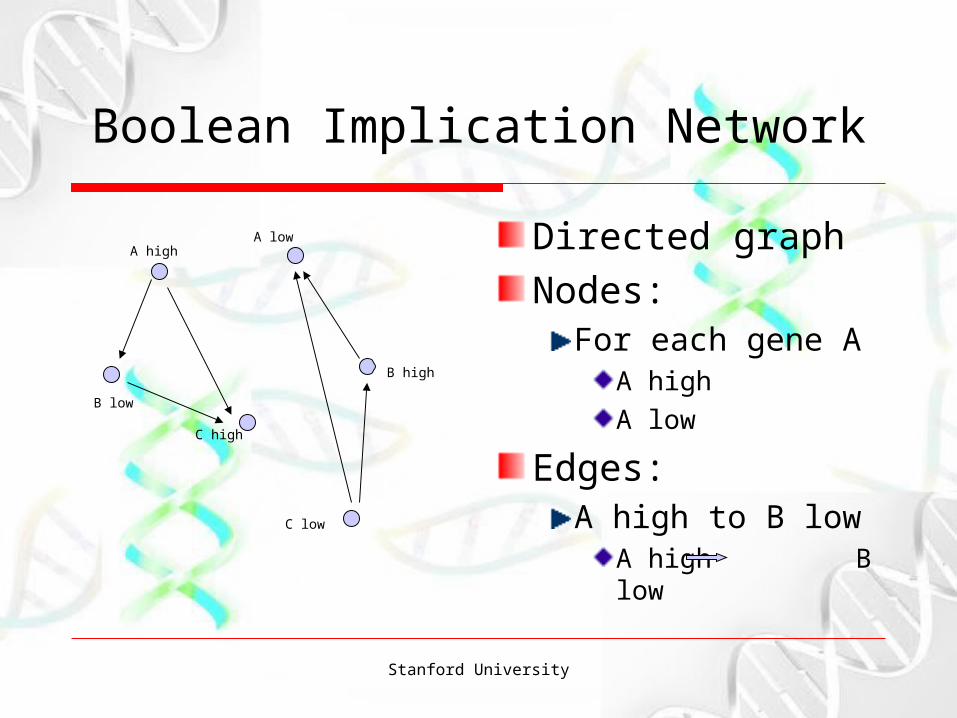
Boolean Implication Network
Directed graphNodes:
For each gene AA highA low
Edges:A high to B low
A high B low
A high
B low
A low
B high
C high
C low

Stanford University
New Biology
This slide is under construction!!

Stanford University
Biological Insights
Gender Organ Tissue
Development Differentiation Co-expression
Stanford University
Example Application
ImmunologyB Cell differentiationGoal:
Discover genes that mark unique B Cell precursors

Stanford University
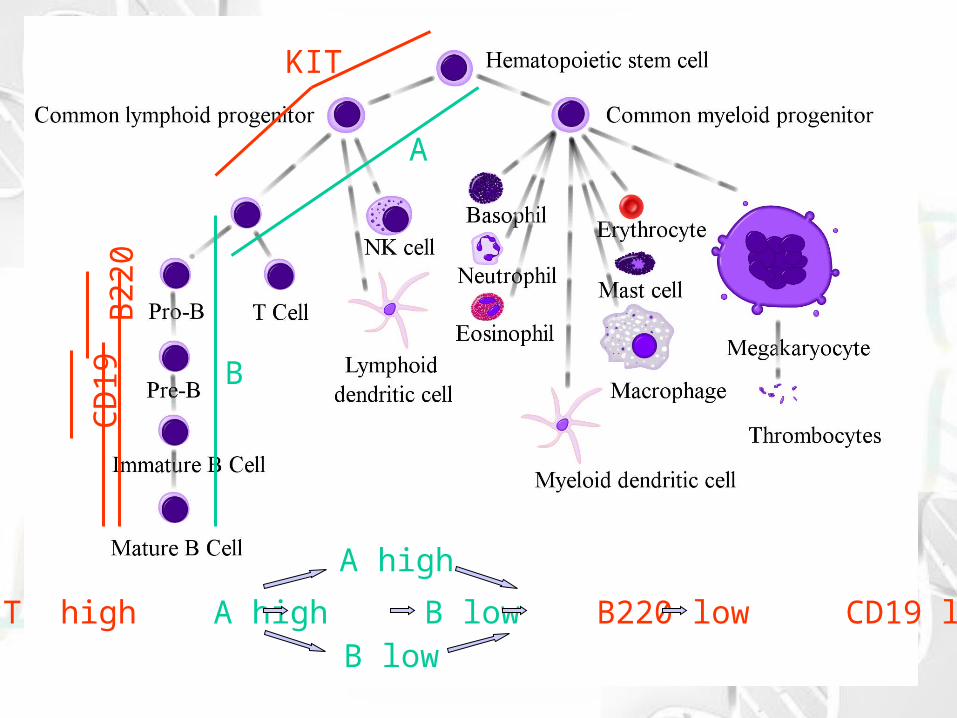
Differentiation Tree
Hematopoietic stem cell differentiation is a tree
Root: HSCLeaf
LymphocytesB Cell, T Cell, NK cell, Dendritic cell
ErythrocytesGranulocytes: Basophil, Neutrophil, EosinophilMonocytes: Dendritic cellThrombocytes
Stanford University
KIT high A high B low B220 low CD19 low
KIT
A
B
B22
0C
D19
A high
B low

Stanford University
Conclusion
Boolean analysisDirectly visible on the scatter plot.Enables discovery of asymmetric relationship.Follow biology.Potential application to Immunology
Future workCancer progression New biology
Stanford University
Acknowledgements
The Felsher Lab:Natalie WuCathy ShachafDean Felsher
Funding: ICBP Program (NIH grant: 5U56CA112973-02)
Leonore A HerzenbergJames Brooks Joe LipsickGavin SherlockHoward ChangStuart Kim

Stanford University
The END
Related Documents


