Standards for Causal Inference Methods in Analyses of Data from Observational and Experimental Studies in Patient-Centered Outcomes Research Final Technical Report Prepared for: Patient-Centered Outcome Research Institute Methodology Committee Prepared by: Joshua J Gagne, PharmD, ScD, Jennifer M Polinski, ScD, MPH, Jerry Avorn, MD, Robert J Glynn, PhD, ScD, John D Seeger, PharmD, DrPH Division of Pharmacoepidemiology and Pharmacoeconomics, Department of Medicine, Brigham and Women’s Hospital and Harvard Medical School March 15, 2012 DISCLAIMER All statements in this report, including its findings and conclusions, are solely those of the authors and do not necessarily represent the views of the Patient-Centered Outcomes Research Institute (PCORI), its Board of Governors or Methodology Committee. PCORI has not peer-reviewed or edited this content, which was developed through a contract to support the Methodology Committee’s development of a report to outline existing methodologies for conducting patient- centered outcomes research, propose appropriate methodological standards, and identify important methodological gaps that need to be addressed. The report is being made available free of charge for the information of the scientific community and general public as part of PCORI’s ongoing research programs. Questions or comments about this report may be sent to PCORI at [email protected] or by mail to 1828 L St., NW, Washington, DC 20036.

Welcome message from author
This document is posted to help you gain knowledge. Please leave a comment to let me know what you think about it! Share it to your friends and learn new things together.
Transcript

Standards for Causal Inference Methods in Analyses of Data from Observational and
Experimental Studies in Patient-Centered Outcomes Research
Final Technical Report
Prepared for: Patient-Centered Outcome Research Institute Methodology Committee
Prepared by: Joshua J Gagne, PharmD, ScD, Jennifer M Polinski, ScD, MPH, Jerry Avorn,
MD, Robert J Glynn, PhD, ScD, John D Seeger, PharmD, DrPH
Division of Pharmacoepidemiology and Pharmacoeconomics, Department of Medicine,
Brigham and Women’s Hospital and Harvard Medical School
March 15, 2012
DISCLAIMER
All statements in this report, including its findings and conclusions, are solely those of the authors
and do not necessarily represent the views of the Patient-Centered Outcomes Research Institute
(PCORI), its Board of Governors or Methodology Committee. PCORI has not peer-reviewed or
edited this content, which was developed through a contract to support the Methodology
Committee’s development of a report to outline existing methodologies for conducting patient-
centered outcomes research, propose appropriate methodological standards, and identify
important methodological gaps that need to be addressed. The report is being made available free
of charge for the information of the scientific community and general public as part of PCORI’s
ongoing research programs. Questions or comments about this report may be sent to PCORI at
[email protected] or by mail to 1828 L St., NW, Washington, DC 20036.

2
I. INTRODUCTION
The demand for evidence to support a widening array of healthcare interventions continues to grow, and
the Patient-Centered Outcome Research Institute (PCORI) is well positioned to guide this development of
evidence. Recognizing that not all research results will be useful for comparing the effects of treatments,
guidance on the proper conduct of research may improve the information that becomes available and is
subsequently used to make comparisons and decide on appropriate healthcare interventions. The grand
scale of this task can be made more tractable through the synthesis and application of existing standards
and guidance documents, which have been promulgated by professional societies.
This report describes the development a set of minimum standards for causal inference methods for
observational and experimental studies in patient-centered outcomes research (PCOR) and comparative
effectiveness research (CER). A broad search was conducted to identify documents from which guidance
could be drawn. From this search, eight minimum standards were developed that cover inter-related
topics in causal inference. These minimum standards are intended to inform investigators, grant
reviewers, and decision makers involved in generating, evaluating, or using PCOR/CER. The report also
describes the rationale for identifying and selecting the standards, gives examples of their successful use,
and identifies gaps where future work is needed.
II. SCOPE OF WORK
Causal inference is the primary objective of PCOR/CER when one seeks to understand whether and the
extent to which a given therapy or intervention affects a particular outcome, or which among multiple
interventions affects an outcome the most. There are many threats to causal inference in both
randomized and observational studies.1,2
Researchers must address these threats in order to produce
the most valid results to inform patient decisions. Results of studies from which causality cannot be
reasonably inferred can hamper decision-making and impede optimal treatment choices and outcomes.
While randomization is the most effective tool for reducing bias due to differences in outcome risk
factors among compared groups, not all studies can or should employ randomization. Even when
baseline randomization is effective, causal inference can be compromised when patients discontinue or
DISCLAIMER
All statements in this report, including its findings and conclusions, are solely those of the authors
and do not necessarily represent the views of the Patient-Centered Outcomes Research Institute
(PCORI), its Board of Governors or Methodology Committee. PCORI has not peer-reviewed or
edited this content, which was developed through a contract to support the Methodology
Committee’s development of a report to outline existing methodologies for conducting patient-
centered outcomes research, propose appropriate methodological standards, and identify
important methodological gaps that need to be addressed. The report is being made available free
of charge for the information of the scientific community and general public as part of PCORI’s
ongoing research programs. Questions or comments about this report may be sent to PCORI at
[email protected] or by mail to 1828 L St., NW, Washington, DC 20036.
3
change therapies during follow-up.3 Adhering to the standards proposed herein can enhance causal
inference in both randomized and non-randomized PCOR/CER studies. However, these minimum
standards do not guard against all forms of bias in PCOR/CER.
In identifying and developing our proposed standards, we considered many methods and general design
and analytic strategies for promoting causal inference in PCOR/CER. Below, we list and briefly describe
the topics that we considered. Items in bold represent those that are incorporated in the proposed
minimum standards, with justification for those selections described in the Results section of this report.
- Data source selection (Standard 1): Data sources vary with respect to the availability, depth, quality,
and accuracy of variables required for causal inference in specific PCOR studies.1 A database that
supports causal inference for one PCOR question may not contain the necessary information to
support causal inference for another question.
- Design features: Many design features can be used to increase the validity of PCOR/CER study
results. In particular, new user designs (Standard 4), follow patients beginning at the time of
initiation of a particular intervention and therefore enable researchers to establish clear temporality
among baseline confounders, exposures, and outcomes and they accurately characterize outcomes
that occur shortly after initiation.4 Active comparators (Standard 5), which are a form of negative
controls,5 can help establish a clear causal question, can facilitate appropriate comparisons, and can
reduce biases due to confounding associated with initiating a treatment.6 Matching and restriction
(Standards 2 and 3) are commonly used approaches to reduce confounding bias by ensuring that
patients are compared only to other patients with similar values for particular factors or
combinations of factors. Other design options, such as the self-controlled case series7 and the case-
crossover design,8 inherently control for confounding by patient factors that remain fixed over time
because these approaches compare experiences within individuals.
- Roles of intention-to-treat and per-protocol approaches to exposure definition (Standard 2): Many
approaches can be used to define to which exposure categories patients contribute information

4
during follow-up. In an intention-to-treat approach, patients are analyzed according to their
randomized assignment or, in observational studies, to their initial exposure group, regardless of
subsequent changes to their exposure status during follow-up.9 In per-protocol analyses, only
patients who adhere to the study protocol (e.g., those who adhere to a particular intervention) are
analyzed.10
Each approach may be associated with different biases.
- Analytic techniques for confounding control:
o In addition to matching and restriction in the design stage, multiple approaches can be used
to further address confounding in the analysis of PCOR/CER studies. Commonly used
approaches include stratification (in which patients are grouped into and analyzed within
categories based on cofounder values) and regression models (in which one evaluates the
extent to which a particular outcome variable changes in relation to changes in values of an
independent variable, while statistically holding constant other independent variables).
o Confounder scores, such as propensity scores11
(Standard 7) and disease risk scores,12
can be
used in combination with the abovementioned analytic approaches as dimension-reduction
techniques to summarize multiple confounders into a single variable. Propensity scores
reflect patients’ probabilities of receiving a particular treatment in a given study, conditional
on measured covariates. On average, patients exposed to different interventions (exposures)
who have similar propensity scores will have similar distributions of variables that contributed
to the propensity score. The disease risk score is the prognostic analogue of the propensity
score, reflecting patients’ likelihood of a particular outcome, and can be used in much the
same way as the propensity score. A benefit of matching on confounder summary scores is
that they enable researchers to readily assess covariate balance (Standard 7),13
which can
provide insight into the extent to which residual confounding by measured variables may
impact the study.
5
o Instrumental variable analysis (Standard 8) is an alternative approach to causal inference
that exploits variables that induce exposure variation but that are not associated with the
outcome except through their associations with the exposure.14
Instrumental variable
analyses require assumptions that are not always well explicated in applications.15
o When researchers seek to adjust for confounding by factors that are affected by prior
exposure and that affect subsequent exposure, traditional conditional methods (such as those
described above – i.e., restriction, matching, stratification, and also regression analysis) can
produce biased results.16
However, methods exist to appropriately address such time varying
confounding, including principal stratification analysis, and the more commonly used inverse
probability weighted marginal structural models17
(Standard 6).
In the next section, we describe our approach to identifying and selecting guidance documents that
address these topics, as well as primary methods papers and empirical examples that demonstrate
successful implementation of the proposed standards.
III. METHODS
A. Search strategy
We employed a multipronged search strategy that involved both systematic and non-systematic
processes to identify relevant guidance documents. We conducted a systematic search of three
databases – MEDLINE, EMBASE, and Web of Science – through January 18, 2012, with no language limits.
We developed separate search strings for each database (detailed in Appendix A) using terms related to
guidelines or standards for research methods in both observational studies and randomized trials.
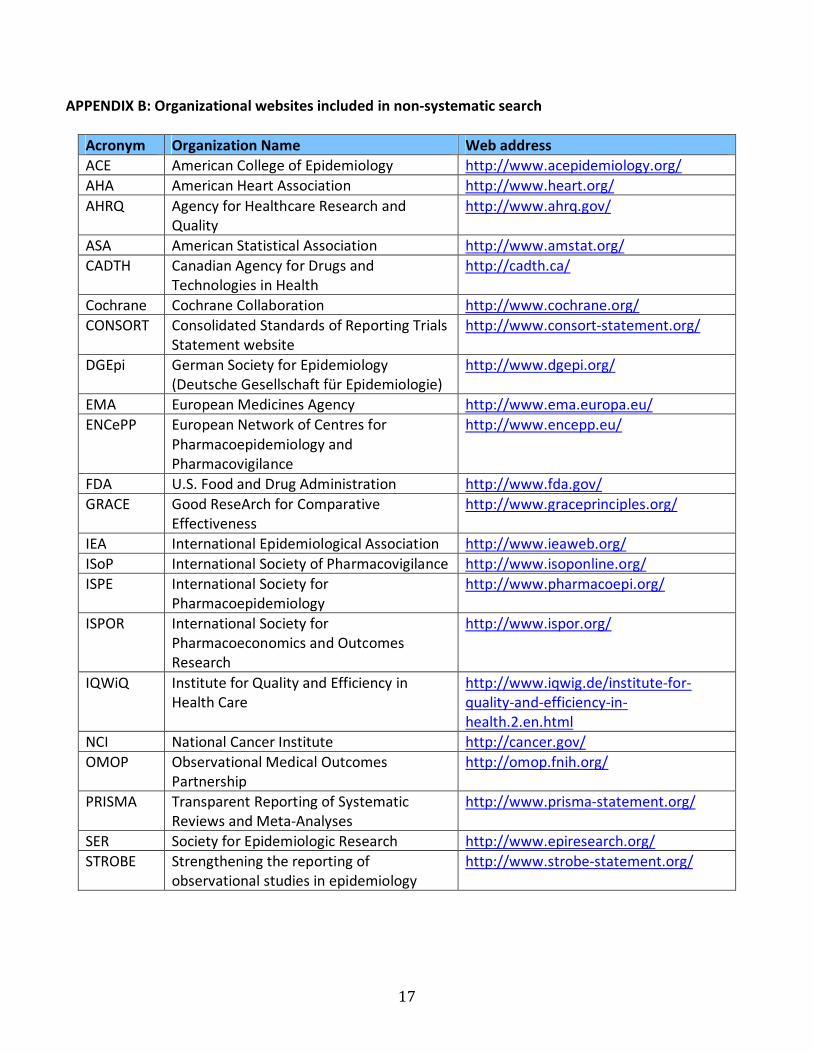
We augmented the systematic search with several non-systematic approaches. We located potentially
relevant documents known to us, including unpublished draft guidelines, and we searched pertinent
professional, governmental, and research organizations’ websites, which are listed in Appendix B. We
also conducted general Internet searches and hand-searched the reference lists of all identified
documents.
6
B. Inclusion/exclusion criteria
We screened the titles and abstracts of publications identified in the systematic search to exclude those
that were clearly not relevant to PCOR or CER (e.g., guidelines and studies related to non-human
research) or to methods for causal inference (e.g., guidelines related to topics addressed by other
contractors). Beyond these minimal criteria, we imposed few restrictions on our search in order to
conduct a document identification process with high sensitivity. In particular, we did not limit
documents on the basis of language or country of origin. We did exclude clinical practice standards,
older versions of guidelines for which more recent guidelines had been developed, and non-English
versions of guidelines for which English translations existed.
We obtained full text versions of all documents that passed our title and abstract screen. Three authors
(JJG, JMP, JDS) reviewed the full text version of each document to further exclude those that did not
address any of our topics of interest. Final included documents are catalogued in Appendix C.
C. Abstraction
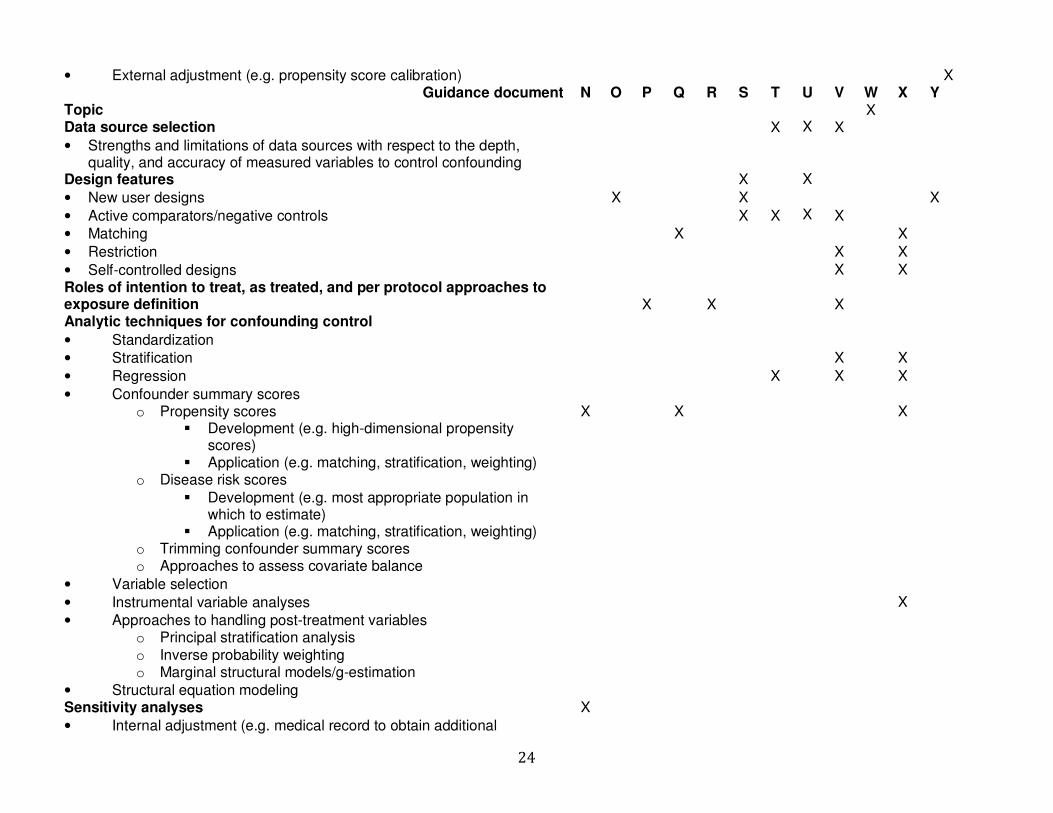
JJG, JMP, JDS abstracted data from each included document. We determined the topic(s) that each
document addressed and indicated these in a grid (Appendix D). We liberally applied this criterion in the
abstraction phase in order to maximize available information for identifying and selecting topics for
potential standards. For example, we indicated that a document addressed a particular topic even if the
document briefly mentioned the topic but did not provide guidance on how to use it.
D. Synthesis
Using the grid in Appendix D, we identified the most commonly mentioned topics, which tended to
reflect the most commonly used methods in causal inference. We avoided focusing on topics that are
extensively covered in standard textbooks, such as multivariable regression analysis. We also drew on
our own methodological expertise in determining which topics cover broad principles of causal inference
that constitute minimum standards. We sought to focus on methods and approaches that are commonly
and increasingly used in CER but that might not be familiar to many stakeholders or methods that are

7
often inappropriately or unclearly applied. Finally, we conducted two meetings with approximately 12
researchers (clinicians, epidemiologists, and biostatisticians) working in PCOR/CER and causal inference
methodology and solicited their feedback regarding our proposed standards to and identify additional
topics within causal inference methods that would be particularly useful for investigators, grant
reviewers, and decision-makers.
In addition to the guidance document search and selection process, we also identified primary methods
research and examples of successful applications of these methods during the guidance document
synthesis and standard development phases. Many of the methods and empirical application papers
were derived from the references of the identified guidance documents. Others were identified based
on our own knowledge of the literature and on ad hoc literature searches.
IV. RESULTS
A. Search results
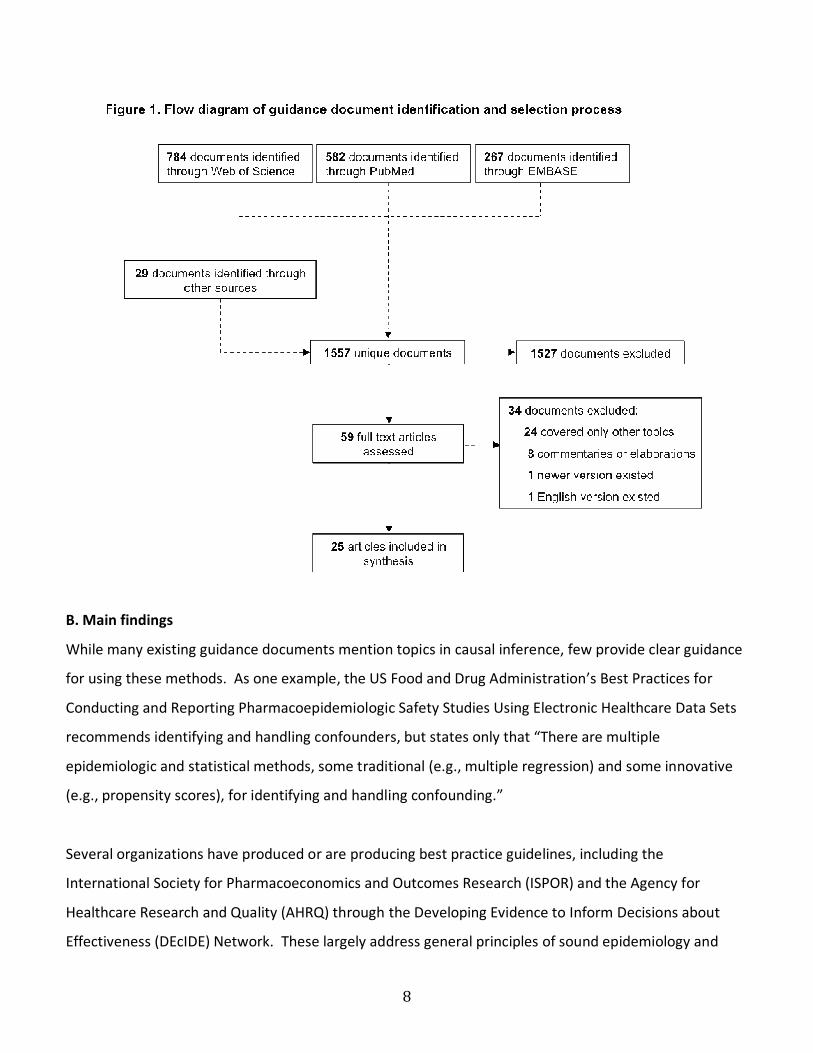
Figure 1 below summarizes the results of the literature search and document selection process. We
identified 1,557 unique documents in the systematic and non-systematic searches combined. After
screening the titles and abstracts, we identified 59 potentially relevant documents for full text review.
Upon full text review, we excluded 34 documents for reasons listed in Figure 1. The remaining 25
documents, which are described in Appendix C, mentioned one or more topics of interest. The grid in
Appendix D indicates which topics in causal inference each document mentioned.
8
B. Main findings
While many existing guidance documents mention topics in causal inference, few provide clear guidance
for using these methods. As one example, the US Food and Drug Administration’s Best Practices for
Conducting and Reporting Pharmacoepidemiologic Safety Studies Using Electronic Healthcare Data Sets
recommends identifying and handling confounders, but states only that “There are multiple
epidemiologic and statistical methods, some traditional (e.g., multiple regression) and some innovative
(e.g., propensity scores), for identifying and handling confounding.”
Several organizations have produced or are producing best practice guidelines, including the
International Society for Pharmacoeconomics and Outcomes Research (ISPOR) and the Agency for
Healthcare Research and Quality (AHRQ) through the Developing Evidence to Inform Decisions about
Effectiveness (DEcIDE) Network. These largely address general principles of sound epidemiology and
9
biostatistics and provide state-of-the-art reviews of various methods and approaches to causal inference.
Where multiple guidelines provided consistent recommendations, we sought to synthesize them into
minimum standards (Standards 1, 2, 4, 5, and 8). Overall, however, few documents provide specific
recommendations on minimum standards for causal inference methods. Therefore, we developed
additional minimum standards largely de novo, based on primary methodological literature and on our
own expertise in causal inference methods (Standards 3, 6, and 7).
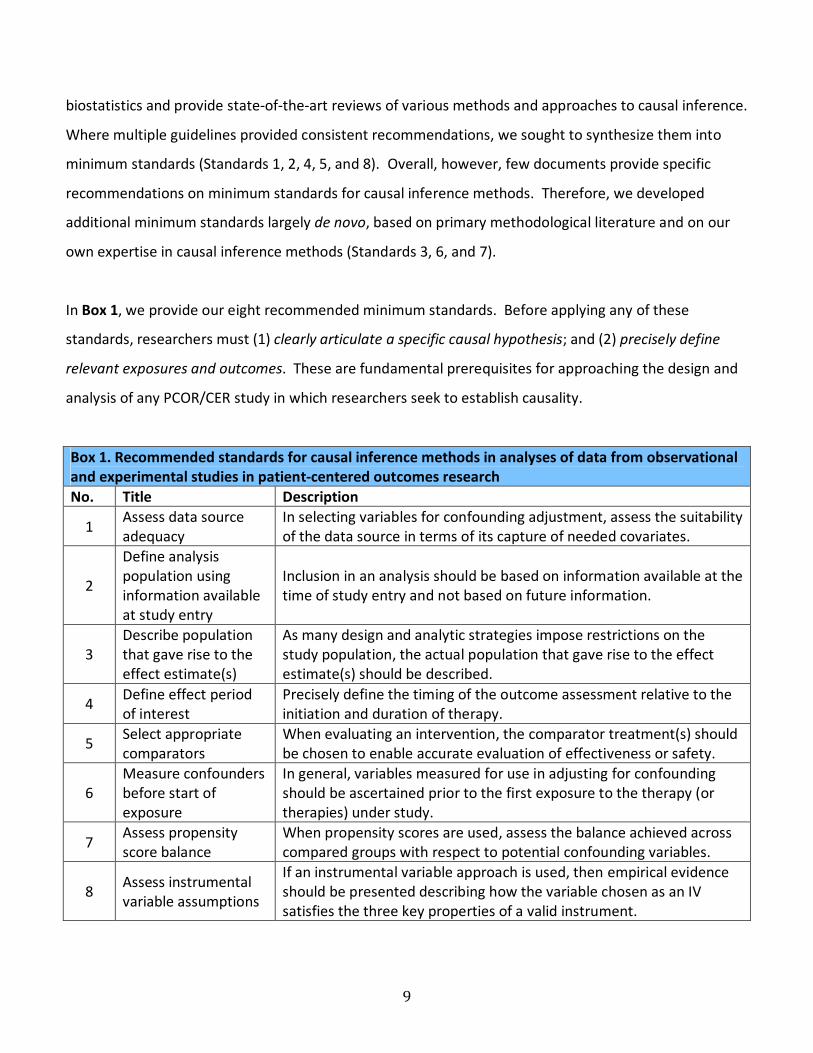
In Box 1, we provide our eight recommended minimum standards. Before applying any of these
standards, researchers must (1) clearly articulate a specific causal hypothesis; and (2) precisely define
relevant exposures and outcomes. These are fundamental prerequisites for approaching the design and
analysis of any PCOR/CER study in which researchers seek to establish causality.
Box 1. Recommended standards for causal inference methods in analyses of data from observational
and experimental studies in patient-centered outcomes research
No. Title Description
1 Assess data source
adequacy
In selecting variables for confounding adjustment, assess the suitability
of the data source in terms of its capture of needed covariates.
2
Define analysis
population using
information available
at study entry
Inclusion in an analysis should be based on information available at the
time of study entry and not based on future information.
3
Describe population
that gave rise to the
effect estimate(s)
As many design and analytic strategies impose restrictions on the
study population, the actual population that gave rise to the effect
estimate(s) should be described.
4 Define effect period
of interest
Precisely define the timing of the outcome assessment relative to the
initiation and duration of therapy.
5 Select appropriate
comparators
When evaluating an intervention, the comparator treatment(s) should
be chosen to enable accurate evaluation of effectiveness or safety.
6
Measure confounders
before start of
exposure
In general, variables measured for use in adjusting for confounding
should be ascertained prior to the first exposure to the therapy (or
therapies) under study.
7 Assess propensity
score balance
When propensity scores are used, assess the balance achieved across
compared groups with respect to potential confounding variables.
8 Assess instrumental
variable assumptions
If an instrumental variable approach is used, then empirical evidence
should be presented describing how the variable chosen as an IV
satisfies the three key properties of a valid instrument.

10
The tables in Appendix E provide additional information related to reference source documents for each
recommendation, rationale for choosing the recommended guidelines and the evidence behind the
recommended guidelines, and examples of research that demonstrate selected minimum standards.
The proposed minimum standards represent guidelines that will help enhance the methodologic rigor of
PCOR/CER studies that seek to infer causality about the effect of an intervention or interventions on an
outcome. Despite the minimum nature of these standards, not all researchers currently adhere to them,
likely owing in large part to a lack of familiarity with the biases associated with violating these principles.
These standards are not intended to help researchers decide among methods, but rather to help
researchers implement methods in a rigorous, transparent manner that facilitates causal interpretations
of PCOR and promotes their transparent communication. Further, these standards are not intended to
represent best practices, as many methods for causal inference are relatively novel and best practices for
these methods have not been established in the primary methodological literature.
C. State of the art methods not included in the main findings
Challenges encountered and gaps
Few guidance documents provide clear recommendations for the use of causal inference methods,
owing largely to the relative nascency of these methods and the lack of well-established best practices.
However, as researchers continue to adopt innovative methods and the literature matures around them,
future standards may be warranted for certain approaches.
Disease risk scores, which are summary scores similar to propensity scores but that balance confounders
based on outcome prediction rather than exposure prediction, have been the focus of considerable
recent methods work.12,18
However, this approach has received little attention in existing guidance
documents and could be a focus of future standards development.
Several recent methodologic papers have examined trimming, which is a form of restriction (See
Standard 3), as a way to enhance the validity of propensity score analyses.19,20
The results of these
studies suggest that researchers should consider trimming in any propensity score application. However,
11
existing guidance documents do not discuss trimming. Thus, trimming might considered a best practice
rather than a minimum standard.
Self-controlled designs are a useful approach for identifying triggers of outcomes.7,8
These designs are
widely used in environmental,21
cardiovascular,22
and medical product epidemiology research.23
However, these approaches are most commonly used to assess causes of adverse events and are rarely
used to compare the effectiveness of multiple interventions.
Variable selection is an important topic that is incompletely covered by existing guidance documents, but
is central to any causal inference approach that relies on conditioning on measured variables (e.g.,
matching, restriction, stratification, model adjustment). However, several recent methodologic papers
have explored variable selection and consistently recommend including outcome risk factors in the
adjustment set, and recommend avoiding conditioning on instrumental variables.24-26
However, as
explained in Standard #8, whether a variable is an instrument can never be empirically verified.
Methodology gaps
Standards 2 and 6 allude to a general rule-of-thumb for causal inference that recommends avoiding
conditioning on factors that occur after entry into the study or after the start of a treatment. Many
novel methods have been developed to enable researchers to validly account for post-entry or post-
treatment initiation variables, including g-methods,27
targeted maximum likelihood estimation,28
and
principal stratification.29
Next steps
Comprehensive reviews of major classes of methods (e.g., methods to address baseline confounding,
methods to address time-varying confounding) are needed to understand how these methods are being
used in PCOR and CER and to establish best practices.
V. SUMMARY
12
Few existing guidelines provide specific recommendations on causal inference methods for observational
and experimental studies. Combining what little guidance exists with recommendations from the
primary methodologic literature, we developed eight minimum standards for using causal inference
methods in PCOR and CER. These standards can help protect against many biases in studies that seek to
determine causality and are consistently supported by theoretical and empirical evidence in the
methodologic literature. While these standards are not currently universally adopted in applied
literature, we identified examples of studies that successfully adhered to the standards and that can be
used as templates.
13
REFERENCES (for body of report)
1. Rubin DB. On the limits of comparative effectiveness research. Stat Med 2010;29:1991-1995.
2. Schulz KF, Chalmers I, Hayes RJ, Altman DG. Empirical evidence of bias: dimensions of methodological
quality associated with estimates of treatment effects in controlled trials. JAMA 1995;273:408-412.
3. Hernán MA, Hernández-Diaz S. Beyond the intention-to-treat in comparative effectiveness research.
Clin Trials 2012;9:48-55.
4. Ray WA. Evaluating medication effects outside of clinical trials: new-user designs. Am J Epidemiol
2003;158:915-20.
5. Lipsitch M, Tchetgen Tchetgen E, Cohen T. Negative controls: a tool for detecting confounding and
bias in observational studies. Epidemiology 2010;21:383-388.
6. Schneeweiss S, Patrick AR, Stürmer T. Increasing levels of restriction in pharmacoepidemiologic
database studies of elderly and comparison with randomized trial results. Med Care 2007;45(10 Supl
2):S131-142.
7. Whitaker HJ, Farrington CP, Spiessens B, Musonda P. Tutorial in biostatistics: the self-controlled case
series method. Stat Med 2006;25:1768-1797.
8. Maclure M. The case-crossover design: a method for studying transient effects on the risk of acute
events. Am J Epidemiol 1991;133:144-153.
9. Hollis S, Campbell F. What is meant by intention to treat analysis? Survey of published randomized
controlled trials. BMJ 1999;319:670.
10. Lewis JA. Statistical principles for clinical trials (ICH E9): an introductory note on an international
guideline. Stat Med 1999;18:1903-1904.
11. Rosenbaum PR, Rubin DB. The central role of the propensity score in observational studies for causal
effects. Biometrika 1983;70:41-55.
12. Hansen BB. The prognostic analogue of the propensity score. Biometrika 2008;95:481-488.
13. Austin PC. Balance diagnostics for comparing the distribution of baseline covariates between
treatment groups in propensity-score matched samples. Stat Med 2009;28:3083-3107.
14. Angrist J, Imbens G, Rubin D. Identification of causal effects using instrumental variables. JASA
1996;91:444-455.
15. Chen Y, Briesacher BA. Use of instrumental variable in prescription drug research with observational

14
data: a systematic review. J Clin Epidemiol 2011;64:687-700.
16. Cole SR, Hernán MA, Margolick JB, Cohen MH, Robins JM. Marginal structural models for estimating
the effect of highly active antiretroviral therapy initiation on CD4 cell count. Am J Epidemiol
2005;162:471-478.
17. Cole SR, Hernán MA. Constructing inverse probability weights for marginal structural models. Am J
Epidemiol 2008;168:656-664.
18. Arbogast PG, Ray WA. Performance of disease risk scores, propensity scores, and traditional
multivariable outcome regression in the presence of multiple confounders. Am J Epidemiol
2011;174:613-620.
19. Stürmer T, Rothman KJ, Avorn J, Glynn RJ. Treatment effects in the presence of unmeasured
confounding: dealing with observations in the tails of the propensity score distribution--a simulation
study. Am J Epidemiol 2010;172:843-854.
20. Crump RK, Hotz VJ, Imbens GW, et al. Dealing with limited overlap in estimation of average
treatment effects. Biometrika 2009;96:187-199.
21. Wellenius GA, Burger MR, Coull BA, et al. Ambient pollution and the risk of acute ischemic stroke.
Arch Intern Med 2012;172:229-234.
22. Mostofsky E, Maclure M, Sherwood JB, Tofler GH, Muller JE, Mittleman MA. Risk of acute myocardial
infarction after the death of a significant person in one’s life; the Determinants of Myocardial
Infarction Onset Study. Circulation 2012;125:491-496.
23. Maclure M, Fireman B, Nelson JC, et al. When should case-only designs be used for safety monitoring
of medical products? Pharmacoepidemiol Drug Saf 2012;21(Suppl 1):50-61.
24. Brookhart MA, Schneeweiss S, Rothman KJ, et al. Variable selection for propensity score models. Am
J Epidemiol 2006;163:1149-1156.
25. Pearl J. On a class of bias-amplifying variables that endanger effect estimates. In: Gru¨nwald P,
Spirtes P, eds. Proceedings of the Twenty-Sixth Conference on Uncertainty in Artificial Intelligence
(UAI 2010). Corvallis, OR: Association for Uncertaintyin Artificial Intelligence; 2010:425–432.
26. Myers JA, Rassen JA, Gagne JJ, et al. Effects of adjusting for instrumental variables on bias and
precision of effect estimates. Am J Epidemiol 2011;174:1213-1222.

15
27. Toh S, Hernán MA. Causal inference from longitudinal studies with baseline randomization. Int J
Biostat 2008;4:Article 22.
28. van der Laan MJ. Targeted maximum likelihood based causal inference: Part I. Int J Biostat
2010;6:Article 2.
29. Frangakis CE, Rubin DB. Principal stratification in causal inference. Biometrics 2002;58:21-29.

16
APPENDIX A: Systematic search strings
MEDLINE
((((("Epidemiologic Research Design"[Majr] OR "Research Design/standards"[Majr]) OR "Information
Dissemination/methods"[Majr]) OR ("Comparative Effectiveness Research/methods"[Majr] OR
"Comparative Effectiveness Research/organization and administration"[Majr] OR "Comparative
Effectiveness Research/standards"[Majr])) OR "Research Report/standards"[Majr]) OR ("Outcome
Assessment (Health Care)"[Majr] OR ("Outcome Assessment (Health Care)/methods"[Majr] OR
"Outcome Assessment (Health Care)/standards"[Majr]))) AND ("Checklist/methods"[Mesh] OR
"Checklist/standards"[Mesh] OR "Publishing/standards"[Mesh] OR "Guideline"[Publication Type] OR
"Guidelines as Topic/standards"[Mesh])
EMBASE
'pharmacoepidemiology'/exp OR 'clinical trial (topic)'/exp AND ('practice guideline'/exp/mj
OR 'checklist'/exp/mj OR 'consensus'/exp/mj)
Web of Science
Topic = (research methods AND epidemiology) AND Topic = (guidelines OR guidance OR checklist OR
standard)
17
APPENDIX B: Organizational websites included in non-systematic search
Acronym Organization Name Web address
ACE American College of Epidemiology http://www.acepidemiology.org/
AHA American Heart Association http://www.heart.org/
AHRQ Agency for Healthcare Research and
Quality
http://www.ahrq.gov/
ASA American Statistical Association http://www.amstat.org/
CADTH Canadian Agency for Drugs and
Technologies in Health
http://cadth.ca/
Cochrane Cochrane Collaboration http://www.cochrane.org/
CONSORT Consolidated Standards of Reporting Trials
Statement website
http://www.consort-statement.org/
DGEpi German Society for Epidemiology
(Deutsche Gesellschaft für Epidemiologie)
http://www.dgepi.org/
EMA European Medicines Agency http://www.ema.europa.eu/
ENCePP European Network of Centres for
Pharmacoepidemiology and
Pharmacovigilance
http://www.encepp.eu/
FDA U.S. Food and Drug Administration http://www.fda.gov/
GRACE Good ReseArch for Comparative
Effectiveness
http://www.graceprinciples.org/
IEA International Epidemiological Association http://www.ieaweb.org/
ISoP International Society of Pharmacovigilance http://www.isoponline.org/
ISPE International Society for
Pharmacoepidemiology
http://www.pharmacoepi.org/
ISPOR International Society for
Pharmacoeconomics and Outcomes
Research
http://www.ispor.org/
IQWiQ Institute for Quality and Efficiency in
Health Care
http://www.iqwig.de/institute-for-
quality-and-efficiency-in-
health.2.en.html
NCI National Cancer Institute http://cancer.gov/
OMOP Observational Medical Outcomes
Partnership
http://omop.fnih.org/
PRISMA Transparent Reporting of Systematic
Reviews and Meta-Analyses
http://www.prisma-statement.org/
SER Society for Epidemiologic Research http://www.epiresearch.org/
STROBE Strengthening the reporting of
observational studies in epidemiology
http://www.strobe-statement.org/
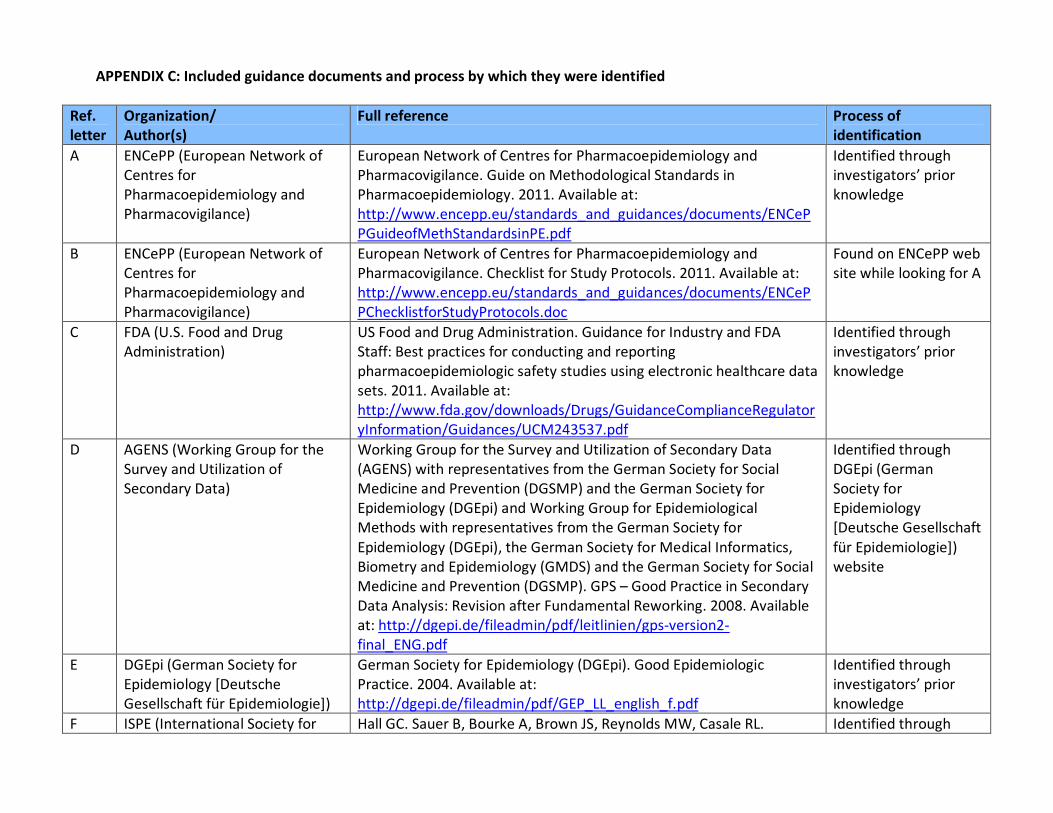
APPENDIX C: Included guidance documents and process by which they were identified
Ref.
letter
Organization/
Author(s)
Full reference Process of
identification
A ENCePP (European Network of
Centres for
Pharmacoepidemiology and
Pharmacovigilance)
European Network of Centres for Pharmacoepidemiology and
Pharmacovigilance. Guide on Methodological Standards in
Pharmacoepidemiology. 2011. Available at:
http://www.encepp.eu/standards_and_guidances/documents/ENCeP
PGuideofMethStandardsinPE.pdf
Identified through
investigators’ prior
knowledge
B ENCePP (European Network of
Centres for
Pharmacoepidemiology and
Pharmacovigilance)
European Network of Centres for Pharmacoepidemiology and
Pharmacovigilance. Checklist for Study Protocols. 2011. Available at:
http://www.encepp.eu/standards_and_guidances/documents/ENCeP
PChecklistforStudyProtocols.doc
Found on ENCePP web
site while looking for A
C FDA (U.S. Food and Drug
Administration)
US Food and Drug Administration. Guidance for Industry and FDA
Staff: Best practices for conducting and reporting
pharmacoepidemiologic safety studies using electronic healthcare data
sets. 2011. Available at:
http://www.fda.gov/downloads/Drugs/GuidanceComplianceRegulator
yInformation/Guidances/UCM243537.pdf
Identified through
investigators’ prior
knowledge
D AGENS (Working Group for the
Survey and Utilization of
Secondary Data)
Working Group for the Survey and Utilization of Secondary Data
(AGENS) with representatives from the German Society for Social
Medicine and Prevention (DGSMP) and the German Society for
Epidemiology (DGEpi) and Working Group for Epidemiological
Methods with representatives from the German Society for
Epidemiology (DGEpi), the German Society for Medical Informatics,
Biometry and Epidemiology (GMDS) and the German Society for Social
Medicine and Prevention (DGSMP). GPS – Good Practice in Secondary
Data Analysis: Revision after Fundamental Reworking. 2008. Available
at: http://dgepi.de/fileadmin/pdf/leitlinien/gps-version2-
final_ENG.pdf
Identified through
DGEpi (German
Society for
Epidemiology
[Deutsche Gesellschaft
für Epidemiologie])
website
E DGEpi (German Society for
Epidemiology [Deutsche
Gesellschaft für Epidemiologie])
German Society for Epidemiology (DGEpi). Good Epidemiologic
Practice. 2004. Available at:
http://dgepi.de/fileadmin/pdf/GEP_LL_english_f.pdf
Identified through
investigators’ prior
knowledge
F ISPE (International Society for Hall GC. Sauer B, Bourke A, Brown JS, Reynolds MW, Casale RL. Identified through

19
Pharmacoepidemiology) Guidelines for good database selection and use in
pharmacoepidemiology research. Pharmacoepidemiol Drug Saf
2012;21:1-10. Available at:
http://www.pharmacoepi.org/resources/Quality_Database_Conduct_
2-28-11.pdf
investigators’ prior
knowledge
G GRACE (Good ReseArch for
Comparative Effectiveness)
Dreyer NA, Schneeweiss S, McNeil BJ, et al. GRACE Principles:
Recognizing high-quality observational studies in comparative
effectiveness. Am J Manag Care 2010;16:467-471. Available at:
http://www.ajmc.com/issue/managed-care/2010/2010-06-vol16-
n06/AJMC_10junDreyer_467to471
Identified through
investigators’ prior
knowledge
H FDA (U.S. Food and Drug
Administration)
US Food and Drug Administration. Guidance for Industry: Good
Pharmacovigilance Practices and Pharmacoepidemiologic Assessment.
2005. Available at:
http://www.fda.gov/downloads/regulatoryinformation/guidances/uc
m126834.pdf
Referred to in C
I ISPOR (International Society for
Pharmacoeconomics and
Outcomes Research)
Motheral B, Brooks J, Clark MA, et al. A checklist for retroactive
database studies--report of the ISPOR Task Force on Retrospective
Databases. Value Health 2003;6:90-97. Available at:
http://www.ispor.org/workpaper/research_practices/A_Checklist_for_
Retroactive_Database_Studies-Retrospective_Database_Studies.pdf
Identified through
investigators’ prior
knowledge
J ISPOR (International Society for
Pharmacoeconomics and
Outcomes Research)
Berger ML, Mamdani M, Atikins D, Johnson ML. Good research
practices for comparative effectiveness research: defining, reporting
and interpreting nonrandomized studies of treatment effects using
secondary data sources: The International Society for
Pharmacoeconomics and Outcomes Research Good Research Practices
for Retrospective Database Analysis Task Force Report—Part I. Value
Health 2009;12:1044-1052. Available at:
http://www.ispor.org/TaskForces/documents/RDPartI.pdf
Identified through
investigators’ prior
knowledge
K ISPOR (International Society for
Pharmacoeconomics and
Outcomes Research)
Cox E, Martin BC, Van Staa T, Garbe E, Siebert U, Johnson ML. Good
research practices for comparative effectiveness research: approaches
to mitigate bias and confounding in the design of nonrandomized
studies of treatment effects using secondary data sources: The
International Society for Pharmacoeconomics and Outcomes Research
Good Research Practices for Retrospective Database Analysis Task
Identified through
investigators’ prior
knowledge

20
Force Report—Part II. Value Health 2009;12:1053-1061. Available at:
http://www.ispor.org/TaskForces/documents/RDPartII.pdf
L ISPOR (International Society for
Pharmacoeconomics and
Outcomes Research)
Johnson ML, Crown W, Martin BC, Dormuth CR, Siebert U. Good
research practices for comparative effectiveness research: analytic
methods to improve causal inference from nonrandomized studies of
treatment effects using secondary data sources: The International
Society for Pharmacoeconomics and Outcomes Research Good
Research Practices for Retrospective Database Analysis Task Force
Report—Part III. Value Health 2009;12:1062-1073. Available at:
http://www.ispor.org/TaskForces/documents/RDPartIII.pdf
Identified through
investigators’ prior
knowledge
M ISPOR (International Society for
Pharmacoeconomics and
Outcomes Research)
The International Society for Pharmacoeconomics and Outcomes
Research. Prospective observational studies to assess comparative
effectiveness: ISPOR Good Research Practices Task Force Report
(Draft). 2011. Available at:
http://www.ispor.org/TaskForces/documents/ProspectiveObservation
alStudiesGRPDraft.pdf
Identified through
investigators’ prior
knowledge
N AHRQ (Agency for Healthcare
Research and Quality)
Gliklich RE, Dreyer NA, eds. Registries for Evaluating Patient Outcomes:
A User’s Guide. 2nd ed. (Prepared by Outcome DEcIDE Center
[Outcome Sciences, Inc. d/b/a Outcome] under Contract No.
HHSA29020050035I TO3.) AHRQ Publication No.10-EHC049. Rockville,
MD: Agency for Healthcare Research and Quality. September 2010.
Available at:
http://effectivehealthcare.ahrq.gov/ehc/products/74/531/Registries%
202nd%20ed%20final%20to%20Eisenberg%209-15-10.pdf
Referred to in A
O AHRQ (Agency for Healthcare
Research and Quality)
Methods Guide for Effectiveness and Comparative Effectiveness
Reviews. AHRQ Publication No. 10(11)-EHC063-EF. Rockville, MD:
Agency for Healthcare Research and Quality. August 2011. Chapters
available at: www.effectivehealthcare.ahrq.gov
Referred to in G
P ASRM (American Society for
Reproductive Medicine)
The Practice Committee of the American Society for Reproductive
Medicine. Interpretation of clinical trial results. Fertil Steril
2006;86(Suppl 1):S161-167. Available at:
http://www.asrm.org/uploadedFiles/ASRM_Content/News_and_Publi
cations/Practice_Guidelines/Educational_Bulletins/Interpretation_of_c
linical(1).pdf
Identified in
systematic search

21
Q Gugiu and Gugiu Gugiu PC, Gugiu MR. A critical appraisal of standard guidelines for
grading levels of evidence. Eval Health Prof 2010;33:233-255. Available
at: http://ehp.sagepub.com/content/33/3/233.abstract
Identified in
systematic search
R CONSORT (Consolidated
Standards of Reporting Trials
Statement)
Piaggio G, Elbourne DR, Altman DG, Pocock SJ, Evans SJ; CONSORT
Group. Reporting of noninferiority and equivalence randomized trials:
an extension of the CONSORT statement." JAMA 2006;295:1152-1160.
Available at: www.consort-statement.org/index.aspx?o=1324
Identified in
systematic search
S Schneeweiss Schneeweiss S. On Guidelines for Comparative Effectiveness Research
Using Nonrandomized Studies in Secondary Data Sources. Value Health
2009;12:1041. Available at:
http://www.ispor.org/publications/value/valueinhealth_volume12_iss
ue8.pdf
Identified in
systematic search
T GRADE (Grading of
Recommendations Assessment,
Development and Evaluation)
Guyatt GH, Oxman AD, Vist G, et al. GRADE guidelines: 4. Rating the
quality of evidence--study limitations (risk of bias). J Clin Epidemiol
2011;64:407-415. Available at: http://www.ceb-
institute.org/fileadmin/upload/refman/j_clin_epidemiol_2011_64_4_4
07_guyatt.pdf
Identified in
systematic search
U STROBE-ME Gallo V, Egger M, McCormack V, et al. STrengthening the Reporting of
OBservational studies in Epidemiolgy – Molecular Epidemiology
(STROBE-ME): An Extension of the STROBE Statement. PLoS Med
2011;8:e1001117. Available at:
http://www.plosmedicine.org/article/info%3Adoi%2F10.1371%2Fjour
nal.pmed.1001117
Identified in
systematic search
V Lewis Lewis JA. Statistical principles for clinical trials (ICH E9): an
introductory note on an international guideline. Stat Med
1999;18:1903-1904.
Identified in
systematic search
W ISPE (International Society for
Pharmacoepidemiology)
Andrews EA, Avorn J, Bortnichak EA, et al; ISPE. Guidelines for Good
Epidemiology Practices for Drug, Device, and Vaccine Research in the
United States. Pharmacoepidemiol Drug Saf 1996;5:333-338. Available
at: http://www.pharmacoepi.org/resources/guidelines_08027.cfm
Identified in
systematic search
X Lu Lu CY. Observational studies: a review of study designs, challenges and
strategies to reduce confounding. Int J Clin Pract 2009;63:691-697.
Identified in
systematic search
Y AHRQ/DEcIDE Johnson ES, Bartman BA, Briesacher BA, et al. The incident user design
in comparative effectiveness research. Research from the Developing
Identified through
investigators’ prior
22
Evidence to Inform Decisions about Effectiveness (DEcIDE) Network.
AHRQ January 2012.
knowledge

APPENDIX D. Abstraction tool and summary of topics covered by each guidance documents (guidance document letters correspond to references in Appendix C)
Guidance document A B C D E F G H I J K L M Topic Data source selection X X X X X X X X
• Strengths and limitations of data sources with respect to the depth, quality, and accuracy of measured variables to control confounding X X X X
Design features X
• New user designs X X X
• Active comparators/negative controls X X X X X • Matching X X
• Restriction X X
• Self-controlled designs X X X X Roles of intention to treat, as treated, and per protocol approaches to exposure definition X X X Analytic techniques for confounding control X X • Standardization
• Stratification X X X
• Regression X X X
• Confounder summary scores X o Propensity scores X X X X
� Development (e.g. high-dimensional propensity scores) � Application (e.g. matching, stratification, weighting) X
o Disease risk scores X
� Development (e.g. most appropriate population in which to estimate)
� Application (e.g. matching, stratification, weighting) o Trimming confounder summary scores o Approaches to assess covariate balance
• Variable selection X
• Instrumental variable analyses X X X X
• Approaches to handling post-treatment variables X o Principal stratification analysis o Inverse probability weighting X o Marginal structural models/g-estimation X X
• Structural equation modeling X Sensitivity analyses X X X
• Internal adjustment (e.g. medical record to obtain additional confounder data) X
24
• External adjustment (e.g. propensity score calibration) X Guidance document N O P Q R S T U V W X Y
Topic X Data source selection X X X
• Strengths and limitations of data sources with respect to the depth, quality, and accuracy of measured variables to control confounding
Design features X X
• New user designs X X X
• Active comparators/negative controls X X X X
• Matching X X
• Restriction X X
• Self-controlled designs X X
Roles of intention to treat, as treated, and per protocol approaches to exposure definition X X
X
Analytic techniques for confounding control
• Standardization
• Stratification X X
• Regression X X X
• Confounder summary scores
o Propensity scores X X X � Development (e.g. high-dimensional propensity
scores)
� Application (e.g. matching, stratification, weighting) o Disease risk scores
� Development (e.g. most appropriate population in which to estimate)
� Application (e.g. matching, stratification, weighting) o Trimming confounder summary scores o Approaches to assess covariate balance
• Variable selection
• Instrumental variable analyses X
• Approaches to handling post-treatment variables
o Principal stratification analysis
o Inverse probability weighting
o Marginal structural models/g-estimation
• Structural equation modeling
Sensitivity analyses X
• Internal adjustment (e.g. medical record to obtain additional

25
confounder data)
• External adjustment (e.g. propensity score calibration)
APPENDIX E
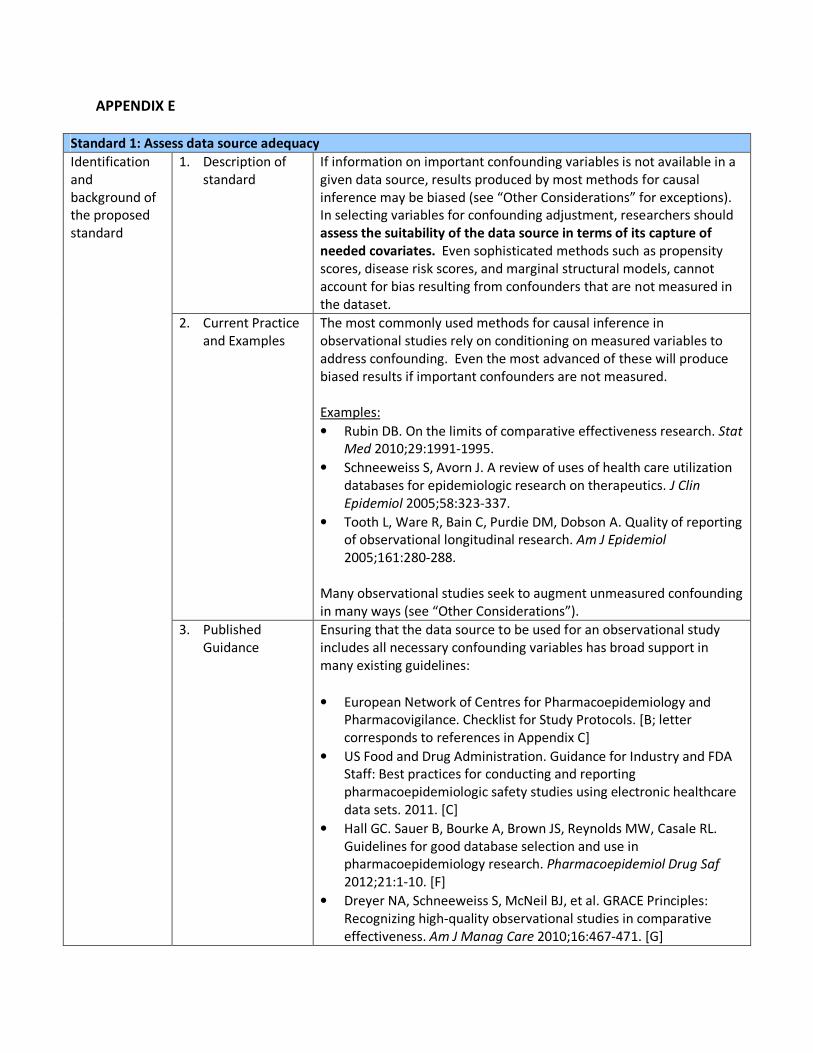
Standard 1: Assess data source adequacy
Identification
and
background of
the proposed
standard
1. Description of
standard
If information on important confounding variables is not available in a
given data source, results produced by most methods for causal
inference may be biased (see “Other Considerations” for exceptions).
In selecting variables for confounding adjustment, researchers should
assess the suitability of the data source in terms of its capture of
needed covariates. Even sophisticated methods such as propensity
scores, disease risk scores, and marginal structural models, cannot
account for bias resulting from confounders that are not measured in
the dataset.
2. Current Practice
and Examples
The most commonly used methods for causal inference in
observational studies rely on conditioning on measured variables to
address confounding. Even the most advanced of these will produce
biased results if important confounders are not measured.
Examples:
• Rubin DB. On the limits of comparative effectiveness research. Stat
Med 2010;29:1991-1995.
• Schneeweiss S, Avorn J. A review of uses of health care utilization
databases for epidemiologic research on therapeutics. J Clin
Epidemiol 2005;58:323-337.
• Tooth L, Ware R, Bain C, Purdie DM, Dobson A. Quality of reporting
of observational longitudinal research. Am J Epidemiol
2005;161:280-288.
Many observational studies seek to augment unmeasured confounding
in many ways (see “Other Considerations”).
3. Published
Guidance
Ensuring that the data source to be used for an observational study
includes all necessary confounding variables has broad support in
many existing guidelines:
• European Network of Centres for Pharmacoepidemiology and
Pharmacovigilance. Checklist for Study Protocols. [B; letter
corresponds to references in Appendix C]
• US Food and Drug Administration. Guidance for Industry and FDA
Staff: Best practices for conducting and reporting
pharmacoepidemiologic safety studies using electronic healthcare
data sets. 2011. [C]
• Hall GC. Sauer B, Bourke A, Brown JS, Reynolds MW, Casale RL.
Guidelines for good database selection and use in
pharmacoepidemiology research. Pharmacoepidemiol Drug Saf
2012;21:1-10. [F]
• Dreyer NA, Schneeweiss S, McNeil BJ, et al. GRACE Principles:
Recognizing high-quality observational studies in comparative
effectiveness. Am J Manag Care 2010;16:467-471. [G]
27
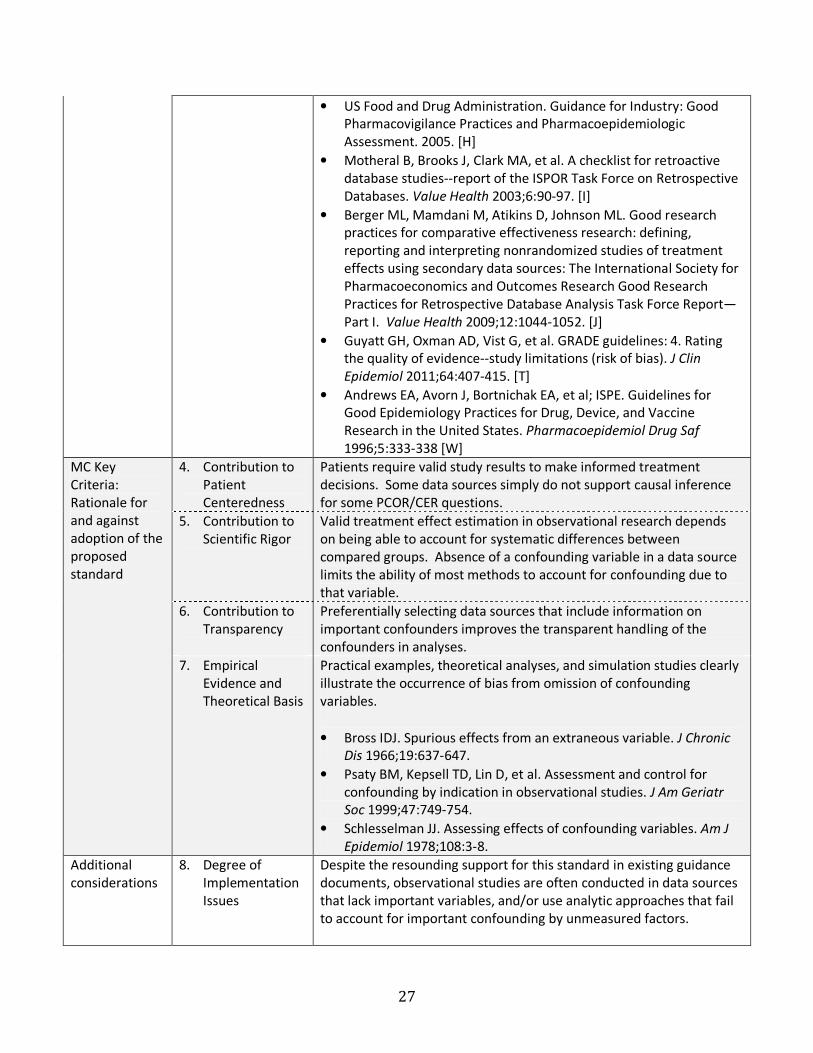
• US Food and Drug Administration. Guidance for Industry: Good
Pharmacovigilance Practices and Pharmacoepidemiologic
Assessment. 2005. [H]
• Motheral B, Brooks J, Clark MA, et al. A checklist for retroactive
database studies--report of the ISPOR Task Force on Retrospective
Databases. Value Health 2003;6:90-97. [I]
• Berger ML, Mamdani M, Atikins D, Johnson ML. Good research
practices for comparative effectiveness research: defining,
reporting and interpreting nonrandomized studies of treatment
effects using secondary data sources: The International Society for
Pharmacoeconomics and Outcomes Research Good Research
Practices for Retrospective Database Analysis Task Force Report—
Part I. Value Health 2009;12:1044-1052. [J]
• Guyatt GH, Oxman AD, Vist G, et al. GRADE guidelines: 4. Rating
the quality of evidence--study limitations (risk of bias). J Clin
Epidemiol 2011;64:407-415. [T]
• Andrews EA, Avorn J, Bortnichak EA, et al; ISPE. Guidelines for
Good Epidemiology Practices for Drug, Device, and Vaccine
Research in the United States. Pharmacoepidemiol Drug Saf
1996;5:333-338 [W]
MC Key
Criteria:
Rationale for
and against
adoption of the
proposed
standard
4. Contribution to
Patient
Centeredness
Patients require valid study results to make informed treatment
decisions. Some data sources simply do not support causal inference
for some PCOR/CER questions.
5. Contribution to
Scientific Rigor
Valid treatment effect estimation in observational research depends
on being able to account for systematic differences between
compared groups. Absence of a confounding variable in a data source
limits the ability of most methods to account for confounding due to
that variable.
6. Contribution to
Transparency
Preferentially selecting data sources that include information on
important confounders improves the transparent handling of the
confounders in analyses.
7. Empirical
Evidence and
Theoretical Basis
Practical examples, theoretical analyses, and simulation studies clearly
illustrate the occurrence of bias from omission of confounding
variables.
• Bross IDJ. Spurious effects from an extraneous variable. J Chronic
Dis 1966;19:637-647.
• Psaty BM, Kepsell TD, Lin D, et al. Assessment and control for
confounding by indication in observational studies. J Am Geriatr
Soc 1999;47:749-754.
• Schlesselman JJ. Assessing effects of confounding variables. Am J
Epidemiol 1978;108:3-8.
Additional
considerations
8. Degree of
Implementation
Issues
Despite the resounding support for this standard in existing guidance
documents, observational studies are often conducted in data sources
that lack important variables, and/or use analytic approaches that fail
to account for important confounding by unmeasured factors.
28
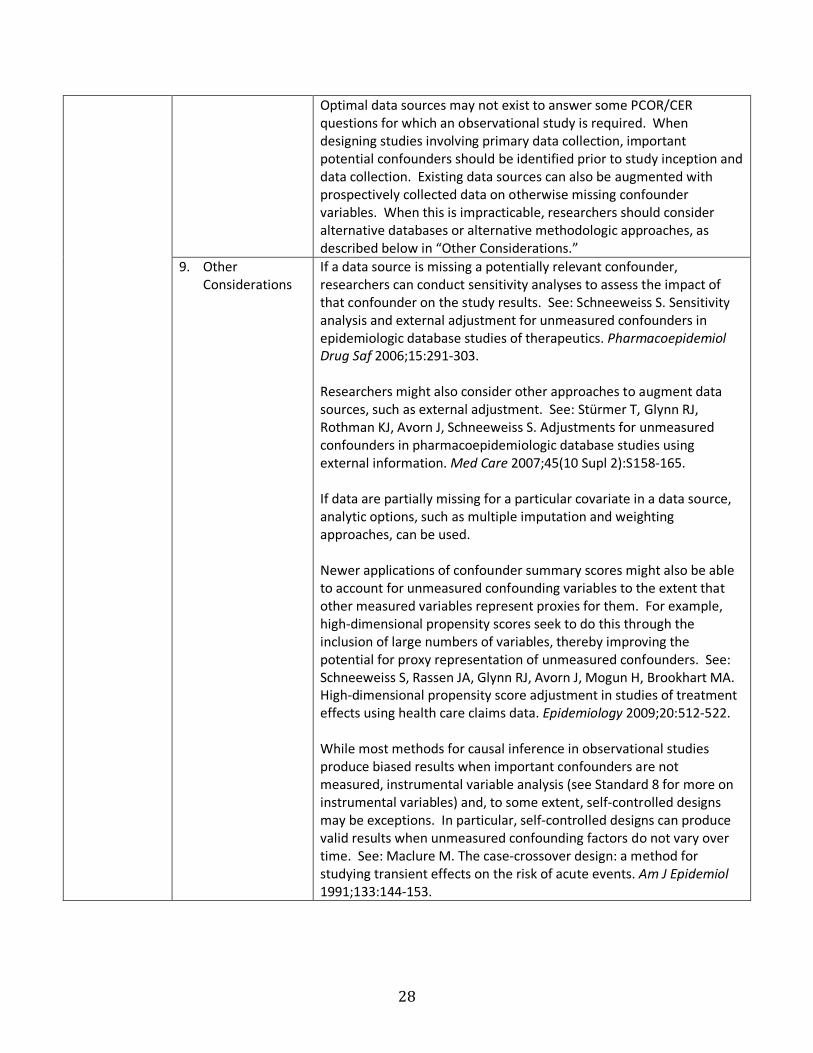
Optimal data sources may not exist to answer some PCOR/CER
questions for which an observational study is required. When
designing studies involving primary data collection, important
potential confounders should be identified prior to study inception and
data collection. Existing data sources can also be augmented with
prospectively collected data on otherwise missing confounder
variables. When this is impracticable, researchers should consider
alternative databases or alternative methodologic approaches, as
described below in “Other Considerations.”
9. Other
Considerations
If a data source is missing a potentially relevant confounder,
researchers can conduct sensitivity analyses to assess the impact of
that confounder on the study results. See: Schneeweiss S. Sensitivity
analysis and external adjustment for unmeasured confounders in
epidemiologic database studies of therapeutics. Pharmacoepidemiol
Drug Saf 2006;15:291-303.
Researchers might also consider other approaches to augment data
sources, such as external adjustment. See: Stürmer T, Glynn RJ,
Rothman KJ, Avorn J, Schneeweiss S. Adjustments for unmeasured
confounders in pharmacoepidemiologic database studies using
external information. Med Care 2007;45(10 Supl 2):S158-165.
If data are partially missing for a particular covariate in a data source,
analytic options, such as multiple imputation and weighting
approaches, can be used.
Newer applications of confounder summary scores might also be able
to account for unmeasured confounding variables to the extent that
other measured variables represent proxies for them. For example,
high-dimensional propensity scores seek to do this through the
inclusion of large numbers of variables, thereby improving the
potential for proxy representation of unmeasured confounders. See:
Schneeweiss S, Rassen JA, Glynn RJ, Avorn J, Mogun H, Brookhart MA.
High-dimensional propensity score adjustment in studies of treatment
effects using health care claims data. Epidemiology 2009;20:512-522.
While most methods for causal inference in observational studies
produce biased results when important confounders are not
measured, instrumental variable analysis (see Standard 8 for more on
instrumental variables) and, to some extent, self-controlled designs
may be exceptions. In particular, self-controlled designs can produce
valid results when unmeasured confounding factors do not vary over
time. See: Maclure M. The case-crossover design: a method for
studying transient effects on the risk of acute events. Am J Epidemiol
1991;133:144-153.

29
Standard 2: Define analysis population using information available at study entry
Identification
and
background of
the proposed
standard
1. Description of
standard
In clinical trials and in clinical practice, patients often change exposure
status over time. For example, patients assigned to a particular
therapy in a randomized trial might switch to a different therapy or
discontinue therapy altogether. However, decisions about whether
patients are included in an analysis should be based on information
available at each patient’s time of study entry and not based on
future information, such as future changes in exposure. Excluding
patients on the basis of exposure changes that occur during follow-up
can severely distort results of PCOR studies by selectively removing
patients who do particularly well or poorly with a given therapy.
2. Current Practice
and Examples
Most researchers agree that primary analysis of randomized trial data
should include all patients who entered the study, regardless of
exposure changes that occur during follow-up. The recommendation is
implicit in the commonly used intention-to-treat (ITT) principle. See:
• Fergusson D, Aaron SD, Guyatt G, Hébert P. Post-randomisation
exclusions: the intention to treat principle and excluding patients
from analysis. BMJ 2002;325:652.
• Hollis S, Campbell F. What is meant by intention to treat analysis?
Survey of published randomized controlled trials. BMJ
1999;319:670.
Whether following an IT or an “as treated” paradigm, in which patients
are analyzed according to the therapy that they actually received,
observational studies should be analyzed similarly to randomized trials
insomuch as patients who are eligible for the study based on
information available at the time of entry (i.e., the start of follow-up)
are not excluded based on subsequent changes in exposure:
• Hernán MA, Alonso A, Logan R, et al. Observational studies
analyzed like randomized experiments: an application to
postmenopausal hormone therapy and coronary heart disease.
Epidemiology 2008;19:766-779.
• Suissa S. Effectiveness of inhaled corticosteroids in chronic
obstructive pulmonary disease: immortal time bias in observational
studies. Am J Respir Crit Care Med 2003;168:49-53.
3. Published
Guidance
The standard is reflected in the guidelines developed by the
International Conference on Harmonisation Expert Working Group,
describing statistical principles for clinical trials and is consistent with
other general recommendations for the analysis of clinical trials:
• Lewis JA. Statistical principles for clinical trials (ICH E9): an
introductory note on an international guideline. Stat Med
1999;18:1903-1942. [V]
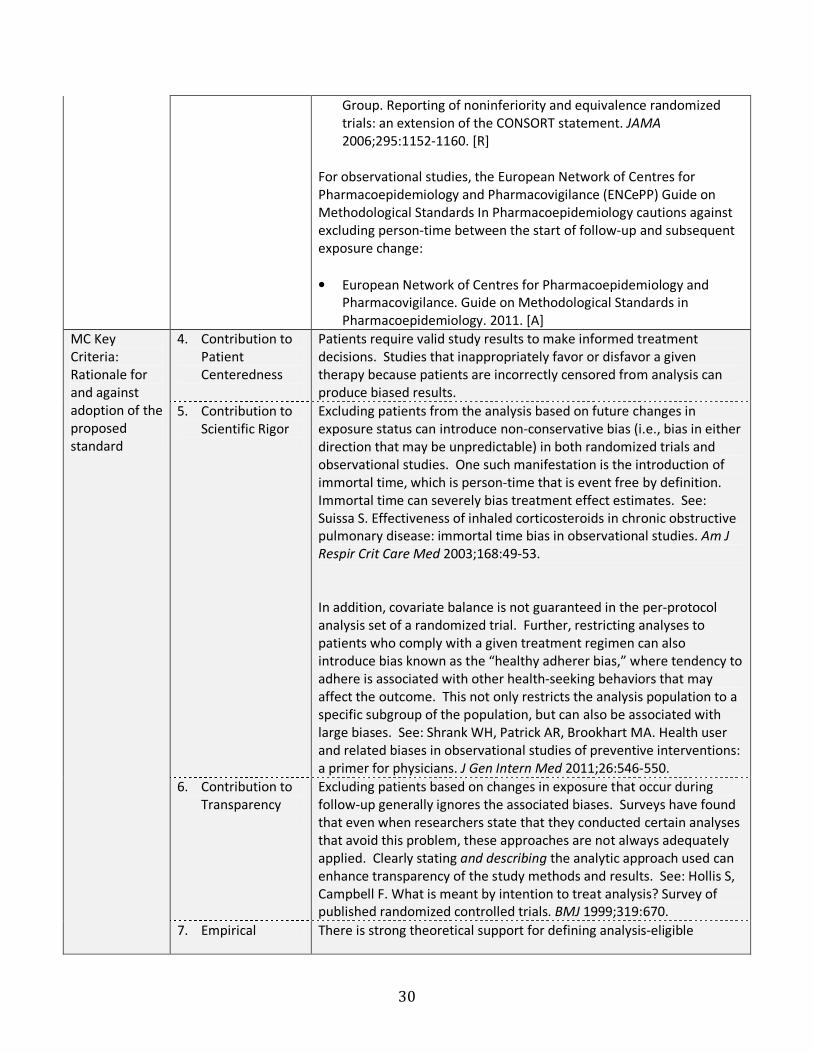
• Piaggio G, Elbourne DR, Altman DG, Pocock SJ, Evans SJ; CONSORT
30
Group. Reporting of noninferiority and equivalence randomized
trials: an extension of the CONSORT statement. JAMA
2006;295:1152-1160. [R]
For observational studies, the European Network of Centres for
Pharmacoepidemiology and Pharmacovigilance (ENCePP) Guide on
Methodological Standards In Pharmacoepidemiology cautions against
excluding person-time between the start of follow-up and subsequent
exposure change:
• European Network of Centres for Pharmacoepidemiology and
Pharmacovigilance. Guide on Methodological Standards in
Pharmacoepidemiology. 2011. [A]
MC Key
Criteria:
Rationale for
and against
adoption of the
proposed
standard
4. Contribution to
Patient
Centeredness
Patients require valid study results to make informed treatment
decisions. Studies that inappropriately favor or disfavor a given
therapy because patients are incorrectly censored from analysis can
produce biased results.
5. Contribution to
Scientific Rigor
Excluding patients from the analysis based on future changes in
exposure status can introduce non-conservative bias (i.e., bias in either
direction that may be unpredictable) in both randomized trials and
observational studies. One such manifestation is the introduction of
immortal time, which is person-time that is event free by definition.
Immortal time can severely bias treatment effect estimates. See:
Suissa S. Effectiveness of inhaled corticosteroids in chronic obstructive
pulmonary disease: immortal time bias in observational studies. Am J
Respir Crit Care Med 2003;168:49-53.
In addition, covariate balance is not guaranteed in the per-protocol
analysis set of a randomized trial. Further, restricting analyses to
patients who comply with a given treatment regimen can also
introduce bias known as the “healthy adherer bias,” where tendency to
adhere is associated with other health-seeking behaviors that may
affect the outcome. This not only restricts the analysis population to a
specific subgroup of the population, but can also be associated with
large biases. See: Shrank WH, Patrick AR, Brookhart MA. Health user
and related biases in observational studies of preventive interventions:
a primer for physicians. J Gen Intern Med 2011;26:546-550.
6. Contribution to
Transparency
Excluding patients based on changes in exposure that occur during
follow-up generally ignores the associated biases. Surveys have found
that even when researchers state that they conducted certain analyses
that avoid this problem, these approaches are not always adequately
applied. Clearly stating and describing the analytic approach used can
enhance transparency of the study methods and results. See: Hollis S,
Campbell F. What is meant by intention to treat analysis? Survey of
published randomized controlled trials. BMJ 1999;319:670.
7. Empirical There is strong theoretical support for defining analysis-eligible
31
Evidence and
Theoretical Basis
patients using only information available at baseline. Completely
excluding from the analysis those patients whose exposure changes
during follow-up can differentially exclude person-time from the
denominator of a rate or incidence measure, which can distort study
results. Post-randomization (or post-cohort entry) exclusions can
disrupt baseline balance in outcome risk factors, and also restricts the
analysis population to patient who a specific subset of the original
population.
Suissa has demonstrated the potential bias related to immortal time
that can occur when conditioning the analysis population on exposure
changes that occur during follow-up:
• Suissa S. Effectiveness of inhaled corticosteroids in chronic
obstructive pulmonary disease: immortal time bias in observational
studies. Am J Respir Crit Care Med 2003;168:49-53.
• Suissa S. Immortal time bias in observational studies of drug
effects. Pharmacoepidemiol Drug Saf 2007;16:241-249.
Additional
considerations
8. Degree of
Implementation
Issues
The standard has broad support in the clinical trials setting, where the
ITT principle is used as the primary analysis standard for superiority
studies involving beneficial outcomes. However, randomized trials
sometime use per-protocol analyses. When conducting analyses on
the per-protocol set, the precise reasons for excluding patients from
the analysis on the basis of exposure status after time zero should be
fully defined and documented, and potential biases resulting from such
exclusions should be explained. Researchers should also report the
results of per-protocol analyses alongside results from analyses that
include all patients (See: McAlister FA, Sackett DL. Active-control
equivalence trials and antihypertensive agents. Am J Med
2011;111:553-558), as done in the following examples:
• Brown MJ, Palmer CR, Castaigne A, et al. Morbidity and mortality in
patients randomised to double-blind treatment with long-acting
calcium-channel blocker or diuretic in the Internal Nifedipine GITS
study: intervention as a Goal in Hypertension Treatment (INSIGHT).
Lancet 2000;356:366-372.
• Hansson L, Lindholm LH, Niskanen L, et al. Effect of angiotensin-
converting-enzyme inhibition compared with conventional therapy
on cardiovascular morbidity and mortality in hypertension: the
Captopril Prevention Project (CAPPP) randomised trial. Lancet
1999;353:611-616.
In addition to ITT, as-treated analyses also avoid exclusions based on
future events.
Analogous to per protocol analyses of RCTs, observational studies
sometimes exclude patients who change exposure status during the

32
observation window. This can result in differential exclusion of
immortal person-time (i.e., person-time that is event free by definition)
from the different exposure groups, which can differentially distort the
outcome event rates in each group, as described above.
9. Other
Considerations
While the ITT approach ensures consistency with this standard, it is not
the only strategy that can be used to analyze data from all study
participants. Researchers can also conduct what are sometimes call
“on treatment” or “as treated analyses” (though these terms are not
consistently defined), in which patients are censored after they
discontinue or switch therapies. This allows patients to contribute
person-time to the analysis prior to the censoring event. Alternatively,
researchers can allow participants to contribute to multiple exposure
categories during follow-up, allowing participants to contribute person-
time to their current exposure group. However, these approaches can
introduce other biases if subjects preferentially switch or discontinue
treatment just before an event.
33
Standard 3: Describe population that gave rise to the effect estimate(s)
Identification
and
background of
the proposed
standard
1. Description of
standard
Many approaches to causal inference impose some form of restriction
on the original study population in order to mitigate confounding. This
can be done explicitly by restricting to patients with a certain
confounder value (e.g., age restriction) or implicitly as with matching
that excludes patients for whom reasonable matches cannot be found.
When conducting analyses that in some way exclude patients from
the original study population, researchers should describe the final
analysis population that gave rise to the effect estimate(s). If patients
excluded from the original study population differ from included
subjects on factors that modify the effect of the therapy or therapies,
then the resulting effect estimate may not accurately apply to the
whole study population.
2. Current Practice
and Examples
Restriction, matching, and stratification are common approaches to
address confounding by measured factors in observational studies.
Restriction explicitly excludes patients from an analysis to increase the
similarity of compared patients on one or more potential confounding
factors. Matching and stratification can also result in exclusions of
patients if researchers are unable to find suitable matches for some
patients or if some strata contain patients from only one treatment
group. Note that as per Standard 2, any exclusions should be based on
patients’ information at study entry.
While excluding patients from the analysis can increase the validity of
results, the analysis population (1) may not represent the original study
population (i.e., loss of generalizability) and; (2) may be too small to
allow for adequate precision of the derived estimates (i.e., loss of
power).
Restricting, stratifying, or matching on individual confounders (e.g.,
age) can make it very clear who resides in the analysis population.
However, when using confounder scores (e.g., propensity scores),
which summarize multiple covariates into single variables, the
characteristics of excluded and included patients become less
transparent. Studies that employ propensity score matching present
characteristics of the population in terms of a “Table 1.” These tables
illustrate the characteristics of patients before matching and after
matching (forming the subset of the population from which the effect
estimate is derived). Propensity score stratified analyses may include
tables of characteristics that illustrate balance within strata of the
propensity score and directly characterize the population involved in
analyses that include specific strata.
Examples:
• Connors AF, Speroff T, Dawson NV, et al. The effectiveness of right
heart catheterization in the initial care of critically ill patients.
SUPPORT Investigators. JAMA 1996;276:889-897.

34
• Seeger JD, Walker AM, Williams PL, Saperia GM, Sacks FM. A
propensity score-matched cohort study of the effect of statins,
mainly fluvastatin, on the occurrence of acute myocardial
infarction. Am J Cardiol 2003;92:1447-1451.
3. Published
Guidance
While many guidance documents mention the benefits of restriction,
matching, and stratification, none address the potential limitation that
these approaches may exclude patients from the analysis and that the
results may therefore not apply to the original study population.
However, this has been described in the methodologic literature:
• Lunt M, Solomon D, Rothman K, et al. Different methods of
balancing covariates leading to different effect estimates in the
presence of effect modification. Am J Epidemiol 2009;169:909-
917.
• Kurth T, Walker AM, Glynn RJ, Chan KA, Gaziano JM, Berger K,
Robins JM. Results of multivariable logistic regression, propensity
matching, propensity adjustment, and propensity-based weighting
under conditions of nonuniform effect. Am J Epidemiol
2006;163:262-270.
• Schneeweiss S, Patrick AR, Stürmer T. Increasing levels of
restriction in pharmacoepidemiologic database studies of elderly
and comparison with randomized trial results. Med Care
2007;45(10 Supl 2):S131-142.
• Stürmer T, Rothman KJ, Glynn RJ. Insights into different results
from different causal contrasts in the presence of effect-measure
modification. Pharmacoepidemiol Drug Saf 2006;15:698-709.
• Stürmer T, Rothman KJ, Avorn J, Glynn RJ. Treatment effects in the
presence of unmeasured confounding: dealing with observations
in the tails of the propensity score distribution--a simulation
study. Am J Epidemiol 2010;172:843-854.
MC Key
Criteria:
Rationale for
and against
adoption of the
proposed
standard
4. Contribution to
Patient
Centeredness
Patients should be able to assess if a study’s results are applicable to
them based on their respective clinical and demographic profiles.
Researchers who describe their analytic population and clarify to
whom their results apply make their research more relevant to
patients.
5. Contribution to
Scientific Rigor
Treatment effect estimates may vary across subgroups of a population
(effect measure modification or treatment effect heterogeneity). The
effect estimate provided by a study most directly applies to the
population from which the estimate arose. However, because of
methods that exclude patients, the population from which the
estimate arose may not reflect the original study population. The
attribution of an effect estimate to a different population
(generalization) requires assumptions about the homogeneity of the
effect across the characteristics of the population that defines the
subgroup. Being explicit about these assumptions improves the
scientific rigor of the research.
35
6. Contribution to
Transparency
By explicitly defining the population in which estimates are derived,
researchers improve transparency of the result, and also the
transparency of any subsequent generalization of the result.
7. Empirical
Evidence and
Theoretical Basis
The articles referenced above in “Published Guidance” represent a
sample of the work that forms the empirical and theoretical basis for
this standard.
Additional
considerations
8. Degree of
Implementation
Issues
Written reports of studies that restrict, match, or stratify on the
propensity score are sometimes not explicit about the final population
included in the analysis. This omission can result in the attribution of
subgroup effects to broader populations and might represent
inappropriate extrapolation of findings to the extent that effect
measure modifiers exist.
9. Other
Considerations
Weighting by the propensity score does not exclude patients from the
analysis per se, but can produce different results that apply to different
populations when different weights are used and when effect
modification exists. When using weighting, researchers should be
explicit about the population to which the results apply.

36
Standard 4: Define effect period of interest
Identification
and
background of
the proposed
standard
1. Description of
standard
The effects of many interventions vary with duration of use. To ensure
that an effect estimate corresponds to the question that researchers
seek to answer, the researchers must precisely define the timing of
the outcome assessment relative to the initiation and duration of
therapy. The new user design, which focuses on patients who initiate
the therapy being studied for the first time, helps make explicit when
outcomes are assessed with respect to treatment initiation and
duration. This makes it possible to quantify the incidence rate of a
given outcome in the period shortly after therapy initiation, which
cannot be done accurately when prevalent users are studied.
Prevalent users are more likely to “survive” the early period of use,
when side effects, adverse outcomes, treatment discontinuation due
to no effect, and treatment non-adherence may be more likely to
occur.
2. Current Practice
and Examples
New user designs restrict the eligible study population to patients who
initiate treatment for the first time, or after a defined period of non-
use. In contrast, prevalent user designs include all patients who are
currently using a treatment. This approach excludes patients who are
non-compliant with treatment over time, have early adverse events
that result in treatment discontinuation, or who discontinue treatment
due to lack of effect.
Most randomized controlled trials routinely implement a new-user
design, randomizing patients to treatment, sometimes after a
“washout period” of non-use. Observational studies have increasingly
used a new user design.
Examples:
• Cadarette and colleagues compared the relative effectiveness of
osteoporosis drugs in a new user design. See: Cadarette SM, Katz
JM, Brookhart MA, Stürmer T, Stedman MR, Solomon DH. Relative
effectiveness of osteoporosis drugs for prevention nonvertebral
fracture. Ann Intern Med 2008;148:637-646.
• Ray provides examples of new user and prevalent user designs and
describes the potential biases associated with prevalent user
designs. See: Ray WA. Evaluating medication effects outside of
clinical trials: new-user designs. Am J Epidemiol 2003;158:915-20.
• Suissa and colleagues discuss how treatment duration may have
biased results in prevalent user studies of oral contraceptives and
venous thromboembolism. See: Suissa S, Spitzer WO, Rainville B,
Cusson J, Lewis M, Heinemann L. Recurrent use of newer oral
contraceptives and the risk of venous thromboembolism. Hum
Reprod 2000;15:817-821.
3. Published
Guidance
The new user design is recommended as the main design for studies
assessing treatment effects in guidance documents from numerous

37
organizations including:
• European Network of Centres for Pharmacoepidemiology and
Pharmacovigilance. Guide on Methodological Standards in
Pharmacoepidemiology. 2011. [A]
• Motheral B, Brooks J, Clark MA, et al. A checklist for retroactive
database studies--report of the ISPOR Task Force on Retrospective
Databases. Value Health 2003;6:90-97. [I]
• Cox E, Martin BC, Van Staa T, Garbe E, Siebert U, Johnson ML. Good
research practices for comparative effectiveness research:
approaches to mitigate bias and confounding in the design of
nonrandomized studies of treatment effects using secondary data
sources: The International Society for Pharmacoeconomics and
Outcomes Research Good Research Practices for Retrospective
Database Analysis Task Force Report—Part II. Value Health
2009;12:1053-1061. [K]
• Johnson ES, Bartman BA, Briesacher BA, et al. The incident user
design in comparative effectiveness research. Research from the
Developing Evidence to Inform Decisions about Effectiveness
(DEcIDE) Network. AHRQ January 2012. [Y]
MC Key
Criteria:
Rationale for
and against
adoption of the
proposed
standard
4. Contribution to
Patient
Centeredness
The new user design captures the clinical consequences of the entire
therapeutic strategy over time, including early events that may cause
patients to discontinue use or co-interventions that might mediate
therapeutic effectiveness. The new user design can also provide
information about the induction period to experience an outcome.
5. Contribution to
Scientific Rigor
New users may differ from prevalent users in their response to
treatment. The new user design follows patients from the initiation of
treatment, preventing bias associated with treatment duration by
evaluating the complete course of treatment. The new user design
also supports Standard 2 by including patients who experience adverse
events early in treatment, preventing under-ascertainment of these
events, and includes patients who become non-compliant with
treatment who may have different clinical profiles than those who
remain adherent.
Secondly, the new user design supports Standard 6 by enabling
covariate measurement in the period prior to treatment initiation. This
allows for appropriate measurement of and adjustment for these
covariates before they are affected by treatment. In contrast, in
studies with prevalent users, covariates may be measured after they
are impacted by treatment exposure. Adjustment for these covariates
might underestimate (adjust away) the treatment effect if they are
intermediates on the causal pathway, or they might create bias in
either direction if they share common causes with the outcome.
6. Contribution to
Transparency
Restricting the study population to new initiators of a treatment
prevents biases associated with treatment duration and clarifies the
study question. Studies of new users and studies of prevalent users

38
provide answers to different questions.
7. Empirical
Evidence and
Theoretical Basis
Much empirical evidence describes the biases associated with
prevalent user designs:
• Danaei G, Tavakkoli M, Hernán MA. Bias in observational studies
of prevalent users: lessons for comparative effectiveness research
from a meta-analysis of statins. Am J Epidemiol 2012;175:250-262.
• Feinstein AR. Clinical biostatistics. XI. Sources of ‘chronology bias’
in cohort statistics. Clin Pharmacol Ther 1971;12:864-879.
• Hernán MA, Alonso A, Logan R, et al. Observational studies
analyzed like randomized experiments: an application to
postmenopausal hormone therapy and coronary heart disease.
Epidemioligy 2008;19:766-779.
• McMahon AD, MacDonald TM. Design issues for drug
epidemiology. Br J Clin Pharmacol 2000;50:419-425.
• Schneeweiss S, Patrick AR, Stürmer T, et al. Increasing levels of
restriction in pharmacoepidemiologic database studies of elderly
and comparison with randomized trial results. Med Care
2007;45:S131–S142.
• Suissa S, Spitzer WO, Rainville B, Cusson J, Lewis M, Heinemann L.
Recurrent use of newer oral contraceptives and the risk of venous
thromboembolism. Hum Reprod 2000;15:817-821.
The theoretical rationale for the new user design is well grounded in
the principles of epidemiology:
• Ray WA. Evaluating medication effects outside of clinical trials:
new-user designs. Am J Epidemiol 2003;158:915-20.
Additional
considerations
8. Degree of
Implementation
Issues
While the new user design has strong support in the comparative
effectiveness research community in both observational and
experimental settings, there are several considerations that merit
scrutiny when such a design is implemented:
• Applicability: In some exposure settings (e.g., smoking, nutrient
exposure), true new users may be difficult to find or identify and
randomization to new use of a treatment may be unethical.
• Applicability: Even when a year or more of “pre-exposure” time is
available to indicate that a treatment is new, a patient may have
been exposed to the regimen under study years before the period
covered in the dataset available for analysis.
• Generalizability: New users can be difficult to find when disease is
severe or has already progressed beyond an early stage, when
treatment does not follow guidelines or when treatment has
progressed over time. This restricted patient sample may limit the
generalizability of results.
• Generalizability: The length of the period of non-use prior to
treatment initiation can affect the likelihood of outcomes, as true
39
new users may be at an earlier point in the natural history of their
illness or have milder severity of illness and therefore are at lower
absolute risk of clinical events. The longer the “washout period” of
non-use, the more likely it is that fewer adverse outcomes will
occur.
• Precision: Because finding new users can be difficult, study size and
thus the number of observed events may be reduced. Wide
confidence intervals due to lack of power will limit the statistical
inferences that can be made about benefits or harms.
9. Other
Considerations
If the study goal is to capture the totality of benefits and harms across
episodic treatment use, structural models that account for time-
varying exposures and confounding must be used, even if first use is
restricted to new initiators of treatment (see Standard 6).
If the new user definition is based on meeting a certain therapy
definition, i.e., filling 3 prescriptions, but the date of follow-up starts
prior to the date at which patients meet the new user criterion, then
the study design incorporates immortal time and bias may result if this
time is differential across exposure groups.
Owing to the implementation issues described above, new user designs
cannot be categorically required of all patient-centered outcomes
research studies. If prevalent users (i.e., patients currently using
treatment, regardless of duration) are included in the study
population, a clear description of how duration of therapy might
impact the causal relationship should be given, including the effects of
under-ascertainment of events early in treatment, whether risk of
events is thought to vary with time, whether barriers to treatment
initiation and factors associated with treatment adherence may result
in a selected population, and how covariates associated with treatment
initiation but also affected by treatment use are handled.

40
Standard 5: Select appropriate comparators
Identification
and
background of
the proposed
standard
1. Description of
standard
The causal interpretation of a PCOR/CER study depends on the choice
of comparator(s). A treatment found to be effective relative to one
comparator might not be effective in another study if a different
comparator is used. Moreover, in observational studies, use of
different comparator groups can be associated with different degrees
of bias. When evaluating an intervention, the comparator
treatment(s) must be chosen to enable accurate evaluation of
effectiveness or safety. Researchers should make explicit what the
comparators are and how they were selected, focusing on clearly
describing how the chosen comparator(s) define the causal question
and impact the potential for biases. Generally, non-use (or no
treatment) comparator groups should be avoided.
2. Current Practice
and Examples
An ideal study, whether randomized or observational, controls all
sources of outcome variation except those caused by the
intervention(s) under study. Active comparators enhance the causal
interpretation of randomized trials by controlling sources of bias when
using non-use comparator groups.
Examples:
• In a randomized controlled trial, Lieberman et al. compared the
effectiveness of newer atypical versus older conventional
antipsychotic medications in the treatment of schizophrenia by
randomizing patients to one of three active comparison exposures:
perphenazine, olanzapine, or ziprasidone. See: Lieberman JA,
Stroup TS, McEvoy JP, et al. Effectiveness of antipsychotic drugs in
patients with chronic schizophrenia N Engl J Med 2005;353:1209-
1223.
• Chokshi and colleagues describe the importance of appropriate
comparator selection and its impact on the causal question. See:
Chokshi DA, Avorn J, Kesselheim AS. Health Affairs 2010;29:1842-
1848.
In an observational study, the most valid evaluation of a treatment’s
effect can be achieved by choosing one or more active comparator
treatments that have similar indication for use among a patient
population with similar disease status in terms of presence, severity,
and duration. Active comparators can also reduce information bias in
situations where treated patients are more likely to have important
confounders measured than non-treated patients.
Examples:
• Mauri and colleagues compared mortality rates among patients
with acute myocardial infarction who received either a drug-
eluting or a bare metal stent during PCI. See: Mauri L, Silbaugh TS,
Garg P et al. Drug-eluting or bare-metal stents for acute myocardial
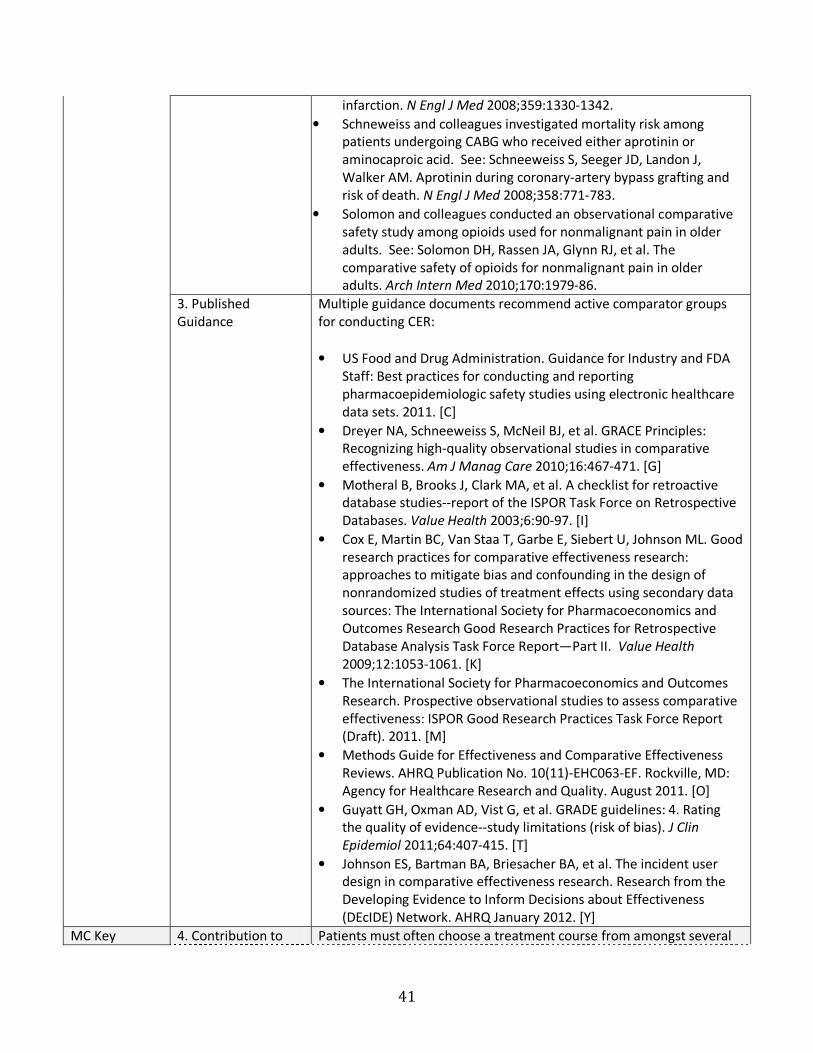
41
infarction. N Engl J Med 2008;359:1330-1342.
• Schneweiss and colleagues investigated mortality risk among
patients undergoing CABG who received either aprotinin or
aminocaproic acid. See: Schneeweiss S, Seeger JD, Landon J,
Walker AM. Aprotinin during coronary-artery bypass grafting and
risk of death. N Engl J Med 2008;358:771-783.
• Solomon and colleagues conducted an observational comparative
safety study among opioids used for nonmalignant pain in older
adults. See: Solomon DH, Rassen JA, Glynn RJ, et al. The
comparative safety of opioids for nonmalignant pain in older
adults. Arch Intern Med 2010;170:1979-86.
3. Published
Guidance
Multiple guidance documents recommend active comparator groups
for conducting CER:
• US Food and Drug Administration. Guidance for Industry and FDA
Staff: Best practices for conducting and reporting
pharmacoepidemiologic safety studies using electronic healthcare
data sets. 2011. [C]
• Dreyer NA, Schneeweiss S, McNeil BJ, et al. GRACE Principles:
Recognizing high-quality observational studies in comparative
effectiveness. Am J Manag Care 2010;16:467-471. [G]
• Motheral B, Brooks J, Clark MA, et al. A checklist for retroactive
database studies--report of the ISPOR Task Force on Retrospective
Databases. Value Health 2003;6:90-97. [I]
• Cox E, Martin BC, Van Staa T, Garbe E, Siebert U, Johnson ML. Good
research practices for comparative effectiveness research:
approaches to mitigate bias and confounding in the design of
nonrandomized studies of treatment effects using secondary data
sources: The International Society for Pharmacoeconomics and
Outcomes Research Good Research Practices for Retrospective
Database Analysis Task Force Report—Part II. Value Health
2009;12:1053-1061. [K]
• The International Society for Pharmacoeconomics and Outcomes
Research. Prospective observational studies to assess comparative
effectiveness: ISPOR Good Research Practices Task Force Report
(Draft). 2011. [M]
• Methods Guide for Effectiveness and Comparative Effectiveness
Reviews. AHRQ Publication No. 10(11)-EHC063-EF. Rockville, MD:
Agency for Healthcare Research and Quality. August 2011. [O]
• Guyatt GH, Oxman AD, Vist G, et al. GRADE guidelines: 4. Rating
the quality of evidence--study limitations (risk of bias). J Clin
Epidemiol 2011;64:407-415. [T]
• Johnson ES, Bartman BA, Briesacher BA, et al. The incident user
design in comparative effectiveness research. Research from the
Developing Evidence to Inform Decisions about Effectiveness
(DEcIDE) Network. AHRQ January 2012. [Y]
MC Key 4. Contribution to Patients must often choose a treatment course from amongst several
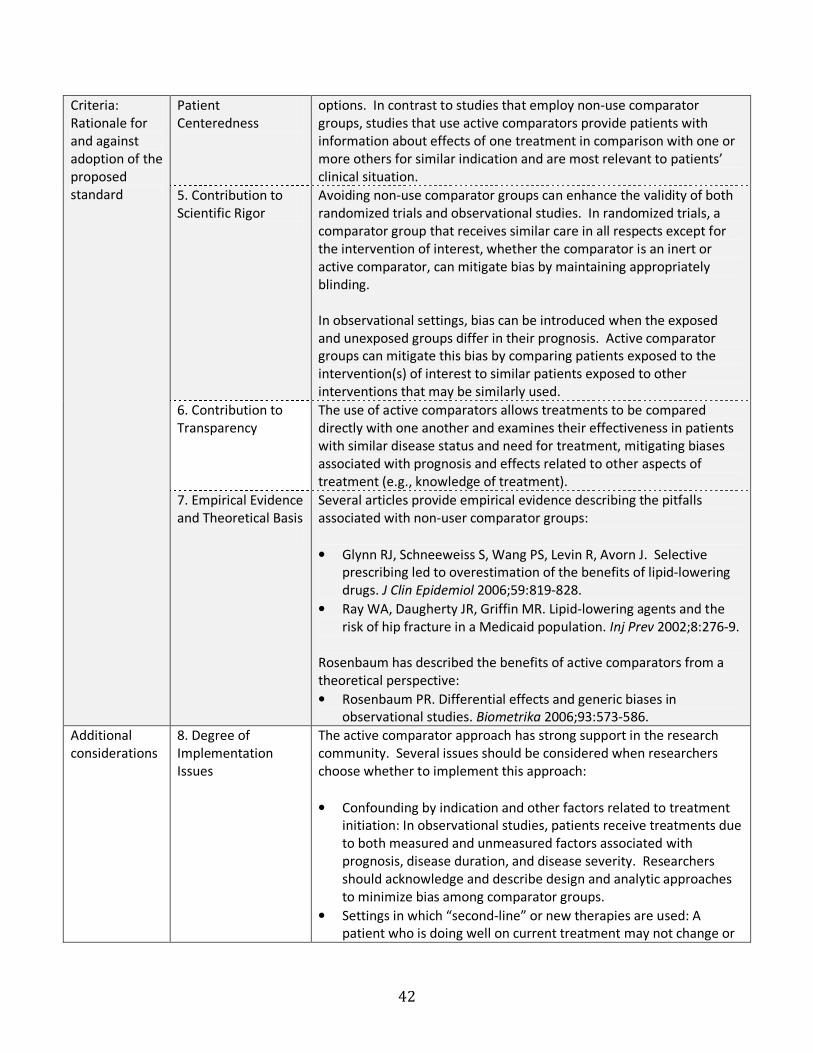
42
Criteria:
Rationale for
and against
adoption of the
proposed
standard
Patient
Centeredness
options. In contrast to studies that employ non-use comparator
groups, studies that use active comparators provide patients with
information about effects of one treatment in comparison with one or
more others for similar indication and are most relevant to patients’
clinical situation.
5. Contribution to
Scientific Rigor
Avoiding non-use comparator groups can enhance the validity of both
randomized trials and observational studies. In randomized trials, a
comparator group that receives similar care in all respects except for
the intervention of interest, whether the comparator is an inert or
active comparator, can mitigate bias by maintaining appropriately
blinding.
In observational settings, bias can be introduced when the exposed
and unexposed groups differ in their prognosis. Active comparator
groups can mitigate this bias by comparing patients exposed to the
intervention(s) of interest to similar patients exposed to other
interventions that may be similarly used.
6. Contribution to
Transparency
The use of active comparators allows treatments to be compared
directly with one another and examines their effectiveness in patients
with similar disease status and need for treatment, mitigating biases
associated with prognosis and effects related to other aspects of
treatment (e.g., knowledge of treatment).
7. Empirical Evidence
and Theoretical Basis
Several articles provide empirical evidence describing the pitfalls
associated with non-user comparator groups:
• Glynn RJ, Schneeweiss S, Wang PS, Levin R, Avorn J. Selective
prescribing led to overestimation of the benefits of lipid-lowering
drugs. J Clin Epidemiol 2006;59:819-828.
• Ray WA, Daugherty JR, Griffin MR. Lipid-lowering agents and the
risk of hip fracture in a Medicaid population. Inj Prev 2002;8:276-9.
Rosenbaum has described the benefits of active comparators from a
theoretical perspective:
• Rosenbaum PR. Differential effects and generic biases in
observational studies. Biometrika 2006;93:573-586.
Additional
considerations
8. Degree of
Implementation
Issues
The active comparator approach has strong support in the research
community. Several issues should be considered when researchers
choose whether to implement this approach:
• Confounding by indication and other factors related to treatment
initiation: In observational studies, patients receive treatments due
to both measured and unmeasured factors associated with
prognosis, disease duration, and disease severity. Researchers
should acknowledge and describe design and analytic approaches
to minimize bias among comparator groups.
• Settings in which “second-line” or new therapies are used: A
patient who is doing well on current treatment may not change or

43
“step up” to a new or second line comparator therapy, whereas a
patient whose condition continues to worsen or who cannot
tolerate current treatment may be switched to the new therapy.
To mitigate differences between exposure groups, researchers
might define an eligible cohort based on use of common first-line
therapy and then define exposure groups based on addition or
switch to another product. This improves comparability of disease
severity and progression because all required stepped-up therapy.
If appropriate active comparators cannot be found then, at minimum,
a patient population with demonstrated comparable health services
use (e.g., use of prescription drugs, screening tests, or vaccines, as
appropriate) should be used to balance active engagement with the
healthcare system among exposure groups.
9. Other
Considerations
In settings where the definition of active comparators will involve a
contrast between a readily available treatment (e.g., prescription drug)
and a treatment that may occur with some time delay (e.g., surgery,
other procedure), consideration should be given to the definition of
the exposure start date. The exposure start date with the least
misclassification is the date on which the treatment was prescribed
(i.e., date of provider visit). However, the lag time between the
provider visit and filling a prescription versus having surgery may be
differential, introducing bias. In such situations, it may be preferable
to choose the fill date and procedure date and accept non-differential
bias from unfilled but prescribed and prescribed but not undertaken
procedures.
If a non-user comparator group is defined, the rationale for and
recognition of biases associated with this choice should be described.
Generally, comparing patients who use a treatment to non-users
introduces confounding biases related to health system engagement
(healthy user bias), disease duration, and disease severity.

44

45
Standard 6: Measure confounders before start of exposure
Identification
and
background of
the proposed
standard
1. Description of
standard
Valid CER requires researchers to ensure that differences in outcomes
among compared groups are attributable to the therapies themselves
and not to differences in the patients who received them. Outcomes
risk factors can be balanced using many methods, including
randomization, design features, such as matching, and statistical
adjustment. In general, variables for use in confounding adjustment
(either in the design or analysis) should be ascertained and measured
prior to the first exposure to the therapy (or therapies) under study.
Standard approaches to confounding adjustment can be biased when
used to adjust for factors measured after the start of the exposure if
these factors are affected by the exposure.
2. Current Practice
and Examples
In expectation, randomization balances all baseline variables. In
observational studies, researchers generally attempt to mimic the
baseline randomization process by measuring and adjusting for pre-
treatment variables:
• Rosenbaum PR, Rubin DB. The central role of the propensity score
in observational studies for causal effects. Biometrika 1983;70:41-
55.
• Schneeweiss S. Developments in post-marketing comparative
effectiveness research. Clin Pharmacol Ther 2007;82:143-156.
However, some observational studies continue to employ conditional
survival models (e.g., Cox proportional hazards models) with time-
dependent covariates. Researchers also sometimes adjust for
variables measured between the start of exposure and the outcome
event date in case-control studies. Both approaches can produce bias
when these variables are affected by prior exposure and are causes of
or share common causes with the outcome.
3. Published
Guidance
The primary methodological literature uniformly recommends avoiding
adjustment for variables affected by prior exposure, which can most
easily be achieved by measuring all potential confounders before the
start of a treatment:
• Weinberg CR. Toward a clearer definition of confounding. Am J
Epidemiol 1993;137:1-8.
• Greenland S. Quantifying biases in causal models: classical
confounding vs collider-stratification bias. Epidemiology
2003;14:300-306.
MC Key
Criteria:
Rationale for
and against
adoption of the
proposed
4. Contribution to
Patient
Centeredness
Valid approaches to CER are required to produce the most useful
information for patients in order to guide treatment choices.
5. Contribution to
Scientific Rigor
Adjusting for variables measured during follow-up (i.e., after the start
of a therapy) can introduce bias in the analysis of both randomized

46
standard trial and observational study data if these variables both (1) are
affected by the exposure; and (2) affect the outcome or share common
causes with the outcome. Avoiding this practice can enhance the
validity of PCOR/CER. Alternatively, researchers may adjust for
variables measured during follow-up if they provide clear rationale for
why the variables are not affected by prior exposure or why the
variables do not affect or share common causes with the outcome.
6. Contribution to
Transparency
Specifying when variables are measured with respect to the start of
exposure increases transparency in PCOR/CER studies by making it
clear whether estimated parameters may be biased.
When researchers do ascertain variables after the start of exposure,
providing a clear rational for why these variables do not depend on
prior exposure or using methods to appropriately adjust for them (see
“Other Considerations” below) can also enhance transparency.
7. Empirical
Evidence and
Theoretical Basis
This standard is supported by both solid theoretical justification and
empirical evidence. If a variable is affected by prior exposure and in
turn affects the outcome, then the variable is an intermediate on the
causal pathway and adjustment for it using traditional methods will
distort the true relation between the exposure and the outcome:
• Robins J. The control of confounding by intermediate variables.
Stat Med 1989;8:679-701.
If the variable is affected by prior exposure and it shares a common
cause with the outcome, then adjusting for it can distort the exposure-
outcome relation by opening up a so-called backdoor path:
• Cole SR, Platt RW, Schisterman EF, et al. Illustrating bias due to
conditioning on a collider. Int J Epidemiol 2010;39:417-420.
• VanderWeele TJ, Mumford SL, Schisterman EF. Conditioning on
intermediates in perinatal epidemiology. Epidemiology 2012;23:1-
9.
Additional
considerations
8. Degree of
Implementation
Issues
While most patient-centered outcomes research studies and
comparative effectiveness studies do successfully measure all
potentially confounding variables prior to initial exposure, it is not
uncommon to find studies that violate this precept and do not address
the problem with appropriate methods (see “Other Considerations”
below).
9. Other
Considerations
If the research question pertains to the joint effect of a time-varying
exposure, rather than a fixed exposure such as random assignment in
an intention-to-treat analysis, then adjustment might be needed for
time-varying confounders. Time-varying confounders refer to
variables that are affected by prior exposure and that affect
subsequent exposure and the outcome of interest. Traditional analytic
approaches, such as conditional regression models, can produce
biased results when adjusting for time-varying confounding (See:
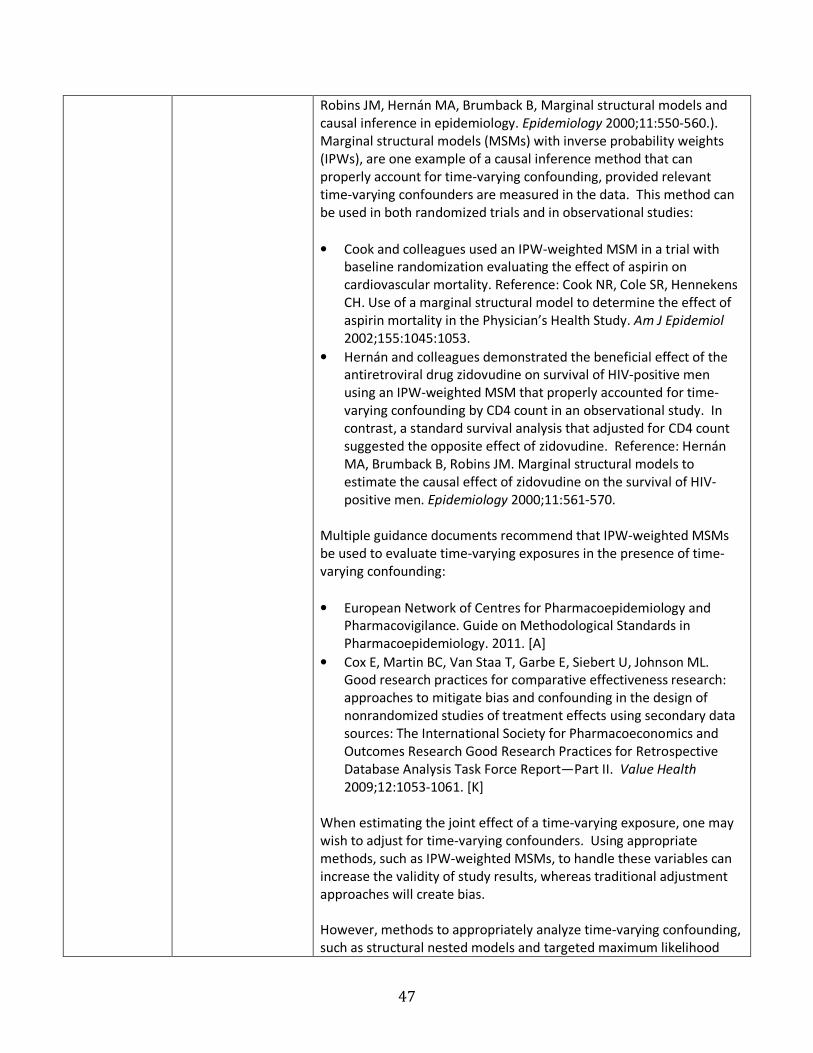
47
Robins JM, Hernán MA, Brumback B, Marginal structural models and
causal inference in epidemiology. Epidemiology 2000;11:550-560.).
Marginal structural models (MSMs) with inverse probability weights
(IPWs), are one example of a causal inference method that can
properly account for time-varying confounding, provided relevant
time-varying confounders are measured in the data. This method can
be used in both randomized trials and in observational studies:
• Cook and colleagues used an IPW-weighted MSM in a trial with
baseline randomization evaluating the effect of aspirin on
cardiovascular mortality. Reference: Cook NR, Cole SR, Hennekens
CH. Use of a marginal structural model to determine the effect of
aspirin mortality in the Physician’s Health Study. Am J Epidemiol
2002;155:1045:1053.
• Hernán and colleagues demonstrated the beneficial effect of the
antiretroviral drug zidovudine on survival of HIV-positive men
using an IPW-weighted MSM that properly accounted for time-
varying confounding by CD4 count in an observational study. In
contrast, a standard survival analysis that adjusted for CD4 count
suggested the opposite effect of zidovudine. Reference: Hernán
MA, Brumback B, Robins JM. Marginal structural models to
estimate the causal effect of zidovudine on the survival of HIV-
positive men. Epidemiology 2000;11:561-570.
Multiple guidance documents recommend that IPW-weighted MSMs
be used to evaluate time-varying exposures in the presence of time-
varying confounding:
• European Network of Centres for Pharmacoepidemiology and
Pharmacovigilance. Guide on Methodological Standards in
Pharmacoepidemiology. 2011. [A]
• Cox E, Martin BC, Van Staa T, Garbe E, Siebert U, Johnson ML.
Good research practices for comparative effectiveness research:
approaches to mitigate bias and confounding in the design of
nonrandomized studies of treatment effects using secondary data
sources: The International Society for Pharmacoeconomics and
Outcomes Research Good Research Practices for Retrospective
Database Analysis Task Force Report—Part II. Value Health
2009;12:1053-1061. [K]
When estimating the joint effect of a time-varying exposure, one may
wish to adjust for time-varying confounders. Using appropriate
methods, such as IPW-weighted MSMs, to handle these variables can
increase the validity of study results, whereas traditional adjustment
approaches will create bias.
However, methods to appropriately analyze time-varying confounding,
such as structural nested models and targeted maximum likelihood

48
approaches, may be unfamiliar to many investigators, which could
reduce transparency. Among these methods, IPW-weighted marginal
structural models are the most widely used.

49
Standard 7: Assess propensity score balance
Identification
and
background of
the proposed
standard
1. Description of
standard
Propensity scores are a useful method to adjust for many measured
confounding variables. A patient’s propensity score is his or her
probability of receiving a particular treatment, conditional on
measured covariates. On average, patients with similar propensity
scores in a study tend to have similar distributions of variables used to
build the propensity score. When conducting analyses that use
propensity scores to balance covariate distributions across exposure
groups, researchers should assess the balance achieved across
compared groups with respect to potential confounding variables.
Balance in confounders between treatment groups can be easily
assessed after matching on or weighting by the propensity score or
within strata of the propensity score.
2. Current Practice
and Examples
Propensity score analyses that do not assess balance across compared
groups with respect to potential confounding variables may not fully
account for the potential confounding.
Examples:
• Austin PC. Balance diagnostics for comparing the distribution of
baseline covariates between treatment groups in propensity-score
matched samples. Stat Med 2009;28:3083-3107.
• Austin PC. The relative ability of different propensity-score
methods to balance measured covariates between treated and
untreated subjects in observational studies. Med Decis Making
2009;29:661-677.
• Seeger JD, Kurth T, Walker AM. Use of propensity score technique
to account for exposure-related covariates: an example and lesson.
Med Care 2007;45(10 Supl 2):S143-8.
• Schneeweiss S, Rassen JA, Glynn RJ, Avorn J, Mogun H, Brookhart
MA. High-dimensional Propensity Score Adjustment in Studies of
Treatment Effects Using Health Care Claims Data. Epidemiology
2009;20:512-522.
3. Published
Guidance
No existing guidance documents specifically address assessing balance
on the propensity score. However, this standard is supported by
recommendations in many methodological papers:
• Austin PC. Balance diagnostics for comparing the distribution of
baseline covariates between treatment groups in propensity-score
matched samples. Stat Med 2009;28:3083–3107.
• Belitser SV, Martens EP, Pestman WR, Groenwold RH, de Boer A,
Klungel OH. Measuring balance and model selection in propensity
score methods. Pharmacoepidemiol Drug Saf 2011;20:1115-1129.
• D’Agostino RB Jr. Propensity score methods for bias reduction in
the comparison of a treatment to a non-randomized control group.
Stat Med 1998;17:2265-2281.
MC Key 4. Contribution to Patients require valid study results to make informed treatment
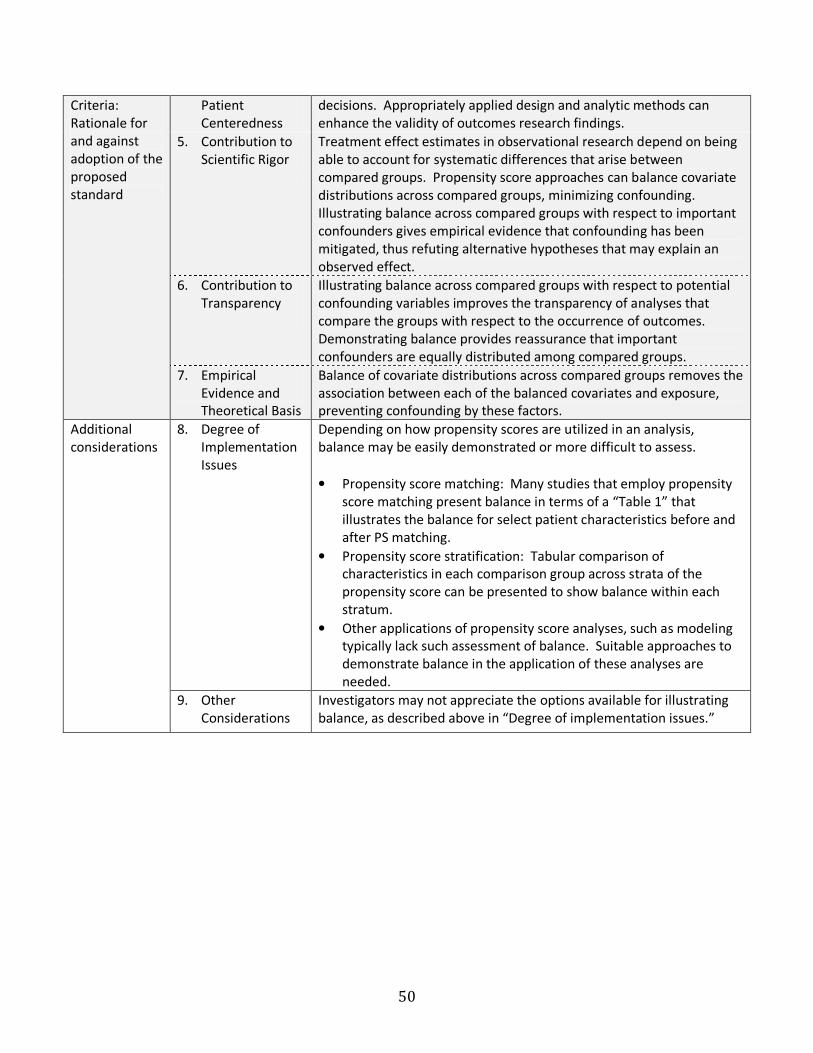
50
Criteria:
Rationale for
and against
adoption of the
proposed
standard
Patient
Centeredness
decisions. Appropriately applied design and analytic methods can
enhance the validity of outcomes research findings.
5. Contribution to
Scientific Rigor
Treatment effect estimates in observational research depend on being
able to account for systematic differences that arise between
compared groups. Propensity score approaches can balance covariate
distributions across compared groups, minimizing confounding.
Illustrating balance across compared groups with respect to important
confounders gives empirical evidence that confounding has been
mitigated, thus refuting alternative hypotheses that may explain an
observed effect.
6. Contribution to
Transparency
Illustrating balance across compared groups with respect to potential
confounding variables improves the transparency of analyses that
compare the groups with respect to the occurrence of outcomes.
Demonstrating balance provides reassurance that important
confounders are equally distributed among compared groups.
7. Empirical
Evidence and
Theoretical Basis
Balance of covariate distributions across compared groups removes the
association between each of the balanced covariates and exposure,
preventing confounding by these factors.
Additional
considerations
8. Degree of
Implementation
Issues
Depending on how propensity scores are utilized in an analysis,
balance may be easily demonstrated or more difficult to assess.
• Propensity score matching: Many studies that employ propensity
score matching present balance in terms of a “Table 1” that
illustrates the balance for select patient characteristics before and
after PS matching.
• Propensity score stratification: Tabular comparison of
characteristics in each comparison group across strata of the
propensity score can be presented to show balance within each
stratum.
• Other applications of propensity score analyses, such as modeling
typically lack such assessment of balance. Suitable approaches to
demonstrate balance in the application of these analyses are
needed.
9. Other
Considerations
Investigators may not appreciate the options available for illustrating
balance, as described above in “Degree of implementation issues.”
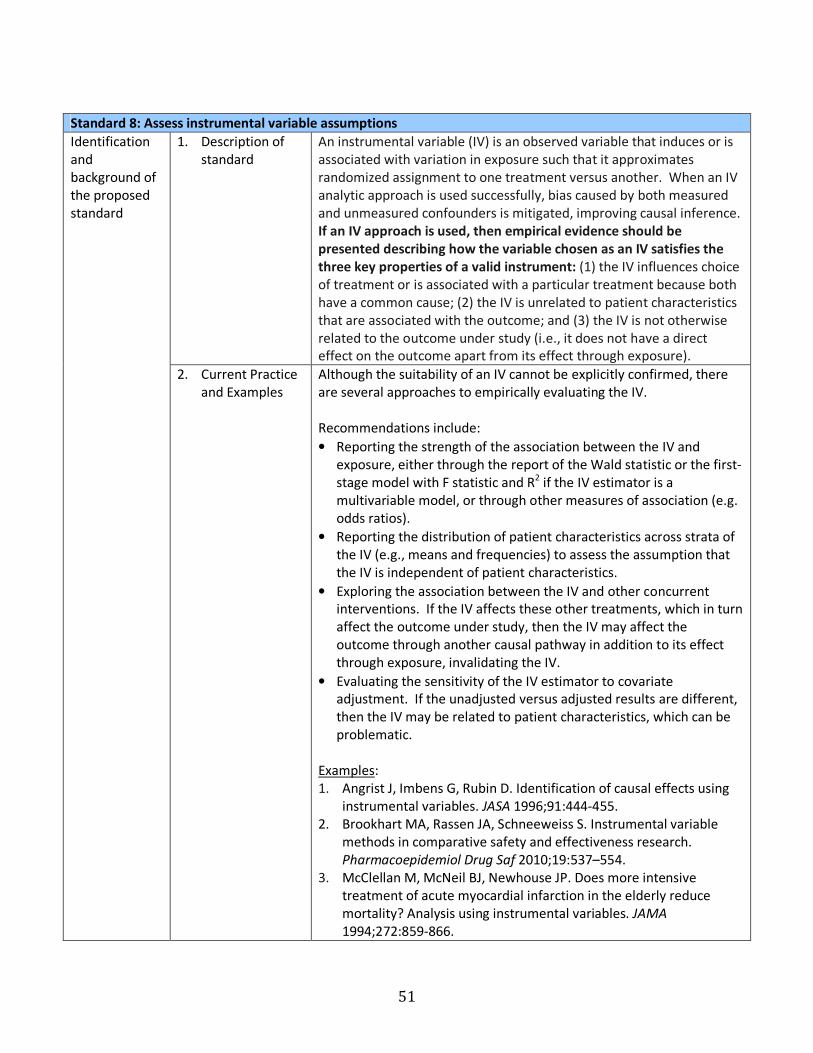
51
Standard 8: Assess instrumental variable assumptions
Identification
and
background of
the proposed
standard
1. Description of
standard
An instrumental variable (IV) is an observed variable that induces or is
associated with variation in exposure such that it approximates
randomized assignment to one treatment versus another. When an IV
analytic approach is used successfully, bias caused by both measured
and unmeasured confounders is mitigated, improving causal inference.
If an IV approach is used, then empirical evidence should be
presented describing how the variable chosen as an IV satisfies the
three key properties of a valid instrument: (1) the IV influences choice
of treatment or is associated with a particular treatment because both
have a common cause; (2) the IV is unrelated to patient characteristics
that are associated with the outcome; and (3) the IV is not otherwise
related to the outcome under study (i.e., it does not have a direct
effect on the outcome apart from its effect through exposure).
2. Current Practice
and Examples
Although the suitability of an IV cannot be explicitly confirmed, there
are several approaches to empirically evaluating the IV.
Recommendations include:
• Reporting the strength of the association between the IV and
exposure, either through the report of the Wald statistic or the first-
stage model with F statistic and R2 if the IV estimator is a
multivariable model, or through other measures of association (e.g.
odds ratios).
• Reporting the distribution of patient characteristics across strata of
the IV (e.g., means and frequencies) to assess the assumption that
the IV is independent of patient characteristics.
• Exploring the association between the IV and other concurrent
interventions. If the IV affects these other treatments, which in turn
affect the outcome under study, then the IV may affect the
outcome through another causal pathway in addition to its effect
through exposure, invalidating the IV.
• Evaluating the sensitivity of the IV estimator to covariate
adjustment. If the unadjusted versus adjusted results are different,
then the IV may be related to patient characteristics, which can be
problematic.
Examples:
1. Angrist J, Imbens G, Rubin D. Identification of causal effects using
instrumental variables. JASA 1996;91:444-455.
2. Brookhart MA, Rassen JA, Schneeweiss S. Instrumental variable
methods in comparative safety and effectiveness research.
Pharmacoepidemiol Drug Saf 2010;19:537–554.
3. McClellan M, McNeil BJ, Newhouse JP. Does more intensive
treatment of acute myocardial infarction in the elderly reduce
mortality? Analysis using instrumental variables. JAMA
1994;272:859-866.
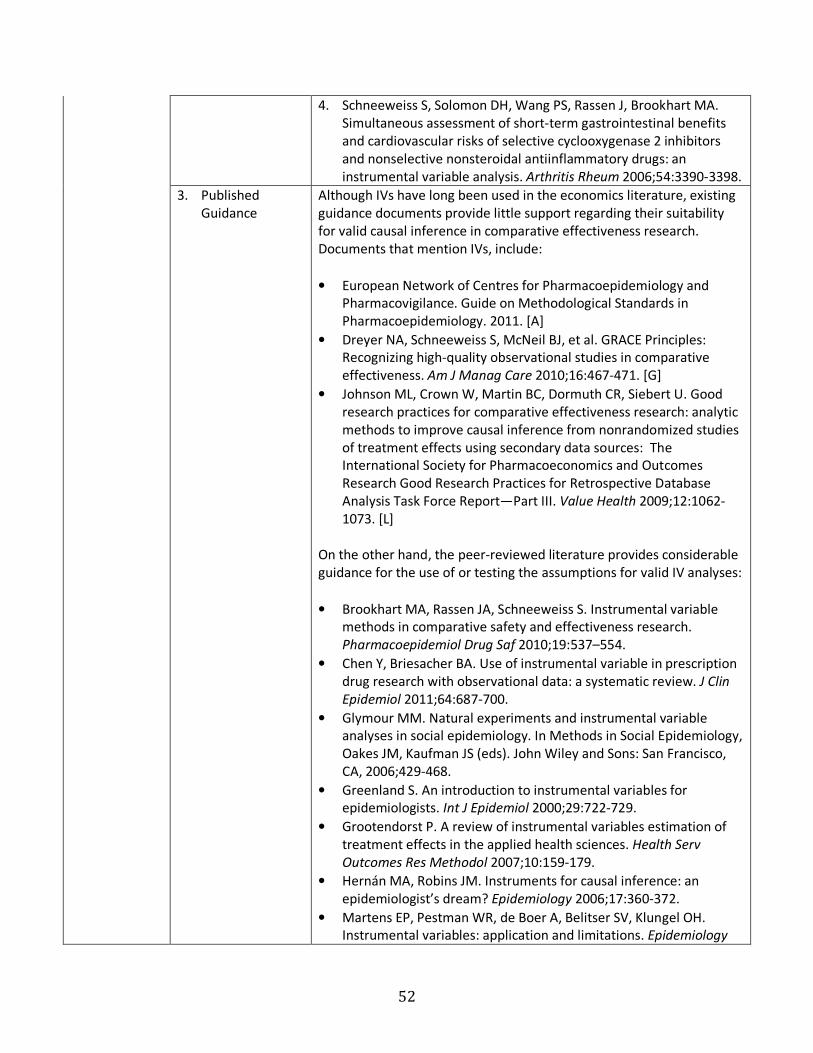
52
4. Schneeweiss S, Solomon DH, Wang PS, Rassen J, Brookhart MA.
Simultaneous assessment of short-term gastrointestinal benefits
and cardiovascular risks of selective cyclooxygenase 2 inhibitors
and nonselective nonsteroidal antiinflammatory drugs: an
instrumental variable analysis. Arthritis Rheum 2006;54:3390-3398.
3. Published
Guidance
Although IVs have long been used in the economics literature, existing
guidance documents provide little support regarding their suitability
for valid causal inference in comparative effectiveness research.
Documents that mention IVs, include:
• European Network of Centres for Pharmacoepidemiology and
Pharmacovigilance. Guide on Methodological Standards in
Pharmacoepidemiology. 2011. [A]
• Dreyer NA, Schneeweiss S, McNeil BJ, et al. GRACE Principles:
Recognizing high-quality observational studies in comparative
effectiveness. Am J Manag Care 2010;16:467-471. [G]
• Johnson ML, Crown W, Martin BC, Dormuth CR, Siebert U. Good
research practices for comparative effectiveness research: analytic
methods to improve causal inference from nonrandomized studies
of treatment effects using secondary data sources: The
International Society for Pharmacoeconomics and Outcomes
Research Good Research Practices for Retrospective Database
Analysis Task Force Report—Part III. Value Health 2009;12:1062-
1073. [L]
On the other hand, the peer-reviewed literature provides considerable
guidance for the use of or testing the assumptions for valid IV analyses:
• Brookhart MA, Rassen JA, Schneeweiss S. Instrumental variable
methods in comparative safety and effectiveness research.
Pharmacoepidemiol Drug Saf 2010;19:537–554.
• Chen Y, Briesacher BA. Use of instrumental variable in prescription
drug research with observational data: a systematic review. J Clin
Epidemiol 2011;64:687-700.
• Glymour MM. Natural experiments and instrumental variable
analyses in social epidemiology. In Methods in Social Epidemiology,
Oakes JM, Kaufman JS (eds). John Wiley and Sons: San Francisco,
CA, 2006;429-468.
• Greenland S. An introduction to instrumental variables for
epidemiologists. Int J Epidemiol 2000;29:722-729.
• Grootendorst P. A review of instrumental variables estimation of
treatment effects in the applied health sciences. Health Serv
Outcomes Res Methodol 2007;10:159-179.
• Hernán MA, Robins JM. Instruments for causal inference: an
epidemiologist’s dream? Epidemiology 2006;17:360-372.
• Martens EP, Pestman WR, de Boer A, Belitser SV, Klungel OH.
Instrumental variables: application and limitations. Epidemiology

53
2006;17:260-267.
• Newhouse JP, McClellan M. Econometrics in outcomes research:
the use of instrumental variables. Annu Rev Public Health
1998;19:17-34.
MC Key
Criteria:
Rationale for
and against
adoption of the
proposed
standard
4. Contribution to
Patient
Centeredness
Patients require valid study results to make informed treatment
decisions. Evidence that strengthens the validity of the analytic
approach used to produce results can strengthen the confidence
patients have in those results.
5. Contribution to
Scientific Rigor
Assessing the assumptions that underlie whether an IV is valid provides
evidence of the methodologic rigor of an IV analysis beyond theoretical
justifications and arguments of plausibility.
6. Contribution to
Transparency
Failure to provide empirical evidence that the chosen instrument
meets the 3 properties of the IV ignores possible biases that may be
associated with a weak or unsuitable IV.
7. Empirical
Evidence and
Theoretical Basis
The potential biases associated with violating IV assumptions are well
described:
• Hernán MA, Robins JM. Instruments for causal inference: an
epidemiologist’s dream? Epidemiology 2006;17:360-372.
• Crown WH, Henk HJ, Vanness DJ. Some cautions on the use of
instrumental variables estimators in outcomes research: how bias
in instrumental variables estimators is affected by instrument
strength, instrument contamination, and sample size. Value Health
2011;14:1078-1084.
Additional
considerations
8. Degree of
Implementation
Issues
The lack of information on unmeasured characteristics and on the
importance of some unmeasured characteristics does not allow for
explicit confirmation of IV assumptions. However, efforts to evaluate
the IV using measured covariates can strengthen the evidence for the
IV’s appropriateness.
9. Other
Considerations
Justifying the need for an IV analytic approach (i.e., strong unmeasured
confounding) and the theoretical rationale for why the proposed
measured covariate is a suitable IV are crucial to causal inference,
particularly since the tenability of the assumptions can never be fully
empirically verified.
Evaluating the IV-outcome association conditional on exposure is not
generally advised. See: Hernán MA, Robins JM. Instruments for causal
inference: an epidemiologist’s dream? Epidemiology 2006;17:360-372.
Related Documents


![Bayesian Causal Inference - uni-muenchen.de...from causal inference have been attracting much interest recently. [HHH18] propose that causal [HHH18] propose that causal inference stands](https://static.cupdf.com/doc/110x72/5ec457b21b32702dbe2c9d4c/bayesian-causal-inference-uni-from-causal-inference-have-been-attracting.jpg)