1 Standards and Market Power: Evidence from Tunisia 1 Hendrik W. Kruse, University of Göttingen Inma Martínez-Zarzoso, University of Göttingen and University Jaume I Leila Baghdadi, WTO Chair Holder, Tunis Business School, University of Tunis Abstract – We develop a theoretical model and derive conditions under which firms with market power try to influence the setting of quality standards and describe the political equilibrium. We show that in political equilibrium the positive association only holds for a restricted set of initial values of the firm’s market share , if the government ascribes a positive value to consumer welfare. We test our hypothesis using Tunisian data for the years 2002-2010. In our main results, we find a higher incidence of SPS measures in sectors where firms connected to former president Ben Ali have a higher share in imports. However, this association only holds for sectors with high tariffs. For low tariff sectors, we find that Ben Ali firms are associated with more TBTs. A higher concentration of market power in itself does not lead to higher standards, leading us to the conclusion that political power is essential. Keywords: NTMs, market power, political economy, development, imports, Tunisia JEL codes: F12, F13 1 We would like to thank participants at the 23rd Annual Conference of the ERF in Amman, Jordan. In particular, we thank Chahir Zaki, Bernard Hoekman, Jaime de Melo and Mongi Boughzala for their constructive comments. Furthermore, we would like to thank Holger Strulik, David de la Croix, Katharina Werner, Lionel Fontagné, Cristina Mitaritonna and Bob Rijkers. This work was sponsored by the Economic Research Forum (ERF) and has benefited from both financial and intellectual support. The contents and recommendations do not necessarily reflect ERF’s views. Kr use thanks the German Research Foundation (DFG) for financial support.

Welcome message from author
This document is posted to help you gain knowledge. Please leave a comment to let me know what you think about it! Share it to your friends and learn new things together.
Transcript
1
Standards and Market Power: Evidence from Tunisia 1
Hendrik W. Kruse, University of Göttingen
Inma Martínez-Zarzoso, University of Göttingen and University Jaume I
Leila Baghdadi, WTO Chair Holder, Tunis Business School, University of Tunis
Abstract – We develop a theoretical model and derive conditions under which firms
with market power try to influence the setting of quality standards and describe the
political equilibrium. We show that in political equilibrium the positive association only
holds for a restricted set of initial values of the firm’s market share , if the government
ascribes a positive value to consumer welfare. We test our hypothesis using Tunisian
data for the years 2002-2010. In our main results, we find a higher incidence of SPS
measures in sectors where firms connected to former president Ben Ali have a higher
share in imports. However, this association only holds for sectors with high tariffs. For
low tariff sectors, we find that Ben Ali firms are associated with more TBTs. A higher
concentration of market power in itself does not lead to higher standards, leading us to
the conclusion that political power is essential.
Keywords: NTMs, market power, political economy, development, imports, Tunisia
JEL codes: F12, F13
1 We would like to thank participants at the 23rd Annual Conference of the ERF in Amman, Jordan. In
particular, we thank Chahir Zaki, Bernard Hoekman, Jaime de Melo and Mongi Boughzala for their
constructive comments. Furthermore, we would like to thank Holger Strulik, David de la Croix,
Katharina Werner, Lionel Fontagné, Cristina Mitaritonna and Bob Rijkers. This work was sponsored
by the Economic Research Forum (ERF) and has benefited from both financial and intellectual support.
The contents and recommendations do not necessarily reflect ERF’s views. Kr use thanks the German
Research Foundation (DFG) for financial support.
2
1. Introduction
In recent years, it is becoming increasingly recognized that product standards2 do not always
play the role of non-tariff barriers to trade, but might in fact be trade-enhancing (cf. Maertens
and Swinnen, 2008). The most frequently studied cases cover standards imposed by high -
income countries. In particular, if standards are not set excessively high, they can serve as a
signaling device increasing confidence in the quality of the product, and hence make products
more marketable. In such a setting, consumer preferences are supposed to determine the
political economy outcome (Swinnen et al, 2015), i.e., standards are high because they improve
consumers’ utility.3 Moreover, other factors related to the context in which the standard is
fixed, such as political factors, producer costs and consumer demand conditions might shape
the effect of the standard more than the initial intent of the policy (Swinnen et al, 2015) .
Despite the fact that in recent years most standards notifications are made by developing
countries (60% of them from 2000-2015 according to Wilson, 2017), standards imposed by low
and middle income-countries have been studied to a lesser extent than thos e imposed by the
EU, US or other high-income countries. Especially, the literature on the political economy of
standards in developing and emerging markets is scant.
This paper makes an attempt to fill this gap. In particular , we develop a variation of the
theoretical model by Grossman and Helpman (1993) where we introduce different commercial
interests of domestic market participants. If some actors have preferential access to high
standard international products, they will prefer higher standards in thei r home country in order
to increase their market share. The same holds for firms that for any reason find it relatively
easy to comply with the rules of the standard. One such reason could be proximity to the
political elite. In both cases, it is not always obvious that increasing standards is in the interest
of consumers. We derive conditions under which standards are introduced for reasons unrelated
to consumer interest. For simplicity, we discuss the case of an import monopolist.
We test the implications of the model using Tunisian data. Tunisia is an interesting case study
for three reasons. First, the number of non-tariff measures (NTMs) –counted as barriers to
trade– have increased considerably in the country during the last decade of the Ben Ali regime.
Secondly, Baghdadi et al (2016a, 2016b) and Ghali et al (2013) have shown that in fact NTMs
2 We define “standards” as regulations (obligatory) that relate to risk, safety and/or environmental
concerns implemented to protect consumers. Please refer to the UNCTAD classification of NTMs 2012
version. 3 Compare also Cadot and Ing (2015) who make the case that NTMs can play an important role in
ensuring quality.
3
seem to increase Tunisian imports. Thirdly, Tunisia under Ben Ali was a country with a high
concentration of market power in many sectors. In particular, with few exceptions only state
enterprises are able to import agricultural products under preferential tariffs (cf. Minot et al
2010). Moreover, the family of former president Ben Ali owned a number of firms in different
sectors of the economy that enjoyed advantages in terms of bureaucratic costs (Rijkers et al
2014, 2015).
Our theoretical results suggest that if products are imperfect substitutes and an import
monopolist faces no or negligible additional fixed cost to c omply with the standard, then she
will prefer a higher standard. The political economy equilibrium is likely to be closer to the
state preferred by the monopolist if the imports are relatively important in the respective sector.
If the cost advantage of the importer is low, however, a low standard equilibrium may arise
against the interest of the importer. The main empirical results indicate that there is a higher
incidence of product standards in sectors where firms connected to former president Ben Ali
have a higher share in imports. This association specifically holds for sectors with high tariffs
when the standards are related to sanitary and phytosanitary standards. For low tariff sectors,
we find that Ben Ali firms are associated with more standards in the form of technical barriers
to trade. A higher concentration of market power in itself does not lead to higher standards,
leading us to the conclusion that political power is essential.
The remainder of this paper is organized as follows. Section 2 reviews the closely related
literature, Section 3 outlines the theoretical model and the main hypothesis. Section 4 presents
the data and the stylized facts and Section 5 specifies the empirical model that is applied to the
Tunisian case. In section 6, we present our results. Finally, section 7 concludes.
2. Literature Review
In this Section, we focus on two strands of literature that are closely related to our theoretical
model and in the corresponding empirical applications. The first strand studies the poli tical
economy of trade policy and is based on the seminal paper of Grossman and Helpman (1994,
henceforth GH). In GH firms operating in different sectors influence trade policy –in particular
tariffs– by making campaign contribution to the incumbent politi cal party. Goldberg and Maggi
(1999) find empirical support for the GH model by using NTM coverage ratios. Bombardini
(2007) introduces firm heterogeneity within a given sector. In her model, due to the fixed costs
of lobbying, only sectors in which productivity is concentrated or average firm size is high are
able to influence trade policy. She also tests the empirical implications of her model using
NTM coverage ratios. However, since the equilibrium that results for the level of protection
4
hinges on the assumption that the barriers in question generate revenue for the state, there is a
wedge between theory and empirics. Goldberg and Maggi (1999) address this by focusing on
price-oriented measures only. In Swinnen et al (2015) the theoretical framework of GH is also
applied, in this case to non-revenue generating standards. In particular, they show that if
consumers can influence political decision they may favor higher standards that in turn might
even lead to higher imports.
A second strand of related literature studies policy preferences and our model is related to the
research focused on the consequences of raising the cost of the rival . In particular, Salop and
Scheffman (1983) present a model with a homogenous good in which a dominant firm can use
several cost raising strategies, in particular raising standards, in order to raise the costs of
“fringe” firms. The authors fail to model the political economy aspect and focus only on
domestic producers, whereas in this paper we stress the role of importers.
Furthermore, there are numerous empirical studies estimating the effect of higher standards
imposed in developed countries on developing country performance ( Maertens and Swinnen
2008, 2009b). Augier et al (2014) provide a theoretical model an empirical assessment of NTM
harmonization in Morocco. They conclude that harmonization might be driven by the wish to
protect domestic producers from competitors located in other developing countries.
A number of studies focus on the Tunisian case. Rijkers et al (2014) provide an extensive
discussion of the role of politically connected firms in Tunisia. In particular, they study how
entry regulations on investment are linked to firm performance of politically connected firms.
Using the same data on political connections, Rijkers et al (2015) study the effect of political
connections on tariff evasion. They find that firms belonging to the family of former president
Ben Ali are more likely to underreport import prices of products and th us lower their tariff
duties. This indicates that political connections in fact matter for trade policy in Tunisia. As
for NTMs, several studies have documented a positive effect of NTMs on imports, two of them
using sectoral trade data (Baghdadi et al, 2016a; and Ghali et al, 2013) and Baghdadi et al
(2016b) using firm level data, in particular for large companies that engage both in exports and
imports. Baghdadi et al (2016a) mainly study the effect of changes in tariffs on prices. They
find that market concentration significantly limits the pass-through of tariffs to domestic prices.
3. The Model
In what follows, we will derive the formal conditions under which an import monopolist will
prefer higher standards, if he competes with other domestic producers . The importer is a
monopolist in the sense that he has exclusive access to the international good. The basic
5
assumption is that domestic firms face a different cost function than the importer. Note that
this is only one of the settings in which the model can be derived. The same mechanism holds
if one firm has a better importing technology than other firms. More precisely, the costs of
importing could be lower for one firm, for instance if it enjoy close ties to the responsible
authorities.
Consider a small sector with a single firm importing goods into the domestic market. Assume
a standard constant elasticity of substitution (CES) utility function. For sake of clarity, assume
that the standard does not enter the utility function. The standard only appear s in production
costs and, thus, affects prices. Furthermore, assume that consumers allocate their spending
between this differentiated sector and a homogenous good according to a Cobb -Douglas
function (similar to Silva et al. 2012). In this context, the h omogenous good serves as a
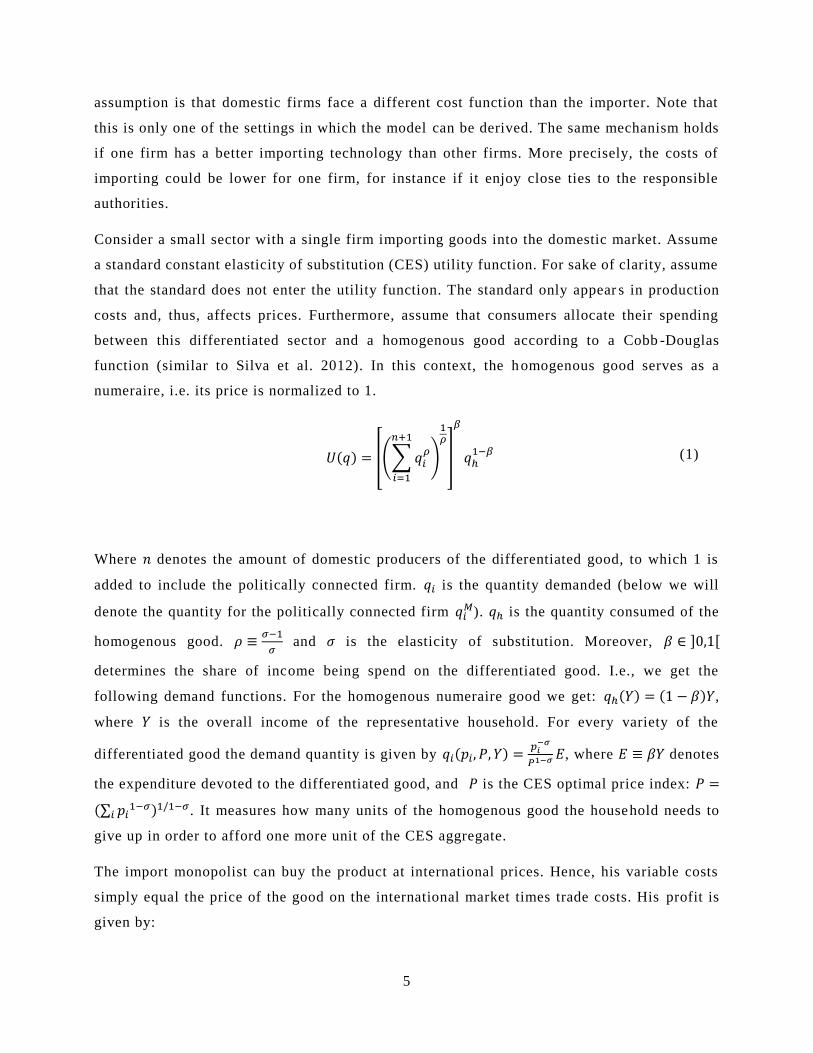
numeraire, i.e. its price is normalized to 1.
𝑈(𝑞) = [(∑ 𝑞𝑖𝜌
𝑛+1
𝑖=1
)
1𝜌
]
𝛽
𝑞ℎ1−𝛽
(1)
Where 𝑛 denotes the amount of domestic producers of the differentiated good, to which 1 is
added to include the politically connected firm. 𝑞𝑖 is the quantity demanded (below we will
denote the quantity for the politically connected firm 𝑞𝑖𝑀). 𝑞ℎ is the quantity consumed of the
homogenous good. 𝜌 ≡𝜎−1
𝜎 and 𝜎 is the elasticity of substitution. Moreover, 𝛽 ∈ ]0,1[
determines the share of income being spend on the differentiated good. I.e., we get the
following demand functions. For the homogenous numeraire good we get: 𝑞ℎ(𝑌) = (1 − 𝛽)𝑌,
where 𝑌 is the overall income of the representative household. For every variety of the
differentiated good the demand quantity is given by 𝑞𝑖(𝑝𝑖, 𝑃, 𝑌) =𝑝𝑖
−𝜎
𝑃1−𝜎 𝐸, where 𝐸 ≡ 𝛽𝑌 denotes
the expenditure devoted to the differentiated good, and 𝑃 is the CES optimal price index: 𝑃 =
(∑ 𝑝𝑖1−𝜎
𝑖 )1/1−𝜎. It measures how many units of the homogenous good the household needs to
give up in order to afford one more unit of the CES aggregate.
The import monopolist can buy the product at international prices. Hence, his variable costs
simply equal the price of the good on the international market times trade costs. His profit is
given by:
6
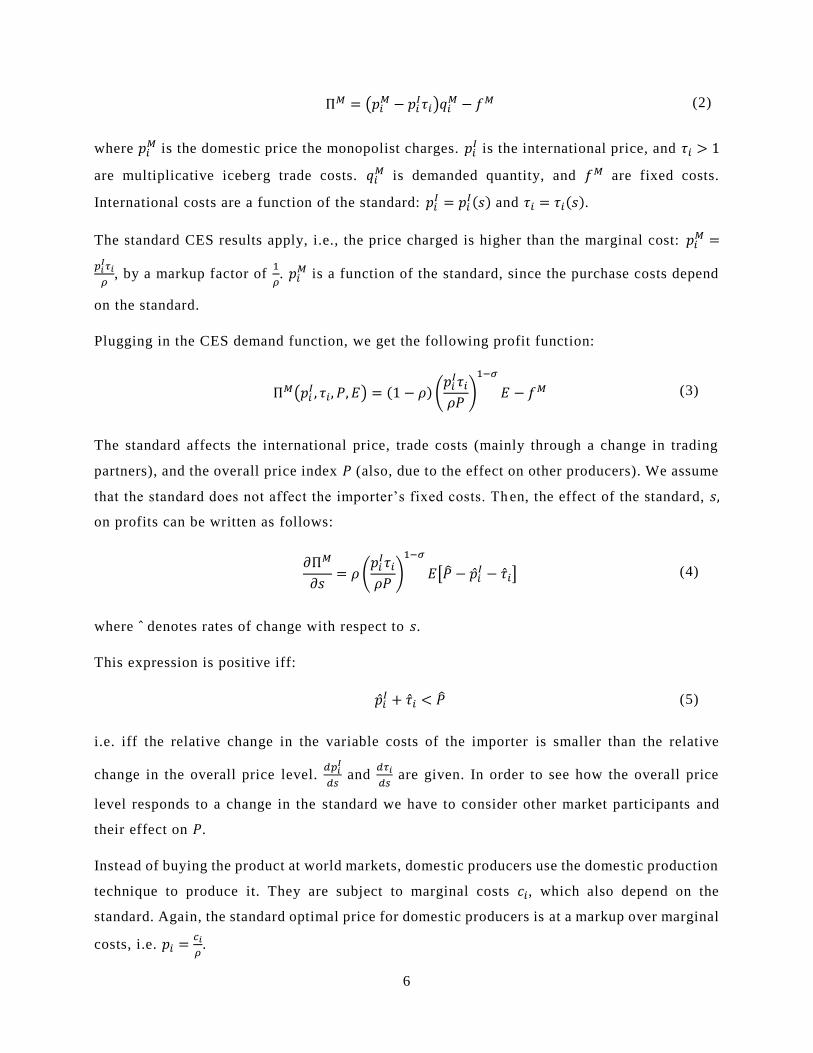
Π𝑀 = (𝑝𝑖𝑀 − 𝑝𝑖
𝐼𝜏𝑖)𝑞𝑖𝑀 − 𝑓𝑀 (2)
where 𝑝𝑖𝑀 is the domestic price the monopolist charges. 𝑝𝑖
𝐼 is the international price, and 𝜏𝑖 > 1
are multiplicative iceberg trade costs. 𝑞𝑖𝑀 is demanded quantity, and 𝑓𝑀 are fixed costs.
International costs are a function of the standard: 𝑝𝑖𝐼 = 𝑝𝑖
𝐼(𝑠) and 𝜏𝑖 = 𝜏𝑖(𝑠).
The standard CES results apply, i.e., the price charged is higher than the marginal cost: 𝑝𝑖𝑀 =
𝑝𝑖𝐼𝜏𝑖
𝜌, by a markup factor of
1
𝜌. 𝑝𝑖
𝑀 is a function of the standard, since the purchase costs depend
on the standard.
Plugging in the CES demand function, we get the following profit function:
Π𝑀(𝑝𝑖
𝐼 , 𝜏𝑖, 𝑃, 𝐸) = (1 − 𝜌) (𝑝𝑖
𝐼𝜏𝑖
𝜌𝑃)
1−𝜎
𝐸 − 𝑓𝑀 (3)
The standard affects the international price, trade costs (mainly through a change in trading
partners), and the overall price index 𝑃 (also, due to the effect on other producers). We assume
that the standard does not affect the importer’s fixed costs. Th en, the effect of the standard, 𝑠,
on profits can be written as follows:
𝜕Π𝑀
𝜕𝑠= 𝜌 (
𝑝𝑖𝐼𝜏𝑖
𝜌𝑃)
1−𝜎
𝐸[�̂� − �̂�𝑖𝐼 − �̂�𝑖] (4)
where ̂ denotes rates of change with respect to 𝑠.
This expression is positive iff:
�̂�𝑖𝐼 + �̂�𝑖 < �̂� (5)
i.e. iff the relative change in the variable costs of the importer is smaller than the relative
change in the overall price level. 𝑑𝑝𝑖
𝐼
𝑑𝑠 and
𝑑𝜏𝑖
𝑑𝑠 are given. In order to see how the overall price
level responds to a change in the standard we have to consider other market participants and
their effect on 𝑃.
Instead of buying the product at world markets, domestic producers use the domestic production
technique to produce it. They are subject to marginal costs 𝑐𝑖, which also depend on the
standard. Again, the standard optimal price for domestic producers is at a markup over marginal
costs, i.e. 𝑝𝑖 =𝑐𝑖
𝜌.

7
We assume that in the local production market there is free entry and exit, leading to 𝑛 operating
firms. Plugging the prices into the CES formula we get:
𝑃 =
1
𝜌((𝑝𝑖
𝐼𝜏𝑖)1−𝜎 + 𝑛𝑐𝑖1−𝜎)
11−𝜎 (6)
Importantly, in (6) not only the marginal cost determinants 𝑝𝑖𝐼, 𝜏𝑖, and 𝑐𝑖 depend on 𝑠, but also
𝑛, since the standard affects the zero profit condition, as we shall see below. Hence, the
response of the price index to changes in the standard is:
�̂� = (
𝑝𝑖𝐼𝜏𝑖
𝜌𝑃)
1−𝜎
[�̂�𝑖𝐼 + �̂�𝑖] + 𝑛 (
𝑐𝑖
𝜌𝑃)
1−𝜎
[�̂�𝑖 +�̂�
(1 − 𝜎)] (7)
Note that 𝑑𝑃
𝑑𝑛< 0. The reason is that the ideal price index takes the love of variety underlying
the CES utility into account. A loss of variety, hence, is treated like an increase in the cost of
living. 𝑛 is determined by the zero profit condition (ZPC):
Π𝐷 = (1 − 𝜌) (
𝑐𝑖
𝜌𝑃)
1−𝜎
𝐸 − 𝑓𝐷 = 0 (8)
Solving for 𝑛 and imposing 𝑛 ≥ 0 we get:
𝑛 = max {(1 − 𝜌)
𝐸
𝑓𝐷− (
𝑝𝑖𝐼𝜏𝑖
𝑐𝑖)
1−𝜎
, 0} (9)
Since the domestic producer cannot rely on political connections or on importing (by
assumption), fixed costs respond to increased standards. The response of 𝑛 to higher standards
is:
𝑑𝑛
𝑑𝑠= (𝜎 − 1) (
𝑝𝑖𝐼𝜏𝑖
𝑐𝑖)
1−𝜎
[�̂�𝑖𝐼 + �̂�𝑖 − �̂�𝑖] −
(1 − 𝜌)𝐸
𝑓𝐷𝑓𝐷 (10)
Plugging this expression into (7) and using the ZPC we get:
�̂� = �̂�𝑖 +
1
𝜎 − 1𝑓𝐷 (11)
i.e. due to additional loss of variety related to the increase in fixed cost of domestic production,
the ideal price index increases by more than the change in marginal c osts. The condition under
which the import monopolist prefers higher standards is:
8
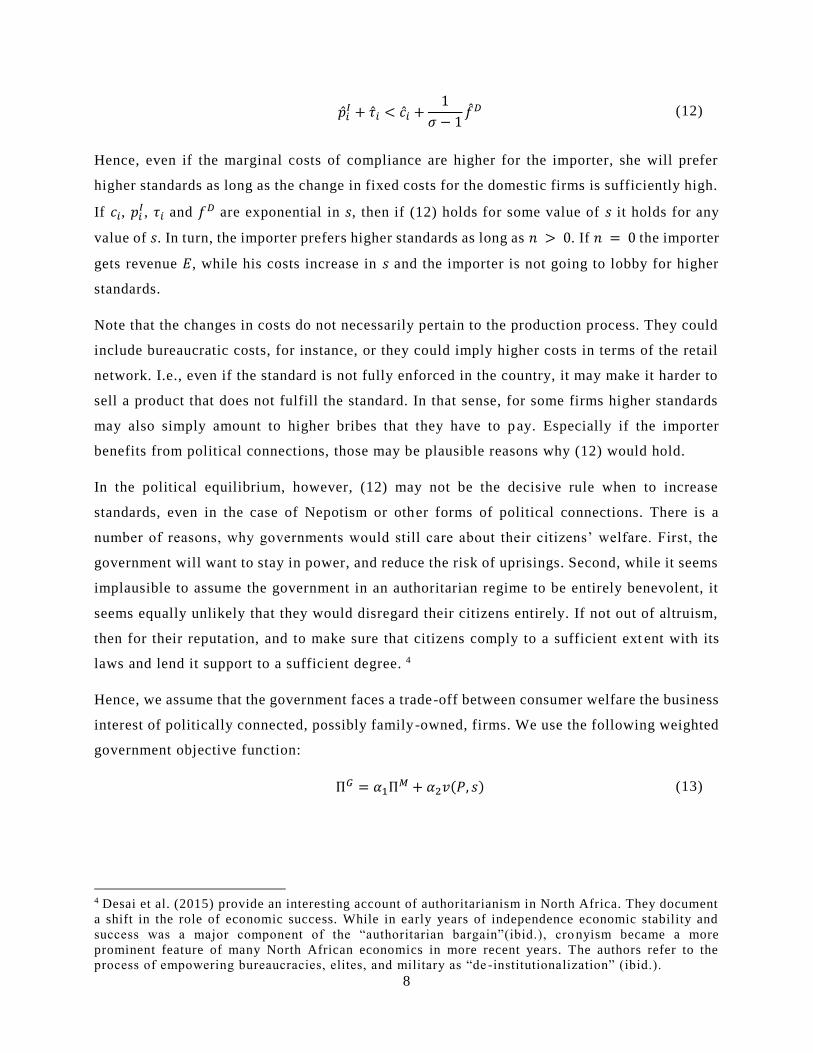
�̂�𝑖
𝐼 + �̂�𝑖 < �̂�𝑖 +1
𝜎 − 1𝑓𝐷 (12)
Hence, even if the marginal costs of compliance are higher for the importer, she will prefer
higher standards as long as the change in fixed costs for the domestic firms is sufficiently high.
If 𝑐𝑖, 𝑝𝑖𝐼, 𝜏𝑖 and 𝑓𝐷 are exponential in 𝑠, then if (12) holds for some value of 𝑠 it holds for any
value of 𝑠. In turn, the importer prefers higher standards as long as 𝑛 > 0. If 𝑛 = 0 the importer
gets revenue 𝐸, while his costs increase in 𝑠 and the importer is not going to lobby for higher
standards.
Note that the changes in costs do not necessarily pertain to the production process. They could
include bureaucratic costs, for instance, or they could imply higher costs in terms of the retail
network. I.e., even if the standard is not fully enforced in the country, it may make it harder to
sell a product that does not fulfill the standard. In that sense, for some firms higher standards
may also simply amount to higher bribes that they have to pay. Especially if the importer
benefits from political connections, those may be plausible reasons why (12) would hold.
In the political equilibrium, however, (12) may not be the decisive rule when to increase
standards, even in the case of Nepotism or other forms of political connections. There is a
number of reasons, why governments would still care about their citizens’ welfare. First, the
government will want to stay in power, and reduce the risk of uprisings. Second, while it seems
implausible to assume the government in an authoritarian regime to be entirely benevolent, it
seems equally unlikely that they would disregard their citizens entirely. If not out of altruism,
then for their reputation, and to make sure that citizens comply to a sufficient ext ent with its
laws and lend it support to a sufficient degree. 4
Hence, we assume that the government faces a trade-off between consumer welfare the business
interest of politically connected, possibly family-owned, firms. We use the following weighted
government objective function:
Π𝐺 = 𝛼1Π𝑀 + 𝛼2𝑣(𝑃, 𝑠) (13)
4 Desai et al. (2015) provide an interesting account of authoritarianism in North Africa. They document
a shift in the role of economic success. While in early years of independence economic stability and
success was a major component of the “authoritarian bargain”(ibid.), cro nyism became a more
prominent feature of many North African economics in more recent years. The authors refer to the
process of empowering bureaucracies, elites, and military as “de -institutionalization” (ibid.).

9
where 𝑣(𝑌, 𝑃, 𝑠) is consumers’ indirect utility function, and 𝛼1 > 𝛼2 are the weights the
government attaches to the connected firms’ profits, and consumer utility respectively. 5 The
indirect utility function can be expressed as follows
𝑣(𝑌, 𝑃, 𝑠) = (
𝛽
𝑃)
𝛽
(1 − 𝛽)1−𝛽𝑌 (14)
Then, the first derivative of the government objective function is:
𝜕Π𝐺
𝜕𝑠= 𝛼1
𝜕Π𝑀
𝜕𝑠+ 𝛼2
𝜕𝑣(𝑌, 𝑃, 𝑠)
𝜕𝑠 (15)
This is positive iff:
�̂�𝑖
𝐼 + �̂�𝑖 < [1 −𝛼2
𝛼1
1
𝜌
1
𝜒𝑀𝑃𝛽𝜁(𝛽)] {�̂�𝑖 +
1
𝜎 − 1𝑓𝐷} (16)
where 𝜒𝑀 ≡ (𝑝𝑖
𝐼𝜏𝑖
𝜌𝑃)
1−𝜎
is importer market share6 and we denote 𝜁(𝛽) ≡ 𝛽𝛽(1 − 𝛽)(1−𝛽) for brevity.
The effect of the elasticity of substitution is ambiguous. Note that lim𝜎→1
1
𝜌= ∞ and lim
𝜎→∞
1
𝜌= 1, i.e.
a higher markup factor is always due to a low elasticity of substitution. A higher markup factor
and a lower elasticity of substitution imply a smaller effect of the standard on profits of the
monopolist because the induced price difference has little effect on relative demand. On the
one hand, that lowers the potential benefits for the monopolist; but, on the other hand, if the
elasticity of substitution is low, fewer firms will have to exit the market, which reduces the
social costs of the standard. Additionally, if the importers’ market share or the price level is
high, then the conditions under which the government will enact higher standards are less
stringent.
However, both revenue and consumption depend on the level of standard 𝑠. We can rewrite (16)
as follows:
�̂�𝑖𝐼 + �̂�𝑖
�̂�𝑖 +1
𝜎 − 1 𝑓𝐷< [1 −
𝛼2
𝛼1
1
𝜌
1
𝜒𝑀𝑃𝛽𝜁(𝛽)] (17)
5 Note that a similar function arises in the lobbying model by Grossman and Helpman (1994) assuming
truthful contributions.
6 Note that there is minimum level for 𝜒𝑀, such that 𝜒𝑀 ≥𝜎𝑓𝑀
𝐸 to ensure Π𝑀 ≥ 0.
10
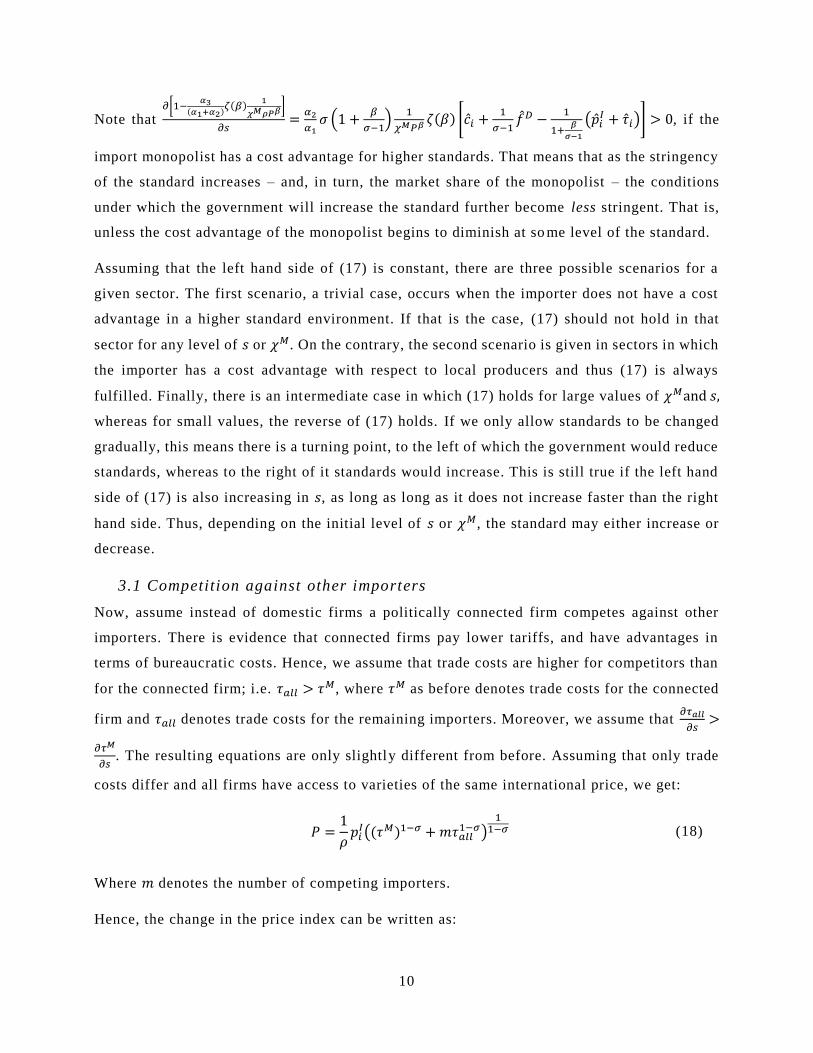
Note that 𝜕[1−
𝛼3(𝛼1+𝛼2)
𝜁(𝛽)1
𝜒𝑀𝜌𝑃𝛽]
𝜕𝑠=
𝛼2
𝛼1𝜎 (1 +
𝛽
𝜎−1)
1
𝜒𝑀𝑃𝛽 𝜁(𝛽) [�̂�𝑖 +1
𝜎−1𝑓𝐷 −
1
1+𝛽
𝜎−1
(�̂�𝑖𝐼 + �̂�𝑖)] > 0, if the
import monopolist has a cost advantage for higher standards. That means that as the stringency
of the standard increases – and, in turn, the market share of the monopolist – the conditions
under which the government will increase the standard further become less stringent. That is,
unless the cost advantage of the monopolist begins to diminish at so me level of the standard.
Assuming that the left hand side of (17) is constant, there are three possible scenarios for a
given sector. The first scenario, a trivial case, occurs when the importer does not have a cost
advantage in a higher standard environment. If that is the case, (17) should not hold in that
sector for any level of 𝑠 or 𝜒𝑀. On the contrary, the second scenario is given in sectors in which
the importer has a cost advantage with respect to local producers and thus (17) is always
fulfilled. Finally, there is an intermediate case in which (17) holds for large values of 𝜒𝑀and 𝑠,
whereas for small values, the reverse of (17) holds. If we only allow standards to be changed
gradually, this means there is a turning point, to the left of which the government would reduce
standards, whereas to the right of it standards would increase. This is still true if the left hand
side of (17) is also increasing in 𝑠, as long as long as it does not increase faster than the right
hand side. Thus, depending on the initial level of 𝑠 or 𝜒𝑀, the standard may either increase or
decrease.
3.1 Competition against other importers
Now, assume instead of domestic firms a politically connected firm competes against other
importers. There is evidence that connected firms pay lower tariffs, and have advantages in
terms of bureaucratic costs. Hence, we assume that trade costs are higher for competitors than
for the connected firm; i.e. 𝜏𝑎𝑙𝑙 > 𝜏𝑀, where 𝜏𝑀 as before denotes trade costs for the connected
firm and 𝜏𝑎𝑙𝑙 denotes trade costs for the remaining importers. Moreover, we assume that 𝜕𝜏𝑎𝑙𝑙
𝜕𝑠>
𝜕𝜏𝑀
𝜕𝑠. The resulting equations are only slightly different from before. Assuming that only trade
costs differ and all firms have access to varieties of the same international price, we get:
𝑃 =
1
𝜌𝑝𝑖
𝐼((𝜏𝑀)1−𝜎 + 𝑚𝜏𝑎𝑙𝑙1−𝜎)
11−𝜎 (18)
Where 𝑚 denotes the number of competing importers.
Hence, the change in the price index can be written as:
11
�̂� = �̂�𝑖
𝐼 + 𝜒𝑀 (�̂�𝑀 + 𝑚 (𝜏𝑎𝑙𝑙
𝜏𝑀)
1−𝜎
[�̂�𝑎𝑙𝑙 +�̂�
1 − 𝜎]) (19)
The number of competing importers 𝑚 as before is determined by the ZPC, which yields:
𝑚 = max {(1 − 𝜌)
𝐸
𝑓𝑖𝑚− (
𝜏𝑀
𝜏𝑎𝑙𝑙)
1−𝜎
, 0} (20)
And
𝑑𝑚
𝑑𝑠= (𝜎 − 1) (
𝜏𝑀
𝜏𝑎𝑙𝑙)
1−𝜎
[�̂�𝑀 − �̂�𝑎𝑙𝑙] (21)
Plugging this into (19), again, we get a simplified expression:
�̂� = �̂�𝑖𝐼 + �̂�𝑎𝑙𝑙 (22)
Since condition (5) holds irrespective of the particular cost structure of the competitor, we get
the condition under which a connected firm will prefer higher standards by plugging (22) into
(5), which results in:
�̂�𝑀 < �̂�𝑎𝑙𝑙 (23)
Using the same government objective function (13), and plugging in all the relevant variables,
we need a new equation characterizing under which circumstances increasing the standard is
politically feasible. Instead of (17) we get:
�̂�𝑖𝐼 + �̂�𝑀
�̂�𝑖𝐼 + �̂�𝑎𝑙𝑙
< [1 −𝛼2
𝛼1
1
𝜌
1
𝜒𝑀𝑃𝛽𝜁(𝛽)] (24)
The range of 𝑠 for which (24) is true depends on other sources of trade costs.
Consider the case where the trade costs of everybody else 𝜏𝑎𝑙𝑙 increase while the connected
firm is unaffected, for instance due to a tariff that the connected firm does not pay. I.e. 𝑑𝜏𝑎𝑙𝑙 >
0, while 𝑑𝜏𝑀 = 0.
Note that 𝜕𝑃/𝜕𝜏𝑎𝑙𝑙
𝑃= 𝜏𝑎𝑙𝑙
−1 and 𝜕𝜒𝑀/𝜕𝜏𝑎𝑙𝑙
𝜒𝑀 = (𝜎 − 1)𝜏𝑎𝑙𝑙−1. Then we have that
𝜕[1−𝛼2𝛼1
1
𝜌
1
𝜒𝑀𝑃𝛽𝜁(𝛽)]
𝜕𝜏𝑎𝑙𝑙=
𝛼2
𝛼1
1
𝜒𝑀𝜌𝑃𝛽 𝜁(𝛽)(𝜎 − 1 + 𝛽) 𝜏𝑎𝑙𝑙−1 > 0. Hence, if trade cost for competitors increase for reasons other
than a standard it becomes more likely in political equilibrium that a standard w ill also be
enacted.

12
Next, consider the case where trade costs increase equally for the connected firms and its
competitors; i.e., 𝑑𝜏 = 𝑑𝜏𝑎𝑙𝑙 = 𝑑𝜏𝑀. Then, we have: 𝑑𝑃/𝑑𝜏
𝑃= 𝜏𝑎𝑙𝑙
−1 and 𝑑𝜒𝑀/𝑑𝜏
𝜒𝑀 = (𝜎 − 1)[𝜏𝑎𝑙𝑙−1 −
𝜏𝑀−1]. And so:
𝑑[1−𝛼2𝛼1
1
𝜌
1
𝜒𝑀𝑃𝛽𝜁(𝛽)]
𝑑𝜏=
𝛼2
𝛼1
1
𝜒𝑀𝑃𝛽 𝜁(𝛽)[(𝜎 − 1 + 𝛽)𝜏𝑎𝑙𝑙−1 − (𝜎 − 1)𝜏𝑀−1
], which is larger
than zero iff 𝜏𝑀
𝜏𝑎𝑙𝑙>
𝜎−1
𝜎−1+𝛽. The reason is that if 𝜏𝑀 is low compared to 𝜏𝑎𝑙𝑙 an equal change in
both would imply that the relative change in the price of the connected firm is higher than the
relative change in the price index. In turn, the importer’s market share would decline. Hence,
empirically, in most cases an increase in trade costs for all importers is likely going to reduce
the scope for introducing a standard, if those trade costs apply to all importers in the same way.
The interaction between other types of trade costs and standards thus crucially depends on to
what extent these trade costs affect the connected firm. It will thus be an empirical q uestion
what the interaction between the two will look like.
4. Data, Variables and Stylized Facts
We estimate the implications of the theoretical model outlined in the previous section using
data on Tunisia. Data for NTMs is from the World Bank (Malouche et al, 2013). It is worth
noting that this database includes many more measures than those notified to the WTO.
Bacchetta et al (2012) discuss the limitations of official data on NTM and concludes that WTO
notifications are incomplete almost by construction. Information on state trading enterprises
is from the WTO’s Integrated Trade and Intelligence Portal (I -TIP). Additionally, we obtained
tariff data from the World Integrated Trade Solutions (WITS) portal. Tariff data availability
restricts our sample to the years 2002-2010. Sector specific imports and exports are from UN
COMTRADE.
Herfindahl indices of market concentration at the HS6 level, and sectoral value added are f rom
the Tunisian L’institute National da la Statistique (INS) . . Herfindahl indices are defined as the
sum of squares of firms’ shares in total sectoral sales.
Tunisia has many features that make it an interesting case study for the study at hand. For
instance, State Owned Enterprises (STEs) play an important role in trade (as documented by
the US-Development Aid FAIRS COUNTRY Report, 2013; and by the WTO Trade Policy
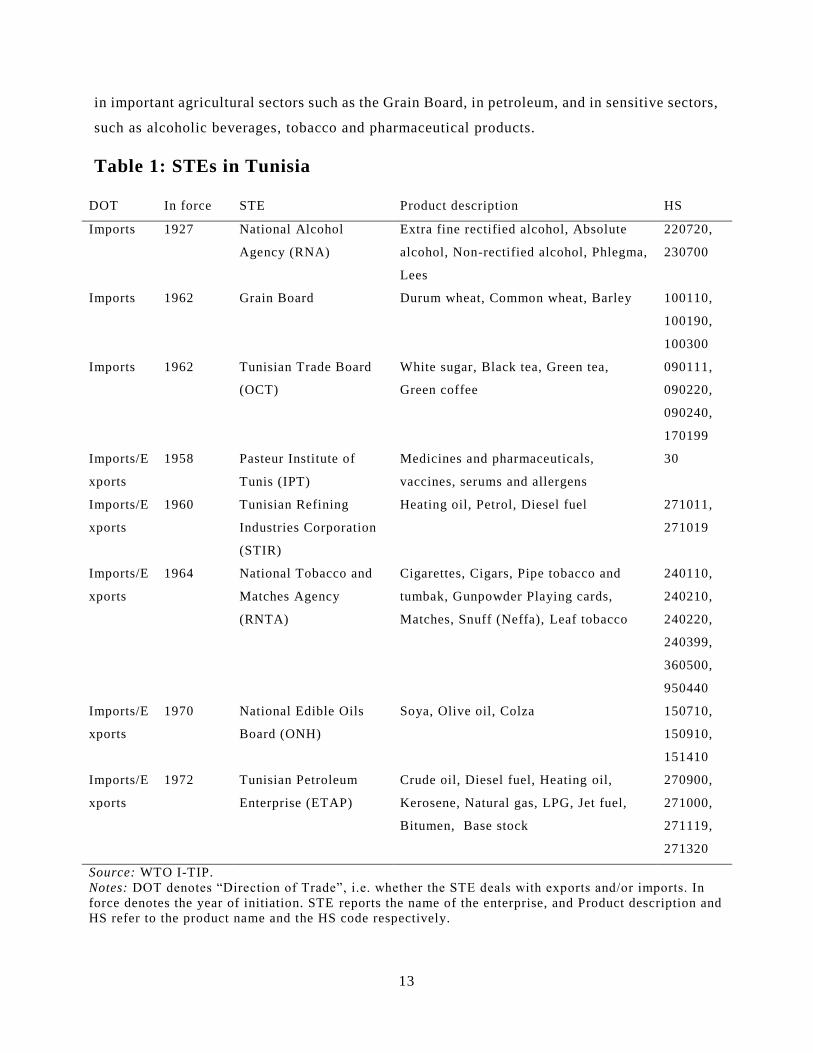
Review, 2005). Table 1 provides an overview of sectors in which there is an STE. STEs operate
13
in important agricultural sectors such as the Grain Board, in petroleum, and in sensitive sectors,
such as alcoholic beverages, tobacco and pharmaceutical products.
Table 1: STEs in Tunisia
DOT In force STE Product description HS
Imports 1927 National Alcohol
Agency (RNA)
Extra fine rectified alcohol, Absolute
alcohol, Non-rectified alcohol, Phlegma,
Lees
220720,
230700
Imports 1962 Grain Board Durum wheat, Common wheat, Barley 100110,
100190,
100300
Imports 1962 Tunisian Trade Board
(OCT)
White sugar, Black tea, Green tea,
Green coffee
090111,
090220,
090240,
170199
Imports/E
xports
1958 Pasteur Institute of
Tunis (IPT)
Medicines and pharmaceuticals,
vaccines, serums and allergens
30
Imports/E
xports
1960 Tunisian Refining
Industries Corporation
(STIR)
Heating oil, Petrol, Diesel fuel 271011,
271019
Imports/E
xports
1964 National Tobacco and
Matches Agency
(RNTA)
Cigarettes, Cigars, Pipe tobacco and
tumbak, Gunpowder Playing cards,
Matches, Snuff (Neffa), Leaf tobacco
240110,
240210,
240220,
240399,
360500,
950440
Imports/E
xports
1970 National Edible Oils
Board (ONH)
Soya, Olive oil, Colza 150710,
150910,
151410
Imports/E
xports
1972 Tunisian Petroleum
Enterprise (ETAP)
Crude oil, Diesel fuel, Heating oil,
Kerosene, Natural gas, LPG, Jet fuel,
Bitumen, Base stock
270900,
271000,
271119,
271320
Source: WTO I-TIP.
Notes: DOT denotes “Direction of Trade”, i.e. whether the STE deals with exports and/or imports. In
force denotes the year of initiation. STE reports the name of the enterprise, and Product description and
HS refer to the product name and the HS code respectively.

14
Moreover, market concentration is high as reported in Table 2. The overall average of the
Herfindahl index is 0.41, but there is considerable sectoral variation. Market concentration has
an important impact on trade policy. Baghdadi et al (2016a) have shown that market
concentration significantly limits the impact of tariff changes on domes tic prices. In addition,
during the period of study a fraction of firms were connected to the family of the leader Zine
El Abidine Ben Ali. The data of Ben Ali connections (BA) are obtained from Rijkers et al
(2014) and were extensively studied by Rijkers et al (2014, 2015). Table 2 reports summary
statistics of the main variables, including in the second and third row the shares in import
values for firms connected to Ben Ali, first based on the firms’ own reports (Share BA), and
secondly based on predictions using Input-Output tables (Share BA predicted).
Another aspect that makes Tunisia an interesting case is the comparatively high level of tariff
duties in relation to other middle income countries . This is especially visible when looking at
the weighted average tariff, which reaches a maximum of 230%. However, as documented in
Baghdadi et al (2016a) tariffs have been in steady decline in the 2000s.
Table 2: Summary Statistics
Variable Obs Mean Std. Dev. Min Max
Herfindahl 43408 0.414 0.312 0.008 1
Share BA 47511 0.016 0.081 0 1
Share BA, predicted 47511 0.001 0.010 0 0.790
Tariff (in %) 45198 7.154 7.526 0 71.479
Tariff (weighted, in %) 47511 18.268 21.478 0 230
It is relevant for our research to emphasize that several studies have found that NTMs tended
to increase imports into Tunisia (Baghdadi et al 2016a, 2016b and Ghali et al 2013).
In accordance with Maertens et al (2009a) and Swinnen et al (2015) we use NTMs that
according to the MAST classification fall under the heading Sanitary and Phytosanitary
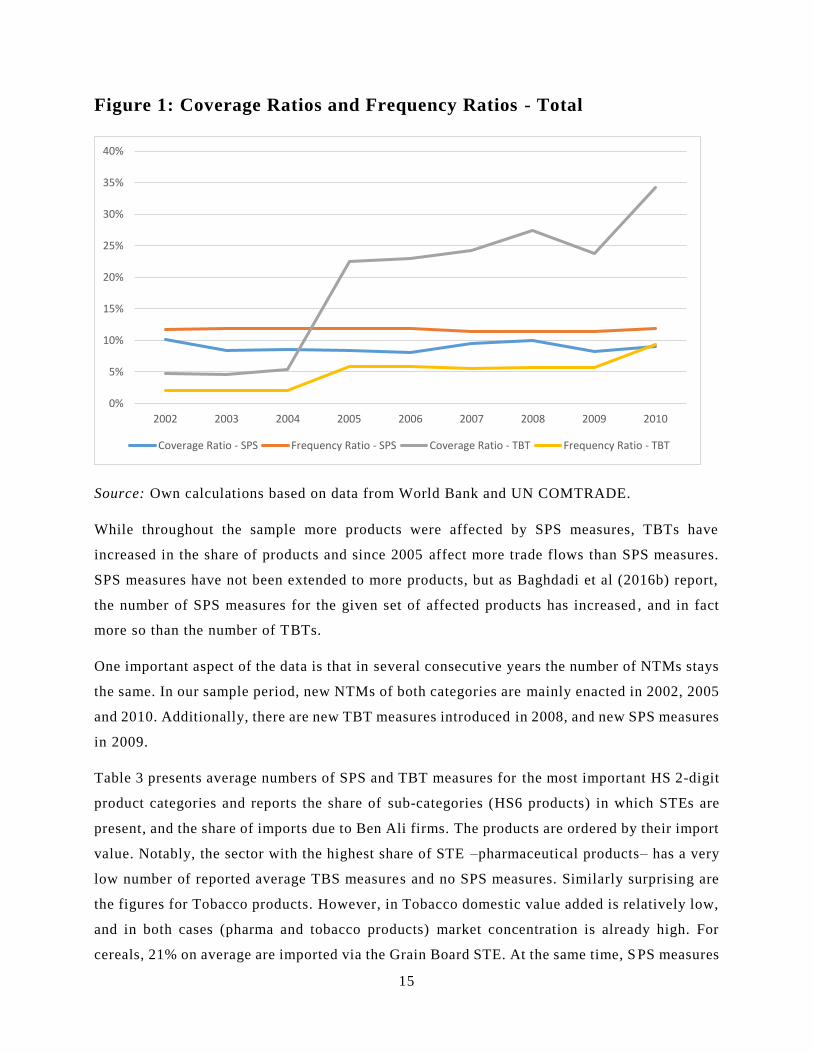
measures (SPS) and Technical Barriers to Trade (TBT).7 Figure 1 shows frequency ratios (i.e.
the fraction of products affected) and coverage ratios (i.e. the share of imports affected) for
both types of NTM.
7 See UNCTAD (2012) for the definition of the MAST categories.
15
Figure 1: Coverage Ratios and Frequency Ratios - Total
Source: Own calculations based on data from World Bank and UN COMTRADE.
While throughout the sample more products were affected by SPS measures, TBTs have
increased in the share of products and since 2005 affect more trade flows than SPS measures.
SPS measures have not been extended to more products, but as Baghdadi et al (2016b) report,
the number of SPS measures for the given set of affected products has increased , and in fact
more so than the number of TBTs.
One important aspect of the data is that in several consecutive years the number of NTMs stays
the same. In our sample period, new NTMs of both categories are mainly enacted in 2002, 2005
and 2010. Additionally, there are new TBT measures introduced in 2008, and new SPS measures
in 2009.
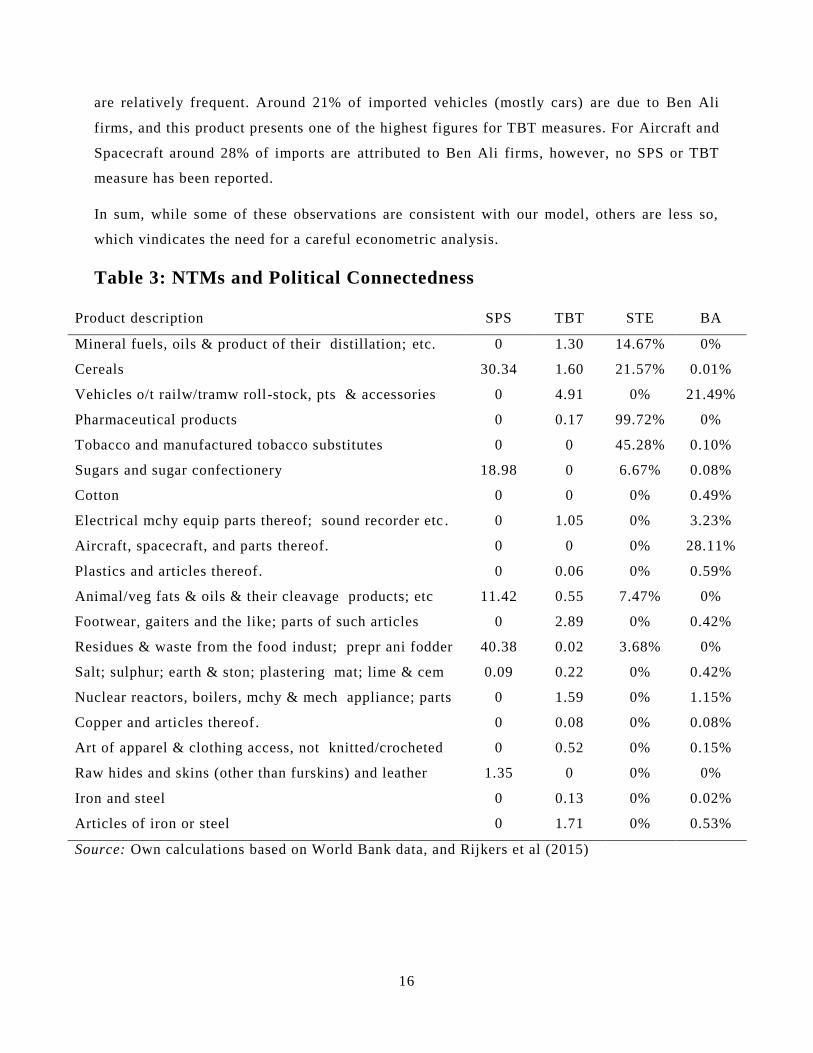
Table 3 presents average numbers of SPS and TBT measures for the most important HS 2-digit
product categories and reports the share of sub-categories (HS6 products) in which STEs are
present, and the share of imports due to Ben Ali firms. The products are ordered by their import
value. Notably, the sector with the highest share of STE –pharmaceutical products– has a very
low number of reported average TBS measures and no SPS measures. Similarly surprising are
the figures for Tobacco products. However, in Tobacco domestic value added is relatively low,
and in both cases (pharma and tobacco products) market concentration is already high. For
cereals, 21% on average are imported via the Grain Board STE. At the same time, S PS measures
0%
5%
10%
15%
20%
25%
30%
35%
40%
2002 2003 2004 2005 2006 2007 2008 2009 2010
Coverage Ratio - SPS Frequency Ratio - SPS Coverage Ratio - TBT Frequency Ratio - TBT
16
are relatively frequent. Around 21% of imported vehicles (mostly cars) are due to Ben Ali
firms, and this product presents one of the highest figures for TBT measures. For Aircraft and
Spacecraft around 28% of imports are attributed to Ben Ali firms, however, no SPS or TBT
measure has been reported.
In sum, while some of these observations are consistent with our model, others are less so,
which vindicates the need for a careful econometric analysis.
Table 3: NTMs and Political Connectedness
Product description SPS TBT STE BA
Mineral fuels, oils & product of their distillation; etc. 0 1.30 14.67% 0%
Cereals 30.34 1.60 21.57% 0.01%
Vehicles o/t railw/tramw roll-stock, pts & accessories 0 4.91 0% 21.49%
Pharmaceutical products 0 0.17 99.72% 0%
Tobacco and manufactured tobacco substitutes 0 0 45.28% 0.10%
Sugars and sugar confectionery 18.98 0 6.67% 0.08%
Cotton 0 0 0% 0.49%
Electrical mchy equip parts thereof; sound recorder etc . 0 1.05 0% 3.23%
Aircraft, spacecraft, and parts thereof. 0 0 0% 28.11%
Plastics and articles thereof. 0 0.06 0% 0.59%
Animal/veg fats & oils & their cleavage products; etc 11.42 0.55 7.47% 0%
Footwear, gaiters and the like; parts of such articles 0 2.89 0% 0.42%
Residues & waste from the food indust; prepr ani fodder 40.38 0.02 3.68% 0%
Salt; sulphur; earth & ston; plastering mat; lime & cem 0.09 0.22 0% 0.42%
Nuclear reactors, boilers, mchy & mech appliance; parts 0 1.59 0% 1.15%
Copper and articles thereof. 0 0.08 0% 0.08%
Art of apparel & clothing access, not knitted/crocheted 0 0.52 0% 0.15%
Raw hides and skins (other than furskins) and leather 1.35 0 0% 0%
Iron and steel 0 0.13 0% 0.02%
Articles of iron or steel 0 1.71 0% 0.53%
Source: Own calculations based on World Bank data, and Rijkers et al (2015)
17
5. Empirical Specification
In this Section, we present our empirical model. Since NTMs, and more specifically standards,
do not generate an income for the government, we cannot use Bombardini’s (2008) and
Goldberg and Maggi’s (1999) approach, which is based on tariffs . Our theoretical model
explicitly deals with NTMs, instead of tariffs; but it does not yield an equation, that can directly
be estimated. Instead, our empirical model is designed to test whether politically connected
firms in fact have an influence on the occurrence, and the amount of standards in a sector .
We model the number of NTMs in specific categories (standards, like categories A (SPS) and
B (TBT)) introduced in a given sector at a given point in time using a two-part model (Mullahy
1998, Belotti et al. 2015; Santos Silva et al. 2015). We express the expected value for the
number of NTMs as follows:
𝐸[𝑁𝑇𝑀ℎ𝑘𝑡|𝑋ℎ𝑘𝑡] = Pr(𝑁𝑇𝑀ℎ𝑘𝑡 > 0|𝑋ℎ𝑘𝑡) × 𝐸[𝑁𝑇𝑀ℎ𝑘𝑡|𝑁𝑇𝑀ℎ𝑘𝑡 > 0, 𝑋ℎ𝑘𝑡] (17)
where Pr(𝑁𝑇𝑀ℎ𝑘𝑡 > 0|𝑋ℎ𝑘𝑡) denotes the probability to observe positive counts conditional on
the covariates. 𝐸[𝑁𝑇𝑀ℎ𝑘𝑡|𝑁𝑇𝑀ℎ𝑘𝑡 > 0, 𝑋ℎ𝑘𝑡] is the expected value of the number of NTMs given
that there is a positive amount and given the covariates. The two part model rests on the
assumption that the process creating zeroes and the process generating counts are conditionally
independent. Under this assumption, the log-likelihood of the underlying model is separable
and the left and right terms in the right hand side can be estimated separately. Thus, the count
process is split into two stages. This is advantageous in our case for two reasons: First , a
practical reason is that zeroes are frequent in our dataset, which may lead to overdispersion in
a simple Poisson model (Alfò et al. 2010). Second, our NTM variable is merely a count variable,
and does not capture the stringency of the regulations. The two-part model is more flexible in
this regard than a one-part model. If a single regulation can be made sufficiently stringent, the
political actor may be more interested in adding a single regulation, than in pushing through a
higher number of NTMs. However, if the number of NTMs is related to the overall regulatory
stringency of standards, one could obtain the opposite results. The two -part model can uncover
both patterns, and prevents one of the processes from dominating the results.
We model the first part, the probability of obtaining a positive count , as a logit model:
Pr(𝑁𝑇𝑀ℎ𝑘𝑡 > 0|𝑋ℎ𝑘𝑡) = 𝑔(𝛼𝑄𝑘𝑡𝑇𝑎𝑟 × 𝑃𝐶𝑘𝑡 + β𝑍ℎ𝑘𝑡 + 𝛼ℎ2 + 𝛾𝑡) (18)
where 𝑔(𝜂) denotes the logistic function.
18
The second part of (17) is modelled using a Poisson regression framework:
𝐸[𝑁𝑇𝑀ℎ𝑘𝑡|𝑁𝑇𝑀ℎ𝑘𝑡 > 0, 𝑋ℎ𝑘𝑡] = ℎ(𝛼𝑄𝑘𝑡𝑇𝑎𝑟 × 𝑃𝐶𝑘𝑡 + β𝑍ℎ𝑘𝑡 + 𝛼ℎ2 + 𝛾𝑡) (19)
where the response function is exponential ℎ(𝜂) ≡ e𝜂, which is equivalent to using the canonical
log-link function. 𝑁𝑇𝑀ℎ𝑘𝑡 is the number of NTMs of the respective type introduced in sector 𝑘
(belonging to HS2 category ℎ) at time 𝑡, 𝑄𝑘𝑡𝑇𝑎𝑟 is a vector of dummies indicating whether high,
medium or low tariffs (defined as different quantiles of the distribution) prevail in the
respective HS6 sector. 𝑃𝐶𝑘𝑡 denotes the measure of political connectedness. We use three
different proxies for the strength of political connections in a given sector: firstly, we study
sectors in which a STE operates, secondly, we include the share of imports by firms belonging
to the Ben Ali family, and finally, we include a Herfindahl Index of market concentration . All
of these measures are available at the HS6-level. By allowing different coefficients for different
quartiles of the tariff distribution, we account for the possibility that tariffs and standards may
be complementary or substitutable means of protection. For instance, there is evidence that
firms linked to Ben Ali paid less in tariffs (Rijkers et al. 2015). Such firm may thus already
enjoy advantages vis-à-vis importing competitors. 𝛼ℎ2 are HS 2-digit sector specific unobserved
effects and 𝛾𝑡 are year-dummies. With the introduction of specific unobserved effects we
control for potential selection bias, arising from sorting of politically connected firms into
broad sectors with certain time invariant characteristics, e.g. profitability. The year dumm ies
capture all country specific time varying variables , including shifts in policy priorities towards
NTMs – taking into account that NTMs seem to be enacted in certain years only as reported
above – or changes in the overall economic environment. Additional control variables - 𝑍ℎ𝑘𝑡 –
include the import value, and sectoral value added as control s for the importance of the sector
in the domestic economy.
In the logit model given by (18) the exponential of the coefficients can be interpreted as an
odds ratio. Note that Ai and Norton’s (2003) critique concerning the interpretation of
interactions in logit and Probit models does not apply here. The reason is that 𝑄𝑘𝑡𝑇𝑎𝑟 × 𝑃𝐶𝑘𝑡 is
not strictly speaking an interaction term. Rather, 𝑃𝐶𝑘𝑡 has heterogeneous coefficients. Hence,
𝑒𝛼𝑄𝑘𝑡𝑇𝑎𝑟
can be interpreted as odds ratios, given the value of the vector 𝑄𝑘𝑡𝑇𝑎𝑟. I.e., if 𝛼 =
(𝛼𝑙 𝛼𝑚 𝛼ℎ), then 𝑒𝛼𝑙0.01 − 1 denotes the change in the odds of observing a positive amount
of NTMs due to an increase of politically connected firms by 1% given that the sector in
question belongs to the quantile with low tariffs .
19
Since we are using a log-link function the interpretation of the coefficients in (19) is equivalent
to log-linearized models; i.e., as elasticities and semi-elasticities. Note that the functional form
thus implies a multiplicative model structure. Hence, there are interaction effects with regard
to the count.
6. Results
6.1 Main Results
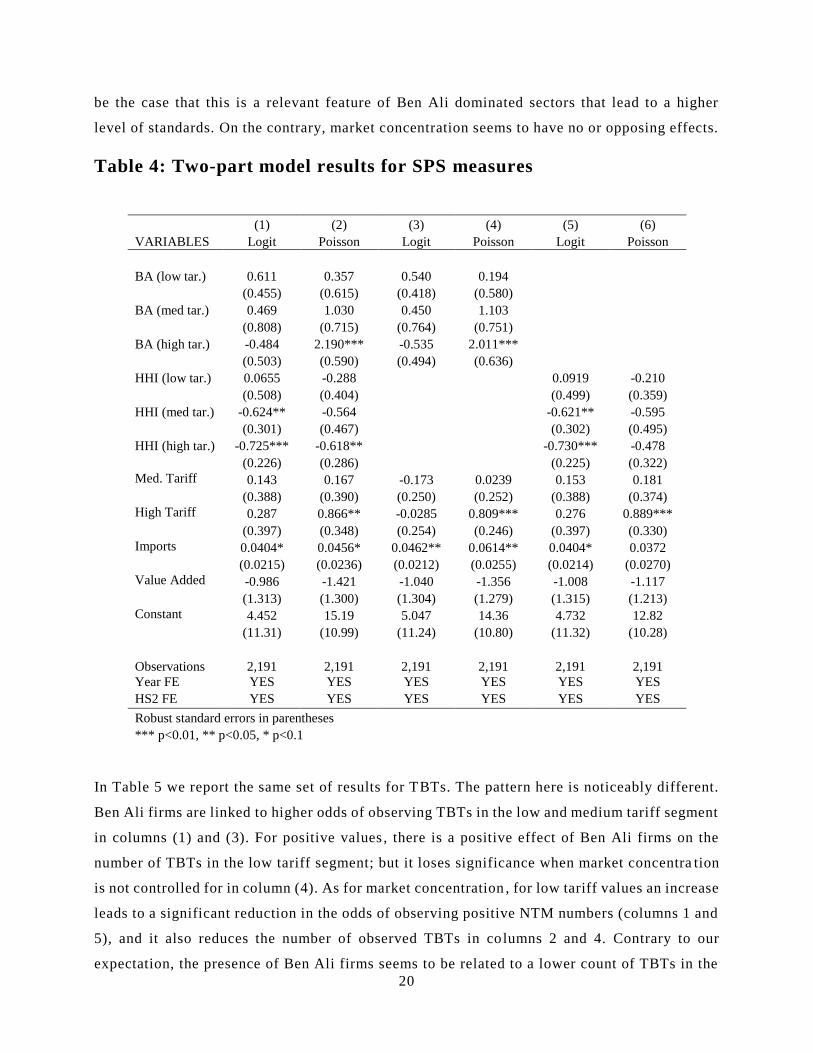
Table 4 presents the first set of results for NTMs belonging to the category of SPS measures.
In columns 1 and 2 the share of imports going to Ben Ali related firms (BA) is included, as
well as the Herfindahl Index defined in terms of sales as a measures of market concentration.
For Ben Ali related firms we see no statistically significant effect irrespective of the level of
tariffs in the logit regression. However, in the Poisson regression in column 2 – i.e., for positive
values – there is a significant positive effect of political connectedness on the number of NTMs
if tariffs are high. That indicates that in the presence of Ben Ali firms , SPS measures and tariffs
are complements. A potential explanation is based on Rijkers et al. (2015). They show that by
reporting a lower unit value of imports, Ben Ali firms t end to pay lower tariffs. If that is true,
high tariffs indicate a higher level of protection from competing importers. In fact, in our data
the level of tariff protection is positively associated with the share of Ben Ali firms’ import
share. Hence, the higher the tariff is, the more likely there is scope for using standards to
increase the costs of domestic competitors. We obtain the associated elasticity by multiplying
the coefficient with 1
100. Hence, if the share of Ben Ali firms’ imports increases by 1% the
number of SPS measure would be on average 0.02% higher in sectors that exhibit high tariffs.
Thus, albeit significant, the results remain economically small.
As for market concentration as measured by the Herfindahl index, there is no evidence of a
positive effect on the number of SPS measures. However, in the Logit model, for medium and
high tariffs a higher degree of market concentration is linked to a significant reduction in the
odds of observing a positive number.8 In this sense, one can interpret the Herfindahl results as
a Placebo test for the importance of explicit political connections. While Rijkers et al. (2014)
show that Ben Ali firms tend to be related to higher market concentra tion, it does not seem to
8 Note that while we used a two-part model here, the results for this first set of regressions do not hinge
in this particular treatment of zeroes. We obtain qualitatively the same and quantitatively similar results
using the Zero-Inflated Poisson (ZIP) on the same sample. Also, a one-part Poisson model yields the
same results. The choice, hence, is only relevant for TBT measures reported below, where the presence
of zeroes with many dummies makes it difficult to fit a one -part model, and also prevents the use of a
ZIP model.
20
be the case that this is a relevant feature of Ben Ali dominated sectors that lead to a higher
level of standards. On the contrary, market concentration seems to have no or opposing effects.
Table 4: Two-part model results for SPS measures
(1) (2) (3) (4) (5) (6)
VARIABLES Logit Poisson Logit Poisson Logit Poisson
BA (low tar.) 0.611 0.357 0.540 0.194
(0.455) (0.615) (0.418) (0.580) BA (med tar.) 0.469 1.030 0.450 1.103
(0.808) (0.715) (0.764) (0.751) BA (high tar.) -0.484 2.190*** -0.535 2.011***
(0.503) (0.590) (0.494) (0.636) HHI (low tar.) 0.0655 -0.288 0.0919 -0.210
(0.508) (0.404) (0.499) (0.359)
HHI (med tar.) -0.624** -0.564 -0.621** -0.595
(0.301) (0.467) (0.302) (0.495)
HHI (high tar.) -0.725*** -0.618** -0.730*** -0.478
(0.226) (0.286) (0.225) (0.322)
Med. Tariff 0.143 0.167 -0.173 0.0239 0.153 0.181 (0.388) (0.390) (0.250) (0.252) (0.388) (0.374)
High Tariff 0.287 0.866** -0.0285 0.809*** 0.276 0.889*** (0.397) (0.348) (0.254) (0.246) (0.397) (0.330)
Imports 0.0404* 0.0456* 0.0462** 0.0614** 0.0404* 0.0372 (0.0215) (0.0236) (0.0212) (0.0255) (0.0214) (0.0270)
Value Added -0.986 -1.421 -1.040 -1.356 -1.008 -1.117 (1.313) (1.300) (1.304) (1.279) (1.315) (1.213)
Constant 4.452 15.19 5.047 14.36 4.732 12.82
(11.31) (10.99) (11.24) (10.80) (11.32) (10.28)
Observations 2,191 2,191 2,191 2,191 2,191 2,191
Year FE YES YES YES YES YES YES
HS2 FE YES YES YES YES YES YES
Robust standard errors in parentheses *** p<0.01, ** p<0.05, * p<0.1
In Table 5 we report the same set of results for TBTs. The pattern here is noticeably different.
Ben Ali firms are linked to higher odds of observing TBTs in the low and medium tariff segment
in columns (1) and (3). For positive values , there is a positive effect of Ben Ali firms on the
number of TBTs in the low tariff segment; but it loses significance when market concentra tion
is not controlled for in column (4). As for market concentration , for low tariff values an increase
leads to a significant reduction in the odds of observing positive NTM numbers (columns 1 and
5), and it also reduces the number of observed TBTs in columns 2 and 4. Contrary to our
expectation, the presence of Ben Ali firms seems to be related to a lower count of TBTs in the

21
high tariff segment. This may be somewhat less surprising when considering that when
differentiating between different kinds of TBTs only 1% are standards in the strict sense. All
other measures explicitly pertain to importers, including, for instance, registration
requirements. For SPS measures, by contrast, around 30% of measures are standards. Hence, a
possible explanation for these results is that for low levels of protection through tariffs more
NTMs may protect Ben Ali firms from competition by other importers. For high tariffs on the
other hand, they already enjoy a cost advantage vis-à-vis other importers and further import
related measures would reduce their competitive stance vis-à-vis domestic producers. In that
case, it would make little sense for them to push for more such measures.
Table 5: Two-part model results for TBTs
(1) (2) (3) (4) (5) (6)
VARIABLES Logit Poisson Logit Poisson Logit Poisson
BA (low tar.) 3.390*** 1.613** 3.076*** 1.254
(0.880) (0.652) (0.787) (0.799) BA (med tar.) 1.692* -0.565 1.711* -0.538
(0.960) (0.967) (0.964) (1.207) BA (high tar.) 1.972** -2.068** 1.957** -1.863**
(0.952) (1.040) (0.973) (0.945) HHI (low tar.) -1.879* -1.809** -1.677* -1.363**
(1.054) (0.723) (0.940) (0.655)
HHI (med tar.) 0.179 0.186 0.216 0.199
(0.566) (0.725) (0.559) (0.769)
HHI (high tar.) 0.291 -0.422 0.252 -0.198
(0.506) (0.680) (0.514) (0.704)
Med. Tariff 0.328 -0.396 1.051*** 0.0750 0.234 -0.794* (0.470) (0.389) (0.339) (0.363) (0.456) (0.418)
High Tariff 1.260*** 0.266 1.980*** 0.493 1.221*** -0.402 (0.441) (0.449) (0.365) (0.408) (0.429) (0.429)
Imports 0.0883** 0.194*** 0.0902** 0.201*** 0.101** 0.217*** (0.0449) (0.0407) (0.0442) (0.0444) (0.0449) (0.0400)
Value Added -0.293 1.304 -0.662 1.120 -0.336 0.991 (0.612) (1.100) (0.592) (1.120) (0.603) (1.224)
Constant -19.50*** -10.03 -17.23*** -8.997 -19.06*** -7.458
(4.778) (8.481) (4.783) (8.584) (4.759) (9.429)
Observations 7,212 7,212 7,212 7,212 7,212 7,212
Year FE YES YES YES YES YES YES
HS2 FE YES YES YES YES YES YES
Robust standard errors in parentheses *** p<0.01, ** p<0.05, * p<0.1

22
Finally, for state trading enterprises (STEs) we do not find a significant relation to SPS
measures as documented in columns 1 and 2 of Table 6. Also, note that for sectors with positive
trade flows and low tariffs STEs are a perfect predictor of zero SPS measures. Results for
technical barriers to trade are reported in the second panel (columns 3 and 4) of Table 6. We
find at the binary stage –in the logit regression– that there is a significant positive effect (at
the ten percent level) of STEs operating in the given sector for medium tariffs. However, for
positive counts the effect is always negative, albeit only significant for low and high tariffs.
One potential explanation for that pattern is that the presence of a state trading enterprise is a
sufficient control mechanism for the state. Moreover, as argued above, STEs often operate in
sectors with limited value added and are often granted exclusive importing rights, or at least
very preferential conditions.
Table 6: Two-part model results for STEs
SPS TBT
(1) (2) (3) (4)
VARIABLES Logit Poisson Logit Poisson
STE (low tar.) 1.492 -2.215***
(1.198) (0.497)
STE (med. tar.) -0.904 0.473 1.932* -0.299
(0.658) (0.403) (1.009) (0.391)
STE (high tar.) 0.444 -0.321 -0.300 -2.055**
(0.364) (0.911) (0.469) (0.856)
Med. Tariff -0.436* -0.203 0.626*** -0.294
(0.252) (0.298) (0.172) (0.207)
High Tariff -0.399 0.703*** 1.281*** -0.154
(0.264) (0.265) (0.202) (0.210)
Imports 0.0511** 0.0791*** 0.0833*** 0.192***
(0.0216) (0.0301) (0.0300) (0.0296)
Value added -2.453*** 1.852*** 0.244 -0.300
(0.531) (0.391) (0.335) (0.217)
Constant 19.88*** -12.34*** -19.73*** 2.287
(4.482) (3.418) (2.974) (1.483)
Observations 2,922 2,922 11,359 11,359
Year FE Yes Yes Yes Yes
HS2 FE Yes Yes Yes Yes
Robust standard errors in parentheses *** p<0.01, ** p<0.05, * p<0.1
Summarizing, it seems that mainly political connections of private enterprises are linked to
higher NTMs. Neither for sectors with a high degree of market concentration, nor in sectors
23
with STEs do we find a strong positive effect on NTMs. On the contrary, in many cases the
effect is even significantly negative. In Table A.1 in the appendix, we report the results
including the year 2010, which was so far excluded. There are two reasons why we did not
include 2010. First, the data for the Herfindahl Index and the Ben Ali f irms’ only ranges until
2009. In order to include NTMs implemented in 2010 we thus assume that the values for the
Ben Ali firms’ import shares did not change from 2009 to 2010. On the one hand, that seems
plausible because the import share is in most cases reasonably stable over time. But on the
other hand, 2010 may be a particular year. The Ben Ali regime was ousted as early as January
2011. Protests had started in 2010 already, and the economic situation was dire. Hence,
legislation at that point in time may have followed a different rationale than in the preceding
years. That being said, the results for TBTs are robust to including 2010. For SPS measures ,
the positive results are present now in the first (logit) part and for medium tariffs only.
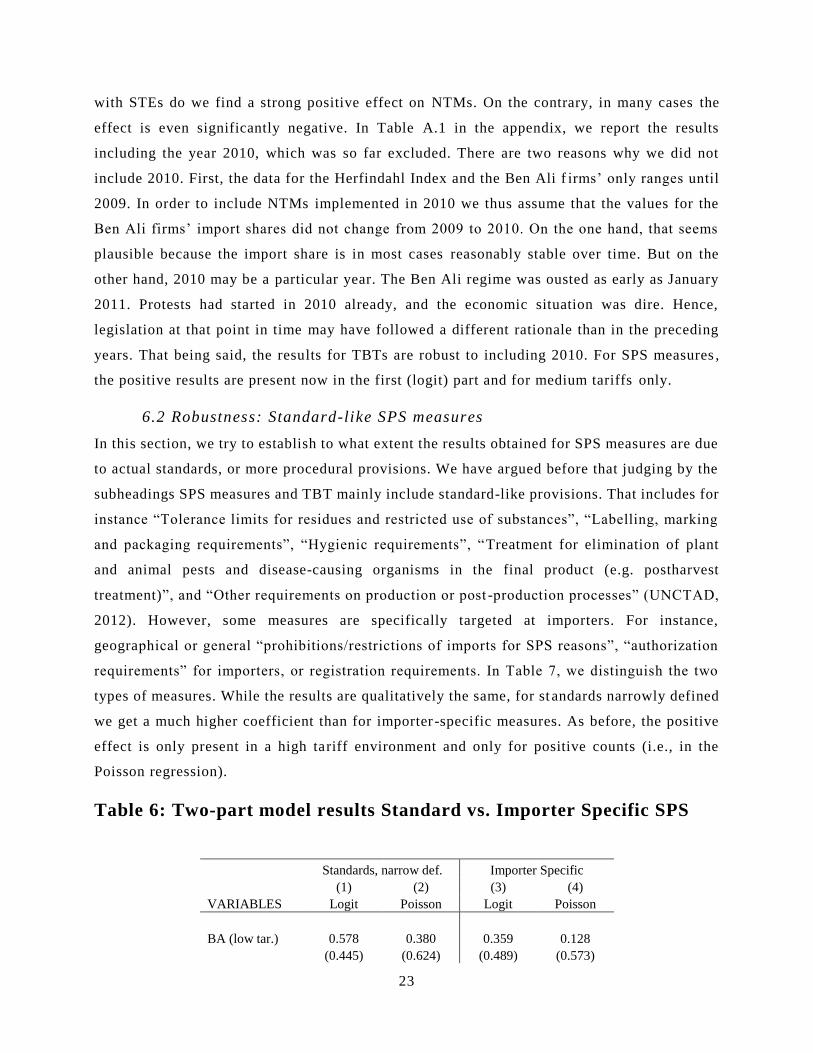
6.2 Robustness: Standard-like SPS measures
In this section, we try to establish to what extent the results obtained for SPS measures are due
to actual standards, or more procedural provisions. We have argued before that judging by the
subheadings SPS measures and TBT mainly include standard-like provisions. That includes for
instance “Tolerance limits for residues and restricted use of substances”, “Labelling, marking
and packaging requirements”, “Hygienic requirements”, “Treatment for elimination of plant
and animal pests and disease-causing organisms in the final product (e.g. postharvest
treatment)”, and “Other requirements on production or post -production processes” (UNCTAD,
2012). However, some measures are specifically targeted at importers. For instance,
geographical or general “prohibitions/restrictions of imports for SPS reasons”, “authorization
requirements” for importers, or registration requirements. In Table 7, we distinguish the two
types of measures. While the results are qualitatively the same, for st andards narrowly defined
we get a much higher coefficient than for importer -specific measures. As before, the positive
effect is only present in a high tariff environment and only for positive counts (i.e., in the
Poisson regression).
Table 6: Two-part model results Standard vs. Importer Specific SPS
Standards, narrow def. Importer Specific
(1) (2) (3) (4)
VARIABLES Logit Poisson Logit Poisson
BA (low tar.) 0.578 0.380 0.359 0.128
(0.445) (0.624) (0.489) (0.573)

24
BA (med. tar.) -4.537 -16.92 0.643 0.830
(6.277) (14.72) (1.027) (0.575)
BA (high tar.) -0.654 4.685*** 0.489 1.470**
(0.832) (1.209) (0.778) (0.594)
Med. Tariff -0.104 0.102 -0.454 0.0334
(0.413) (0.313) (0.283) (0.255)
High Tariff 0.120 0.671** -0.280 0.846***
(0.413) (0.316) (0.298) (0.241)
Imports 0.0685** 0.105*** 0.0463* 0.0451*
(0.0335) (0.0290) (0.0272) (0.0262)
Value added -5.440*** 1.471 6.854*** -2.254
(1.936) (1.428) (1.495) (1.471)
Constant 43.08*** -11.14 -55.59*** 20.21*
(15.14) (10.74) (12.03) (11.59)
Observations 947 947 1,426 1,426
Year FE Yes Yes Yes Yes
HS2 FE Yes Yes Yes Yes
Robust standard errors in parentheses *** p<0.01, ** p<0.05, * p<0.1
7 Conclusion
Recent research emphasizes that NTMs are not necessarily impediments to trade, and might
even be welfare enhancing. We add another perspective to the debate. In our theoretical model,
we show that if access to imports or access to high-quality production technology are
concentrated, standards can be used as a po licy tool to secure the firms’ market position that
enjoy access. In that sense, NTMs are not necessarily protection against trade, but can also be
protection against domestic competitors. This, of course, does not imply that NTMs necessarily
play this role, but might be especially important for emerging countries with a high degree of
political connections and market power.
We provide indicative evidence that the channel we describe is in fact at play in Tunisia. We
find that sectors with a higher share of firms linked to the Ben Ali family tend to have a higher
number of SPS measures if tariffs are high. We also find a positive association between the
share of Ben Ali related firms on TBTs if tariffs are low.
References
Ai, Chunrong and Edward C. Norton . 2003. ‘Interaction terms in logit and probit models.’
Economics Letters 80, 123-129.
Alfò, Marco and Antonello Maruotti. 2010. ‘Two -part regression models for longitudinal zero-
inflated count data’. The Canadian Journal of Statistics 38(2), 197-216.
25
Augier, Patricia, Olivier Cadot and Marion Dovis. 2014. ‘NTM harmonization, profits, and
productivity: Firm-level evidence from Morocco’. NCCR trade regulation Working Paper No
2014/24.
Bacchetta, Marc, Jürgen Richtering and Roy Santana. 2012. ‘How Much Light Do WTO
Notifications Shed on NTMs?’ In: Olivier Cadot and Mariem Malouche (eds.). Non-Tariff
Measures – A Fresh Look at Trade Policy’s New Frontier’. Washington DC. World Bank/Centre
for Economic and Policy Research.
Baghdadi, Leila., Hendrik .W. Kruse and Inma Martínez-Zarzoso. 2016a. ‘Trade policy without
trade facilitation: Lessons from tariff pass-through in Tunisia’, in: Teh, Smeets, Jallab and
Chaudhri (eds.). ‘Trade Costs and Inclusive Growth. Case Studies presented by WTO chair -
holders’. Geneva. WTO Publications.
Baghdadi, Leila, Sonia Ben Kheder and Hassen Arouri. 2016b. ‘Impact of Non -Tariff Measures
on SMEs in Tunisia’. ITC Working Paper WP -03-2016.E.
Belotti, Federico, Partha Deb, Willard G. Manning and Edward C. Norton. 2015. ‘twopm: Two -
part models.’ The Stata Journal 15(1), 3-20.
Bombardini, Matilde. 2008. ‘Firm heterogeneity and lobby participation’. Journal of
International Economics 75, 329-348.
Cadot, Olivier and Lili Yan Ing. 2015. ‘Non -Tariff Measures: Not All that Bad’. ERIA Policy
Brief No. 2015-02.
Desai, Raj. M., Anders Olofsgård and Tarik M. Yousef. 2015. ‘The Economics of
Authoritarianism in North Africa’. In: C. Monga and J.Y.Lin (eds). ‘The Oxford Handbook of
Africa and Economics: Volume 1: Context and Concepts’ . Oxford University Press.
Ghali, Sofiane, Habib Zitouna, Zouhour Karray and Slim Driss. 2013. ‘Effects of NTBs on the
Extensive and Intensive Margins to Trade: the case of Tunisia and Egypt ’. Economic Research
Forum Working Paper 820.
Goldberg, Pinelopi K. and Maggi, Giovanni. 1999. ‘Protection for Sale: An Empirical
Investigation.’ American Economic Review 89(5), 1135-1155.
Grossman, Gene M. and Helpman, Elhanan. 1994. ‘Protection for Sale’. American Economic
Review 84(4), 833-850.
26
Helpman, Elhanan, Marc J. Melitz and Stephen R. Yeaple. 2004. ‘Export Versus FDI with
Heterogeneous Firms’. American Economic Review 94(1), 300-316.
Maertens, Miet and Johan Swinnen. 2008. ‘Standards as Barriers and Catalysts for Trade,
Growth and Poverty Reduction’. Journal of International Agricultural Trade and Development
4(1), 47-61.
Maertens, Miet and Johan Swinnen. 2009a. ‘Food Standards, Trade and Development’. Review
of Business and Economic 3, 313-326.
Maertens, Miet and Johan Swinnen. 2009b. ‘Trade, Standards, and Poverty: Evidence from
Senegal’. World Development 37(1), 161-178.
Malouche, Mariem, José-Daniel Reyes and Amir Fouad. 2013. ‘Making Trade Policy More
Transparent: A New Database of Non-Tariff Measures’. World Bank Economic Premise 128.
Minot, Nicholas, Mohamed Abdelbasset Chemingui, Marcelle Thomas, Reno Dewina, and
David Orden. 2010. ‘Trade Liberalization and Poverty in the Middle East and North Africa’.
IFPRI Research Monograph, Washington D.C.
Mullahy, John. 1998. ‘Much ado about two: reconsidering retransformation and the two -part
model in health econometrics’. Journal of Health Economics 17, 247-281.
Papke, Leslie E. and Jeffrey M. Wooldridge. 2008. ‘Panel data methods for fractional response
variables with an application to test pass rates’. Journal of Econometrics 145, 121-133.
Rijkers, Bob, Caroline Freund and Antonio Nucifora. 2014. ‘All in the Family. State Capture
in Tunisia.’ World Bank Policy Research Working Paper 6810.
Rijkers, Bob, Leila Baghdadi and Gael Raballand. 2015. ‘Political Connections and Tariff
Evasion Evidence from Tunisia’. World Bank Economic Review, 1-34.
Salop, Steven C. and David T. Scheffman. 1983. ‘Raising Rivals’ Costs’. American Economic
Review 73(2), 267-271.
Santos Silva, João M.C., Silvana Tenreyro and Frank Windmeijer. 2015. ‘Testing Competing
Models for Non-negative Data with Many Zeros’. Journal of Econometric Methods 4(1), 29-
46.
Swinnen, Johan, Koen Deconinck, Thijs Vandemoortele and Anneleen Vandeplas. 2015.
‘Quality Standards, Value Chains, and International Development. Economic and Political
Theory.’ Cambridge University Press.
27
UNCTAD. 2012. ‘Classification of Non-Tariff Measures’. United Nations Publication.
Wilson, Norbert. L. W. 2017. ‘Labels, Food Safety, and International Trade.’ Asian
Development Bank Institute (ADBI) WP No. 657.
Wooldridge, Jeffrey M. 2002. ‘Econometric Analysis of Cross Section and Panel Data’. The
MIT Press.
USDA. 2013. ‘Tunisia. Food and Agricultural Import Regulations and S tandards – Narrative’.
FAIRS Country Report.
WTO. 2013. ‘Trade Policy Review. Report by the Secretariat. Tunisia’.

28
Appendix
Table A.1: Results for BA firms including the year 2010
SPS TBT
(1) (2) (3) (4)
VARIABLES Logit Poisson Logit Poisson
BA (low tar.) 0.586 0.132 2.634*** 1.039
(0.471) (0.607) (0.569) (0.680)
BA (med tar.) 1.132** 0.745 -0.491 -2.012*
(0.514) (0.562) (0.941) (1.193)
BA (high tar.) -0.288 0.362 0.577 -1.576**
(0.448) (0.220) (1.105) (0.792)
Med. Tariff -0.397 -0.198 0.757*** 0.0949 (0.258) (0.305) (0.176) (0.204)
High Tariff -0.273 0.670** 1.366*** 0.227 (0.267) (0.269) (0.206) (0.215)
Imports 0.0426** 0.0849*** 0.0778*** 0.186*** (0.0212) (0.0301) (0.0288) (0.0279)
Value Added -2.437*** 1.882*** 0.181 -0.589***
(0.527) (0.394) (0.314) (0.202)
Constant 19.68*** -12.67*** -19.34*** 4.014***
(4.445) (3.467) (2.803) (1.409)
Observations 2,926 2,926 11,359 11,359
Year FE Yes Yes Yes Yes
HS2 FE Yes Yes Yes Yes
Robust standard errors in parentheses *** p<0.01, ** p<0.05, * p<0.1
Related Documents


