1 A A A s s s i i i a a a ‐ ‐ ‐ P P P a a a c c c i i i f f f i i i c c c N N N e e e t t t w w w o o o r r r k k k f f f o o o r r r G G G l l l o o o b b b a a a l l l C C C h h h a a a n n n g g g e e e R R R e e e s s s e e e a a a r r r c c c h h h S S t t a a n n d d a a r r d d i i z z a a t t i i o o n n a a n n d d s s y y s s t t e e m m a a t t i i z z a a t t i i o o n n o o f f c c a a r r b b o o n n - - b b u u d d g g e e t t o o b b s s e e r r v v a a t t i i o o n n i i n n A A s s i i a a n n t t e e r r r r e e s s t t r r i i a a l l e e c c o o s s y y s s t t e e m m b b a a s s e e d d o o n n A A s s i i a a F F l l u u x x n n e e t t w w o o r r k k Final report for APN project: ARCP2006-01CMY Project Leader: Yoshikazu OHTANI, Forestry and Forest Products Research Institute, Japan, [email protected]

Welcome message from author
This document is posted to help you gain knowledge. Please leave a comment to let me know what you think about it! Share it to your friends and learn new things together.
Transcript
1
AAAsssiiiaaa‐‐‐PPPaaaccciiifffiiiccc NNNeeetttwwwooorrrkkk fffooorrr GGGlllooobbbaaalll CCChhhaaannngggeee RRReeessseeeaaarrrccchhh
SSttaannddaarrddiizzaattiioonn aanndd
ssyysstteemmaattiizzaattiioonn ooff
ccaarrbboonn--bbuuddggeett
oobbsseerrvvaattiioonn iinn AAssiiaann
tteerrrreessttrriiaall eeccoossyysstteemm
bbaasseedd oonn AAssiiaaFFlluuxx
nneettwwoorrkk
Final report for APN project: ARCP2006-01CMY
Project Leader:
Yoshikazu OHTANI, Forestry and Forest Products Research
Institute, Japan, [email protected]
2
The following collaborators worked on this project:
Mohammad Abdul BATEN, Bangladesh Agricultural University,
Bangladesh, [email protected]
Yasumi FUJINUMA, National Institute for Environmental Studies,
Japan, [email protected]
Koh INUKAI, National Institute for Environmental Studies, Japan,
Joon KIM, Yonsei University, Korea, [email protected]
Akira MIYATA, National Institute for Agro-Environmental
Sciences, Japan, [email protected]
Yoshikazu OHTANI, Forestry and Forest Products Research
Institute, Japan, [email protected]
Nobuko SAIGUSA, National institute of Advanced Industrial
Science and Technology, Japan, [email protected]
Chuckree SENTHONG, Chiang Mai University, Thailand,
Satoko YUTA, National Institute for Environmental Studies, Japan,
3
Standardization and systematization of
carbon-budget observation in Asian terrestrial
ecosystem based on AsiaFlux network
Project Reference Number: ARCP2006-01CMY
Final Report submitted to APN
©Asia-Pacific Network for Global Change Research
4
Overview of project work and outcomes
Non-technical summary The estimation of carbon budget in terrestrial ecosystem is one of urgent research subjects in terms of climate change study and the implementation of Kyoto Protocol. The micrometeorological approach has been the most common method in this study field, however, the technique has not yet been standardized nor fully diffused into Asian countries. We have conducted AsiaFlux Workshops in 2005 and 2006 with foremost experts as well as young scientists from both inside and outside of Asia to provide opportunities to discuss and understand the current situation and problems of each Asian country. The newly reported information was very valuable for further promotion of AsiaFlux Activities. We have also compiled technical manual in terms of summarizing the result of data reanalysis and standardization of observation method. This manual can be used by young scientists aiming for their initial capacity building in flux observation and analysis.
Objectives The main objectives of the project were: 1) to promote information exchange and to improve methodology in flux observation and data analysis among participating countries in order to provide much more reliable carbon budget data in Asian monsoon terrestrial ecosystems, 2) to promote the systematic carbon budget observation in Asia and to encourage activities of observation in Asian countries with the development of AsiaFlux network. Amount received and number years supported
2005/06: USD 25,000.
2006/07: USD 20,000.
Activity undertaken We have conducted two international workshops on the carbon flux observation in Asian terrestrial ecosystems. 1) AsiaFlux Workshop 2005 was held in August 2005 in Fujiyoshida, Japan, titled “International Workshop on Advanced Flux Network and Flux Evaluation”. 2) AsiaFlux Workshop 2006 was held in November to December 2006 in Chiang Mai, Thailand, titled “International Workshop on Flux Estimation over Diverse Terrestrial Ecosystems in Asia”. More than 130 and 140 participants, respectively, have attended both from inside and outside Asia. Active discussions have made it possible to exchange and share valuable information on flux measurement and analysis methodologies. Furthermore, we have come to understand the current situation and challenges of each Asian country and their reported information would be very helpful for further promotion of AsiaFlux Activities. Results We have published two proceedings of AsiaFlux Workshop 2005 and 2006 on advanced flux network and flux evaluation. About 100 reports are included in both and they discussed the latest information such as current situation of flux measurement in Asian countries, the carbon dioxide flux evaluation on complex terrains and flux estimation over diverse ecosystems from tropical to sub-arctic climates in Asia. The information is going to be utilized for the rebuilding of the Asian flux network. Significant amount of valuable information on flux measurement and analysis methodologies was exchanged and shared through active discussion at AsiaFlux Workshop 2005 and 2006. A Technical manual was prepared and used as textbook in AsiaFlux Training Course on micrometeorology in 2006. Some of our reports about the new activities of AsiaFlux
5
have been introduced in some academic journals. We have carried out inter-comparison of measurement by using annual data from different type of observation method (open- and closed-path system). The results show a significant difference in CO2 flux values between the different observation methods. CO2 flux value from closed-path system tends to increase as sensible heat flux increases, whereas open-path system shows larger reading when wind speed increases. These results shall be valuable evaluating index for previously obtained data.
Relevance to APN’s Science Agenda and objectives Our objectives have been related to three topics of APN research frameworks: 1) Changes in Terrestrial Ecosystems, 2) Human Dimensions of Global Change, and 3) Changes in Atmospheric Composition. Asia is a unique area where terrestrial ecosystems are continuously distributed from arctic to tropical zone, and the monsoon causes intense rain fall in the growing season of plants. There is a large amount of human activities such as land-use change by plantation and forest managements. These changes will lead to the carbon budget change in the terrestrial ecosystems, and will affect the atmospheric composition. Furthermore, this unique ecosystem in Asia has attracted the attention as a carbon sink against the global warming and carbon dioxide fertilization. We have contributed to the APN’s science objectives by the following two aspects; one is to organize the information exchange among the carbon flux observation network in Asia, and another is to promote capacity building among the Asian researchers. Self evaluation We have become able to picture the current situation of the carbon budget observation in Asian countries. The obtained information will help us to re-build AsiaFlux framework to enhance the general technical level of flux observation. Potential for further work Our activities have urged to build up new sub-regional flux observation networks in Asia, such as in Thailand, Philippines and India. The emphasized AsiaFlux network through the APN program is going to start a new scientific program on the terrestrial carbon budget among China, Korea and Japan. It will be a successive program after the APN project also to promote AsiaFlux activities. Publications 1) Proc. AsiaFlux Workshop 2005 “International Workshop on Advanced Flux Network
and Flux Evaluation”, Ed. AsiaFlux Workshop Organizing Committee, 96pp., 2005 2) Proc. AsiaFlux Workshop 2006 “International Workshop on Flux Estimation over
Diverse Terrestrial Ecosystem in Asia“, Ed. S. Lakanavichian, 113pp., 2006 3) Practice of Flux Observations in Terrestrial Ecosystems, Ed. Asia Flux Steering
Committee, 2006 References None Acknowledgments AsiaFlux Activities are also financially supported by Ministry of Education, Culture, Sports, Science and Technology (MEXT) as well as APN. We have committed most of the available APN funds for subsidizing inviting leading experts to workshops and preparation of the technical manual for the AsiaFlux Training Course.
6
Technical Report Preface
The estimation of carbon budget in terrestrial ecosystem is one of the urgent research subjects from the views of climate change research and the implementation of Kyoto Protocol. The objective of our study is to promote information exchange and to improve methodology in flux observation and data analysis among Asian countries in order to provide much more reliable carbon budget data in Asian monsoon terrestrial ecosystems. The systematic and standardized carbon-budget observation in Asia will be encouraged together with the development of AsiaFlux network.
Table of Contents
1.0 Introduction
2.0 Methodology
2.1 AsiaFlux Workshop2005
2.2 AsiaFlux Workshop2006
2.3 Data reanalysis
2.4 Publication of technical manual on flux measurements
3.0 Results & Discussion
3.1 AsiaFlux Workshop2005
3.1.1 New Programs of AsiaFlux and reports from Asian countries
3.1.2 Special Session “Complex Topography”
3.1.3 Other sessions (Long-term Flux Observation, Earth Observation and AsiaFlux, Biochemical Cycles in Terrestrial Ecosystem, Modeling and Remote Sensing of Terrestrial Ecosystem, and Poster session)
3.2 AsiaFlux Workshop2006
3.2.1 Overview of AsiaFlux and FLUXNET Activities
3.2.2 Establishment of New Sub-Regional Networks in Asia
3.2.3 Field Trip to the Huay Kog Ma Watershed
3.3 Data reanalysis
3.4 Publication of technical manual on flux measurements
4.0 Conclusions
5.0 Future Directions
References
Appendix A1 Proceeding of AsiaFlux Workshop 2005
Appendix A2 Proceeding of AsiaFlux Workshop 2006
Appendix A3 Practice of Flux Observations in Terrestrial Ecosystems
7
1.0 Introduction
The estimation of carbon budget in terrestrial ecosystem is one of the urgent research subjects from the views of climate change research and the implementation of Kyoto Protocol. The technology widely used in recent years to evaluate the ecosystem carbon budget is the eddy covariance method called tower flux measurement, which determines instantaneous flux from covariance of the CO2 concentration and the vertical wind velocity. Net carbon budget for a period is computed by integrating the instantaneous fluxes over the period. Although the principle of the measurement is simple, instrumentation, data acquisition and data analysis are very complicated because these aspects are highly sensitive on local topography, vegetation and regional climatic conditions. In addition, the eddy covariance observation can be easily disturbed by heavy rain and the result is poorly reliable under calm conditions. We need to remove those data uncertainty, but its strategy and procedure are not standardized, yet. These are factors of discrepancy among observation sites.
27 flux measurements, when this project began, were under operation (10 in Japan, 8 in China, 2 in Korea, 2 in Thailand, 2 in Indonesia, 2 in Malaysia and 1 in Russia) in different implementation structure and instrumentation. Most of them have been organized in AsiaFlux network and others were in preparation for joining to it. To evaluate the regional and global carbon uptake by terrestrial ecosystem using the high quality data, the observation should be managed under the organized measurement network and operated by standardized methodology. This project aimed to promote information exchange and to improve methodology in flux observation and data analysis among participating countries in order to provide much more reliable carbon budget data in Asian monsoon terrestrial ecosystems. The activities of carbon-budget observation in Asian countries would be encouraged and the systematic observation would be established in Asia, together with the development of AsiaFlux network. For those purposes, we focus on the following two major activities. One was to hold the AsiaFlux Workshop holding annually to exchange the latest scientific information on the flux measurement and analysis. Another was to hold annual program, “AsiaFlux Training Course” to provide opportunity to study microclimatologic background, flux measurement and data analysis mainly for the younger scientists in Asia. The course itself is conducted by other project framework, but we prepare a text book used in the course in this APN project.
2.0 Methodology
The objective to open workshops were to promote information exchange and to improve methodology in flux observation and data analysis among participating countries in order to provide much more reliable carbon budget data in Asian monsoon terrestrial ecosystems. For those purposes, we have conducted two AsiaFlux Workshops in 2005 and 2006 with foremost experts as well as young scientists from both inside and outside of Asia to provide opportunities to discuss and understand the current situation and problems of each Asian country.
We have also compiled technical manual in terms of summarizing the result of data reanalysis and standardization of observation method. This manual has been used by young scientists aiming for their initial capacity building in flux observation and analysis. A flux observation manual was already published (AsiaFlux Steering Committee, 2003) by Japanese scientists in AsiaFlux community, but it was specialized to Japanese climate and land-use type and was written in Japanese. The manual has been updated and translated into English, and some descriptions on the applicable scope into Asian region have been taken into account.
AsiaFlux Activities are also supported by MEXT* project as well as APN. We have committed most of the available APN funds for subsidizing inviting leading experts to workshops and preparation of technical manual. This manual has been utilized for the AsiaFlux Training Course conducted in the MEXT project framework.
8
*MEXT project: AsiaFlux Activities are also financially supported by the project from Ministry of Education, Culture, Sports, Science and Technology (MEXT), titled “Initiation of the next-generation AsiaFlux”. Both financial budget from APN and MEXT have been concurrently supported our activities.
2.1 AsiaFlux Workshop2005
AsiaFlux Workshop 2005 was held in August 2005 in Fujiyoshida, Japan. Active discussions have made it possible to exchange and share valuable information on flux measurement and analysis methodologies. Furthermore, we have come to understand the current situation and challenges of each Asian country and their reported information would be very helpful for further promotion of AsiaFlux Activities. More than 130 participants have attended from various research institutions and universities all over Asia including Bangladesh, China, India, Japan, Korea, Malaysia, Philippines, and Thailand. We also invited some experts from technically developed countries such as Australia, Canada and USA for keynote speeches.
2.2 AsiaFlux Workshop2006
The workshop in 2nd year was held in November 2006, in Chiang Mai, Thailand. Discussions were focusing especially on the standardized methodology and inter comparison of data obtained in various conditions. Several participants have reported about their newly established, or planned to be established, flux observation sites. We saw the progeny of our activities on capacity building technology transfer. Over 140 researchers participated from 13 countries and regions, including Australia, Bangladesh, China, Indonesia, Japan, Korea, Malaysia, Philippines, Singapore, Taiwan, Thailand, UK and USA.
2.3 Data reanalysis
We have carried out inter-comparison of measurement by using annual data from different type of observation method (open- and closed-path system). We have installed both systems on the same observation towers which are located in the different vegetation and climate zone, such as paddy filed (Tsukuba, warm-temperate zone) and larch forest (Tomakomai, cool-temperate zone). We summarized the result of this data reanalysis and pursued incorporation of information into the technical manual.
2.4 Publication of technical manual on flux measurements
A survey was carried out to find out the distribution of observation sites in Asia, and a standard method of flux observation and data analysis was also established. To summarize the new standard method and to promote it in Asian countries, we have compiled a concrete technical manual on flux measurements which was suitable for Asian typical ecosystem and climate conditions. Detailed data analysis methodology is described in it, including the methods of unreliable data detection and the fulfillments of observation gaps. Using this manual as a textbook, the very first AsiaFlux Training Course 2006 was carried out in late August 2006 in Tsukuba, Japan which was also one of the main focuses in the MEXT project framework. 20 participants from nine countries (Bangladesh, China, India, Indonesia, Malaysia, Philippines, Taiwan, Thailand and Viet Nam) came together to learn about basis of observation theory, observation techniques and data analysis in 10 days.
3.0 Results & Discussion
3.1 AsiaFlux Workshop2005
The AsiaFlux Workshop 2005 (International Workshop on Advanced Flux Network and Flux Evaluation) was held successfully in 24-26 August 2005, in Fujiyoshida, on the foothills of Mt. Fuji, Japan. This is the 4th workshop of the AsiaFlux network and the purpose is to provide an opportunity to improve the understanding on cycles of carbon
9
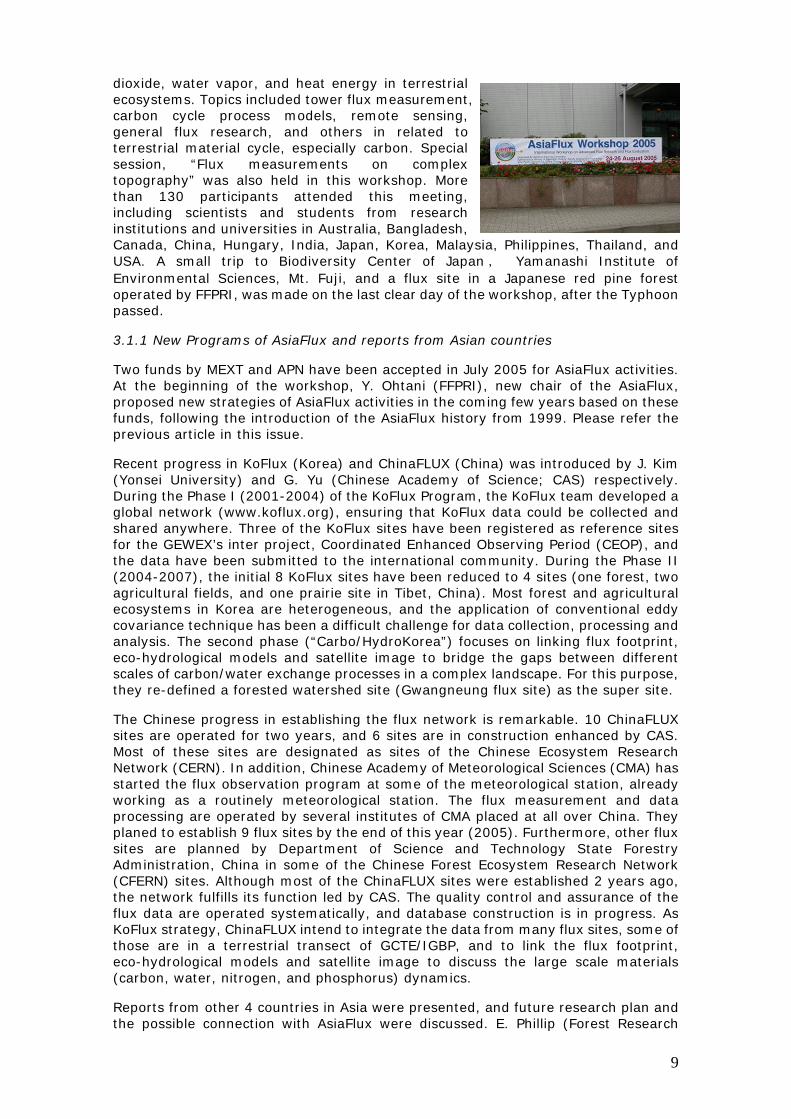
dioxide, water vapor, and heat energy in terrestrial ecosystems. Topics included tower flux measurement, carbon cycle process models, remote sensing, general flux research, and others in related to terrestrial material cycle, especially carbon. Special session, “Flux measurements on complex topography” was also held in this workshop. More than 130 participants attended this meeting, including scientists and students from research institutions and universities in Australia, Bangladesh, Canada, China, Hungary, India, Japan, Korea, Malaysia, Philippines, Thailand, and USA. A small trip to Biodiversity Center of Japan , Yamanashi Institute of Environmental Sciences, Mt. Fuji, and a flux site in a Japanese red pine forest operated by FFPRI, was made on the last clear day of the workshop, after the Typhoon passed.
3.1.1 New Programs of AsiaFlux and reports from Asian countries
Two funds by MEXT and APN have been accepted in July 2005 for AsiaFlux activities. At the beginning of the workshop, Y. Ohtani (FFPRI), new chair of the AsiaFlux, proposed new strategies of AsiaFlux activities in the coming few years based on these funds, following the introduction of the AsiaFlux history from 1999. Please refer the previous article in this issue.
Recent progress in KoFlux (Korea) and ChinaFLUX (China) was introduced by J. Kim (Yonsei University) and G. Yu (Chinese Academy of Science; CAS) respectively. During the Phase I (2001-2004) of the KoFlux Program, the KoFlux team developed a global network (www.koflux.org), ensuring that KoFlux data could be collected and shared anywhere. Three of the KoFlux sites have been registered as reference sites for the GEWEX’s inter project, Coordinated Enhanced Observing Period (CEOP), and the data have been submitted to the international community. During the Phase II (2004-2007), the initial 8 KoFlux sites have been reduced to 4 sites (one forest, two agricultural fields, and one prairie site in Tibet, China). Most forest and agricultural ecosystems in Korea are heterogeneous, and the application of conventional eddy covariance technique has been a difficult challenge for data collection, processing and analysis. The second phase (“Carbo/HydroKorea”) focuses on linking flux footprint, eco-hydrological models and satellite image to bridge the gaps between different scales of carbon/water exchange processes in a complex landscape. For this purpose, they re-defined a forested watershed site (Gwangneung flux site) as the super site.
The Chinese progress in establishing the flux network is remarkable. 10 ChinaFLUX sites are operated for two years, and 6 sites are in construction enhanced by CAS. Most of these sites are designated as sites of the Chinese Ecosystem Research Network (CERN). In addition, Chinese Academy of Meteorological Sciences (CMA) has started the flux observation program at some of the meteorological station, already working as a routinely meteorological station. The flux measurement and data processing are operated by several institutes of CMA placed at all over China. They planed to establish 9 flux sites by the end of this year (2005). Furthermore, other flux sites are planned by Department of Science and Technology State Forestry Administration, China in some of the Chinese Forest Ecosystem Research Network (CFERN) sites. Although most of the ChinaFLUX sites were established 2 years ago, the network fulfills its function led by CAS. The quality control and assurance of the flux data are operated systematically, and database construction is in progress. As KoFlux strategy, ChinaFLUX intend to integrate the data from many flux sites, some of those are in a terrestrial transect of GCTE/IGBP, and to link the flux footprint, eco-hydrological models and satellite image to discuss the large scale materials (carbon, water, nitrogen, and phosphorus) dynamics.
Reports from other 4 countries in Asia were presented, and future research plan and the possible connection with AsiaFlux were discussed. E. Phillip (Forest Research
10
Institute Malaysia) reported the research and development activities on climate change in Malaysia. E.P. presented the C-sequestration capacity of several ecosystems (Peat swamp, Mangrove, Plantation, Inland forest, and others), based on the data of the C-sequestration inventory in Malaysian forest or the carbon budget study in Pasoh and Lambir Forest Reserves, and discussed the impact of climate change on these ecosystems based on the ecological data. C. Senthong (Chiang Mai University) introduced the 6 flux sites in Thailand, which were constructed by members of the AsiaFlux, and their recent research works on micrometeorology. In addition, C.S. introduced a new program “The Royal Golden Jubilee Ph. D. program” granted by Thailand Research Fund to train young scientists of micrometeorology. M. A. Baten (Bangladesh Agricultural University) introduced the natural, agricultural, ecological, and scientific aspects of Bangladesh, and a plan to monitor the CO2 and H2O fluxes at a rice ecosystem with help of National Institute for Agro-Environmental Sciences, Japan (NIAES). N. Hooda (Ministry of Environment and Forests, India) presented recent researches on the assessment of major carbon pools and fluxes in India’s forest and their change caused by the change in the land use, based on the taught data sets of forest and soil carbon inventories of all over India and land use change data obtained by satellite mapping. Additionally, N.H. showed a prediction of the change in the NPP due to the climate change, using the BIOME-3 model. In order to improve its precision, she pointed out the necessity of the intensive research on the carbon dynamics by tower flux measurement at some of the typical forest ecosystems in India.
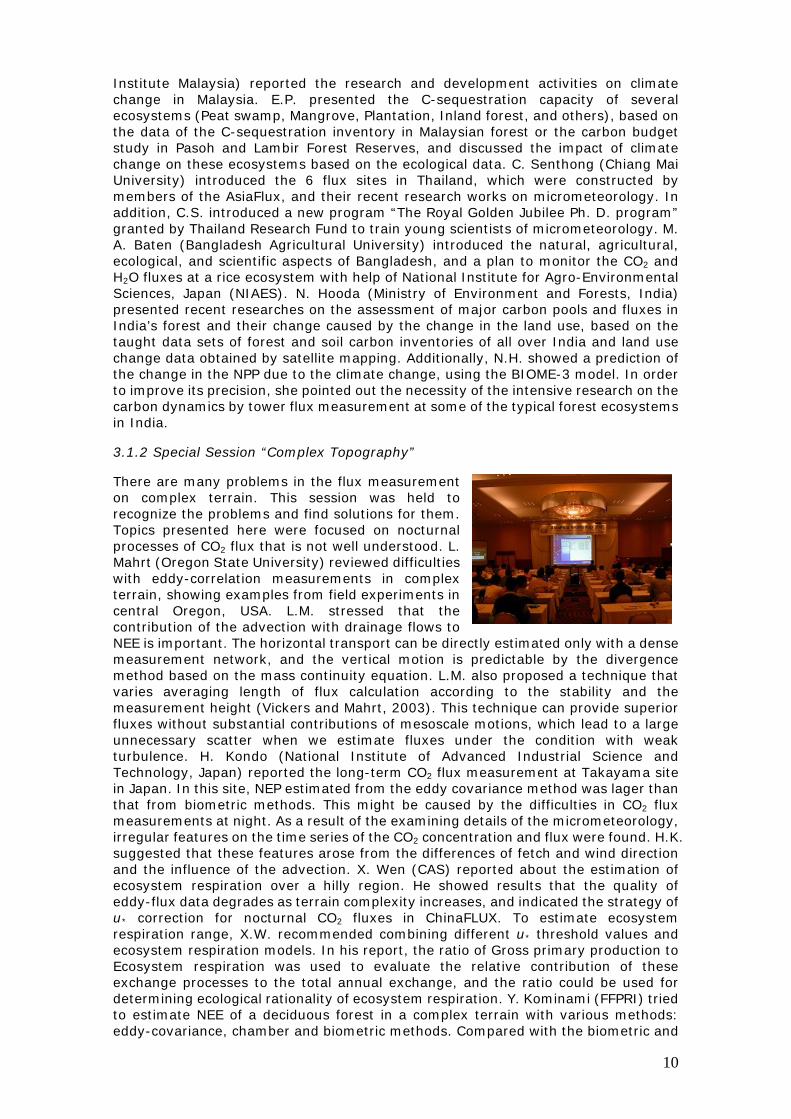
3.1.2 Special Session “Complex Topography”
There are many problems in the flux measurement on complex terrain. This session was held to recognize the problems and find solutions for them. Topics presented here were focused on nocturnal processes of CO2 flux that is not well understood. L. Mahrt (Oregon State University) reviewed difficulties with eddy-correlation measurements in complex terrain, showing examples from field experiments in central Oregon, USA. L.M. stressed that the contribution of the advection with drainage flows to NEE is important. The horizontal transport can be directly estimated only with a dense measurement network, and the vertical motion is predictable by the divergence method based on the mass continuity equation. L.M. also proposed a technique that varies averaging length of flux calculation according to the stability and the measurement height (Vickers and Mahrt, 2003). This technique can provide superior fluxes without substantial contributions of mesoscale motions, which lead to a large unnecessary scatter when we estimate fluxes under the condition with weak turbulence. H. Kondo (National Institute of Advanced Industrial Science and Technology, Japan) reported the long-term CO2 flux measurement at Takayama site in Japan. In this site, NEP estimated from the eddy covariance method was lager than that from biometric methods. This might be caused by the difficulties in CO2 flux measurements at night. As a result of the examining details of the micrometeorology, irregular features on the time series of the CO2 concentration and flux were found. H.K. suggested that these features arose from the differences of fetch and wind direction and the influence of the advection. X. Wen (CAS) reported about the estimation of ecosystem respiration over a hilly region. He showed results that the quality of eddy-flux data degrades as terrain complexity increases, and indicated the strategy of u* correction for nocturnal CO2 fluxes in ChinaFLUX. To estimate ecosystem respiration range, X.W. recommended combining different u* threshold values and ecosystem respiration models. In his report, the ratio of Gross primary production to Ecosystem respiration was used to evaluate the relative contribution of these exchange processes to the total annual exchange, and the ratio could be used for determining ecological rationality of ecosystem respiration. Y. Kominami (FFPRI) tried to estimate NEE of a deciduous forest in a complex terrain with various methods: eddy-covariance, chamber and biometric methods. Compared with the biometric and
11
chamber measurements, u* threshold for nighttime respiration was determined. Y.K. also pointed out that the interpolation function varied with seasons and the seasonal change was occurred by the change in the growth respiration rate in spring and the decrease in soil respiration in summer. S. Okubo (Kyoto University) validated nighttime CO2 flux data in a mountainous site by comparing with chamber measurements of leaf, trunk and soil respirations. S.O. verified that nighttime NEE estimated from the tower-based measurement nearly equaled to the ecosystem respiration estimated from the chamber measurements at high u* conditions. These results provided a positive prospect of the u* correction in a complex terrain. M. Y. Leclerc (The University of Georgia) addressed the problems of nighttime flux measurements and their interpretation. M.L. showed the impact of nighttime atmospheric phenomena (waves, low-level jet and so on) on fluxes. The interactions between these phenomena at night suggested that tower flux measurements include not only the influence of the underlying surface, but also the influence of the structure of the atmosphere above. M.L. cautioned about the selection of nighttime calculations of NEE: Not all periods exhibiting turbulent mixing with arbitrary above-threshold velocities qualify to represent surface-atmosphere exchange of a target area.
The following two studies are presented in other session but are strongly related to this issue. R. Leuning (CSIRO, Australia) introduced novel mass-balance approach to measure the mass balance of a 50x50x6m control volume installed in a tall Eucalyptus forest in south east Australia. Net fluxes of CO2 from the soil and vegetation were estimated from the vector sums of fluxes through the sidewalls and upper surface of the control volume. The novelty of the measurement system was the use of windspeed-weighted sampling of air from six airlines per sidewall combined with eddy flux instrumentation at 6 m. The results showed that all terms in mass balance equation (change in storage, eddy flux across lid, and horizontal advection) were the same scale and important at night. In addition, 10-day mean mass balance flux agreed with the biological measurements, however the dynamics was different. Y. Kosugi (Kyoto University) validated evapotranspiration rate obtained by eddy flux observation at a hilly watershed using the watershed water balance evaluation. Y.K. suggested that the correction to close the energy budget improved the water budget in the watershed.
3.1.3 Other sessions (Long-term Flux Observation, Earth Observation and AsiaFlux, Biochemical Cycles in Terrestrial Ecosystem, Modeling and Remote Sensing of Terrestrial Ecosystem, and Poster session)
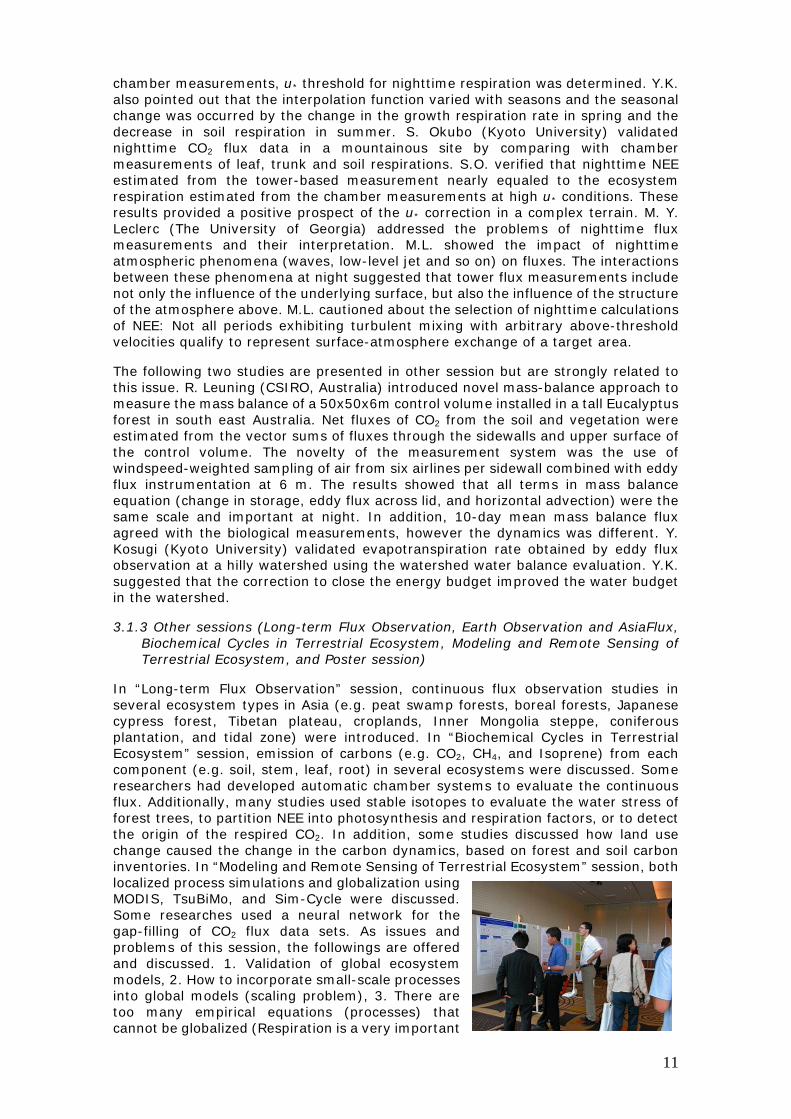
In “Long-term Flux Observation” session, continuous flux observation studies in several ecosystem types in Asia (e.g. peat swamp forests, boreal forests, Japanese cypress forest, Tibetan plateau, croplands, Inner Mongolia steppe, coniferous plantation, and tidal zone) were introduced. In “Biochemical Cycles in Terrestrial Ecosystem” session, emission of carbons (e.g. CO2, CH4, and Isoprene) from each component (e.g. soil, stem, leaf, root) in several ecosystems were discussed. Some researchers had developed automatic chamber systems to evaluate the continuous flux. Additionally, many studies used stable isotopes to evaluate the water stress of forest trees, to partition NEE into photosynthesis and respiration factors, or to detect the origin of the respired CO2. In addition, some studies discussed how land use change caused the change in the carbon dynamics, based on forest and soil carbon inventories. In “Modeling and Remote Sensing of Terrestrial Ecosystem” session, both localized process simulations and globalization using MODIS, TsuBiMo, and Sim-Cycle were discussed. Some researches used a neural network for the gap-filling of CO2 flux data sets. As issues and problems of this session, the followings are offered and discussed. 1. Validation of global ecosystem models, 2. How to incorporate small-scale processes into global models (scaling problem), 3. There are too many empirical equations (processes) that cannot be globalized (Respiration is a very important
12
component – Q10 parameterization is grossly inadequate), 4. First principle approach? - Unification of concepts (“GCMs” of ecosystem models). In “Earth Observation and AsiaFlux” session, G. Inoue (NIES) presented possible contribution of AsiaFlux to an international operational observation “Integrated Global Carbon Observation (IGCO)” in Integrated Global Observing Strategy (IGOS; http://www.eohandbook.com/igosp/) proposed by WMO and UNEP, and the relation of IGCO to the research planning “Global Carbon Project (GCP; http://www.globalcarbonproject.org)” (Global Carbon Project, 2003) and the assessment “Intergovernmental Panel on Climate Change (IPCC)”. In addition, G.I. introduced the Greenhouse gasses observing satellite (GOSAT) that will be launched in 2008. GOSAT is developed by the Ministry of Environment, Japan and Japan Aerospace Exploration Agency and can estimate column-integrated atmospheric CO2 and CH4. H. Sawada (FFPRI) introduced the application of satellite data to monitor forest ecosystems. More than 50 studies, concerning on the above-mentioned issues, were presented in the Poster session. (Takagi, K. and Yasuda, Y., 2005)
3.2 AsiaFlux Workshop2006
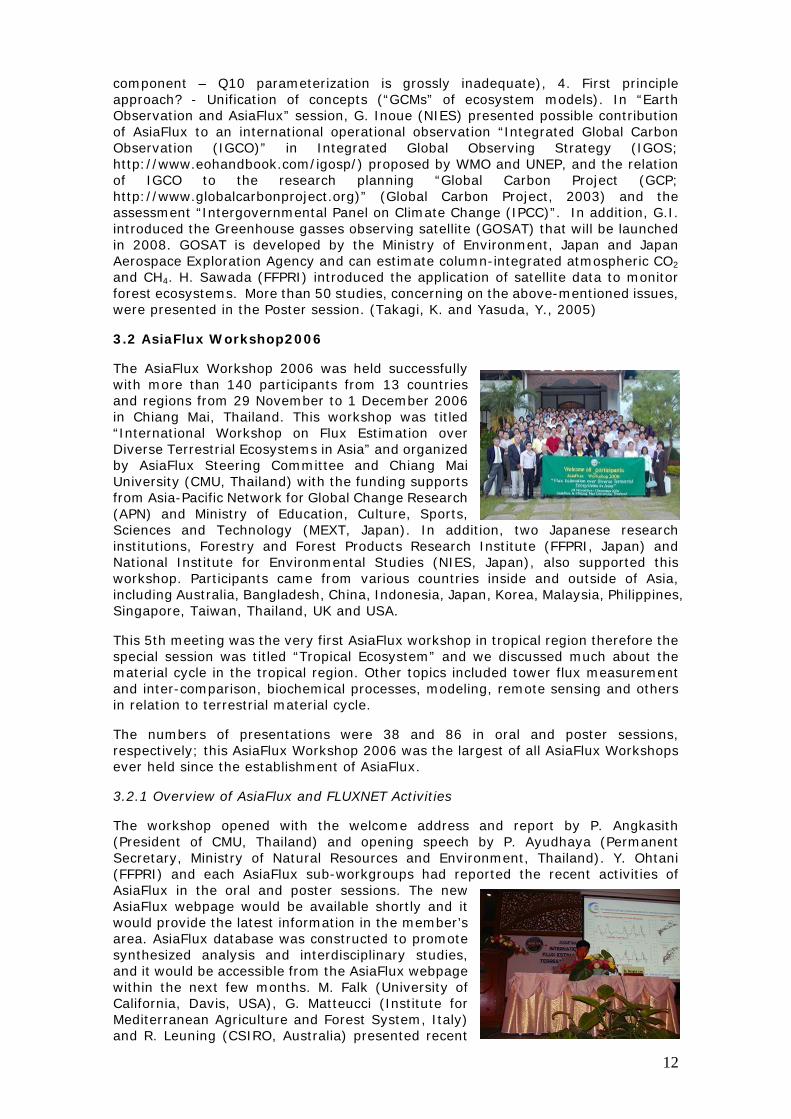
The AsiaFlux Workshop 2006 was held successfully with more than 140 participants from 13 countries and regions from 29 November to 1 December 2006 in Chiang Mai, Thailand. This workshop was titled “International Workshop on Flux Estimation over Diverse Terrestrial Ecosystems in Asia” and organized by AsiaFlux Steering Committee and Chiang Mai University (CMU, Thailand) with the funding supports from Asia-Pacific Network for Global Change Research (APN) and Ministry of Education, Culture, Sports, Sciences and Technology (MEXT, Japan). In addition, two Japanese research institutions, Forestry and Forest Products Research Institute (FFPRI, Japan) and National Institute for Environmental Studies (NIES, Japan), also supported this workshop. Participants came from various countries inside and outside of Asia, including Australia, Bangladesh, China, Indonesia, Japan, Korea, Malaysia, Philippines, Singapore, Taiwan, Thailand, UK and USA.
This 5th meeting was the very first AsiaFlux workshop in tropical region therefore the special session was titled “Tropical Ecosystem” and we discussed much about the material cycle in the tropical region. Other topics included tower flux measurement and inter-comparison, biochemical processes, modeling, remote sensing and others in relation to terrestrial material cycle.
The numbers of presentations were 38 and 86 in oral and poster sessions, respectively; this AsiaFlux Workshop 2006 was the largest of all AsiaFlux Workshops ever held since the establishment of AsiaFlux.
3.2.1 Overview of AsiaFlux and FLUXNET Activities
The workshop opened with the welcome address and report by P. Angkasith (President of CMU, Thailand) and opening speech by P. Ayudhaya (Permanent Secretary, Ministry of Natural Resources and Environment, Thailand). Y. Ohtani (FFPRI) and each AsiaFlux sub-workgroups had reported the recent activities of AsiaFlux in the oral and poster sessions. The new AsiaFlux webpage would be available shortly and it would provide the latest information in the member’s area. AsiaFlux database was constructed to promote synthesized analysis and interdisciplinary studies, and it would be accessible from the AsiaFlux webpage within the next few months. M. Falk (University of California, Davis, USA), G. Matteucci (Institute for Mediterranean Agriculture and Forest System, Italy) and R. Leuning (CSIRO, Australia) presented recent
13
situations in global and regional networks in flux measurement. FLUXNET highlighted the importance of synthesizing analysis and announced that they were going to hold FLUXNET data synthesis workshop in February 2007.
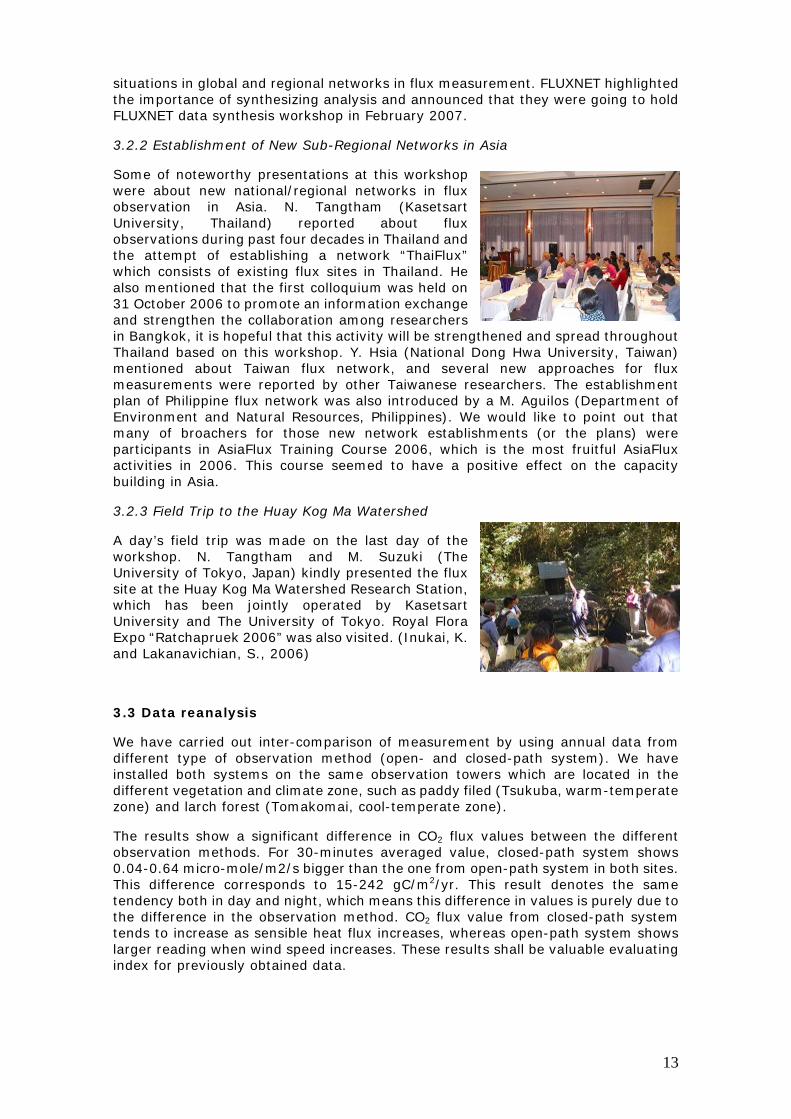
3.2.2 Establishment of New Sub-Regional Networks in Asia
Some of noteworthy presentations at this workshop were about new national/regional networks in flux observation in Asia. N. Tangtham (Kasetsart University, Thailand) reported about flux observations during past four decades in Thailand and the attempt of establishing a network “ThaiFlux” which consists of existing flux sites in Thailand. He also mentioned that the first colloquium was held on 31 October 2006 to promote an information exchange and strengthen the collaboration among researchers in Bangkok, it is hopeful that this activity will be strengthened and spread throughout Thailand based on this workshop. Y. Hsia (National Dong Hwa University, Taiwan) mentioned about Taiwan flux network, and several new approaches for flux measurements were reported by other Taiwanese researchers. The establishment plan of Philippine flux network was also introduced by a M. Aguilos (Department of Environment and Natural Resources, Philippines). We would like to point out that many of broachers for those new network establishments (or the plans) were participants in AsiaFlux Training Course 2006, which is the most fruitful AsiaFlux activities in 2006. This course seemed to have a positive effect on the capacity building in Asia.
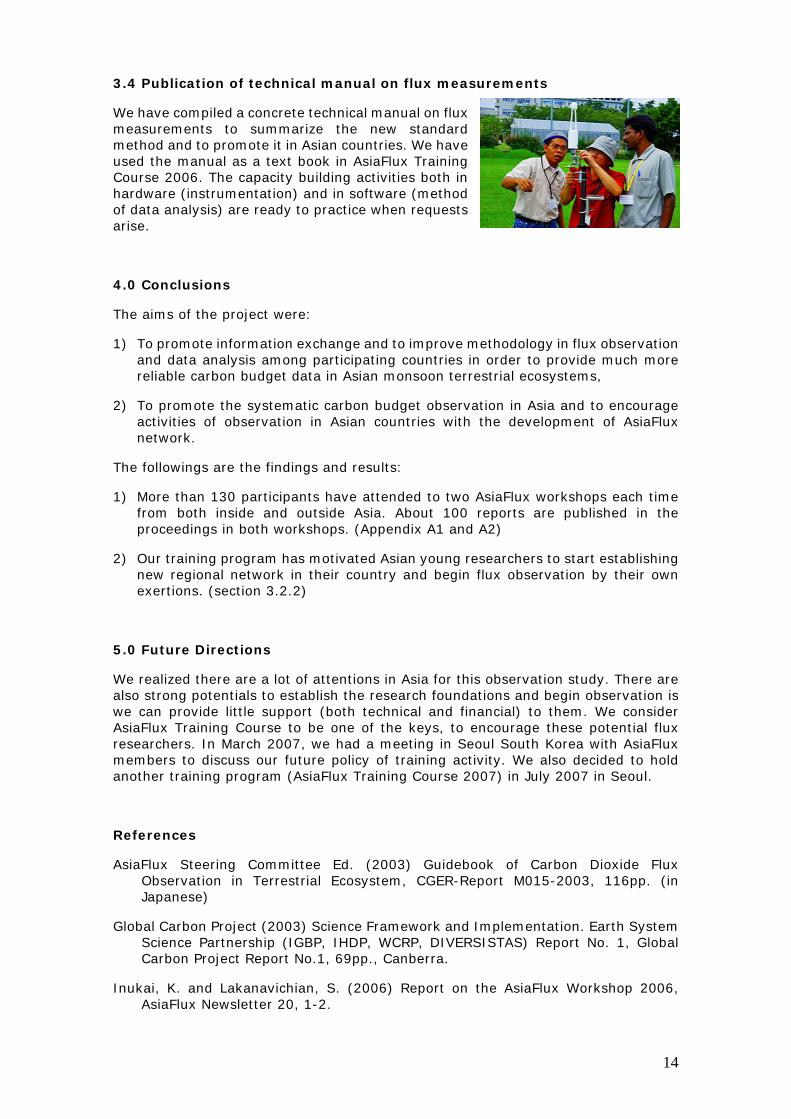
3.2.3 Field Trip to the Huay Kog Ma Watershed
A day’s field trip was made on the last day of the workshop. N. Tangtham and M. Suzuki (The University of Tokyo, Japan) kindly presented the flux site at the Huay Kog Ma Watershed Research Station, which has been jointly operated by Kasetsart University and The University of Tokyo. Royal Flora Expo “Ratchapruek 2006” was also visited. (Inukai, K. and Lakanavichian, S., 2006)
3.3 Data reanalysis
We have carried out inter-comparison of measurement by using annual data from different type of observation method (open- and closed-path system). We have installed both systems on the same observation towers which are located in the different vegetation and climate zone, such as paddy filed (Tsukuba, warm-temperate zone) and larch forest (Tomakomai, cool-temperate zone).
The results show a significant difference in CO2 flux values between the different observation methods. For 30-minutes averaged value, closed-path system shows 0.04-0.64 micro-mole/m2/s bigger than the one from open-path system in both sites. This difference corresponds to 15-242 gC/m2/yr. This result denotes the same tendency both in day and night, which means this difference in values is purely due to the difference in the observation method. CO2 flux value from closed-path system tends to increase as sensible heat flux increases, whereas open-path system shows larger reading when wind speed increases. These results shall be valuable evaluating index for previously obtained data.
14
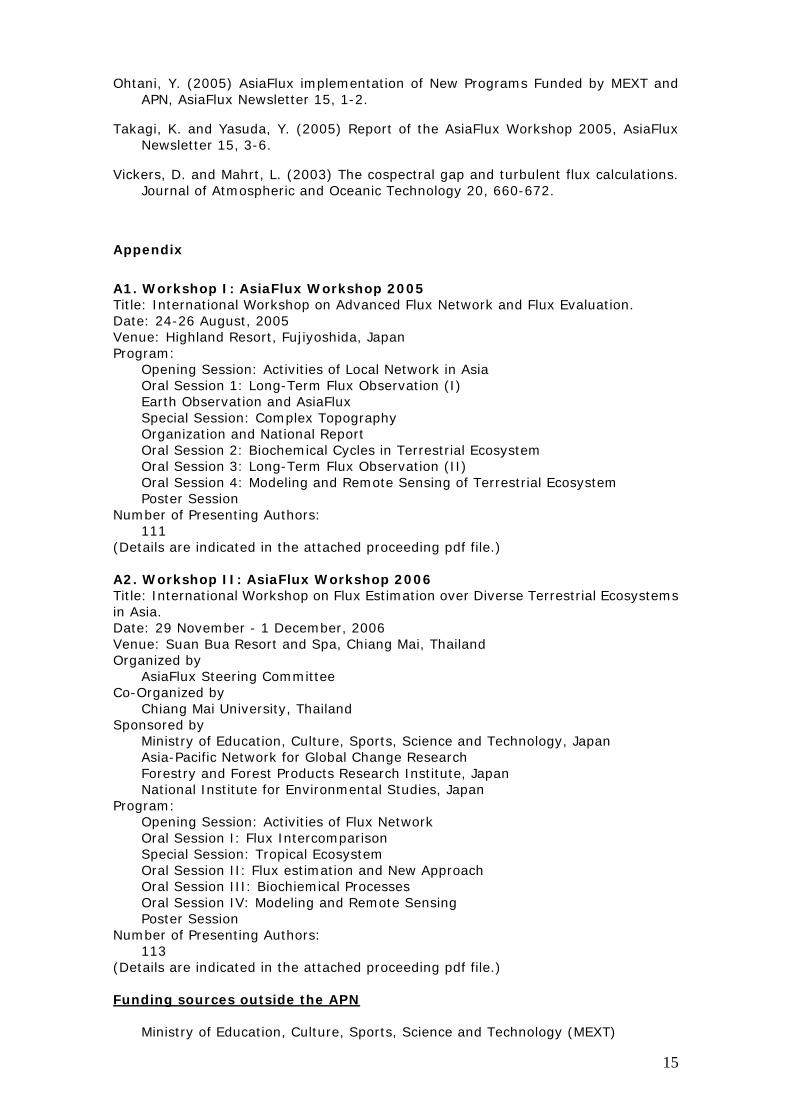
3.4 Publication of technical manual on flux measurements
We have compiled a concrete technical manual on flux measurements to summarize the new standard method and to promote it in Asian countries. We have used the manual as a text book in AsiaFlux Training Course 2006. The capacity building activities both in hardware (instrumentation) and in software (method of data analysis) are ready to practice when requests arise.
4.0 Conclusions
The aims of the project were:
1) To promote information exchange and to improve methodology in flux observation and data analysis among participating countries in order to provide much more reliable carbon budget data in Asian monsoon terrestrial ecosystems,
2) To promote the systematic carbon budget observation in Asia and to encourage activities of observation in Asian countries with the development of AsiaFlux network.
The followings are the findings and results:
1) More than 130 participants have attended to two AsiaFlux workshops each time from both inside and outside Asia. About 100 reports are published in the proceedings in both workshops. (Appendix A1 and A2)
2) Our training program has motivated Asian young researchers to start establishing new regional network in their country and begin flux observation by their own exertions. (section 3.2.2)
5.0 Future Directions
We realized there are a lot of attentions in Asia for this observation study. There are also strong potentials to establish the research foundations and begin observation is we can provide little support (both technical and financial) to them. We consider AsiaFlux Training Course to be one of the keys, to encourage these potential flux researchers. In March 2007, we had a meeting in Seoul South Korea with AsiaFlux members to discuss our future policy of training activity. We also decided to hold another training program (AsiaFlux Training Course 2007) in July 2007 in Seoul.
References
AsiaFlux Steering Committee Ed. (2003) Guidebook of Carbon Dioxide Flux Observation in Terrestrial Ecosystem, CGER-Report M015-2003, 116pp. (in Japanese)
Global Carbon Project (2003) Science Framework and Implementation. Earth System Science Partnership (IGBP, IHDP, WCRP, DIVERSISTAS) Report No. 1, Global Carbon Project Report No.1, 69pp., Canberra.
Inukai, K. and Lakanavichian, S. (2006) Report on the AsiaFlux Workshop 2006, AsiaFlux Newsletter 20, 1-2.
15
Ohtani, Y. (2005) AsiaFlux implementation of New Programs Funded by MEXT and APN, AsiaFlux Newsletter 15, 1-2.
Takagi, K. and Yasuda, Y. (2005) Report of the AsiaFlux Workshop 2005, AsiaFlux Newsletter 15, 3-6.
Vickers, D. and Mahrt, L. (2003) The cospectral gap and turbulent flux calculations. Journal of Atmospheric and Oceanic Technology 20, 660-672.
Appendix
A1. Workshop I: AsiaFlux Workshop 2005 Title: International Workshop on Advanced Flux Network and Flux Evaluation. Date: 24-26 August, 2005 Venue: Highland Resort, Fujiyoshida, Japan Program:
Opening Session: Activities of Local Network in Asia Oral Session 1: Long-Term Flux Observation (I) Earth Observation and AsiaFlux Special Session: Complex Topography Organization and National Report Oral Session 2: Biochemical Cycles in Terrestrial Ecosystem Oral Session 3: Long-Term Flux Observation (II) Oral Session 4: Modeling and Remote Sensing of Terrestrial Ecosystem Poster Session
Number of Presenting Authors: 111
(Details are indicated in the attached proceeding pdf file.) A2. Workshop II: AsiaFlux Workshop 2006 Title: International Workshop on Flux Estimation over Diverse Terrestrial Ecosystems in Asia. Date: 29 November - 1 December, 2006 Venue: Suan Bua Resort and Spa, Chiang Mai, Thailand Organized by
AsiaFlux Steering Committee Co-Organized by
Chiang Mai University, Thailand Sponsored by
Ministry of Education, Culture, Sports, Science and Technology, Japan Asia-Pacific Network for Global Change Research Forestry and Forest Products Research Institute, Japan National Institute for Environmental Studies, Japan
Program: Opening Session: Activities of Flux Network Oral Session I: Flux Intercomparison Special Session: Tropical Ecosystem Oral Session II: Flux estimation and New Approach Oral Session III: Biochiemical Processes Oral Session IV: Modeling and Remote Sensing Poster Session
Number of Presenting Authors: 113
(Details are indicated in the attached proceeding pdf file.) Funding sources outside the APN
Ministry of Education, Culture, Sports, Science and Technology (MEXT)
16
“Initiation of the next-generation AsiaFlux” 21,000,000JPY, FY2005; 30,963,000JPY, FY2006
Glossary of Terms
AIST: National Research Institute for Advanced Industrial Science and Technology, Japan
APN: Asia-Pacific Network for Global Change Research CAS: Chinese Academy of Science CERN: Chinese Ecosystem Research Network CGER: Center for Global Change Research, NIES, Japan ChinaFLUX: A flux observation network in China by CERN CMA: Chinese Academy of Meteorological Sciences CSIRO: Australian Commonwealth Scientific and Research Organization EUROFLUX: A regional flux observation network in Europe FFPRI: Forestry and Forest Products Research Institute, Japan FLUXNET: A global flux observation network GCP: Global Carbon Project GCTE: Global Change and Terrestrial Ecosystems GEWEX: Global Energy and Water cycle Experiment GOSAT: Green Hause Gases Observing Sattelite GPP: Gloss primary productivity (production) IGBP: International Geosphere-Biosphere Programme IGOS: Integrated Global Observing Strategy IGCO: Integrated Global Carbon Observation IPCC: Intergovernmental Panel on Climate Change KoFlux: A flux observation network in Korea MEXT: Ministry of Education, Culture, Sports, Science and Technology NEE: Net ecosystem carbon dioxide exchange NEP: Net ecosystem productivity (production) (= -NEE) NIAES: National Institute for Agro-Environmental Sciences, Japan NIES: National Institute for Environmental Studies, Japan
AsiaFlux Workshop 2005 International workshop on
Advanced Flux Network and Flux Evaluation
PPRROOCCEEEEDDIINNGGSS
24-26 August 2005 Hotel Highland Resort Fujiyoshida, Japan Organized by
AsiaFlux Steering Committee Co-Organized by
Forestry and Forest Products Research Institute National Institute for Environmental Studies
Supported by Asia-Pacific Network for Global Change Research Ministry of Education, Culture, Sports, Science and Technology City of Fujiyoshida
AsiaFlux Workshop 2005 International Workshop on
Advanced Flux Network and Flux Evaluation
PROCEEDINGS
24-26 August 2005 Highland Resort, Fujiyoshida, Japan

Edited by
Workshop Organizing Committee
Printed by
Digital Print Co., Ltd
Tsukuba, Japan 2005
Printed on Recycled Paper

Organizing Committees
AsiaFlux Steering Committee Fujinuma, Yasumi (Japan)
Fukushima, Yoshihiro (Japan)
Hirano, Takashi (Japan)
Inoue, Gen (Japan)
Kida, Hideji (Japan)
Kim, Joon (Co-chair, Korea)
Koizumi, Hirosi (Japan)
Lee, ByongLyol (Korea)
Lee, Dongho (Korea)
Miyata, Akira (Japan)
Monji, Nobutaka (Japan)
Ohtani, Yoshikazu (Chair, Japan)
Oikawa, Takehisa (Japan)
Tani, Makoto (Japan)
Yamamoto Susumu (Japan)
Workshop Organizing Committee Fujinuma, Yasumi (Japan)
Inukai, Koh (Japan)
Miyata, Akira (Japan)
Mizoguchi, Yasuko (Japan)
Nakano, Takashi (Japan)
Ohtani, Yoshikazu (Japan)
Okano, Michiaki (Japan)
Saigusa, Nobuko (Japan)
Wang, Huimin (Japan)
Yuta, Satoko (Japan)

Organizer AsiaFlux Steering Committee
Co-organizers Forestry and Forest Products Research Institute
National Institute for Environmental Studies
Sponsors Asia-Pacific Network for Global Change Research
Ministry of Education, Culture, Sports, Science and Technology
Supporting Community City of Fujiyoshida
AsiaFlux Secretariat Center for Global Environmental Research
National Institute for Environmental Studies
16-2 Onogawa, Tsukuba, Ibaraki 305-8506, JAPAN
FAX:+81-29-858-2645
E-mail:[email protected]
http://www.asiaflux.net

Contents
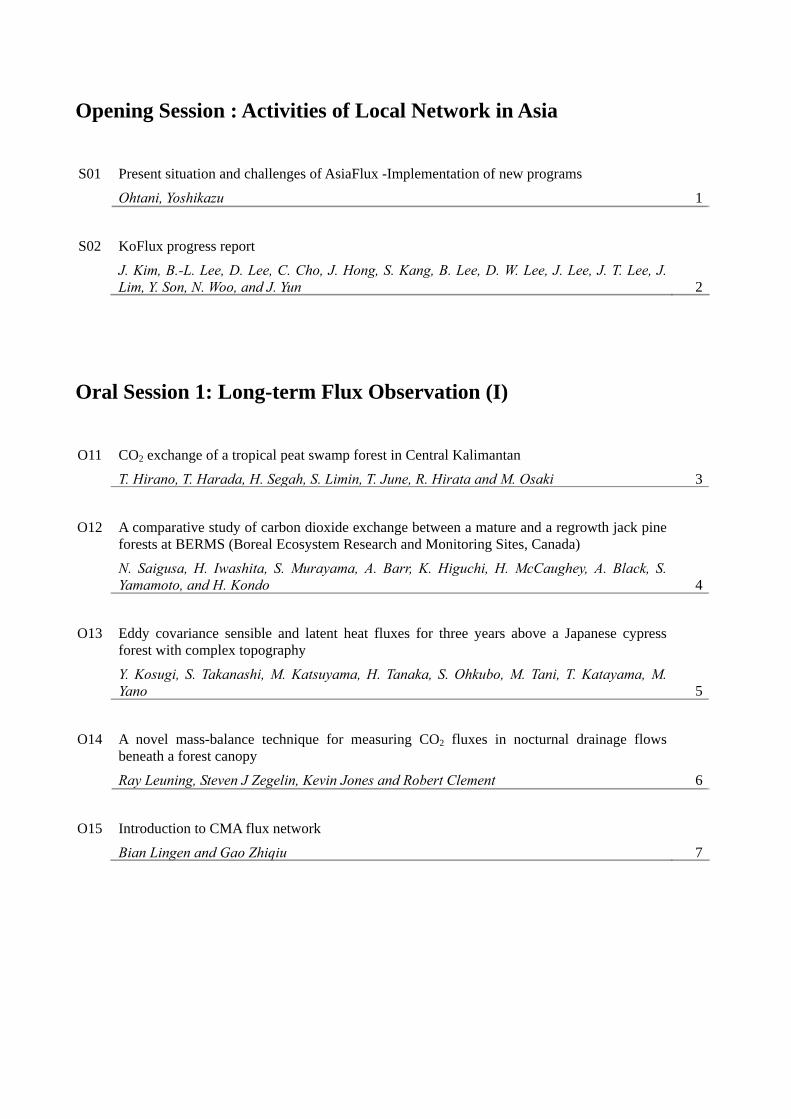
Opening Session : Activities of Local Network in Asia
S01
Present situation and challenges of AsiaFlux -Implementation of new programs
Ohtani, Yoshikazu 1
S02
KoFlux progress report
J. Kim, B.-L. Lee, D. Lee, C. Cho, J. Hong, S. Kang, B. Lee, D. W. Lee, J. Lee, J. T. Lee, J. Lim, Y. Son, N. Woo, and J. Yun 2
Oral Session 1: Long-term Flux Observation (I)
O11
CO2 exchange of a tropical peat swamp forest in Central Kalimantan
T. Hirano, T. Harada, H. Segah, S. Limin, T. June, R. Hirata and M. Osaki 3
O12
A comparative study of carbon dioxide exchange between a mature and a regrowth jack pine forests at BERMS (Boreal Ecosystem Research and Monitoring Sites, Canada)
N. Saigusa, H. Iwashita, S. Murayama, A. Barr, K. Higuchi, H. McCaughey, A. Black, S. Yamamoto, and H. Kondo 4
O13
Eddy covariance sensible and latent heat fluxes for three years above a Japanese cypress forest with complex topography
Y. Kosugi, S. Takanashi, M. Katsuyama, H. Tanaka, S. Ohkubo, M. Tani, T. Katayama, M. Yano 5
O14
A novel mass-balance technique for measuring CO2 fluxes in nocturnal drainage flows beneath a forest canopy
Ray Leuning, Steven J Zegelin, Kevin Jones and Robert Clement 6
O15
Introduction to CMA flux network
Bian Lingen and Gao Zhiqiu 7
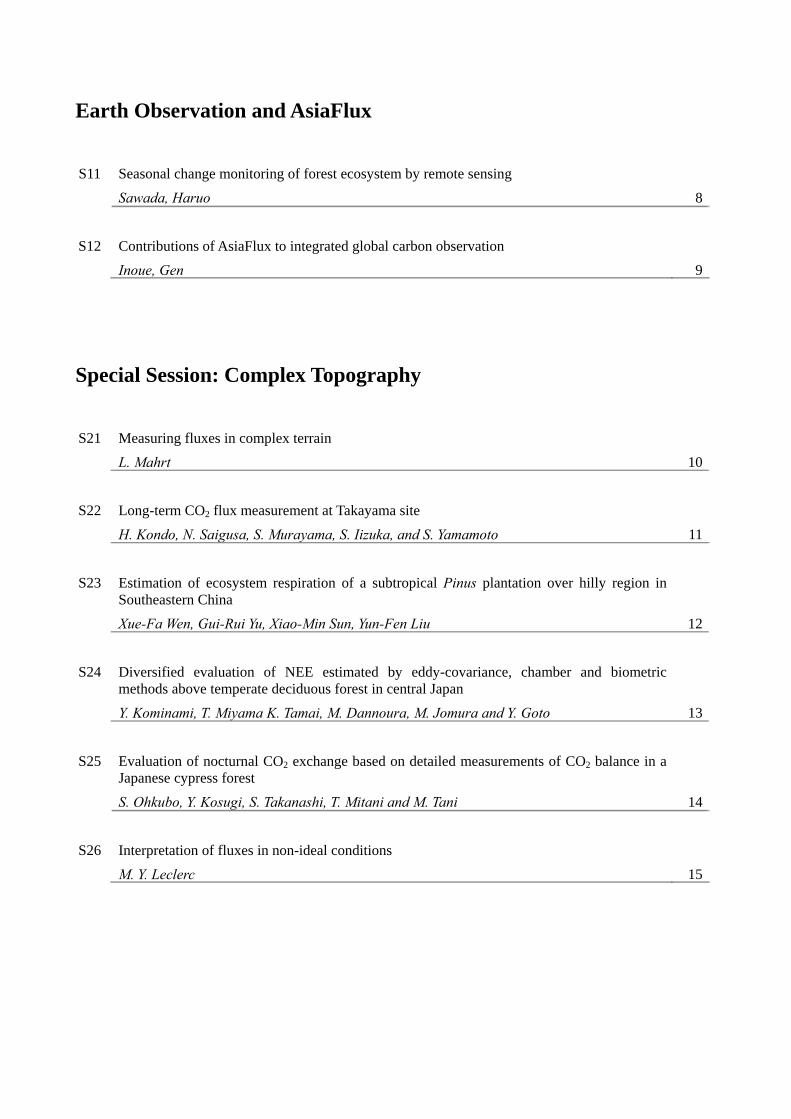
Earth Observation and AsiaFlux
S11
Seasonal change monitoring of forest ecosystem by remote sensing
Sawada, Haruo 8
S12
Contributions of AsiaFlux to integrated global carbon observation
Inoue, Gen 9
Special Session: Complex Topography
S21
Measuring fluxes in complex terrain
L. Mahrt 10
S22
Long-term CO2 flux measurement at Takayama site
H. Kondo, N. Saigusa, S. Murayama, S. Iizuka, and S. Yamamoto 11
S23
Estimation of ecosystem respiration of a subtropical Pinus plantation over hilly region in Southeastern China
Xue-Fa Wen, Gui-Rui Yu, Xiao-Min Sun, Yun-Fen Liu 12
S24
Diversified evaluation of NEE estimated by eddy-covariance, chamber and biometric methods above temperate deciduous forest in central Japan
Y. Kominami, T. Miyama K. Tamai, M. Dannoura, M. Jomura and Y. Goto 13
S25
Evaluation of nocturnal CO2 exchange based on detailed measurements of CO2 balance in a Japanese cypress forest
S. Ohkubo, Y. Kosugi, S. Takanashi, T. Mitani and M. Tani 14
S26
Interpretation of fluxes in non-ideal conditions
M. Y. Leclerc 15
Organization and National Report
S32
Climate change activities in forestry sector: Current and future R&D in Malaysia
Elizabeth Philip and Abdul Rahim Nik 16
S33
Agricultural and forest meteorology research work in Thailand
Chuckree Senthong 17
S34
Micrometeorological research and flux studies in Bangladesh-current status and future prospect
Baten, Abdul Md. 19
S35
Status of forest carbon budget studies in India
Hooda, Neeta 21
Oral Session 2: Biochemical Cycles in Terrestrial Ecosystem
O21
A automatic chamber system for measuring continuous soil respiration based on an open-flow dynamic method
JS. Lee , SU. Suh, NY Chae, J Kim, M Yokozawa, MS Lee 22
O22
Soil respiration in tropical seasonal rain forest and rubber plantation in Xishuangbanna, Yunnan, SW China
Liqing Sha Qiulan Fang 23
O23
Isoprene emission of Quercus spp. and its contribution to the leaf carbon budget
A. Tani, Y. Kawawada, D. Tozaki 24
O24
Using 13C to partition NEE into photosynthesis and respiration of broad-leaved and Korean pine forest
Qingkang Li, Chuanyou Ren, Leiming Zhang, Xuefa Wen, Lupeng Gao, Yuling Fu, Zhengquan Li, Xiaomin Sun, Gui-Rui Yu 25
O25
Carbon isotope composition of Quercus serrata (Japanese oak) and Caprinus laxiflora (white birch) leaves grown in Gwangneung forest
N. Chae, D. Lee and J. Kim 26
O26
Contributions from belowground respiratory fluxes in an irrigated rice paddy determined by carbon isotopic compositions of ecosystem respiration
G. H. Han, H. Yoshikoshi, H. Nagai, T. Yamada, K. Ono, M. Mano, and A. Miyata 27
O27
CO2 sink assessments for long-term monitoring in a cool-temperate deciduous forest, Korea
Seong-Deog Kim, Wonsik Kim, Naishen Liang and Gen Inoue 28
O28
The role of carbon-to-nitrogen ratios for quantifying carbon sequestration in China’s soils
Shaoqiang Wang, Guirui Yu, Estaben Jobaggy, Jiyuan Liu, Panqin Chen, and Qingmei Chen 29
O29
The effects of soil erosion on dynamics of soil organic carbon and CO2 release
Huajun Fang, Guirui Yu, Xueming Yang, Xiaoping Zhang 30
O30
Several considerations on studying carbon balance of global terrestrial ecosystems
Zhou, Guoyi 31
Oral Session 3: Long-term Flux Observation (II)
O31
Carbon dioxide flux of three ecosystems on the Tibetan Plateau
Xin-Quan Zhao Ying-Nian Li Liang Zhao Gui-Rui Yu Yan-Hong Tang Ming-Yuan Du Shi- Xiao Xu Guang-Ming Cao 32
O32
Seasonal variations in energy and CO2 fluxes over a cropland surface in north China
Gao Zhiqiu, Bian Lingen and Guo Jianxia 33
O33
The carbon dioxide exchange over a typical steppe in Inner Mongolia, China
Yan-Fen Wang, Yan-Bin Hao, Xiang-Zhong Huang 34
O34
Response of transpiration and canopy conductance of young coniferous plantation to severe drought in south China
X Song, G.R. Yu, Y.F. Liu, Y.M. Lin 36
O35
Surface energy fluxes of the tidal zone over the Ariake Sea
K. Tanaka 37
O36
Applications of genetic neural network models for gap-filling of CO2 flux data sets
M. Ooba, T. Hirano, R. Hirata, Y. Fujinuma, Y. Kikuchi and T. Machimura 38
Oral Session 4: Modeling and Remote Sensing of Terrestrial Ecosystem
O41
Rectifier effect in an atmospheric model with daily biospheric fluxes
Douglas Chan, Misa Ishizawa, Kaz Higuchi, Shamil Maksyutov, Chiu Wai Yuen1 and Jing Chen 39
O42
Eco-hydrological modeling and remote sensing for monitoring carbon and water fluxes in topographically complex forested landscapes
Sinkyu Kang, Yungil. Kim, Youngjin Kim, Eunsook Kim, Youngryul Ryu, Seung Kim, Joon Kim 40
O43
An evaluation of CO2 flux and latent heat flux in open canopies with a modified soil-plant-atmosphere model
Lee, Young-Hee 41
O44
A comparison between modeled and measured CO2 and water vapor flux in a sub-tropical coniferous forest
F. X. Gu, M. K. Cao, G. R. Yu, X. F. Wen, J. B. Wang 42
O45
Simulation of CO2 flux in three different ecosystem in ChinaFLUX based on artificial neural networks
Honglin He, Guirui Yu, Lengming Zhang, Xiaoming Sun 43
O46
Analysis and interpretation of AsiaFlux data in connection to global carbon cycle modeling
G. A. Alexandrov and Y. Yamagata 44
Poster Session
P01
Leaf phenology model based on seasonal carbon allocation for a forest ecosystems model.
Motomu Toda, Masayuki Yokozawa, Akihiro Sumida, Tsutomu Watanabe, Toshihiko Hara 45
P02
Seasonal variation in leaf properties and ecosystem carbon budget in a cool-temperate deciduous broad-leaf forest: simulation analysis at Takayama site, Japan
A. Ito, H. Muraoka, H. Koizumi, N. Saigusa, S. Murayama, and S. Yamamoto 46
P03
Estimation of plant area index by down-looking heliborne lidar in Japanese larch forest
T. Takeda, H. Oguma, Y. Yone and Y. Fujinuma 47
P04
Development of measurement system for evaluating forest ecosystems: Measurement method of NPP by using airborne laser survey
Y. Yone, H. Oguma and Y. Fujinuma 48
P05
Relationship between the remote sensed vegetation indices and photosynthetic light use efficiency of Japanese larch needles
T. Nakaji, H. Oguma and Y. Fujinuma 49
P06
Analyses of phenology at the Takayama site using a time series of fixed view camera images
T. Maeda, M. Gamo and N. Saigusa 50
P07
Research plan and strategy of the forest observation method using remote sensing in the Fuji-Hokuroku site
H. Oguma and Y. Fujinuma 51
P08
Spatial resolution effect on areal evapotranspiration simulation in Haibei, Tibet Plateau, China
Zhengquan Li, Guirui Yu, Qingkang Li, Yuling Fu, Yingnian Li 52
P09
Response characteristics of portable CO2 sensors
Y. Mizoguchi and Y. Ohtani 53
P10
Relative contribution of roots on soil respiration in a cool-temperate deciduous forest in Korea
Jae-Man Lee, Sung-Min Yu and Seong-Deog Kim 54
P11
Seasonal change in the contribution of root respiration to soil respiration in a temperature Forest in Japan
M. Dannoura, Y. Kominami, K. Tamai, M. Jomura, T. Miyama, Y. Goto, and Y. Kanazawa 55
P12
Continuous measurement of CO2 evolution from a Japanese cedar forest floor using a chamber system with automatic open and closing based on an open-flow method
M-S. Lee, J-S. Lee and H. Koizumi 56
P13
Long-term measurements of soil respiration in an agro forest ecosystem in Korea
Hyeong-Ho Seo, In-Kook Song, Joo-Yong Lee and Seong-Deog Kim 57
P14
Soil CO2 efflux in a temperate forest ecosystem under monsoon climate in Northeast Asia
N. Chae and J. Kime 58
P15
Influence of soil temperature and moisture on spatial variation of CO2 efflux on forest floor in small catchment –in case of Yamashiro experimental forest, May 2004-April 2005-
K. Tamai, Y. Kominami, T. Miyama and Y. Goto 59
P16
Export of dissolved organic carbon from Korean natural forest catchment during storm events
S. J. Kim, I. H. Choi, J. Y. Yoo, and K. H. Kim 60
P17
Fluxes of CH4 and N2O from soil under tropical seasonal rain forest in Xishuangbanna, Yunnan, SW China
YupingYan, Liqing Sha, Min Cao, Zheng Zheng, Jianwei Tang, Yinghong Wang, Yiping Zhang, Rui Wang, Guangren Liu, Yuesi Wang & Yang Sun 61
P18
Heterogeneous nature of soil organic matter as indicated by radiocarbon signatures
J. Koarashi 62
P19
Is carbon stable isotope ratio of heterotrophic respiration invariant? ~What we learned from observational facts~
Y. Takahashi, N. Liang, Y. Fujinuma and G. Inoue 63
P20
Leaf ecophysiological processes for the photosynthetic productivity in a cool-temperate deciduous forest ecosystem at Takayama site.
H. Muraoka and H. Koizumi 64
P21
Seasonal variation in the nocturnal woody-tissue respiration of a mixed broad leaved forest
T. Miyama, Y. Kominami, K. Tamai and Y. Goto 65
P22
Estimating the CO2 flux from coarse woody debris in a temperate deciduous broad-leaved forest in Japan
M. Jomura, Y. Kominami, M. Dannoura, K. Tamai, T. Miyama, Y. Goto, and Y. Kanazawa 66
P23
Biometric based estimates of net ecosystem production in a cool-temperate deciduous forest beneath a flux tower
T. Ohtsuka1, W. Mo2 and H. Koizumi 67
P24
Inter-annual variability of net primary production and soil CO2 efflux in a cool temperate red pine forest at northern foot of Mt. Fuji
K. Sugita, T. Yokosawa and T. Ohtsuka 68
P25
Carbon balance of larch forest ecosystems
Naishen Liang, Yasumi Fujinuma, and Gen Inoue 69
P26
Leaf photosynthesis and respiration of a deciduous tree (Konara oak) in the leafing stage
Y. Yasuda, Y. Ohtani, Y. Mizoguchi, H. Iwata and T. Nakano 70
P27
Instrumentation and data quality assessment at Daegwallyeong CO2 flux measurement site (DFMS) in Korea
J. Cho, D. Komori, S. D. Kim and W. Kim 71
P28
Quality check of flux data using a multilayered canopy model
T. Watanabe, Y. Nakai, K. Kitamura, H. Utsugi, H. Tobita and S. Ishizuka 72
P29
Examination of the high frequency correction theories to the closed-path CO2 flux measured over a coniferous forest in Kyushu Island, Japan
T. Shimizu 73
P30
Effect of local temperature fluxes in the vicinity of an open-path gas analyzer on the WPL correction
K. Ono and A. Miyata 74
P31
Comparison of eddy CO2 fluxes measured with open-path and closed-path systems
R. Hirata, T. Hirano, N. Saigusa, K. Takagi, Y. Yone, N. Liang, Y. Fujinuma, and K. Inukai 75
P32
Data gap filling for annual and monthly net ecosystem carbon dioxide exchange using genetic algorithm
T. Machimura, M. Ooba, T. Oda, Y. Kikuchi, T. Okabe, L. Lopez, G. Iwahana and Y. Kobayashi 76
P33
Diurnal and seasonal variations in CO2 exchange over a Gmelin larch forest on Continuous permafrost of the central Siberia
Y. Nakai, Y. Matsuura, T. Kajimoto, A.P. Abaimov, and S. Yamamoto 77
P34
Transpiration, water potential and stomatal conductance of Larix cajanderi under non-limiting soil moisture, central Yakutia, eastern Siberia
Larry Lopez 78
P37
Ecosystem CO2 flux over two years for a 200-year-old Chinese broad-leaved Korean pine mixed forest
J. ZHANG, S. HAN, G. YU, D. GUAN and X. SUN 79
P38
CO2 exchange of a larch forest ecosystem in northeast China
Huimin Wang, Nobuko Saigusa, Yuangang Zu, Wenjie Wang, Susumu Yamamoto and Hiroaki Kondo 80
P39
Seasonal variation in CO2 and H2O fluxes in a young larch plantation in northern Japan
K. Takagi, M. Nomura, K. Fukuzawa, H. Hojyo, S. Sugata, H. Shibata, K. Sasa, T. Koike, Y.Akibayashi, Y. Fujinuma, N. Liang, K. Inukai, and M. Maebayashi 81
P40
Seasonal and inter-annual changes in carbon balance for a broadleaved deciduous forest in Sapporo, northern Japan
K. Kitamura, Y. Nakai, S. Suzuki, K. Yamanoi, Y. Ohtani and Y. Yasuda 82
P41
A yearlong observation of ecosystem carbon cycle in Japanese red pine forest
Y. Kikuchi, T. Machimura, M. Ooba, S. Aoki, T. Okabe, Y. Tanaka, K. Yamase, Y. Aoyama and S. Okada 83
P42
Long-term observation of micrometeorological NEP in Fujiyoshida site
Y. Ohtani, Y. Mizoguchi, T. Watanabe, Y. Yasuda and H. Iwata 84
P43
Annual variation in carbon flux and relationships between carbon flux and impact factors in a tropical seasonal rain forest
Zhang Yiping Sha Liqing Yu Guirui Song Qinghai Tang Jianwei Yang Xiaodong Wang Yuesi Zheng Zheng Zhao Shuangju Yang Zhen 85
P44
Carbon flux observation in the tropical seasonal forests and tropical rain forest
M.Gamo, S.Panuthai, T.Maeda, T.Toma, A.Ishida, M.Hayashi, Warsudi, R.Dianna, S.Diloksumpun, L.Phanumard, D.Staporn, M.Ishizuka, N.Saigusa and H.Kondo 86
P45
Effects of disturbances and the ENSO drought on the micrometeorology and radiation characteristics of a tropical peat swamp forest
Tsuyoshi Harada, Takashi Hirano, Hendrik Segah, Suwido Limin, Kitso Kushin, Mitsuru Osaki 87
P46
Carbon dioxide exchange monitoring and research programs at the Hungarian tall tower site
Z. Barcza, L. Haszpra, D. Hidy, Zs. Iványi, A. Kern, H. Kondo, N. Saigusa, T. Szabó, K. Tarczay and S. Yamamoto 88
P47
Fluxes of carbon dioxide, water vapor and energy over a temperate grassland in central Japan from autumn to early summer
S. Matsuura, A. Miyata, M. Mano, M. Oikawa, R. Hatano, M. Hojito, A. Mori, K. Kohyama and H. Sasaki 89
P48
Exchange of carbon dioxide and water vapor between grasslands and the atmosphere at four hay meadow sites in Japan from autumn to spring
A. Miyata, M. Mano, S. Matsuura, M. Oikawa, R. Hatano, A. Hayakawa, M. Hojito, N. Katayanagi O. Kawamura, K. Kohyama, Y. Kouda, M. Niimi, T. Saigusa and M. Shimizu 90
P49
Measurement and simulation on carbon and water flux of the cropland ecosystem in north China plain
Q.F. Wang and G.R. Yu 91
P50
CO2 flux observed over a rice paddy field by the eddy covariance method and its quality check
T. Takimoto K. Inobe T. Iwata S. Yamamoto and T. Miura 92
P51
Bowen ratio measurements of energy budget components over various ecosystems in Mymensingh, Bangladesh
R. Khatun, M. A. Farukh, A. Miyata and Md. A. Baten 93
P52
Sensible heat, latent heat, and CO2 fluxes on the loess plateau in China during the season from spring to summer in 2005
Atsuhiro Takahashi, Tetsuya Hiyama, Atsushi Higuchi, Wei Li, Masanori Nishikawa, Shaungjiang Li, Wenzhao Liu, and Yoshihiro Fukushima 94
P53
CO2 flux measurement over winter barley and soybean fields growing on the rice based double cropping paddies in northern Kyushu, Japan
H. Yoshikoshi, A. Maruyama and K. Ohba 95
P54
Air temperature measurement errors in a naturally ventilated multi-plate radiation shield
Reina Nakamura and L. Mahrt 96

Oral Session
PRESENT SITUATION AND CHALLENGES OF ASIAFLUX - IMPLEMENTATION OF NEW PROGRAMS -
Y. Ohtani1, J. Kim2, A. Miyata3, N. Saigusa4, Y. Fujinuma5, S. Yamamoto6 and G. Inoue5
1Forestry and Forest Products Research Institute, Tsukuba, Japan 2Yonsei University, Seoul, Korea
3National Institute for Agro-Environmental Sciences, Tsukuba, Japan 4National Institute of Advanced Industrial Science and Technology, Tsukuba, Japan
5National Institute for Environmental Studies, Tsukuba, Japan 6Okayama University, Okayama, Japan
Since the establishment of AsiaFlux in 2000, we have hosted three international workshops for the advancement of a flux measurement network in Asia. We have also published a booklet on flux observations and analyses as well as 14 volumes of the AsiaFlux Newsletter to promote the exchange of information on terrestrial carbon balance studies mainly in East and South-East Asia. AsiaFlux is now in the process of developing new programs with financial support from two distinct projects: “Initiation of the next-generation AsiaFlux” by the Japanese Ministry of Education, Culture, Sports, Science and Technology (MEXT) and “Standardization and Systematization of Carbon-Budget Observation in Asian Terrestrial Ecosystems Based on AsiaFlux Framework” by the Asia-Pacific Network for Global Change Research (APN).
There are three main objectives for the MEXT project: 1) to offer training courses for flux measurements and analyses to scientists in Asia, 2) to develop a standardized portable flux observation system and flux analysis techniques for inter-comparing flux measurements among the AsiaFlux sites, and 3) to establish a structure for sharing and exchanging data within and outside the Asiaflux community. The aim of the training courses is to help scientists maintain their local flux observational sites and effectively analyze data. Use of the portable flux observational system and development of standardized analysis techniques will improve data accuracy. Collaborative flux observations will also be made in one or two terrestrial ecosystems in Asia within the MEXT project framework. The financial support from the APN project will be spent to host workshops and to prepare manuals for the training courses offered with the funding from the MEXT project.
Improved organization of AsiaFlux is considered important to effectively implement the above-mentioned programs. For this purpose, we are planning to establish workgroups within the AsiaFlux organization. With the support from the steering and executive committees, each workgroup takes an active part for implementing these new programs. We believe the efforts made through the MEXT and APN projects will enhance research collaboration among Asian nations and reinforce the existing framework for research cooperation among AsiaFlux, KoFlux and the Chinese flux community, with the collaboration from OzFlux. Revision of the AsiaFlux Organization (tentative) AsiaFlux Steering Committee AsiaFlux Executive Committee AsiaFlux Secretariat AsiaFlux Workgroups (WG) and Sub-Workgroups (SWG) (New)
AsiaFlux General WG AsiaFlux Network Management SWG (e.g. Updating AsiaFlux directory and web page) AsiaFlux Editorial SWG (e.g. AsiaFlux Newsletter) Workshop Management SWG (e.g. AsiaFlux Workshop)
Measurement and Data Policy WG Measurement Support and Standardization SWG (e.g. Flux measurement and analysis methodology, site
planning, and inter-site comparison) Database and Data Policy SWG (e.g. AsiaFlux data policy and database arrangement) Short Training Courses SWG (e.g. AsiaFlux training courses for flux measurement and analysis)
S01
1- 1 -
KOFLUX PROGRESS REPORT
J. Kim1, B.-L. Lee2, D. Lee1, C. Cho3, J. Hong1, S. Kang4, B. Lee5, D. W. Lee6, J. Lee7, J. T. Lee8,
J. Lim9, Y. Son10, N. Woo1, and J. Yun11
1Yonsei University, Seoul, Korea
2National Center for AgroMeteorology, Korea Meteorological Administration, Suwon, Korea 3Korea Meteorological Research Institute, Seoul, Korea
4Kangwon National University, Kangwon, Korea 5Catholic University of Daegu,Daegu, Korea
6Seoul National University, Seoul, Korea 7Kunkuk University, Seoul, Korea
8National Institute of Agricultural Science & Technology, Suwon, Korea 9National Institute for Forest Science, Seoul, Korea
10Korea University, Seoul, Korea 11Kyunghee University, Suwon, Korea
The KoFlux Program is dedicated to understanding the fluxes of energy and matter, net ecosystem
production, and water resource management in key ecosystems of Monsoon Asia. KoFlux was launched in 2001 by networking individual research sites and the limited available resources in Korea to support AsiaFlux, which builds upon the scientific initiatives of regional networks such as JapanNet, ChinaFlux, KoFlux to provide a mechanism to consolidate and leverage their scientific activities. In this way, the value of data from each site is greatly augmented and new scientific questions are further explored and answered.
During Phase I (from 2001 to 2004), the KoFlux team developed a global network (www.koflux.org), providing that KoFlux data could be collected and shared anywhere. Three of the eight flux sites have been registered as reference sites for the GEWEX’s inter project, Coordinated Enhanced Observing Period (CEOP, ) and the data have been submitted to the international community. During the Phase II (2004-2007), the initial eight sites have been reduced to four sites (one forest and two agricultural sites in Korean Peninsula, one prairie site in Tibet, China) due to the limited funding and human resources. Most forest and agricultural ecosystems in Korea are heterogeneous, and the application of conventional eddy covariance technique has been a difficult challenge for data collection, processing and analysis. The second phase of KoFlux (“Carbo/HydroKorea”) focuses on linking flux footprint, ecohydrological models and satellite images to bridge the gaps between different scales of carbon/water exchange processes in a complex landscape.
A major difference between 1st phase of KoFlux research and its successor is the establishment of the supersite where inter-disciplinary, coordinated research efforts are conducted. The Gwangneung flux site, where a flux tower has been operated since the beginning of KoFlux and ecological and hydrological information have been monitored for more than 10 years, is selected as a representative landscape of the country and becomes the center of the inter-disciplinary researches. For this, the Gwangneung supersite is re-defined as a 7 x 7 km (MODIS) unit that includes two flux towers. Within this MODIS unit, a 3 x 3 km intensive monitoring unit is designated. The unit is further subdivided into nine 1 x 1 km basic units, comparable to the scale of MODIS grid, that become the basic component of intensive field monitoring, modeling and image analysis studies. In this progress report, we present the current status of the ongoing flux sites including some preliminary results.
Acknowledgments: KoFlux is supported by the Eco-Technopia 21 Project (Ministry of Environment) and by a grant (code:1-8-2) from Sustainable Water Resources Research Center of 21st Century Frontier Research Program (Ministries of Science and Technology & Construction and Transportation of Korea).
S02
2- 2 -
CO2 EXCHANGE OF A TROPICAL PEAT SWAMP FOREST IN CENTRAL KALIMANTAN
T. Hirano1, T. Harada1, H. Segah1, S. Limin2, T. June3, R. Hirata4 and M. Osaki1
1Graduate School of Agriculture, Hokkaido University, Sapporo, Japan 2University of Palangkaraya, Palangkaraya, Indonesia
3BIOTROP, Bogor, Indonesia 4National Institute for Environmental Studies, Tsukuba, Japan
Peatland existing in the tropics has accumulated a large amount of carbon as organic matter. Indonesia
contains the largest area of tropical petland, and the petaland usually coexists with tropical peat swamp forests. Recently, however, deforestation and drainage are in progress on a large scale owing to a growing demand for timber and farmlands. In addition, the ENSO drought and its consequent large-scale fires are accelerating the devastation of the peatland. The devastation enhances the decomposition of organic matter stored in peatland, and consequently increases carbon release to the atmosphere as CO2. This suggests that tropical peatland will be a major CO2 source in the near future. To evaluate the CO2 balance of tropical peatland, we have measured CO2 flux above a tropical peat swamp forest remaining in Area B of the Mega Rice Project near Palangkaraya, Central Kalimantan, Indonesia since November 2001.
The forest is located on flat peatland between a river and channel. Water table in the forest was zonally reduced near the channel. A tower of 50 m height was constructed about 300 m inside from the northeast corner of the forest (2º 20’ 41.6” S, 114º 2’ 11.3” E). Dominant tree species of the forest are Combretocarpus rotundatus, Cratoxylum arborescens, Buchanania sessifolia and Tetrameristra glabra and rich shrubs grow in the trunk space. The height of the forest canopy is about 26 m. Predominant wind direction was the south (SE-SW). Fetch was longer than 1 km for the southern wind. During the dry season of 2002, between mid-August and late October, peatland fires occurred in large areas around Palangkaraya because of the ENSO drought, whereas the forest did not burn. CO2 and energy fluxes have been measured at 41.7 m by the eddy covariance technique with a sonic anemometer-thermometer (CSAT3, CSI) and an open-path CO2 analyzer (LI7500, Licor) facing the south. Sensor signals were recorded with a data logger (8421, HIOKI) at 10 Hz. In addition, CO2 concentrations have been measured at six heights below the flux measuring height with a closed-path CO2 analyzer (LI820, Licor) to calculate CO2 storage flux (Fs). Hourly mean fluxes were calculated from the data according to the following procedures: 1) removal of noise spikes, 2) planar fit rotation, 3) covariance calculation using block average, 4) WPL correction. From CO2 flux (Fc) and Fs, net ecosystem CO2 exchange (NEE) was calculated (NEE = Fc + Fs). Data quality was checked by wind direction and steady state tests. In addition, a friction velocity (u*) threshold of 0.08 m s-1 was applied for nighttime. Gaps of missing data were filled using empirical models; ecosystem respiration (RE) or nighttime NEE was estimated from soil moisture, and gross primary production (GPP) was estimated form photosynthetic photon flux density (PPFD).
In this area, the dry season began in May and lasted until October, judging from monthly precipitation of 100 mm. CO2 fluxes showed seasonal variations. Typically GPP continued to become more negative from the mid rainy season until the mid dry season, and rapidly became more positive in the late dry season. On the other hand, RE continued to increase through the dry season. As a result, NEE was smallest in the mid dry season at around zero and largest in the late dry season. In total, GPP and RE were significantly more negative and positive, respectively, in the dry season than the rainy season. However, NEE showed no significant difference between two seasons. These seasonal variations of CO2 fluxes were caused by those of PPFD, vapor pressure deficit (VPD) and water table. During the dry season, high PPFD enhanced GPP until July or August, whereas high VPD depressed it in September and October. Low water table, which reflected on low soil moisture, enhanced RE through peat decomposition because the aerobic layer of peat increased; the negative relationship between RE and soil moisture is a distinctive feature at peatland.
The annual sums of NEE, RE and GPP were 721, 3580 and -2859 in 2002, 527, 3686 and -3159 in 2003, and 356, 3583 and -3227 gC m-2 y-1 in 2004, respectively. This forest worked as a net source of CO2 at an intensity of 535±183 gC m-2 y-1 for the atmosphere from 2002 through 2004. The source intensity was largest in 2002, an ENSO year; this was probably caused by drought and low PPFD, which was caused by dense smoke emitted through large-scale fires.
O11
3- 3 -
A COMPARATIVE STUDY OF CARBON DIOXIDE EXCHANGE BETWEEN A MATURE AND A REGROWTH JACK PINE FORESTS AT BERMS (BOREAL
ECOSYSTEM RESEARCH AND MONITORING SITES, CANADA)
N. Saigusa1, H. Iwashita1,2, S. Murayama1, A. Barr3, K. Higuchi4, H. McCaughey5, A. Black6, S. Yamamoto7, and H. Kondo1
1National Institute of Advanced Industrial Science and Technology, Tsukuba, Japan 2Incorporated Non Profit Organization, The Forum for Forest Creating, Tokyo, Japan
3 Climate Research Branch, Meteorological Service of Canada, Saskatoon, Canada 4 Air Quality Research Branch, Meteorological Service of Canada, Toronto, Canada
5 Department of Geography, Queen’s University, Kingston, Canada K7L 3N6. 6 Faculty of Agricultural Sciences, University of British Columbia, Vancouver, Canada
7 Graduate School of Environmental Science, Okayama University, Okayama, Japan
The relationship between soil moisture and ecosystem-level carbon budget was investigated for BERMS (Boreal Ecosystem Research and Monitoring Sites, http://berms.ccrp.ec.gc.ca/) sites in Saskatchewan, Canada, using eddy covariance flux measurements obtained during 2001, 2002 and 2003. The study sites were located in a mature jack pine forest (Pinus banksiana Lamb.) with tree age of approximately 80 years, and in a young jack pine stand characterized by a sparse low canopy. Jack pine is an evergreen coniferous species that is found on well-drained and nutrient-poor soils. It is a pioneer species that grows quickly after a natural disturbance (e.g. fire or harvesting) and thus plays an important role in ecosystem regeneration after such disturbances.
The mature jack pine forest site (referred to as the old jack pine "OJP" site, location 53o 55’N, 104o 41’W) was established in 1993 in the southern portion of the Canadian boreal forest as part of the Boreal Ecosystem-Atmosphere Study (BOREAS) program. Under the BERMS program, carbon dioxide, water vapor, and sensible heat flux measurements have continued since 1999, using three-dimensional sonic anemometer-thermometer and a closed-path infrared gas analyzer on a scaffold tower at 28 m above ground.
The adjacent young jack pine site (referred to as harvested jack pine site, "HJP94", 53o 54’N, 104o 39’W) was established in 2001 at approximately 2 km southeast of the OJP site. A mature jack pine forest was harvested (clear-cut) in 1994 over an area of approximately 30 ha, and young trees from the ages of one year to ten years have been regenerating naturally. Fluxes were measured on a tower at 5 m above the ground, using a three-dimensional sonic anemometer-thermometer and a closed-path infrared gas analyzer.
The present study focuses on the relationship of the carbon budget components with soil moisture and various other environmental factors at the OJP and HJP94 sites. Focuses are also on the effect of seasonal and inter-annual variations in climate on carbon and water budgets at the sites with different age distributions, to increase our understanding of a transition of carbon cycling with ecosystem regeneration.
Net ecosystem CO2 exchange (NEE), total ecosystem respiration (RE) and gross primary production (GPP) were estimated from 2001 to 2003 at the OJP and HJP94 sites. We conclude that the nighttime NEE at both sites had a positive correlation with soil volumetric water content (VWC), as well as with soil temperature, in warm growing seasons but was almost independent of VWC in cold dormant seasons. The positive correlation with VWC was more apparent at HJP94 than at OJP.
The high sensitivity of GPP and RE to VWC variations was more obvious at HJP94, probably related to the severe water stress on the photosynthetic and respiratory activities caused by poor water holding capacity of the sandy soil layer and the shallow root system of the young trees, many of which were less than ten years old. At HJP94, the relatively large RE, which sometimes exceeded GPP, was caused by high respiration rate and low LAI. The decomposition of remaining dead plant mass, either buried or on the ground surface, likely contributed to the large RE at the site. Since VWC displayed a strong seasonal variation in a shallow surface soil layer, it could be an important seasonal environmental factor governing photosynthetic and respiratory activities at sparse young forest stands like HJP94.
O12
4- 4 -
EDDY COVARIANCE SENSIBLE AND LATENT HEAT FLUXES FOR THREE YEARS ABOVE A JAPANESE CYPRESS FOREST WITH COMPLEX TOPOGRAPHY
Y. Kosugi1, S. Takanashi1, M. Katsuyama1, H. Tanaka2, S. Ohkubo1, M. Tani1, T. Katayama3, M. Yano4
1 Graduate School of Agriculture, Kyoto University, Kyoto 606-8502, Japan 2 Hydrospheric Atmospheric Research Center, Nagoya University, Nagoya 464-8601, Japan
3 NTT Communications Co., Tokyo, Japan 4 UFJ Institute Ltd. 1-11-7, Shimbashi, Minato-Ku, Tokyo 105-8631, Japan
Typical plantation forests in the mountains of Japan are evergreen coniferous forests. Evapotranspiration
from these forests greatly influences hydrological and micrometeorological processes and also the environmental functions of the forests. Annual evapotranspiration is a component of the water cycle and can be estimated using the water balance method to elucidate the relationship with annual precipitation. However, an approach using annual hydrological data cannot rule out controlling factors or their influences on the characteristics of evapotranspiration. As a result, differences based on forest type cannot be studied in depth. In contrast, evaluation of evapotranspiration using eddy covariance heat fluxes coupled with micrometeorological data allows analysis of the factors that control evapotranspiration. Analysis of dry-canopy transpiration measured with the eddy covariance method will yield information on stomatal behavior and influence on heat, water vapor, and carbon dioxide fluxes. Understanding how dry canopy transpiration interacts with photosynthesis and is influenced by stomatal regulation is critical for understanding gas-exchange processes. Diurnal, seasonal, and inter-annual fluctuations in evapotranspiration and bulk parameters, which include surface conductance (Monteith, 1973) and decoupling factor (McNaughton and Jarvis, 1983), can and should be evaluated for various vegetation types using long term flux datasets.
There is a possibility that surface conductance is underestimated in the eddy covariance method because of an energy closure problem (the imbalance problem), i.e., sensible and latent heat fluxes are underestimated. Accurately measuring energy fluxes for the eddy covariance method may be difficult, especially for forest sites with complex topography. The imbalance problem has been noted in many sites. Whether eddy covariance data provide accurate information so that heat fluxes and evapotranspiration can be evaluated is a question that must be answered for individual sites.
In this study, we analyzed sensible and latent heat fluxes for 3 years (2001 to 2003) over a Japanese cypress forest with complex topography in central Japan. The observation site (Kiryu Experimental Watershed) was established in 1967 to study hydrological water circulation and to evaluate the roles of trees and soil in the forest. It represents one of the longest continuous research programs in Japan and has 33 years’ reliable hydrological datasets from 1972. We also compared the evapotranspiration estimated with eddy covariance method with those estimated with long-term and short-term water budget methods for the validation.
A detailed assessment of the energy budget closure was performed to reveal the diagnosis of energy imbalance. The assessment of the energy budget closure coupling with the comparison between eddy covariance and water budget methods revealed that eddy covariance method underestimated the evapotranspiration even after careful data quality check. The underestimation during and after rain with closed path method was especially critical. Our suggestion for the practical solution is to apply the correction to the eddy covariance sensible and latent heat fluxes to close the energy budget. Comparison of eddy covariance method with long-term and short-term water budget methods also suggested the necessity of some corrections.
The observations described the magnitude and seasonal and inter-annual variations in sensible and latent heat fluxes, evapotranspiration and the parameters describing bulk canopy characteristics. This forest was characterized by relatively small values of surface conductance and decoupling factor compared to other forests. However, several other coniferous forests in the literatures showed smaller values. Surface conductance, and thus stomatal regulation, is important in controlling dry-canopy transpiration in this forest. Both amplitude and characteristics of seasonal fluctuation of evapotranspiration and surface conductance showed no significant inter-annual differences in spite of considerable fluctuation in precipitation and thus soil moisture condition.
O13
5- 5 -
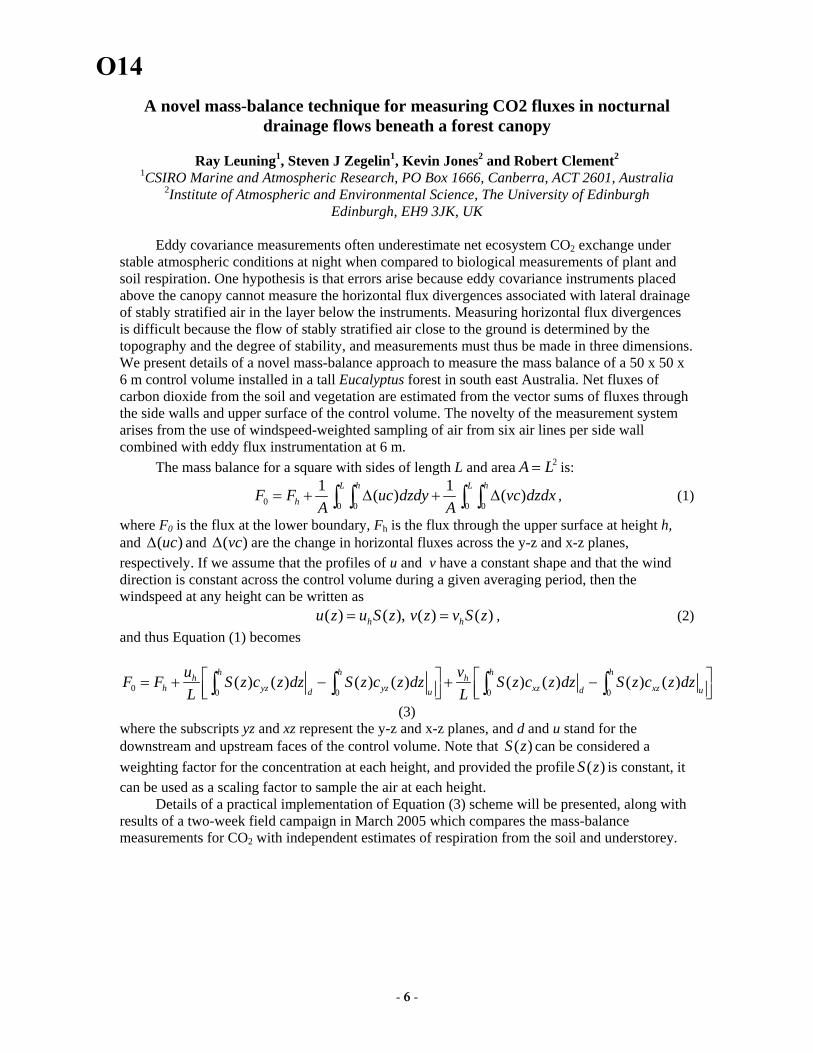
A novel mass-balance technique for measuring CO2 fluxes in nocturnal drainage flows beneath a forest canopy
Ray Leuning1, Steven J Zegelin1, Kevin Jones2 and Robert Clement2
1CSIRO Marine and Atmospheric Research, PO Box 1666, Canberra, ACT 2601, Australia 2Institute of Atmospheric and Environmental Science, The University of Edinburgh
Edinburgh, EH9 3JK, UK
Eddy covariance measurements often underestimate net ecosystem CO2 exchange under stable atmospheric conditions at night when compared to biological measurements of plant and soil respiration. One hypothesis is that errors arise because eddy covariance instruments placed above the canopy cannot measure the horizontal flux divergences associated with lateral drainage of stably stratified air in the layer below the instruments. Measuring horizontal flux divergences is difficult because the flow of stably stratified air close to the ground is determined by the topography and the degree of stability, and measurements must thus be made in three dimensions. We present details of a novel mass-balance approach to measure the mass balance of a 50 x 50 x 6 m control volume installed in a tall Eucalyptus forest in south east Australia. Net fluxes of carbon dioxide from the soil and vegetation are estimated from the vector sums of fluxes through the side walls and upper surface of the control volume. The novelty of the measurement system arises from the use of windspeed-weighted sampling of air from six air lines per side wall combined with eddy flux instrumentation at 6 m.
The mass balance for a square with sides of length L and area 2A L= is:
0 0 0 0 0
1 1( ) ( )L h L h
hF F uc dzdy vc dzdxA A
= + ∆ + ∆∫ ∫ ∫ ∫ , (1)
where F0 is the flux at the lower boundary, Fh is the flux through the upper surface at height h, and and are the change in horizontal fluxes across the y-z and x-z planes, respectively. If we assume that the profiles of u and v have a constant shape and that the wind direction is constant across the control volume during a given averaging period, then the windspeed at any height can be written as
( )uc∆ ( )vc∆
( ) ( ), ( ) ( )hu z u S z v z v S zh= = , (2) and thus Equation (1) becomes
0 0 0 0 0( ) ( ) ( ) ( ) ( ) ( ) ( ) ( )
h h h hh hh yz yz xz xzd ud u
u vF F S z c z dz S z c z dz S z c z dz S z c z dzL L⎡ ⎤ ⎡= + − + −⎢ ⎥ ⎢⎣ ⎦ ⎣∫ ∫ ∫ ∫ ⎤
⎥⎦ (3) where the subscripts yz and xz represent the y-z and x-z planes, and d and u stand for the downstream and upstream faces of the control volume. Note that can be considered a weighting factor for the concentration at each height, and provided the profile is constant, it can be used as a scaling factor to sample the air at each height.
( )S z( )S z
Details of a practical implementation of Equation (3) scheme will be presented, along with results of a two-week field campaign in March 2005 which compares the mass-balance measurements for CO2 with independent estimates of respiration from the soil and understorey.
O14
6- 6 -
Introduction to CMA Flux Network
Bian Lingen and Gao Zhiqiu Chinese Academy of Meteorological Science, CMA, Beijing, 100081, China
Background: The secular increase occurring in carbon dioxide concentration may help stimulation of photosynthesis, crop growth and water use efficiency. However, its potential adverse effects include global warming, perturbations of regional precipitation and soil moisture patterns. China Meteorology Administration (hereinafter, referred to as CMA) needs to investigate the global carbon and water cycle with an emphasis on assessments of surface fluxes within China landscape for better understanding how surface fluxes respond to the change in climate and in ecology. Knowledge about the surface flux is also critical for CMA to develop societal policies on future energy use. In a word, CMA was aware that establishing of flux network would significantly improve our operational work, and therefore is our responsibility too. To quantify the seasonal variations of carbon dioxide and water vapor fluxes, the Fluxnet (AsiaFlux, AmeriFlux, EuroFlux and other) has been operating since 1990s. CMA would like to deeply involve into this network for sharing the benefit within the Fluxnet and for contributing our energy. What is being done? Recognizing a need for long term measurements, we installed three flux towers in April of 2004. They were equipped with same instruments (CSAT3, and LiCor 7500) for the fast response measurements and have been operating well since beginning. The synchronous slow response measurements (i.e., gradient air temperature, humidity, and wind speed; soil temperature and liquid water content) have been also conducting. The surface types mainly are croplands. The time series of data are ready for analysis. Meanwhile, two dust-storm towers were installed in the suburb of Beijing in north China for monitoring dust-storm, where the fluctuating wind speed and fluctuating air temperature have been collecting since the February 2005. The surfaces are sparse grasslands. In addition, four flux towers are under construction for capturing heat and water fluxes over urban and desert surfaces respectively. In a work, the CMA flux network is growing well now and will be developed further. What is CMA Flux Data Policy? We are designing a website for releasing data to colleagues within Fluxnet. This website will provide us a bridge of our cooperation. What are Future Plans? We plan to convene a workshop on 'Strategies for Long Term Studies of CO2 Heat and Water Vapor Fluxes over Terrestrial Ecosystem' at the end of 2005 in Beijing. Similar to that held during March, 1995 in LaThuile, Italy, the explicit goals of the workshop is to assess the state-of-art of making long term flux measurements and to obtain advice and consensus on the direction of future long-term flux research. How Can Get More Information? The CMA Flux program is led by Prof. Bian Lingen at Chinese Academy of Meteorological Sciences, CMA. Information about CMA Flux may be obtained via the upcoming website or via emailing Prof. Gao Zhiqiu at [email protected].
O15
7- 7 -
SEASONAL CHANGE MONITORING OF FOREST ECOSYSTEM BY REMOTE SENSING
H. Sawada
Forestry and Forest Products Research Institute, Tsukuba, Japan
Main characteristics of natural disturbances and human-induced stressors affecting on forest ecosystems are
considered as: frequency (number of occurrences per unit time), extent (area over which the event occurs), intensity (degree of effect), and duration (length of stressor event). These four aspects are summarized in "spatial" and "temporal" resolutions in remote sensing parameters. Therefore, these two aspects are essential for appropriate monitoring designs. Although remote sensing data give us various information of forest ecosystem, appropriate "indicators" are also required for monitoring forest ecosystem.
Because natural and human-induced stressors affect forest area for a long time, "prediction" models based on
previous monitoring data are important for evaluating the apparent phenomena. However, "appropriateness" of monitoring system using remote sensing is not yet clear and the conceptual structure on monitoring design is required worldwide.
Therefore, monitoring and modeling of seasonal change is an essential task for environmental studies in
forested area and appropriate monitoring design should be adopted. Remote sensing technology is considered one of the useful and important tools for monitoring various forests in the world. Especially, remote sensing data with high frequent observation capability play important role for monitoring and modeling of seasonal changes.
This presentation shows some examples of monitoring designs and the products of “indicators”, which were
created from seasonal change models applied to satellite remote sensing data, such as NOAA-AVHRR, SPOT-VGT, and MODIS.
S11
8- 8 -
CONTRIBUTIONS OF ASIAFLUX TO INTEGRTED GLOBAL CARBON OBSERVATION
G.Inoue
National Institute for Environmental Studies, Tsukuba, Japan
The ten-year implementation plan of the Global Earth Observation System of Systems (GEOSS) endorsed by Earth Observation Summit proposes to develop a plan to ensure comprehensive and sustained earth observations. The carbon observation system is one of the most important components of GEOSS. The carbon group of Integrated Global Observation System (IGOS) has proposed a strategy to realize a coordinated system of Integrated Global Carbon Cycle Observations (IGCO). The two main objectives described in it are; (1) To provide the long-term observations required to improve understanding of the present state and future
behavior of the global carbon cycle, particularly the factors that control the global atmospheric CO2 level. (2) To monitor and assess the effectiveness of carbon sequestration and/or emission reduction activities on
global atmospheric CO2 levels, including attribution of sources and sinks by region and sector. The requirements to implement the above observations are; (a) Consolidating data requirements, designing network configurations, and developing advanced algorithms
for assimilating carbon observations, which will be the core of a future, sustained operational system by 2015,
(b) Developing cost-effective, low maintenance, in situ sensors for atmospheric CO2, ocean dissolved pCO2, and terrestrial ecosystem fluxes,
(c) Developing and implementing technologies for remote sensing of CO2 from space, (d) Improving estimates of biomass based on national inventories and/or remote sensing observations, (e) Developing, operational carbon cycle models, validated through rigorous tests and driven by systematic
observations that can deliver routine diagnostics of the state of the carbon cycle, and (f) Enhancing data harmonization and intercomparability, archiving, and distribution to support model
development and implementation AsiaFlux will play an important role to understand the present state of carbon cycle in terrestrial ecosystems (c,d) in Asia, and the long-term and systematic flux observation will provide us the better prediction of future carbon cycle in different climate from now. There are several on going or under planning activities in Asia related to carbon. The in situ atmospheric CO2 observation is limited to Japan, China and Korea, but the observation on the passenger aircrafts of Japan Airline is starting very soon, and the South-east Asia area is expected to be covered. A project of in situ observation on cargo-ships in South-east Asia is stating from 2006. These projects just fit to the proposal of (b) in the sense of cost-effective and low maintenance. The satellite observation project, Greenhouse gases Observing SATellite (GOSAT) is under progress targeting to be launched in 2008 (c). The Asia Integrated Model (AIM) group is improving the national inventory of anthropogenic emissionmainly, but it will be extended to cover terrestrial ecosystems (d).
These activities are desirable to be integrated and a complimentary observation system will be established in Asia.
S12
9- 9 -
MEASURING FLUXES IN COMPLEX TERRAIN
L. Mahrt
Oregon State University, Corvallis, OR, USA
Difficulties with eddy-correlation measurements in complex terrain are surveyed with examplesfrom field sites in central Oregon, USA. The strategy for using fluxes to estimate the NetEcosystem Exchange is briefly reviewed. In complex terrain, estimation of fluxes and NEE iscomplicated by height-dependence of the wind and flux fields within the canopy due to drainageand upslope flows and advection by such flows. Location bias and systematic errors inquantification of horizontal advection is also discussed. Estimation of vertical advection by suchflows is problematic due to apparent inability of sonic anemometers to measure mean verticalmotion. Mean vertical motions estimated from measured horizontal divergence and masscontinuity yield vertical motions that are more systematic and in better agreement with physicalexpectations compared to those estimated from sonic anemometers.
Traditional averaging lengths for computing fluxes are found to be inappropriate in very stableconditions, leading to large random flux errors. These problems are most important in low-lyingareas with weak nocturnal airflow. Biases in existing approaches for estimating carbon dioxidefluxes are summarized.
S21
10- 10 -
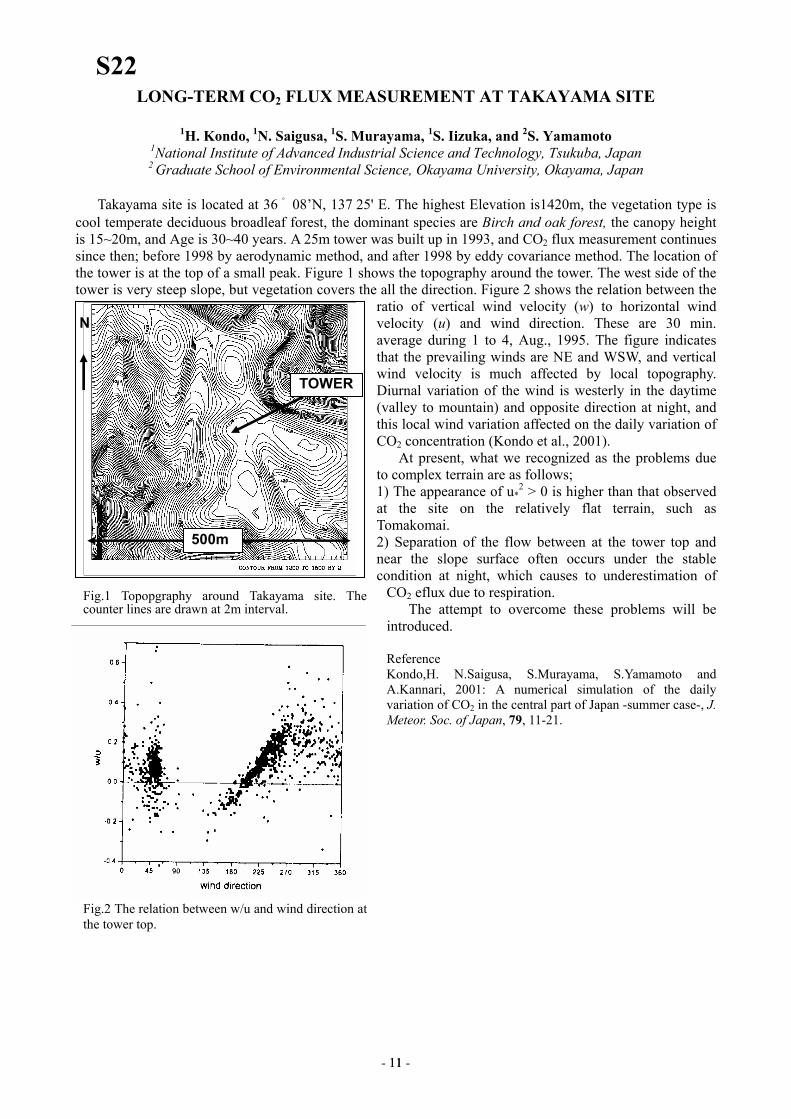
LONG-TERM CO2 FLUX MEASUREMENT AT TAKAYAMA SITE
1H. Kondo, 1N. Saigusa, 1S. Murayama, 1S. Iizuka, and 2S. Yamamoto 1National Institute of Advanced Industrial Science and Technology, Tsukuba, Japan 2 Graduate School of Environmental Science, Okayama University, Okayama, Japan
Takayama site is located at 36 ゚ 08’N, 137 25' E. The highest Elevation is1420m, the vegetation type is cool temperate deciduous broadleaf forest, the dominant species are Birch and oak forest, the canopy height is 15~20m, and Age is 30~40 years. A 25m tower was built up in 1993, and CO2 flux measurement continues since then; before 1998 by aerodynamic method, and after 1998 by eddy covariance method. The location of the tower is at the top of a small peak. Figure 1 shows the topography around the tower. The west side of the tower is very steep slope, but vegetation covers the all the direction. Figure 2 shows the relation between the
ratio of vertical wind velocity (w) to horizontal wind velocity (u) and wind direction. These are 30 min. average during 1 to 4, Aug., 1995. The figure indicates that the prevailing winds are NE and WSW, and vertical wind velocity is much affected by local topography. Diurnal variation of the wind is westerly in the daytime (valley to mountain) and opposite direction at night, and this local wind variation affected on the daily variation of CO2 concentration (Kondo et al., 2001). At present, what we recognized as the problems due to complex terrain are as follows; 1) The appearance of u*
2 > 0 is higher than that observed at the site on the relatively flat terrain, such as Tomakomai. 2) Separation of the flow between at the tower top and near the slope surface often occurs under the stable condition at night, which causes to underestimation of
CO2 eflux due to respiration. The attempt to overcome these problems will be introduced. Reference Kondo,H. N.Saigusa, S.Murayama, S.Yamamoto and A.Kannari, 2001: A numerical simulation of the daily variation of CO2 in the central part of Japan -summer case-, J. Meteor. Soc. of Japan, 79, 11-21.
Fig.1 Topopgraphy around Takayama site. The counter lines are drawn at 2m interval.
TOWER
N
Fig.2 The relation between w/u and wind direction at the tower top.
500m
S22
11- 11 -
ESTIMATION OF ECOSYSTEM RESPIRATION OF A SUBTROPICAL PINUS PLANTATION OVER HILLY REGION IN SOUTHEASTERN CHINA
Xue-Fa Wen, Gui-Rui Yu, Xiao-Min Sun, Yun-Fen Liu
Synthesis Research Center of Chinese Ecosystem Research Network, Institute of Geographical Sciences and Natural Resources Research, Chinese Academy of Sciences, Beijing 100101, China
Long-term measurements of the exchange of CO2 between natural and planted vegetation and the atmosphere
have the potential to markedly improve understanding the role of terrestrial ecosystems play in the global carbon cycle. Eddy covariance (EC) is a micrometeorological technique that allows a non-invasive measurement of the exchange of CO2 between the atmosphere and a several hectare area of forest, shrubland, or grassland. Expanding the scope of the FLUXNET database, ChinaFLUX offers new opportunities to quantify and compare the magnitudes and dynamics of annual ecosystem carbon and water balance and to explore the biotic and abiotic effects on ecosystem processes of carbon dioxide and water vapour exchange that are unique to ecosystems in China.
However, reliable flux measurements at nighttime or at sites subject to advective flows remains a serious obstacle to routine 24 hour operation. At night, flux corrections based on u* thresholds are widely applied to replace aerodynamic estimates when turbulence is weak and the sum of eddy fluxes and storage terms fails to give convincing measures of CO2 respiration. Similarly, rapid flushing of the canopy CO2 at dawn or during intermittent turbulent events in stable conditions is usually spatially localized and may lead to systematic bias in estimates of regional exchange from a single tower. Many sites, chosen for reasons other than micrometeorological convenience such as Qianyanzhou flux site in ChinaFLUX, a subtropical Pinus plantation on the red earth hilly region of southeastern China, suffer from systematic advection in some or all wind directions. Operational approaches to correct for advection are not yet available.
Accuracy estimation of ecosystem respiration over tall vegetation in difficult condition was one of the major issues within the FLUXNET network, so did ChinaFLUX. To be able to compare the results of flux data of different flux measurements, the quality of the flux data must be assessed and controlled. Motivated in larger part by the need to address this question in ChinaFLUX, we analyzed the turbulence flux measurements using the EC technique at two and three canopy heights of Qianyanzhou subtropical Pinus plantation on the red earth hilly region of southeastern China in 2003 and 2004. The objectives of this paper focus on 1) how to assess the nocturnal flux underestimation, and 2) how to estimate the daytime ecosystem respiration to determine gross primary production, and 3) how to determine the seasonal pattern of ecosystem respiration.
The turbulent flux measurements made at two heights were within the surface layer. However, stationary test and integral turbulence test indicated that nocturnal CO2 flux measurement was still under debate. A way to correct for flux underestimation during stable nighttimes is to replace the measured fluxes below the threshold of 0.2~0.3 m s-1 by the simulated efflux by a temperature and moisture function derived during well-mixed conditions at Qianyanzhou flux site.
The use of the annual respiration values derived from nighttime EC data may not be suitable for studies where heterogeneity and fetch limitation exist. Given the potential problems associated with nighttime EC measurement, such as inadequate turbulent mixing, advection, extended flux footprints, and so on, the potential difference in physiological behavior between daytime and nighttime, and the consistency of annual ecosystem respiration, which was derived from daytime light-response analyses and nighttime EC estimates, suggest that our study site was not significantly affected by heterogeneity or fetch problems.
Although ecosystem respiration showed a decline trend during the severe drought during the summer of 2003, net carbon uptake of this planted forest still declined obviously and even become a small carbon source. In essential, net ecosystem CO2 exchange and ecosystem respiration at daily and monthly scales were determined by the gross ecosystem CO2 exchange. Small differences in these large biospheric fluxes account for day-to-day difference in carbon storage by terrestrial ecosystem.
S23
12- 12 -
DIVERSIFIED EVALUATION OF NEE ESTIMATED BY EDDY-COVARIANCE, CHAMBER AND BIOMETRIC METHODS ABOVE TEMPERATE DECIDUOUS
FOREST IN CENTRAL JAPAN Y. Kominami1, T. Miyama1 K. Tamai2, M. Dannoura3, M. Jomura3 and Y. Goto1
1Kansai Research Center, Forestry & Forest Products Research Institute, Kyoto, Japan 2Kyushu Research Center, Forestry & Forest Products Research Institute, Kumamoto, Japan
3Graduate School of Science and Technology, Kobe University, Kobe, Japan
INTRODUCTION In a temperate deciduous forest in Japan situated complex terrain, net ecosystem CO2 exchange (NEE) was estimated using micro-meteorological method, measures of fluxes using chamber and biometric methods. U* threshold for interpolation of nighttime flux and seasonal change of function to estimate nighttime flux was evaluated using respective results. SITE AND METHODS Measurements were conducted at the Yamashiro Experimental Forest (YEF) in Kyoto, Japan. The plot area is 1.7ha. Forest type is a secondary deciduous broad-leaved forest and Quercus serrata and Irex pedunculosa are dominated. Stand density is 3209 ha-1, mean crown height is about 12m and living biomass (DBH≥3cm) is 44.5tC ha-1 (Goto et al., 2003). Eddy covariance CO2 flux measurements were conducted using a closed-path method at 26.5m height and vertical profiles of CO2 concentration from air samples taken at 8 different heights using gas analyzer (LI-6262). In this study, we used eddy covariance flux data obtained from 1 January 1999 to 31 December 2003. Above and below ground net primary production were estimated based on allometric relationships and DBH census (Goto, 2003, Dannoura, 2002). Allometric relationships between size parameters and dry weight of stems, branches, leaves and roots were established using 46 and 16 trees for above and below ground biomass respectively. And DBH census was conducted for all trees (1cm=<DBH) in 1994 and 1999. CO2 flux from foliage was estimated using 4 automated chambers and LAI measurements (Miyama, 2005a). CO2 flux from soil (Fs) was estimated by 2 automated and 16 manual chambers (Tamai, 2005). Estimation function for Fs was established using the data of soil temperature (Ts) and soil water content (θ). CO2 flux from CWD was estimated by 2 automated and 192 manual chambers measurements and CWD census in 2003 (Jomura, 2005). CO2 flux from stem was estimated by 2 chambers measurements and the data of stem surface area estimated by allometric relation between stem surface area and DBH (Miyama, 2005b). By integrating each CO2 flux, CO2 flux from forest was estimated by chamber method. RESULTS AND DISCUSSIONS Averaged net uptake of CO2 measured by eddy covariance method from 1999 to 2003 was 3.4 tC yr-1 ha-1 without compensation of nighttime underreports. Estimated NEP(=NEE) using biometric measurements from 1994 to 1999 was 1.56 tC yr-1 ha-1. U* threshold based on biometric NEP were 0.28 m sec-1 and regression function which relate nighttime CO2 flux and soil temperature at 5cm depth (Ts) was Fco2=0.02443EXP(0.0912 Ts) Annual averaged regression function obtained by chamber measurements showed good agreement with the function by eddy covariance method using the u* threshold as 0.35 m s-1. Assuming the u* threshold as 0.32 which was mean value of two evaluations, annual NEP obtained by eddy covariance method varied from 1.29 to 1.68 tC yr-1 ha-1 from 1999 to 2003. REFFERENCES Dannoura M., Kanazawa Y., Goto Y.(2002), Estimation of root distribution and measurement of root respiration. Bulletin of 113th
assembly of Japanese forestry society, 590. (in Japanese). Goto, Y., Kominami, Y., Miyama, T., Tamai, K., and Kanazawa, Y. (2003), Above ground biomass and net primary production of
broad-leaved secondary forest in the southern part of Kyoto prefecture, central Japan. Bull. FFPRI, 387, 115-147. (in Japanese, with English summary).
Jomura M., Kominami Y., Kanazawa Y.(2005), Long-term measurements of the CO2 flux from coarse woody debris using an automated chamber system. J.Jpn. Soc. 87:138-144(in Japanese with English summary)
Miyama, T., Kominami, Y., Tamai, K. and Goto, Y.(2005a), Seasonal change in nocturnal foliar respiration in a mixed deciduous and evergreen broad leaved forest, J. Agric. Meteorol., 60(5), 753-756.
Miyama, T., Kominami, Y., Tamai, K. and Goto, Y.(2005b), Estimation of the woody tissue surface area and respiration in the secondary deciduous broad leaved forest, Bulletin of 116th assembly of Japanese forestry society, 480. (in Japanese).
S24
13- 13 -
EVALUATION OF NOCTURNAL CO2 EXCHANGE BASED ON DETAILED MEASUREMENTS OF CO2 BALANCE IN A JAPANESE CYPRESS FOREST
S. Ohkubo1, Y. Kosugi1, S. Takanashi1, T. Mitani2 and M. Tani1
1Graduate School of Agriculture, Kyoto University, Kyoto 606-8502, Japan 2Forestry Agency Japan
Introduction
Underestimation of nocturnal CO2 respiration with the eddy covariance method under calm conditions remains an unsolved problem at many forest flux stations. In this study, to evaluate nocturnal CO2 exchange in a Japanese cypress forest with complex topography, we observed CO2 flux above the canopy (Fc), changes in CO2 storage in the canopy (St) and soil, trunk and leaf respirations (Fs, Ft and Fl). In addition to these measurements, we observed the wind speed on the forest floor and checked whether there was a drainage flow, which is considered as one of the causes of underestimation. Site and Methods
Our observation site is located at the Kiryu Experimental Watershed (34° 58’ N, 136° 00’ E) in Shiga Prefecture, Japan. The site is mainly covered by Chamaecyparis obtusa Sieb. et Zucc. (Japanese cypress, an evergreen conifer). This area has a mild northward inclination of approximately 9.2°. The canopy height is approximately 18 m and the total leaf area index (LAI) ranges from 4.5 to 5.5. The annual mean air temperature from 2003-2004 was 13.3℃ and annual mean precipitation from 2003-2004 was 1884 mm.
We measured wind speed and CO2 concentration at 10 Hz with a three-dimensional sonic anemo-thermometer and an open-path IRGA at 28.5m and calculated Fc by the eddy covariance method. The reference frame of the co-variances was rotated for every 30 min flux measurement to align the flux perpendicular to the mean streamline. WPL correction for the effect of air density fluctuations was applied. The data that does not meet the stationarity was rejected. We also calculated St from the vertical CO2 distribution measuring 5 (or 6) heights density. NEE was estimated every 30 min from Fc and St.
Each component of ecosystem respirations (Fs, Ft and Fl) was observed by the chamber method. Five automated closed dynamic chambers for soil (3), trunk (1) and foliage (1) were installed for the continuous observation. Soil respiration rate observed with the automated chambers at the three positions was compared with that observed with a closed chamber air circulation method using home-made chambers and an IRGA at 100 positions located over the watershed, to validate the spatial and temporal representativeness of the data obtained with the three automated chambers. Trunk respiration rate observed with an automated trunk chamber was assumed to be a representative value of this site and scaled to the values per unit ground area (Ft) using census data around the flux tower. Several methods for the scale up were compared to evaluate the uncertainty caused by the difference of the scale up method. The foliage respiration per unit ground area (Fl) was scaled from an automated foliage chamber data. The coefficient for the scaling was derived from the budget with Fc, St, Fs, and Ft, with the assumption that Fc was measured precisely at high friction velocity (u*) in the daytime. The validity of this method was checked comparing with LAI and leaf respiration rate per unit leaf area measured at several heights in the canopy. The underestimation of nocturnal CO2 respiration by the eddy covariance method was evaluated comparing Fc+St to Fs+Ft+Fl. In addition to these observations, three-dimensional wind speed was measured at 2 m-height on the forest floor and compared with that of above the canopy to investigate the existence of drainage flow. Results and Discussion
Comparison of nighttime Fc+St to Fs+Ft+Fl verified that Fc+St underestimated ecosystem respiration (Fs+Ft+Fl) at low u*. The frequency of south wind (downward along the slope) was dominant below the canopy regardless of the wind direction above the canopy at low u*. This suggested the drainage flow at this site under calm condition. Nighttime ecosystem respiration estimated with chamber method nearly equaled to Fc+St at high u*. This result in our site provides a positive prospect for the correction of the nocturnal CO2 flux replacing the data with low u* by the temperature response functions from the data with high u*, although the spatial and temporal heterogeneity in ecosystem respirations should be evaluated more precisely at each site.
S25
14- 14 -
Interpretation of fluxes in non-ideal conditions
M. Y. Leclerc
Abstract This paper reports on the impact of surface patchiness on CO2 fluxes. Using a combination of surface-atmosphere exchange models, tracer and CO2 fluxes and turbulence measurements, this paper demonstrates how adjoining lands of contrasting surface properties upwind, though located hundreds of meters away or more, impact tower CO2 fluxes. The influence of the size of upwind surface patches on fluxes is also discussed. This paper draws examples obtained from several flux research sites. It discusses important flux enhancements imparted by surface inhomogeneities upwind in daytime conditions and identifies several physical mechanisms significantly altering CO2 fluxes in nocturnal conditions. Results from this work shed a new light on the interpretation of surface-atmosphere exchange of CO2 in non-ideal terrain.
S26
15- 15 -
Climate Change Activities in Forestry Sector : Current and Future R&D in Malaysia
Elizabeth Philip and Abdul Rahim Nik Forest Research Institute Malaysia (FRIM) Kepong, 52 109 Kuala Lumpur
Abstract
Malaysia signed the United Nations Framework Convention on Climate Change (UNFCCC) in 1993 and ratified it in 1994 and has since doubled its efforts to fulfill its obligations. A National Climate Change Committee was established to help meet its obligations under the Convention. In addition, an Initial National Communication was submitted to UNFCCC in 2000. Malaysia is in the midst of preparing its second National Communication. Efforts into improving the scientific knowledge base on the potential of Malaysian rainforest as CO2 sink or source is being intensified. Research activities identifying the key carbon pools of each key forest types are on-going. Along these lines, research programmes to address how land-use affects the changes in stocks and estimate the effects of land-use and land-use changes on the emissions and removals of CO2 is being done. In addition, the impacts of projected climate change on key forest species are also being investigated. This paper will highlight the current and future research activities related to climate change and carbon inventories in forestry sector in Malaysia.
S32
16- 16 -
Agricultural and Forest Meteorology Research Work in Thailand
Chuckree Senthong
Professor of Agronomy, Faculty of Agriculture, and Director of Biogas Technology
Center, Chiang Mai University, Chiang Mai 50200, Thailand
ABSTRACT
Thailand has 6 Tower Flux Sites, which constructed by the AsiaFlux for conducting the research work in agricultural and forest meteorology. Maeklong and Sakaerat flux sites belongs to Asia Flux network were operated by Dr. Minoru Gamo et al., (2001-present), which have the objective of the research as to evaluate CO2, water vapor and heat exchange in tropical seasonal deciduous forest. To Daeng To Daeng, and Bacho Bacho flux sites in Narathiwat province (Southern part) was investigated by Dr. Tomoyasu Ishida et al., (1994-present), which have an objective to grasp and renovate the actual conditions of destroyed environment, and to develop local appropriate technology of sustainable biological production of tropical forest. One flux site in Phangnga province (Southern part) was operated by Dr. Nobutaka Monji et al., (1996-1998), has the objective to study for CO2 exchange and heat flow in mangrove forest. The Tak flux measurement (TFM) site, one of the sites of Korean Flux Network (KoFlux) which is an infrastructure of AsiaFlux, is constructed at a Northwest of Thailand and operated by Dr. Wonsik Kim et al., which have an objective to construct a KoFlux prototype of data information system (KoFlux-DIS), which is an infrastructure for a seal time monitoring and simulation system incorporating comprehensive data management of tower flux measurements. There are already several Flux sites in Thailand but it need to find an ecosystem that has been overlooked or left out by the current Thai network especially in the upper North. In the northern part of Thailand the rate of forest loss by deforestation have been relatively modest in the last two decades, with a reduction in forest cover from 52 percent in 1982 to 44 percent in 1995 and even of an increasing more in recent years. There are several activities that involve biomass burning which is the principle source of air pollution; for example slash and burn agriculture especially in the upland and highland areas, and the establishment of permanent farms and cattle ranches, the clearing for which also involves the burning of large amounts of forest materials. Cruzen (2003) estimated 1.8-4.7×10¹⁵ gC of biomass are burned each year in the tropics, compared to the amounts of 5.5×10¹⁵ gC/year of fossil burning. No research work has been done on the biomass burning as a pollution source and limiting in the studies of soil-vegetation-atmosphere interaction in the upland and highland agricultural system. One of the serious causes for the social and economic weakness of Thailand is the severe shortage of highly qualified human resources especially in the field of science and technology. Agricultural meteorology and micrometeorology is the one of the most severe shortage area. There have some scientists from the Royal Forest Department working with the Asia Flux network, and have some course work in agricultural
S33
17- 17 -
meteorology offered for the undergraduate students in some universities. No Ph. D. graduated in agricultural meteorology has been produced by the Thai University. Previous attempts to solve this problem, the Thailand Research Fund, a state research funding agency was initiated a Royal Golden Jubilee (RGJ) Ph. D. program by giving scholarships for the talented student to gain about 6-12 months international research experience. With a shortage of a well-trained personnel in micrometeorology, it would be good for Thailand in terms of to developing the course in agricultural meteorology and micrometeorology. This course would be beneficial immediately to all scientists throughout Thailand, Laos. Cambodia, Malaysia, Vietnam and South of China. The course would be particularly helpful if it can set up a flux site near Chiang Mai University, and should prepare graduate students, post docs, and professors as well as government scientific personnel in the basic principles of micrometeorology / agricultural meteorology. This may be of interest to scientists who work in agriculture, in forestry (ecophysiology), agricultural and civil engineering, environmental sciences, atmospheric sciences, botany, and biology. To tackle these severe shortages we need the collaboration and support from AsiaFlux. With so much photochemical activity in the tropics, it is very unfortunate that we know very little about the atmospheric chemistry in these regions. Thus, an important goal for the future research is to gain a better understanding about chemical processes in these areas. The tropics and subtropics, especially Asia, contain an increasing proportion of the world’s population, which is under rapid development. The large change in atmospheric chemistry and climate forcing during the coming decades will therefore largely come from these region. CO2 has a concentration of approximately 370 per million air molecule, together with water vapor and sunlight, it builds the organic molecules of living matter. As a so-called greenhouse gas, CO2 is also significant for the Earth’s climate. However, despite these important aspects, it plays no role in atmospheric chemistry. O3 and water vapor are the most important drivers of the photochemistry of the atmosphere. Without O3, the chemistry and chemical composition of the atmosphere would be totally different. There was an interaction found in between CO2, O3 and UV-B as the stress factors. An increase of UV-B in the troposphere will promote ozone formation. Ozone and UV-B are known to reduce bio-productivity and therefore less carbon is sequestered in biomass. This response of plants will contribute to the increase of CO2 in the atmosphere. Higher temperatures (greenhouse effect) and CO2 seem to reduce the sensitivity of some plants to ozone and UV-B. This synergism is not understood at all, but due to the high cost of “crucial” experiments to gain reliable results, they are not performed frequently. This paper was prepared for the AsiaFlux workshop 2005, which will be held in Fujiyoshida, Japan, August 24-26, 2005.
- 18 -18- 18 -
MICROMETEOROLOGICAL RESEARCH AND FLUX STUDIES IN BANGLADESH – CURRENT STATUS AND FUTURE PROSPECT
Md. Abdul Baten
Department of Environmental Science, Bangladesh Agricultural University, Mymensingh BANGLADESH
Geologically, Bangladesh is a part of the Bengal Basin, one of the largest geosynclinals in the world. Physiographically, the country can be divided into hills, uplifted land blocks, and the majority alluvial plains with very mean elevation above sea level. Climatologically, it is characterized by high temperature, excessive humidity, and fairly marked seasonal variations of precipitation. Bangladesh experiences abundant rainfall during the monsoon (July-October) followed by a cool winter period (November-February), and then a hot dry summer (March-June).
Bangladesh is highly suitable for crop production. The total land area of Bangladesh is approximately 35 million acres (14 million hectares) of which around 20 million (8 million hectares) or 55.5% of the total area is under cultivation. This is one of the highest percentages in Asia. Seventy percent of the population depends on agriculture. Agriculture is the life nerve of Bangladesh. It contributes 34% to the Gross Domestic Product (GDP). Most of the cultivable land covers with rice based cropping pattern as Rice-Fallow-Rice or Rice-Rice-Rice. And also different types of cereal crops, pulse crops, vegetables, fiber crops, oil crops are cultivated in agricultural sector. Biomass (wood, crop residues, dung) fuel constitutes 73% of total energy consumption and per capita supply is declining gradually which is the principal source of air pollution.
Ecologically, Bangladesh plays a major role with the contribution of terrestrial and aquatic ecosystem. Terrestrial ecosystem includes Dipterocarp forest, Savannas, Bamboo forests, swamp forest, natural inland Sal forest, littoral Mangrove Forest and aquatic ecosystem includes freshwater and coastal wetland. The total land under forest in Bangladesh is about 2.56 million hectare. In Cox’s Bazar, natural forest cover dropped from 31,300 ha in 1985 to about 24,300 ha in 1992. In Sundarbans, 78% of the forest had canopy closure of 75% or more in 1961, which was reduced to 65% in 1984. As of 1989 only about 17% of the total legitimate Sal forest area remained across central and northwest of Bangladesh (FMP, 1995). The total area of the wetlands in the country has been variously estimated at seven to eight million hectares, or about 50% of the total land surface. No research work on micrometeorology/ flux measurement has been conducted on any ecosystem in our country in the past.
In Bangladesh, there are 36 meteorological stations among 64 districts (under Govt. supervision). They
record traditional meteorological parameters with their age-old instruments and process their data manually. Space Research and Remote Sensing Organization (SPARRSO), SAARC Meteorological Research Centre (SMRC), EGIS work with collected meteorological data through Remote Sensing, Satellite Image and Geographical Information System.
International Union for Conservation of Nature and Natural Resource (IUCN) and United Nations Development Programme (UNDP) have several countries programmed to conserve biodiversity in different ecosystems. Food and Agricultural Organization (FAO), CARE and Bangladesh Agricultural Research Council (BARC) work with vulnerability, climate change and adaptation. Department of Environment (DoE) under the Ministry of Environment and Forest (MOEF) and hundreds of NGOs involved in different categories of environmental programme like air pollution, water pollution, soil degradation, waste management etc. But their works are limited in survey based data and awareness building rather than technological development.
There was no course on micrometeorology for students in any University of Bangladesh till 2002,
though micrometeorological research started in 1998 after coming back of Dr. Baten from Chiba University, Japan, with a very limited scope at Bangladesh Agricultural University (BAU) with few portable sensors. By adding a few more sensors with a datalogger provided by National Institute for Agro-Environmental Sciences (NIAES), Japan in September 2002, Dr. Baten is now offering courses to MS students of the Department of Environmental Science of BAU on micrometeorology and has started research on it. Some MS students are working on crop micrometeorology for their dissertations on energy balance, heat storage and radiation use
S34
19- 19 -

efficiency over different ecosystems. We wish to start measurement of micrometeorology in details with water vapor and CO2 fluxes soon over rice ecosystem with collaboration of NIAES. Since Bangladesh is a rice-based country, flux measurement should be continued for 5-7 years. In addition our evergreen “sal forest” should be included for flux observation.
Identified obstacles for our research works are social and economic weakness, severe shortage of highly trained human resource, lack of scientific research centre and scientist and lack of sophisticated instruments. We have already several potential ecosystems for flux study, but we don’t have any facility to conduct such research. We would like to start collaborative research with Japan and thus we want cordial co-operation from AsiaFlux and FLUXNET for financial support, sophisticated instruments and trained manpower. This kind of collaboration will help to provide data to AsiaFlux from a densely populated rice based country for the development of future strategy to combat global warming.
20- 20 -
Status of forest carbon budget studies in India
At present, India being a party to the UNFCCC has initiated its first National Communication and emission inventory in various sectors, this was conveyed successfully to the UNFCCC in June 2004. As part of the NATCOM process, the emissions inventory from the forestry sector was assessed. The data source for this was mainly secondary in nature. The institutions that took part in this process were, Forest Survey of India, Forest Research Institute and Indian Institute of Science. The emissions from the forestry sector make up only one percent of the total national emissions. The forest carbon budgeting efforts have been made to a very limited extent by Indian Institute of Remote Sensing. Besides, the mitigation potentials have been worked out by Indian Institute of Science through forestry mitigation projects using the current productivity rates and land availability. There is a dire need for generating primary information for CO2 and other GHGs in forest ecosystems. No systematic or collaborative programme has been initiated so far. A preliminary attempt has been made by IIRS to establish a flux net tower in Nainital district of Uttaranchal, the modalities for which are in the process of finalization. The Indian Council of Forestry Research and Education as a premier national research organization and custodian of forestry research for the last hundred years and would be interested in a collaborative effort to promote carbon budget studies in India. The organization has eight regional institutes at strategic locations all over the country, adequate strength of scientist and researchers to undertake this work and also coordinate the establishment of a flux network with State Forest Departments. Further, the scientific staff in ICFRE is adept and with the research on nutrient cycles, ecological sciences and forests and conversant with the climate change issues in forests. Here, I would like to highlight that the major clients for forestry research carried out by ICFRE are the State Forest Departments. The SFDs are also the custodians of forest resources and hence ICFRE could liaise very well to enable such a networking and locate ideal sites in representative forest types. The area in which ICFRE would like strengthening and support through the medium of AsiaFlux would be in expertise in handling the flux net tower operations and modeling for carbon budgets.
S35
21- 21 -
A AUTOMATIC CHAMBER SYSTEM FOR MEASURING CONTINUOUS SOIL RESPIRATION BASED ON AN OPEN-FLOW DYNAMIC METHOD
JS. Lee1 , SU. Suh1, NY Chae2, J Kim2, M Yokozawa3, MS Lee4
1Department of Biological Sciences, College of Science, Konkuk University, Seoul 143-701, Korea
2Department of Atmospheric Sciences, Yonsei University, Seodaemun-gu, Seoul 120-749, Korea. 3Department of Global Resources, National Institute for Agro-Environmental Sciences, Tsukuba, Ibaraki 305-8604, Japan.
4Institute for Basin Ecosystem Studies, Gifu University, 1-1 Yanagido, Gifu 501-1193 Japan
We developed an automatic opening and closing chamber system (AOCC) based on an open-flow
dynamic method (open-flow AOCC). The AOCC can be used during all four seasons, even at the surface of relatively deep snow. We compared the open-flow AOCC with two closed dynamic methods (the AOCC configured as a closed dynamic system (closed dynamic-AOCC) and the LI-6400 system) under field conditions. The closed dynamic-AOCC and LI-6400 measurements were about 15.5% and 5.2% lower, respectively, than the values obtained with the open-flow AOCC. There was significant difference in soil respiration rate between the open-flow AOCC and the closed dynamic AOCC system. In contrast, no significant difference in soil respiration rate was detected between the open-flow AOCC and the LI-6400 system. In the field, the open-flow AOCC permitted long-term measurements under a range of temperature conditions and did a good job of reflecting the marked daily and seasonal variations in soil respiration as a function of soil temperature.
O21
22- 22 -
Soil respiration in tropical seasonal rain forest and rubber plantation
in Xishuangbanna, Yunnan, SW China*
Liqing Shaa Qiulan Fanga,b
a Xishuangbanna Tropical Botanical Garden, Chinese Academy of Sciences, Kunming 650223, China
b Graduate School of the Chinese Academy of Sciences, Beijing 100039, China
Abstract: Xishuangbanna is the most northerly situated tropical rain forest in the world and, as a result, has remarkable seasonal climate variations, which is different from tropical rain forests in other regions. In Xishuangbanna, the canopy of rubber plantations, Hevea brasiliensis, often form a single layer structure that is different from the multi-layer canopy of tropical seasonal rain forests.
Measurements of soil respiration rates were carried out for one year in a tropical seasonal rain forest in a Nature Reserve (21º57'N, 101º12'E) and a rubber plantation (21º56'N, 101º15'E). The two sites are about 5 km away near the Xishuangbanna Tropical Botanical Garden in Xishuangbanna, Yunnan.
The results showed that there was remarkable seasonal changes in the soil respiration rates in both the tropical seasonal rain forest and rubber plantation with changes in soil temperature at 5 cm depth, air temperature and soil water content. Soil respiration rates of the tropical seasonal rain forest and rubber plantation were greatest in October (9.24 kgCO2·m-2·d-1 and 11.06 kgCO2·m-2·d-1, respectively), and lowest in February (4.71 kgCO2·m-2·d-1 and 5.13 kgCO2·m-2·d-1, respectively). Soil respiration rates in May, June, July, August, September and October were higher than those in November, December, January, February, March and April. Soil respiration rates in the rubber plantation were significantly higher than that of the tropical seasonal rain forest (P ‹0.01). There was a significant correlation between soil respiration rates and soil temperature at 5 cm depth, air temperature, and the correlation between soil respiration rate and soil temperature (r2= 0.87 and r2= 0.82, respectively) was higher than that between soil respiration rate and air temperature (r2= 0.80 and r2= 0.72, respectively) (P ‹ 0.01) for the forest and plantation. There was a significant (P ‹ 0.01) correlation between soil respiration rates and soil water content in the forest and plantation (r2= 0.73 and r2= 0.63, respectively). The annual CO2 efflux from the tropical seasonal rain forest and rubber plantation was 2.64 kg CO2·m-2·a-1 and 2.80 kg CO2·m-2·a-1, respectively. The Q10 values of the tropical seasonal rain forest and rubber plantation were 2.16 and 2.18, respectively. The Q10 value of the tropical seasonal rain forest measured by the alkaline absorption method in our study was slightly higher than the values measured using the static opaque chamber and gas chromatography techniques. The Q10 values of the seasonal tropical rain forest and rubber plantation in Xishuangbanna are higher than those reported in other tropical regions.
Key words:Tropical seasonal rain forest; Rubber plantation; Soil respiration; Q10; Xishuangbanna
* This research was financially supported by the National Natural Science Foundation of China (Grant No. 40173039) and the
Natural Science Foundation of Yunnan Province, China (Grant No. 2004C0052M, 2001NG28).
O22
23- 23 -
ISOPRENE EMISSION OF QUERCUS SPP. AND ITS CONTRIBUTION TO THE LEAF CARBON BUDGET
A. Tani, Y. Kawawada, D. Tozaki Tokai University, Shizuoka, Japan
Isoprene is a major volatile organic compound emitted from higher plant. Annual isoprene emission is
estimated to be 220 TgC which is higher than the annual emission of non-methane hydrocarbons resulting from fossil fuel (IPCC 2001). One of isoprene emitters is Quercus spp., but there is no available database for the tree species grown in Japan showing which Quercus species emits isoprene and which does not.
Isoprene quickly reacts with some kinds of reactive species such as OH, O3 and NO3 in the atmosphere. The life time of isoprene in the atmosphere is less than several min. It is finally converted to CO2 and this carbon emission is sometimes not negligible in considering carbon budget of leaf, whole plant and forest. We reported in a previous paper that carbon emission as isoprene from Edgeworthia chrysantha corresponds to 7% of carbon fixed by photosynthesis. In the present study, we collected volatiles from 12 Quercus spp.to identify the compounds emitted. Here we report the effects of leaf temperature and light intensity on isoprene emission of some Quercus spp.
Plants used here were Q. serrata, Q. mongolica var. grosseserrata, Q. aliena, Q. dentate, Q. acutissima, Q. variabilis, Q. acuta, Q. glauca, Q. phillyraeoides, Q. salicina, Q myrsinaefolia and Q. sessilifolia. A portable photosynthetic meter was used to measure photosynthetic rate and stomatal conductance. The leaf temperature and PPF in the cuvette were controlled. The flow rate entering the cuvette was set to be 500 umol/s. The volatiles in the cuvette was collected into adsorbent tube containing Tenax TA and Carbotrap. The volatiles were thermally desorbed and then analyzed with a gas chromatograph mass spectrometer. The isoprene concentration was often measured with a proton transfer reaction mass spectrometer (PTR-MS), allowing a real time monitoring of plant response to environment.
Among twelve species only deciduous trees Q. serrata, Q. mongolica var. grosseserrata, Q. aliena, and Q. dentate were identified as isoprene emitters. Isoprene emission from these plant species increased with an increase in leaf temperature up to 40 °C. Isoprene emission rate of these plant species at a leaf temperature of 40 °C ranged from 0.1 to 0.3 µmol(C) m-2s-1, which is corresponding to 5 ~ 20 % of carbon fixed photosynthetically. Their isoprene emission also raised with an increase in PPF and reached a plateau around 500 ~ 1000µmol m-2s-1, showing the change was similar to that of photosynthetic rate.
O23
24- 24 -
* The author for correspondence: [email protected]
Using 13C to partition NEE into photosynthesis and respiration of broad-leaved Korean pine forest
Qingkang Li, Chuanyou Ren, Leiming Zhang, Xuefa Wen, Lupeng Gao,
Yuling Fu, Zhengquan Li, Xiaomin Sun, Gui-Rui Yu*
Institute of Geographic Sciences and Natural Resources Research, Chinese Academy of Sciences (CAS),
11A Datun Road, Chaoyang District, Beijing, 100101, China Email: [email protected]
Terrestrial ecosystems played an important role in the global carbon balance and
mitigating of global climate warming with the increase of CO2 concentration. Net ecosystem exchange of CO2 (NEE), water and energy are widely measured using the eddy covariance (EC) technique. Under-estimate of ecosystem respiration is one of great uncertainty during EC observation in the evaluation of forest ecosystem carbon sequestration function. Another challenge is attributed the abiotic and biotic factors to influences on the mechanism of ecosystem carbon metabolism which results in the annual NEE fluctuation. In order to overcome the weakness of eddy covariance technique and improve our understanding of the ecosystem ecophysiological behavior, stable carbon isotope technique is used to partition the NEE into photosynthesis and respiration components of broad-leaved Korean pine forest, which is the typical forest type in the northeastern of China. Along with open path eddy covariance and meteorology measurements, on the 3-4 and 6-7 August of 2004, ambient air at 3 heights (0.5m, 24m and 32m) within the forest were sampled every two hours for determination of 13C ratio of CO2 using flask with custom-made sampling system. The measured CO2 concentration and 13C ratio are applied to determine the 13C flux (isoflux of 13C) and isotopic characteristics of ecosystem photosynthesis and respiration using Keeling plot technique etc. during the week pre and post sampling. Combined with EC and isotopic measurements, the NEE are successfully partitioned into photosynthesis and respiration components. The respiration flux derived from isotopic technique consists of about 40% of the total gross primary production (GPP) and 50% percent of NEE. In comparison with respiration flux derived from the NEE vs PPFD using nonlinear regression and extrapolation from the exponential dependence of nighttime NEE on air temperature with year round data, the isotopic derived is much higher with apparent diurnal trend. The PPFD technique derived respiration is the lowest and the air temperature derived one is the median with less diurnal change.
It is concluded that the stable carbon isotope technique combined with eddy covariance can be successfully used to partition NEE into photosynthesis and respiration components, and obtain more accurate estimate of ecosystem respiration to study ecophysiological dynamic response to environmental change. Keywords Net ecosystem exchange, eddy covariance, Keeling plot, carbon flux
O24
25- 25 -
Carbon Isotope Composition of Quercus serrata (Japanese Oak) and Caprinus laxiflora (White Birch) Leaves grown in Gwangneung Forest
N. Chae, D. Lee and J. Kim
Dept. of Atmospheric Sciences/Global Environment Lab., Yonsei Univ., Korea
Gwangneung site in Korea has been a center of intensive ecological, meteorological and hydrological researches during last ~10 years to understand forest-atmosphere exchanges of energy, carbon and water in a typical landscape of the country. We report carbon isotope data of Quercus serrata (Japanese Oak) and Caprinus laxiflora (White Birch) leaves collected in 2003 and 2004 from Gwangneung forest for an effort to characterize forest response to changing environmental conditions. Carbon isotope ratios of leaves exhibit remarkable temporal and inter-/intra-specimen variability. For both years, Q. serrata leaves are more enriched in 13C than C. laxiflora leaves. For Q. serrata, leaves grown at higher level of canopy are more enriched in 13C, which mainly correlates with vertical gradients in temperature and vapor pressure within canopy. Leaves of both species grown in 2004 are consistently depleted in 13C compared to those grown in 2003. Carbon isotope fractionation during photosynthesis is mainly determined by the ratios between intercellular and ambient CO2 concentration that is related to the stomatal conductance and photosynthesis rate. Precipitation and soil water content were higher in 2003 than in 2004, while temperature and radiation were lower in 2003. Presumably greater VPD favors low canopy conductance and high WUE in 2004 but higher radiation may result in a condition suitable for low WUE due to high stomatal conductance of the same year. In terms of carbon isotope data, greater ∆ values in 2004 indicate a lower WUE of the year. A more complicated interpretation is derived if normalized nitrogen concentration in leaves is considered. The lower concentration of leaf nitrogen in 2004 likely indicates that Gwangneung forest (or at least two species studied) in 2004 had low ‘Maximum Photosynthesis Ability’ than in 2003. Without supplementary data, it is difficult to interpret how and why Gwangneung forest in 2003 and 2004 had different WUE and photosynthesis rate. However, the results discussed here clearly indicate that the carbon isotope composition of leaves can be a useful measure of forest dynamics under changing environmental conditions. This study is supported by “The Eco-Technopia 21 Project” from the Ministry of Environment, Korea.
O25
26- 26 -
Contributions from belowground respiratory fluxes in an irrigated rice paddy determined by carbon isotopic compositions of ecosystem respiration
G. H. Han1, H. Yoshikoshi2, H. Nagai1, T. Yamada1, K. Ono1, M. Mano1, and A. Miyata1
1Ecosystem Gas Exchange Team, National Institute for Agro-Environmental Sciences, Tsukuba 305-8604, Japan
2Faculty of Agriculture, Kyushu University, Fukuoka 812-8581, Japan
CO2 efflux from waterlogged soil surface has been often neglected, because the floodwater and water-filled pores form a strong diffusion barrier to release of belowground CO2. Furthermore, it has been often assumed that belowground (root and soil microbial) respirations are negligible (or negligibly small compared to those under drained conditions) and thus do not contribute to the carbon balance of the ecosystem under flooded conditions. However, other compelling experimental evidences exist that anaerobic decomposition of organic matter (e.g., plant debris and photosynthates released by roots) and production of CO2 and methane as the end products are the very active processes governing the carbon cycle in the paddy ecosystem. To investigate the contribution from belowground respiratory flux at the ecosystem scale, we periodically measured the carbon isotopic composition of ecosystem respiration (δR) by means of Keeling plot in an irrigated Japanese rice paddy, in conjugation with continuous aerodynamic flux measurements of CO2 and methane (by eddy covariance and flux-gradient methods, respectively).
The observed δR increased from –26.3‰ to –23.2‰ over the growing season in 2003 and was strongly correlated with the variations in carbon isotopic composition of bulk leaf and CO2 entrapped in soil (δP and δS, respectively). δS was gradually enriched in 13C as influenced by the CO2-dependent methane production pathway (CO2 + 4H2 CH4 + 2H2O). Upon floodwater drainage, δR increased remarkably by 1.1‰ to 3.1‰ accompanied with large emissions of methane and with increased nighttime NEE (net ecosystem exchange). The results strongly support a significant role of belowground CO2 flux on the ecosystem carbon exchange, regardless of flooding conditions.
We attempted to quantify the contribution from belowground respiratory flux to the total ecosystem respiration by partitioning ecosystem respiration into plant (above-ground) and soil (belowground) respirations based on δR and the carbon isotope ratios of each respiratory component (δP and δS, respectively). The estimated proportion of soil respiration under flooded conditions was, on average, 32% of the ecosystem respiration and showed a weak seasonal variation. In the early growing season when the rice canopy was still small (LAI = 0.1), soil respiration accounted for about 50% of the ecosystem respiration. In the later flooded periods (2 ≤ LAI ≤ 5), the proportion of soil respiration ranged between 20% and 33%. Under drained conditions, the proportion of soil respiration was estimated to be about 40% of the ecosystem respiration, regardless of the duration of drainage. A simple calculation showed that emission rate of belowground CO2 increased by 2 to 3 times by the drainage practices. To illustrate the importance of belowground CO2 processes in the paddy ecosystem, we estimated the temporal variation in NPP (net primary production) from the measured NEP (net ecosystem production), the approximated total ecosystem respirations from air temperatures, the inferred proportions of soil respiration, and the above- and below-ground biomass distributions. The cumulative NEP over the growing season was about 200 g C m-2 smaller than the measured biomass carbon increase. There was a good correspondence between the time courses of the estimated NPP and the measured biomass carbon.
O26
27- 27 -
CO2 SINK ASSESSMENTS FOR LONG-TERM MONITERING IN A COOL-TEMPERATE DECIDUOUS FOREST IN KOREA
Seong-Deog Kim1, Wonsik Kim2, Naishen Liang3 and Gen Inoue3
1Chungnam National University, Daejeon, Korea 2National Institute for Agro-Environmental Sciences, Tsukuba, Japan
3National Institute for Environmental Sciences, Tsukuba, Japan
Long-term monitoring and accurate measuring the net ecosystem production (NEP) in forest ecosystems are very important to understand the carbon balance under current and future global warming environments. Our study on carbon sink assessments was based on the forest ecological method in a Quercus mongolica forest at Daegwallyeong Flux Measurement Site (DFMS), which is the typical cool-temperate deciduous forest in Korea. We carried out the measurements of biomass, net primary productivity (NPP), soil CO2 efflux and estimated the net ecosystem productivity (NEP) from August 2003 to August 2005. The biomass and NPP were calculated from results of tree census in each year. The soil CO2 efflux and heterotrophic respiration were measured with a multichannel automatic chamber system through the whole year.
The biomass was estimated to be 144.5 and 154.1 ton ha-1 in 2003 and 2004, respectively. NPP was 4.8 tC ha-1 in 2004. Annual total soil respiration and heterotrophic respiration in 2004 was 5.3 and 2.4 C tC ha-1, respectively. NEP of this forest was 2.4 tC ha-1 in 2004.
O27
28- 28 -
THE ROLE OF CARBON-TO-NITROGEN RATIOS FOR QUANTIFYING CARBON SEQUESTRATION IN CHINA’S SOILS
Shaoqiang Wang1, Guirui Yu1, Estaben Jobaggyb, Jiyuan Liu1, Panqin Chen1, and Qingmei Chen1
1. Key Laboratory of Ecosystem Network Observation and Modeling, the CERN Synthesis Research Center,,
Institute of Geographic Sciences and Natural Resources Research, Beijing 100101, China 2. Grupo de Estudios Ambientales – IMASL, Universidad Nacional de San Luis & CONICET, Ejercito de los
Andes 950 - Primer Piso, 5700 - San Luis - ARGENTINA
Soils may help decrease the threat of global warming by removing greenhouse gases from the atmosphere and using the carbon in those gasses to build soil organic matter. This process is called carbon sequestration. We found that the ratio of carbon to nitrogen in soil organic matter can be used as an index to determine whether soil organic matter is increasing or decreasing. Net accumulation of soil organic carbon in soil is constrained by the amount of soil organic matter and its maximum C:N ratio. Our objectives were to estimate the potential for China’s soils to continue sequestration carbon within the soil organic pool. We calculated total soil organic carbon and organic nitrogen in the top meter of 5439 representative soil profiles from the China national second soil survey database. Nitrogen in these mainly forest soils was assumed to be at steady state. The maximum carbon storage capacity was estimated by calculating the amount of carbon stored under assumed maximum soil C:N ratios of either 20,15 or 13. We will discuss the spatial differences of soil carbon sequestration in arid and humid regions in China. The research will benefit land managers who need information on how well their management systems are working and may serve as a tool to help action agencies and policy makers measure the amount of carbon being sequestered in soil organic matter. Keywords: Soil carbon storage; C:N ratio; Soil nitrogen storage; Carbon sequestration
O28
29- 29 -
THE EFFECTS OF SOIL EROSION ON DYNAMICS OF SOIL
ORGANIC CARBON AND CO2 RELEASE
Huajun Fang1,2, Guirui Yu1, Xueming Yang3, Xiaoping Zhang2 1.Institute of Geographical Sciences and Natural Resources Research, Beijing, China; 2. Northeast Institute of Geography and Agricultural Ecology, CAS, Changchun China; 3.Greenhouse & Processing Crops Research Centre, Agriculture & Agri-Food Canada,
Harrow, Ontario, Canada
Soil erosion and deposition influences the accumulation and loss of soil organic carbon (SOC), yet it has not been concerned in the study of soil carbon cycle. In this paper, A typical rolling farmland in Black Soil region of Northeast China was taken as a case to analyze the impact of soil erosion and deposition on the diurnal and seasonal CO2 flux and the variation of different labile carbon fractions based on measurement of CO2 flux, water soluble organic carbon (WSOC), microbial biomass carbon (MBC), particulate organic carbon (POC) and macro-aggregate organic carbon (MOC).The results showed that the CO2 evolved from the soil surface varied significantly among seasons ranging from 0 gC m-2 d-1 in the winter to about 13.6 gC m-2 d-1 during the summer. There was no obvious difference for the release of CO2 between erosion and deposition sites except for shoulder-slope although depositional areas had higher labile fraction content than eroded slope positions. Soil C flux exhibited diurnal variations with high values differing from lows by as much as 0.067 g C m-2 h-1. Peak flux rates as high as 0.106 g Cm-2 h-1 occurred during the mid afternoon during the spring, summer, and autumn seasons. Soil C flux was significantly correlated with soil temperature and air temperature but not with soil moisture content. In addition, soil erosion significantly decreased the content of WSOC, MBC, POC and MOC at eroded geomorphic positions, those of depositional sites such as foot-slope accumulated except for WSOC. The significant positive correlation between each labile carbon fraction and TOC was found. Above preliminary conclusions demonstrated that eroded carbon trapped in deposition positions increased the activity of microorganism and was apt to be mineralized other than be sequestrated in oxidizing environment.
Keywords: Soil erosion and deposition; CO2 flux; labile organic carbon; black soil
O29
30- 30 -
SEVERAL CONSIDERATIONS ON STUDYING CARBON BALANCE OF GLOBAL TERRESTRIAL ECOSYSTEMS.
GUOYI ZHOU
South China Institute of Botany, Chinese Academy of Sciences, Guangzhou, 510650, China. [email protected] To address “missing carbon sink” in global scale is a big challenge for the global change scientists. Although the reported value of missing carbon sink is different in various documented materials, it is usually about 2 Pg C. If the value can be found only in some concentrated areas, for example, as reported in middle latitude areas, the carbon sink in these regions will be unimaginable great and would be easily found and have been well documented. More probable situation may be that the missing carbon sink is more averagely distributed in terrestrial ecosystems and inland water bodies, although there may be some relative high sink areas. If this hypothesis is rational, the carbon sink in normal regions will be less than 0.5 ton·ha-1·yr-1. Under this consideration, precise, long-term and large area of measurement is absolutely necessary, and carbon flux by eddy covariance must be tested by the complexity of other multiple ways due to its unstability of recording and rigorous requirement on flat topography. Furthermore, some processes in which carbon content is low can not be omitted, such as the organic carbon in forest hydrological processes, it may be the best way to show the accumulation of organic carbon in soil, especially in deep soil. When studying carbon balance of global terrestrial ecosystems, another important aspect that we should pay more attention to is comprehensively considering the turnover time and storage change of various carbon pools in terrestrial ecosystems. The organic carbon in the pools has turnover times ranging from months to millennia, with much of it around several years to a few decades. Key words: Carbon missing sink, Tentative distribution pattern, Measurement ways, Hydrological processes, Turnover time
O30
31- 31 -
Carbon dioxide flux of three ecosystems on the Tibetan
Plateau.
Xin-Quan Zhao1 Ying-Nian Li1 Liang Zhao1 Gui-Rui Yu2 Yan-Hong Tang3 Ming-Yuan
Du4 Shi- Xiao Xu1 Guang-Ming Cao1 1Northwest Plateau Institute of Biology, The Chinese Academy of Sciences 2 Institute of Geographic Sciences and Natural Resources Research, The Chinese Academy of Sciences
3National Institute for Environmental Studies, Japan 4National Institute for Agro-Environmental Science, Japan
Abstract: Grassland ecosystem provides a wide range of environment service function and plays an integral part in the life supporting-system. Tibet plateau is a unique geogranfic unit with a vast territory, high attitude, cold air temperature, strong sonar radiation, and typical alpine ecosystems. Alpine meadow,alpine shrub and alpine swamp ecosystems are widely distributed on the plateau and they are characterized by short growing period, high soil carbon content and sensitive to global warming. Alpine meadow dominated by Kobresia humilis and various grasses and forbs (depending on grazing density) are distributed in this region along the valley floor. The shrub, Potentilla fruticosa are joined by shrubby Salix species are locating on the north hill. The region swamp vegetation consists primarily of Kobresia tibetica and Pedicularis longiflora. Sheep and yaks, the major herbivorous animals in the region, live on herbage, which varies greatly with seasons. The eddy covariance method was employed to measure the CO2 exchange between the atmosphere and alpine meadow, alpine shrub land and alpine swamp ecosystems in northeastern Tibetan plateau from November 2002 to October 2003. Results from the first year indicated that net CO2 fluxes were carbon sink for alpine meadow, shrubland but weakly sources for swamp ecosystem on Northeastern Tibetan Plateau. Corresponding daily CO2 fluxes were 2.36, 1.67, and 2.07 g CO2 sink of growing season from May to October, and 1.35, 1.18, 2.19 g CO2 sources of non-growing season from November to April of next year for meadow, shrubland and swamp ecosystems respectively. The temperature sensitivity of ecosystem CO2 emission (Q10), was estimated to be 2.73, 5.06 and 15.15 for the alpine meadow, shrubland and swamp ecosystems, respectively. The high Q10 for the swamp ecosystem seems due to the high organic matter and large proportion of belowground biomass as well. The results indicate that the swamp would have larger potential of ecosystem CO2 emission than the other two alpine ecosystems. The high Q10 for the swamp ecosystem seems due to the high organic matter and large proportion of belowground biomass as well. The current study suggests that the Qinghai-Tibetan Plateau could be a significant CO2 source during the no-growing season and it has significantly contribution on annual CO2 flux.
O31
32- 32 -
Seasonal Variations in Energy and CO2 Fluxes over a Cropland
Surface in north China
Gao Zhiqiu, Bian Lingen and Guo Jianxia
Chinese Academy of Meteorological Sciences, Beijing, 100081, China
The direct and indirect effects of increasing atmospheric CO2 may have profound implications for the structure and function of plant communities. Vegetation, in turn, plays a crucial role in the global carbon balance. Climate simulations are especially sensitive to the surface partitioning of available energy into sensible and latent heat fluxes. Agricultural ecosystem is one of the most widespread vegetation types in the world and therefore is a significant component of the earth’s climate system. Field studies designed to characterize land surface processes in agricultural ecosystem are thus needed. We report results obtained from one year of an ongoing measurement campaign that quantifies the land surface-atmosphere exchanges of carbon dioxide, water, and energy over a cropland surface in the agricultural ecosystem in north China. Eddy covariance flux measurements have been making at the height of 16 m in a regular meteorological station (39.22N, 115.72W) since May, 2004. Ancillary measurements include radiation budget, meteorology, and soil moisture and temperature. The site is typical of plains in north China. Within the experimental period, the dominant temporal variation in fluxes of carbon, water, and energy are caused by variations of crop (winter wheat and corn) growth. Based on footprint analysis, we expect >90% of the measured flux to occur within the nearest 10 km of upwind area. We examine seasonal and diurnal variations in the components of the
surface energy balance and in 2CO flux. Results show that significant variation
occurred in surface energy partition and CO2 during the experiments. Daytime
absorption of 2CO flux by the crop canopy increases when latent heat flux increases.
We examined the energy budget closure and found it ranges from 0.6 to 0.9.
O32
33- 33 -
The carbon dioxide exchange over a typical steppe in Inner Mongolia, China
Yan-Fen Wang, 1 Yan-Bin Hao, 1, 2 Xiang-Zhong Huang, 1, 2
1 Department of Biology, Graduate School of the Chinese Academy of Sciences, Beijing, 100049, China 2 Laboratory of Quantitative Vegetation Ecology, Institute of Botany, Chinese Academy of Sciences, Beijing,
100093, China
Introduction Typical steppe ecosystems developed under semi-arid continental temperate climate condition cover
approximately 4.1×10⁷ hm2 that is about 10.5% of the national grassland area. Recent study shown the climate change in this region has been getting warmer trendy accompanied with obvious increasing air temperature in winter and serious drought in spring. Therefore, there is a virtual need for long-term field measurements to quantify carbon dynamics under climatic changes condition and management practices.
The experimental site is at Inner Mongolia Grassland Ecosystem Research Station located at Xilin River Water- shed of Inner Mongolia Autonomous Region ( 43°32′N , 116°40′E, 1200m a.s.l.). The site has been fenced for 24 years since 1979, being distant from settlements and water holes, the center of the research of Global Change and NECT. The climate is described as semi-arid continental temperate steppe with a dry spring and moist summer. Annual temperature averages - 0. 4 ℃ with a plant growth season of 150 - 180 d. The annual precipitation range is 320 - 400 mm, but is mainly concentrated in June to August. There are many litter falls on the ground. Methods
Wind speed, temperature, CO2, and air temperature were measured at 2 m over ground level. Vertical wind speed and temperature fluctuations were measured at 10 Hz using a three-dimensional sonic anemometer-thermometer aligned into the mean wind. Carbon dioxide and H2O vapor fluctuations were measured at 10 Hz with a fast response open-path infrared gas analyzer. Results 1. Diurnal course of CO2 flux
During the study period in two years, the diurnal CO2 flux pattern was divided into two situations. One had dual uptake peaks that after sunrise (at 6:00 am, Beijing Standard Time), grassland began to take up CO2 (FCO2 was negative) and FCO2 reached the daily maximum magnitude at 8:00; then gradually decreased as PAR increased until became positive (i.e. emission) at 11:00. FCO2 became negative at 16:30 again. After sunset at 19:00, the grassland kept the emission of CO2 and became a net source of CO2.
Another diurnal course of CO2 flux was only single peak of uptake. In 2003, the grassland started to take up CO2 around 6:00~6:30. After reaching the maximum uptake about 8:00, FCO2 gradually decrease until became a net source of CO2 around 19:00~20:00. In contrast, in 2004 the ecosystem began to take up CO2 around 8:00 and reached its maximum magnitude around 10:00 as PAR increased. Subsequently the uptake gradually decreased with the progress of PAR, and the grassland began to become the net source of CO2 around 20:00 (i.e. Fco2 was positive). In addition, in order to investigate the relationship between PAR and FCO2, we plotted the FCO2 against PAR. After sun rising the magnitude of FCO2 increased as PAR increased every month and reached the maximum value around 600~800μmol m-2s-1and 1000μmol m-2s-1 respectively in 2003 and 2004. At the same level of PAR, the afternoon FCO2 magnitudes were smaller than those in the forenoon. In particularly in 2004, the difference between afternoon and forenoon magnitudes was bigger than that in 2003. 2. Seasonal variation of CO2 flux
O33
34- 34 -
The daytime fluxes of CO2 ranged from an uptake of -3.5 g m-2d-1 for the month of July to an emission about 2.8 g m-2d-1 in May during this study period in 2003. The maximum uptake and release was -6.6 g m-2d-1 in August and 3.1 g m-2d-1 in May respectively in 2004. By mid May in 2003, the grassland began to uptake CO2
the peak value time was in Mid-June through Mid-July. Until late September, the signal fell into positive that indicated grassland began to release CO2. In 2004, grassland began to uptake CO2 at early June, the peak value appeared in August, and released CO2 until late September. Through integrating half-hour night FCO2 magnitude, we found that the grassland released more CO2 comparable at night during this study period. In 2003, the magnitude of night CO2 flux (Re) reached the maximum value 4.4 g m-2 d-1 in July. In contrast, in 2004, the value 4.5 g m-2d-1 t was observed in August.
Calculating the sum of diurnal and nighttime FCO2, and then integrated the daily sum to one month. The variation in monthly CO2 fluxes was considerable distinction from May to September between 2003 and 2004. In 2003, the magnitude of maximum monthly CO2 uptake -135.36 g m-2mon-1 was observed in June. However, the maximum emission 95.2g m-2 mon-1 exhibited in July. In contrast, there was a maximum uptake -244.26 g m-2 mon-1 and emission 121.37 g m-2 mon-1 in August of 2004. Grassland started to become a net sink of carbon dioxide in June and reached the maximum value during growing season in 2003. However, in 2004, the date of conversing is in July, delayed near one month than 2003’s. 3. Depression of net ecosystem CO2 exchange
This study found that there was an evident decrease at midday (FCO2 is positive) during the study period of two growing seasons. This phenomenon cannot simply attribute to midday photosynthesis depression although the photosynthesis decrease can cause the ability of fixing CO2 decline at midday. We entitle “Ecosystem Midday Decrease” for this phenomenon. When the ecosystem respiration over the vegetation photosynthesis also causes the positive FCO2 Besides this situation, we found also that during this study period CO2 flux did not increase with PAR increased and its maximum value was not consistent with the maximum PAR. However, at midday FCO2 still maintain negative Conclusions
Comparably, the characteristics of carbon dioxide exchange at our sit are totally difference with other grasslands in the world. Except the magnitude and tend variability of CO2 uptake, the most distinct difference is that the grassland displayed double peaks of CO2 uptake, i.e. there was an “Ecosystem midday decrease” phenomenon at midday.
35- 35 -
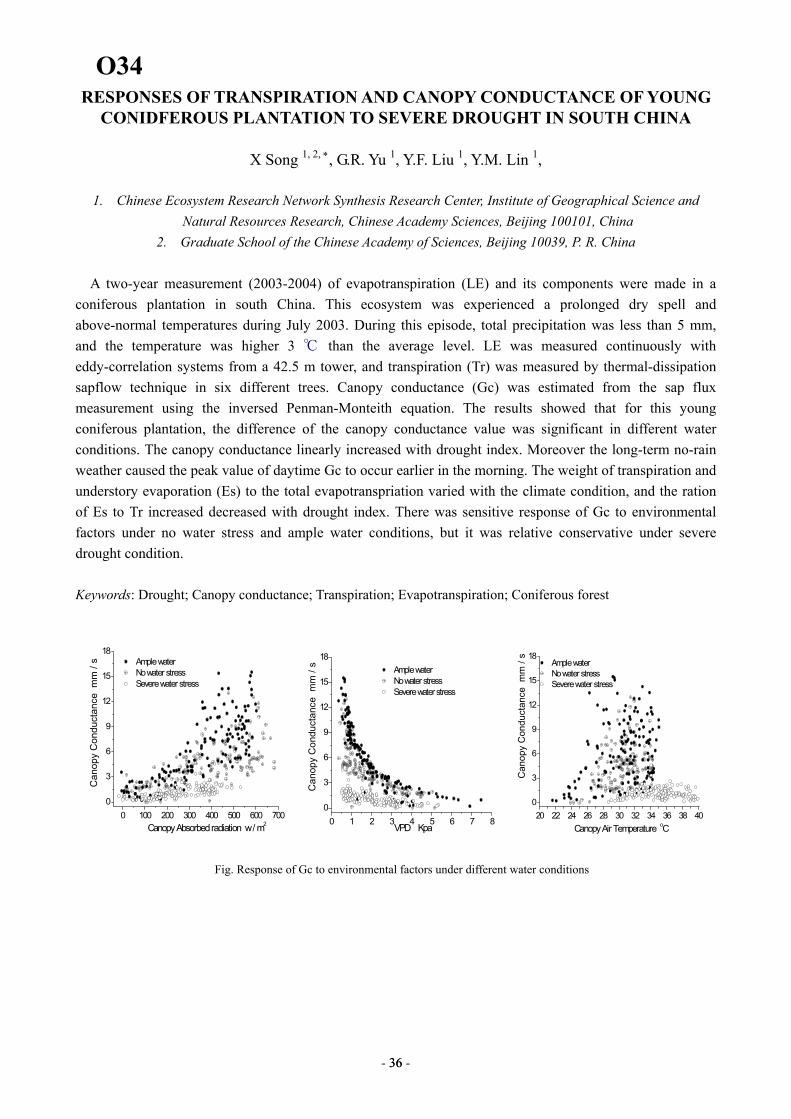
RESPONSES OF TRANSPIRATION AND CANOPY CONDUCTANCE OF YOUNG CONIDFEROUS PLANTATION TO SEVERE DROUGHT IN SOUTH CHINA
X Song 1, 2, ∗, G.R. Yu 1, Y.F. Liu 1, Y.M. Lin 1,
1. Chinese Ecosystem Research Network Synthesis Research Center, Institute of Geographical Science and
Natural Resources Research, Chinese Academy Sciences, Beijing 100101, China 2. Graduate School of the Chinese Academy of Sciences, Beijing 10039, P. R. China
A two-year measurement (2003-2004) of evapotranspiration (LE) and its components were made in a
coniferous plantation in south China. This ecosystem was experienced a prolonged dry spell and above-normal temperatures during July 2003. During this episode, total precipitation was less than 5 mm, and the temperature was higher 3 ℃ than the average level. LE was measured continuously with eddy-correlation systems from a 42.5 m tower, and transpiration (Tr) was measured by thermal-dissipation sapflow technique in six different trees. Canopy conductance (Gc) was estimated from the sap flux measurement using the inversed Penman-Monteith equation. The results showed that for this young coniferous plantation, the difference of the canopy conductance value was significant in different water conditions. The canopy conductance linearly increased with drought index. Moreover the long-term no-rain weather caused the peak value of daytime Gc to occur earlier in the morning. The weight of transpiration and understory evaporation (Es) to the total evapotranspriation varied with the climate condition, and the ration of Es to Tr increased decreased with drought index. There was sensitive response of Gc to environmental factors under no water stress and ample water conditions, but it was relative conservative under severe drought condition.
Keywords: Drought; Canopy conductance; Transpiration; Evapotranspiration; Coniferous forest
0 100 200 300 400 500 600 7000
3
6
9
12
15
18
Can
opy
Con
duct
ance
mm
/ s
Canopy Absorbed radiation w / m2
Ample water No water stress Severe water stress
0 1 2 3 4 5 6 7 80
3
6
9
12
15
18
VPD Kpa
Can
opy
Con
duct
ance
mm
/ s Ample water
No water stress Severe water stress
20 22 24 26 28 30 32 34 36 38 400
3
6
9
12
15
18 Ample water No water stress Severe water stress
Can
opy
Con
duct
ance
mm
/ s
Canopy Air Temperature oC
Fig. Response of Gc to environmental factors under different water conditions
O34
36- 36 -
SURFACE ENERGY FLUXES OF THE TIDAL ZONE OVER THE ARIAKE SEA
K. Tanaka1
1Department of Architecture and Civil Engineering, Kumamoto University, Kumamoto, Japan
The Ariake Sea is a closed bay on the west of Kyushu Island, Japan, with a dynamic tidal range over 5 m in the closed-off section of bay in the spring tide. The Ariake Sea also has a vast tidal flat: the exposed area becomes wider than 200 km2 in the spring tide, occupying about 40 % of the total exposed area in Japan.
The energy budget on the tidal flat surface has been thought to play an important role in controlling the thermodynamic properties of seawater and the biophysical chemical processes of the tidal bottom surface. However, the land sea surface-atmosphere interaction on the tidal flat is complicated because of including not only the diurnal cycle mainly driven by solar radiation but also the tidal cycle controlling the seawater coverage in the tidal bottom surface. Therefore, the objective of this study is to observe the surface energy fluxes on the tidal flat using the direct method of turbulent eddy correlation.
The observation system was constructed on the inter-tidal zone near the Kumamoto Port (32º46´5” N,130º35´40" E). The turbulent flux observation system of the AWS is composed of the sonic anemo-thermometer (81000, YONG) and the infrared H2O/CO2 gas analyzer (LI-7500, Li-COR). The data are sampled at 10 Hz and stored on the data logger (CR-5000, Campbell). The surface around the system exposes offward about 1.5 km at lowest water level. Around site, the bottom surface exposes as long as 3.5 hours in a half-day tidal cycle in the spring tide. In the neap tide, however, the bottom surface is always submerged.
While the bottom surface was submerged in the daytime, the sensible heat flux and latent heat flux was as low as 100 Wm-2, although the net radiation flux became higher than 700 Wm-2. As soon as the bottom surface was exposed, both the sensible heat flux and the latent heat flux increased because the bottom soil surface was heated directly by the net radiation. Under the exposed condition, the bottom soil was still wet and the latent heat flux was dominant. During several hours from sunset, the latent heat flux became higher than 150 Wm-2. The diurnal variation of the water temperature, skin surface temperature, and atmospheric temperature showed that the atmospheric stratification was still unstable during the night with the bottom surface covered by seawater, which released the heat energy both into atmosphere and into the bottom soil.
A scale analysis of seawater temperature equation showed that vertically integrated advection term became an order of 100~500 Wm-2, by substituting the typical value in the Ariake Sea. This value was comparable to other components of the surface energy fluxes.
O35
37- 37 -
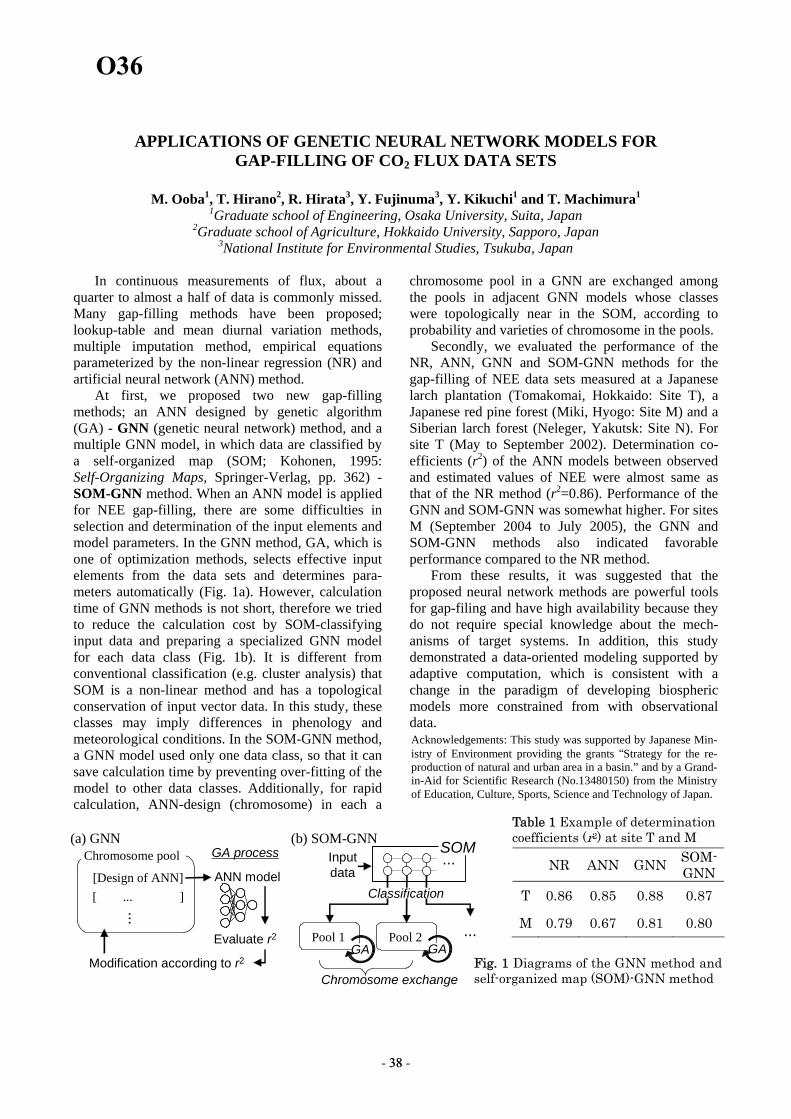
APPLICATIONS OF GENETIC NEURAL NETWORK MODELS FOR GAP-FILLING OF CO2 FLUX DATA SETS
M. Ooba1, T. Hirano2, R. Hirata3, Y. Fujinuma3, Y. Kikuchi1 and T. Machimura1
1Graduate school of Engineering, Osaka University, Suita, Japan 2Graduate school of Agriculture, Hokkaido University, Sapporo, Japan
3National Institute for Environmental Studies, Tsukuba, Japan
In continuous measurements of flux, about a quarter to almost a half of data is commonly missed. Many gap-filling methods have been proposed; lookup-table and mean diurnal variation methods, multiple imputation method, empirical equations parameterized by the non-linear regression (NR) and artificial neural network (ANN) method.
At first, we proposed two new gap-filling methods; an ANN designed by genetic algorithm (GA) - GNN (genetic neural network) method, and a multiple GNN model, in which data are classified by a self-organized map (SOM; Kohonen, 1995: Self-Organizing Maps, Springer-Verlag, pp. 362) - SOM-GNN method. When an ANN model is applied for NEE gap-filling, there are some difficulties in selection and determination of the input elements and model parameters. In the GNN method, GA, which is one of optimization methods, selects effective input elements from the data sets and determines para- meters automatically (Fig. 1a). However, calculation time of GNN methods is not short, therefore we tried to reduce the calculation cost by SOM-classifying input data and preparing a specialized GNN model for each data class (Fig. 1b). It is different from conventional classification (e.g. cluster analysis) that SOM is a non-linear method and has a topological conservation of input vector data. In this study, these classes may imply differences in phenology and meteorological conditions. In the SOM-GNN method, a GNN model used only one data class, so that it can save calculation time by preventing over-fitting of the model to other data classes. Additionally, for rapid calculation, ANN-design (chromosome) in each a
chromosome pool in a GNN are exchanged among the pools in adjacent GNN models whose classes were topologically near in the SOM, according to probability and varieties of chromosome in the pools.
Secondly, we evaluated the performance of the NR, ANN, GNN and SOM-GNN methods for the gap-filling of NEE data sets measured at a Japanese larch plantation (Tomakomai, Hokkaido: Site T), a Japanese red pine forest (Miki, Hyogo: Site M) and a Siberian larch forest (Neleger, Yakutsk: Site N). For site T (May to September 2002). Determination co- efficients (r2) of the ANN models between observed and estimated values of NEE were almost same as that of the NR method (r2=0.86). Performance of the GNN and SOM-GNN was somewhat higher. For sites M (September 2004 to July 2005), the GNN and SOM-GNN methods also indicated favorable performance compared to the NR method.
From these results, it was suggested that the proposed neural network methods are powerful tools for gap-filing and have high availability because they do not require special knowledge about the mech- anisms of target systems. In addition, this study demonstrated a data-oriented modeling supported by adaptive computation, which is consistent with a change in the paradigm of developing biospheric models more constrained from with observational data. Acknowledgements: This study was supported by Japanese Ministry of Environment providing the grants “Strategy for the reproduction of natural and urban area in a basin.” and by a Grand-in-Aid for Scientific Research (No.13480150) from the Ministry of Education, Culture, Sports, Science and Technology of Japan.
NR ANN GNN SOM- GNN
T 0.86 0.85 0.88 0.87
M 0.79 0.67 0.81 0.80
[Design of ANN][ ... ]
...
ANN model
Evaluate r2
Modification according to r2
(b) SOM-GNN
...GA
GA process
Chromosome exchange
Chromosome pool
Pool 1 Pool 2GA
SOM...
Classification
Inputdata
(a) GNN
Fig. 1 Diagrams of the GNN method and self-organized map (SOM)-GNN method
Acknowledgements: This study was supported by Japanese Min- istry of Environment providing the grants “Strategy for the re- production of natural and urban area in a basin.” and by a Grand- in-Aid for Scientific Research (No.13480150) from the Ministry of Education, Culture, Sports, Science and Technology of Japan.
Table 1 Example of determination coefficients (r2) at site T and M
O36
38- 38 -
RECTIFIER EFFECT IN AN ATMOSPHERIC MODEL WITH DAILY BIOSPHERICFLUXES
Douglas Chan2, Misa Ishizawa1, Kaz Higuchi2, Shamil Maksyutov3, Chiu Wai Yuen1andJing Chen1
1University of Toronto, Toronto, Canada;2Meteorological Service of Canada, 4905 Dufferin St. Toronto, Canada M3H5T4;
3National Institute of Environmental Studies, Tsukuba, 305-8506 Japan;
Inversion studies (e.g. Gurney et al. 2002) showed that an important uncertainty in the fluxestimates is the interaction between the atmosphere and the biospheric fluxes or the ‘rectifier effect’. Recent studies have shown that supplementing the baseline flask CO2 data with continuous CO2measurements at baseline and continental sites could yield inversion results with greater spatial/temporalresolutions. However, continuous CO2 measurements at continental sites show strong interactionbetween the atmospheric mixing and the biospheric fluxes on many time scales including diurnal,synoptic and seasonal time scales. The synoptic scale interaction is the subject of this study.
This study investigates the atmosphere-biosphere interaction on the synoptic time scale using theBiome-BGC (Thornton et al., 2002) and NIES (National Institute of Environmental studies) transportmodels (Maksyutov and Inoue, 2000) We used two global biospheric source distributions from Biome-BGC. One represents the daily fluxes with Biome-BGC driven by NCEP (National Centers ofEnvironmental Prediction) daily averaged data from 1990 to 1999 (the fluxes for each year were adjustedto yield a neutral biosphere), and the second source distribution is the mean monthly fluxes averagedfrom year 1990 to 1999 (used as the reference in this study). These biospheric fluxes were thentransported in the NIES transport model with NCEP wind data from year 1990 to 1999. Thus thebiospheric flux and transport are consistent as they both used the NCEP meteorological data. Thedifference in the atmospheric CO2 concentration produced by these two source distributions representsthe effect of coupling between the atmosphere and biosphere with daily variations in the biosphericfluxes.
We have found that the magnitude of the difference in CO2 simulated by the model by these twosources is approximately 10 ppm near the surface. These variations are comparable to the mean seasonalcycle. The anomalies are typically centred over landmasses and have length scale of ~500-1000 km withlittle continuity over different months. The smaller scale features have shorter lifetime (~ 1 month). Theannually averaged CO2 difference is about one order of magnitude smaller while still showing largeinterannual variations and similar spatial features.
These results show that the synoptic scale rectifier effect on the CO2 concentration is significanton the monthly timescale and has some effect on the annual time scale. Thus the synoptic scale rectifiereffect may contribute to the errors and uncertainties of CO2 inversion estimates by models without thesynoptic scale interaction of the atmosphere and biosphere.
O41
39- 39 -
Eco-hydrological modeling and remote sensing for monitoring carbon and
water fluxes in topographically complex forested landscapes
Sinkyu Kang1, Yungil. Kim2, Youngjin Kim1, Eunsook Kim2, Youngryul Ryu2, Seung Kim2, Joon Kim3
1Department of Environmental Science, Kangwon National University, Chunchon 200-701, Korea 2Graduate School of Environmental Studies, Seoul National University, Seoul 151-742, Korea
3Department of Atmospheric Science, Yonsei University, Seoul 120-749, Korea
MODIS (Moderate Resolution Image Spectrometer) is a core satellite sensor boarded on
Terra and Aqua satellite of NASA Earth Observing System since 1999 and 2001,
respectively. MODIS vegetation products (e.g. LAI, GPP, and ET) provide useful tools for
monitoring seasonal variations of terrestrial carbon and water fluxes. For the reliable
application of MODIS products, extensive validation efforts need to be addressed for
diverse ecosystem regimes. We evaluated uncertainties in MODIS FPAR, LAI, and GPP
products with respects to cloud contamination, input meteorology, and parameterization in
Korea. The cloud-originated errors were 8.5%, 13.1%, and 8.4% for FPAR, LAI, and GPP,
respectively. Summertime errors from June to September explained by 78% of the annual
accumulative errors in GPP, which indicates that cloud-originated errors should be
mitigated for practical use of MODIS vegetation products to monitor seasonal and annual
changes in plant phenology and vegetation production in Korea. MODIS GPP algorithm
adopts Data Assimilation Office (DAO) meteorological data to calculate daily GPP. By
evaluating the reliability of DAO data with respect to surface weather station data, we
examined the effect of errors from DAO data on MODIS GPP estimation in Korea. DAO
data resulted in overestimation of GPP by 25% for most of biome types but up to 40% for
forest biomes that is major biome types in Korea. MODIS GPP was more sensitive to
errors in shortwave radiation and VPD than air temperatures. Our results indicate that
more reliable gridded meteorological data than DAO data are necessary to better estimate
MODIS GPP in Korea. Finally, we applied eco-hydrological models (BIGFOOT and
RHHESSys) to evaluate uncertainty in MODIS GPP parameterization. The models were
validated by using NPP data which was estimated from dendrochronological data and then,
applied to calculate maximum light use efficiency(εmax), a core biophysical parameter in
MODIS GPP algorithm, which showed 30% underestimation of the MODIS GPP default
parameter. Overall, our research indicates that considerable uncertainties were imbedded
in MODIS vegetation products and hence, special concerns to mitigate the uncertainties
are required for regional application of MODIS vegetation products.
O42
40- 40 -
AN EVALUATION OF CO2 FLUX AND LATENT HEAT FLUX IN OPEN CANOPIES WITH A MODIFIED SOIL-PLANT-ATMOSPHERE MODEL
Young-Hee Lee Kyungpook National University, Daegu, Korea
This study evaluates the prediction of diurnal variation of moisture and carbon dioxide flux from a
modified soil-plant-atmosphere model with eddy correlation data collected above a pine forest located in a semiarid environment in central Oregon.
The model is based on the canopy model (soil plant atmosphere (SPA) model) of Williams et al., (1996), coupled to a multi-layer soil model with snow and frozen soil physics (Koren et al., 1999). In the canopy model, plants are assumed to open their stomata until either (1) further opening does not constitute an effective use of stored water in terms of carbon gain per unit water loss, or (2) further opening causes a drop in leaf water potential below the limit that causes xylem cavitation (Williams et al., 1996). In modified SPA model, we reduced vegetation layers from 10 layers to 2 layers for use in large-scale model and included stem effect in leaf energy balance. And also subcanopy eddy diffusivity was incorporated to calculate air temperature and mixing ratio in the subcanopy. Estimates of NEE were calculated as the sum of GPP from model simulation and estimates of respiration of ecosystem (Re) determined from empirical temperature response equations.
Simulations were carried out for June and July during growing season in 2003. In June, soil water stress was relatively low and vapor pressure deficiency was moderate while in July both soil water stress and vapor pressure deficiency were high. The model showed an overall good performance in simulating the variability of half hourly latent heat flux and NEE, explaining 78% and 87 % of the variance, respectively. Two cases were selected to examine the impact of soil moisture deficit on diurnal variation of carbon dioxide and water vapor fluxes. The first case contained data for the period between days 152 and 181 when soil moisture was ample. The second case contained data between days 197 and 212. At this time, both soil moisture deficit and air temperatures were high. The model reproduced mean diurnal variation of latent and sensible heat flux and net ecosystem exchange when soil moisture was ample. In case 2, the model predicted reasonably the diurnal course of latent heat flux and CO2 flux but it overestimated the turbulent fluxes in the morning and showed an earlier peak of carbon uptake compared to the measured CO2 flux. Compared to case 1, case 2 had many calm nights and mornings with weak turbulence. The overestimation of the turbulent fluxes was related to the large energy imbalance in observations mainly due to weak turbulent intensity. The earlier peak of carbon uptake was due to neglected CO2 storage term in model. However, the CO2 storage did not explain the overestimation of respiration throughout the night, suggesting that other process such as drainage flow could play a role in carbon budget during calm night at this site.
O43
41- 41 -
A COMPARISON BETWEEN MODELED AND MEASURED CO2 AND WATER VAPOR FLUX IN A SUB-TROPICAL CONIFEROUS FOREST
F. X. Gu1, 2 M. K. Cao1 G. R. Yu1 X. F. Wen1 J. B. Wang1
1 Institute of Geographical Sciences and Natural Resources Research. Chinese Academy of Science, Beijing, China,
2Graduate School, Chinese Academy of Science,Beijing, China
Abstract: Using data from eddy covariance measurements in a subtropical coniferous forest, we tested and evaluated the model of Carbon Exchange in the Vegetation-Soil-Atmosphere (CEVSA) that simulates energy transfers and water, carbon and nitrogen cycles based on eco-physiological processes. In the present study, we improved the model in calculating LAI, carbon allocation among plant organs, litterfall, decomposition and evapotranspiration, and tested and validated the model. The modeled seasonal variations in carbon and water vapor flux were consistent with the measurements. The model explained 79% and 86% of the measured variations in evapotranspiration and soil water content. However, the modeled evapotranspiration and soil water content were lower than the measured systematically, because the model assumed that water was lost as runoff if it was beyond the soil saturation water content, but the soil at the flux site with abundant rainfall is often above water saturated. The model reproduced 79% and 88% of the measured variations in gross primary production (GPP) and ecosystem respiration (Re), but only 31% of the variations in measured net ecosystem exchange (NEP) although the model annual NEP was close to the measured. The modeled NEP was generally lower in winter and higher in summer than the measured. The modeled responses of photosynthesis and respiration to water vapor deficit at high temperatures were different from measured, and the model underestimated ecosystem photosynthesis and respiration in extremely condition. The present study shows that CEVSA can simulate the seasonal pattern and magnitude of CO2 and water vapor fluxes, but it requires improvement in simulating photosynthesis and respiration at extreme temperatures and water vapor deficit. Key words: Ecosystem CO2 and water vapor flux, CEVSA, eddy covariance, subtropical coniferous forest.
O44
42- 42 -
Simulation of CO2 flux in three different ecosystem in ChinaFLUX based on artificial neural networks
Honglin He, Guirui Yu, Lengming Zhang, Xiaoming Sun
Key Laboratory of Ecosystem Network Observation and Modeling, the CERN Synthesis Research Center,, Institute of Geographic Sciences and Natural Resources Research, Beijing 100101, China
The non-linearity of the relationship between CO2 flux and other micrometeorological variables flux parameters limits the applicability of carbon flux models to accurately estimate the flux dynamics . but the need for Carbon dioxide(CO2) estimations covering larger areas and the limitations of the point eddy covariance technique to address this requirement necessitates the modeling of CO2 flux from other micrometeorological variables. Artificial neural network (ANN) are used because of their power to fit highly non-linear relations between input and output-variables without to explain the nature of the phenomena. In this paper ,we applied a multilayer perceptron ANN technique with error back propagation algorithm to simulate CO2 flux on three different ecosystems (forest, grassland and maize) in ChinaFLUX . Energy flux(net radiation, latent heat, sensible heat and soil heat flux) and temperature (air and soil) and soil moisture were used to train the ANN and predict the CO2 flux . Diurnal half-hourly fluxes data from June to August of observations in 2003 were divided into training , validating and testing. Results of the CO2 flux simulation show that the technique can successfully predict the observed values with R2 value between 0.75 and 0.866. The results also showed the soil moisture couldn’t improve the simulative accuracy without limitations of soil moisture. The analysis of the contribution of input variables in ANN show the ANN is not a black box model, it can tell us about the controlling parameters of NEE in different ecosystem and micrometeorological environment. The results indicate the ANN is not only the reliable ,efficient technique to estimate regional or global CO2 flux from point measurements and understand the spatiotemporal budget of the CO2 fluxes ,but also can discovery the relations between the CO2 flux and micrometeorological variables.
Keywords: Artificial neural network;CO2;ChinaFLUX; Energy flux; variables contribution.
O45
43- 43 -
ANALYSIS AND INTERPRETATION OF ASIAFLUX DATA IN CONNECTION TO GLOBAL CARBON CYCLE MODELING
G. A. Alexandrov1 and Y. Yamagata1
1National Institute for Environmental Studies, Tsukuba, Japan
A regional carbon sink is a sum of carbon fluxes provided by regional ecosystems. The combinations of ecosystems, environmental and climate conditions form a variety that developing network for carbon flux monitoring cannot cover, and so the regional and global assessments are presumed to be based on models extrapolating and interpolating measured fluxes.
Getting robust estimate of regional carbon sink is a challenge. Not every model that fit fluxes measured at a site may serve the purpose. If accuracy achieved by model specialization, that is, by taking into account specific features of the site, the model is hardly applicable at regional scale, across the ecosystem diversity.
TsuBiMo (a process-based carbon cycle model) was developed for applying at the regional and global scale, and therefore it employs only those biophysical concepts that are commonly applicable. One of them is optimal temperature of photosynthesis. The temperature dependence of light-saturated photosynthesis is commonly drawn as a bell-shaped curve that peaks somewhere between 20 and 30°C. The width and height of the “bell” as well as the position of its center depends on plant species and conditions at which plant was grown. The problem is to find values at which corresponding parameters should be set in a global scale model.
With this in mind we consider the AsiaFlux data as indirect measurements of light-saturated photosynthesis, derive its rate by inverting the model of productivity (see [1-2] for details of the method), and plot against temperature. Thus interpreted data provide valuable information about temperature dependence of light-saturated photosynthesis that currently presents a “bottleneck” in modeling climate feedbacks from terrestrial ecosystems. The position of optimal temperature dictates when and where carbon sinks switch to sources under given global warming scenario, and thus current uncertainty in positioning the optimal temperature is a cause of discrepancies in carbon sink assessments [3].
Here we present the results of analysis and interpretation of the data from Takayama [4] and Tomakomai [5] sites of AsiaFlux network and discuss some peculiarities in the obtained curves of temperature response that cannot be readily interpreted within the framework of chemical thermodynamics.
References:
1. Alexandrov, G.A., Yamagata, Y., Oikawa, T. and Saigusa, N., 2004. Re-calibrating TsuBiMo with eddy-covariance measurements at Takayama. Agricultural and Forest Meteorology (accepted)
2. Alexandrov, G.A., Oikawa, T. and Yamagata, Y., 2002. The scheme for globalization of a process-based model explaining gradations in terrestrial NPP and its application, Ecological Modelling, 148: 293-306.
3. Alexandrov, G.A. and Yamagata, Y., 2004. Verification of carbon sink assessment: can we exclude natural sinks? Climatic Change 67: 437-447.
4. Saigusa,N., Yamamoto,S., Murayama,S., Kondo,H., and Nishimura,N., (2002) Gross primary production and net ecosystem exchange of a cool-temperate deciduous forest estimated by the eddy covariance method. Agricultural and Forest Meteorology, 112:203-215 pp.
5. Hirano, T., Hirata, R., Fujinuma, Y., Saigusa, N., Yamamoto, S., Harazono, Y., Takada, M., Inukai, K. and Inoue, G. 2003. CO2 and water vapor exchange of a larch forest in northern Japan. Tellus. 55B, 244-257.
O46
44- 44 -

Poster Session
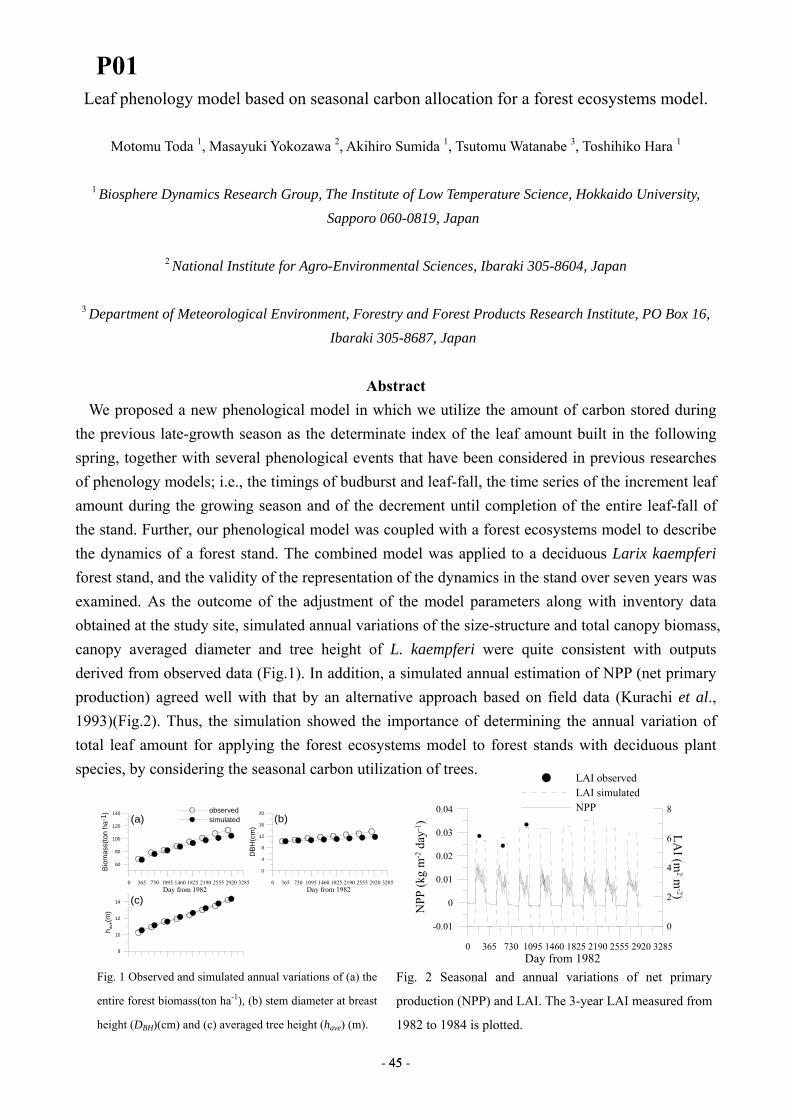
Leaf phenology model based on seasonal carbon allocation for a forest ecosystems model.
Motomu Toda 1, Masayuki Yokozawa 2, Akihiro Sumida 1, Tsutomu Watanabe 3, Toshihiko Hara 1
1 Biosphere Dynamics Research Group, The Institute of Low Temperature Science, Hokkaido University,
Sapporo 060-0819, Japan
2 National Institute for Agro-Environmental Sciences, Ibaraki 305-8604, Japan
3 Department of Meteorological Environment, Forestry and Forest Products Research Institute, PO Box 16,
Ibaraki 305-8687, Japan
Abstract We proposed a new phenological model in which we utilize the amount of carbon stored during
the previous late-growth season as the determinate index of the leaf amount built in the following spring, together with several phenological events that have been considered in previous researches of phenology models; i.e., the timings of budburst and leaf-fall, the time series of the increment leaf amount during the growing season and of the decrement until completion of the entire leaf-fall of the stand. Further, our phenological model was coupled with a forest ecosystems model to describe the dynamics of a forest stand. The combined model was applied to a deciduous Larix kaempferi forest stand, and the validity of the representation of the dynamics in the stand over seven years was examined. As the outcome of the adjustment of the model parameters along with inventory data obtained at the study site, simulated annual variations of the size-structure and total canopy biomass, canopy averaged diameter and tree height of L. kaempferi were quite consistent with outputs derived from observed data (Fig.1). In addition, a simulated annual estimation of NPP (net primary production) agreed well with that by an alternative approach based on field data (Kurachi et al., 1993)(Fig.2). Thus, the simulation showed the importance of determining the annual variation of total leaf amount for applying the forest ecosystems model to forest stands with deciduous plant species, by considering the seasonal carbon utilization of trees.
Fig. 2 Seasonal and annual variations of net primary
production (NPP) and LAI. The 3-year LAI measured from
1982 to 1984 is plotted.
0 365 730 1095 1460 1825 2190 2555 2920 3285Day from 1982
-0.01
0
0.01
0.02
0.03
0.04
NPP
(kg
m-2
day
-1)
0
2
4
6
8
LAI (m
2m-2)
LAI observedLAI simulatedNPP
0 365 730 1095 1460 1825 2190 2555 2920 3285Day from 1982
8
10
12
14
h ave
(m)
0 365 730 1095 1460 1825 2190 2555 2920 3285Day from 1982
0
4
8
12
16
20
DB
H(c
m)
0 365 730 1095 1460 1825 2190 2555 2920 3285Day from 1982
60
80
100
120
140
Bio
mas
s(to
n ha
-1) observed
simulated(a) (b)
(c)
Fig. 1 Observed and simulated annual variations of (a) the
entire forest biomass(ton ha-1), (b) stem diameter at breast
height (DBH)(cm) and (c) averaged tree height (have) (m).
P01
45- 45 -
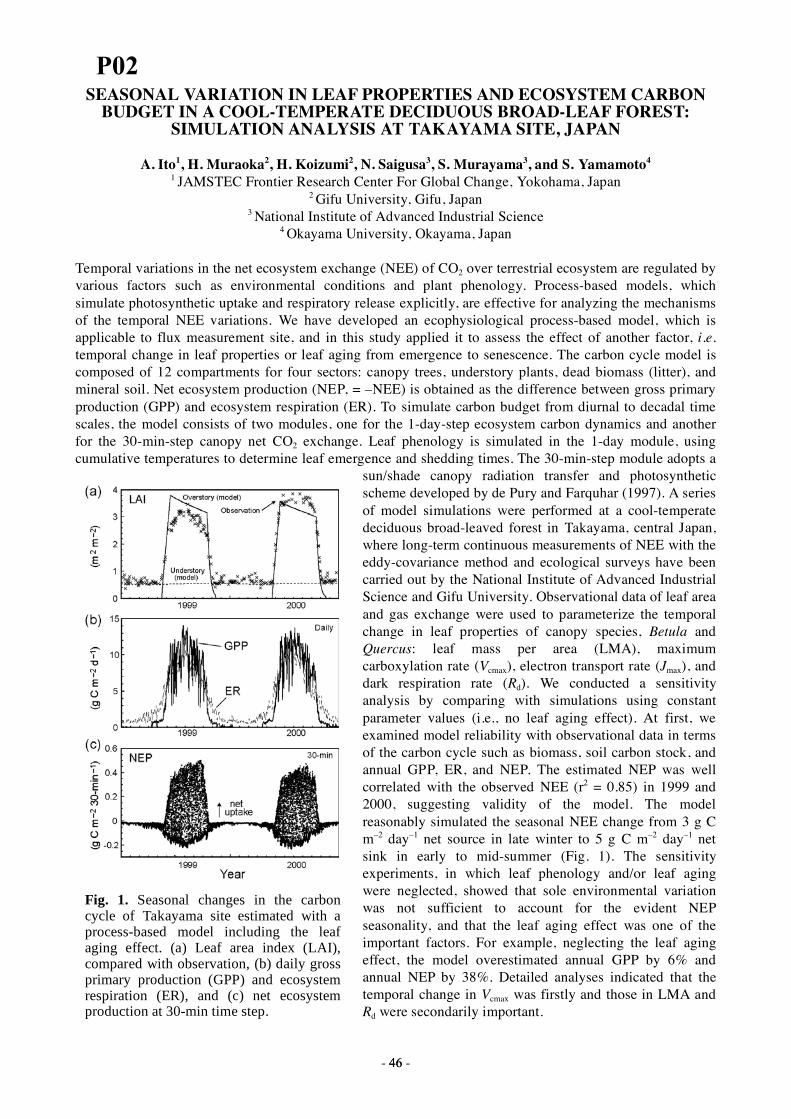
SEASONAL VARIATION IN LEAF PROPERTIES AND ECOSYSTEM CARBON BUDGET IN A COOL-TEMPERATE DECIDUOUS BROAD-LEAF FOREST:
SIMULATION ANALYSIS AT TAKAYAMA SITE, JAPAN
A. Ito1, H. Muraoka2, H. Koizumi2, N. Saigusa3, S. Murayama3, and S. Yamamoto4 1 JAMSTEC Frontier Research Center For Global Change, Yokohama, Japan
2 Gifu University, Gifu, Japan 3 National Institute of Advanced Industrial Science
4 Okayama University, Okayama, Japan Temporal variations in the net ecosystem exchange (NEE) of CO2 over terrestrial ecosystem are regulated by various factors such as environmental conditions and plant phenology. Process-based models, which simulate photosynthetic uptake and respiratory release explicitly, are effective for analyzing the mechanisms of the temporal NEE variations. We have developed an ecophysiological process-based model, which is applicable to flux measurement site, and in this study applied it to assess the effect of another factor, i.e. temporal change in leaf properties or leaf aging from emergence to senescence. The carbon cycle model is composed of 12 compartments for four sectors: canopy trees, understory plants, dead biomass (litter), and mineral soil. Net ecosystem production (NEP, = –NEE) is obtained as the difference between gross primary production (GPP) and ecosystem respiration (ER). To simulate carbon budget from diurnal to decadal time scales, the model consists of two modules, one for the 1-day-step ecosystem carbon dynamics and another for the 30-min-step canopy net CO2 exchange. Leaf phenology is simulated in the 1-day module, using cumulative temperatures to determine leaf emergence and shedding times. The 30-min-step module adopts a
sun/shade canopy radiation transfer and photosynthetic scheme developed by de Pury and Farquhar (1997). A series of model simulations were performed at a cool-temperate deciduous broad-leaved forest in Takayama, central Japan, where long-term continuous measurements of NEE with the eddy-covariance method and ecological surveys have been carried out by the National Institute of Advanced Industrial Science and Gifu University. Observational data of leaf area and gas exchange were used to parameterize the temporal change in leaf properties of canopy species, Betula and Quercus: leaf mass per area (LMA), maximum carboxylation rate (Vcmax), electron transport rate (Jmax), and dark respiration rate (Rd). We conducted a sensitivity analysis by comparing with simulations using constant parameter values (i.e., no leaf aging effect). At first, we examined model reliability with observational data in terms of the carbon cycle such as biomass, soil carbon stock, and annual GPP, ER, and NEP. The estimated NEP was well correlated with the observed NEE (r2 = 0.85) in 1999 and 2000, suggesting validity of the model. The model reasonably simulated the seasonal NEE change from 3 g C m–2 day–1 net source in late winter to 5 g C m–2 day–1 net sink in early to mid-summer (Fig. 1). The sensitivity experiments, in which leaf phenology and/or leaf aging were neglected, showed that sole environmental variation was not sufficient to account for the evident NEP seasonality, and that the leaf aging effect was one of the important factors. For example, neglecting the leaf aging effect, the model overestimated annual GPP by 6% and annual NEP by 38%. Detailed analyses indicated that the temporal change in Vcmax was firstly and those in LMA and Rd were secondarily important.
Fig. 1. Seasonal changes in the carbon cycle of Takayama site estimated with a process-based model including the leaf aging effect. (a) Leaf area index (LAI), compared with observation, (b) daily gross primary production (GPP) and ecosystem respiration (ER), and (c) net ecosystem production at 30-min time step.
P02
46- 46 -
ESTIMATION OF PLANT AREA INDEX BY DOWN-LOOKING HELIBORNE LIDAR IN JAPANESE LARCH FOREST
T. Takeda1, H. Oguma1, Y. Yone2 and Y. Fujinuma1
1National Institute for Environmental Studies, Tsukuba, Japan 2PASCO Corporation, Tokyo, Japan
The distribution of leaf area and wood area in forest play an important role in estimation of CO2 fixation of
forest and interpretation of spectral reflectance on remote sensing data. As the indices that express the distribution, a plant area index (PAI), which is the total one-sided leaf area and wood surface area per unit ground surface area, and an average plant inclination angle (APIA), which is the angle between the normal of leaf and wood surface and the vertical, are widely used. Among the many techniques to measure PAI and APIA, gap fraction theory is applied to various applications, because it can measure PAI and APIA without destruction of forest and time-consuming. We developed the techniques to measure gap fraction from the probability of penetration of laser beams through the canopy by the laser range finder (Takeda, 2005). The advantages of using the laser range finder are that, 1) the three-dimensional distribution of PAI and APIA can be measured, 2) the measurement at night time become possible, and 3) the measurement not only at the forest floor but also above the canopy become possible. In relation to 3), we succeeded in the measurement of PAI and APIA in large scale by using side-looking LIDAR mounted on helicopter. However, the commonly used airborne or heliborne LIDAR can not shot the laser beam in the direction of the angle needed to invert PAI and APIA from gap fraction. So, as one attempt to estimate PAI by commonly used heliborne LIDAR, we discussed that the technique to estimate PAI by down-looking heliborne LIDAR, under the assumption that APIA was already known.
The measurement was conducted at the Tomakomai Flux Research Site (hereafter refer to TFRS) in the national forest located in Tomakomai, Hokkaido, Japan (42°44′N、141°31′E). In TFRS, 45-year-old Japanese larch (Larix kaempferi Sarg.) with the tree height of 13.8m (range from 7.0m to 20.0m) was planted and the population was about 1087 plants/ha-1. In order to estimate PAI, dividing the area scanned by down-looking heliborne LIDAR into 63 plots with the area of 100m × 100m, and the measurement of gap fraction in each plot was conducted. To verify accuracy, the measurement of PAI and APIA by side-looking heliborne LIDAR was also conducted in same plots. The measurement of side-looking heliborne LIDAR was conducted in September 8, 2003 and down-looking heliborne LIDAR was conducted in September 9, in 2003.
In a case that APIA assumed 57.3 degree, which is the APIA of spherical distribution, the relation of PAI measured by side-looking heliborne LIADR and down-looking heliborne LIDAR shows that RMSE is 2.21 and the slope of regression line is 1.11. On the other hand, in a case that APIA assumed 45.5 degree, which is the averaged APIA in all plots measured by side-looking heliborne LIDAR, the relation of PAI measured by side-looking heliborne LIADR and down-looking heliborne LIDAR shows that RMSE is 1.84 and the slope of regression line is 0.94. A difference was few seen in RMSE between both PAIs. But, from the result that RMSE was about 2, it was suggested that the error included in PAI could not be neglected in some plots. Reference T. Takeda, H. Oguma, Y. Yone and Y. Fujinuma, 2005 : Measurement of 3-D Structure of Japanese Larch (Larix kaempferi Sarg.) by Laser Scanner. J. Agric. Meteorol., 61, 39-47
P03
47- 47 -
DEVELOPMENT OF MEASUREMENT SYSTEM FOR EVALUATING FOREST ECOSYSTEMS:
MEASUREMENT METHOD OF NPP BY USING AIRBORNE LASER SURVEY
Y. Yone1, H. Oguma2 and Y. Fujinuma2 1Pasco Corporation, Tokyo, Japan
2National Institute for Environmental Studies, Tsukuba, Japan
In order to develop a monitoring system for evaluating forest ecosystems, a method of forest stand measurement using airborne laser survey was examined. The study area was a Larix leptolepis forest (100m×100m) in the Tomakomai Flux Research Site, Hokkaido, Japan (42°44’N, 141°31’E). Canopy height was approximately 15-16m and tree age was about 45 years old.
The laser survey data were taken in the year 1999, 2001 and 2003. A canopy DSM (Digital Surface Model) was constructed from first pulse of the laser survey data, and the DTM (Digital Terrain Model) was constructed from the last pulse of it. The DCHM (Digital Canopy Height Model) was made by the difference of the canopy DSM and DTM. The crowns of trees were extracted from the canopy DSM by the Watershed method. Tree height was measured by the difference of maximum altitude of laser point and DTM altitude within the extracted crown. The stem volume of trees was calculated by using the relationship between tree height and the stem volume. The tree height measured by the laser survey tends to be underestimated because of penetration in the foliage and missing tree tops. Therefore, tree heights are corrected by the relationship of the true height and measured height when the pulse density is thinned as a simulation. And, since the crowns of under-storey tree could not be detected in the laser survey, the MNY method (Hozumi, 1971) was used for the prediction of under-storey trees. The stand volume was calculated as the sum of stem volumes. The carbon weight of the stand was calculated by using the relationship between the wood volume and the wood dry-weight, and by multiplying the expansion factor, and the carbon content factor. NPP using laser survey was calculated as the sum of the annual carbon weight growth and the annual carbon weight of leaf fall. And, for the comparison, NPP by using micrometeorological method was calculated as
NPP = NEP + Rh - wf (1) where NEP was the estimated NEP by the eddy covariance technique ( Open- and closed-pass system ) , Rh was the heterotrophic respiration and wf was the carbon weight of forest floor plants.
The results that the growth of the forest stand height was 0.23~0.25cmyr-1, and that the growth of the forest stand volume was 11m3yr-1, both were near to the data obtained by the complete enumeration. NPP calculated from the laser survey method and from the complete enumeration method were 298 gCm-2yr-1 and 311 gCm-2yr-1 , respectively. NEP by the Open- and closed-pass system was 566 gCm-2yr-1 and 232 gCm-2yr-1 (Hirata et al., submitted) , Rh was 545 gCm-2yr-1 (Liang et al., 2004) and wf was 355 gCm-2yr-1, then NPP became 756 and 422 gCm-2yr-1. This value was larger than the NPP by laser survey. This bias of NPP is thought that the formula (1) lacks the production of the rootlet. But, NPP calculated from the laser survey method and from the complete enumeration method were close value. Therefore, this method has a precision for the measurement of NPP.
P04
48- 48 -
RELATIONSHIP BETWEEN THE REMOTE SENSED VEGETATION INDICES AND PHOTOSYNTHETIC LIGHT USE EFFICIENCY OF JAPANESE LARCH NEEDLES
T. Nakaji1, H. Oguma1 and Y. Fujinuma1
1National Institute for Environmental Studies, Tsukuba, Japan To clarify the utility of remote sensed vegetation index for evaluation of photosynthetic light use efficiency (LUE) of Japanese larch (Larix kaempferi), three types of spectral vegetation indices and daytime gas exchange rates of larch needles were investigated on different satellite overpass time.
In six clear days from early June to late October in 2003, the 4-band spectral reflectance (531, 570, 671 and 782 nm), net photosynthetic rate (Pn) and photosynthetically photon flux density (PPFD) were investigated at the canopy top of mature Japanese larch forest in Tomakomai, Japan (42°44’N, 141°31’E). The measurements were carried out two times per day, on near overpass time of Terra/MODIS (10:40 JST) and Aqua/MODIS (13:40 JST). Spectral reflectance of larch needles was measured using a portable spectral imager (MSI-4, Photron Co.), and the photochemical reflectance index (PRI)1), normalized vegetation index (NDVI) 2) and difference of reciprocal reflectance (1/RRED-1/RNIR) 3) were calculated from spectral reflectance as follows (Rλ denotes the reflectance at λ nm):
PRI = (R531 – R570) / (R531 + R570) (1) NDVI = (R782 – R671) / (R782 + R671) (2) 1/RRED-1/RNIR = 1/R671 – 1/R782 (3)
The Pn of the larch needles and the incident PPFD were determined using a portable photosynthesis system (Li-6400, Li-Cor, USA), and the LUE was calculated as Pn divided by the incident PPFD.
At the monitoring site, expansion of short-shoot needles was started from mid-May, and yellow color change of the needles was observed in late October. As well as phenology of needle growth, both Pn and LUE increased during summer, with peaks in August, and reduced in October. The Pn from June to July was significantly higher in the morning overpass time than that in afternoon overpass time due to higher irradiation in the morning period. However, no significant difference was found on the LUE between the overpass times.
The feature of seasonal variation differed among the analyzed vegetation indices. The NDVI and 1/RRED-1/RNIR stabilized from late June to September, and then reduced in October. On the other hand, the PRI increased from June to August, and reduced in October together with needle senescence. There was no significant effect of satellite overpass time on these vegetation indices.
Consequently, strong correlation was detected between the LUE and PRI of larch needles in both satellite overpass time (r = 0.955 in AM, r = 0.954 in PM). Although the significant correlations were found between the Pn and the analyzed vegetation indices, their correlations (coefficient correlation and regression line) were affected by observation time. Although further study is needed to develop the LUE estimation model for the large scale targets (ex. tree canopy and forest ecosystems), these results obtained in this study suggest that PRI is one of the useful indices for estimating the seasonal change in LUE of CO2 flux in Japanese larch forest even by using snapshot data. References 1) Gamon, J. A., Peñuelas, J., and Field, C. B., 1992, A narrow-waveband spectral index that tracks diurnal
changes in photosynthetic efficiency. Remote Sensing of Environment, 41, 35-44. 2) Tucker, C. J., 1979, Red and photographic infrared linear combinations for monitoring vegetation. Remote
Sensing of Environment 8, 127-150. 3) Gitelson, A. A., Verma, B. S., Viña, A., Rundquist, C. D., Keydan, G., Leavitt, B., Arkebauer, J. T., Burba, G.
G. and Suyker, E A., 2003, Novel technique for remote estimation of CO2 flux in maize. Geophysical Research Letter, 30(9), 1486, doi:10.1029/2002GL016543.
P05
49- 49 -
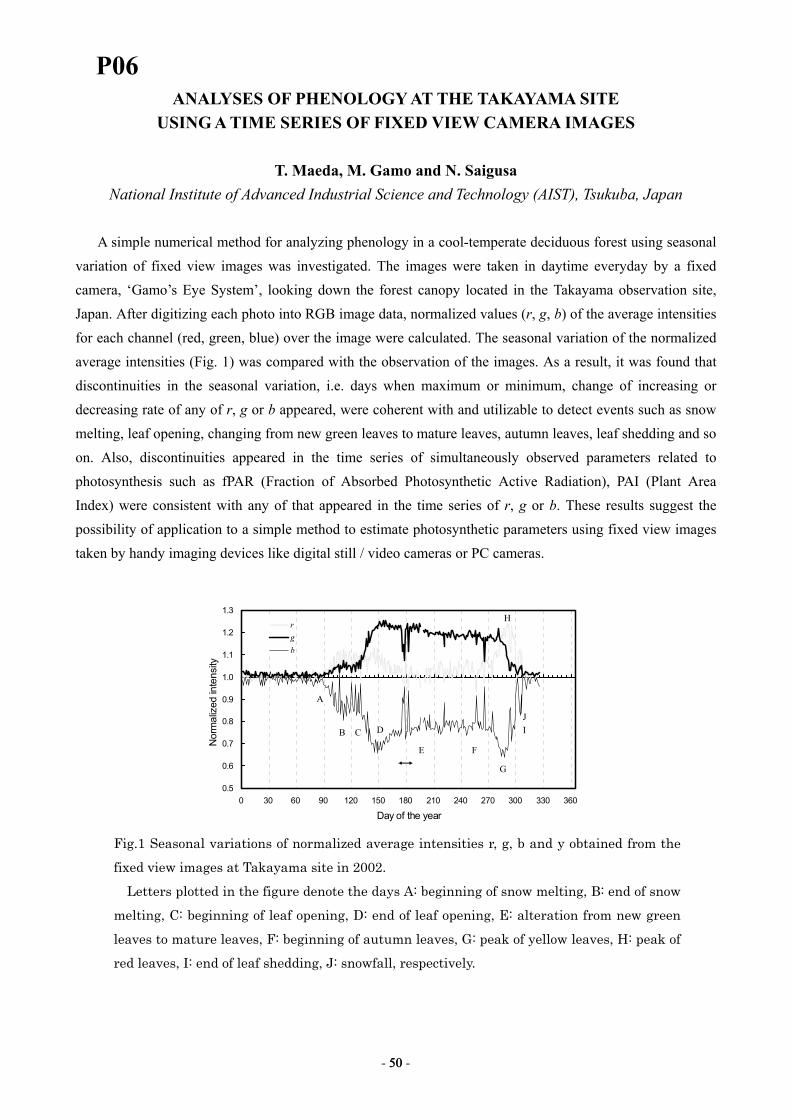
ANALYSES OF PHENOLOGY AT THE TAKAYAMA SITE USING A TIME SERIES OF FIXED VIEW CAMERA IMAGES
T. Maeda, M. Gamo and N. Saigusa National Institute of Advanced Industrial Science and Technology (AIST), Tsukuba, Japan
A simple numerical method for analyzing phenology in a cool-temperate deciduous forest using seasonal variation of fixed view images was investigated. The images were taken in daytime everyday by a fixed camera, ‘Gamo’s Eye System’, looking down the forest canopy located in the Takayama observation site, Japan. After digitizing each photo into RGB image data, normalized values (r, g, b) of the average intensities for each channel (red, green, blue) over the image were calculated. The seasonal variation of the normalized average intensities (Fig. 1) was compared with the observation of the images. As a result, it was found that discontinuities in the seasonal variation, i.e. days when maximum or minimum, change of increasing or decreasing rate of any of r, g or b appeared, were coherent with and utilizable to detect events such as snow melting, leaf opening, changing from new green leaves to mature leaves, autumn leaves, leaf shedding and so on. Also, discontinuities appeared in the time series of simultaneously observed parameters related to photosynthesis such as fPAR (Fraction of Absorbed Photosynthetic Active Radiation), PAI (Plant Area Index) were consistent with any of that appeared in the time series of r, g or b. These results suggest the possibility of application to a simple method to estimate photosynthetic parameters using fixed view images taken by handy imaging devices like digital still / video cameras or PC cameras.
0.5
0.6
0.7
0.8
0.9
1.0
1.1
1.2
1.3
0 30 60 90 120 150 180 210 240 270 300 330 360
Day of the year
Nor
mal
ized
inte
nsity
rgb
A
B C D
E F
G
H
IJ
Fig.1 Seasonal variations of normalized average intensities r, g, b and y obtained from the
fixed view images at Takayama site in 2002.
Letters plotted in the figure denote the days A: beginning of snow melting, B: end of snow
melting, C: beginning of leaf opening, D: end of leaf opening, E: alteration from new green
leaves to mature leaves, F: beginning of autumn leaves, G: peak of yellow leaves, H: peak of red leaves, I: end of leaf shedding, J: snowfall, respectively.
P06
50- 50 -
RESEARCH PLAN AND STRATEGY OF THE FOREST OBSERVATION METHOD USING REMOTE SENSING IN THE FUJI-HOKUROKU SITE
H. Oguma1 and Y. Fujinuma1
1National Institute for Environmental Studies, Tsukuba, Japan
Remote sensing techniques are expected to play an important role in establishing the carbon sink assessment system for the Kyoto Protocol and the study of the carbon cycle on both the regional and global scale. So far, the technique for monitoring photosynthetic activity and phenological change of larch trees by passive remote sensing and the aboveground biomass measurement techniques by laser remote sensing were developed and verified at the Tomakomai Flux Research Site. We are going to develop remote sensing research of two themes like Tomakomai also at the new site in Fuji-hokuroku. The outline of two themes is described below. 1)Assessment of aboveground biomass
The airborne laser-profiler is a remote sensing technology that promises to increase the accuracy of wide-area biomass measurements. It can measure to an accuracy of about 15 cm in the vertical direction and 3cm in the horizontal direction. We are planning to observe 200ha around new Fuji flux research site with airborne laser-profiler, and high spatial resolution digital camera in this August or September. The laser-profiler provides us with the canopy height, the digital surface model (DSM), and the digital terrain model (DTM). The airborne digital camera acquires multispectral image with a resolution of 5cm from the altitude of 500m and is expected generating the three dimension model of 15cm resolution. By analyzing these data, the aboveground biomass of the larch forest is calculated and making it into the fiducial data of the year which began to measure CO2 flux is expected. 2)Evaluation of forest ecosystems using hyper spectral reflectance
The hyper spectral reflectance over the forest is expected to obtain the information, related to the health condition, leaf biochemical contents ratio and photosynthetic activity. Hemispherical spectro radiometer system which covers the wavelength range from approximately 350nm to 1100nm with a spectral resolution of 7nm was developed in order to take the hyper-spectral reflectance of the forest canopy in the daytime automatically by cooperation with Phenological Eyes Network (PEN).
Two spectroscopes are mounted in the highest floor of the flux tower and observe hyper reflectance spectra of the canopy at intervals of 2 minutes. The goal of this research is comparing various vegetation indexes such as NDVI, PRI, WI with CO2 flux using this data. References 1) Satoshi Tsuchida, Kenlo Nishida, Koki Iwao, Wataru Kawato, Hiroyuki Oguma, Akira Iwasaki, 2005,
Phenological Eyes Network for Validation of Remote Sensing Data. Journal of the Remote Sensing society of Japan,25(3), 282-288.
P07
51- 51 -
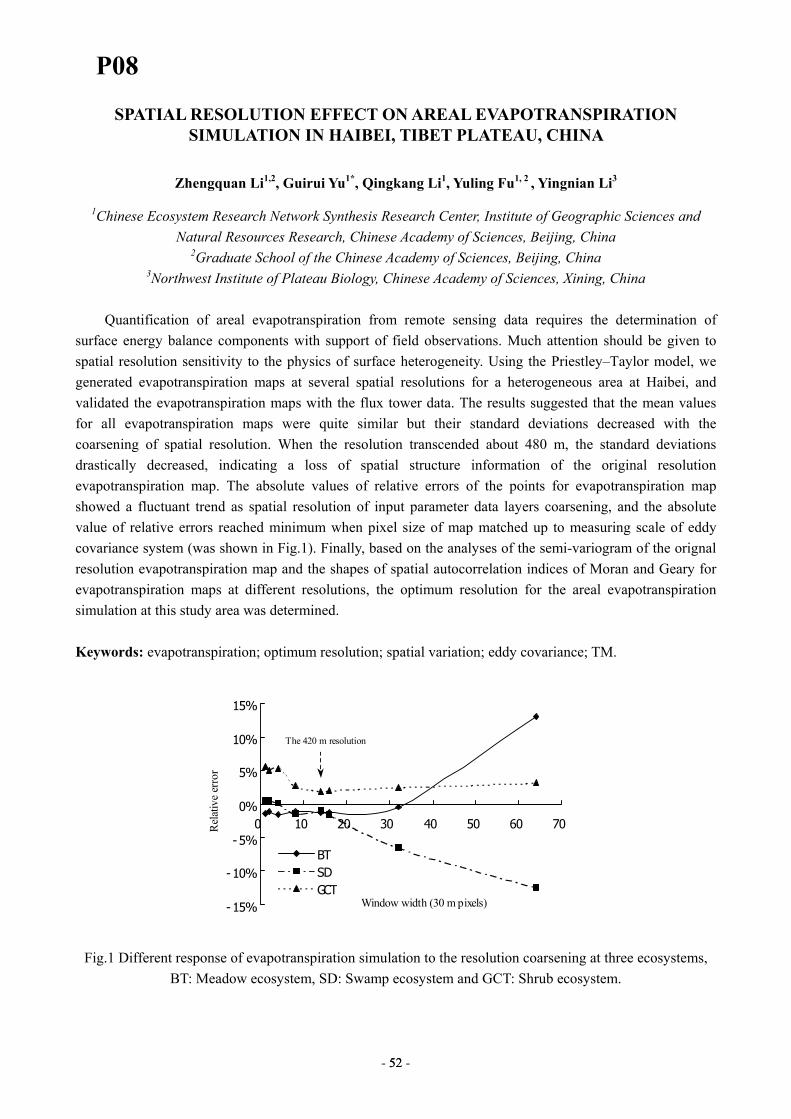
SPATIAL RESOLUTION EFFECT ON AREAL EVAPOTRANSPIRATION SIMULATION IN HAIBEI, TIBET PLATEAU, CHINA
Zhengquan Li1,2, Guirui Yu1*, Qingkang Li1, Yuling Fu1, 2 , Yingnian Li3
1Chinese Ecosystem Research Network Synthesis Research Center, Institute of Geographic Sciences and Natural Resources Research, Chinese Academy of Sciences, Beijing, China
2Graduate School of the Chinese Academy of Sciences, Beijing, China 3Northwest Institute of Plateau Biology, Chinese Academy of Sciences, Xining, China
Quantification of areal evapotranspiration from remote sensing data requires the determination of
surface energy balance components with support of field observations. Much attention should be given to spatial resolution sensitivity to the physics of surface heterogeneity. Using the Priestley–Taylor model, we generated evapotranspiration maps at several spatial resolutions for a heterogeneous area at Haibei, and validated the evapotranspiration maps with the flux tower data. The results suggested that the mean values for all evapotranspiration maps were quite similar but their standard deviations decreased with the coarsening of spatial resolution. When the resolution transcended about 480 m, the standard deviations drastically decreased, indicating a loss of spatial structure information of the original resolution evapotranspiration map. The absolute values of relative errors of the points for evapotranspiration map showed a fluctuant trend as spatial resolution of input parameter data layers coarsening, and the absolute value of relative errors reached minimum when pixel size of map matched up to measuring scale of eddy covariance system (was shown in Fig.1). Finally, based on the analyses of the semi-variogram of the orignal resolution evapotranspiration map and the shapes of spatial autocorrelation indices of Moran and Geary for evapotranspiration maps at different resolutions, the optimum resolution for the areal evapotranspiration simulation at this study area was determined.
Keywords: evapotranspiration; optimum resolution; spatial variation; eddy covariance; TM.
Fig.1 Different response of evapotranspiration simulation to the resolution coarsening at three ecosystems, BT: Meadow ecosystem, SD: Swamp ecosystem and GCT: Shrub ecosystem.
- 15%
-10%
-5%
0%
5%
10%
15%
0 10 20 30 40 50 60 70
BTSDGCT
Window width (30 m pixels)
Rel
ativ
e er
ror
The 420 m resolution
P08
52- 52 -
RESPONSE CHARACTERISTICS OF PORTABLE CO2 SENSORS
Y. Mizoguchi and Y. Ohtani Forestry and Forest Products Research Institute, Tsukuba, Japan
Portable infrared CO2 sensors are often used for soil CO2 efflux measurements; however, such inexpensive
small sensors are often relatively inaccurate and exhibit a slow response. The output signals are delayed both from diffusion processes in the sample cell and from internal averaging calculations for stable data output. Therefore, for accurate estimations of the CO2 efflux, we need to know the actual increase in the CO2 concentration in a chamber without these composite delays.
First, we conducted laboratory experiments to check the accuracy of each sensor, namely, GMD20, GMT222, GMM222, GMP343 (Vaisala), and Li820 (LiCor). The outputs of GMD20, GMT222, and GMM222 were monitored when the standard gas concentrations were 0, 353.3, 420.5, and 950 ppm. The errors ranged from 5 ppm to 140 ppm. After calibration, the maximum error reduced to 20 ppm or less. The error of GMP343 was below 1% after calibration. GMP343 had the highest accuracy among the Vaisala sensors. The error of Li820 was below 0.1%. Hence, the accuracy of Li820 was higher than that of GMP343.
Next, we conducted response experiments to parameterize composite delays under diffusion and flow-through conditions. Since Li820 has a quicker response in comparison with the other sensors, it was excluded from these experiments. The response time of a sensor when installed with a dust filter was longer than that without a dust filter. Furthermore, the response time of a sensor under the diffusion condition was longer than that under the flow-through condition. We developed a backward estimation method (BCDC: Backward calculation for delay compensation) for estimating the actual increase in the CO2 concentration by using delayed sensor outputs. The actual CO2 concentration is given by the following equation in BCDC:
Ct’ = C0 + (Ct + b + C0)/(1 – exp(–aT )) where a and b are the constants of each sensor; Ct’, the expected CO2 concentration in the chamber if the output of the sensor is not delayed; C0, the initial CO2 concentration in the chamber; Ct + b, the CO2 concentration in the chamber at t + b (s); and T, temperature (°C). The constants a and b of GMP343 diffusion type with a dust filter under diffusion condition were 0.0076 and 0 s, respectively, while those without the dust filter were 0.0133 and 0 s, respectively. Further, the constants a and b of GMP343 flow-through type under the flow-through condition were 0.2210 and 0s, respectively, and those of GMM222 probe type C with a dust filter were 0.0421 and 21 s, respectively.
We calculated the soil CO2 efflux with the sensor outputs and modified CO2 concentration by BCDC, using a nonlinear regression under diffusion model. The soil CO2 effluxes calculated with the sensor outputs (Fcal) were always smaller than those calculated with the actual CO2 concentration (Fmodel). The difference between Fcal and Fmodel decreased when the sampling interval was long. A long sampling interval may reduce errors; however, it is inefficient and sometimes has a negative effect because the closure of the chamber for a long period leads to changes in the chamber environment. This suggests that a short sampling interval leads to a large underestimate of the soil CO2 efflux when the efflux is calculated with non-corrected data using the nonlinear regression. Thus, the correction of the sensor response with the backward estimation method provides an effective solution for archiving an accurate estimation of the soil CO2 efflux using the sensors that are slow to respond.
P09
53- 53 -
RELATIVE CONTRIBUTION OF ROOTS ON SOIL RESPIRATION IN A COOL-TEMPERATE DECIDUOUS FOREST IN KOREA
Jae-Man Lee1, Sung-Min Yu1 and Seong-Deog Kim1
1Chungnam National University, Daejeon, Korea
The soil CO2 efflux is a major source of CO2 in terrestrial ecosystems and a key component of the carbon balance. The soil CO2 efflux is resulted from the combinations of biological and physiological processes with high spatial and temporal variations. The objectives of this study were (1) to qualify the relationship between soil CO2 efflux and environmental factors, such as soil temperature, and (2) to estimate the relative contribution of root respiration in soil CO2 efflux. The study was carried out in a Quercus mongolica forest at Daegwallyeong Flux Measurement Site (DFMS), which is the typical cool-temperate deciduous forest in Korea. The measurements were carried out from August 2003 to August 2005. The soil CO2 efflux and heterotrophic respiration were measured continuously with a multichannel automatic chamber system through the whole year. The soil CO2 efflux was increased exponentially with increase in soil temperature. We found a significant relationship between soil temperature and soil CO2 efflux, root respiration and heterotrophic respiration, respectively. Annual soil CO2 efflux and heterotrophic respiration in 2004 was 5.3 and 2.4 tC ha-1, respectively. Annual root respiration in 2004 was estimated to be 2.9 tC ha-1 that accounted for about 55% of soil CO2 efflux.
P10
54- 54 -
SEASONAL CHANGE IN THE CONTRIBUTION OF ROOT RESPIRATION TO SOIL RESPIRATION IN A TEMPERATURE FOREST IN JAPAN
M. Dannoura1, Y. Kominami2, K. Tamai3, M. Jomura1, T. Miyama2, Y. Goto2, and Y. Kanazawa1
1Graduate School of Science and Technology, Kobe University, Kobe, Japan 2Kansai Research Center, Forestry & Forest Products Research Institute, Kyoto, Japan
3Kyushu Research Center, Forestry & Forest Products Research Institute, Kumamoto, Japan
INTRODUCTION CO2 flux from root, considered a part of soil respiration (Rs), plays an important role in the carbon cycle of forest. Hanson et al. (2000) concluded in their review that the contribution of root respiration (Rr) to Rs might converge at approximately 48.5% in the forest ecosystem. However, it is difficult to build the technique to separate accurately Rr from Rs. We had measured root respiration according to root thickness and it was shown that fine root had an important role in root respiration (Dannoura et al., 2003). In this study, we developed a new method for temporal Rr of fine root and evaluated the contribution of Rr to Rs. SITE DESCRIPTION Measurements were conducted at Yamashiro Experimental Forest (YEF) in Kyoto, which is a mixed forest of deciduous and evergreen broad-leaved trees including some conifers. The soil is immature and originated from granite. DBH (Diameter at breast high) of all trees (DBH > 1.0 cm) were measured in this research site in 1999 (Goto et al., 2003). METHODS We developed an automatic chamber system for measuring CO2 flux from fine root. It consisted of an IRGA (Li-820), a pump, and 5 chambers that were alternately operated. To measure only Rr, forest soil of A layer including organic matter was removed, and only living root was remained. Instead of removed soil, the space was stuffed with decomposed granite soil. Acrylic board was put between A and B layer to elude the influence of CO2 flux from below B layer (mineral soil). At the same time, Rs and CO2 flux from B layer were measured. We set up 3 chambers for Rr, 1 chamber for Rs, and the last one for CO2 flux from B layer. At each chamber, CO2 flux was measured at 35-min intervals, soil temperature and water content were measured continuously from April 2004 to May 2005. RESULT AND DISCUSSION From annual measurement of CO2 flux using automatic chamber system, Rr of fine root responded exponentially to soil temperature. High soil moisture during and just after rainfall became limiting factor in Rr. Rs responded exponentially to soil temperature, too. There was positive relationship between soil water content and Rs. CO2 flux from B layer did not make response to soil temperature and soil water content. From annual measurement, relationship between Rr and soil temperature did not change seasonally and Rr reached its peak at summer same as soil temperature. On the other hand, Rs showed clearly hysteresis to soil temperature. Therefor, yearly peak of Rs reached earlier than that of soil temperature. The ratio of Rr to Rs changed from about 20% to 70% through a year. The decomposition rate might be accelerated by high temperature and high soil water content in rainy season (June and July), so most litter was decomposed by summer. We suspected that the change in Rr/Rs ratio was caused by seasonal change of the amount of decomposed litter. These results suggested the importance of analysis of long-term measurement for discussion about the role of Rr in forest ecosystem. REFERENCES Dannoura, M., K. Kominami, M. Suzuki, T. Miyama, K. Tamai, Y. Goto, Y. Kanazawa (2003), Measurement of
root respiration according to root thickness-Observation in Yamashiro Experimental Forest(5)-. Abstract of International Workshop on Flux Observation and Research in Asia.
Hanson P.J., N. T. Edwards, C. T. Garten and J. A. Andrews (2000), Separating root and soil microbial contribution to soil respiration: A review of methods and observations. Biogeochemistry, 48, 115-146, 2000.
Goto, Y., Y. Kominami, T. Miyama, K. Tamai, and Y. Kanazawa (2003), Above ground biomass and net primary production of broad-leaved secondary forest in the southern part of Kyoto prefecture, central Japan. Bull. FFPRI, 387, 115-147. (in Japanese, with English summary).
P11
55- 55 -
CONTINUOUS MEASUREMENT OF CO2 EVOLUTION FROM A JAPANESE CEDARFOREST FLOOR USING A CHAMBER SYSTEM WITH AUTOMATIC OPEN AND
CLOSING BASED ON AN OPEN-FLOW METHOD
M-S. Lee1, J-S. Lee2 and H. Koizumi1
1Institute for Basin Ecosystem Studies, Gifu University, Gifu, Japan2Department of Biological Sciences, College of Science, Konkuk University, Seoul, Korea
The carbon stock of Japanese cedar (Cryptomeria japonica D. Don) forests represents 24% (308 to 364 ×106
Mg C) of the total Japan forests, with an area-weighted mean of 77 Mg C ha-1 (Fukuda et al., 2003; Fang et al.,2005). However, there are only a few studies concerning soil respiration in Japanese cedar forests (Simono etal., 1989; Ohashi et al., 1999; Shutou and Nakane 2004). The static CO2 absorption method (Shutou andNakane, 2004) and manual open-flow method (Simono et al., 1989; Ohashi et al., 1999) have been used tomeasure soil respiration for once a month on a just fine day. Some reports, however, demonstrated that the staticCO2 absorption method might be inadequate for field measurements (Edwards and Sollins, 1973; Nakadai et al.,1993). It has been also confirmed that CO2 concentration in the chamber (Hanson et al., 1993; Nakadai et al.,1993) and rainfall (Lee et al., 2002) significantly affect soil respiration rate. Moreover, the measurement atnight or on rainy days is strongly limited with these methods because human intervention is required. Thus, it isimportant to consider both short-term and long-term measurements that account for changes in variousenvironmental factors. To accomplish these subjects, we established a chamber system with automatic open andclosing for measuring continuous soil respiration based on an open-flow method (AOCC) described in theprevious study (Suh et al., in press). In the present study, our object is to examine seasonal changes in soilrespiration of a Japanese cedar forest using the new chamber system. We also evaluated the relationshipbetween soil respiration rates and environmental factors, such as soil temperature and soil moisture.
The study area was a Japanese cedar plantation located in Takayama city, central Japan (36o 08’ N, 137o 22’E). The plantation was approximately 50 years old. This region refer to a cool temperate zone, Asia monsoonclimate. The annual mean of air temperature and precipitation for 44 years (1961–2004) were 11ºC and 1745mm, respectively (data from Japan Meteorological Agency). The ecological-process research plot wasestablished on the middle of a slope (30 m×50 m) in November 2004. The altitude of plot ranged from 800 to850 m. The slope inclination ranged from 10o to 20o. The slope direction is south-east. The site had 1153 treesha-1 with ca. 20-25 m in height. The study site was rice terrace before conducted Japanese cedar plantation.
The AOCC system is composed of three main parts: a chamber system, plus pumping and timer systems.Each chamber system consisted of three parts: chamber, cell, and soil collar. The chamber systems have anelongated octagonal shape (20×30×8 cm, L×W×H) to avoid the stagnation of circulation in any zones. A topframe encloses the upper part of the chamber and supports a fixed, 12V DC motor and two limit switches. Anacrylic lid (0.5 cm thick) is supported on both short sides of the top frame. Further descriptions on the systemare given by Suh et al. (in press). We installed the six chambers at locations with east-facing slope (n = 3,subplot: 15 m×10 m) and north-facing slope (n = 3, subplot: 10 m×10 m) on 25 April 2005. To establish eachchamber, we inserted the collars at the depth of 6 to 8 cm below the top of the litter layer, cutting through thesurface litter and roots. We operated the AOCC over a period of about 4 months, from May to August in 2005.Each chamber measurements during 30-min and then one measurement cycle of 3 hours were repeated. Analysisdata were used when the CO2 concentration at the air outlet reached a steady state. The raw CO2 signals fromthe IRGAs (LI-820) were sampled every 10s and averaged every 1-min. We measured air temperature at theheight of 30 cm near the chambers and soil temperatures at depth of 5 cm in the chambers. Continuousmeasurements of soil temperature and water content by TDR were carried out near the chambers at a soil depthof 5 and 10 cm below the top of the litter layer at 30-min intervals over the entire study period.
In this study site, no marked diurnal trends in the soil respiration rates were observed on days withoutrainfall. In contrast, significant changes in soil respiration rates were detected on days with rainfall events. Theexponential relationship between soil temperature and soil respiration rates accounted for approximately 50 %of the soil respiration rate variability. Also, soil respiration rates in east-facing slope tended to be higher thanthose in north-facing slope. Our results indicated that soil respiration rates are strongly related to not only soiltemperature but also soil water content and/or precipitations.
P12
56- 56 -
LONG-TERM MEASUREMENTS OF SOIL RESPIRATION IN AN AGROFOREST ECOSYSTEM IN KOREA
Hyeong-Ho Seo1, In-Kook Song2, Joo-Yong Lee2 and Seong-Deog Kim2
1 National Horicultural Research Institute, Suwon, Korea
2Chungnam National University, Daejeon, Korea
The soil CO2 efflux is a major source of CO2 in agroforest ecosystems and a key component of the carbon balance. The soil CO2 efflux is resulted from the combinations of biological and physiological processes with high spatial and temporal variations. The objective of this study was to determine the relationships between soil CO2 efflux and environmental factors, such as soil temperature, soil moisture, air temperature and depth of soil A1 layer in spatial variation. This study was carried out at the flux measurement site in an apple agroforest ecosystem (AFMS), in Euiseong, Korea. The measurements were carried out from August 2004 to August 2005. The soil CO2 efflux was measured with a multichannel automatic chamber system through the whole year. We found that the soil CO2 efflux was increased exponentially with increase in soil temperature. Soil CO2 efflux Q10, derived from all measurements, was 3.5 during the measurement period.
P13
57- 57 -
SOIL CO2 EFFLUX IN A TEMPERATE FOREST ECOSYSTEM UNDER MONSOON CLIMATE IN NOTRHEAST ASIA
N. Chae and J. Kim
Global Environment Laboratory and Department of Atmospheric Sciences, Yonsei University, Seoul, Korea
Soil CO2 efflux is the primary component (≈70%) of ecosystem respiration in forests. Quantitative and qualitative understanding of soil carbon emission is therefore critical for identifying carbon sink/source strength of forest ecosystems in the context of climate change protocols. Although soil temperature is the major controlling factor in the annual soil carbon emission, a realistic long-term estimation under monsoon climate must take the effect of precipitation into account. The objectives are to estimate annual carbon emission from deciduous broad-leaved forest floors and to investigate the influence of monsoon climate on interannual variability of soil CO2 efflux. The annual soil carbon emission from site for three years averaged about 871 g C m-2 with an annual variability of the order of 10%. Such variation, however, could not be explained by the annual variations of soil temperature, suggesting the potential influence of other controlling factors such as soil water content. However, no clear relationship was apparent between soil CO2 efflux and soil water content due to the confounding effect of both positive and negative correlations. The variability of soil carbon emission was then related to changes in magnitude, duration, and frequency of precipitation particularly during Changma, the rainy spell in summer. Contrary to our expectation with moderate and persistent rainfalls, an excess of soil water rather restrained CO2 efflux. These results clearly indicate that the changes in intensity and frequency of precipitation can significantly alter the carbon sink/source strength of forest ecosystems in monsoon. This study is supported by “The Eco-Technopia 21 Project” from the Ministry of Environment, Korea.
P14
58- 58 -
INFLUENCE OF SOIL TEMPERATURE AND MOISTURE ON SPATIAL VARIATION OF CO2 EFFLUX ON FOREST FLOOR IN SMALL CATCHMENT
-IN CASE OF YAMASHIRO EXPERIMENTAL FOREST, MAY 2004-APRIL 2005-
K. Tamai1, Y. Kominami2, T. Miyama2 and Y. Goto2 1Kyusyu Research Center, Forestry & Forest Products Research Institute, Kumamoto, Japan
2Kansai Research Center, Forestry & Forest Products Research Institute, Kyoto, Japan 1. Site Description and Methodology The CO2 efflux on the forest floor (Fc: mg CO2 m-2 s-1) was observed at the plots settled on a ridge and in a valley in the Yamashiro Experimental Forest, located at 34° 47' N, 135° 50' E, in southern Kyoto Prefecture, Japan. The distance between the two plots was 70 m horizontally and 35 m vertically. The region is covered by a deciduous broad-leaved secondary forest dominated by oak. In 1999, the total basal area and aboveground biomass of stems with a diameter at breast height (DBH) greater than 3 cm were 20.7 m2 ha-1 and 105.05 t ha-1, respectively. The same authors recorded the average litterfall, mean temperature, warmth index, and annual precipitation for 1999-2002 as 5.16 t ha-1 year-1, 5.5°C, 125.6°C month-1, and 1449.1 mm, respectively. The forest soil originates from granite, and has an immature structure. The forest floor at the experimental forest was consistent with this regolith, and the organic carbon content was less than 2.75%. The CO2 efflux was measured using an automated chamber with an enclosed infra-red gas analyzer (IRGA; Tamai et al., 2005a), which is classified as a closed static method. Soil temperature (Ts: ºC) and soil moisture (θ: m3 m-3) at 5-cm depth were also measured near the automated chamber. The data for May 2004 to April 2005 was analyzed in this study.
2. Results and Discussion
The average rate and standard deviation of “Fcv - Fcr” was calculated for every 5-6 days, where Fcv and Fcr are the CO2 efflux in the valley and on the ridge, respectively. A clear difference between Fcv and Fcr was defined as the range of standard deviation that did not include “Fcv - Fcr = 0 mg CO2 m-2 s-1”. Fcv was up to 0.04 mg CO2 m-2 s-1 larger than Fcr from July to September 2004, while Fcr was slightly larger than Fcv (less than 0.01 mg CO2 m-2 s-1) from November 2004 to March 2005.
Tamai et al. (2005b) reported Eq. (1) based on observations at five plots in Yamashiro Experimental Forest, including the two plots observed in this study.
( )1089.0
0717.0exp0566.0+
=θ
θsc TF (1)
“FTs - Frcal” and “Fθ - Frcal” were calculated when Fcr and Fcv clearly differed. FTs, Tθ and Frcal were calculated by substituting the respective values of Ts in the valley and θ at the ridge, Ts at the ridge and θ in the valley, and Ts and θ at the ridge, respectively into Eq. (1). “FTs - Frcal” and “Fθ - Frcal” are thought to indicate the effects of soil temperature and soil moisture on “Fcv - Fcr”, respectively. The calculated results show that “FTs - Frcal” and “Fθ - Frcal” had marked effects on “Fcv - Fcr” from November 2004 to March 2005 and from July to September 2004, respectively. This means that the cause of the difference between Fcv and Fcr was the spatial difference in soil temperature and soil moisture during the respective periods. References Tamai K., Y. Kominami, T. Miyama and Y. Goto (2005a), Temporal fluctuations in the CO2 efflux on a forest floor -The case of an extreamly immature forest soil-, J. Agricultural meteorology, 60, 773-776. Tamai K., Y. Kominami, T. Miyama and Y. Goto (2005b), The estimation of time series data of soil respiration based on soil temperature and soil moisture content ratio and its spatial variations in a small mountanious catchment –In the case of weathered granite region in southern Kyoto Pref.- (in Japanese with English summary), J. Japanese Forest Society, 87, in press.
P15
59- 59 -
EXPORT OF DISSOLVED ORGANIC CARBON FROM KOREAN NATURAL FOREST CATCHMENT DURING STORM EVENTS
S. J. Kim1, I. H. Choi2, J. Y. Yoo3, and K. H. Kim3
1Global Environment Laboratory/Department of Atmospheric Sciences, Yonsei University, Seoul, Korea 2Department of Earth System Sciences, Yonsei University, Seoul, Korea
3Forest Water Resources Laboratory, Korea Forest Research Institute, Seoul, Korea
The carbon exchange between terrestrial ecosystems and the atmosphere has been quantified in various biomes and climate regions. The movement of water also exports dissolved organic carbon (DOC), dissolved inorganic carbon (DIC), and particulate organic carbon (POC) from the soil. These materials contribute significantly to the carbon cycle, because the transport of soil-derived organic matter by rivers and its subsequent burial in coastal sea sediments is an important sink for carbon. The presented data have shown that these carbon fluxes through rivers are an important component in the global carbon cycle. Therefore, we intensively measured DOC, anions and cations in soil water, groundwater and streamwater during storm events, especially in Monsoon.
This study was conducted in the Gwangneung deciduous forest catchment (22ha), located in the Gyeonggi-do near Seoul metropolitan (elevation: 280 ~ 470m; 37° 44' N, 127° 09' E). The mean annual air temperature was 11.5℃, and average annual precipitation was 1436 mm between 1970 and 2002. Much of precipitation concentrates in summer Monsoon. The Gwangneung deciduous forest catchment was prohibited forest management such as thinning, and preserved naturally. The Gwangneung deciduous forest catchment is covered with weathered gneiss over the whole area. Hillsides with slopes 10~20° account for 80% of the total area, while maximum slope was 51°. The soil texture is sandy loam.
We found high concentration of DOC in shallow soil water during pre-events, and it ranged from 20 to 80 mg·L-1. However, DOC concentrations in groundwater decreased with increasing well depth. It seems to be that decreasing of DOC concentrations with well depth due to adsorption and decomposition process in soil layer. It showed decreasing of DOC concentration in shallow soil water during storm events. Although DOC concentrations in streamwater were showed below 1 mg·L-1 during base flow, they were drastically increased to 6 mg·L-1 with increasing runoff discharge during storm events. The maximum carbon efflux through DOC was investigated 0.6 kg·10min.-1 with runoff discharge 1.05 mm·10min.-1. Furthermore, DOC concentration in spring water increased about 10 times after storm events. These results suggest that DOC discharge through lateral flow significantly contributes carbon efflux during storm events. Our result also suggests that Monsoon is important component to evaluate the carbon flux in Korean natural forest.
P16
60- 60 -
Fluxes of CH4 and N2O from soil under tropical seasonal rain forest
in Xishuangbanna, Yunnan, SW China*
YupingYana,c, Liqing Shaa, Min Caoa, Zheng Zhenga, Jianwei Tanga, Yinghong Wangb, Yiping
Zhanga, Rui Wanga, Guangren Liub, Yuesi Wangb & Yang Sunb a Xishuangbanna Tropical Botanical Garden, Chinese Academy of Sciences, Kunming 650223, China
b Institute of Atmospheric Physics, Chinese Academy of Sciences, Beijing 100029, China
c Graduate School, Chinese Academy of Sciences, Beijing 100039, China
Abstract: CH4 and N2O fluxes from soil under tropical seasonal rain forest in Xishuangbanna, SW China, were
measured for 1 year by using the closed static chamber technique and gas chromatography method. Three
treatments were set in the studied field: (A) litter free, (B) with litter, (C) with litter and seedling. The results
show that the soil in our study was a sink of atmospheric CH4 and a source of atmospheric N2O. The observed
mean CH4 fluxes from treatments A, B, and C were –57.5 ± 6.9, –35.9 ± 2.8, –31.6 ± 2.8 µg CH4–C m–2 h–1
(Mean ± SE), respectively, and calculated annual fluxes in 2003 were –5.19, –3.15, and –1.44 kg C ha-1,
respectively. The observed mean N2O fluxes from treatments A, B, and C were 30.9 ± 3.1, 28.2 ± 3.5, 51.9 ± 4.1
µg N2O–N m–2 h–1, respectively, and calculated annual fluxes in 2003 were 2.92, 2.64, and 4.36 kg N ha-1,
respectively. Seasonal variations in CH4 flux were significant in all three treatments and seasonal variations in
N2O fluxes only existed in treatment C. Litter decreased CH4 uptake, which were mainly observed in the wet
season. Seedlings increased N2O emission, which occurred in the dry season. A strong positive relationship
existed between CH4 fluxes and soil moisture for all three treatments, and between CH4 fluxes and soil
temperature for treatment A and treatment C. N2O fluxes correlated with soil temperature for all three
treatments.
Key words: Greenhouse gases; Seasonal variability; Tropical seasonal rain forest; Xishuangbanna
* This work was supported by the Knowledge Innovation Project of Chinese Academy of Sciences (Grant No.
KZCX1–SW–01) and the National Key Basic Research & Development Program (Grant No. G2002CB412501).
P17
61- 61 -
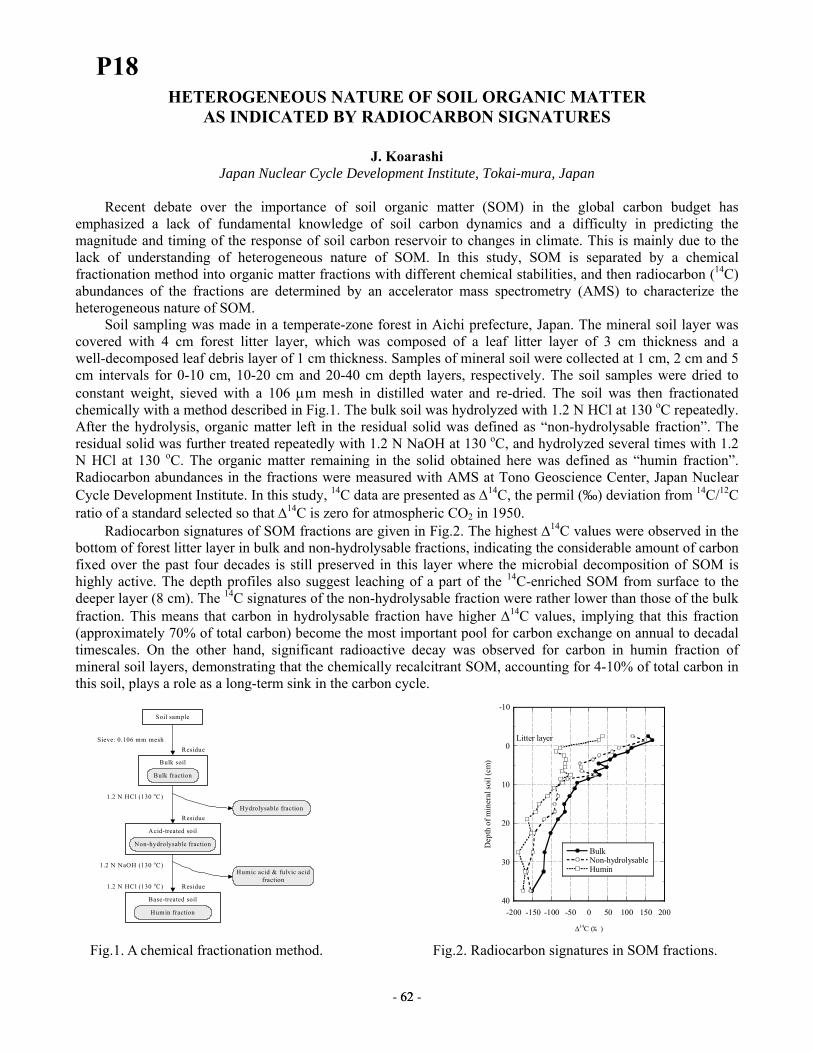
HETEROGENEOUS NATURE OF SOIL ORGANIC MATTER AS INDICATED BY RADIOCARBON SIGNATURES
J. Koarashi
Japan Nuclear Cycle Development Institute, Tokai-mura, Japan
Recent debate over the importance of soil organic matter (SOM) in the global carbon budget has emphasized a lack of fundamental knowledge of soil carbon dynamics and a difficulty in predicting the magnitude and timing of the response of soil carbon reservoir to changes in climate. This is mainly due to the lack of understanding of heterogeneous nature of SOM. In this study, SOM is separated by a chemical fractionation method into organic matter fractions with different chemical stabilities, and then radiocarbon (14C) abundances of the fractions are determined by an accelerator mass spectrometry (AMS) to characterize the heterogeneous nature of SOM. Soil sampling was made in a temperate-zone forest in Aichi prefecture, Japan. The mineral soil layer was covered with 4 cm forest litter layer, which was composed of a leaf litter layer of 3 cm thickness and a well-decomposed leaf debris layer of 1 cm thickness. Samples of mineral soil were collected at 1 cm, 2 cm and 5 cm intervals for 0-10 cm, 10-20 cm and 20-40 cm depth layers, respectively. The soil samples were dried to constant weight, sieved with a 106 µm mesh in distilled water and re-dried. The soil was then fractionated chemically with a method described in Fig.1. The bulk soil was hydrolyzed with 1.2 N HCl at 130 oC repeatedly. After the hydrolysis, organic matter left in the residual solid was defined as “non-hydrolysable fraction”. The residual solid was further treated repeatedly with 1.2 N NaOH at 130 oC, and hydrolyzed several times with 1.2 N HCl at 130 oC. The organic matter remaining in the solid obtained here was defined as “humin fraction”. Radiocarbon abundances in the fractions were measured with AMS at Tono Geoscience Center, Japan Nuclear Cycle Development Institute. In this study, 14C data are presented as ∆14C, the permil (‰) deviation from 14C/12C ratio of a standard selected so that ∆14C is zero for atmospheric CO2 in 1950.
Radiocarbon signatures of SOM fractions are given in Fig.2. The highest ∆14C values were observed in the bottom of forest litter layer in bulk and non-hydrolysable fractions, indicating the considerable amount of carbon fixed over the past four decades is still preserved in this layer where the microbial decomposition of SOM is highly active. The depth profiles also suggest leaching of a part of the 14C-enriched SOM from surface to the deeper layer (8 cm). The 14C signatures of the non-hydrolysable fraction were rather lower than those of the bulk fraction. This means that carbon in hydrolysable fraction have higher ∆14C values, implying that this fraction (approximately 70% of total carbon) become the most important pool for carbon exchange on annual to decadal timescales. On the other hand, significant radioactive decay was observed for carbon in humin fraction of mineral soil layers, demonstrating that the chemically recalcitrant SOM, accounting for 4-10% of total carbon in this soil, plays a role as a long-term sink in the carbon cycle.
-200 -150 -100 -50 0 50 100 150 200
-10
0
10
20
30
40
Bulk Non-hydrolysableHumin
∆14C (‰)
Dep
th o
f min
eral
soil
(cm
)
Litter layer
Soil sample
Hydrolysable fraction
Humic acid & fulvic acid fraction
Sieve: 0.106 mm meshResidue
1.2 N HCl (130 oC)
1.2 N NaOH (130 oC)
Acid-treated soil
Non-hydrolysable fraction
Base-treated soil
Humin fraction
Bulk soil
Bulk fraction
Residue
Residue1.2 N HCl (130 oC)
Fig.1. A chemical fractionation method. Fig.2. Radiocarbon signatures in SOM fractions.
P18
62- 62 -
IS CARBON STABLE ISOTOPE RATIO OF HETEROTROPHIC RESPIRATION INVARIANT?
~WHAT WE LEARNED FROM OBSERVATIONAL FACTS~
Y. Takahashi, N. Liang, Y. Fujinuma and G. Inoue
National Institute for Environmental Studies, Tsukuba, Japan
To investigate potential variability in 13C/12C ratio of heterotrophic respiration, we measured 13C/12C ratio of CO2 respired from soil at plots with and without “root-exclusion” in a deciduous needle leaf
forest in Japan for 3 years. High-precision measurement coupled with a sampling system optimized for soil
respiration made it possible to detect spatiotemporal variability intrinsic to heterotrophic respiration. Even in
the absence of root respiration, the 13C/12C ratio of soil-respired CO2 had significant seasonal variation with
range greater than previous model estimate. The 13C/12C ratio of soil-respired CO2 at the root-excluded plot
generally showed minimum in early summer but its temperature relationship was not monotonous like that in
the CO2 efflux. Those observational facts would have implications for future validation of model predictions.
Our results also showed that the 13C/12C ratio of soil-respired CO2 had significant short-term variability related
to temperature change and large spatial variation even without influence of root-respiration. Under the
limitations of chamber-based measurement, the spatial variations would give sampling bias that made it
difficult to estimate flux-weighted mean value of the d13C in canopy-or-larger spatial scales. While much
remains to be learned about the natural variations in the 13C/12C ratio of soil-respired CO2, the variations in the 13C/12C ratio of soil-respired CO2 observed in this study likely captured some characteristics intrinsic to
heterotrophic respiration.
P19
63- 63 -
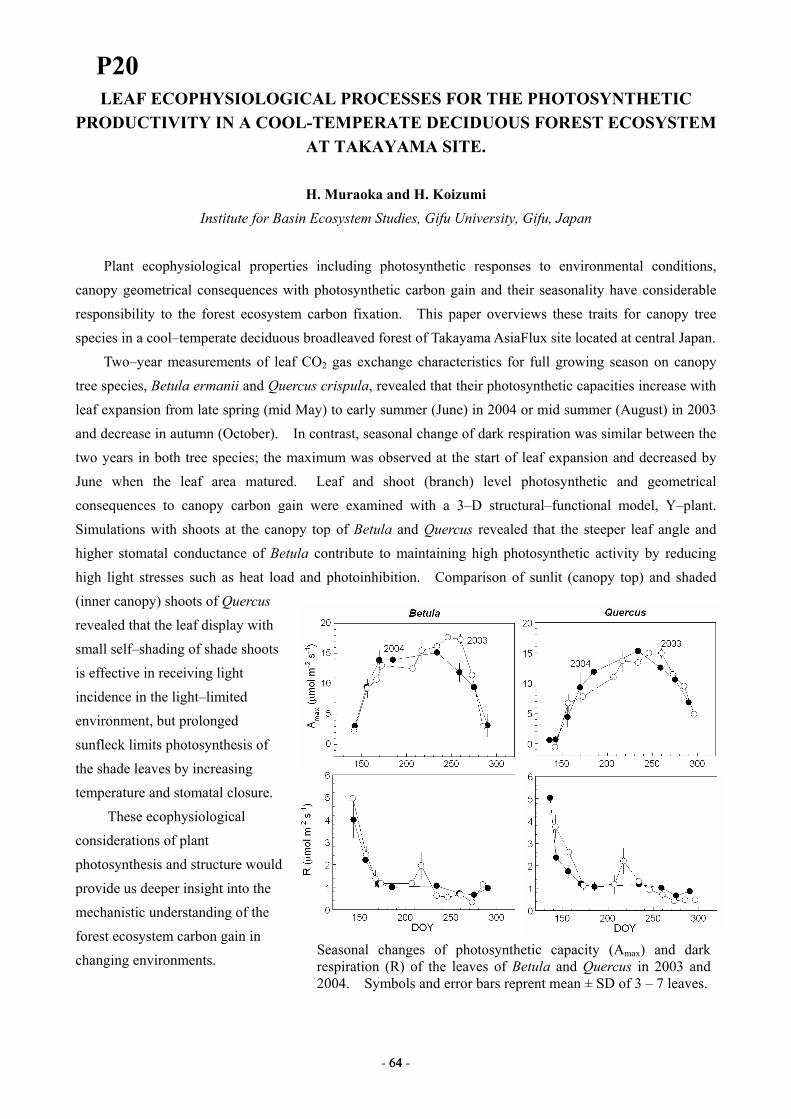
LEAF ECOPHYSIOLOGICAL PROCESSES FOR THE PHOTOSYNTHETIC PRODUCTIVITY IN A COOL-TEMPERATE DECIDUOUS FOREST ECOSYSTEM
AT TAKAYAMA SITE.
H. Muraoka and H. Koizumi Institute for Basin Ecosystem Studies, Gifu University, Gifu, Japan
Plant ecophysiological properties including photosynthetic responses to environmental conditions,
canopy geometrical consequences with photosynthetic carbon gain and their seasonality have considerable responsibility to the forest ecosystem carbon fixation. This paper overviews these traits for canopy tree species in a cool–temperate deciduous broadleaved forest of Takayama AsiaFlux site located at central Japan.
Two–year measurements of leaf CO2 gas exchange characteristics for full growing season on canopy tree species, Betula ermanii and Quercus crispula, revealed that their photosynthetic capacities increase with leaf expansion from late spring (mid May) to early summer (June) in 2004 or mid summer (August) in 2003 and decrease in autumn (October). In contrast, seasonal change of dark respiration was similar between the two years in both tree species; the maximum was observed at the start of leaf expansion and decreased by June when the leaf area matured. Leaf and shoot (branch) level photosynthetic and geometrical consequences to canopy carbon gain were examined with a 3–D structural–functional model, Y–plant. Simulations with shoots at the canopy top of Betula and Quercus revealed that the steeper leaf angle and higher stomatal conductance of Betula contribute to maintaining high photosynthetic activity by reducing high light stresses such as heat load and photoinhibition. Comparison of sunlit (canopy top) and shaded (inner canopy) shoots of Quercus revealed that the leaf display with small self–shading of shade shoots is effective in receiving light incidence in the light–limited environment, but prolonged sunfleck limits photosynthesis of the shade leaves by increasing temperature and stomatal closure.
These ecophysiological considerations of plant photosynthesis and structure would provide us deeper insight into the mechanistic understanding of the forest ecosystem carbon gain in changing environments.
Seasonal changes of photosynthetic capacity (Amax) and dark respiration (R) of the leaves of Betula and Quercus in 2003 and 2004. Symbols and error bars reprent mean ± SD of 3 – 7 leaves.
P20
64- 64 -
SEASONAL VARIATION IN THE NOCTURNAL WOODY-TISSUE RESPIRATION OF A MIXED BROAD LEAVED FOREST
T. Miyama1, Y. Kominami1, K. Tamai2 and Y. Goto1
1Kansai Research Center, Forestry & Forest Products Research Institute, Kyoto, Japan 2Kyusyu Research Center, Forestry & Forest Products Research Institute, Kumamoto, Japan
1. INTRODUCTION To understand how deciduous and evergreen trees control nocturnal CO2 flux in Yamashiro Experimental Forest (YEF), we measured the seasonal variation in the nocturnal woody-tissue respiration of the deciduous and evergreen trees using a static automated chamber method. In this study, we estimated the ratio of growth respiration to total annual nocturnal respiration. 2. SITE DESCRIPTION AND METHODS The YEF is located in a valley in Yamashiro-cho (34°47'N, 135°51'E), Soraku-gun, Kyoto, in a hilly, mountainous region of central Japan and at an elevation of about 220 m asl. The forest consists of deciduous broadleaved species (mainly Q. serrata) and evergreen broadleaved species (mainly I. pedunculosa). We measured the leaf area index (LAI) of the forest once per week with an LAI-2000 (Li-Cor).Based on the seasonal variation in the LAI, and the measured foliar respiration, we were able to estimate total foliar respiration for the forest (Miyama et al., 2005). We also measured the diameter at breast height (DBH) of all trees in the YEF every 5 years (Goto et al., 2003). In this study, we measured seasonal variations in nocturnal stem respiration using static, automated stem chambers in the YEF. The chamber automatically measured nocturnal stem respiration at 30-min intervals. We measured the relationship between DBH and the surface area of woody tissue in the trees, estimated total surface area in the YEF, and scaled up stem respiration to the whole forest level to estimate respiration by woody tissue. We attached the stem chambers to stems of Q. serrata and I. pedunculosa (DBH, 20.7 and 17.9 cm, respectively) at breast height. The air temperature within the stem chamber was measured with a copper-constantan thermocouple. Nocturnal respiration of woody tissue per unit surface area of I. pedunculosa and Q. serrata (FwI and FwQ, respectively) were calculated from the difference in CO2 concentrations between 30 and 210 sec (3 min) in chambers. We collected data continuously from 1 May to 31 December 2003. We measured the relationship between DBH and the surface area of woody tissue on the sample trees. We defined surface areas of trees from the sum of twig surface areas, and measured twig surface areas using slide gauges directly. We used FwE and FwD, respectively, to represent the whole-tree respiration of woody tissue for evergreen and deciduous trees.
3. RESULTS AND DISCUSSION The relationship between DBH(cm) and stand-level surface area of woody tissue (SA, cm2) was expressed by the following allometric equation (SA = 247 DBH2.24, R2 = 0.949). We confirmed the linearity of the relationship between surface area and the respiration rate of woody tissue using destructive stem samples. The ambient air temperature was strongly correlated with respiration by woody tissue, except during the growing season, when there was relatively high growth respiration. The growing season for stems of Q. serrata was 1 month longer than that for I. pedunculosa. The proportions of FwE, and FwD to nocturnal whole-tree aboveground respiration (Ftree) were estimated to be 8 and 16%, respectively. The rate of growth component of FwE, and FwD in Ftree were estimated as 1 and 2%, respectively. These results suggest the importance of exact estimation of woody tissue respiration in similar forests.
REFERENCES Miyama, T., Kominami, Y., Tamai, K. and Goto, Y.(2005), Seasonal change in nocturnal foliar respiration in
a mixed deciduous and evergreen broadleaved forest, J. Agric. Meteorol., 60(5), 753-756. Goto, Y., Kominami, Y., Miyama, T., Tamai, K., and Kanazawa, Y. (2003), Above ground biomass and net
primary production of broad-leaved secondary forest in the southern part of Kyoto prefecture, central Japan. Bull. FFPRI, 387, 115-147. (in Japanese, with English summary).
P21
65- 65 -
ESTIMATING THE CO2 FLUX FROM COARSE WOODY DEBRIS IN A TEMPERATE DECIDUOUS BROAD-LEAVED FOREST IN JAPAN
M. Jomura1, Y. Kominami2, M. Dannoura1, K. Tamai3, T. Miyama2, Y. Goto2, and Y. Kanazawa1
1Graduate School of Science and Technology, Kobe University, Kobe, Japan 2Forestry and Forest Products Research Institute, Kansai Research Center, Kyoto, Japan
3Forestry and Forest Products Research Institute, Kyusyu Research Center, Kumamoto, Japan
INTRODUCTION CO2 sequestration in forest ecosystems plays a key role in the global carbon cycle. Forest uptake CO2 via photosynthesis and release CO2 via autotrophic and heterotrophic respiration (Ra and Rh respectively). NEP is the small difference between the two large fluxes, so an understanding the biological and physical characteristics of all of the processes in a forest is necessary to estimate how the carbon cycle will respond to environmental change. Ra can be considered in a quantification of NPP, while Rh has to be treated as an independent compartment, because Rh relies on the amount of dead plant tissues. Coarse woody debris (CWD) releases CO2 that affects the carbon cycle of a forest for 10 to 100 years after death, because it decomposes slowly. However, the CO2 flux from CWD (RCWD) is hardly included in measurements of soil respiration, and few studies have treated CWD as a CO2 source. Therefore, this study focused on CWD and estimated the annual RCWD in a forest to evaluate the contribution to Rh and NEP. SITE & METHODS RCWD was measured in the Yamashiro Experimental Forest (YEF), in Kyoto, Japan. The forest is a secondary deciduous broad-leaved forest dominated by Qercus serrata and Irex pedunculosa. The stand density (DBH≥3cm) is 3,209 ha-1, the mean crown height is about 12m, and the living biomass is 44.54tC·ha-1. The soil is generally thin, immature, and sandy. To examine the temporal changes in RCWD due to the environmental factors, automated chamber were installed on two CWD samples and measured RCWD 72 times a day from 2002 and 2003. For modeling of RCWD to environmental factors and CWD characteristics, RCWD of 192 CWD samples, which were cut from snags and logs in the forest, were measured. CWD census in 2003 and CWD input census from 1999 to 2994 were made from the field surveys. For the evaluation of CWD carbon cycle, the annual RCWD was scaled to the ecosystem after considering environmental factors associated with the position (snag or log) of CWD and CWD characteristics. RESULTS Long-term continuous measurements of the RCWD of two samples showed daily and seasonal patterns with changes in T. Precipitation events caused notable changes in the RCWD of both samples. Manual measurements of RCWD of 192 samples showed that RCWD was correlated with temperature (T), water content(θ), wood density(ρ), and diameter (D) of CWD; (RCWD = 78.5exp(0.0494T)(θ+0.0591)(0.871-θ)0.581 D-0.682ρ-0.790 ) and the function explained 53% of the variance in RCWD. Measurements of environmental factors of snags and logs showed that theθ of snags was 20% of that of logs. A field survey conducted in 2003 estimated the CWD mass as 9.30 tC·ha-1. Seventy percent of the CWD had been created before 1999. Snags constituted 60% of the total CWD mass. The annual RCWD estimated in 2003 in YEF was 0.50tC·ha-1·yr-1, amounting to 13-19% of Rh. The mean annual CWD input from 2000 to 2004 was 0.61tC·ha-1·y-1, and 60% of this occurred as snags. Snags fell to the ground during sporadic events, such as typhoons. The forest sequestered 0.11tC·ha-1·y-1 as CWD, which was 7% of the NEP (1.56tC·ha-1·y-1) estimated from tower and biometric measurements. DISCUSSION RCWD was controlled by both environmental factors and CWD characteristics. In YEF, snags constituted 60% of the total CWD mass. The water content of snags was markedly lower than that of logs. Therefore, the difference in water content due to CWD position (snag or log) affects the annual RCWD in YEF. Most CWD initially occurs as snags, which then fall to the ground during sporadic events and subsequently decompose more rapidly. Therefore, the transformation of snags into logs is an important event in the CWD carbon cycle. Since CWD forms accidentally during disturbances and decomposes more slowly, it is difficult to assume that CWD input and decomposition are balanced. Therefore, in order to quantify the carbon cycle in forest, it may be important to consider the CWD balance in a forest, especially when CWD is abundant in the forest or the forest conditions have recently changed.
P22
66- 66 -
BIOMETRIC BASED ESTIMATES OF NET ECOSYSTEM PRODUCTION IN A COOL-TEMPERATE DECIDUOUS FOREST BENEATH A FLUX TOWER
T. Ohtsuka1, W. Mo2 and H. Koizumi2 1Faculty of Science, Ibaraki University, Mito, Japan
2River Basin Research Center, Gifu University, Gifu, Japan
The eddy-covariance based estimates of NEE clearly demonstrated that temperate forests have significant contribution to the global uptake of CO2 (Wofsy et al. 1993). An alternative approach to measuring carbon sequestration is biometric based estimates of net ecosystem production (NEP), which is described as the balance between net primary production (NPP) and heterotrophic respiration (Rh). Inter-comparison of NEP and NEE in a flux site is important not only to cross-validation of both independent methods but also to qualify the contribution of various biological processes to NEE. We conducted that biometric based NEP in a temperate deciduous broad-leaved forest beneath a flux tower. Our objectives are 1) to help accurate estimates of forest carbon storage, and 2) to show how and where the forest is storing C. The study site is located in Takayama Forest Research Station, River Basin Research Center, Gifu University. The site is a part of Asia Flux Network that is presently measuring CO2 and energy exchange between forest canopy and the atmosphere from 1993 (Yamamoto et al. 1999). A permanent plot of 1 ha was set on a west-facing slope. The flux tower is included in the plot. Forest compartment model was applied to construct for stand-level mass balance of carbon budget. Biometric NEP is conceptually equivalent to the
sum of the change in carbon pools (⊿C), i.e., plant biomass (B), coarse woody debris (CWD), and soil organic carbon (SOC). Annual ⊿C in each carbon pool was based on process-level flux measurements. Annual growth of tree dbh was measured in each winter to estimate annual biomass increment (⊿B) from 1999. Annual detritus production was estimated from 14 litter traps (1 m2 area). Diurnal and seasonal change in soil surface CO2 efflux were measured continuously for 24-48 h once or twice a month with the open-flow (OF) IRGA method using four chambers beneath the flux tower from 1999. Heterotrophic respiration was separated from root respiration based on comparisons of CO2 efflux between untrenched and trenched areas in the permanent quadrat (Lee et al. 2003). The mean annual tree growth of above-ground and large roots amounted to 1.3±0.47 t C ha-1. However,
⊿B in the site was rather small (0.3 t C ha-1) because of annual tree mortality amounted to 1.0 t C ha-1. Annual coarse litter production (branches) varied year-to-year ranged from 0.19 to 0.70 t C ha-1 compared to less variable fine litter (foliage) production (1.8±0.14 t C ha-1). The soil surface CO2 efflux was determined as the average across a 5-year record (8.4±0.52 t C ha-1). The contribution of the root respiration of the total soil respiration was 45.3%, thus, Rh was 3.9±0.24 t C ha-1 with topographical correction. The mean total C
uptake (⊿C) of the Takayama site is 2.6 t C ha-1 yr-1 during 1999 to 2003, which agree well with eddy- covariance based NEE (Saigusa et al. 2005, 237±92 g C m-2 yr-1 from 1994 to 2002) within 10% mean value.
However, validation of ⊿SOC is still limited by an insufficient data of the below-ground detritus production (fine root of trees and rhizomes of dwarf bamboo). These limitations make it difficult to estimates accurate
⊿C by process-level flux measurements.
P23
67- 67 -

INTER-ANNUAL VARIABILITY OF NET PRIMARY PRODUCTION AND SOIL CO2 EFFLUX IN A COOL TEMPERATE RED PINE FOREST
AT NORTHERN FOOT OF MT. FUJI
K. Sugita, T. Yokosawa and T. Ohtsuka Laboratory of Ecology, Graduate School of Science and Engineering, Ibaraki University, Mito, Japan
The carbon flux between the terrestrial and the atmosphere, which has been decided by balance that CO2 emission from the land use change and the substantial CO2 absorption by plant was clarified by the third report of IPCC in 2001. It is important to know the carbon budget of the terrestrial ecosystem because CO2 has largest contribution to global warming. Therefore the tower flux observation in forest ecosystems was spread rapidly in 1990’s to comprehend the substantial CO2 absorption in the terrestrial ecosystem. Ecological measurement of carbon budget beneath the flux tower is needed for accurate estimate of carbon budget. In this study, we aimed to consider that inter-annual variability of net primary production and soil CO2 efflux and how dose they contribute to net ecosystem production in a forest ecosystem, and to show where and how the forest is storing carbon.
The study site is located in northern foot of Mt. Fuji (35°27′N, 138°46′E, 1030m a.s.l.). Secondary forest of red pine (Pinus densiflora) was established on the Kenmarubi lava flow, which was formed in 937. This site is a part of the Asia Flux Network that is presently measuring CO2 flux from 1999.
The permanent quadrat of 0.64 ha (80m×80m) was set on 2000 near the flux tower. NPP was estimated by the harvest method as expressed by the sum of ⊿B (annual biomass increment) + L (annual litter production). Annual biomass increment was estimated by measuring the dbh of all living stems greater than 5cm in December after growing season from 2000. 20 point of litter traps (1m2) and 9 point of big branches traps (100m2) were used to estimate the litter production. These samples were collected at monthly intervals from 2000 to 2004, and dried and weighed. Soil CO2 efflux was measured by three methods (2000-2002: Automated closed chamber method, 2003: Closed chamber method, 2004: LI-6200).
Annual tree growth was fluctuated 2.18 ton C ha-1 to 2.91 ton C ha-1 in five years. Annual biomass increment was fluctuated 1.81 ton C ha-1 to 2.50 ton C ha-1, and annual tree mortality was 0.35 ton C ha-1 to 0.76 ton C ha-1 in four years. Mean annual litter production (including big branches) was 3.50 ton C ha-1 in five years. NPP was fluctuated 5.68 ton C ha-1 to 6.41 ton C ha-1 in five years, soil CO2 efflux was almost constant excluding 2004 (3.22 ton C ha-1 to 4.08 ton C ha-1). We assumed that heterotrophic respiration is 83% of soil respiration (Sakata personal communication). Therefore, NEP that is estimated by subtracting heterotrophic respiration from NPP was fluctuated 2.84 ton C ha-1 to 3.73 ton C ha-1. Moreover, the mean annual carbon storage in the forest ecosystem in five years was 2.20 ton C ha-1 in plant biomass, 0.33 ton C ha-1 in soil organic carbon, 0.71 ton C ha-1 in coarse woody debris.
P24
68- 68 -
CARBON BALANCE OF LARCH FOREST ECOSYSTEMS
*Naishen Liang, Yasumi Fujinuma, and Gen Inoue Center for Global Environmental Research, National Institute for Environmental Studies, Japan.
Forests worldwide contain about 45% of the global stock of carbon, the large part of which is found in forest soils. They impact upon the natural cycle of carbon, nitrogen and water, and they influence the radiation balance of the planet. Larch forests widely distribute throughout the North Hemisphere, e.g. occupying >40% of Russian forests, thus is global important of forested biome. However, the carbon budget of larch ecosystems has received little attention. We routinely measure net ecosystem exchange (NEE) with eddy covariance at larch forests in northern Japan, northeastern China and central Siberia. In addition, we partitioned the components of the CO2 flux with the chamber methods, in terms of canopy photosynthesis, aboveground woody tissue respiration, understory vegetation gas exchange, total soil-CO2 efflux, heterotrophic and root respirations. Our objectives were: (1) to quantify the contributions of CO2 flux components to GPP; and (2) evaluate the influence of environmental conditions on CO2 flux components.
For a 50-year-old larch plantation at Tomakomai Flux Site in Hokkaido, northern Japan, we scaled up the flux components based on the chamber measurements. In 2003, annual soil-CO2 efflux was averaged to 9.59 tC ha-1, heterotrophic respiration was about 5.47 tC ha-1 that accounted about 57% of the soil-CO2 efflux, net annual CO2 exchange of understory vegetation was about -0.39 tC ha-1, annual aboveground woody tissue respiration was bout 0.75 tC ha-1, and annual photosynthesis and respiration of the canopy was about -12.75 and 1.15 tC ha-1, respectively. Annual GPP, NPP, NEP and ecosystem respiration for this forest was estimated to be about 13.49, 7.16, 2.04 and 11.45 tC ha-1, respectively. The contribution of canopy respiration, aboveground woody respiration, root respiration and heterotrophic respiration to GPP was about 8.1%, 5.6%, 30.6% and 40.5%, respectively.
P25
69- 69 -
LEAF PHOTOSYNTHESIS AND RESPIRATION OF A DECIDUOUS TREE (KONARA OAK) IN THE LEAFING STAGE
Y. Yasuda1, Y. Ohtani1, Y. Mizoguchi1, H. Iwata2 and T. Nakano3
1Forestry and Forest Products Research Institute, Tsukuba, Japan 2University of Tsukuba, Tsukuba, Japan
3Yamanashi Institute of Environmental Sciences,Fujiyoshida, Japan
Seasonal trends in leaf photosynthesis and respiration are important factors in determining the seasonality and magnitude of ecosystem CO2 fluxes. In deciduous broad-leaf trees, photosynthetic and respiration rates change drastically in the leafing stage, so that the better understanding of those rates is required in order to study net ecosystem CO2 exchange of deciduous forests. In this report, we present results of gas exchange measurements of leaf photosynthesis and respiration in the leafing stage.
Single-leaf gas exchange measurements were made with a portable photosynthesis system (LI-6400, LI-COR) at Fujiyoshida, Japan, from May to August 2005. From the measurements, we estimated maximum rate of carboxylation at 25℃ (Vcmax25) and dark respiration rate per unit area (Rd) of a deciduous tree (Quercus serrata Thunb., called “Konara” in Japanese), where Vcmax25 means a measure of photosynthetic capacity at 25℃. Four branches (16, 13, 11 and 8 m high) were selected for the measurements. The LI-6400 was equipped with a LED light source and a CO2 injector to control photosynthetically active photon flux density (PPFD) and CO2 concentration in the chamber. In the experiments, we made light response curves of net photosynthetic rate. Vcmax25 was estimated from saturated photosynthetic rates using Farquhar’s model and Rd was assumed CO2 exchange rate at PPFD = 0μmol m-2 s-1. The CO2 concentration and relative humidity in the chamber were kept at 360μmol mol-1 and about 60 %.
There were apparent seasonal trends in Vcmax25 and Rd in the leafing stage. The Vcmax25 values rapidly increased with leaf expansion. When the sharp expansion of the leaves was finished, the seasonal variation in Vcmax25 became gradual. Although Vcmax25 of lower branch increased faster than that of higher branch in the early period of the leafing stage, averaged Vcmax25 of higher branch was larger than that of lower branch after the stage.
Respiration rate per unit area decreased over time in the leafing stage. Measured Rd just after leafing was higher than photosynthetic rate. After that, Rd steadily decreased for a month, even though the leaf temperature rose. Leaf respiration at 25℃ (Rd25) was estimated with the assumption of Q10 = 2.0 at each measurement, where Q10 is the coefficient of temperature dependency for leaf respiration rate. Rd25 rapidly decreased with leaf expansion, which was opposite to the trend of Vmax25. The relationship between Rd25 and the leaf temperature clearly showed a attenuation function that indicated Rd25 was reduced by 20 % with a 10℃ rise in temperature. Leaf respiration per unit leaf was also analysed. The trend of Rd25 per unit leaf (Rd25leaf) showed the peak one month later from the beginning of the leafing. The time of the peak corresponded with the end of the leaf expansion period.
We found the photosynthetic and respiration rates of the deciduous tree were changed with the leaf expansion during the leafing stage. At the beginning of the growing season, leaf area could be an important parameter to determine the characteristics of leaf photosynthesis and respiration. Keywords: Deciduous tree, Leafing stage, Photosynthetic capacity, Respiration, Single-leaf gas exchange
P26
70- 70 -
Instrumentation and data quality assessment at Daegwallyeong CO2 flux measurement site (DFMS) in Korea
J. Cho1, D. Komori1, S.D. Kim2 and W. Kim3
1Institute of Industrial Science, University of Tokyo, Tokyo, Japan 2Department of Biology, Chungnam National University, Seoul, Korea
3Department of Global Resources, National Institute for Agro-Environmental Sciences, Tsukuba, Japan
There is presented the instrumentation of eddy covariance technique at the Daegwallyeong CO2 flux measurement site (DFMS) in Korea, and the initial results of applying a data quality assessment to measurements which are acquired during two experiment periods of each summer and winter season. For the data quality assessment, 1) instationarity, 2) correlation coefficient, and 3) integral turbulence characteristics (ITC) test are carried out, and then the measurements are classified to the two groups (accept or worst) according to final quality flags suggested by Foken and Wichura (1996). The acceptable group of which flag of data quality leveled from 1 to 4 is 85.4% for summer experiment and 68.1% for winter experiment, respectively. This result represents not only stationarity but also good agreement of the turbulent characteristic within similarity theory during experimental periods without the temporal difference according to diurnal or nocturnal time. The measured minimum and maximum CO2 fluxes during the experimental periods are -27.3 µmol CO2 m-2 day-1 (uptake) and 4.5 µmol CO2 m-2 day-1, (release) respectively. In theses results, the DFMS is one of the best sites for CO2 flux measurement in order to make the information of CO2 absorption for Quercus mongolica community in Korea.
P27
71- 71 -
QUALITY CHECK OF FLUX DATA USING A MULTILAYERED CANOPY MODEL
T. Watanabe1, Y. Nakai2, K. Kitamura2, H. Utsugi2, H. Tobita2 and S. Ishizuka1 1Forest and Forest Products Research Institute, Tsukuba, Japan
2Hokkaido Research Center, Forestry and Forest Products Research Institute, Sapporo, Japan
To obtain accurate estimates of ecosystem CO2 uptake based on the eddy covariance measurements, the quality control of the flux data is highly important. A widely used method of the quality control is a screening of raw instantaneous data. This procedure flags questionable data, according to prescribed acceptance criteria for the level of spiky noise, absolute values of data, the range of higher-order momentum, the level of discontinuity found in a data record, and so forth. The fluxes are then calculated using data that were not flagged by this procedure. By means of these steps, observers are able to select flux data unaffected by instrumental or data recording problems. Nevertheless, there is no warranty that these selected flux data surely represent the actual ecosystem exchange. Some factors (e.g., advections) may disconnect the fluxes measured at a height above the canopy from the actual exchange fluxes; or the data may be affected by some system problems that cannot be detected by the above-mentioned data screening procedure. It is, therefore, necessary to crosscheck the flux data using other independent estimates of the ecosystem exchange.
One possible method of the crosscheck is comparing the summation of flux and the net growth of ecosystem. However, this method is only applicable for a long period of time (i.e., one year or longer), and the uncertainty inherent in the net growth estimates may degrade the reliability of crosscheck. Obviously, we need to have a more reliable means that can be applied for a short period of time.
We have been developing a stand microclimate model named Multilayered Implementation for Natural Canopy-Environment Relations (MINCER) as a tool for compiling individual leaf-scale measurements into a comprehensive representation of canopy-scale fluxes. This model includes all essential processes that affect the fluxes above a plant canopy, that is, biophysical, hydrological and physiological processes functioning differently at various levels inside the canopy. If the leaf-scale fluxes, the soil surface fluxes and the canopy structure are given to the model, it predicts the canopy-scale fluxes using meteorological conditions measured above the canopy. Although the output fluxes are not purely ‘measurements’, the comparison between the predicted and measured fluxes provides some information on the consistency of measured above-canopy fluxes with individual small-scale fluxes.
We applied MINCER to a FFPRI FluxNet site (Hitsujigaoka) established in a broadleaf forest in Sapporo, Japan. This forest is a mixture of various broadleaf species dominated by Betula platyphylla, Quercus mongolica, and Kalopanax pictus. In this site, measurements of canopy architecture, leaf-scale physiological measurements and the soil CO2 flux are available as well as the eddy covariance fluxes and micorometeorological variables. The vertical profile of leaf area density was measured once for each major species, and the seasonal variation in total leaf area was monitored by the photographical technique and by measurements of PAR attenuation across the canopy. To monitor seasonal variations in the photosynthetic capacity of the dominant species, light-saturated net photosynthetic rates at two different CO2 concentrations (360 and 1500 ppm) were measured about once per month for several leaves at each of four different heights in the canopy. From these data, seasonal variations in the vertical profile of maximum catalytic activity of Rubisco (Vcmax) were evaluated. The soil respiration rates were measured once per month by the closed chamber method, and the relationship between the respiration rate and the soil temperature has been established.
Using these measurements or relationships as input to the model, temporal variations in 30-min average fluxes of energy and CO2 were simulated for three years from 2000 to 2002. For most part of the simulation period, the modeled fluxes showed good correspondence with the measured flux at least for the daytime. This agreement indicates both the model’s good performance and the consistency of the eddy covariance fluxes with individual leaf-scale and soil surface fluxes. However, there were some cases when the model could not simulate the diurnal flux variations. One example is that the time trace of measured CO2 flux was unstable and deviated from the simulated time course during and after rainfall events. We do not mean to claim that the modeled results are always true, but if we closely look at the data when inconsistency is found between modeled and measured fluxes, we can find some problems in measurements or something new that really happens.
P28
72- 72 -
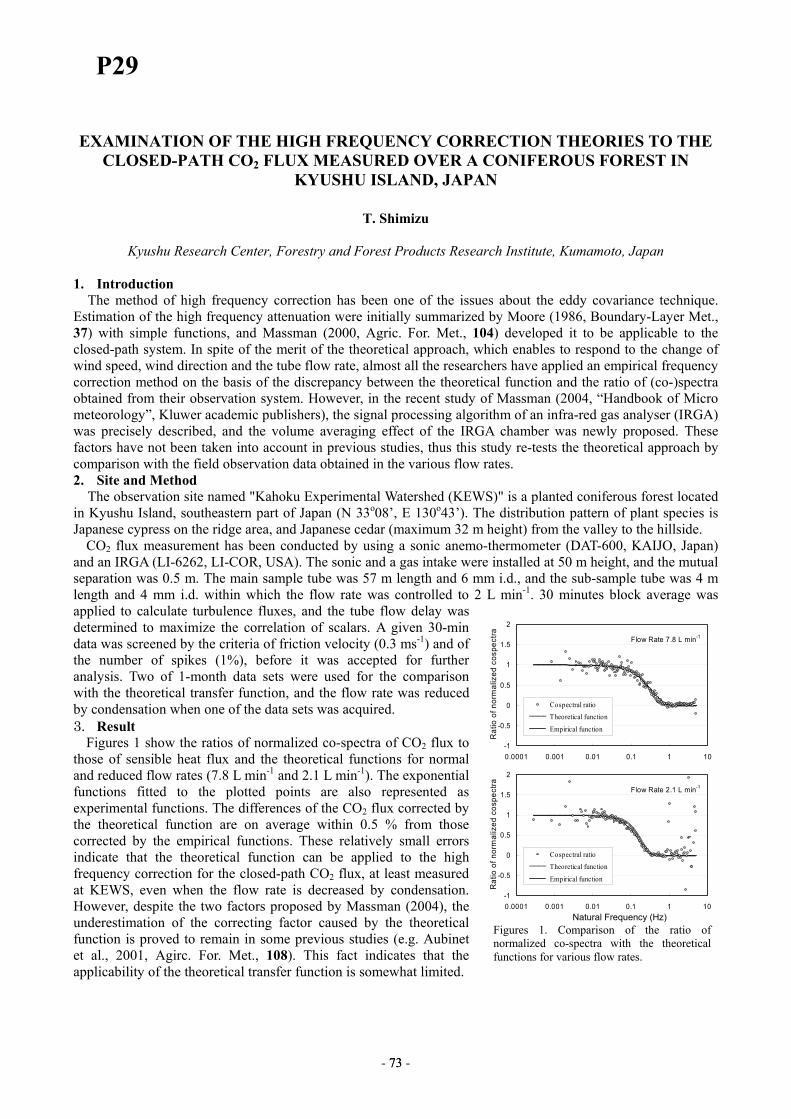
EXAMINATION OF THE HIGH FREQUENCY CORRECTION THEORIES TO THE CLOSED-PATH CO2 FLUX MEASURED OVER A CONIFEROUS FOREST IN
KYUSHU ISLAND, JAPAN
T. Shimizu
Kyushu Research Center, Forestry and Forest Products Research Institute, Kumamoto, Japan
1. Introduction The method of high frequency correction has been one of the issues about the eddy covariance technique.
Estimation of the high frequency attenuation were initially summarized by Moore (1986, Boundary-Layer Met., 37) with simple functions, and Massman (2000, Agric. For. Met., 104) developed it to be applicable to the closed-path system. In spite of the merit of the theoretical approach, which enables to respond to the change of wind speed, wind direction and the tube flow rate, almost all the researchers have applied an empirical frequency correction method on the basis of the discrepancy between the theoretical function and the ratio of (co-)spectra obtained from their observation system. However, in the recent study of Massman (2004, “Handbook of Micro meteorology”, Kluwer academic publishers), the signal processing algorithm of an infra-red gas analyser (IRGA) was precisely described, and the volume averaging effect of the IRGA chamber was newly proposed. These factors have not been taken into account in previous studies, thus this study re-tests the theoretical approach by comparison with the field observation data obtained in the various flow rates. 2. Site and Method
The observation site named "Kahoku Experimental Watershed (KEWS)" is a planted coniferous forest located in Kyushu Island, southeastern part of Japan (N 33o08’, E 130o43’). The distribution pattern of plant species is Japanese cypress on the ridge area, and Japanese cedar (maximum 32 m height) from the valley to the hillside.
CO2 flux measurement has been conducted by using a sonic anemo-thermometer (DAT-600, KAIJO, Japan) and an IRGA (LI-6262, LI-COR, USA). The sonic and a gas intake were installed at 50 m height, and the mutual separation was 0.5 m. The main sample tube was 57 m length and 6 mm i.d., and the sub-sample tube was 4 m length and 4 mm i.d. within which the flow rate was controlled to 2 L min-1. 30 minutes block average was applied to calculate turbulence fluxes, and the tube flow delay was determined to maximize the correlation of scalars. A given 30-min data was screened by the criteria of friction velocity (0.3 ms-1) and of the number of spikes (1%), before it was accepted for further analysis. Two of 1-month data sets were used for the comparison with the theoretical transfer function, and the flow rate was reduced by condensation when one of the data sets was acquired. 3. Result
Figures 1 show the ratios of normalized co-spectra of CO2 flux to those of sensible heat flux and the theoretical functions for normal and reduced flow rates (7.8 L min-1 and 2.1 L min-1). The exponential functions fitted to the plotted points are also represented as experimental functions. The differences of the CO2 flux corrected by the theoretical function are on average within 0.5 % from those corrected by the empirical functions. These relatively small errors indicate that the theoretical function can be applied to the high frequency correction for the closed-path CO2 flux, at least measured at KEWS, even when the flow rate is decreased by condensation. However, despite the two factors proposed by Massman (2004), the underestimation of the correcting factor caused by the theoretical function is proved to remain in some previous studies (e.g. Aubinet et al., 2001, Agirc. For. Met., 108). This fact indicates that the applicability of the theoretical transfer function is somewhat limited.
-1
-0.5
0
0.5
1
1.5
2
0.0001 0.001 0.01 0.1 1 10
Cospectral ratio Theoretical function
Empirical function
Rat
io o
f nor
mal
ized
cos
pect
ra
Flow Rate 2.1 L min-1
-1
-0.5
0
0.5
1
1.5
2
0.0001 0.001 0.01 0.1 1 10
Cospectral ratio Theoretical function
Empirical function
Rat
io o
f nor
mal
ized
cos
pect
ra
Flow Rate 7.8 L min-1
Natural Frequency (Hz) Figures 1. Comparison of the ratio of normalized co-spectra with the theoretical functions for various flow rates.
P29
73- 73 -
EFFECT OF LOCAL TEMPERATURE FLUXES IN THE VICINITY OF AN OPEN-PATH GAS ANALYZER ON THE WPL CORRECTION
K. Ono and A. Miyata
National Institute for Agro-Environmental Sciences, Tsukuba, Japan
The authors often observed unrealistic downward CO2 fluxes over a non-vegetated rice paddy in the suburb of Tsukuba, Japan (36.05oN, 140.03oE) in follow periods only when we employed an open-path eddy covariance system. We conducted a measurement campaign from March to April 2003, and found that the unrealistic downward CO2 fluxes did not represent true transport of CO2 and might be caused by inappropriate application of the WPL correction (Webb et al., 1980). The WPL correction postulates that all the variables involved in the correction are measured at a same point or represent the same area-averaged properties of turbulence. In the strict sense, however, the assumption is rarely satisfied in practical field measurements because the covariances in the WPL correction are measured with two different instruments, a sonic anemometer-thermometer and an open-path gas analyzer. If the open-path gas analyzer itself was a heat source, temperature fluxes measured with the sonic anemometer would differ from those at the optical path of the analyzer. This might lead to under- or over-estimate of the WPL correction term. Over the follow paddy field where only small CO2 efflux was expected, underestimate of the WPL correction term could leave the corrected CO2 fluxes in the daytime still downward . In order to confirm this idea by measuring local temperature fluxes in the vicinity of the open-path eddy covariance system, we conducted another experiment at the same paddy from 14 March 2005 to 7 April 2005.
We employed a sonic anemometer-thermometer (DA-600, Kaijo), two open-path gas analyzers (LI-7500, Li-Cor) and a closed-path gas analyzer (LI-7000, Li-Cor). The instrumentation and configuration were almost the same as those in the 2003 campaign. We wrapped one of the probes of the two open-path gas analyzers in a black tape made of chloroethene while keeping its optical path open in order to increase the absorptance of the probe againt short- and long-wave radiation. The taped and not taped probes are hereafter denoted by black and white probes, respectively. We measured fluctuations in air temperature at the acoustic path of the sonic anemometer and at the optical path of the black and while probes with T-type fine thermocouples (0.025 mm in diameter). Surface temperature of the probes of the gas analyzers was also monitored. These signals were sampled at 10Hz and recorded using a high-speed logger (CR5000, Campbell Scientific Inc.) All the statistics were calculated every half hour. The results obtained on March 31 are described below.
In the daytime of March 31, the mean surface temperature of the black probe was higher than that of the white one. The differences in the surface temperature between the two probes reached 1.4 oC at maximum, but they were smaller than the temperature difference between the top and the bottom parts of the white probe, which was 3.7 oC at maximum. The intra-probe differences in the white probe were also found in the nighttime with similar tendency and magnitude. This implied heat transfer from the internal infrared source to the surface at the bottom part of the probes. The standard deviation of air temperature measured at the optical path of the black probe was larger by 43% than that measured at the acoustic path of the sonic probe, and also 2.5 times as much as that measured at the optical path of the white probe However, the temperature fluxes calculated from the fluctuations in air temperature measured with the thermocouples and the vertical wind velocity (w) showed different results. The temperature fluxes calculated from temperature at the acoustic path were the largest among the three because of short separation from the path measuring w. To avoid the contamination by the different sensor separation, we introduced an equivalent temperature flux, in which the correlation coefficient between w and air temperature measured at respective paths were replaced by the correlation coefficient between w and air temperature measured at the acoustic path. The calculated equivalent temperature fluxes suggested that the local temperature fluxes as much as 50 W m-2 were generated at the black probe at 1100 hours on 31 March, but they were not obvious at the white probe. The temperature flux of 50 W m-2 is equivalent to about 2 µmol m-2 s-1 in the WPL correction and worth taking into account when we discuss the downward flux observed over the fallow paddy field.
P30
74- 74 -
COMPARISON OF EDDY CO2 FLUXES MEASURED WITH OPEN-PATH AND CLOSED-PATH SYSTEMS
R. Hirata1, T. Hirano2, N. Saigusa3, K. Takagi4, Y. Yone5, N. Liang1, Y. Fujinuma1, and K. Inukai1
1Center for Global Environmental Research, National Institute for Environmental Studies, Tsukuba, Japan 2Graduate School of Agriculture, Hokkaido University, Sapporo, Japan
3National Institute of Advanced Industrial Science and Technology, Tsukuba, Japan 4Field Science Center for Northern Biosphere, Hokkaido University, Sapporo, Japan
5PASCO Corporation, Tokyo, Japan
Long-term measurements of CO2 flux by the eddy covariance technique using an open- or closed-path system on a tower have been performed for elucidating the carbon cycle of terrestrial ecosystems. Evaluation of the difference between annual net CO2 ecosystem exchanges (NEE) from the open- and the closed-path data is important for site intercomparison studies. However, long-term measurements of NEE using both systems have been limited. We report the comparison of eddy CO2 fluxes measured with open- and closed path systems for three years from 2001 through 2003.
The study site is a Japanese larch plantation in Hokkaido, Japan (42°44’N, 141°31’E). Canopy height was approximately 15-16 m and tree age was about 45 years old. Canopy LAI reached the maximum at 5.5 m2 m-2 in July. Wind speed and virtual temperature were measured with a 3D sonic anemometer-thermometer (DA600, Kaijo). CO2 and water vapor densities were measured with an open-path CO2/H2O analyzer (LI7500, Licor) and a closed-path CO2/H2O analyzer (LI6262, Licor) at height of 27 m. Data were sampled at 10Hz, and 30-min averages of fluxes were calculated. NEE was calculated as the sum of CO2 flux and CO2 storage change. Gross primary production (GPP) and ecosystem respiration (RE) were estimated from photosynthesis photon flux density and soil temperature using non-linear regression.
Daytime 30-min NEE tended to be more negative by about 10% for open-path than for closed-path. In contrast, nighttime 30-min NEE tended to be about 10% less positive for open-path than for closed-path.
The annual GPP estimated from closed-path data was 8–10% less negative than that from the open-path data, whereas the annual RE was 11–16% more positive for closed-path data. Consequently, the annual NEE from the closed-path data was less negative by 301–333 gC m-2 y-1.
The bias of NEE between two systems is large and an extremely important issue. Ecophysiological approaches are needed to validate the eddy covariance technique.
P31
75- 75 -
DATA GAP FILLING FOR ANNUAL AND MONTHLY NET ECOSYSTEM CARBON DIOXIDE EXCHANGE USING GENETIC ALGORITHM
T. Machimura1, M. Ooba1, T. Oda1, Y. Kikuchi1, T. Okabe1, L. Lopez2, G. Iwahana2
and Y. Kobayashi3 1Graduate School of Engineering, Osaka University, Suita, Osaka, Japan
2Institute of Low Temperature Science, Hokkaido University, Sapporo, Japan 3National Institute for Agro-Environmental Sciences, Tsukuba, Ibaraki, Japan
Selection and performance of the data gap filling method are important for the accurate and reliable
estimation of annual net ecosystem carbon dioxide exchange (NEE) from long-term observations of the eddy covariance flux. The biological response models that base on well-studied environmental responses of ecosystem respiration to temperature and gross assimilation to radiation are, therefore, more reliable than the empirical techniques, and comparable among different sites. The model parameters are often determined by the non-linear regression technique, however, the technique is unable to determine all parameters for the respiration and assimilation during daytime simultaneously, and assumes an extrapolated respiration from the nocturnal observation or a constant respiration within narrow temperature ranges.
Genetic algorithm is a simple and universal optimization technique that simulates the evolution and natural selection of a organism community, and is available even for analytically insoluble problems. The simple genetic algorithm (SGA) was employed to determine the biological response model of NEE. Quality controlled datasets of carbon dioxide eddy flux, air temperature, photosynthetic photon flux density (PPFD) observed in a Japanese red pine forest and in a Siberian larch forest were used for the evaluation of this technique. Four model parameters to be determined i.e. ecosystem respiration at the air temperature of 0 °C (R0), the temperature coefficient of ecosystem respiration (Q10), maximum gross assimilation (Agmax) and initial light use efficiency (α), were encoded into chromosomes of 16-bit long for each. The objective function of SGA to be optimized was defined as the third power of the product of correlation coefficient and inverted relative error between observed and modeled fluxes, where each statistic was scaled between 0 and 1. The SGA originally does not preserve the best-fitted individual in a generation that occasionally does not survive in the next generation. To prevent this loss, the best-fitted individual was immigrated unconditionally into the new generation. Initial population, crossover rate and mutation rate were set to 1000, 0.5 and 0.2, respectively, and each trial computed up to 100 generations. The model was evaluated monthly and 20 trials were performed for a monthly dataset.
The best-fitted estimations of the NEE model parameters among 20 trials for each month were used for the evaluation. In the Japanese red pine forest, the standard error in NEE was 0.6 µmol m–2 s–1 in average and ranged between 0.4 (October 2004) and 1.2 µmol m–2 s–1 (June 2005), and the determination coefficient (r2) was 0.76 in average and ranged between 0.65 and 0.88. Estimated Q10 and Agmax showed obvious seasonal change, which was corresponded with monthly mean air temperature. The large Q10 in a hot season suggests large errors in the ecosystem respiration and, consequently, in the gross assimilation if it was estimated using only nocturnal observations. Solutions by the SGA generally vary more or less for the trials and are not deterministically unique. However, the estimates of NEE parameters did not change so much among the 20 trials for each month, and the solutions by this technique was supposed to be sufficiently optimized.
The modeled NEE for the Siberian larch forest also showed a good accuracy. This forest stand often catches a severe drought in summer, and the significant depressions both in photosynthesis and ecosystem respiration have been observed. Linear trends of the Q10 and Agmax to the vapor pressure deficit were modeled and encoded in additional three chromosomes in the SGA. This new model well described the drought effect on NEE in mid summer, and the accuracy was slightly improved.
This study was carried out in frames of the Environmental Technology Development program supported by Japanese Ministry of Environment, the CREST program supported by Japan Science and Technology Corporation, the RR2000 and Grant-in-Aid for Scientific Research programs supported by Japanese Ministry of Education, Culture, Sports, Science, and Technology.
P32
76- 76 -
DIURNAL AND SEASONAL VARIATIONS IN CO2 EXCHANGE OVER A GMELIN LARCH FOREST ON CONTINUOUS PERMAFROST
OF THE CENTRAL SIBERIA
Y. Nakai1, Y. Matsuura2, T. Kajimoto3, A.P. Abaimov4, and S. Yamamoto5
1 Hokkaido Research Center, Forestry and Forest Products Research Institute, Sapporo, Japan2 Forestry and Forest Products Research Institute, Tsukuba, Japan
3 Kyushu Research Center, Forestry and Forest Products Research Institute, Kumamoto, Japan4 Sukachev Institute of Forest, Siberian Branch, Russian Academy of Sciences, Krasnoyarsk, Russia
5 Okayama University, Okayama, Japan
The magnitude of ecosystem CO2 exchange between the boreal forests and atmosphere is of
particular interest because of the wide coverage of the forests. The boreal forests are
comprised primarily not only of evergreen conifer but also of deciduous conifer, Larch.
Larch forests distribute widely over central to eastern Eurasia. The larch species form
forests even over continuous permafrost in North-West Eurasia. Now, the measurement
network on carbon balance over the larch ecosystems is very sparse, and the representative
magnitude of CO2 exchange was not quantified. The above background, ecological
investigations have been continued and micro-meteorological measurements initiated at
some larch forests in Russia, China, and Japan.
Recently, we are able to carry out long-term micro-meteorological measurements at remote
sites because of technology developments in micro-computer, data-loggers, solar power-
generators, high-quality batteries and sensors for surface meteorology. Based on this tech-
nological background, half-hourly CO2 exchange between a Gmelin-larch forest ecosystem
and atmosphere, was measured during a whole growing period of the tree at Central Siberia,
using the eddy covariance method. The whole measurement integration system could be sta-
bly operated.
Diurnal patterns with daytime uptake in CO2 exchange were observed in early June when
the soil was almost frozen. The maximum half-hourly net CO2 uptake rate appeared mainly
between late of June and the end of July. In early September, the net CO2 exchange was
positive (release from the surface) and it’s diurnal variation was not clear.
This study was funded partially by the Global Environment Research Fund.
P33
77- 77 -
Author: Larry Lopez Transpiration, water potential and stomatal conductance of Larix cajanderi under
non-limiting soil moisture, Central Yakutia, Eastern Siberia. Two plots were set in a larch (Larix cajanderi) forest one under non-limiting soil water conditions (irrigation regime applied) and the other under natural precipitation regime in Central Yakutia, Eastern Siberia. Sap flow rate values were scaled up to stand transpiration and utilized for calculations of canopy conductance. The calculated values provided the basis to estimate Potential transpiration using maximal canopy conductance as a function of vapour pressure deficit. For non limiting water conditions canopy conductance was 2.57 and about 3.11 mm s-1 for natural conditions. Predawn water potential was not followed by variations of stomatal conductance or leaf transpiration. Tree transpiration response to irrigation was immediate whereas at leaf level the effects were observed after 3 to 4 days. This lag suggests that extra water in the soil is first used in replenishing tree compartments rather than giving it all to transpiration. The percentage of increased transpiration ranged between 20 to 50 % following the days after irrigation. The upper 10 cm of soil layer played an important role in the control of transpiration. When soil moisture at this layer is not a limiting factor canopy conductance and consequently transpiration can be estimated as a function of VPD. The total transpiration during the growing season 2004 was merely 70 mm. Despite irrigation, the total amount of transpiration at both plots was not significantly different.
P34
78- 78 -
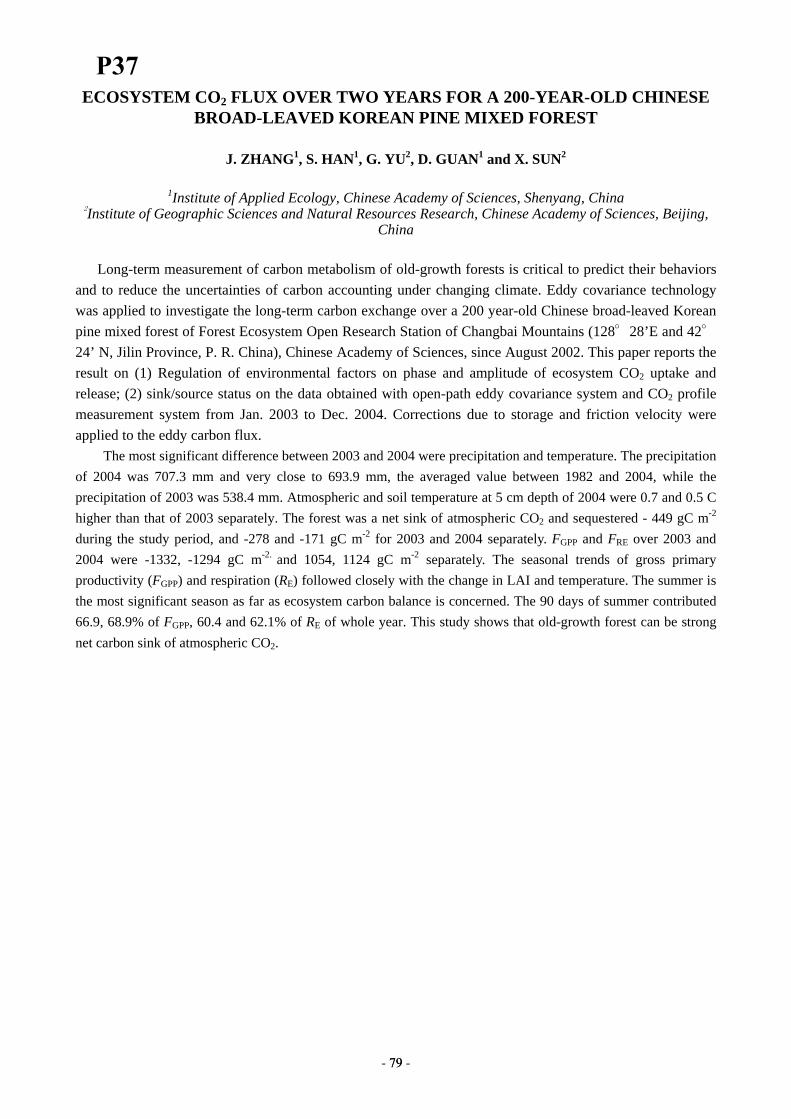
ECOSYSTEM CO2 FLUX OVER TWO YEARS FOR A 200-YEAR-OLD CHINESE BROAD-LEAVED KOREAN PINE MIXED FOREST
J. ZHANG1, S. HAN1, G. YU2, D. GUAN1 and X. SUN2
1Institute of Applied Ecology, Chinese Academy of Sciences, Shenyang, China
2Institute of Geographic Sciences and Natural Resources Research, Chinese Academy of Sciences, Beijing, China
Long-term measurement of carbon metabolism of old-growth forests is critical to predict their behaviors
and to reduce the uncertainties of carbon accounting under changing climate. Eddy covariance technology was applied to investigate the long-term carbon exchange over a 200 year-old Chinese broad-leaved Korean pine mixed forest of Forest Ecosystem Open Research Station of Changbai Mountains (128°28’E and 42°24’ N, Jilin Province, P. R. China), Chinese Academy of Sciences, since August 2002. This paper reports the result on (1) Regulation of environmental factors on phase and amplitude of ecosystem CO2 uptake and release; (2) sink/source status on the data obtained with open-path eddy covariance system and CO2 profile measurement system from Jan. 2003 to Dec. 2004. Corrections due to storage and friction velocity were applied to the eddy carbon flux. The most significant difference between 2003 and 2004 were precipitation and temperature. The precipitation of 2004 was 707.3 mm and very close to 693.9 mm, the averaged value between 1982 and 2004, while the precipitation of 2003 was 538.4 mm. Atmospheric and soil temperature at 5 cm depth of 2004 were 0.7 and 0.5 C higher than that of 2003 separately. The forest was a net sink of atmospheric CO2 and sequestered - 449 gC m-2 during the study period, and -278 and -171 gC m-2 for 2003 and 2004 separately. FGPP and FRE over 2003 and 2004 were -1332, -1294 gC m-2. and 1054, 1124 gC m-2 separately. The seasonal trends of gross primary productivity (FGPP) and respiration (RE) followed closely with the change in LAI and temperature. The summer is the most significant season as far as ecosystem carbon balance is concerned. The 90 days of summer contributed 66.9, 68.9% of FGPP, 60.4 and 62.1% of RE of whole year. This study shows that old-growth forest can be strong net carbon sink of atmospheric CO2.
P37
79- 79 -
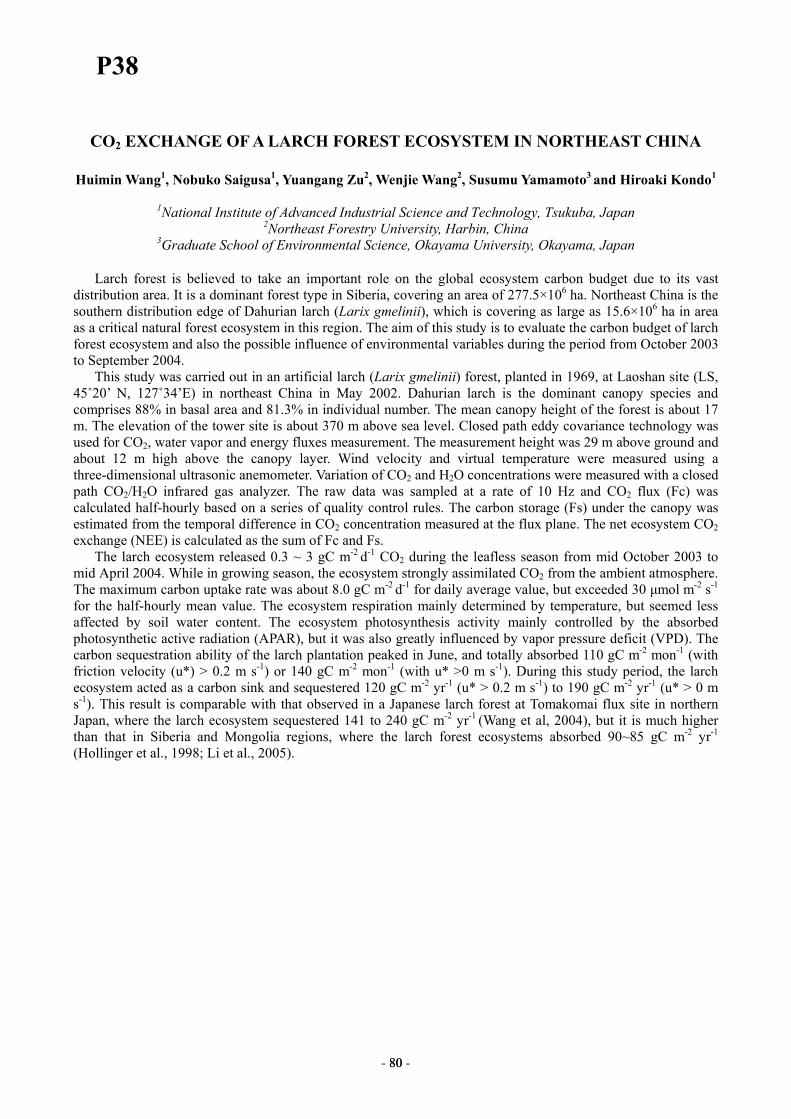
CO2 EXCHANGE OF A LARCH FOREST ECOSYSTEM IN NORTHEAST CHINA
Huimin Wang1, Nobuko Saigusa1, Yuangang Zu2, Wenjie Wang2, Susumu Yamamoto3 and Hiroaki Kondo1
1National Institute of Advanced Industrial Science and Technology, Tsukuba, Japan
2Northeast Forestry University, Harbin, China 3Graduate School of Environmental Science, Okayama University, Okayama, Japan
Larch forest is believed to take an important role on the global ecosystem carbon budget due to its vast
distribution area. It is a dominant forest type in Siberia, covering an area of 277.5×10⁶ ha. Northeast China is the southern distribution edge of Dahurian larch (Larix gmelinii), which is covering as large as 15.6×10⁶ ha in area as a critical natural forest ecosystem in this region. The aim of this study is to evaluate the carbon budget of larch forest ecosystem and also the possible influence of environmental variables during the period from October 2003 to September 2004.
This study was carried out in an artificial larch (Larix gmelinii) forest, planted in 1969, at Laoshan site (LS, 45˚20’ N, 127˚34’E) in northeast China in May 2002. Dahurian larch is the dominant canopy species and comprises 88% in basal area and 81.3% in individual number. The mean canopy height of the forest is about 17 m. The elevation of the tower site is about 370 m above sea level. Closed path eddy covariance technology was used for CO2, water vapor and energy fluxes measurement. The measurement height was 29 m above ground and about 12 m high above the canopy layer. Wind velocity and virtual temperature were measured using a three-dimensional ultrasonic anemometer. Variation of CO2 and H2O concentrations were measured with a closed path CO2/H2O infrared gas analyzer. The raw data was sampled at a rate of 10 Hz and CO2 flux (Fc) was calculated half-hourly based on a series of quality control rules. The carbon storage (Fs) under the canopy was estimated from the temporal difference in CO2 concentration measured at the flux plane. The net ecosystem CO2 exchange (NEE) is calculated as the sum of Fc and Fs.
The larch ecosystem released 0.3 ~ 3 gC m-2 d-1 CO2 during the leafless season from mid October 2003 to mid April 2004. While in growing season, the ecosystem strongly assimilated CO2 from the ambient atmosphere. The maximum carbon uptake rate was about 8.0 gC m-2 d-1 for daily average value, but exceeded 30 µmol m-2 s-1 for the half-hourly mean value. The ecosystem respiration mainly determined by temperature, but seemed less affected by soil water content. The ecosystem photosynthesis activity mainly controlled by the absorbed photosynthetic active radiation (APAR), but it was also greatly influenced by vapor pressure deficit (VPD). The carbon sequestration ability of the larch plantation peaked in June, and totally absorbed 110 gC m-2 mon-1 (with friction velocity (u*) > 0.2 m s-1) or 140 gC m-2 mon-1 (with u* >0 m s-1). During this study period, the larch ecosystem acted as a carbon sink and sequestered 120 gC m-2 yr-1 (u* > 0.2 m s-1) to 190 gC m-2 yr-1 (u* > 0 m s-1). This result is comparable with that observed in a Japanese larch forest at Tomakomai flux site in northern Japan, where the larch ecosystem sequestered 141 to 240 gC m-2 yr-1 (Wang et al, 2004), but it is much higher than that in Siberia and Mongolia regions, where the larch forest ecosystems absorbed 90~85 gC m-2 yr-1 (Hollinger et al., 1998; Li et al., 2005).
P38
80- 80 -
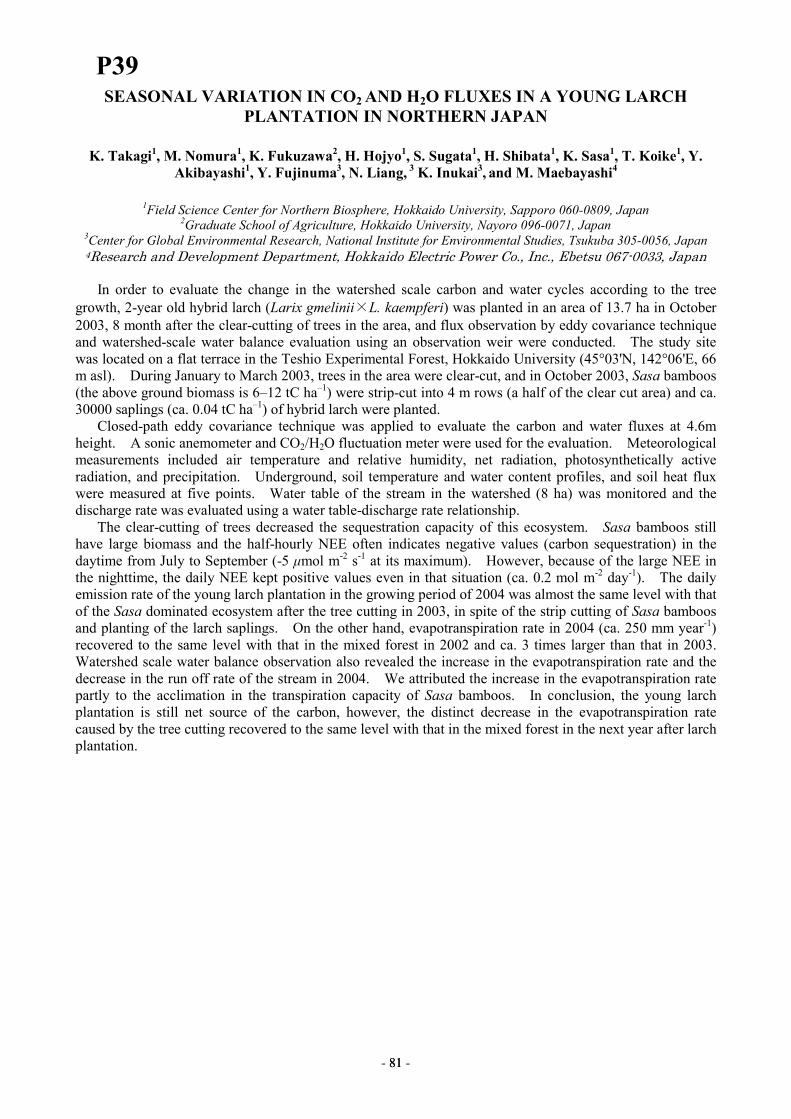
SEASONAL VARIATION IN CO2 AND H2O FLUXES IN A YOUNG LARCH
PLANTATION IN NORTHERN JAPAN
K. Takagi
1, M. Nomura
1, K. Fukuzawa
2, H. Hojyo
1, S. Sugata
1, H. Shibata
1, K. Sasa
1, T. Koike
1, Y.
Akibayashi1, Y. Fujinuma
3, N. Liang,
3 K. Inukai
3, and M. Maebayashi
4
1Field Science Center for Northern Biosphere, Hokkaido University, Sapporo 060-0809, Japan
2Graduate School of Agriculture, Hokkaido University, Nayoro 096-0071, Japan
3Center for Global Environmental Research, National Institute for Environmental Studies, Tsukuba 305-0056, Japan 4Research and Development Department, Hokkaido Electric Power Co., Inc., Ebetsu 067-0033, Japan
In order to evaluate the change in the watershed scale carbon and water cycles according to the tree
growth, 2-year old hybrid larch (Larix gmelinii×L. kaempferi) was planted in an area of 13.7 ha in October
2003, 8 month after the clear-cutting of trees in the area, and flux observation by eddy covariance technique
and watershed-scale water balance evaluation using an observation weir were conducted. The study site
was located on a flat terrace in the Teshio Experimental Forest, Hokkaido University (45°03'N, 142°06'E, 66
m asl). During January to March 2003, trees in the area were clear-cut, and in October 2003, Sasa bamboos
(the above ground biomass is 6–12 tC ha–1) were strip-cut into 4 m rows (a half of the clear cut area) and ca.
30000 saplings (ca. 0.04 tC ha–1) of hybrid larch were planted.
Closed-path eddy covariance technique was applied to evaluate the carbon and water fluxes at 4.6m
height. A sonic anemometer and CO2/H2O fluctuation meter were used for the evaluation. Meteorological
measurements included air temperature and relative humidity, net radiation, photosynthetically active
radiation, and precipitation. Underground, soil temperature and water content profiles, and soil heat flux
were measured at five points. Water table of the stream in the watershed (8 ha) was monitored and the
discharge rate was evaluated using a water table-discharge rate relationship.
The clear-cutting of trees decreased the sequestration capacity of this ecosystem. Sasa bamboos still
have large biomass and the half-hourly NEE often indicates negative values (carbon sequestration) in the
daytime from July to September (-5 µmol m-2 s-1 at its maximum). However, because of the large NEE in
the nighttime, the daily NEE kept positive values even in that situation (ca. 0.2 mol m-2 day
-1). The daily
emission rate of the young larch plantation in the growing period of 2004 was almost the same level with that
of the Sasa dominated ecosystem after the tree cutting in 2003, in spite of the strip cutting of Sasa bamboos
and planting of the larch saplings. On the other hand, evapotranspiration rate in 2004 (ca. 250 mm year-1)
recovered to the same level with that in the mixed forest in 2002 and ca. 3 times larger than that in 2003.
Watershed scale water balance observation also revealed the increase in the evapotranspiration rate and the
decrease in the run off rate of the stream in 2004. We attributed the increase in the evapotranspiration rate
partly to the acclimation in the transpiration capacity of Sasa bamboos. In conclusion, the young larch
plantation is still net source of the carbon, however, the distinct decrease in the evapotranspiration rate
caused by the tree cutting recovered to the same level with that in the mixed forest in the next year after larch
plantation.
P39
81- 81 -
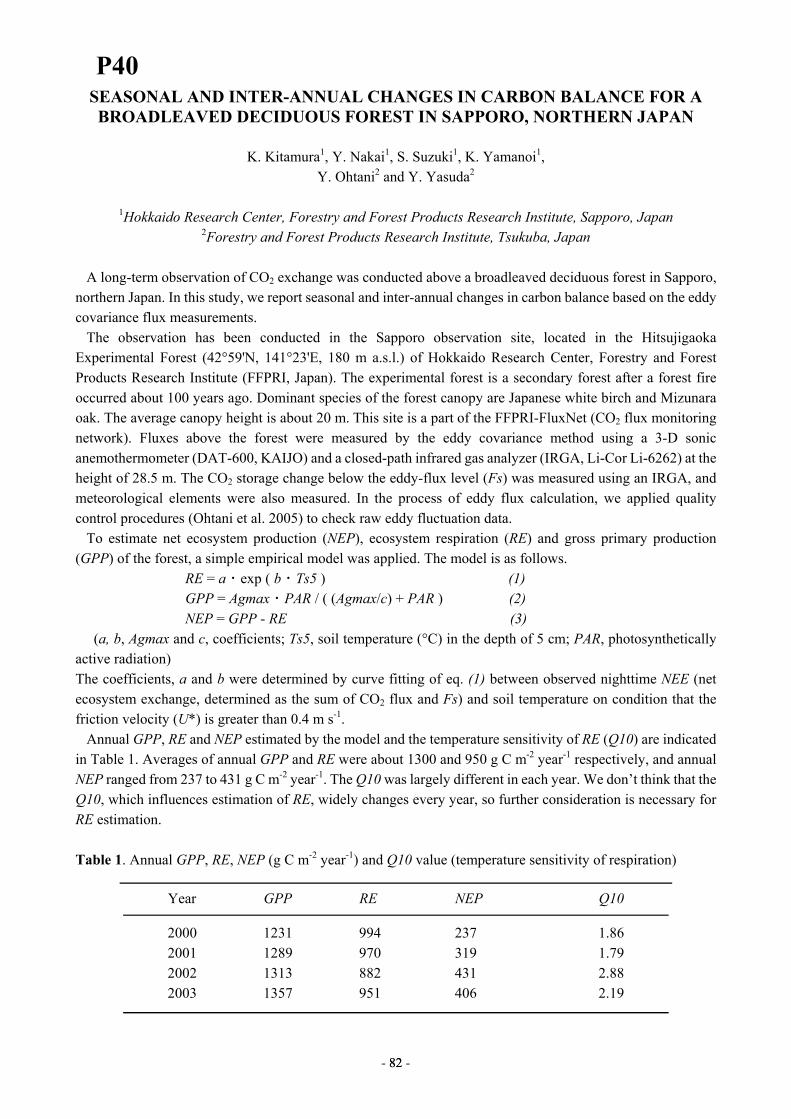
SEASONAL AND INTER-ANNUAL CHANGES IN CARBON BALANCE FOR A BROADLEAVED DECIDUOUS FOREST IN SAPPORO, NORTHERN JAPAN
K. Kitamura1, Y. Nakai1, S. Suzuki1, K. Yamanoi1,
Y. Ohtani2 and Y. Yasuda2
1Hokkaido Research Center, Forestry and Forest Products Research Institute, Sapporo, Japan 2Forestry and Forest Products Research Institute, Tsukuba, Japan
A long-term observation of CO2 exchange was conducted above a broadleaved deciduous forest in Sapporo, northern Japan. In this study, we report seasonal and inter-annual changes in carbon balance based on the eddy covariance flux measurements. The observation has been conducted in the Sapporo observation site, located in the Hitsujigaoka Experimental Forest (42°59'N, 141°23'E, 180 m a.s.l.) of Hokkaido Research Center, Forestry and Forest Products Research Institute (FFPRI, Japan). The experimental forest is a secondary forest after a forest fire occurred about 100 years ago. Dominant species of the forest canopy are Japanese white birch and Mizunara oak. The average canopy height is about 20 m. This site is a part of the FFPRI-FluxNet (CO2 flux monitoring network). Fluxes above the forest were measured by the eddy covariance method using a 3-D sonic anemothermometer (DAT-600, KAIJO) and a closed-path infrared gas analyzer (IRGA, Li-Cor Li-6262) at the height of 28.5 m. The CO2 storage change below the eddy-flux level (Fs) was measured using an IRGA, and meteorological elements were also measured. In the process of eddy flux calculation, we applied quality control procedures (Ohtani et al. 2005) to check raw eddy fluctuation data. To estimate net ecosystem production (NEP), ecosystem respiration (RE) and gross primary production (GPP) of the forest, a simple empirical model was applied. The model is as follows. RE = a ・ exp ( b ・ Ts5 ) (1) GPP = Agmax ・ PAR / ( (Agmax/c) + PAR ) (2) NEP = GPP - RE (3) (a, b, Agmax and c, coefficients; Ts5, soil temperature (°C) in the depth of 5 cm; PAR, photosynthetically active radiation) The coefficients, a and b were determined by curve fitting of eq. (1) between observed nighttime NEE (net ecosystem exchange, determined as the sum of CO2 flux and Fs) and soil temperature on condition that the friction velocity (U*) is greater than 0.4 m s-1. Annual GPP, RE and NEP estimated by the model and the temperature sensitivity of RE (Q10) are indicated in Table 1. Averages of annual GPP and RE were about 1300 and 950 g C m-2 year-1 respectively, and annual NEP ranged from 237 to 431 g C m-2 year-1. The Q10 was largely different in each year. We don’t think that the Q10, which influences estimation of RE, widely changes every year, so further consideration is necessary for RE estimation. Table 1. Annual GPP, RE, NEP (g C m-2 year-1) and Q10 value (temperature sensitivity of respiration)
Year GPP RE NEP Q10
2000 1231 994 237 1.86 2001 1289 970 319 1.79 2002 1313 882 431 2.88 2003 1357 951 406 2.19
P40
82- 82 -
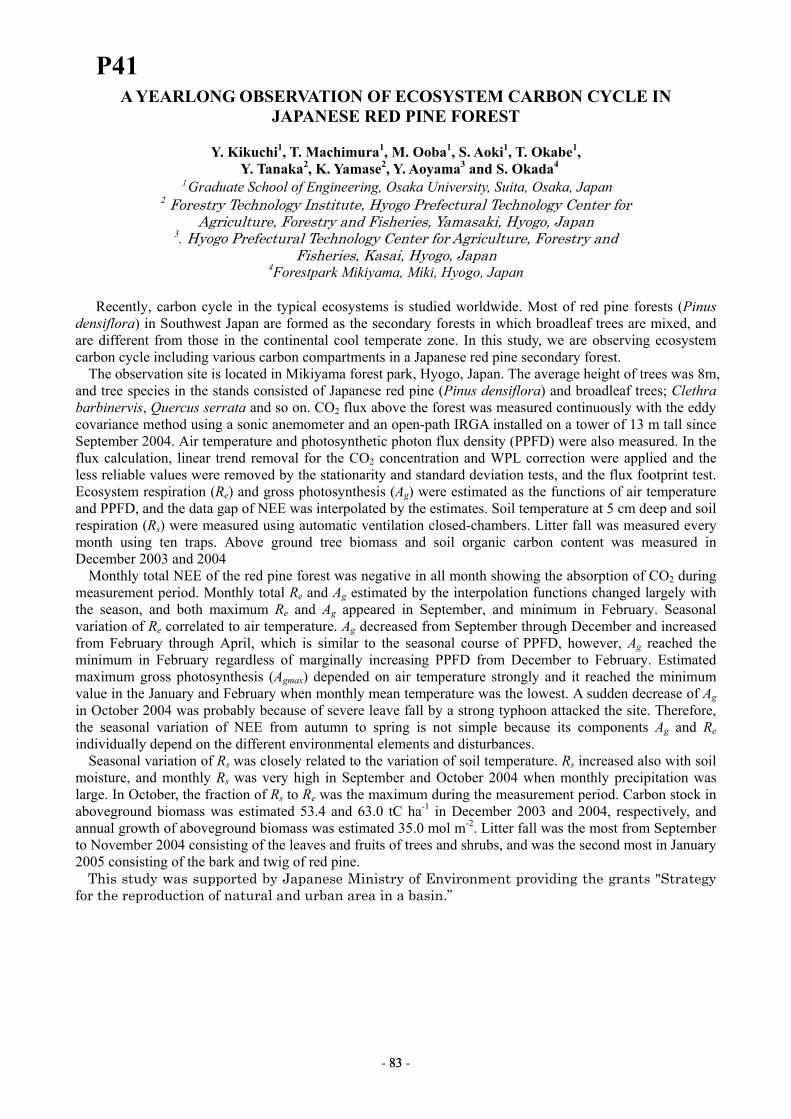
A YEARLONG OBSERVATION OF ECOSYSTEM CARBON CYCLE IN JAPANESE RED PINE FOREST
Y. Kikuchi1, T. Machimura1, M. Ooba1, S. Aoki1, T. Okabe1,
Y. Tanaka2, K. Yamase2, Y. Aoyama3 and S. Okada4
1Graduate School of Engineering, Osaka University, Suita, Osaka, Japan 2 Forestry Technology Institute, Hyogo Prefectural Technology Center for
Agriculture, Forestry and Fisheries, Yamasaki, Hyogo, Japan 3. Hyogo Prefectural Technology Center for Agriculture, Forestry and
Fisheries, Kasai, Hyogo, Japan 4Forestpark Mikiyama, Miki, Hyogo, Japan
Recently, carbon cycle in the typical ecosystems is studied worldwide. Most of red pine forests (Pinus
densiflora) in Southwest Japan are formed as the secondary forests in which broadleaf trees are mixed, and are different from those in the continental cool temperate zone. In this study, we are observing ecosystem carbon cycle including various carbon compartments in a Japanese red pine secondary forest.
The observation site is located in Mikiyama forest park, Hyogo, Japan. The average height of trees was 8m, and tree species in the stands consisted of Japanese red pine (Pinus densiflora) and broadleaf trees; Clethra barbinervis, Quercus serrata and so on. CO2 flux above the forest was measured continuously with the eddy covariance method using a sonic anemometer and an open-path IRGA installed on a tower of 13 m tall since September 2004. Air temperature and photosynthetic photon flux density (PPFD) were also measured. In the flux calculation, linear trend removal for the CO2 concentration and WPL correction were applied and the less reliable values were removed by the stationarity and standard deviation tests, and the flux footprint test. Ecosystem respiration (Re) and gross photosynthesis (Ag) were estimated as the functions of air temperature and PPFD, and the data gap of NEE was interpolated by the estimates. Soil temperature at 5 cm deep and soil respiration (Rs) were measured using automatic ventilation closed-chambers. Litter fall was measured every month using ten traps. Above ground tree biomass and soil organic carbon content was measured in December 2003 and 2004
Monthly total NEE of the red pine forest was negative in all month showing the absorption of CO2 during measurement period. Monthly total Re and Ag estimated by the interpolation functions changed largely with the season, and both maximum Re and Ag appeared in September, and minimum in February. Seasonal variation of Re correlated to air temperature. Ag decreased from September through December and increased from February through April, which is similar to the seasonal course of PPFD, however, Ag reached the minimum in February regardless of marginally increasing PPFD from December to February. Estimated maximum gross photosynthesis (Agmax) depended on air temperature strongly and it reached the minimum value in the January and February when monthly mean temperature was the lowest. A sudden decrease of Ag in October 2004 was probably because of severe leave fall by a strong typhoon attacked the site. Therefore, the seasonal variation of NEE from autumn to spring is not simple because its components Ag and Re individually depend on the different environmental elements and disturbances.
Seasonal variation of Rs was closely related to the variation of soil temperature. Rs increased also with soil moisture, and monthly Rs was very high in September and October 2004 when monthly precipitation was large. In October, the fraction of Rs to Re was the maximum during the measurement period. Carbon stock in aboveground biomass was estimated 53.4 and 63.0 tC ha-1 in December 2003 and 2004, respectively, and annual growth of aboveground biomass was estimated 35.0 mol m-2. Litter fall was the most from September to November 2004 consisting of the leaves and fruits of trees and shrubs, and was the second most in January 2005 consisting of the bark and twig of red pine.
This study was supported by Japanese Ministry of Environment providing the grants "Strategy for the reproduction of natural and urban area in a basin.”
P41
83- 83 -
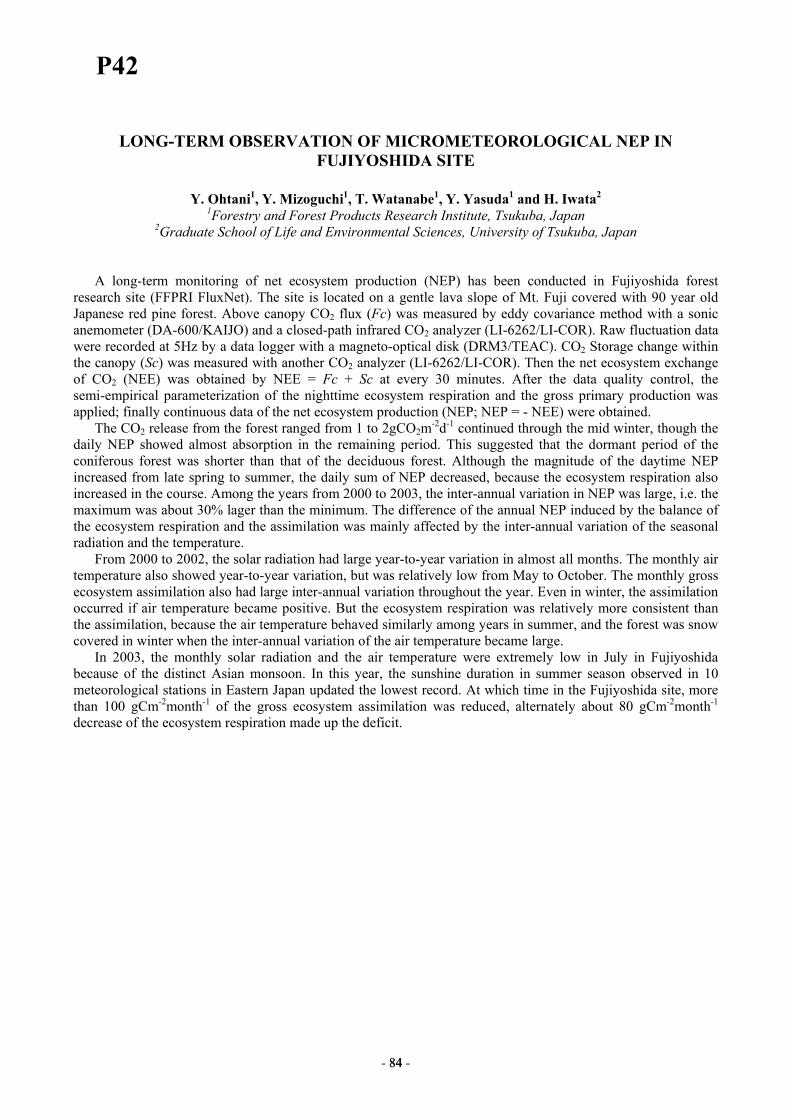
LONG-TERM OBSERVATION OF MICROMETEOROLOGICAL NEP IN FUJIYOSHIDA SITE
Y. Ohtani1, Y. Mizoguchi1, T. Watanabe1, Y. Yasuda1 and H. Iwata2
1Forestry and Forest Products Research Institute, Tsukuba, Japan 2Graduate School of Life and Environmental Sciences, University of Tsukuba, Japan
A long-term monitoring of net ecosystem production (NEP) has been conducted in Fujiyoshida forest
research site (FFPRI FluxNet). The site is located on a gentle lava slope of Mt. Fuji covered with 90 year old Japanese red pine forest. Above canopy CO2 flux (Fc) was measured by eddy covariance method with a sonic anemometer (DA-600/KAIJO) and a closed-path infrared CO2 analyzer (LI-6262/LI-COR). Raw fluctuation data were recorded at 5Hz by a data logger with a magneto-optical disk (DRM3/TEAC). CO2 Storage change within the canopy (Sc) was measured with another CO2 analyzer (LI-6262/LI-COR). Then the net ecosystem exchange of CO2 (NEE) was obtained by NEE = Fc + Sc at every 30 minutes. After the data quality control, the semi-empirical parameterization of the nighttime ecosystem respiration and the gross primary production was applied; finally continuous data of the net ecosystem production (NEP; NEP = - NEE) were obtained.
The CO2 release from the forest ranged from 1 to 2gCO2m-2d-1 continued through the mid winter, though the daily NEP showed almost absorption in the remaining period. This suggested that the dormant period of the coniferous forest was shorter than that of the deciduous forest. Although the magnitude of the daytime NEP increased from late spring to summer, the daily sum of NEP decreased, because the ecosystem respiration also increased in the course. Among the years from 2000 to 2003, the inter-annual variation in NEP was large, i.e. the maximum was about 30% lager than the minimum. The difference of the annual NEP induced by the balance of the ecosystem respiration and the assimilation was mainly affected by the inter-annual variation of the seasonal radiation and the temperature.
From 2000 to 2002, the solar radiation had large year-to-year variation in almost all months. The monthly air temperature also showed year-to-year variation, but was relatively low from May to October. The monthly gross ecosystem assimilation also had large inter-annual variation throughout the year. Even in winter, the assimilation occurred if air temperature became positive. But the ecosystem respiration was relatively more consistent than the assimilation, because the air temperature behaved similarly among years in summer, and the forest was snow covered in winter when the inter-annual variation of the air temperature became large.
In 2003, the monthly solar radiation and the air temperature were extremely low in July in Fujiyoshida because of the distinct Asian monsoon. In this year, the sunshine duration in summer season observed in 10 meteorological stations in Eastern Japan updated the lowest record. At which time in the Fujiyoshida site, more than 100 gCm-2month-1 of the gross ecosystem assimilation was reduced, alternately about 80 gCm-2month-1 decrease of the ecosystem respiration made up the deficit.
P42
84- 84 -
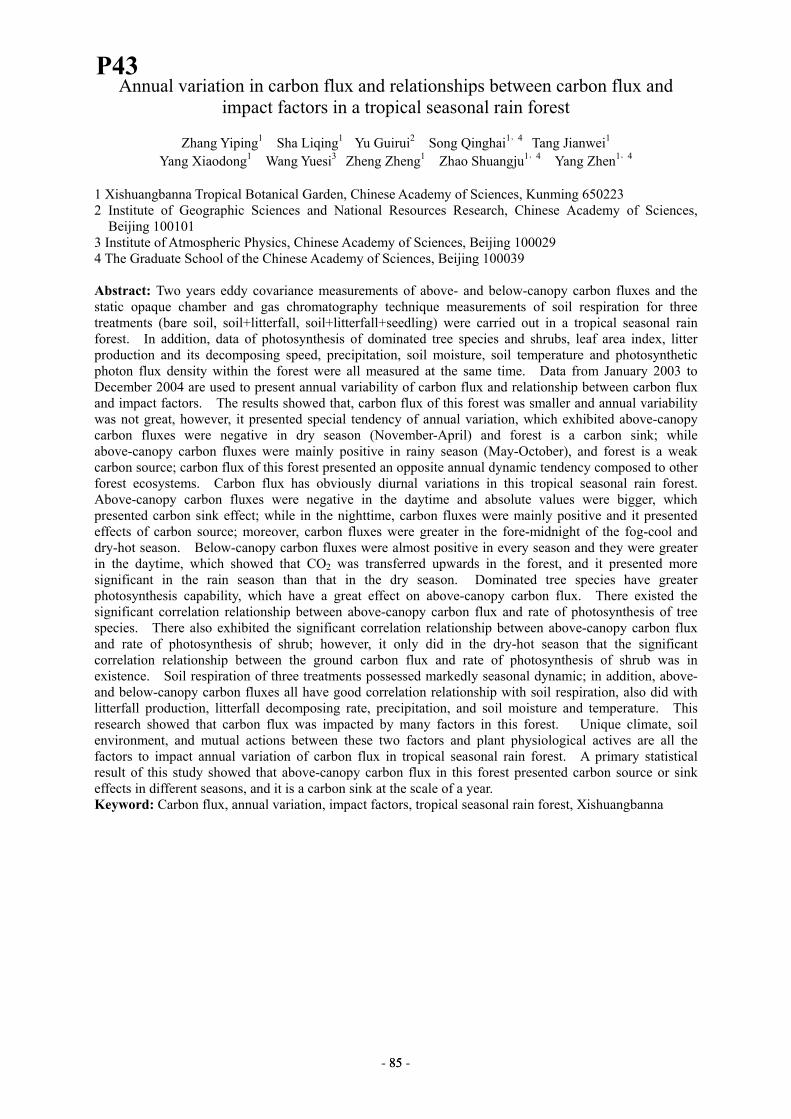
Annual variation in carbon flux and relationships between carbon flux and impact factors in a tropical seasonal rain forest
Zhang Yiping1 Sha Liqing1 Yu Guirui2 Song Qinghai1,4 Tang Jianwei1
Yang Xiaodong1 Wang Yuesi3 Zheng Zheng1 Zhao Shuangju1,4 Yang Zhen1,4 1 Xishuangbanna Tropical Botanical Garden, Chinese Academy of Sciences, Kunming 650223 2 Institute of Geographic Sciences and National Resources Research, Chinese Academy of Sciences,
Beijing 100101 3 Institute of Atmospheric Physics, Chinese Academy of Sciences, Beijing 100029 4 The Graduate School of the Chinese Academy of Sciences, Beijing 100039
Abstract: Two years eddy covariance measurements of above- and below-canopy carbon fluxes and the static opaque chamber and gas chromatography technique measurements of soil respiration for three treatments (bare soil, soil+litterfall, soil+litterfall+seedling) were carried out in a tropical seasonal rain forest. In addition, data of photosynthesis of dominated tree species and shrubs, leaf area index, litter production and its decomposing speed, precipitation, soil moisture, soil temperature and photosynthetic photon flux density within the forest were all measured at the same time. Data from January 2003 to December 2004 are used to present annual variability of carbon flux and relationship between carbon flux and impact factors. The results showed that, carbon flux of this forest was smaller and annual variability was not great, however, it presented special tendency of annual variation, which exhibited above-canopy carbon fluxes were negative in dry season (November-April) and forest is a carbon sink; while above-canopy carbon fluxes were mainly positive in rainy season (May-October), and forest is a weak carbon source; carbon flux of this forest presented an opposite annual dynamic tendency composed to other forest ecosystems. Carbon flux has obviously diurnal variations in this tropical seasonal rain forest. Above-canopy carbon fluxes were negative in the daytime and absolute values were bigger, which presented carbon sink effect; while in the nighttime, carbon fluxes were mainly positive and it presented effects of carbon source; moreover, carbon fluxes were greater in the fore-midnight of the fog-cool and dry-hot season. Below-canopy carbon fluxes were almost positive in every season and they were greater in the daytime, which showed that CO2 was transferred upwards in the forest, and it presented more significant in the rain season than that in the dry season. Dominated tree species have greater photosynthesis capability, which have a great effect on above-canopy carbon flux. There existed the significant correlation relationship between above-canopy carbon flux and rate of photosynthesis of tree species. There also exhibited the significant correlation relationship between above-canopy carbon flux and rate of photosynthesis of shrub; however, it only did in the dry-hot season that the significant correlation relationship between the ground carbon flux and rate of photosynthesis of shrub was in existence. Soil respiration of three treatments possessed markedly seasonal dynamic; in addition, above- and below-canopy carbon fluxes all have good correlation relationship with soil respiration, also did with litterfall production, litterfall decomposing rate, precipitation, and soil moisture and temperature. This research showed that carbon flux was impacted by many factors in this forest. Unique climate, soil environment, and mutual actions between these two factors and plant physiological actives are all the factors to impact annual variation of carbon flux in tropical seasonal rain forest. A primary statistical result of this study showed that above-canopy carbon flux in this forest presented carbon source or sink effects in different seasons, and it is a carbon sink at the scale of a year. Keyword: Carbon flux, annual variation, impact factors, tropical seasonal rain forest, Xishuangbanna
P43
85- 85 -
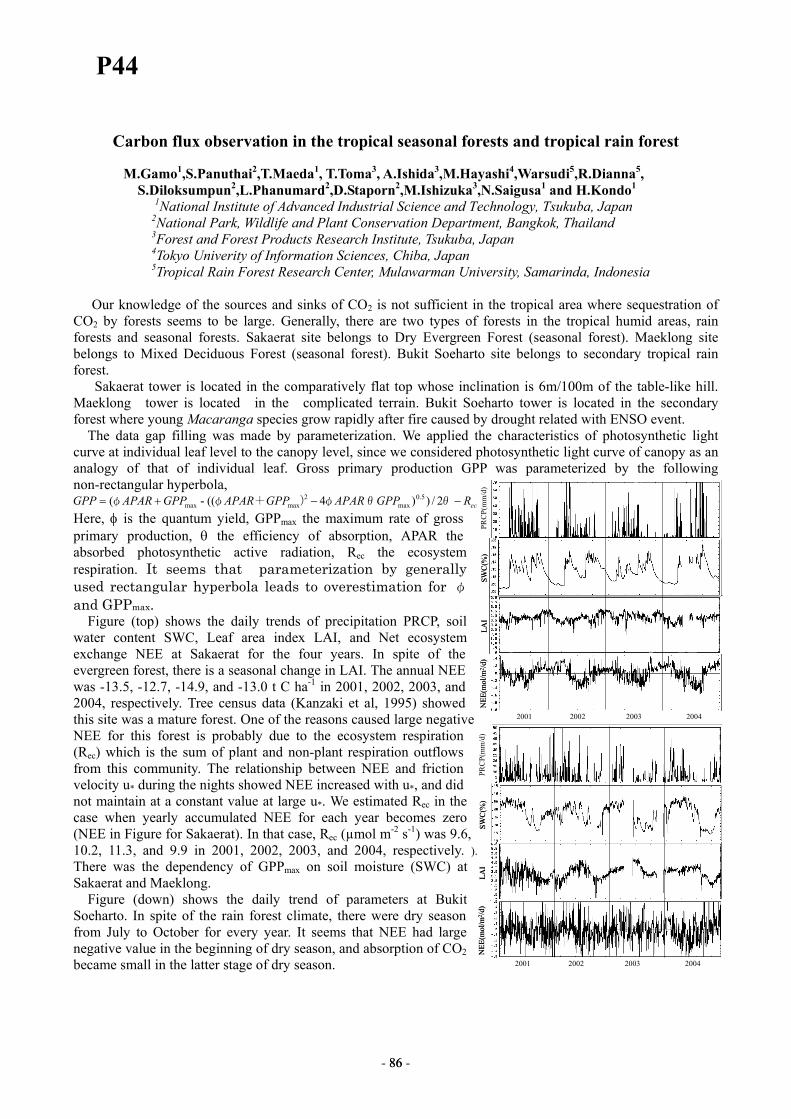
PRC
P(m
m/d
)SW
C(%
)LA
IN
EE(m
ol/m
2 /d)
2001 2002 2003 2004
PRC
P(m
m/d
)SW
C(%
)LA
IN
EE(m
ol/m
2 /d)
2001 2002 2003 2004
ecRGPPAPARGPPAPARGPPAPARGPP −−+= θ θφ)+φ φ 2/))4((-( 5.0max
2maxmax
PRC
P(m
m/d
)SW
C(%
)LA
IN
EE(m
ol/m
2 /d)
2001 2002 2003 2004
PRC
P(m
m/d
)SW
C(%
)LA
IN
EE(m
ol/m
2 /d)
2001 2002 2003 2004
Carbon flux observation in the tropical seasonal forests and tropical rain forest M.Gamo1,S.Panuthai2,T.Maeda1, T.Toma3, A.Ishida3,M.Hayashi4,Warsudi5,R.Dianna5, S.Diloksumpun2,L.Phanumard2,D.Staporn2,M.Ishizuka3,N.Saigusa1 and H.Kondo1
1National Institute of Advanced Industrial Science and Technology, Tsukuba, Japan 2National Park, Wildlife and Plant Conservation Department, Bangkok, Thailand 3Forest and Forest Products Research Institute, Tsukuba, Japan 4Tokyo Univerity of Information Sciences, Chiba, Japan 5Tropical Rain Forest Research Center, Mulawarman University, Samarinda, Indonesia Our knowledge of the sources and sinks of CO2 is not sufficient in the tropical area where sequestration of CO2 by forests seems to be large. Generally, there are two types of forests in the tropical humid areas, rain forests and seasonal forests. Sakaerat site belongs to Dry Evergreen Forest (seasonal forest). Maeklong site belongs to Mixed Deciduous Forest (seasonal forest). Bukit Soeharto site belongs to secondary tropical rain forest.
Sakaerat tower is located in the comparatively flat top whose inclination is 6m/100m of the table-like hill. Maeklong tower is located in the complicated terrain. Bukit Soeharto tower is located in the secondary forest where young Macaranga species grow rapidly after fire caused by drought related with ENSO event.
The data gap filling was made by parameterization. We applied the characteristics of photosynthetic light curve at individual leaf level to the canopy level, since we considered photosynthetic light curve of canopy as an analogy of that of individual leaf. Gross primary production GPP was parameterized by the following non-rectangular hyperbola,
Here, φ is the quantum yield, GPPmax the maximum rate of gross primary production, θ the efficiency of absorption, APAR the absorbed photosynthetic active radiation, Rec the ecosystem respiration. It seems that parameterization by generally used rectangular hyperbola leads to overestimation for φ and GPPmax. Figure (top) shows the daily trends of precipitation PRCP, soil water content SWC, Leaf area index LAI, and Net ecosystem exchange NEE at Sakaerat for the four years. In spite of the evergreen forest, there is a seasonal change in LAI. The annual NEE was -13.5, -12.7, -14.9, and -13.0 t C ha-1 in 2001, 2002, 2003, and 2004, respectively. Tree census data (Kanzaki et al, 1995) showed this site was a mature forest. One of the reasons caused large negative NEE for this forest is probably due to the ecosystem respiration (Rec) which is the sum of plant and non-plant respiration outflows from this community. The relationship between NEE and friction velocity u* during the nights showed NEE increased with u*, and did not maintain at a constant value at large u*. We estimated Rec in the case when yearly accumulated NEE for each year becomes zero (NEE in Figure for Sakaerat). In that case, Rec (µmol m-2 s-1) was 9.6, 10.2, 11.3, and 9.9 in 2001, 2002, 2003, and 2004, respectively. ). There was the dependency of GPPmax on soil moisture (SWC) at Sakaerat and Maeklong. Figure (down) shows the daily trend of parameters at Bukit Soeharto. In spite of the rain forest climate, there were dry season from July to October for every year. It seems that NEE had large negative value in the beginning of dry season, and absorption of CO2 became small in the latter stage of dry season.
P44
86- 86 -
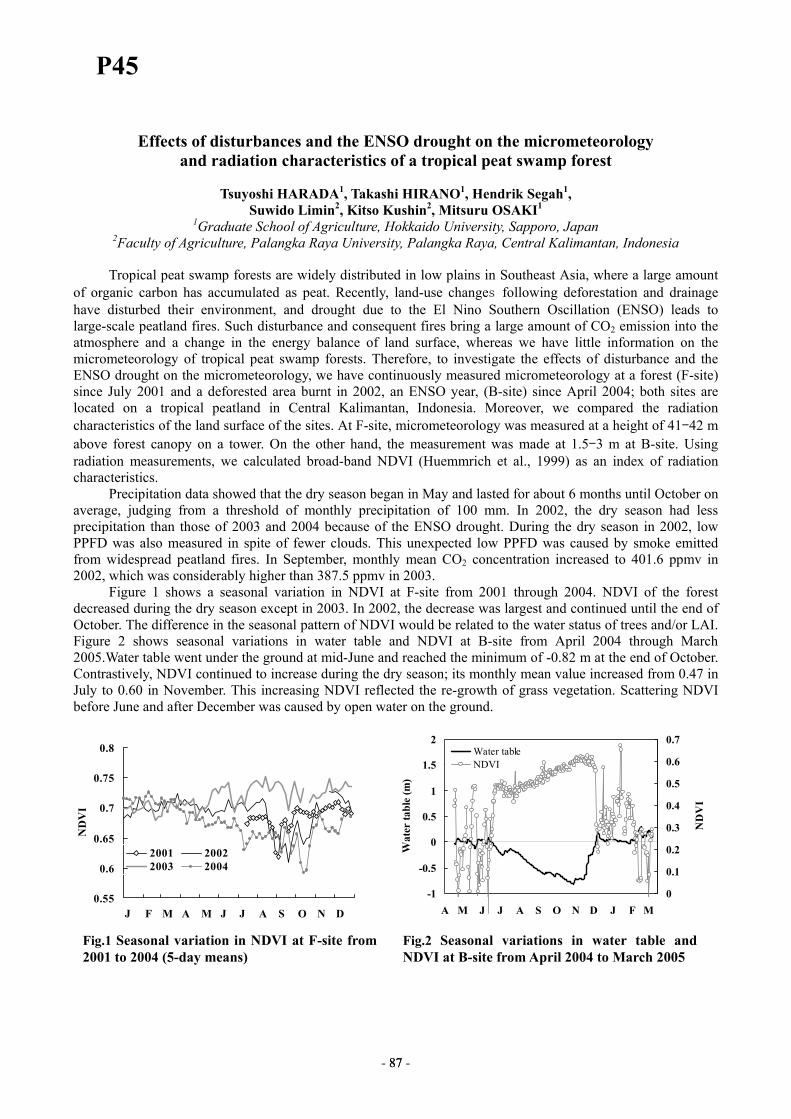
Effects of disturbances and the ENSO drought on the micrometeorology and radiation characteristics of a tropical peat swamp forest
Tsuyoshi HARADA1, Takashi HIRANO1, Hendrik Segah1,
Suwido Limin2, Kitso Kushin2, Mitsuru OSAKI1 1Graduate School of Agriculture, Hokkaido University, Sapporo, Japan
2Faculty of Agriculture, Palangka Raya University, Palangka Raya, Central Kalimantan, Indonesia
Tropical peat swamp forests are widely distributed in low plains in Southeast Asia, where a large amount of organic carbon has accumulated as peat. Recently, land-use changes following deforestation and drainage have disturbed their environment, and drought due to the El Nino Southern Oscillation (ENSO) leads to large-scale peatland fires. Such disturbance and consequent fires bring a large amount of CO2 emission into the atmosphere and a change in the energy balance of land surface, whereas we have little information on the micrometeorology of tropical peat swamp forests. Therefore, to investigate the effects of disturbance and the ENSO drought on the micrometeorology, we have continuously measured micrometeorology at a forest (F-site) since July 2001 and a deforested area burnt in 2002, an ENSO year, (B-site) since April 2004; both sites are located on a tropical peatland in Central Kalimantan, Indonesia. Moreover, we compared the radiation characteristics of the land surface of the sites. At F-site, micrometeorology was measured at a height of 41–42 m above forest canopy on a tower. On the other hand, the measurement was made at 1.5–3 m at B-site. Using radiation measurements, we calculated broad-band NDVI (Huemmrich et al., 1999) as an index of radiation characteristics.
Precipitation data showed that the dry season began in May and lasted for about 6 months until October on average, judging from a threshold of monthly precipitation of 100 mm. In 2002, the dry season had less precipitation than those of 2003 and 2004 because of the ENSO drought. During the dry season in 2002, low PPFD was also measured in spite of fewer clouds. This unexpected low PPFD was caused by smoke emitted from widespread peatland fires. In September, monthly mean CO2 concentration increased to 401.6 ppmv in 2002, which was considerably higher than 387.5 ppmv in 2003.
Figure 1 shows a seasonal variation in NDVI at F-site from 2001 through 2004. NDVI of the forest decreased during the dry season except in 2003. In 2002, the decrease was largest and continued until the end of October. The difference in the seasonal pattern of NDVI would be related to the water status of trees and/or LAI. Figure 2 shows seasonal variations in water table and NDVI at B-site from April 2004 through March 2005.Water table went under the ground at mid-June and reached the minimum of -0.82 m at the end of October. Contrastively, NDVI continued to increase during the dry season; its monthly mean value increased from 0.47 in July to 0.60 in November. This increasing NDVI reflected the re-growth of grass vegetation. Scattering NDVI before June and after December was caused by open water on the ground.
Fig.1 Seasonal variation in NDVI at F-site from 2001 to 2004 (5-day means)
Fig.2 Seasonal variations in water table and NDVI at B-site from April 2004 to March 2005
0.55
0.6
0.65
0.7
0.75
0.8
J F M A M J J A S O N D
ND
VI
2001 20022003 2004
-1
-0.5
0
0.5
1
1.5
2
A M J J A S O N D J F M
Wat
er ta
ble
(m)
0
0.1
0.2
0.3
0.4
0.5
0.6
0.7
ND
VI
Water tableNDVI
P45
87- 87 -
CARBON DIOXIDE EXCHANGE MONITORING AND RESEARCH PROGRAMS AT THE HUNGARIAN TALL TOWER SITE
Z. Barcza1, L. Haszpra2, D. Hidy1, Zs. Iványi3, A. Kern1, H. Kondo4, N. Saigusa4, T. Szabó1,
K. Tarczay1 and S. Yamamoto5
1Eötvös Loránd University, Budapest, Hungary 2Hungarian Meteorological Service, Budapest, Hungary
3The Regional Environmental Center for Central and Eastern Europe, Szentendre, Hungary 4National Institute of Advanced Industrial Science and Technology, Tsukuba, Japan
5Okayama University, Okayama, Japan The mixing ratio and the surface-atmosphere exchange of carbon dioxide have been monitored at different elevations on a tall tower in West Hungary (Hegyhátsál, 46o57'N, 16o39'E, 248 m asl) since 1994 and 1997, respectively. The vertical mixing ratio profile measurements along the 115 m tall tower has been completed with occasional aircraft measurements up to 3000 m above the ground. The poster presents the Hungarian tall tower site and the temporal variation of carbon dioxide observed here. The research activities that are related to the measurement site are also presented together with the linkages with the core measurements. We discuss the region of influence determining the mixing ratio variability, the so-called concentration footprint, as well as that of the flux measurements. The environmental factors governing the net ecosystem exchange (NEE) of the vegetation are analyzed by means of a process oriented ecosystem simulation model. It might be used to estimate the future behavior of the region as the climate is changing. On the basis of the measurements at Hegyhátsál a boundary layer model has been developed which can give rough surface-atmosphere carbon dioxide flux estimate for sites where only surface mixing ratio monitoring is available.
P46
88- 88 -
FLUXES OF CARBON DIOXIDE, WATER VAPOR AND ENERGY OVER A TEMPERATE GRASSLAND IN CENTRAL JAPAN FROM AUTUMN TO
EARLY SUMMER
S. Matsuura1, A. Miyata2, M. Mano2, M. Oikawa3, R. Hatano4, M. Hojito1, A. Mori1, K. Kohyama2 and H. Sasaki1
1National Institute of Livestock and Grassland Science, Nasushiobara, Japan 2National Institute for Agro-Environmental Sciences, Tsukuba, Japan
3Japan Grassland Agriculture and Forage Seed Association, Tokyo, Japan 4Hokkaido University, Sapporo, Japan
To investigate the influence of manure application on greenhouse gas budget of managed grasslands, we
started an experiment at four grassland sites in Japan. At each site, two plots were provided for the experiment, one for manure application (M plot) and the other for chemical fertilizer application (F plot), and fluxes of carbon dioxide (CO2), methane (CH4) and nitrous oxide (N2O) are measured at each plot. In this paper, we focus on CO2, and report results of eddy covariance measurements of CO2, water vapor and energy fluxes at one of the four sites in central Japan. The measurements were conducted from September 2004 to July 2005 at a grassland in National Institute of Livestock and Grassland Science, Nasushiobara, Japan (36°55’N, 139°58’E). The annual temperature and precipitation of this site is about 12.0°C and 1600 mm, respectively. The vegetation is dominated by orchard grass (Dactylis glomerata L.) and Italian ryegrass (Lolium multiflorum Lam.). Manure was applied on M plot after the last harvest of 2004 (mid-November). The eddy covariance system, which consisted of a sonic anemometer (CSAT3, Campbell Scientific) and an open-path infrared gas analyzer (LI-7500, LI-COR), was installed at each plot with instruments to measure other meteorological variables.
Seasonal changes in fluxes of latent heat (LE), sensible heat (H) and CO2 over the grassland of the two plots were quite similar even after the manure application. From the last harvest of 2004 to mid-March 2005, daily LE was kept constant at a value of around 1.9 MJ m-2 d-1 (equivalent to 0.8 mm d-1 in evapotranspiration rate (ET)). On the other hand, daily H, which was almost zero until late-January, took positive value from February to mid-March, and the Bowen ratio for midday increased from 0.6 to 1.4. CO2 flux temporally changed from negative to slightly positive after the last harvest of 2004. CO2 uptake was thereafter kept almost at a constant level, 0.6 g C m-2 d-1 on average, during this period. Even in mid-winter, diurnal variation of CO2 flux was observed, and daytime CO2 flux responded to changes in incident photosynthetically active photon flux density. From mid-March to the first harvest of 2005 (mid-May), daily LE and CO2 uptake increased markedly up to 13.0 MJ m-2 d-1 (5.3 mm d-1 in ET) and 9.7 g C m-2 d-1, respectively. In contrast, daily H decreased gradually to a constant level of 0.5 MJ m-2 d-1. After the first harvest of 2005, temporal release of CO2 to the atmosphere was observed, but with growth of aftermath CO2 uptake recovered rapidly to the pre-harvest level just 2 weeks later. Fluxes showed similar trends to the previous period: daily LE and CO2 uptake increased up to 13.1 MJ m-2 d-1 (5.4 mm d-1 in ET) and 10.7 g C m-2 d-1, respectively, and daily H decreased to a constant level of 0.6 MJ m-2 d-1.
In summary, this study showed seasonality of CO2, water vapor and energy fluxes over the temperate grassland in central Japan, and that the influence of different treatment on CO2 flux was insignificant. Furthermore, although the available data were limited, the results suggest that the grassland in central Japan may act as a CO2 sink throughout the year.
P47
89- 89 -
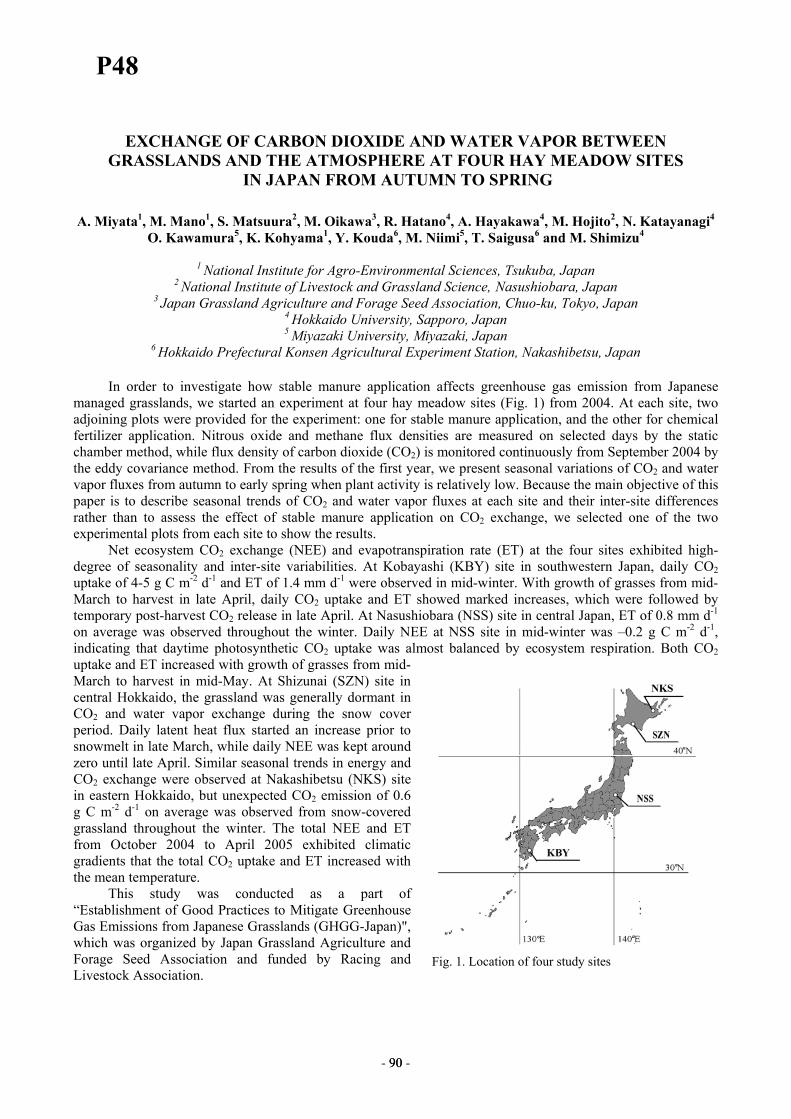
EXCHANGE OF CARBON DIOXIDE AND WATER VAPOR BETWEEN GRASSLANDS AND THE ATMOSPHERE AT FOUR HAY MEADOW SITES
IN JAPAN FROM AUTUMN TO SPRING
A. Miyata1, M. Mano1, S. Matsuura2, M. Oikawa3, R. Hatano4, A. Hayakawa4, M. Hojito2, N. Katayanagi4 O. Kawamura5, K. Kohyama1, Y. Kouda6, M. Niimi5, T. Saigusa6 and M. Shimizu4
1 National Institute for Agro-Environmental Sciences, Tsukuba, Japan
2 National Institute of Livestock and Grassland Science, Nasushiobara, Japan 3 Japan Grassland Agriculture and Forage Seed Association, Chuo-ku, Tokyo, Japan
4 Hokkaido University, Sapporo, Japan 5 Miyazaki University, Miyazaki, Japan
6 Hokkaido Prefectural Konsen Agricultural Experiment Station, Nakashibetsu, Japan
In order to investigate how stable manure application affects greenhouse gas emission from Japanese managed grasslands, we started an experiment at four hay meadow sites (Fig. 1) from 2004. At each site, two adjoining plots were provided for the experiment: one for stable manure application, and the other for chemical fertilizer application. Nitrous oxide and methane flux densities are measured on selected days by the static chamber method, while flux density of carbon dioxide (CO2) is monitored continuously from September 2004 by the eddy covariance method. From the results of the first year, we present seasonal variations of CO2 and water vapor fluxes from autumn to early spring when plant activity is relatively low. Because the main objective of this paper is to describe seasonal trends of CO2 and water vapor fluxes at each site and their inter-site differences rather than to assess the effect of stable manure application on CO2 exchange, we selected one of the two experimental plots from each site to show the results.
Net ecosystem CO2 exchange (NEE) and evapotranspiration rate (ET) at the four sites exhibited high-degree of seasonality and inter-site variabilities. At Kobayashi (KBY) site in southwestern Japan, daily CO2 uptake of 4-5 g C m-2 d-1 and ET of 1.4 mm d-1 were observed in mid-winter. With growth of grasses from mid-March to harvest in late April, daily CO2 uptake and ET showed marked increases, which were followed by temporary post-harvest CO2 release in late April. At Nasushiobara (NSS) site in central Japan, ET of 0.8 mm d-1 on average was observed throughout the winter. Daily NEE at NSS site in mid-winter was –0.2 g C m-2 d-1, indicating that daytime photosynthetic CO2 uptake was almost balanced by ecosystem respiration. Both CO2 uptake and ET increased with growth of grasses from mid-March to harvest in mid-May. At Shizunai (SZN) site in central Hokkaido, the grassland was generally dormant in CO2 and water vapor exchange during the snow cover period. Daily latent heat flux started an increase prior to snowmelt in late March, while daily NEE was kept around zero until late April. Similar seasonal trends in energy and CO2 exchange were observed at Nakashibetsu (NKS) site in eastern Hokkaido, but unexpected CO2 emission of 0.6 g C m-2 d-1 on average was observed from snow-covered grassland throughout the winter. The total NEE and ET from October 2004 to April 2005 exhibited climatic gradients that the total CO2 uptake and ET increased with the mean temperature.
This study was conducted as a part of “Establishment of Good Practices to Mitigate Greenhouse Gas Emissions from Japanese Grasslands (GHGG-Japan)", which was organized by Japan Grassland Agriculture and Forage Seed Association and funded by Racing and Livestock Association.
Fig. 1. Location of four study sites
P48
90- 90 -
MEASUREMENT AND SIMULATION ON CARBON AND WATER FLUX OF THE CROPLAND ECOSYSTEM IN NORTH CHINA PLAIN
Q.F. Wang and G.R. Yu
Institute of Geographical Sciences and Natural Resources Research, Chinese Academy of Sciences, Beijing, China
North China Plain is one of the most important areas of food production in China. Measurement and simulation on its carbon and water flux can help us understand the formation mechanism of crop yield, and evaluate the role of farmland in climate change. In this study, the experiment was performed at Yucheng Comprehensive Experiment Station (36°57′N,116°36′E, 20m a.s.l.) in the North China Plain characterized by a semi-humid and monsoon climate. Mean annual precipitation, temperature and global solar radiation at the station over the past 30 years are 528mm, 13.1℃, and 5225 MJm-2 respectively. The soil of the area is mainly the moisture soil and the salinized moisture soil. The vegetation is a winter wheat and summer maize rotation field. Winter wheat is sown in early October and harvested in mid June while summer maize is sown with the residues of the winter wheat in mid June and harvested in late September. The terrain surrounding it is vegetated with large, flat areas of crop field, upwind fetch of the site extends more than 5 km for winds from all directions. Continuous fluxes and meteorological measurements with the eddy covariance (EC) technique began on October 20, 2002. The EC system, mainly composed of a 3D sonic anemometer (model CSAT3, Campbell Sci., Logan, UT) and an open path, CO2/H2O analyzer (IRGA, Li-7500, Li-Cor Inc., Lincoln, Nebrasks, USA), could measure virtual fluctuations and averages of wind velocity, temperature, water and CO2 concentrations. Two soil heat flux plates (model HFT-3, Campbell Scientific Inc.) were embedded in between-rows and between-plants to determine fluxes. A data logger (model CR5000, Campbell Sci., Logan, UT) connected with the system operated at 10 Hz and the fluxes were averaged for 30 min periods. Along with the fluxes measurements, standard meteorological data were collected including air pressure, photosynthetic active radiation, net radiation, precipitation, soil temperature, soil moisture etc. Routine irrigation and fertilization were employed to achieve a non-limiting condition throughout the growing season. We obtained the temporal variation characteristics of CO2 and H2O flux of the farmland ecosystem with the observed data. On the other hand, according to the Synthetic Model of Photosynthesis-Transpiration based on Stomatal Behavior (SMPTSB) at leaf level developed by Yu et al. (2004), we scaled it up to ecosystem level by introducing soil respiration and aerodynamic resistance. The NEP, ET, and WUE of the cropland ecosystem in North China Plain were estimated with the model. With the measured data obtained by EC system, the simulation results were verified. The comparison showed that the simulated NEP, ET, and WUE were in good agreement with the measured values with relative high R2 values. Therefore, we deduced that the model not only provide a tool for simulating carbon and water flux at ecosystem level but also for partitioning the ET measured by EC system into evaporation and transpiration.
P49
91- 91 -
CO2 FLUX OBSERVED OVER A RICE PADDY FIELD BY THE EDDY COVARIANCE METHOD AND ITS QUALITY CHECK
T. Takimoto1 K. Inobe1 T. Iwata2 S. Yamamoto2 and T. Miura2
1Graduate School of Natural Science and Technology, University of Okayama, Okayama, Japan 2Graduate School of Environmental Science, University of Okayama, Okayama, Japan
Rice paddy field is one of the most popular cultivation patterns in East Asia under a monsoon climate. And it takes a great important role in carbon budget. Therefore, we have been observed CO2 flux above rice paddy field using eddy covariance method since 1999 in Okayama, Japan. The objectives of this observation are evaluating Net Ecosystem Exchange of CO2 (NEE) between atmosphere and rice paddy, and investigating between its seasonal variation or inter-annual variation and environmental factors. To evaluate reliable NEE at rice paddy, we have to check the data quality and to exclude the inappropriate data for eddy covariance method. In recent years, many kind of quality control were proposed; for example, criterion of atmospheric turbulence condition using u*, inspection of skewness and kurtosis which are higher moment terms using its threshold for testing of instationarity. But thresholds of these methods are depending on site or observation system, so they are not universal. Then, we can not apply automatically the threshold which is determined for certain condition to other condition. In this study, we determine the appropriate threshold for rice paddy field, and conduct quality control for the data in 2003 and 2004. Then we calculate the cumulative NEE using selected data with complement of the deficit data.
P50
92- 92 -
BOWEN RATIO MEASUREMENTS OF ENERGY BUDGET COMPONENTS OVER VARIOUS ECOSYSTEMS IN MYMENSINGH, BANGLADESH
R. Khatun1, M. A. Farukh1, A. Miyata2 and Md. A. Baten1
1Department of Environmental Science, Bangladesh Agricultural University, Mymensingh, Bangladesh
2National Institute for Agro-Environmental Sciences, Tsukuba, Japan
Micrometeorological studies on exchange of energy and water vapor between soil/vegetation and the atmosphere is a new research filed in Bangladesh. Partitioning of net radiation (Rn) into latent heat flux (lE), sensible heat flux (H) and ground heat flux (G) over any ecosystem was not reported so far in Bangladesh. We therefore designed experiments to provide preliminary information on lE, H and G over various ecosystems. Such information might be helpful for the AsiaFlux community to design gas flux measurements in Bangladesh in future. To fulfill our aim, experiments were carried out over various ecosystems viz. irrigated rice field, harvested rice field, grassland and bare land at Bangladesh Agricultural University Farm, Mymensingh from October to December 2004 using Bowen Ratio Energy Balance (BREB) technique.
Subtropical climate prevails in the experimental area. It is characterized by heavy rainfall from April to September and by a little shower from October to March. Late precipitation in September or even in October helped to store sufficient soil moisture during the experimental period. Soil moisture content, except for the irrigated rice filed, ranged from 39 to 45%. During the experiment, plant height of rice was 92-95 cm and its leaf area index was 2.8-3.0, while the harvested rice field had only rice straw with 10-15 cm in height. The grassland was covered with 34 species of grasses having 5-10 cm height, and the bare land site was a cultivated open land having no plants. A pair of temperature-humidity sensors equipped with homemade aspirators as well as a naturally ventilated net radiometer and heat flux plates were used to measure energy budget components. The experimental period at each site included 3 to 8 clear days in a row. The data in those periods were used for the following analysis.
At all of the four sites, diurnal trends of Rn, lE and G followed the diurnal course of global radiation. However, H showed slightly positive values, 5-15 W m-2, only around midday and was almost zero in other hours in the daytime. In the total energy balance of the daytime (from 0600 to 1800 hours), lE was dominant at all of the four sites, while H was minor. lE/Rn was 0.92 on average at the irrigated rice field, 0.82 at the harvested rice field, 0.84 at the grassland and 0.79 at the bare land. H/Rn was the largest at the bare land (0.04 on average) and even smaller in other three sites. G/Rn was greater than H/Rn, and ranged from 0.07 at the irrigated rice field to 0.15 at the bare land. In summary, surface energy balance in the study period was characterized by dominant lE and negligibly small H under sufficient soil moisture conditions, with small modification by vegetation.
P51
93- 93 -
SENSIBLE HEAT, LATENT HEAT, AND CO2 FLUXES ON THE LOESS PLATEAU IN CHINA DURING THE SEASON FROM SPRING TO SUMMER
IN 2005
Atsuhiro Takahashi1, Tetsuya Hiyama2, Atsushi Higuchi3, Wei Li2, Masanori Nishikawa2, Shaungjiang Li4, Wenzhao Liu4, and Yoshihiro Fukushima1
1Research Institute for Humanity and Nature, Kyoto, Japan 2Hydrospheric Atmospheric Research Center, Nagoya University, Nagoya, Japan
3Center for Environmental Remote Sensing, Chiba University, Chiba, Japan 4Institute of Soil and Water Conservation, Chinese Academy of Sciences, Shaanxi, China
The Loess plateau is located in the middle region of the Yellow river basin, China, and occupies
380,000 km2, which corresponds to about 3.9 % of total area of China. In May 2004, an observation system for measuring the atmospheric boundary layer (ABL) was installed in the southern part of the plateau in order to measure seasonal and inter-annual variations of ABL as well as to investigate the water cycles in the Yellow river basin. This observation was carried out as a part of the project of Yellow River Study, which has been promoted by Research Institute for Humanity and Nature, Japan, with cooperation by Chinese Academy of Sciences (CAS), China.
Flux Radiation Observation System (FROS) was established at the field of Changwu Agro-Ecological Experimental Station on the Loess Plateau (35°2’N, 107°8’E), Institute of Soil and Water Conservation, CAS. The elevation of the site is 1206.5 m. The average annual precipitation is 578 mm and the annual average air temperature is 9.2°C. The main species of crops in this region are wheat, corns, and apples, and much area of this region is randomly occupied by these agricultural fields. Meteorological instruments of FROS were installed on the 30 m-height observation tower and on the 2 m-height pole. Ultrasonic anemometers (Gill, UK) and open-path CO2/H2O gas analyzers (LI-7500, Li-COR, USA) were installed at heights of 30, 10, and 2 m. Wheat was seeded around the tower in early spring in 2005. Its height reached about 70 cm in May. The field of apple trees was situated in the north to northeast region. In the east, about 50 m apart from the tower, there are some residential buildings. Some narrow streets distribute around the observation site and residential houses stand alongside of the streets. Also, the main street lies at several hundreds meters apart from the observation site.
This study shows sensible heat, latent heat, and CO2 fluxes observed by FROS during the season from spring to summer in 2005. The period of the analyzed data is from 11th May to 12th July. The main results are as follows. 1) In May, each flux had almost constant profile in the vertical direction, respectively. This indicates that the biological activities of plants were closely similar among the different footprint areas for each flux measured at different heights, in spite of presence of several species of plants around the observation site. 2) An apparent influence of water vapor deficit was observed, i.e. the extent of aperture of stomata might be significantly regulated by water vapor deficit. 3) In June, as the color of wheat turned to yellow gradually indicating its biological activity decreased, the amplitudes of latent heat and CO2 fluxes measured at a height of 2 m became smaller than those measured at the other heights, 30 and 10 m. This may indicate that phenological degradation of wheat around the tower could be detected by the sensor at a height of 2 m. 3) In evening, efflux of CO2 was observed frequently caused by that respiration overcame photosynthesis. However, the efflux did not continue any longer than several hours, which might be caused by that respiration decreased with temperature decreased. On the other hand, when evaporation occurred due to downward (negative) sensible heat flux in windy condition during nighttime, respiration was maintained throughout the night.
P52
94- 94 -
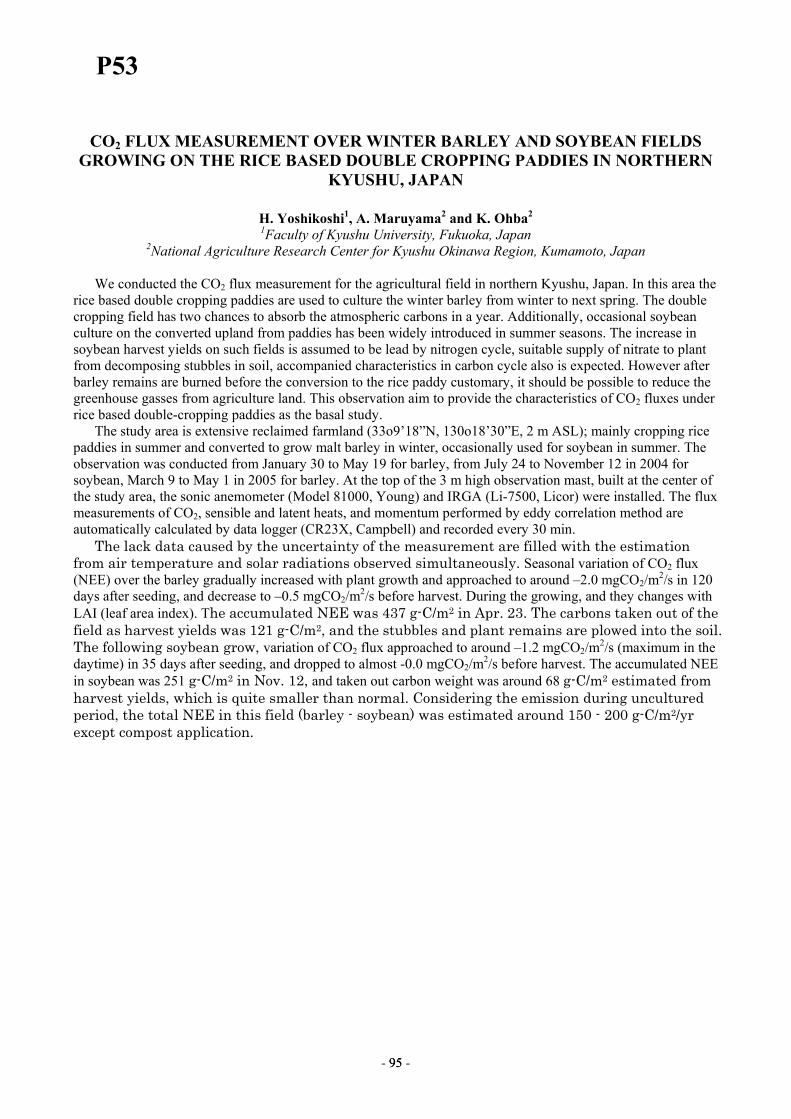
CO2 FLUX MEASUREMENT OVER WINTER BARLEY AND SOYBEAN FIELDS GROWING ON THE RICE BASED DOUBLE CROPPING PADDIES IN NORTHERN
KYUSHU, JAPAN
H. Yoshikoshi1, A. Maruyama2 and K. Ohba2 1Faculty of Kyushu University, Fukuoka, Japan
2National Agriculture Research Center for Kyushu Okinawa Region, Kumamoto, Japan
We conducted the CO2 flux measurement for the agricultural field in northern Kyushu, Japan. In this area the rice based double cropping paddies are used to culture the winter barley from winter to next spring. The double cropping field has two chances to absorb the atmospheric carbons in a year. Additionally, occasional soybean culture on the converted upland from paddies has been widely introduced in summer seasons. The increase in soybean harvest yields on such fields is assumed to be lead by nitrogen cycle, suitable supply of nitrate to plant from decomposing stubbles in soil, accompanied characteristics in carbon cycle also is expected. However after barley remains are burned before the conversion to the rice paddy customary, it should be possible to reduce the greenhouse gasses from agriculture land. This observation aim to provide the characteristics of CO2 fluxes under rice based double-cropping paddies as the basal study.
The study area is extensive reclaimed farmland (33o9’18”N, 130o18’30”E, 2 m ASL); mainly cropping rice paddies in summer and converted to grow malt barley in winter, occasionally used for soybean in summer. The observation was conducted from January 30 to May 19 for barley, from July 24 to November 12 in 2004 for soybean, March 9 to May 1 in 2005 for barley. At the top of the 3 m high observation mast, built at the center of the study area, the sonic anemometer (Model 81000, Young) and IRGA (Li-7500, Licor) were installed. The flux measurements of CO2, sensible and latent heats, and momentum performed by eddy correlation method are automatically calculated by data logger (CR23X, Campbell) and recorded every 30 min.
The lack data caused by the uncertainty of the measurement are filled with the estimation from air temperature and solar radiations observed simultaneously. Seasonal variation of CO2 flux (NEE) over the barley gradually increased with plant growth and approached to around –2.0 mgCO2/m2/s in 120 days after seeding, and decrease to –0.5 mgCO2/m2/s before harvest. During the growing, and they changes with LAI (leaf area index). The accumulated NEE was 437 g-C/m2 in Apr. 23. The carbons taken out of the field as harvest yields was 121 g-C/m2, and the stubbles and plant remains are plowed into the soil. The following soybean grow, variation of CO2 flux approached to around –1.2 mgCO2/m2/s (maximum in the daytime) in 35 days after seeding, and dropped to almost -0.0 mgCO2/m2/s before harvest. The accumulated NEE in soybean was 251 g-C/m2 in Nov. 12, and taken out carbon weight was around 68 g-C/m2 estimated from harvest yields, which is quite smaller than normal. Considering the emission during uncultured period, the total NEE in this field (barley - soybean) was estimated around 150 - 200 g-C/m2/yr except compost application.
P53
95- 95 -
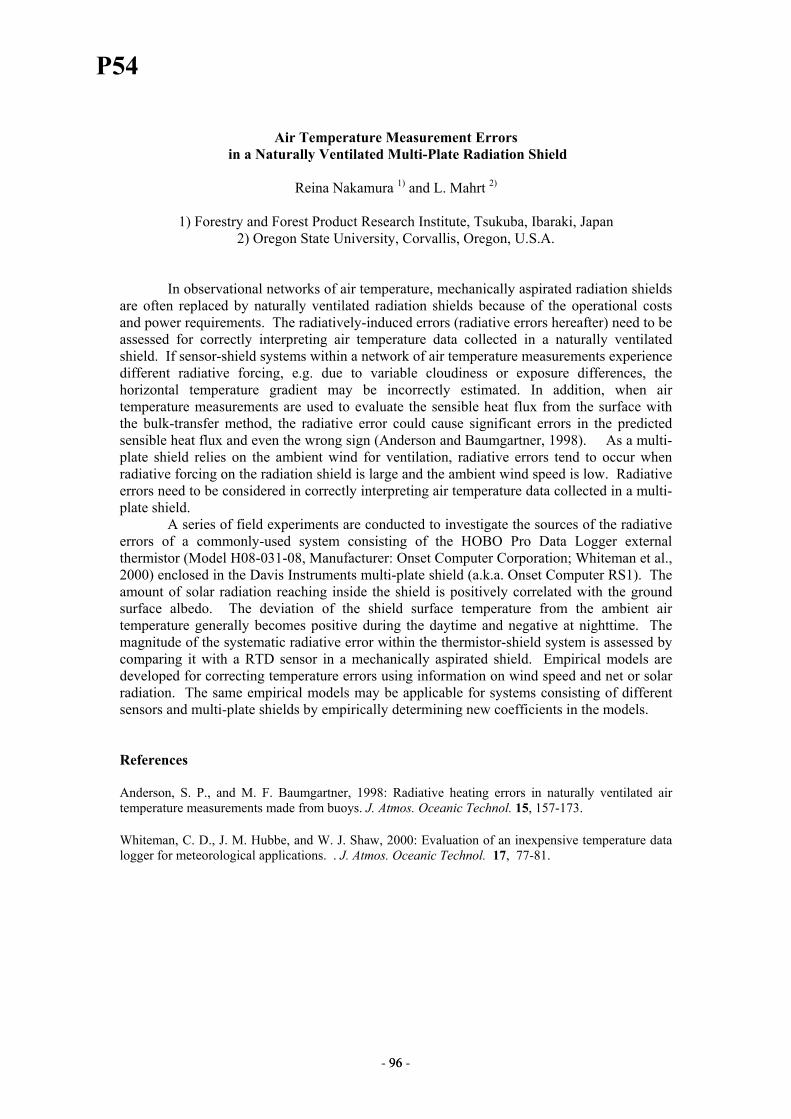
Air Temperature Measurement Errors in a Naturally Ventilated Multi-Plate Radiation Shield
Reina Nakamura 1) and L. Mahrt 2)
1) Forestry and Forest Product Research Institute, Tsukuba, Ibaraki, Japan 2) Oregon State University, Corvallis, Oregon, U.S.A.
In observational networks of air temperature, mechanically aspirated radiation shields are often replaced by naturally ventilated radiation shields because of the operational costs and power requirements. The radiatively-induced errors (radiative errors hereafter) need to be assessed for correctly interpreting air temperature data collected in a naturally ventilated shield. If sensor-shield systems within a network of air temperature measurements experience different radiative forcing, e.g. due to variable cloudiness or exposure differences, the horizontal temperature gradient may be incorrectly estimated. In addition, when air temperature measurements are used to evaluate the sensible heat flux from the surface with the bulk-transfer method, the radiative error could cause significant errors in the predicted sensible heat flux and even the wrong sign (Anderson and Baumgartner, 1998). As a multi-plate shield relies on the ambient wind for ventilation, radiative errors tend to occur when radiative forcing on the radiation shield is large and the ambient wind speed is low. Radiative errors need to be considered in correctly interpreting air temperature data collected in a multi-plate shield. A series of field experiments are conducted to investigate the sources of the radiative errors of a commonly-used system consisting of the HOBO Pro Data Logger external thermistor (Model H08-031-08, Manufacturer: Onset Computer Corporation; Whiteman et al., 2000) enclosed in the Davis Instruments multi-plate shield (a.k.a. Onset Computer RS1). The amount of solar radiation reaching inside the shield is positively correlated with the ground surface albedo. The deviation of the shield surface temperature from the ambient air temperature generally becomes positive during the daytime and negative at nighttime. The magnitude of the systematic radiative error within the thermistor-shield system is assessed by comparing it with a RTD sensor in a mechanically aspirated shield. Empirical models are developed for correcting temperature errors using information on wind speed and net or solar radiation. The same empirical models may be applicable for systems consisting of different sensors and multi-plate shields by empirically determining new coefficients in the models. References Anderson, S. P., and M. F. Baumgartner, 1998: Radiative heating errors in naturally ventilated air temperature measurements made from buoys. J. Atmos. Oceanic Technol. 15, 157-173. Whiteman, C. D., J. M. Hubbe, and W. J. Shaw, 2000: Evaluation of an inexpensive temperature data logger for meteorological applications. . J. Atmos. Oceanic Technol. 17, 77-81.
P54
96- 96 -

Index of
Presenting Authors
NAME PRESENTATION AFFILIATION COUNTRY Alexandrov, Georgii A. S31, O46 National Institute for Environmental Studies Japan Barcza, Zoltan P46 Eotvos Lorand University Hungary Baten, Mohammad Abdul S34, P51 Bangladesh Agricultural University Bangladesh Bian, Lingen O15, O32 Chinese Academy of Meteorological Sciences China Cao, Min P17 Chinese Academy of Sciences China Chae, Namyi O21, O25, P14 Yonsei University Korea
Cho, Jaeil P27 University of Tokyo Japan Dannoura, Masako S24, P11, P22 Kobe University Japan Fang, Huajun O29 Chinese Academy of Sciences China Fujinuma, Yasumi S01, O36, P03, P04, P05, P07, P19, P25, P31, P39 National Institute for Environmental Studies Japan Fukushima, Yoshihiro P52 Research Institute for Humanity and Nature Japan Gamo, Minoru P06, P44 National Institute of Advanced Industrial Science and Technology Japan Gao, Zhiqiu O15, O32 Chinese Academy of Meteorological Sciences China
Gu, Fengxue O44 Chinese Academy of Sciences China Guan, De-Xin P35, P37 Chinese Academy of Sciences China Guo, Jianxia O32 Chinese Academy of Meteorological Sciences China Han, Shi-Jie P37 Chinese Academy of Sciences China Han, Gwang Hyun O26 National Institute for Agro-Environmental Sciences Japan Hao, Yan-Bin O33 Chinese Academy of Sciences China Harada, Tsuyoshi O11, P45 Hokkaido University Japan
He, Honglin O45 Chinese Academy of Sciences China Higuchi, Kaz O12, O41 Meteorological Service of Canada Canada Hirano, Takashi O11, O36, P31, P45 Hokkaido University Japan Hirata, Ryuichi O11, O36, P31 National Institute for Environmental Studies Japan Hooda, Neeta S35 Government of India Ministry of Environment & Forests India Iizuka, Satoru S22 National Institute of Advanced Industrial Science and Technology Japan Inoue, Gen S01, S12, O27, P19, P25 National Institute for Environmental Studies Japan
Inukai Koh P31, P39 National Institute for Environmental Studies Japan Ito, Akihiko P02 Frontier Research Center for Global Change Japan Ivanyi, Zsuzsanna P46 The Regional Environmental Center for Central and Eastern Europe Hungary Jomura, Mayuko S24, P11, P22 Kobe University Japan Kang, Sinkyu S02, O42 Kangwon National University Korea Kern, Aniko P46 Eotvos Lorand University Hungary Khatun, Rehana P51 Bangladesh Agricultural University Bangladesh
Kikuchi, Yasuko O36, P32, P41 Osaka University Japan Kim, Joon S01, S02, O21, O25, O42, P14 Seoul National University Korea Kim, Seong-Deog O27, P10, P13, P27 Chungnam National University Korea Kim, Su-Jin P16 Yonsei University Korea Kim, Wonsik O27, P27 National Institute for Agro-Environmental Sciences Japan Kitamura, Kenzo P28, P40 Forestry and Forest Products Research Institute Japan Koarashi, Jun P18 Japan Nuclear Cycle Development Institute Japan

Koizumi, Hiroshi P02, P12, P20, P23 Gifu University Japan Kominami, Yuji S24, P11, P15, P21, P22 Forestry & Forest Products Research Institute Japan Komori, Daisuke P27 University of Tokyo Japan Kondo, Hiroaki S22, O12, P38, P44, P46 National Institute of Advanced Industrial Science and Technology Japan Kosugi, Yoshiko S25, O13 Kyoto University Japan Leclerc, Monique Y. S26 The University of Georgia USA Lee, Dong-Ho S02, O25 Yonsei University Korea
Lee, Jae-Seok S02, O21, P12 Konkuk University Korea Lee, Mi-Sun O21, P12 Gifu University Japan Lee, Young-Hee O43 Kyungpook National University Korea Leuning, Ray O14 CSIRO Marine and Atmospheric Research Australia Li, Qingkang O24, P08 Chinese Academy of Sciences China Li, Zhengquan O24, P08 Chinese Academy of Sciences China Liang, Naishen O27, P19, P25, P31, P39 National Institute for Environmental Studies Japan
Lopez, Larry P32, P34 Hokkaido University Japan Machimura, Takashi O36, P32, P40 Osaka University Japan Maeda, Takahisa P06, P44 National Institute of Advanced Industrial Science and Technology Japan Mahrt, Larry S21, P54 Oregon State University USA Matsuura, Shoji P47, P48 National Institute of Livestock and Grassland Science Japan Miyama, Takafumi S24, P11, P15, P21, P22 Forestry & Forest Products Research Institute Japan Miyata, Akira S01, O26, P47, P48, P51 National Institute for Agro-Environmental Sciences Japan
Mizoguchi Yasuko P09, P26, P42 Forestry and Forest Products Research Institute Japan Nakai, Yuichiro P28, P33, P40 Forestry and Forest Products Research Institute Japan Nakaji, Tatsuro P05 National Institute for Environmental Studies Japan Nakamura, Reina P54 Forestry and Forest Products Research Institute Japan Nakano, Takashi P26 Yamanashi Institute of Environmental Sciences Japan Oda, Tomohiro P32 Osaka University Japan Oguma, Hiroyuki P03, P04, P05, P07 National Institute for Environmental Studies Japan
Ohkubo, Shinjiro S25, O13 Kyoto University Japan Ohtani, Yoshikazu S01, P09, P26, P40, P42 Forestry and Forest Products Research Institute Japan Ohtsuka, Toshiyuki P23, P24 Ibaraki University Japan Ono, Keisuke O26, P30 National Institute for Agro-Environmental Sciences Japan Ooba, Makoto O36, P32, P40 Osaka University Japan Philip, Elizabeth S32 Forest Research Institute Malaysia Malaysia Saigusa, Nobuko S01, S22, O12, P02, P06, P31, P38, P44, P46, P48 National Institute of Advanced Industrial Science and Technology Japan
Sawada, Haruo S11 Forestry and Forest Products Research Institute Japan Senthong, Chuckree S33 Chiang Mai University Thailand Seo, Hyeong-Ho P13 National Horicultural Research Institute Korea Sha, Liqing O22, P17, P43 Chinese Academy of Sciences China Shimizu, Takanori P29 Forestry and Forest Products Research Institute Japan Song, Xia O34 Chinese Academy of Sciences China Sugita, Kazuyuki P24 Ibaraki University Japan
Sun, Xiaomin S23, O24, O45, P37 Chinese Academy of Sciences China Takagi, Kentaro P31, P39 Hokkaido University Japan Takahashi, Atsuhiro P52 Research Institute for Humanity and Nature Japan Takahashi, Yoshiyuki P19 National Institute for Environmental Studies Japan Takeda, Tomomi P03 National Institute for Environmental Studies Japan Takimoto, Takahiro P50 Okayama University Japan Tamai, Koji S24, P11, P15, P21, P22 Forestry & Forest Products Research Institute Japan
Tanaka, Kenji O35 Kumamoto University Japan Tani, Akira O23 Tokai University Japan Toda, Motomu P01 Hokkaido University Japan Wang, Huimin P38 National Institute of Advanced Industrial Science and Technology Japan Wang, Miao P36 Chinese Academy of Sciences China Wang, Qiufeng P49 Chinese Academy of Sciences China Wang, Shaoqiang O28 Chinese Academy of Sciences China
Wang, Yan-Fen O33 Chinese Academy of Sciences China Watanabe, Tsutomu P01, P28, P42 Forestry and Forest Products Research Institute Japan Wen, Xuefa S23, O24, O44 Chinese Academy of Sciences China Yamamoto, Susumu S01, S22, O12, P02, P33, P38, P46, P50 Okayama University Japan Yasuda, Yukio P26, P40, P42 Forestry and Forest Products Research Institute Japan Yone, Yasumichi P03, P04, P31 Pasco Corporation Japan Yoshikoshi, Hisashi O26, P53 Kyushu University Japan
Yu, Guirui S03, S23, O24, O28, O29, O31,O34, O44, O45, P08, P37, P43, P49 Chinese Academy of Sciences China Yu, Sung-Min P10 Chungnam National University Korea Zhang, Junhui P37 Chinese Academy of Sciences China Zhang, Yiping P17, P43 Chinese Academy of Sciences China Zhao, Xin-Quan O31 Chinese Academy of Sciences China Zhou, Guoyi O30 Chinese Academy of Sciences China
AsiaFlux Secretariat Center for Global Environmental Research National Institute for Environmental Studies 16-2 Onogawa, Tsukuba, Ibaraki 305-8506, JAPAN Fax: +81-29-858-2645 E-mail: [email protected] Website: http://www.asiaflux.net
As■aFnuxWOrkshopZOOC
lntemationalWmkshopon FluxEstimanonoverDiverseT1errestrial
EcosystemsmAsia
PROCEEDⅡNGS
z9November-1DecelnberZOO6
SuanBuaResortandSpa
ChiangMai,Thailand
Editedby SLakanavichian
ChiangMaiUniversity,Thailand
FrontcoverphotographbySLakanavichian
BackcoverphotographbyOkudaTbshinori
Printedby
DprintCo.,Ltd
ChiangMai,Thailand2006
PrintedonGreenReadPaper
or窪anizingCOmmitteeS
AsiaFluxSteeringComlnittee
FUJlNUMA,Yasumi(NationallnstinlteofEnvironmcntalSmdies,Japan)
FUKUSIⅡMA,YOshihiro(RcscalchlnsIitutefbrHumanityandNaturc,Japan)
IlARAZONO,YOsllil]obu(UniversityofAlaskaFairbanks,USA)
HIRANO,T1akashi(HokkaidoUnivelsity,Japan)
INOUE,Gen(NationallllstinltefbrEnvironmcntalSmdies,Japall)
KlM,Joon(Vice-chair,YOnseiUniversity,Korea)
KOIZUMI,Hirosbi(GifilUniversityJapall)
LEE,ByongIyol(McteorologicalRcscarchlnstinlte,Korea)
LEE,Dongho(YO11sciUniversityKorca)
MIYATA,Akira(NationallnstitutclbrAgro-EnvironmcntalScienccs,Japan)
OHTANI,YOshikazu(Chair,ForcstlyalldForcstProductsRcscalchlnstitute,Japan)
OIKAWA,T1akehisa(UnivcrsityofT1sukuba,Japan)
TANLMakoto(KyotoUnivcrsity,Japan)
YAMAMOTO,Susumu(OkayamaUniversityうJapan)
WOI・ksholD20060rganizingCommittee
lNUKAI,Koh(Nalionalll]stilutefbrEnvironmclltalSmdies,Japan)
LAKANAVICHIAN,Sulccratna(ChiangMaiUlliversity,Thailand)
TAKAHASHI,Ybshiyuki(NationalInstitutefbrEnvirol1mclltalStudies,Japan)
NAKAY7l,KO(CcnlralRcscarchlnstituteofElectricPowerlndustryうJapan)
SENTHONQChuckree(ChiangMaiUllivcrsity§Thailand)
LocalOrganizingColnmittee
LAKANAVICHIAN,SuICcraIna(Chail)ChiangMaiUnivcrsity,Thailand)
SUKSEM,Chal・CO、(ChiangMaiUniversityThailand)
KHAMYONQSoontorn(ChiangMaiUniversitymlailand) ONPRAPHAl,Thawom(ChiangMaiUniversitymlailand) KREASUWAN,Jiclnjai(ChiallgMaiUniversitym1ailand)
CHANTARA,Sompom(ChiangMaiUl)ivcrsitym1ailand) SOPAJAREE,Kh(リornsak(ChiangMaiUIlivcrsity;Thailand) AOUNGSAWAS,Kallitta(Chial1gMaiUnivcrsitymlailand) SENTHONQChuckrcc(ChiangMaiUIliversitybThailand)

O1ganizer
AsiaFluxSteeringcommittee
Co-olganizer
ChiangMaiUniversity,Thailand
Sponsors
MinistryofEducation,Culture,Sports,SciellceandTechnology,Japan Asia-PacificNetwolMbrGIobaIChangeResearch
ForestryandForestProductsResea1℃hlnstitute,Japan NationallnstitutelbrEnvironmentStudies,Japan
AsiaFluxSecretariat
CenterIbrOlobalE11vil・onmentalResearch
Nationallnstitutelbl・EnvironmentalSnldies
l6-20nogawa,Tsukuba,lbaraki305-8506,Japan FAX:+81-29-858-2645
E-mail:asiaflux@niesgojp
http:〃wwwasiaHuxnet

◆
OpeningSession:ActivitiesofFluxNetwork
SOlPresentSituationAlldChallcngcsOfAsiaHux-FromActiviticsOfWO1・kgroupsln2006-
XO/W"MKj"I,YノW/"】""MMf〃"α"0,,.Lee,4./VI)ノ、α,ノVSh「ノgノイsq(MM7hWノ 1
SO2FluxnetAHcrlOYCars:SynthesizingCo2AndWaterVaporFluxesFromAcrossAGlobal Network
M」[MAα"(/,.D、DM/l〕ccルノ 2
OralSessionl:Fluxlntercolnparison
OllNcwDevelopmentsinCanopy-AlnlosphereExchange
MILec/eノ℃,lHO"9,GZノノα"9,1.。"的氾ⅡlR・小ノパsα';ノコlBeノ・mcノノ,〃E/cノノノ"ge';MPZJノ・Are';
G2"皿腕ノ./tlM(Jwm脈'ハo〃 3
Ol2SynthcticAnalysisOfThcLong-TblmCarbonBudgetsEstimatcd FromTbwcr-FluxMcasurclnclltsAtVnriousForcstslnEastAsia
SLlhwlα"lolro,ノVkSmgMFq,R、〃ノノWq,R肱,IOh/α"ムノWhWj,
XKOsllg/,MGtJ"ノ0,HJl'hr'19,HKmzlィ"ノノα"(/Xハリノ"""'a 4
Ol3TemporalAndSpatialVariatiollslllTllcSeasonalPattemsOfCo2FluxlnBo1℃a1,T1cmperate, AI1dTropicalForcstslnAsia
ノVStJjg"sα,SJhwlq"lo/o,尺.〃ノノ.α/α,R・肱,MGα"ノo,T〃/M7o,XKOAwg/,S-GLi,
lWMm,10ノリ/α"/,ⅢOjAr(Jwq,MnI"/,α"(/H脆"9 5
Ol4TheSpatialAndT1cmporalDistl・ibutiol1sOfTheEnel・gyPartitionAbovcForcstslnMid-And
High-LatitudeRcgiolls;AnalyscsUsil}gThcAmeriHlⅨ,EuroHux,A11dEEurasia-JapallDatasets
ⅢOル/a 6
Ol5SeasonalVariationofNctEcosystcmProductivityinJapancseT1elnpcralcFolcsts
IOノノ/α"lWSb「'9"sα,ノM/"・a/α,R、h/BIF1脚!""αI〃/ノ・a"0,KKノノα""".α,XKO'"/"α'"/〉
IKns"gliTM〕′α"}α,YMzog"cノノノ,ヱノMbrjTawa,RノVtliM77St7j/omSノノ/"ノ伽KZh"'αLMZh"/,Z腕/α"αbe,Y】hM仇J,】FOjlmlwaQ"(1/8(】h"M''"o/o 7
SpecialSession:TYopicalEcosystem
SIlTheCarbonDynamicsOfTropicalRainForests:LessonsFromFIuxStudicsAlldBiometric MeasLu・emcntslllAmazonia
IMJノノノノ 8
Sl2Land-Atmospherclntcl・actiolllnCIilllatcModel:IndochinaDclb1℃station,GIace,And What,SNext?
S・KanaeandT・Oki ,
Sl3Co2AndWatcrVilpourFIuxcsMcasurclncntOvcrASteepSIopcForcsIUsil1gTWoFIuxTbwcrs
x-JHF/、「,S-ccノノロ"9口"(ノc-爪Lqノ 10
Sl4MeasurementsOfCo2FluxcslluATropicalCity(Singapore)
C""SSO〃α"(/Mルノノノ
Sl5TowardFourDecadcsofFluxObscrvationinThailalld
ノV7h"g/〃α"ノ 12
Sl6nlePotencyOfllldoncsianBiosphc1℃RcscrvcslnAbsorbingCo2
7mノノィ"e,Ⅱ〃"てJ"Ca"〔M、ノbノD'〃 13
Sl7CarbonDioxideExchangcAlDoublcC1・CopingRicePaddyFicldlnBallgladesh
MtM・Ba/e",4Mi)ノα/α,ノMノW"o,R、Kルα/【イノハノWnK/MW,ノWL川ノOsse",
KO"Ca"(ノノWWgm 14
Sl81nPlunsuitTbwardsEstablishingACo2FllⅨMollitoringStatiolllllThcPhilippines
e(/t7,R、D・Lqscoq"dRS助"c/JezMMAglイノノCs,ⅢMJ 15
OralSessionlI:Fluxestimationandnewapproach
OZlNocturnalCal・bonEmux:RccollciliationOfEddyCovarianccAndChambcrMcasurcments
UsingAnAltcmativeToThcU*‐ThrCsholdFiltcringTbchniquc
RLe""/"9,SノZege/"MCノヒ〕"GwJノ7〔ノノaC/e"le"ノ 16
OZ2Flux-TransportillgEd(licsRcvcalcdByLalgeEddySimulations
FⅢ/α"abc 18
O23ApportionmclltOfObscrvcdHeatFIuxcsToHetcrogelleousSurlnCCS
eノリ9,Hzノノα"9,1.LliFHノィα"dノMXLec/eノ℃ 19 XQJLGP
O24UsmgLasersTbMeasureAmmoniaEmissionsFromSmalIFields
D.Cルe17,,.n"・"eJ;ZXJ"g’よZhq"g没Zルα"gMCルe",gZルα"gZDe""leadα"‘よnJで"ev 20
O25EddyCovarianceMeasurementsOflsotopicCo2FluxcsWithTimableDiodeLaser Spectroscopy
SLD、SIqilgc"',TMOノ.!〃,ESMa桃B、D・Tb""cMRG'℃el?eα"〃MBa舵'. 21
O260bservationAndSimulationOfNetEcosystemCarbonExchangelnChil1a
GZhozイ,Xmbl'78L・Zho",XLjQ"d〃Hイα〃 22
O27ComparisonOfEcophysiologicalTbchniqueWithEddyCovarianceMethodAndBiometric ApproachForEstimatingCarbonBalanceOfForestEcosystems
ノVLmr'lgKZhlノヒJgj,IKmwgJiMTh"j;zOAMlIdMXFl‘j"""M1 23
O28TheCorrectedMethodOfFluxUsingGyroAtNon-StaticPlatfbrm
Y-YLan,B-J・I1suangandll-YHsich 24
O291ntroductionTbAsiaHuxDatabase
T、Hirano,B・Lee,YFlUinuma,YKobayashi,R、Hirata,S・YiltaandKJnukai 25
OralSessionlll:Biochelnicalprocesses
O31EffbctOfOrganicMatterVariationOnDecompositionProcesslnForcstEcosystem EvaluationUsingModifiedRoth-CModel-
MJb""".α,XKO")"7α"ノノ,77M〕』α"】α,MDα""Cl".αα"c/IKtJ"αzawa 26
O32CarbonAccumulationslnForestSoilsOfNorthemThailandAsCarbonPoolslnTheGlobal
Ecosystems
SKルα"〃o"8,.5セノロノ"e//Mw〃α'M/D・StJel7chα"'AC"9 27
O33ExploringTheVariationOfAbove-GroundWOodProductivityAndRootProductionAcross S0-HaPasohForcstPlotsAndTheirRelationshipToSoilDetemniningFactors
L・KKhO,IMIノルムE・Pルノノlip,αノ7CMR・ノWk 28
O34MoisturcAndTbmperamreEflbctsOnRespiratiollOfAgriculmreAndForestSoi]slnThailand
A.Cルノd'んα応o"gα"‘&腕?〕ノα'α"9FαノIwノ 29
O35Partitiol血gofWaterFluxlnRubberP1antatiolls:EstimationOfT1℃eTTanspilYltionBySapFlowMeasurement
Pmhaノe';肱陀'1C/Ieノ;OROZ(ノW'YMC/'α"/""lα,ノロ1sかliPO)・'WA[/beM,RKt7Se'"Ar(ZPα'7Q’
Kshwgハル“/ノヒI 30
O36StrawManagcmentAsKcyFactorForDctel・minillgPrcscntAndFuturcGrecnhouscGas
EmissionsFromRiceEcosystcms
RJJbss"ノα"〃 31
O37AsscssmcntOfTheCarbollBalancelnAForestedWatcl・shcdOfmakayamaByEcological
Proccss-BascdApproach
MLee,ノVSO化4.ⅣjFノノハwWα"〔/HKO/zノィ"ノノ 32
OralSessionlV:ModelingandRemoteSensing
O41MovinglbTheRegiollal-Scalc:AhllosphericBoluldalyLaycrConcelltrationsAndSurlilccFluxcs
・ノ:ECノ./γ 33
O42CarbonSinksandSourccsinChinaFol・cstsDuringl901-2001
S''七mg,ノ:MChe〃,〃・ノノイ,X凡"8,MCノノe",RCノノe〃α"JGlW 34
O43SatellitcAlldT1owcrFluxComparisonsOfSeasonalVbgctationDyl1alllicslnMonsoonAsia
A、Huetc,K、Didan,P、Ratana,K・Ichii,S、PanuthaiandM,Gamo 35
O44ComparisollOfSatellitcO1・ccnncssDaIaWitllFhⅨTbwcl・MeasurelncIltslnAmazoll
PRα/α"α,1.R〃ノィe/c,XShj")α6ノィル'"Uα"(/S(StJ/e`Wノ 36
O45TheSimulationOfWatcl・VaporAlldCal・bonDioxidcFIuxesOvcrllTigatedFarmlandBy
ModificdSoil-P1ant-AtmosphcreModcl(Mspa)
X-HLee,』K/"'α"(〃:〃O"9 37
O46ModelingSeasollalVtlriationOfCo2FIuxlnASubtropicalConiferousForcstUsingThcEalco Model
ノVMGRM/,XR肌",XMSt"7,LMZノノα"gXSbノ29α'7‘SSJりり'19 38
PosterSeslsion
POlCarbonSequestratiollillEastAsia:AMilIi-RcvicwofEddyFluxMeasllrcmentStudics
nKmo 39
PO2FluxObscrvationalldEvapotranspiratiollofThreeLalldUscTypcsinThailand
S,BOO".)ノαwα/,MdoAj,R7b"g(ノCeノノoAXKecノ・Ce"!〃"9A/α〃,8.Plイハ"gα")α"(ノ」.PLwイノノノノノcノリαノⅦ 40
PO3EffiectofEnvironmelltalFactorsonCal・bonDioxidcExchangeofForcstEcosystenlsin EastAsia
RHノノ・a/α,ノVSbIjg"sα,S】b"ノαノ"o/o,ノH肱,MG〔ノノ"omHj/・a"0,XKos!lgj,YOA/α"/,
Mn"jMUf1z塑璽IF/FR1imuIlgI- 41
PO4AmlualCarbonBudgctofaSingle-RiccCroppingPaddyFicldbascdonLong-TclmFlux Measuremcnt
AM)'α/α,MMJ"omHJ'"α“K、O"0,HMJgqi,G〃:〃[J'LXKo6(ZWMj,H肋sノl放Csルノ,MStJj/oα"(/IHkJノ・qzo"o 42
PO5Seasol】alVariationofC&lrbollDioxidcExchangeandA11llualCarbollBudgetatFoul・Managed
GrasslandSitesinJapan
d・Miy('/α,R・HtJ/α'7o,ノMMJ"o,XKOZ山,ノusノノノ"'iz",S/M7LMJィrq1MノV/""j
mtJjg"M1,SKtJ"0,ノM〃Qノノ/o,′L/M〕'7,0.KnWα"ノノィノYJ,。.〃【リノaAmlノα,SMJノWlIqWL
HノM(J"ノノ,mhl"/g"cノノ,MOノノIrawα("'/nM/α"ノノノノ・a 43
Seasonalandlnter-AnnualVariationsillCarbonDioxidcExchallgeatFiveGrasslalldand
CropFicldSitesinEastcrnAsia
IKO6q)′ashLA.M〕'α/α,IThWg,710/AmMJ,71ノwα/α,KOノノZ)α,zKmo,MDI《,
xHm"MJ,sLS/7/"lML-血YggqLルU4QuzLLTZlIk1ulQI2-2uzd4LMm(yqlllq
PO6
44
PO7Environnlcl1talControlsonCarbonBlIdgctsinTypicalGrasslandsinChina
XLFMXQ.Zノノαo,GノMケイ,IEI化"9,XH7hll gα"cノノロILSソノノ 45
PO8StudyontllcRelationshipbctwccnCO2FIuxandH20FIuxinPaddyFieldsofThailand andJapan
ⅢPaAoA/o"},nSe/0,T〃b"gノロノhα,ノ別(mse")sqp,S・BOOノリαwα/,4.Ped〉.α"',M肋ACM7,,.KO'''0'・[α"(/MACハノ 46
PO9AnnualCarbonCycleofP/"lMb"Moノ・(JStandEvalllatcdbyE(ldyFluxObservationand EcologicalSurvey
FMbicノノノ""".α,Moo69,-XLnKZ1EhAZQQlL-K-lml1α旦旦-1L4QWUlla21Z4」g-Qkq血 47
PlOEnergy,Water,andCO2F111xcsaboveGmclinLarchForcstollColltinuousPermafiFostof CentralSibcria
X/VM、,XMbr/IFノィノィノ.α’五KtIノノ"IC/o,4.2肋α/"loUSXJ'"α"'0/oα'〃0.4.2,ノノ:)′α'7ow7 48
Long-T1emlVariabilityofNctEcosystcmProductionofFlリiyosidaSitcEstimatedbyAmedas Data-ResponsctoFlucUlalingMeteorologicalConditionsover30YCars‐
XMZog"Cハム10ノノノα"j,Ⅲ肋/α"αbe,IlhslMJq"(/且ハ1'α'a
Pll
49
Pl2CO2andWaterVapourFluxcsataSubtropicalMon(ancCIoudFolcstEcosystemin North-EastemTtliwall
EBej化'.w花血ノルノヒノWヒノセ"6e/19eノ;Y-ノ:HBmlα"(ノ0.K/e'""I 50
Pl3COzFluxinTTopicalAI・cainSouthEastAsiaMeasuredwithEddyCovarianccMcthod
MGq'"o,ⅡMbMJ,ノVJSmgMyq,HKOM〕α"〔ノSPα""ノノノαノ 51
Pl4EffbctsofManurcApplicatiollonCarbollBudgetovcrManagcdGrasslalldinCentl・alJapan
SM7な【イ"'・a,。.M)'α/α,MMJ"0,M〃Qノノ/o,ノ川化'・jJMyq/j,SWqwo,R、H、(J"0,
KKoノリα"lαα"(/HSnFaA/ 52
Pl5EvaporationandCO2ExchangcinMaizcFicldsinShanxiProvincc,Chilla
Iノqリリ(ヨノα"(lMZ/mWgOⅢDe"'"eα仏,.Cノノe",/MZルα’ 53 !&_
Pl6MicrometcorogicalMcasurcmclltsofGasExchangebySugarcanc
oⅡDC"'"eα`/lacTMJcdb"α/(11収脆"gα"`ノG&y皿一 54
Pl7SeasonalandlnterannualCharactcristicsatRain-FedPaddyFic1.,Thailand
D・KO"ICノブ,MAoAj,〃K/"ハSMy(Jz(W,JC/IC,SLBooノリ'αwα/’2PCんo",
HPI/肋9m",R7b"g血e"OA,SKm7ae,T70A/α"(ノパ.MイS/Mc 55
SeasonalVMationsillHcatandCarbollExchangesoveraT1eakDcciduousForestinaTropical
MonsoonEnvironmcllt:ACompal・isonbctweenFIuxDataalldTrcePhcllology
Pl8
〃/,ノWIJ"α/h7,ノ皿助z"Aiα''。/C7hw/qvノノ./〃1KkJ//yα,ノV肋8A 56
PI9ScasonalVirationofCO2F1uxalldltsComparisonwithBiomassMeasllrclncntataRicePaddy FieldinJapan
ⅢZMj'"o/o'五ハl'α/α,SUb1ノ"α"IC'0α"(/Ⅵ/MW'YJ 57
P20UnderstandillgofWatcl・alldCal・bonExchallgesinGwangI1clllDgForcst,Korcain2003and
Z004basedonlntcl・disciplillalyApproaches
AICノノαe,D、Lee,ノ:パノノ",ノI/O"Ra"(/SKtJ"9------------_ 58
P21MeasurementsofCO2NoclurllalRespirationovcraPeanulField
ノVPj"g/"ノノノα,MXLec/eノ℃,GZルαノリ9,J:HO"9,1.Kmmo/,CCノノの'αwα/,。ノIノピlBeas/Cリjl
D・ROW/α"〔/α"(/C、Scノノノノノo"9 59
P22ScasonalandmteramlualVtlriationinEvapotranspirationandEnergyBalanceovcraLarchForest
Kノノ"伽jJRH】'.α、[’7Wガノ.α"oα"’1ノマWj"【ィ"}a 60
P23EnergyandWaterFluxObselvationoflrrigationPaddyFieldinPhitsanulok,Thailand
RPoAα",S:Pα/α'"α、'"ノMα"dMAoAlr 61
P24EnergyBalanceofaTTopicalPeatSwampFolestinKalimantan,Indoncsia
rH”"0,HSbgα〃,L,SWmlbq"c/MOSαハノ 62
P25ProfilingofvcrticalDistribulionofCO2inForestCanopy XZM[J〃asルノα"‘R,〃77.alfa 63
P26CO2ConcentralionProfiewithinaCanopyofaTropicalRainForestinMalaysiaanda TemperateCypressForestinJapan
8OAAlイ6o,IKOs"gL8mノヒJ"“hj,M71J"/α〃4.R、lWA 64
P27FluxDataQualityControlofT1akFluxMcasurcmcntStation
爪KI"1,MM口"o,D・KO"lo7i,JC/jo,SLMMJzQAjRPOZFo",SLX上]waeaMⅢOAj 65
P28SpatialAveragingEfIbctonFluxMeasuremelltbyaSchltillometerAppliedontoaForcstCanopy
肋 αK,csi{zZMrj,Hノノヒ巴dtJ,ⅢKOhIyash/α"JHX7s"jAe MJ 66
P29EffbctofCorrectionofSonicAncmometerAngleofAttackErrorsonEddyFluxcsoverBoreal
andCoolTemperateForests
ⅢMJ/hJi,MKvq灯火'./Mo/e",JHCGqsA,XKO血'"α,no〃/α,。.よりoルノαノZ
HIb6"kli4.EKO"o"Cl)α"‘ⅢC、MJxj'"Clノ 67
P30LocalTbmperatureFluctuationshlthcVicinityofOpen-PathGasAnalyzer
KO"0,Rノブ/'.α/αα"(MMyQ/a 68
P3]Large-ScaleTransportofScnsiblcHeatandWaterVaporTrallsportoveraShortCanopy
MSm/0,JASα"""7αα"(M・Mi〕'α/□ 69
P32ComparisonoftheTilrbulenceCharactcristicsofthcAtmosphericSulfaceLayerovcraRice PaddyasObservcdbyaTbthersolldeSystemandbyanEddyCovarianceSystem
J-L乃qjB.-、ノ:乃zィα'19,F1-s(Lrィα"dK-Hcノリα/唾 70
P33DcvclopmcntofaFluxTbwerfbrLongtermFluxMeasurementofAirPollutantsinan UrbanArea
八e〃 B,-J:乃"α''9α"dR-HKカィ0 71
P34SurfaceEnelgyClosureObservedatVariousHeightsonanUrbanFluxTbwcr
R-HKjイ0,S-XHイ,C・-爪陥イ,K-H乃α79,上L乃αjα"‘B、‐ノ:乃"α噸 72
P35TimeSeriesAnalysisofSoilMoistureataSteepHillslope
SK"",MSO",SMK/"I,D・Leeαノノ‘よK"〃 73
P36EstimateofP1DductivityinEcosytemoftheBroadleaved-KoreanPineMixedForcstmChangbai Mountain
MノリhwgD・KO"α",IS〃bwgα"c/ZgHtm 74
P37CarbonCyclingintheTiDpicalD1yEvelgrcenandDeciduousForestsillThailand
SDノノokFlJ"W",孤附qlmn"α,S〃"!"AaMElLqmIpQノmlwハノヒw"laAasaノノe〃 75
P380bservation-BascdHydrometeorogicalStudiesatTropicalMonsoonForestsinThailalld
ノV7hllaノセ7,ⅢKi""e,ノVl幻sノノi/iダノ,1KtI/Oノα,KzIJ"αノヒ7,H7Mizawa,KS7iかMj
LKmqノ([7,cnI"rasかj",ノvn"gノノノα'〃α"cノノ以及ィz"ハノ 76
P39DiffiercncesinEnviromncntalRcsponscsofCanopyConductanccsBctwcenUnderstory
VegetationandMainCanopyTreesinaBorealForcst
&//(]/b,Ⅱ0カm,KMJLsl""o/o,F/VM、'4.EKO"o"oMT7CMmF""oU
MKv【J〃庇'・Mbノe",』.、ノ:DC/"Jα〃α"JHIb6Mrノ 77
P40ConmlonPotentialRcsponsesofCanopyConductancetoEnvironmentalVariablesinVarious
ForcstsintheFarEastRegion
KノMql'6W"IC'0,ⅡOA/α,】FM7ノhJj,ⅢKjJwqdtJ,KDaノノbノhィ,SJjc/h「,Hlhl6Mj,
4PKO"o"mlIKOdhr'"α,ⅢCMJX/"loWJ"〔/SLLhJ"o〃 78
P41T1emporalandSpatialVariatiollsintheSeasonalPattcmsofCO2FluxinBoreal,Temperate,and TropicalForcstshlAsia
ノVSbjgrイsα,SXJ'"α"IC'0,RH7'鋤α/α,R肱,MGql"'0,ⅢH】'。α'70,XKOslイ94s(‐GLj
Y/VM[J/,10ルノα"/,TO伽lwJ,MTlJ"/α"‘HJHlwg 79
P42SimultancouslsotopicDeterminationofCO2andMcthallcExchangcdbetweentl1ePaddyand thcAtlnosphcrcRevealsMal・kedDiHbrenccsillGasExchangcProccssesbetweenFloodedand DlnainedConditions
GH正ノヒJ",HルsAMfosAMIMJgm,M/MJ"o,4.M〕ノα/αα"WKj"7 80
P43EstimatingEvaporationFluxintheHanRivcrBasin,KCI・eaUsingStablelsotopcT1cclmiquCS
D,Lee,ユバノ"lα"’8K"ノリ 81
P441sopreneEmissionfiDmQ"e1℃"ssel・'YWilltheDeciduollsBroad-LeavedForest
ノMOAW"l"'.α,4.、"LIKO"ノノ"α"ノノ,XKnlWgLSnMmI"αSノノjα'7’3ZrM"o 82
P45CH4andN20EmissionFluxesofMireSoilsinSaUjiallgPlain,NortheastChina
DL/〃α"(/C・Sb"9 83
P46EddyCovananceMeasurementsofCH4FluxinaJapaneseRicePaddyField ■
MJgmiAfMJ"o,4.M〕ノαjαα"dIHtJJpzo"0 84 HJbArhM[DsAi,GHHtJ",丘
P47TheMbctofLoggingonSoilGreenHouseGas(CO2,CH4,N20)FluxesinTropicalHumid Forest,PeninsularMalaysia
Xlh「sh"U,〃4.K脆〃R“此わん,五OA"dbα"‘HKmZz""ノ 85
P48MiectsofTyphoonDamageonthcVCgetationPropcrtiesandCarbonDynamicsillaLarch Forest
ZStJ"0,nHIノロ"0,sU/'"ロハα")α,ノVLjq"gHng""'α, K・肋"ノセJjα"dIFlイノノ""")a 86
P49SoilRcspirationinaSubtropicalMontaneCloudForestinTkliwan
SCC7lα"gKH乃e'噌α"aXfHFkJ 87
P50EffiectofSoil-CollarlnsertionollSoilRespirationinaSecondaryDeciduousBroad-Leaved Forest
SHtJ"lα血,MDq""or"て7,1KO"Jmα"ノノ,〃ん"""αα"JIKtlWamW 88
P51AboveandUndelgroundRespirationinaDcciduousBroadleavedForest
FM)'α'"α,XKO"l、α"lLAfDα""o"'.αα"`/Mん""イノ・a 89
P52AutomaticSoilRcspirationMeasuringintheTropicalSeasonalEvergreenForestmSakaerat, T11ailand
SLH1r"、/jajq"‘MGCJ"'0 90
P53MectEsthnationofEnvironmentalFactorsandSoilPropcrtyonTbpographicalVtlriationofSoil Respiration-theCaseofExtremelylmmanlrcandMamreForestSoil
Kzb"jaj,IKC"!"7α'"msノカノノ"iz",nM〕′(J'"α,xoh"Mjα"(ノxohm"ノ 91
P54TheEvaluationofRootRespirationUsingSomeMethodsinT1emperateDeciduousForestof CentraIJapan
MDα""Cl".α,XKo'"カブα"i1Mmhw'α4M、ノb"ノ'"ロ,正M〕'α")α,IGO/oα"(ノIKtJ"αzawa 92
P55ContributionsofRootandMicrobialRespirationtoSoilRespirationfbM肱s〃oノbIpA〕'/mandglJeノ℃ノィs"Jo'1go/jCaStandsofCentralKorea
Ⅲ〃KDC,XSb",Mノ(/VDA,R・HK"",K収比0,A/JrC/iaeα"c/JKi"I 93
P56ComparlsonofEcosystemRespiratiollofWinter-WheatMeasuredwithEddyCovarlanceand StaticChamber
ZMZ/ie"9,GR.】'iイ,XSLJJhr"gα"J77Soノ19 94
P57DiversifiedEvaluationofCarbonBalanceatWannT1emperateForcstinJapan
IKO"!"7α"lLZMi〕ノα"'α,K71J"'αMfDα""o"ノロ,/Mノb""イノ.α,IGomq"〔ノIKtJ"αzα11'a 95
P58LongTbrmEstimateofAbovegDImdP1DductionbyaTTecRingAnalysisinamempcrateBroad‐ LeavedSecondalyForcsthIJapan
/VMiFaWQ,MLノb""イノロ,IKtJ"αzaWαα"C/IKKOノツノノノ7α"ノノ 96
P59SeasonalVMationsinLeafArealndcxattheKoFluxGwangneungWatcrshcdinKorca
S-B.Pαノ.kノMKm7gノLj"J’よC/izィ",Sノ、α'・ノI『,IKj"1,TハノWq"gノVmae,ⅢC/ioj
SLKtJ'lgSMbo〃α"(lMKj"’ 97
P60DevclopmentofOutdoorlnstallationTypeLaserScanncrfbrContinuousMcasuremcntofTTec
HeightandPlantArcaDcnsity
ⅢTMU巾,HOd g""'αα"‘ Iハリノ"!""3 98
P61TheResponseofTropicalForestPhotosyntllcsistoSeasonalVhriationsinLightConditionsin
theAmazonRCgion
DD)ノe 99
P62TracerValidationofLagrangianAnalyticSolutionInsideandAbovcaForcstCanopy
JHO'ZgMILeC/e1℃,GQlイムJしりMα"`jMKmPo/,GZhα/'9mノリtlLFo",RDjeZz,
KLewi",JWtJg〕ノα"‘団α〃 100
P63SurfhceFluxParamcterizationSchemcsfbrBareSoilSurfiHces:PhysicsandSchemeEvaluation
K】2J"g弧KOノルc,Hハノノ伽wα’よK"",XLj,HLj",SLj",XM7Q'7CLIリグhlノ,9 101
P64ScalingCarbonDioxideandWaterVaporExchangefiDmLeaftoCanopyinaLowland
DiptcrocarpForest
S7M[J"αS/ji,IKOsJイgムノWMJ応"o,S(0M"6o,MThwjql"c/4.R,ノVIk 102
P65GPPDynamicsofallOld-GrowthChincseMixcdForest:ScaledbyVPMModel
SHmT,XXI、α"c/GHィ 103 ノZルα":
P66ModeM1idationofNetEcosystcmCO2ExchangeatAsiafluxSites:TbwardCarbonBudgetin EastAsia
A〃0 104
P67DevelopmentofaProcess-BasedModelfbrAnalyzillgthcLal1d-Atmosphe1℃ExchangeofCO2, CH4andN20:Plot-ScaleSmdyinComparisollbetwecllaTcmperatcDeciduousForestand aTemperateConiferollsForestinCentralJapan
M〃α/o"lj,』.〃o,S/VtWAoα"‘HKOjzZイ"〃 105
P68ModelingTbmporal-SpatialWaterandEnergyBudgetsinNorth-EastemSibcriabyLand SurfaceModel
HルノWjnKJ"lazaIri,XXI"'α"10/oα"cノヱOルノα 106
P69GrossPrimalyProductMtyEstimationofDeciduousBroadlcafForestby3-PGModel ComparmgwithModisImage
107 HPC/"ノiep,ZE"。b,PMBaノwα/jcIwcノI XJs"0hJ
P70ComparisonofModisDrivenNetRadiationovcraMountainousTerrainandaHeterogencous Farmland
HK7)",SKtJ"9,XノRylィα"〃Kノノ〃 108
P71ApplicationofFieldObservedFIuxcsandNOAA/AVllRRtoEvaluateSeasonalCarbon BudgetofB1ackSpnlceForcstoveI・Alaska
Ⅵノwa/αα"C/S】b"Jα'"o/o 109 MUe〕ノ【JmQ,X〃ZJⅡK7ml"oro, rqZO〃0,
P72SpatialHeterogeneityofSatellitc-ScnscdF1uxlndicesRelatedtoEvapotranspiration
SMbo〃α"(1MK"〃 110
P73UtilityofSpectralVegctationhldexfbrEstimationofLightUseEHiciencyinArtificialForestsof JapaneseLarchandHinokiCypressinJapan
jr/VMq/4尺肱KZMJg/,IKOs"gj,SO/hlbo,K/VM伽,ノV:Sbjglィsqq'7c/HDgl""a 111
P74AnAnalysisofLeafPhel1ologyUsingaTimeSericsofFixcdViewCameralmagcs-ACaseof
TropicalSeasonalForestatMaeklollg,Thailand
ⅢMIqMJ,MGq"'o,jVShljgl/sαα"dSLPaノ"ィ/〃αノ 112
P75EstablishingaNetworkofExistingFluxSitcsinnlailand
SBooノ11〕ノawq/,S71hQ"耐awqノリノα'191".α,S:PCOノb7gα"1,CThw/as".j",RBoo"71/lαノ",
R71ノio'19血e"o'9)SIPα"ノイ/haj,』.CWMhQなo"gα"JRKtJse"lscリブ 113

OralSession
SO1
PRESENTSnUATlONANDCHALLENGESOFASIAFLUx
‐FROMACTlVITIESOFWORKGROUPSIN2006‐
Y・OIltHIli1,J、Kill12,Y、FujinumIlJ,K、Iliu・''1104,,.Lee2,A.Miyata5,N、Saiguslloan(1M.Talliフノルb'CM,,。"〃bノWP/・o(/iJc曲Rcsc(Jノ℃ノノ〃ノsノノノ"/emF"M(MtW〃
2川"Sej〔ノノノハノCハW0,,比o,イノKO'℃ajMJノノ。"αノノノノsノノ/"/e/b'Eノハ'ノノ.o"'"e"/('/s/MCS,Tb"ノM(Mw〃
‘"MノhJjt/Mノノ'んCMV,StWWo,〃α〃,Mフノノo"αノノ"s/ノノ,(/CQ/dgノ・o-Eノハ,ノノD"ノ"c"/α/Scic"cesmF"Allbq,ノ(!/)("l
‘ノVt1//o"ロノハノsノノノノノleq/4.W,"cc(""(/lイs/'九J/Sヒル"Ceα"(ノルcノノ"o/、91,,71MAwノM1,JtW〃フノ((yO/O〔ノ>ノハ,CMV,K〕,O/0,〃("ノ
Wellavcintroduccdlastycar,atthc4thAsi【lFluxWorksllophcldillFlリiyoshida,Jal〕an,abolItourplallonbuildingtllcAsianrcgiollaⅡⅨnetworkalongll1chaIncworkofprqjects''1llitiationofthencxt-generation AsiaFIux(MEXT)'’andⅢSmlldardizalionandSystemalizationofCarbo昨BudgctObservalionillAsiall
TcrlcstrifllEcosystclnsBascdonAsiaFluxFraIncwolk(APN)i'、AHcrtheWorkshol),wchavcsituatedtwo workgroul)swithtIlrccsub-workgroul)slⅡldercacllworkgrollp,iI1lllcAsiaFIlIxorganization(Ohtani,2005). Wcarestcadilycal・Iyillgoutoul・aclivities,alldthcscAsiaFluxworkgl・oul)spla)’inlportalltlolesillits iI1l1)IcmcIltation、
OncofthcmosttopicalandlinlitliIlactiviticsinthisycarwastllcvelynrstAsiaF11ⅨTrail〕illgCourscon
Micrometcorology,organizcdbySノ10'./乃・qj'1j"gCbl"ぴCs"b-wo'・Agro1(/).Thctrainingcourscaimcdlbrdifhlsillgbasicthcoryalldobscwatiolltccl】lliqllcstoAsiaI1Hllxlcscarcllcrs・MOI・ctllalltwcntyparticiI)alltswlIowcrcabouttostartcarbondioxi(lcHuxmcasllrcmenljoinedli・olntcIldiffbrcntcouI1trics(Saigusac/(11,
2006).Wcbclievetl]istraillillgcourscllascolltributed(ocxtcndlllccarbolldioxideHuxobscrvatiollinAsia,
aIldtoilllprovcdataqualityaIldlioslcl・iIlglca(IingrcscaIcllcrs・AbovcaⅡ,cool)erativcrclationsanlongAsiallrcscarchiIlstitutiollswcdcvcloI)cdtl1rougllthecourscisaglcathoardtoAsiaFluxcommllnity・
AsjqF/【(Etガノoノブ(J/Sllb-woMglD1(/)|】asissuedlWcvolulncsofAsiaFIuxNcwslcttcrilltheul)(Iatededitoriallillc・Inthcscissucs,Hvecditorsh・oInKoreallIldJapallcoml)ilcd21arliclcsfiDmKorcall,Chincscalld
Jal)ancseauthors・CoIltI・ibutioI1s'1,11]wi(lcrdistrictinAsia【11.cexpcctcd,alongwiththclilltherintcnsiHcationofouractMties・
InparaⅡclwitlltllcseoll-goillgactivilics,wcaI・cdiscussingAsiaFluxpolicyandmclllbersllil)lobetakcllill colltcxt・WchaveIlotupdatedtllosedcscriI)tionsillouI・wcbsitcsinccthecslablishIncntofAsiaFllⅨin1099.TllcAsiaFIllxcxecutivcalldstccringcoIllmittecsalccollductingcolnprchensivcdeliberationsollthcsemaltcrs,
sllggcstcdbyjVen1'0ノ・AMJ"(Jgc'"c"/Slイ/)-Wo'9kgノDMp,OIlcilllpor(aIltissucistosiIuatcAsiaFIuxtobcan uIllbl・ellaorganizatioIlwhichcovcrsAsillIlcommllI1iticswhocarIyoulobscrvationsoncarbondioxidc,eIlcl・gy alldwatervaporHllxorterreslrialcarboll、
Morcovcr,、α/qb“Ca"(ノD(J/qPoノノC)ノS抄wo'WgノDl(/)lMlsbegulltodiscusstheAsiaFluxdalabasel)olicyandupdatillgsitcillliorn1atiolL/I化qFl"we"IC"/SIW)017(J"(/S/(l"`/hll・(ノノzロノノo"M-wo'池ノDl(/)basalsostartc(lthc
dcvclopmclltofstandal・dizednllxmeasulCInentsystcIns、Solllcworkgrouplncmbcrshavcsuggcstcdusthatwc Ilavctorccollsidertllccurl・ellllillkagcalllongcacl]subgloupactMtics、WciIltc】ldtoin1proveAsiaFluxtobclnorcacccssiblcalldattractivcwitllacool)cratiol]ofparticipalltswllojointoAsiaF11Ix.
'ICノ!"olpkdgel"e"町J1化wo"/tノノノAcroノノノロ"AqノノノノノCCCノノall)oノロノoパノMsjqF/l(s1{b-wolAg'りM/)s/bノ・ノノノD"loノノ"g
o"'・(Jcノルj//esJ1/jejW/伽αc'んj/jclswelで/)"('"CM)'Mノリ)oノプαノllWheノt1/)。"eseM"パノノ)'q/肋にαノノo",C"/'1"ぜ,SPol・灯,Sb/e"Ce(J"(/7bc/"'0W)g)'(MEX7)。"(ノノ)W〃cjs/Q-Pqc版cA'e/wolk/blO/Cl)α/Cノノα"ge他vcq'℃ハ(WW).Rehrenccs:
Ohlalli,Y2005.AsiaFlllxilnl)IcnlcntationofNcwProgr〔11〕〕slilndcdbyMEXTandAPN,AsiaFIuxNewslctterl5,l-2
Saigusa,N、,makagi,K、,Yllla,S、andllirata,R2006.RCI〕or[olltllcAsiaFllIxTrainillgCoursc2006,AsiaFIlⅨNcwsletterIO,1-2.
‐1-
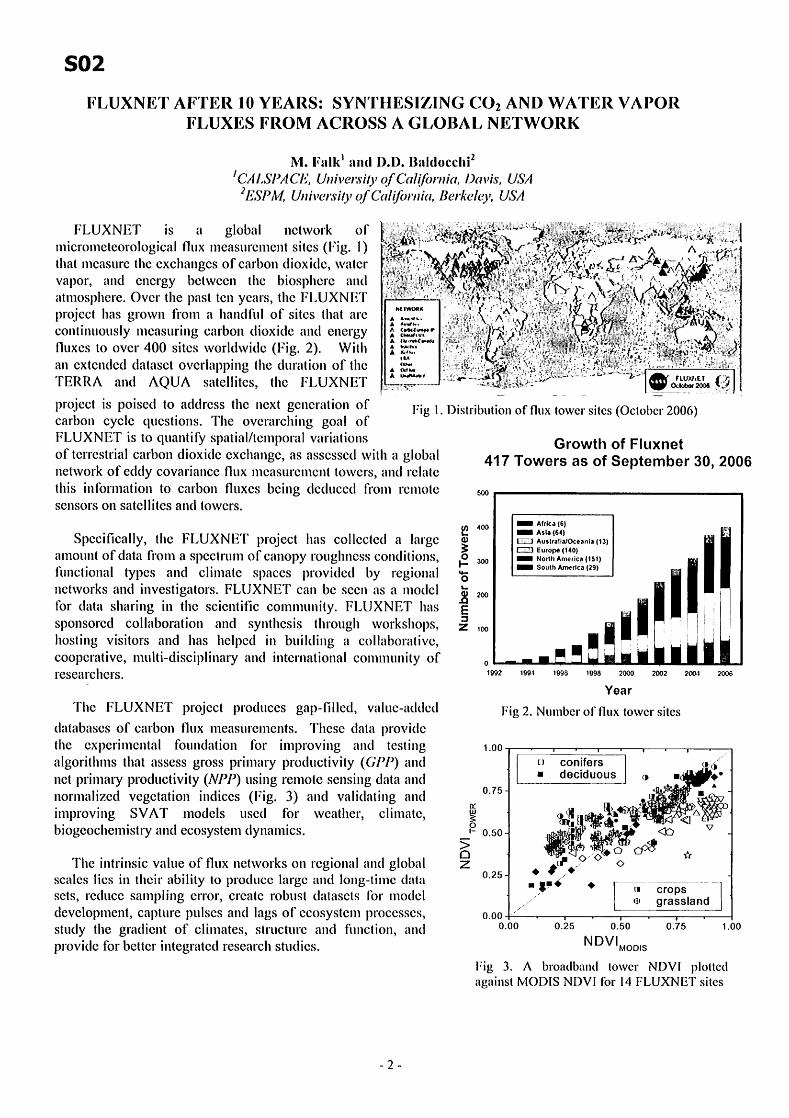
SOZ
FLUXNETAFTER10YEARS:SYNTHESlZINGCOzANDWATERVAPOR FLUXESFROMACROSSAGLOBALNETWORK
M・F8uIk1all(1,.,.B刊I(Iocclliz
jClLSP,4CノZ〔/>'八,cハダノ0,q/nJノi/t"yljqDq1,jMノ1M2EUPM〔ノノ1ハ,eM),q/Q,/(/bノソノノ(,,βe'we/qMノ'34
FLUXNETisngloballlctworko「
micromcteorologicalHuxmeasu1℃Incntsitcs(Fig.1) thatmcasurethccxchangcsofcarbondioxidc,watcr
vapor,aIldcl1crgybclwccnthcbiosl)l1clcaI1(I atmosl)hcrc,Ovcrthcpasltcnycars,thcFLUXNET prQicctl]asgrownfTomahandliIlofsitcslllatarc
colltinlIouslymcasurillgcarbolldioxidcandenel・gy Huxcstoovcr400sitcsworldwidc(Fig.2).With
anextcndcddamsctovcrlappingtlleduloationoflhc TERRAandAQUAsatellitcs,tllcFLUXNET
prqicctispoiscdtoaddrcssthcncxtgencrationof carboncyclequcstions、TheovcrarchinggoalofFLUXNETistoquantilyspatial/tcmporalvariatiolls oftcrIcstrialcarbondioxi(leexchange,asasscsscdlI
麟蝋
Figl、DisIributionofnllxtowcrsilcs(OcIobcr2006)
GrowthofFluxnet
417TowersasofSeptember30,2006 oftcrIcstrialcarbondioxi(Ieexchange,asasscsscdwithaglobal networkofcddycovariallccfluxmcasurclulcllttowcrs,and1℃latc
thisinlbrmatiolltocarbonnuxcsbeingdc(luce(1h.omrcmotc scnsorsonsatcllitesan(I1owcrs.
GOO
■■■Africa(6)
■■■Aslal641
=]AUS腕lWOceania(13)
 ̄〕Europe(140)■■■NC此hAmerica(151)■■■SouIhAn霜rIcaに9)
仰迦m咽
⑭』巴安◎トー。』のcE。Z ,llUlI
SpcciHcally,thcFLUXNETprqIcctll&lscoⅡcctcdalargc amolllltofdatali・omaspcctrumofcanopyrolIghncsscoIldi(ions, lilllctionaItyl)csandclimatesl)acesl)rovidcdbyregiol1al llctworksandilwestigators・FLUXNETcanbesccn【lsanlodcl
Hordmtasharinginthcscielltiliccommunity、FLUXNETh(lsspol]sorcdcoⅡaboratiol〕andsynthcsistllrougllwol・ksllol)s,Ilostillgvisitorsandhashelpcdinbuildillgacol1abol・alive, coopcrative,multi-discipliIMlryaI1dinterlMltionalcomllllIIIityof resealchcrs.
NII 0
l”21”$1993199820002002200$2○O6
Year
Fig2・Nlllnbcrofnllxtowc「sitesThcFLUXNETprQjcctproducesgap-nued,valuc-addcd
databmscsofcarbonHuxmeasulcll1cnts・Thcscdalaprovi(lcthecxperimcntalfbundationlbrimprovillgalldtestillg
algoritllmsthatassessgrossprimalypro(Iuctivily(OPP)and llctprinlalyprodllctivity(ノVPP)usingremotcsensillgdataalld llormalizcdvcgctatiollilldiccs(Fig.3)alldvalidmlillgand improvillgSVATmodclsusc(Ifbrwcathel.,climalc, biogcochenlisil・yandecosystcm(lynamics.
1.00
5
0
5
7
5
2
0
0
0
に山三○ト|ニロヱ
ThcintrinsicvalueofHuxllciworkson1℃gionalalldglobal scalcslicsintIlcil・abilitytoproducclaI・gcal1dlol1g-timc〔1ata
scts,lcducesamplingcl・I・or,crca(crobustdatasetsIbl・modcl
development,capturepulscsalldlagsofccosystcnlpl・ocesscs, studythegradicntofcliInates,sIructurcandfiIIlcIion,【llld
providcfbrbc((crilltegratcdrcseaIc11studics.
■3■◆◆
0.00
0.000.250.500.75’・OO
NDVlMoDIs
Fig3、AbroadbandtowcrNDVIploItedagainstMODISNDVIfbrl4FLUXNETsites
-2‐
011
NEWDEVELOPMENTINCANOPY-ATMOSPIIIDREEXCHANGE
M、Y・LecIel・Cl,J、H0,91,G.ZlMuIUg1,A.AII〔lrews2,R,Avissar3,P・BcrtscIl4,W、Eichiluger5,M、Parker6,G、Oiu7,J・Warlalld8an(lT、Watsoul9
ノLab〃.Eノハ,ノ,.o"脈,"α/PノリWCM1/,e〔ノ>'八,cMyq/GCC'9j(J,U21,2ノVoルノ,BOIノノヒノセノ;CO,〔ノs/1,
JDノィハe〔ノ)ノルe'my,Dl"・〃α"『,ノVCUEfl,イStJWJ'"M1ノノ尺八,e'・ECO/ogyLqb,UGj,jjAe",Sc〔ノM,
j〔ノ>ノハ'eMyq/YOw(M"les,LMノ肌6StM"'"(ノノjR〃cノ・AMO"。/LaZ)0,.口/o/)',」/AC",Sc〔ノH/1,2,1ヅノc"ノノ"'℃(J,l(ノ49ノプーF1oo(ノCtl,"qmO"qwa,C(v"α〔ノロ,
lYノノルMyq/G'イelIP力,Gノイe|I/)ノハCt711qdtv,pBノDOAノノα,)c〃ノVt7//o"。/Lq6oノ刀/o'),,βノDOAノノ〔ハ,c",ⅣXUlM
Thispaperin(roduccstllcconccptol、aCarbonFIuxSupcl・Sitc,thcncxl-gcncratiolloffluxsitesaimedat
charactcrizillgcarbollcxchangcbctwccntcITeslrialecosystcmsmlldthcalInosl)hcrc・TheCarbonFluxSupel・Siteharnessescuttillg-cdgctccl1llologicstogcllcratcinsighlsleadingtohighIyrclcvalltbiologicalandphysical proccssinlbmlatiollaboutthccal・boncycle、Itdoessoinacollccllll・atcd,integl・atedefYbrt,sothatcomprchcnsivcllovclmcasu1℃mclltslcIatcdtocal・bonexchangeillnoll-idcalcollditionsrcsultinmolc scicntiHcallycredibledata、
Usingrecentmcthodstocharactcl・izctheimpactofficqucntandl〕oorlydocumcntcdatmosphericphenomenaoncalbollHuxcs,tllisCal・bonF1uxSuperSiteaimsatproducillglcviscd,mCl・Cl・obustregional‐ scalecarbonHuxcs・ThisdataisobtaillcdusingbothstatiollalyalldaiI・bornclluxplaUbl・mscombinedwithonsitetaⅡtowerCO2mixillgratiomcasulclllellts・Thedatawillbcuscdasilll)utintorcgionalmodelsto
simulatemoreacclIrateclimatccllallgcsccnarioslhatresultliomiI1cl・casc(lalmosl〕hcl・icCO2conccntratiolls・Thcsccolldportiolloftbislalkrcpol・tsollthclatcstdcvclol)mclltssllrrolIIldingcanopy-atmospherc
exchange、ArecelltLagl・allgiandifliIsionmcibodisusedtoexanlinethccaIlopy-atll1osphcregascouscxchangc fbl・sourcesverticallydisIl・ibllIcdwithillthCcanopylayer・Wecx&lmincthcvalidityofthcLagraI1giandifhusionlnethodanddiscussthcbch【wiol・ofI1lcdifhlsingscalaras(llilllctioIlofdistallccliDmthcin-canopysources/sinks,bothlbl・thcnc(】1.-ncldandlbrthcfilr-Hcld・ItmimicstllcdifliIsiollofCO2respiredfiD1nthesoilsurflce,andthediHiIsiollofgascscxchaIlgcdscparatelyh・omtllemaiI1c〔lllopylaycraIldfi・omtheunderstory・Theinfluenccofbuoyallcylb1℃ingonthel・esultsisdiscusscd、Thcsc1℃sultssparkncwundcrstandingsollgaseoustransportillsidclbl・cstcallopicsanditsexchangeofgascsbctwccllthccanopylayerandthe atmosphere.
-3-
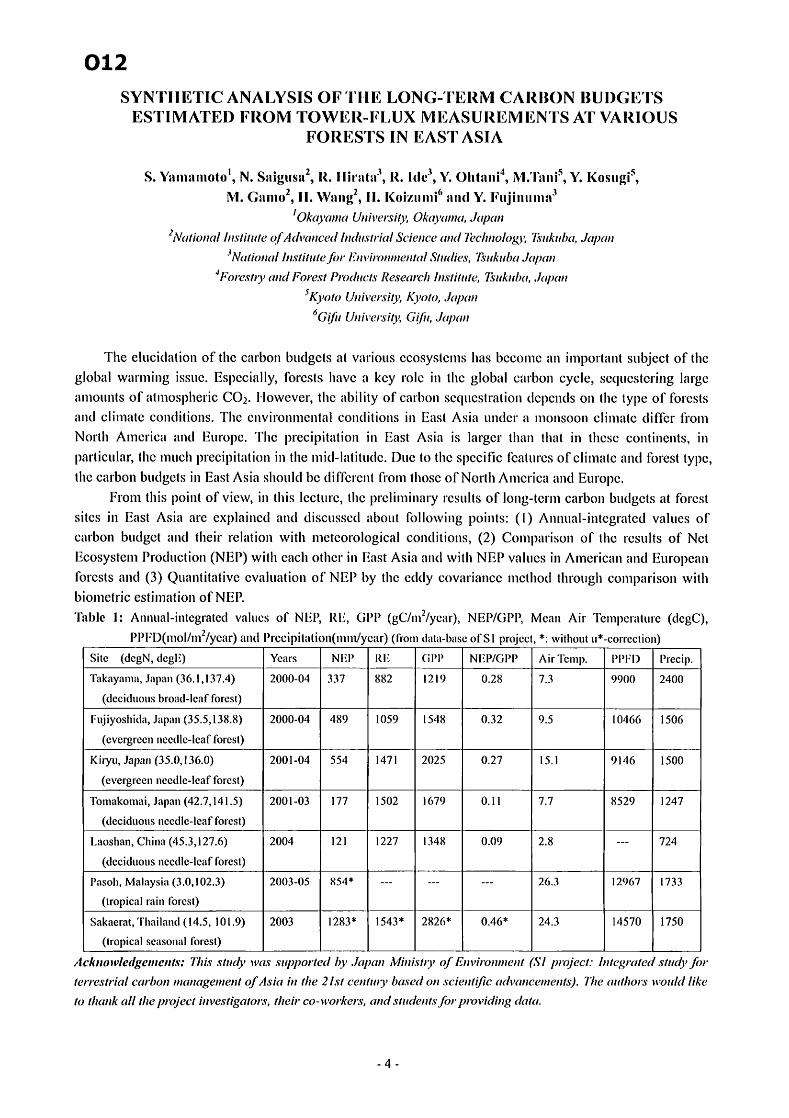
O1Z
SYNTHETICANADrSISOFⅡlELONG-TERMCARBONBUDGETS
ESTIMATEDFROMTOWER-FLUXMEASUREMlDNTSATVARIOUS
FORESTSINEASTASIA
S・MuIwuIuloto1,N、Snigusm2,R、Ilirat8uJ,R・I(IC3,V、OIlt8uni4,M・Tmlli5,YKosllgi5,M.Gilmo2,H、W、Ⅱ92,HLKoizumi`luIl(IYbFujillul】l3uJ
ノOA[1,W")α〔ノ>ノハ,e'F/nIoAql,(""(J,Jtリ、〃
2MJノノo"αノノ"s"/1"cq/A(ノW7"cc(ノノ"〔んs''7α/Sヒゾe"Ce('"(/7bcノj"oノogllZiMイバWl)α,JtJ"(J〃
JMJ"。"αノノノノs"/"je/b'・のハ,ノノD""'e"'〔7ノs/mes,乃"Aw6al,ノノα〃
イパ〔wM)'〔"l(/Fb,℃s'n℃(/llc心R“αJ,℃ハノw""化,乃"1Wb〔,,`ノ【,ノノ(J〃
5K),。/・〔ノ>,八,CM)(),。/(),、ノセ!/w'
601/i,〔ノ"八℃ノ3j0,Gj/jイ,。ノ、ノノα〃
Theelucidationoftllccarbonbudgetsatv(lriousecosyslcmshasbccomcmnimportalltsuhicctoftllc
globalwarmingissuc・Espccially,lbrestslMwc【Ikeyl・olcintllcglob&HIC【lrboncycle,scqucstcl・illglargc
amountsofatmosphel・icCOz・However,thc(lbilityofcarbonscquesll・atioIldcl〕cndsontl]clypeoffb1℃sIsandclimatecollditions・TIlccIwiI・onmenIalcondiIionsinEastAsiaundcl・amollsoonclima(cdiHbrfiOm
NorihAmcricaandEuropc・Thcprecipit<iollillEastAsiaislal・gerthaIlthatintllcsccolltinents,ill
I〕articular,thclnuchprecipitationillthemid-liltiIudc・Dllctothcspecific化alu1℃sofclimatcandfbresttyl)c,
thccarbollbudgctsinEastAsiashouldbc〔liflblclllli・omtlloscofNorthAnlcI・icnalldEul・Cl)c、
Fromthisl〕oilltofvicw,illthislcctlIrc,I1lcpI・eliminaly1℃sultsoflolug-tcrlncarbollbudgctsatfio1℃st
sitcsinEastAsiaareexplaillc(landdiscusscdaboutfioⅡowingpoints:(1)Anllual-intcgratcdvaluesof
carbonbudgctandtheirrcl(ltiollwithmctcorologicalcollditiolls,(2)ComlxlrisonofthcI・csultsofNcl
EcosystcmProductioI】(NEP)withcachotllcriIlEastAsiaandwithNEPvalucsinAmcricanandEuropcan
lblcstsand(3)Qual】titalivccvaluatiollofNEI,bythcc(ldycovariallcemcthodtllrollghcomparisonwithbiometricestimationofNEF
mIlbIel:Annual-integl・atedvalucsofNmRE,OPP(gC/1112/year),NEP/GPPlMcallAirTcml)c「(lIurc(dcgC),
PPFD(、Cl/mz/year)andPrccipiIaIioII(1,1m/ycar)(ITCI、(IatルbascofSll)rQicct,*:witI1outu*-corrcclioll)
PIcclIl
/lcAw(''''化血α"C"おf刀jiWlィの'w(Kw(/W'7e(ノ11)'JtWノノM"M)'(l/E"'ノノノひ'""e'WSノノ"Q/cc':ルノGg'w'c(プs'"のノノb'・
(Cl・'℃sノノ.、ノcα'・DC'1'"αノノ(Jge"leljlq/化jqj〃ノノje2ハノccノノノ'"〕'6口βe(ノo"scjeノノノj/〕Ca(/1'。"Ce'"e,MEノ.刀je("(/AoluIwo"ノW/AC
/orノノα"Aαノノノルe/"u/cc/jllves/jgq'01打,ノノ'cjl・co-wolkclUwll(ノJ1"(メe"ハル'・ノノ'ひWillgdtJ(a.
-4‐
Site(dcgN,(lcgE) YCars NIlID RE GlDlD NEP/GPP 八i「TcmI). IDIDFD Precip.
TklkayamKl,Jal)all(36.1,137.4)
(deciduousbro【ld-IcaffbresI)
2000-04 337 882 1210 028 7.3 9000 2400
F1リiyosbida,J【11)iln(35.5,138.8)
(cvcrgrccnluccdlc-lcaffbrcst)
2000-04 489 1059 1548 0.32 9.5 ]0466 1506
Kilyll,Jal)al】(35.0,136.0)
(evergrccIlllccdlc-leaflbrcsI)
2001-04 554 1471 2025 027 15.1 0146 1500
Tomakomai,Jal)an(42.7,141.5)
(dcciduousI1ccdlc-lcaflbrcsI)
2001-03 177 1502 1670 O」I 7.7 8520 1247
Laoshan,China(45.3,127.6)
(deciduousnccdlc-IcafIb「CSI)
2004 121 1227 13`18 0.09 2.8 724
Pasoh,Malaysia(3.0,102.3)
(lropicalrilillIb「est)
2003-05 854* 26.3 12067 1733
Sakaerat,Thailalld(14.5,lOLo)
(tropicalsc【lsonalfbrcsl)
2003 1283* 1543* 2826* 046* 24.3 14570 1750
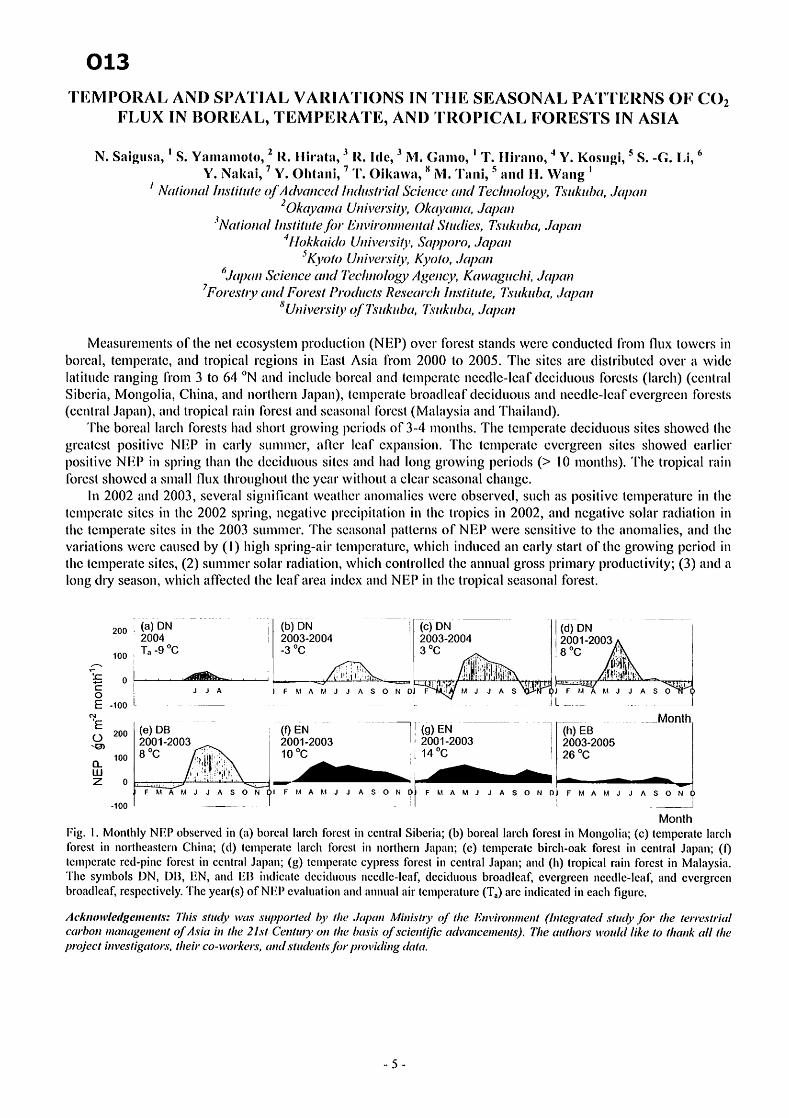
013
TIDMPORALANDSPATIALVARMnoNSINTHESEASoNALPATmRNSoFCo2 FLUXINBOREAL,TEMPERATE,ANDTROPICALFORESTSINASIA
N、Saigusa,1s、Yamamoto,zR・IIir8ut8u,JR.’(le,3M.G801110,’T・Ilirnllo,4Y、KoslIgi,SS.-G.Li,6Y・Nmk孔i,7V・OIutaIli,7T、Oikaw8b8M・Tnlui,Sam(IILW8lmgl
ノノWノノo"αノノノMノノィノCQ//l`ハノロ,"cc〔ノノMMゾα/8℃花"(,c(",(ノルc/j"o/09),、M/M〔,,ハノ〕α〃Z0Aqw'"〔J〔ノノノハ,CWO,,oノhI【),(""αJw〃
ゴノVmjo"(JノノノノS"/"/e/bノ・〃ノハ,ノノD"'"e"/α/S'"(ノグe8,7b,イハ"/)(MtJ/)α〃ギノノOAAα/(/l〕〔ノノノハ,eMl,,StW〕o,.0,.ノヒW〃
3K〕,。/・〔ノノノハノCM)',Kyo/゜,、ノ〔リノα〃61ノヒIノノ(,"8t/e"Ceα"。〃cノノ"・ノヒノgMge"GMmw〔'9"c力Mn"。'’
7Fbノでsノノ)ノロ"(/FWaF/P'℃(/>/C/S腿sea'℃ノノノ"s/",イノe’7KwAwba,、ノヒwwsU>ノルe'川'0/7bwA"b('’7IwMwb(',、ノヒW〃
MeasurenleI1Isoftllenetccosystcnlproduclion(NEP)ovcrll〔)lcststandswclcconductcdnomHuxtowcrsillbolcal,teml〕el・atc,andtropicall・cgiollsinE【lslAsiali・om2000to2005、Tllcsitcsaredislributcdovel・awidc
l(ltillIdcrangillgnUm3to64oNaIldincllIdebo1℃alandtempcratcneedle-lc&lfdcci(luousfblCsts(Iarch)(ccnlral Sibcria,Mongolia,China,andnorthcmJapall),lcmpcratebroadlcafdeciduousandllecdlc-lcafcvcrgrcenlbIcs(s (cclltralJapan),【lndtropicalrailllbrcstandsc【lsolMlllbrcst(Mill【lysiaandThailalld)
Thebol・eallal・cllfbres(shadsllortgrowingl)criodsof3-41nolllhs・Thetcmpcratedeciduoussitcsshowcdthc
grcatcstpositivcNEPincallysummer,aHcl・lcafexpallsioll・Thctcmpcl・atccvcrgrcensitcsshowedemrIicr
posiliveNEPinsl)riIlgthanlhcdcciduoussilcsalldlladlollggrowingperiods(>lOmonths).Thctropicalraill lb1℃stshowcd〔1s、【lⅡHuxthl・olIgllouttheycal・witholItaclcal・scasonalchallgc・
In2002and2003,severalsigllincantwcaIllcl・aIlomalicswc1℃observe。,sllcIlaspositivctcmperaturcinthc tcmpcl・atesitcsinthe2002spl・ing,11egativcplccipiIationinthcIl・opicsi、2002,aIldncgativcsolarradialiollilltllclcmpel・atesitcsillthe2003sulnmcr・ThcscllsollalpatIcI・llsofNEPwel・escnsitivetothcanomalies,aludIhcvariationswc1℃calIscdby(1)highspring-airIcllll〕cratu1℃,whicbin〔lucedancarlysIal・toftllcgrowingperiodillthclcmperatcsitcs,(2)slImmcrsolarradiatioI1,wl1ichconlrollcdthcannualgrossprimaryproduclivily;(3)allda longdlyseason,whichafnectcdIhclcafal・eaindcxalldNEPil1ll1clropicalseasollalfbI・est.
20o(a)DN 2004
,00$Ta-9oC
(b)DN 2003-2004
-3oC
(c)DN 2003-2004
3oC 00 000
0 00
21
(←迄←亡oEN」と○・q山之
JJA FMAMJJASOND
-1001-
~ ̄「雛90両,I14oC
(OEN 2001-2003
10oC 2001~ZUc
DOC
ZIi恥  ̄▲ FMAMJJAsoNDIFMAMJJAsoNDjFMAMJJAsoND
-100
Month
Fig、1.MonthlyNEPobservcdin(a)borcallarchlbrcstillcclltralSibcri【l;(b)borcallarchlbrcstinMollgolia;(c)tempcratclarchIbrcs(illnortheastcmChilla;(。)tcmpcIYltclalc111brcslinllolthcmJal)【11】;(e)tempcmtcbi「ch-oakfbreslillccntralJapan;(DIcml)cratered-pinclb「cstincenIr(11J【11)all;(9)tcll1l)cmlccyprcssliDrcsIiI1ccnlralJapall;all(l(h)tropicalrainlbrcstinMalaysia・TIlcsymbolsDN,DB,EN,alldljBilldicaIedeciduousncedlc-lcafdcciduousbroadlcafcvcrgrcenncedlc-Icafandcvcrgrccll broa(Ⅱeafrespcctivcly・Tllcycar(s)ofNEPcvaluaIiolMlIIdalⅡlualairtclnl)cratu「c(Ta)a「cilldicatcdineacl〕ngurc.
/化町IDⅡ左(Zgc"'C''応:7カ町s'1ィqO'w(&VJM(/V〕o'7e(/のノノIC・hWJ''M"M)'q/ノノJCE'ハルD''"'e"'(7)'/eg'切花(ノ.W"〔O'/b'・〃)e/e'・'℃sノノ.j(ノノCa'・bollllJα"<Jgc'"c"'q/′lsiai"//jc2ハノα""")'o〃ノノjcb(JMsq/scjcl〃cα(ノ!'。「"cel"elMsiノ.m/)call/ノjolFwoノィノヒノノノAC'oノルα"Arα〃/ハeノ"ロノccji"WS'jgdlolmi,ルノノ・co-wolkcl汀,〃"(ノs'1ィ。b"パノbl・ノ"D11j(か"9.1W.
-5‐
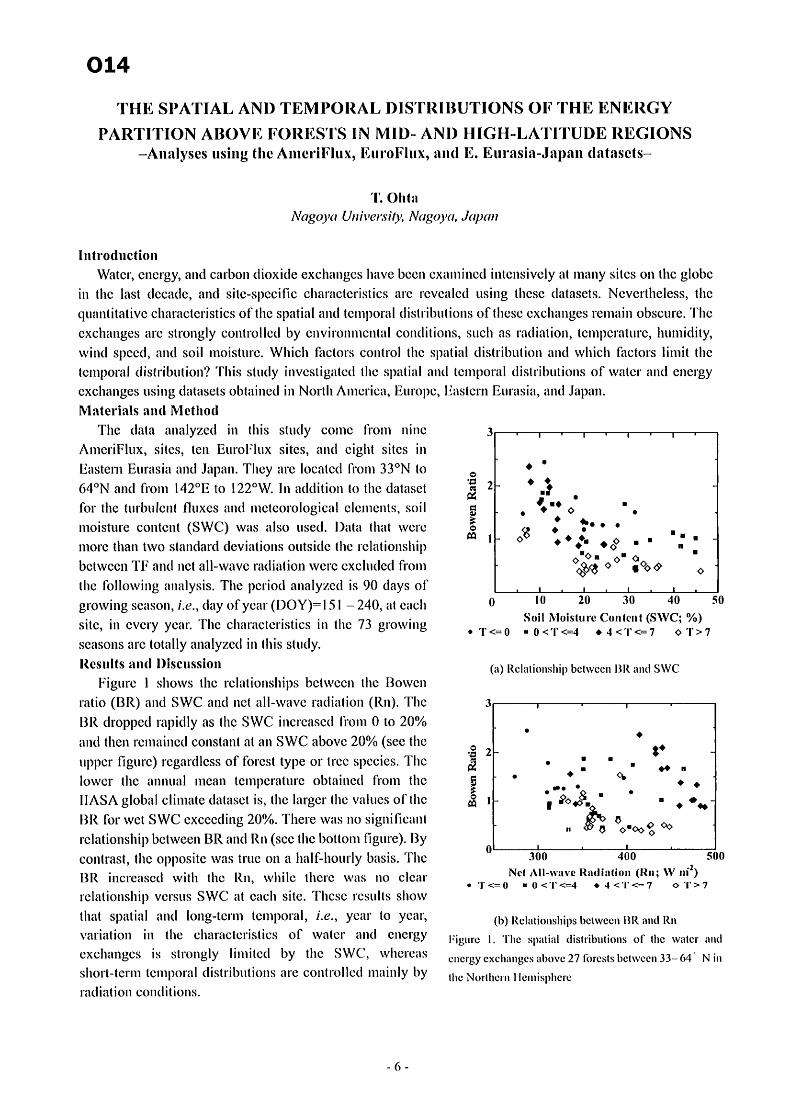
014
THESPATIALANDTEMPORALDlSTRlBUTIONSOFTHEENERGY
PARTITIONABOVEFORESTSINMID-ANDHIGII-LATITUDEREGIONS
-AMIysesusilugtlleAmeH・iFIux,EuH・oFlux,nul(lE・Eurasi汁J8ll)an(lHtnsets-
T、OIlt81
MJgq〕'(J〔ノノノハノeパノ01/VtJgの'α,ノヒソノノα〃
IIltroductiolu
Watcr,cncrgy,alldcarbolldioxidcexchallgcsllavcbccllcx(lmillcdintcllsivclyatmaIlysitcsollthcglobc
intIlclastdccade,alldsilc-sl〕ccificchaI・aclcristicsarcI・cvclllc(Iusinglhcscdatasets、Ncvcrtheless,tllc
quantitativccharactel・isticsoflhcspatialalldtcllll)oraldisll・ibllliollsofthcsccxchangesl・emainobscurc.Thc
cxchallgesalcslrollglyconll.oⅡcdbycnvil・olllncllt&llcolldilions,suchasl・a(Iiation,tempcralulc,hulnidity,
wiIldspecd,andsoilmoisturc・W11ichflctorscolltroltllcsp<i(lldistribuliollalldwhichlIlctorslimitt1]c
tcmporaldislribution?Thissludyillvcstigatcdlllcspati&llilIldtcmporaldistl・ibutionsofwatcl・andcnergy
cxchallgesusillgd<ase(soblaillcdillNortllAlncl・ica,Ellrol)c,l]【lstcmElIrasia,andJapan.Matel・ialsnIl(lMethod
The(laiaanalyzedintlliss(udycomcl1・olnninc
AmeriFllIx,sites,lenElIl・oFluxsites,alldcightsitcsill
EasternEurasiaandJapalLTllcyalclocatcdn・oIll33oNlo 64oNalldli・oml42oEtol22oW・lI1additionlothcdatasct
lbl・theturbulcll(Huxesalldlllcteolologicalclcments,soil
llloisturecontcnt(SWC)was【llsoused、Datathatwc1℃
Inolcthantwoslandarddcvialiol]soutsidcl1lclcIationship
bctwccllTFandllctall-wavcl・adiationwcI・ccxcludedfi・om
tllcfbllowing【lllalysis・ThcpcriodanalyzedisOOdayso「
growingscasoll,/、e,,dayofycaT(DOY)=151-240,atcacll
sitc,illcvclyycar・Thccharactcristicsintl1c73growillg
scasol]sarctotallyallalyzcdiIltl】isstudy・ResuItsam(IDiscussion
Figurclshowsthclc1atiollshipsbelwccntllcBowcn
raIio(BR)andSWCandnctall-wavcradiatiol】(RIl).Tllc
BRdroppcdral)idlyasthcSWCillcrcasc(111.onlOto20%
alldthellrcmailIcdcollstantaIallSWCabovc20%(secthc
ul)pcrHgurc)rcgardlcssoflb1℃sttyI)eorl1℃cspccics、TIlc
lowcrthe&ll1llualmeanIcmpcraturcobtllinc(111.onllhc
llASAglobalcIimatedaIasctis,lllclargerlhcvallIesoftllc
BRfbrwetSWCexcecding20%・Thcrewasllosignincani
lclationshipbclwccllBRalldRll(seethebotlomHgurc)By
conlrast,tllcol)positewastrUcollahalfhoul・lybasis・ThcBRincreascdwithIheRII,wllilethelcwaslloclcar
rclationshil〕vcl・susSWCatcacllsitc・Thcsc1℃sultsshow
thatspatialaIldlong-1cm]lcll1poral,j、e、,ycarloycal.,
Val・iationillIhecharactcrisIicsofwaIcrandcncrgy
cxchangcsissIrol1glylimiIcdbythcSWC,whelcas
short-telm(cmporaldistributionsarecon(rollcdmainlyby radiatiollcondiIiol〕s、
3
◇
ロ$
●■OB
■■
・へび◇
●◆◇
幹・騨鋭
●◇◆
・◆Hい・・・◆◆・負い
●
ヨ2
ロ⑭量●ぬ ■■
■
I ■
■
◇
10203040S0
SoiIMoistureCoIutclut(SWC;%) ■O<T<=4◆4<T<=7◇T>7
0
。T<=0
(a)RclaIi()llshiI)beIwccllIBRandSWC
3
●
$◆
・・:。、。~J,
尭謹《二:三川
21
①垣甸堅口ご参①蛍
●
0 300400S00
NetAll-w8weRndinti⑪H1(Rn;WmZ) 。T<=0■O<T<=4◆4<T<=7。T>7
(b)IRclKllionsllil)sbctwccllIBRalldRn
mllcsl〕【lIialdistribuIionso「IllcvFigurcLT1lcsl〕【lIialdistribuIionso「Ⅱlcwalcran(l
cI1c「gyexcIlaIlgcsilbovc271brcslsbcIwccIl33-64‘NiIl
I11cNortllcmllclu]isI〕l1crc
-6‐
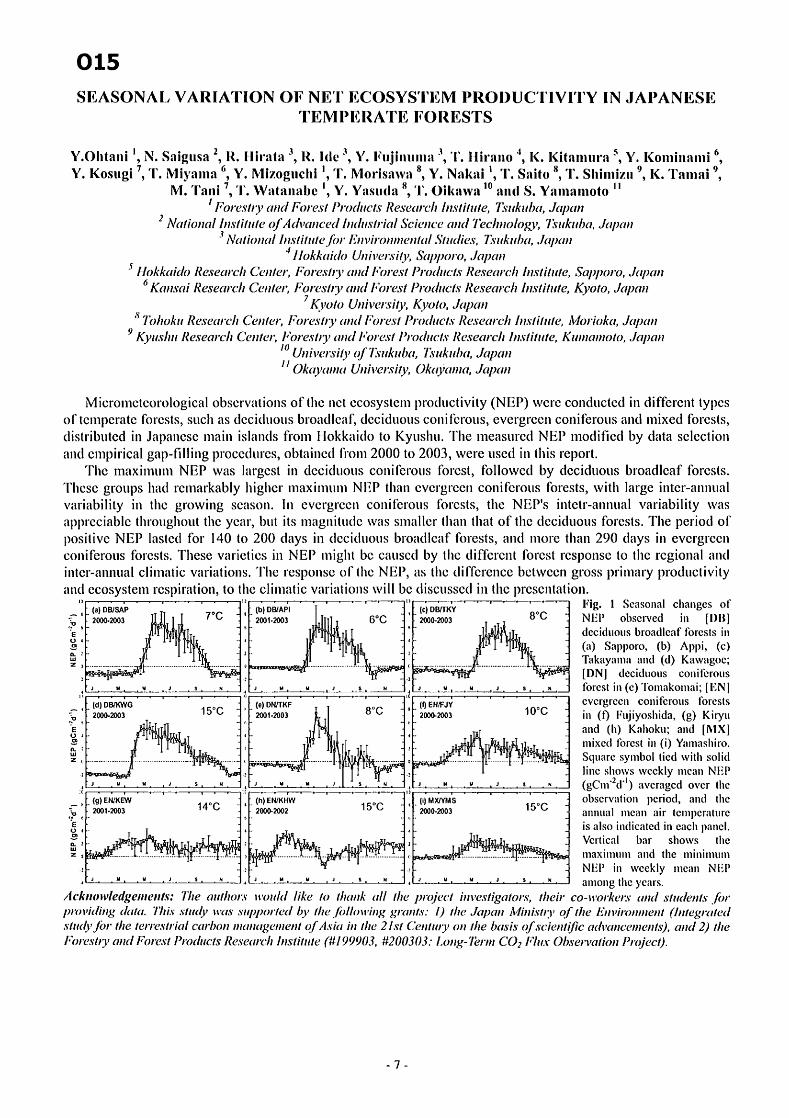
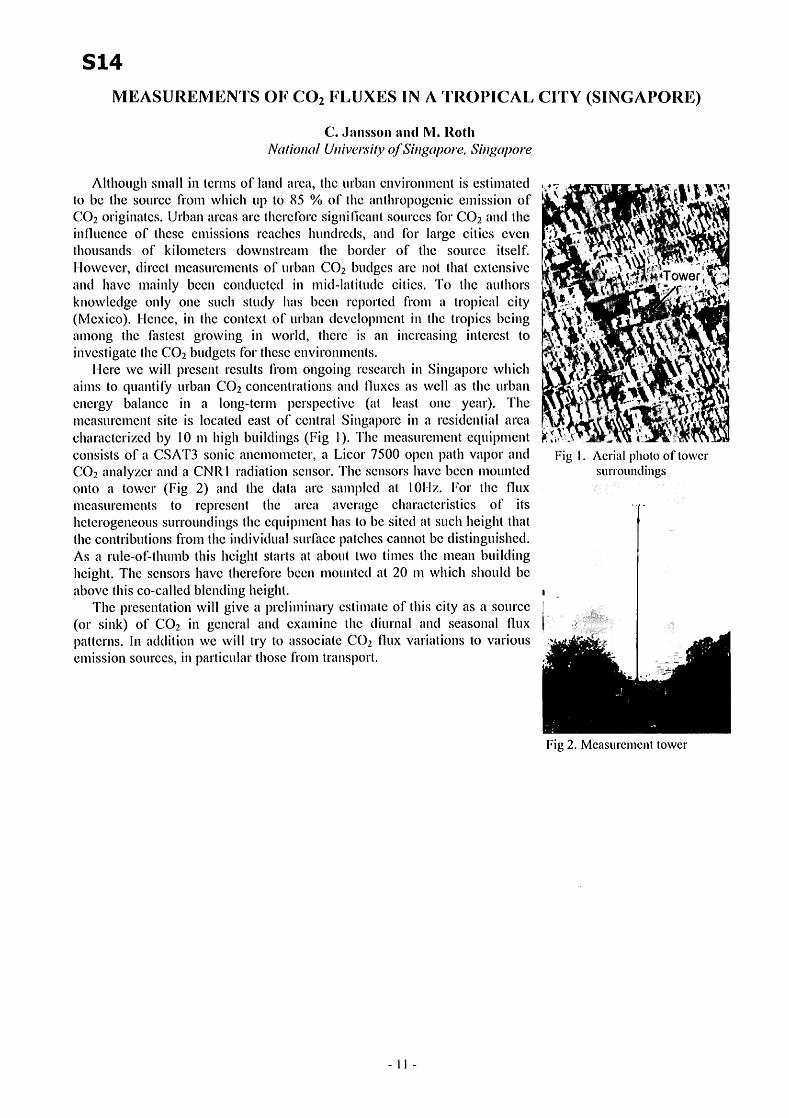
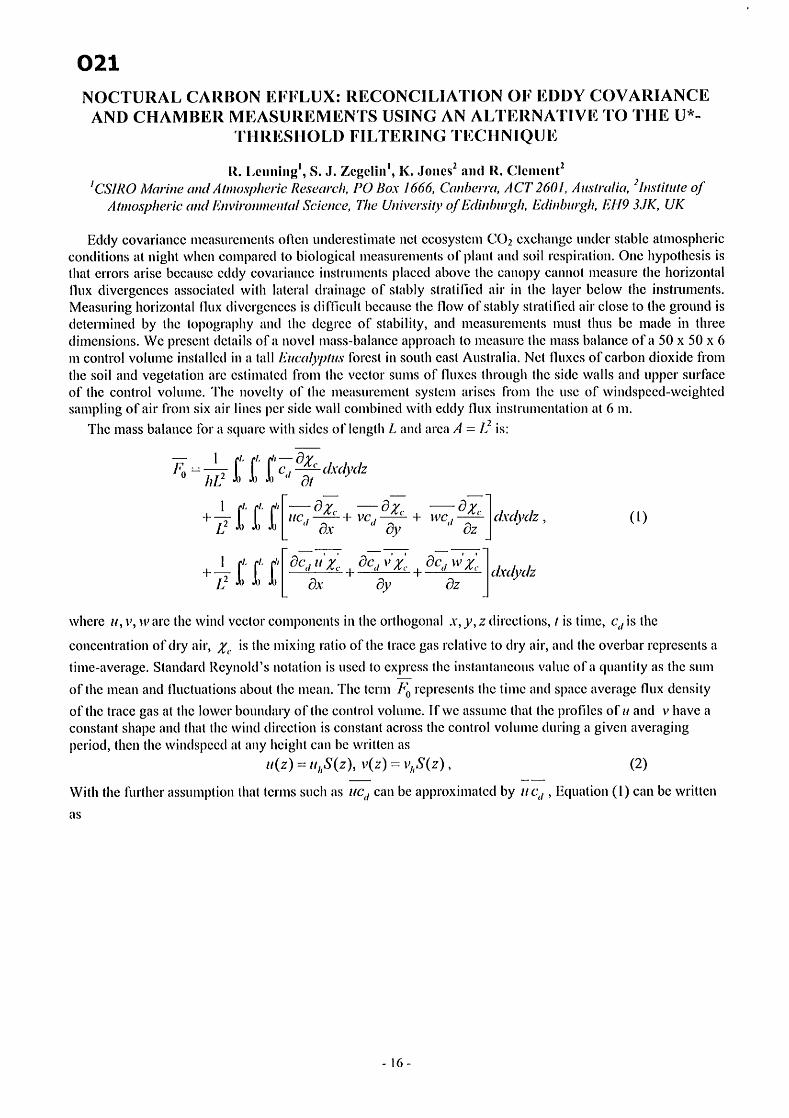
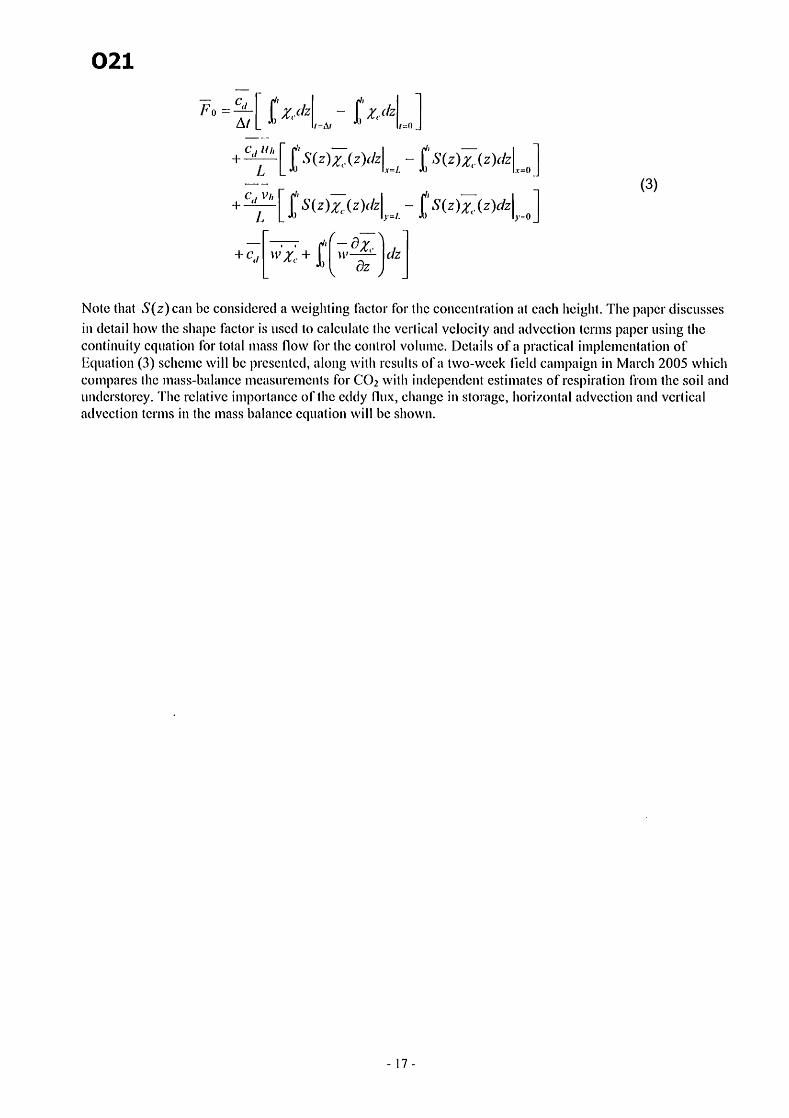
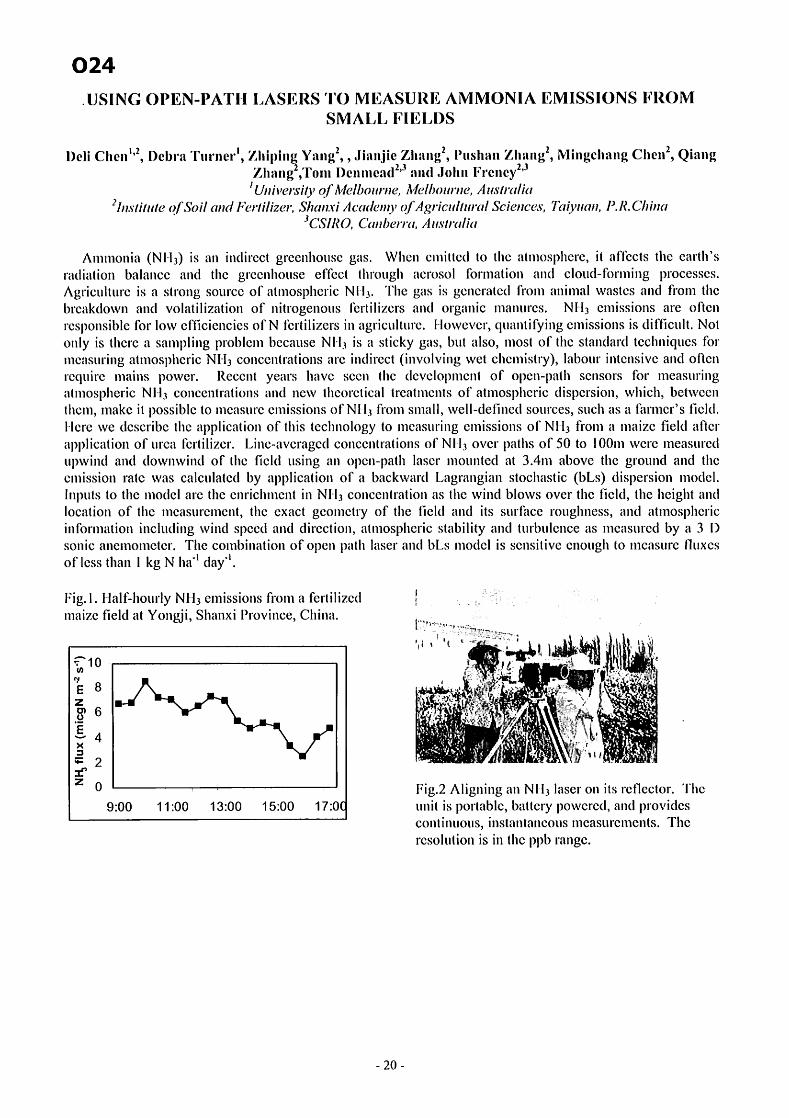
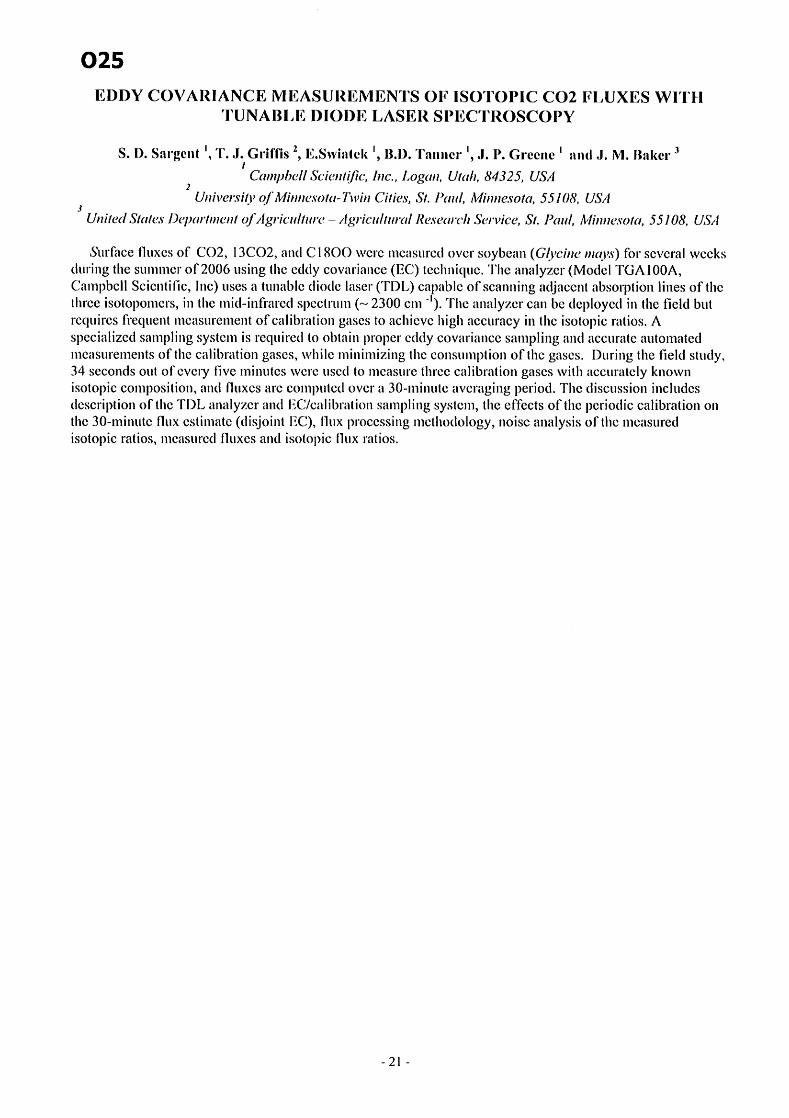
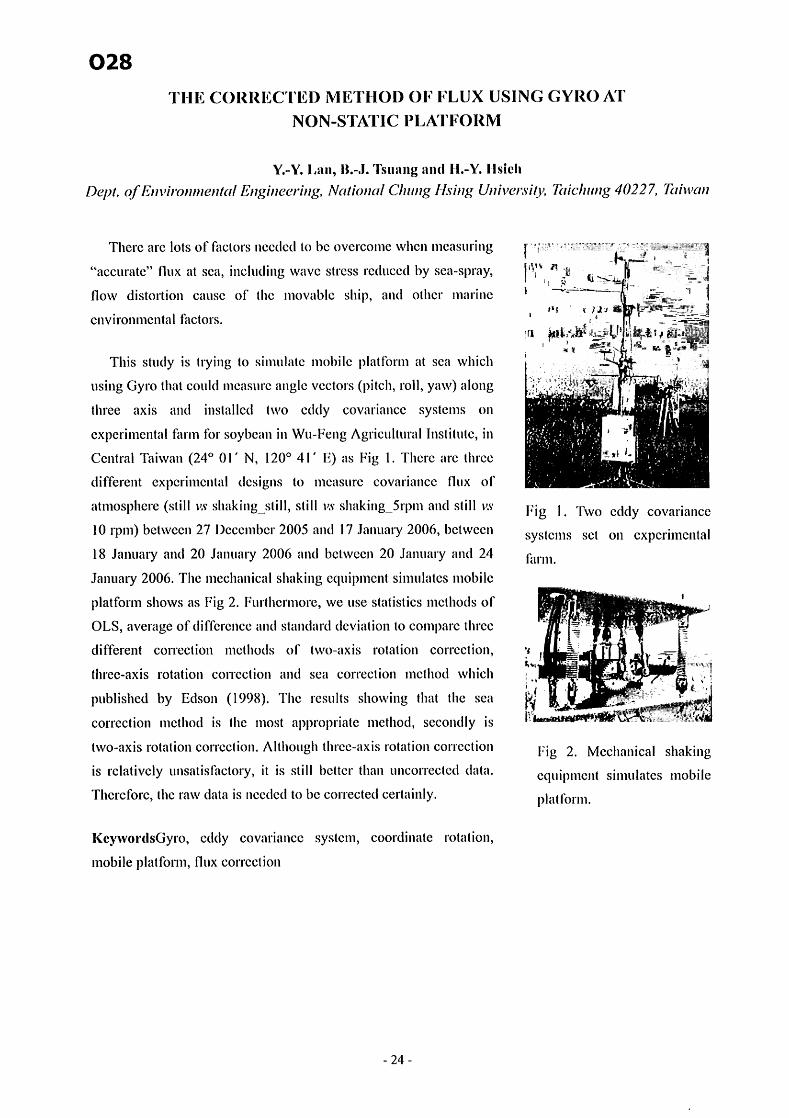
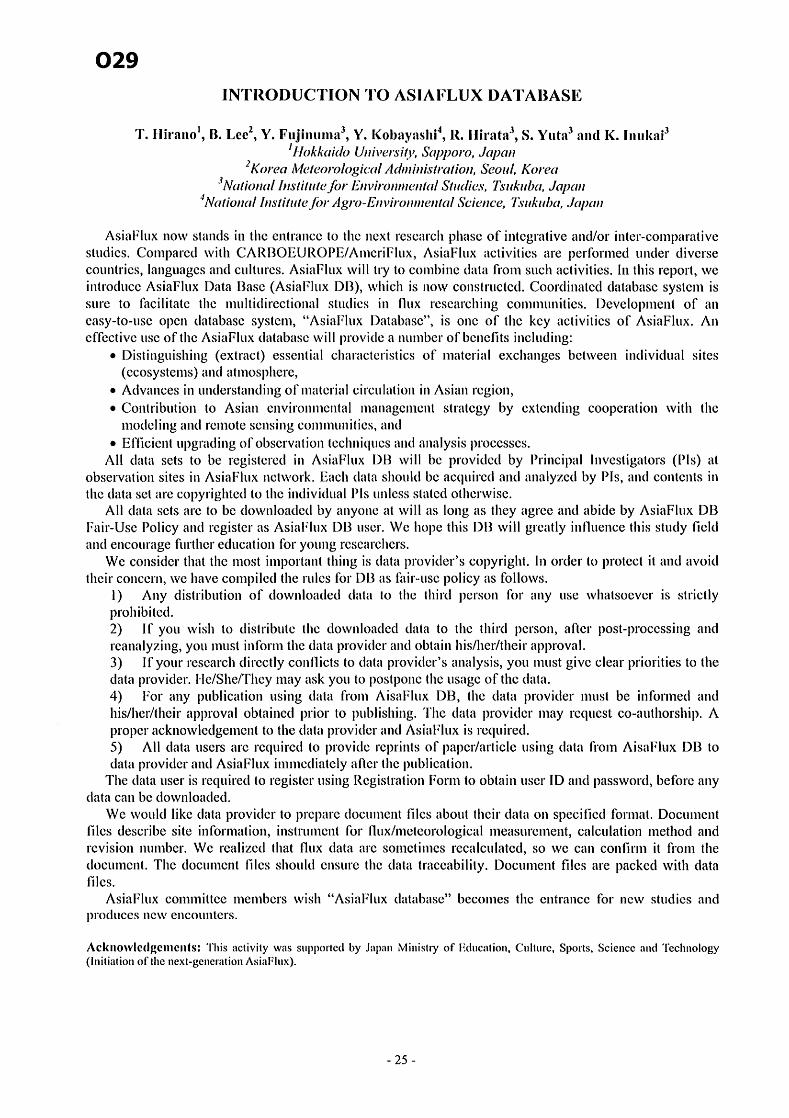
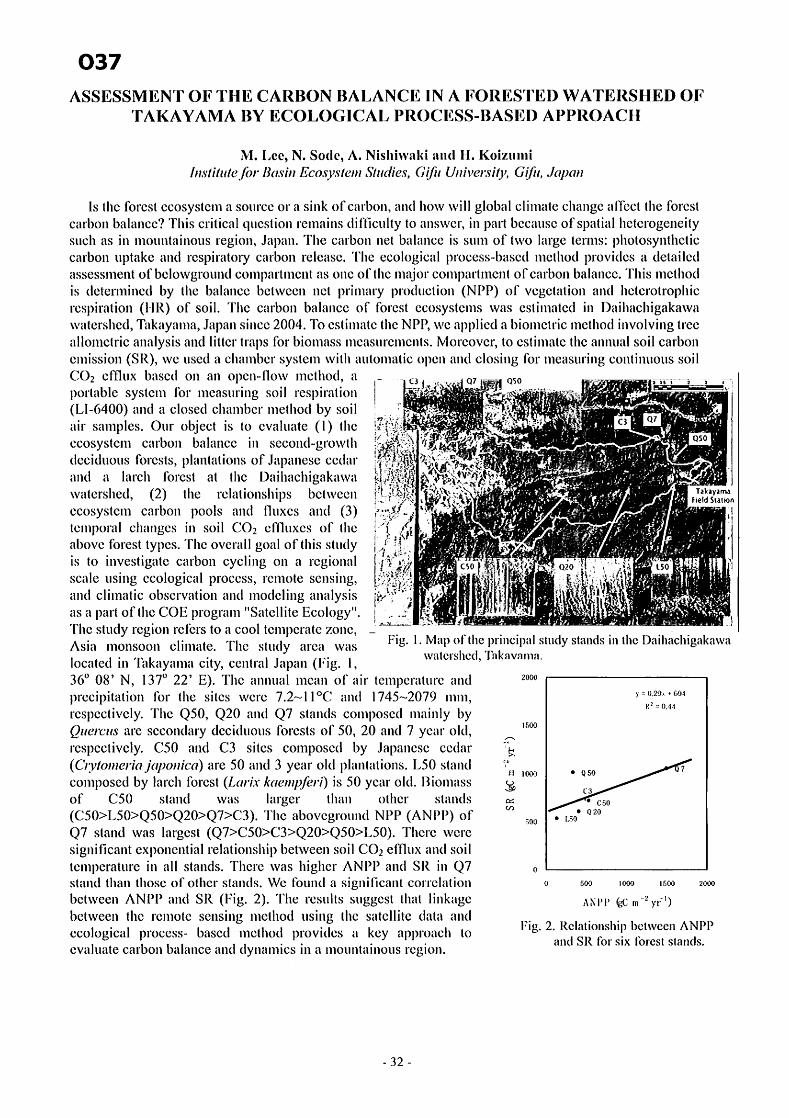
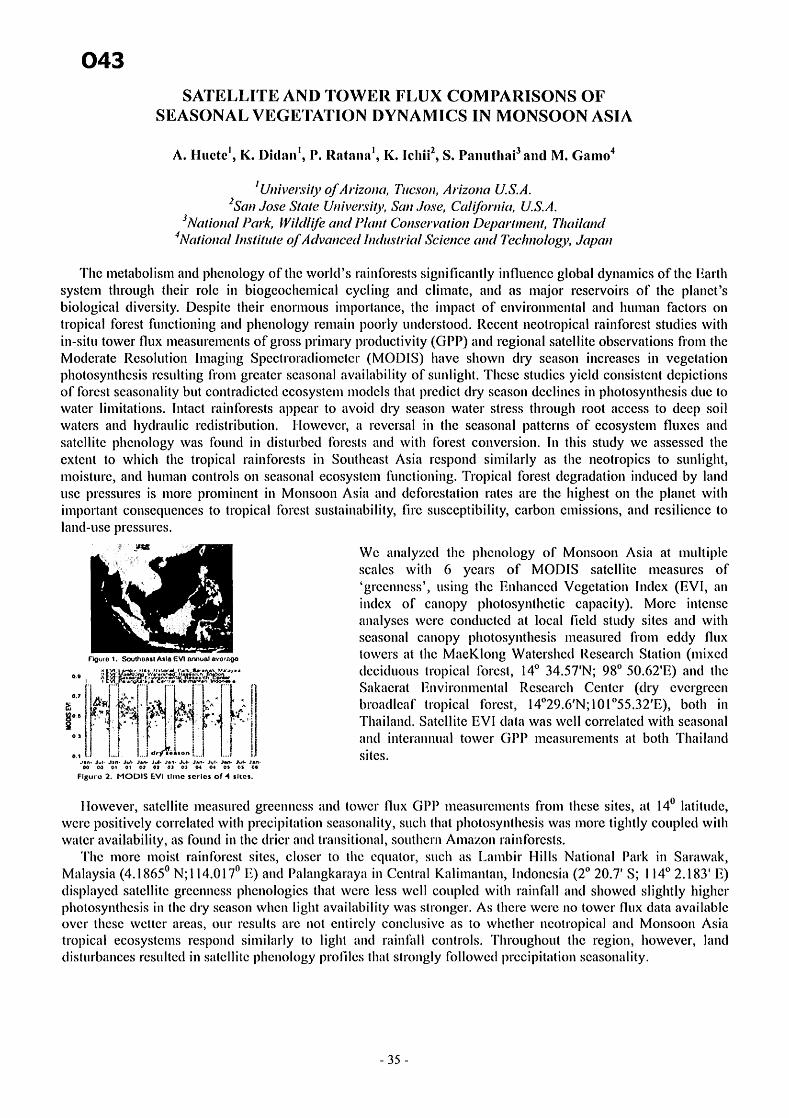
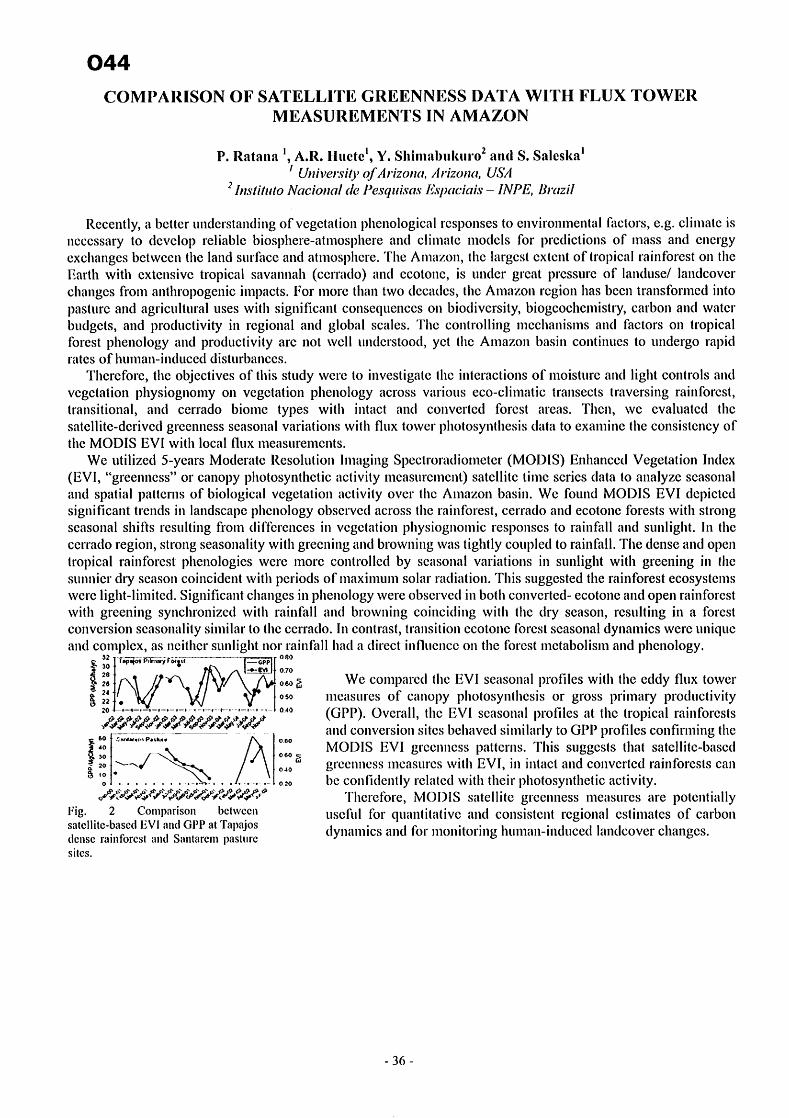

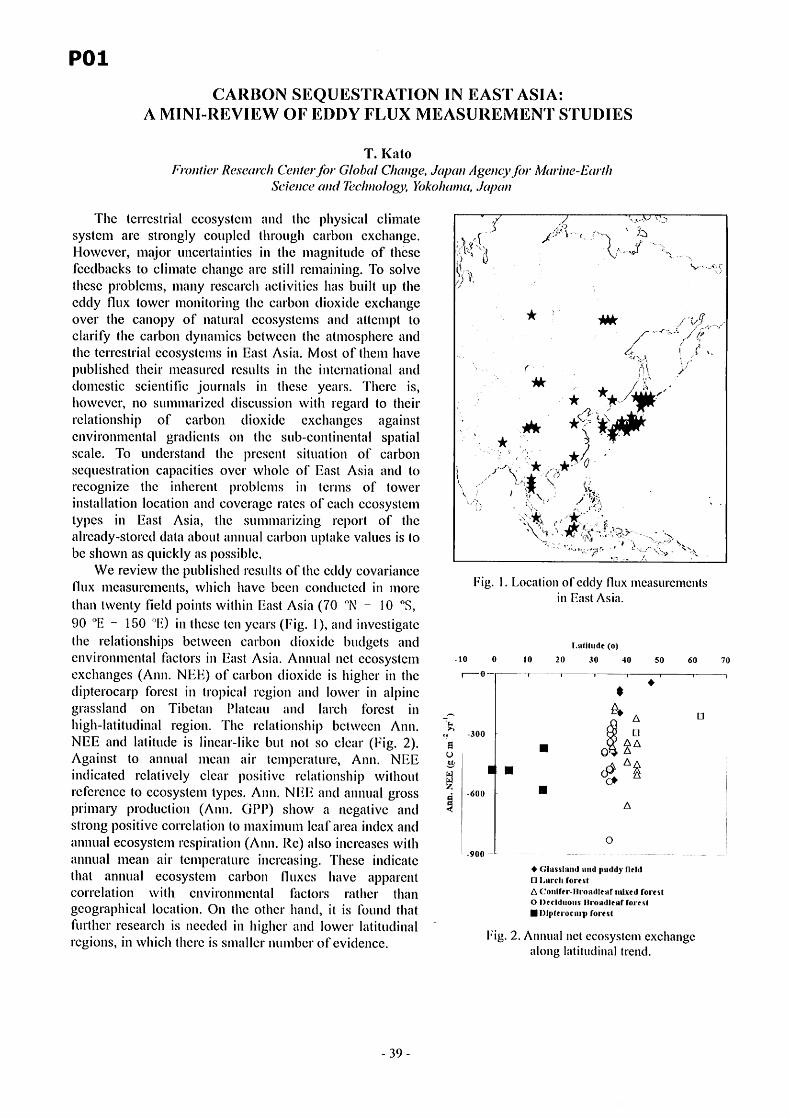
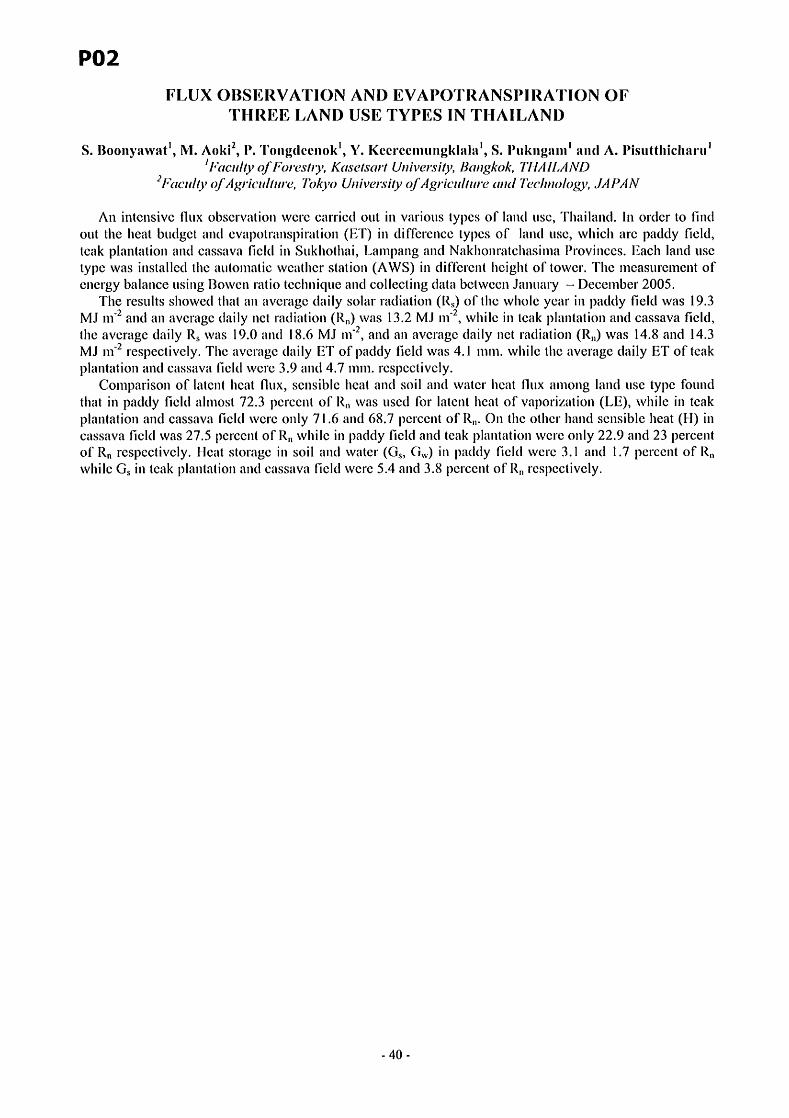
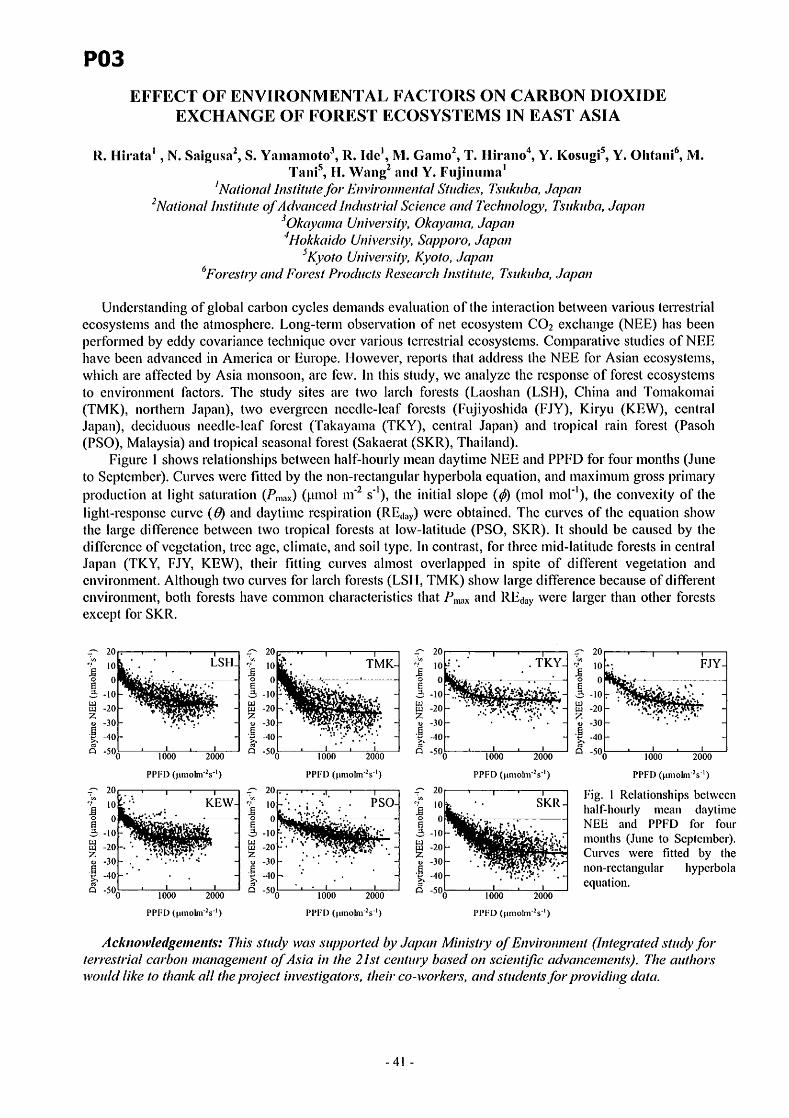
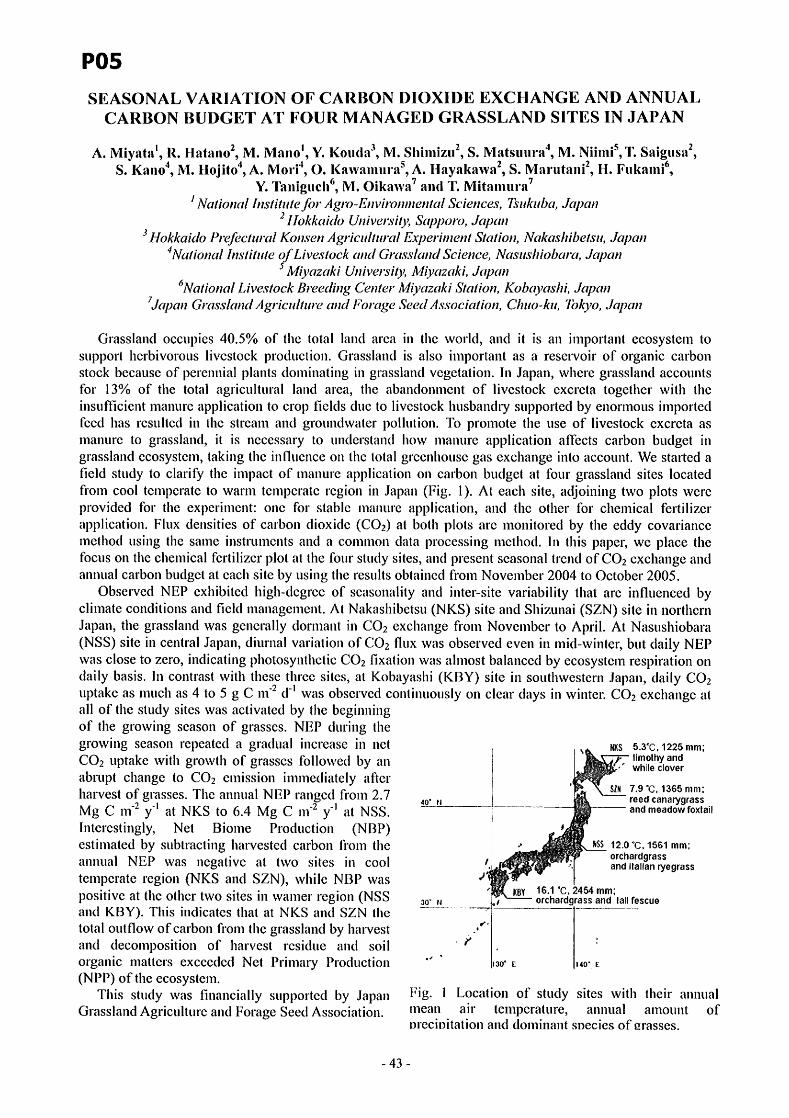
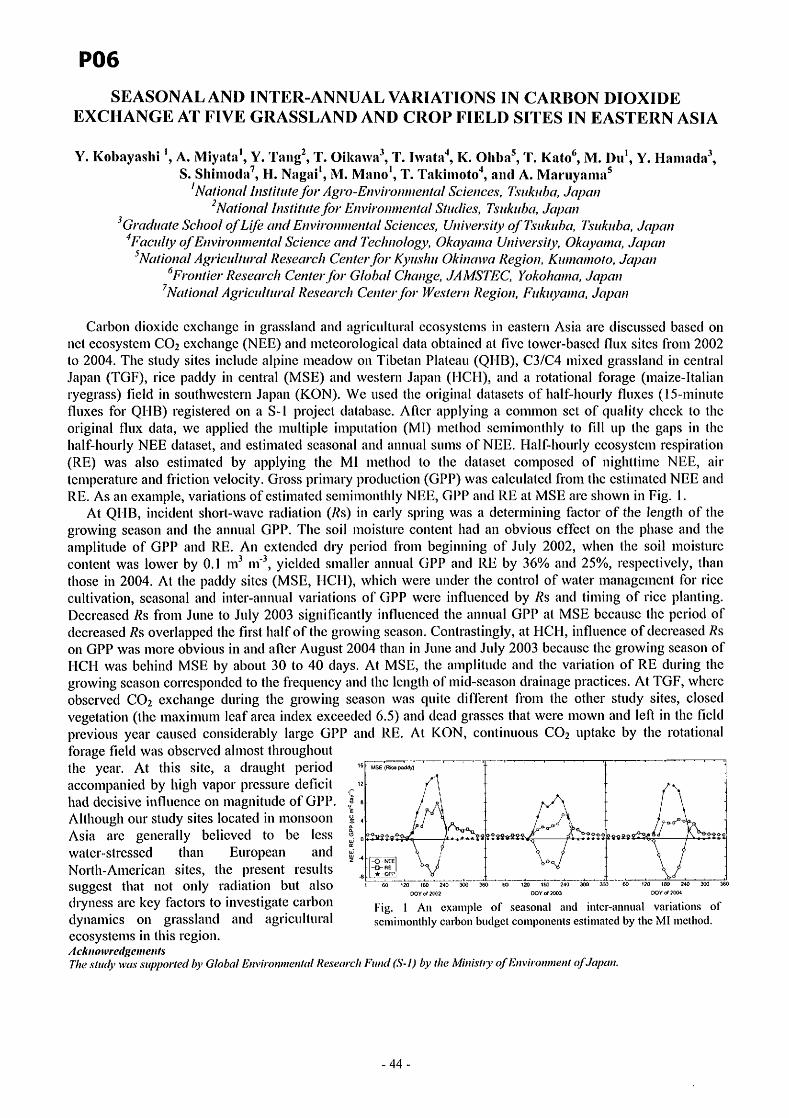
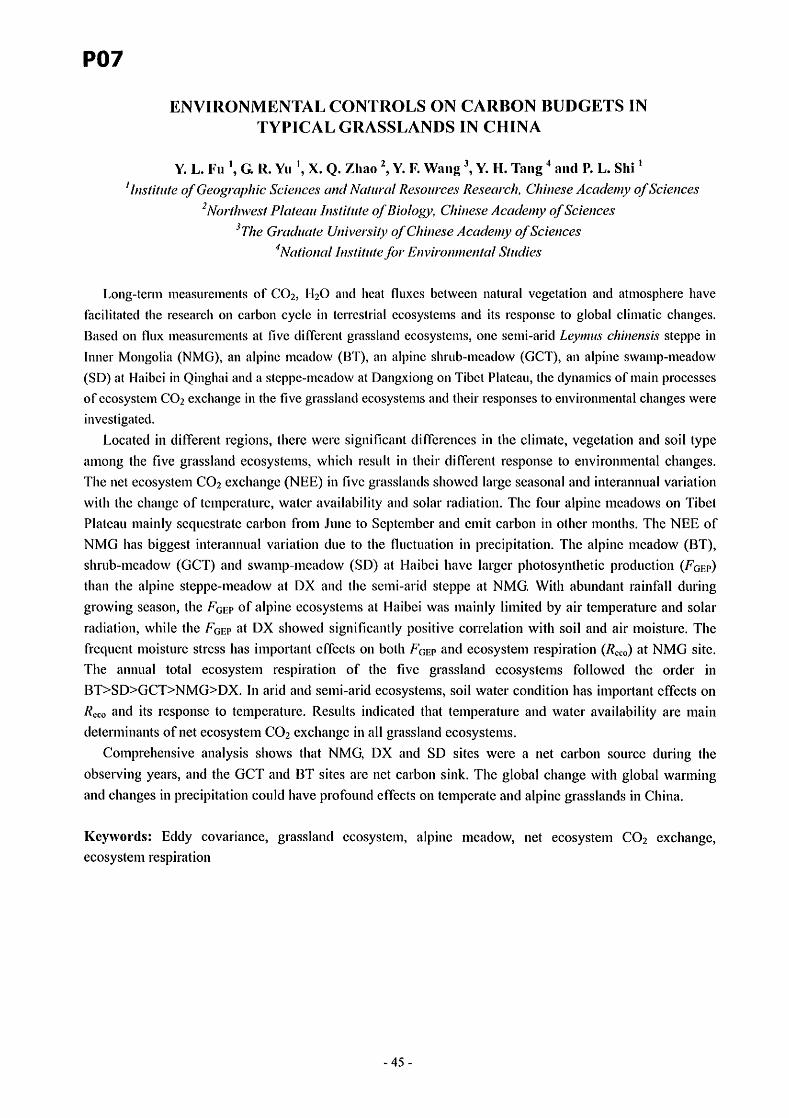
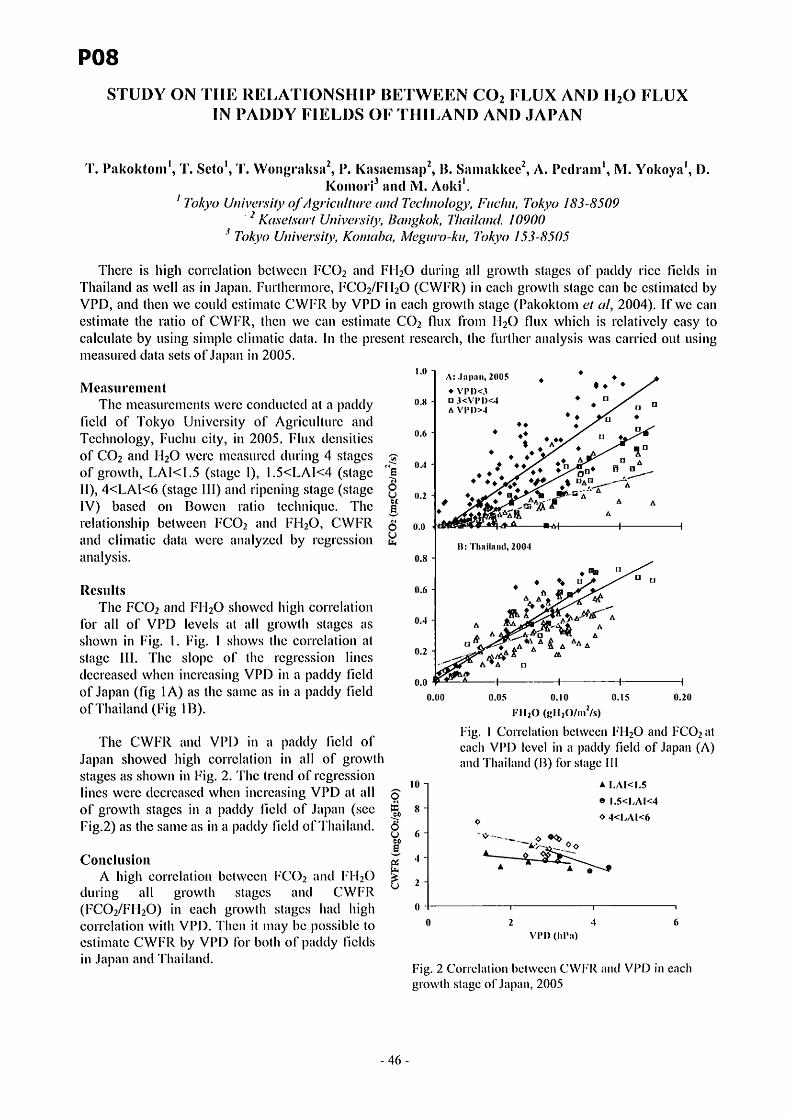
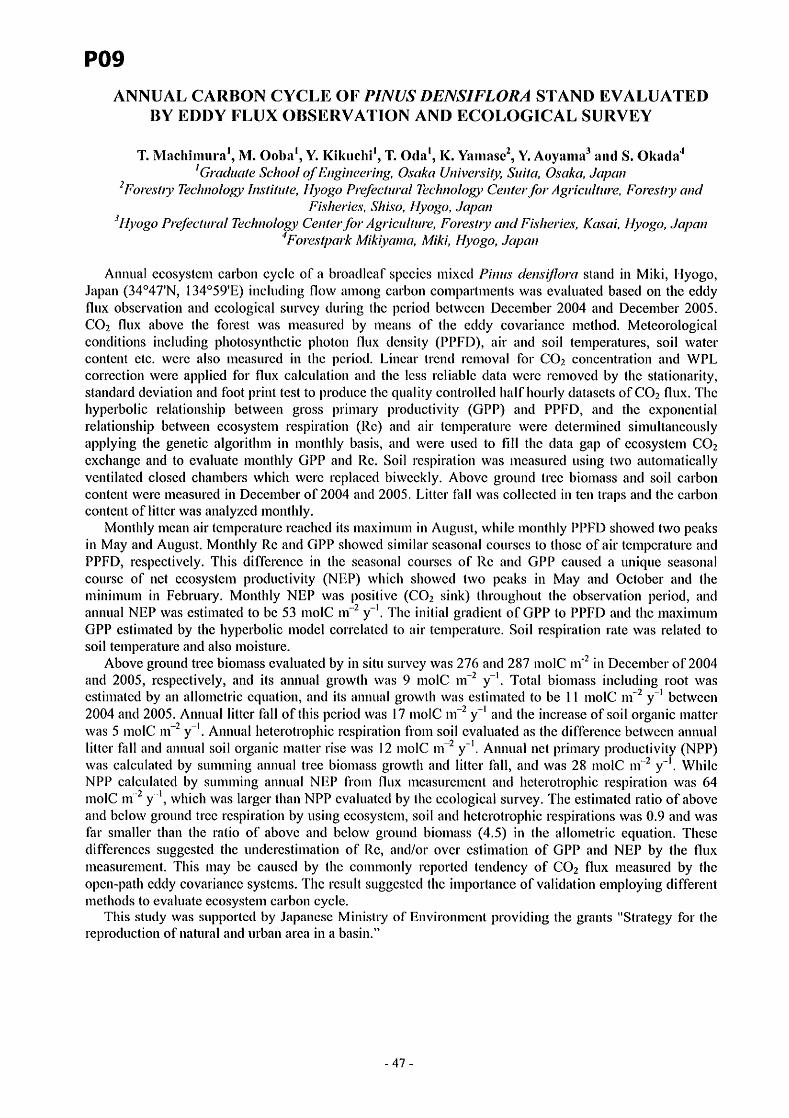
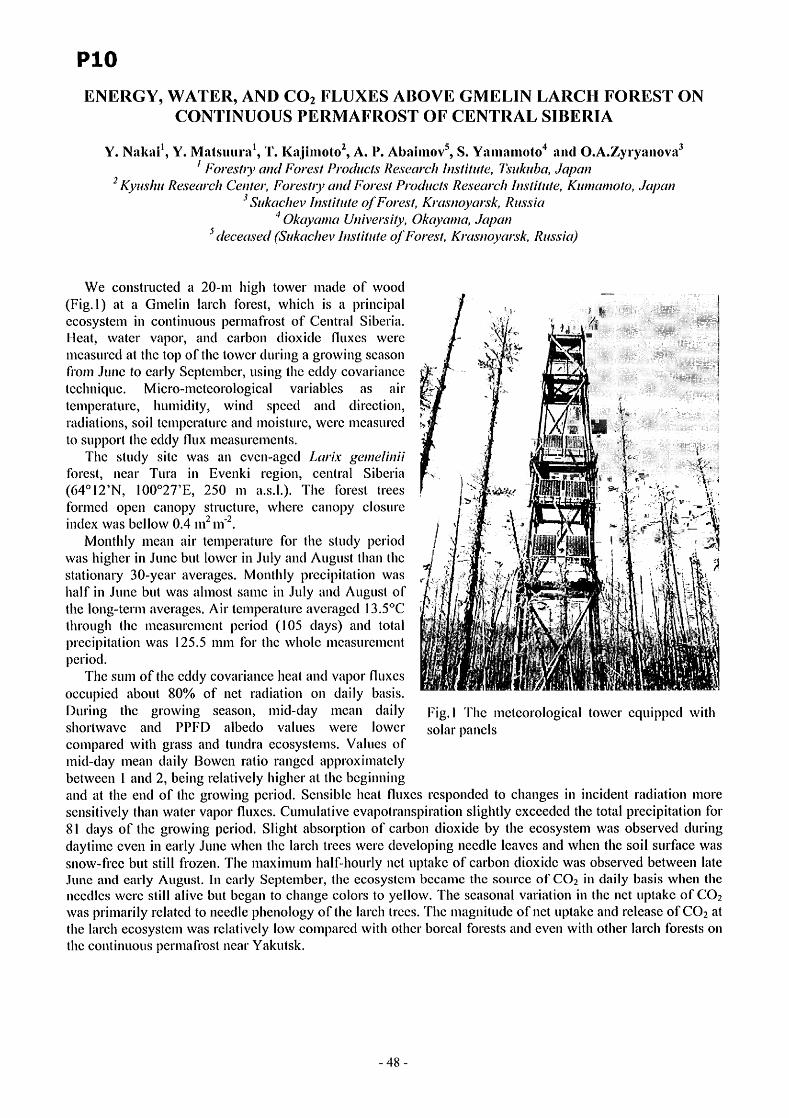
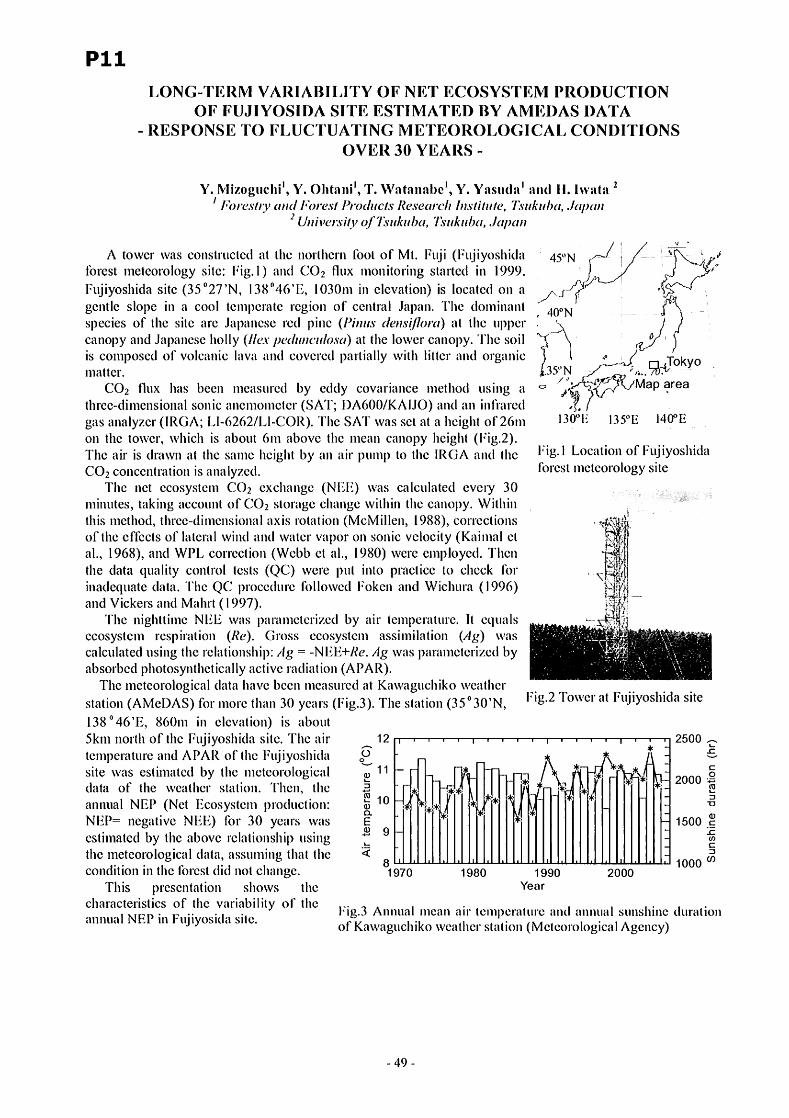
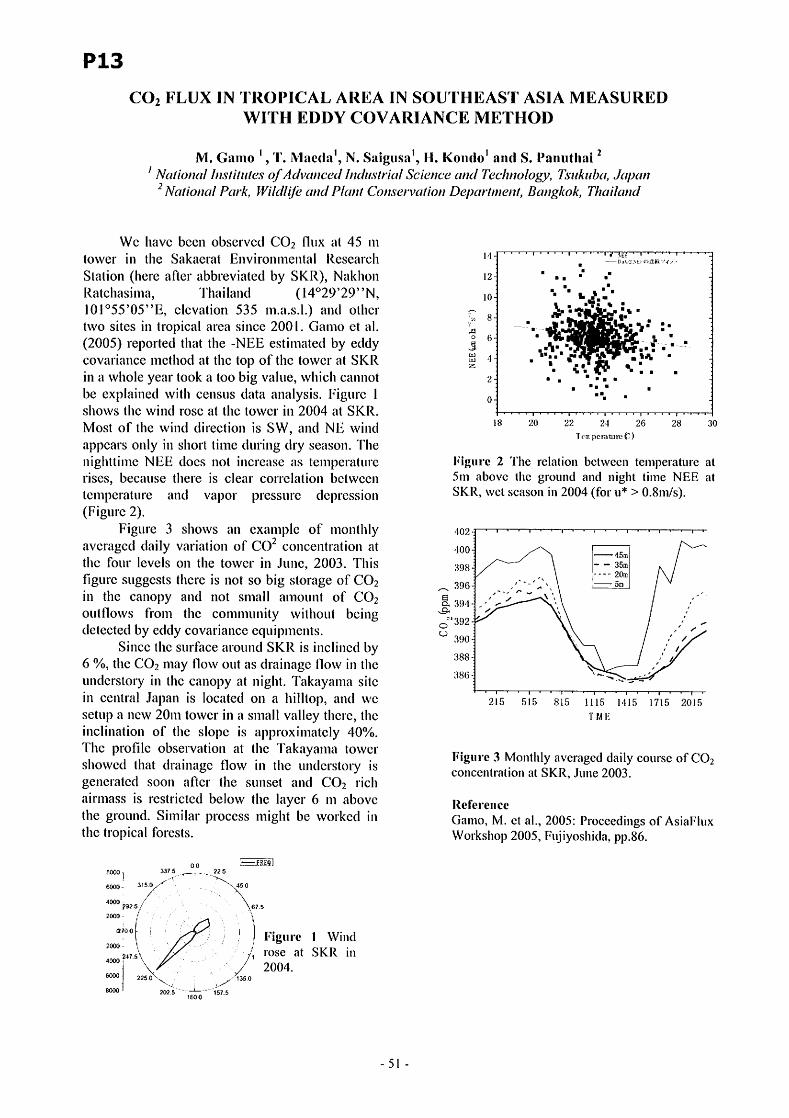
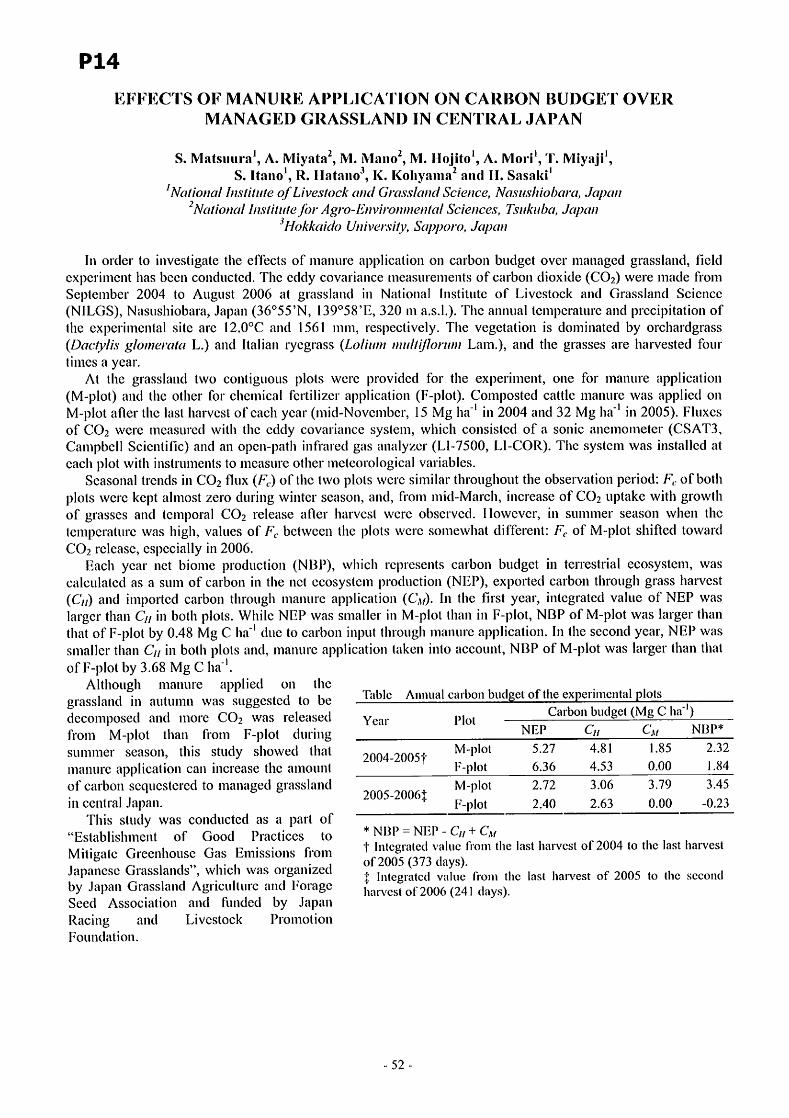
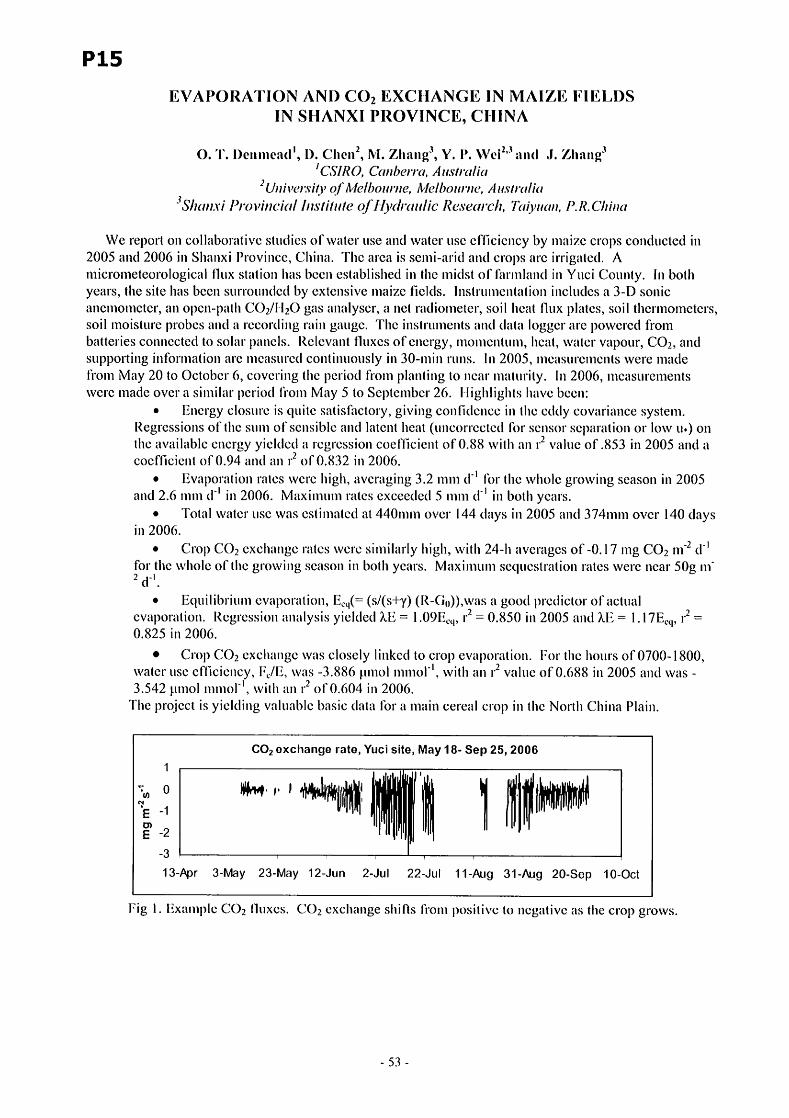
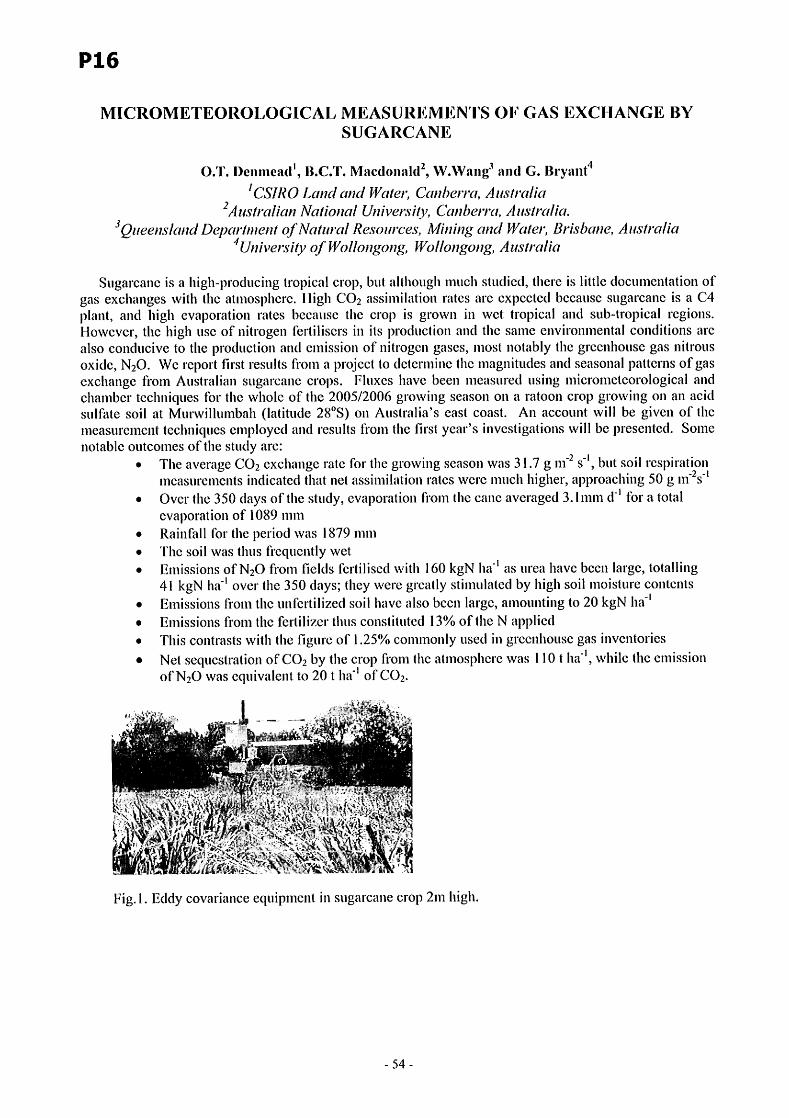
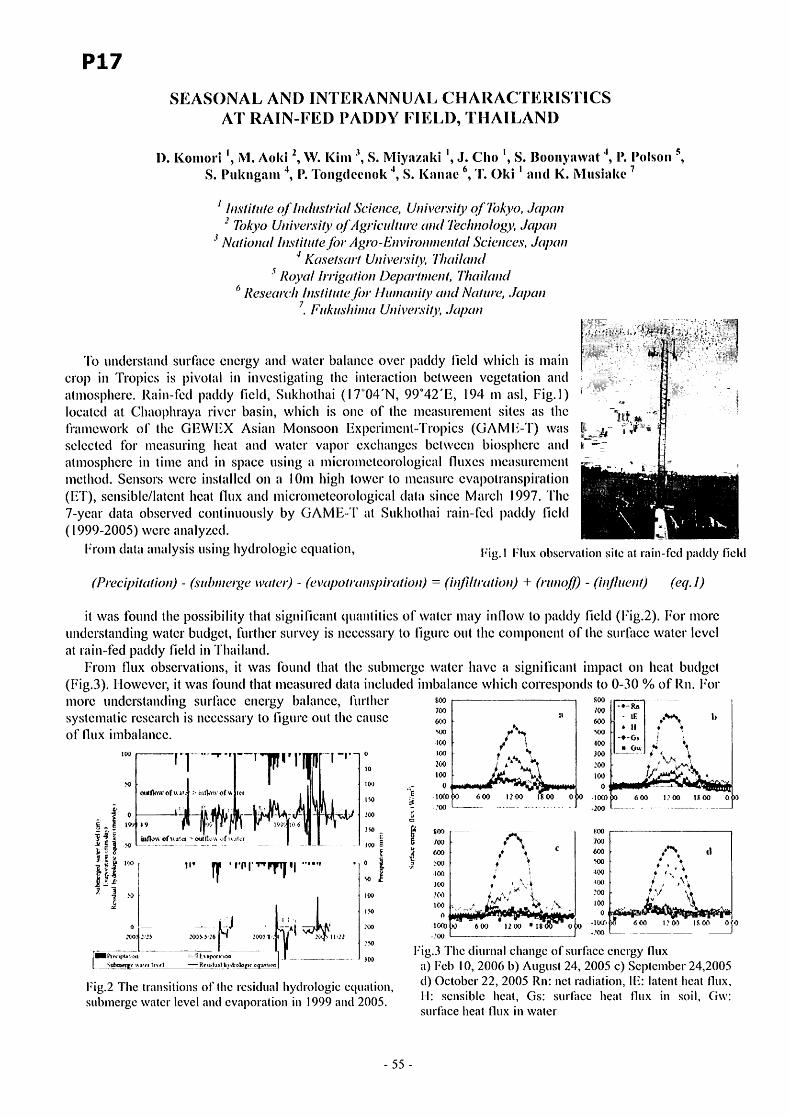
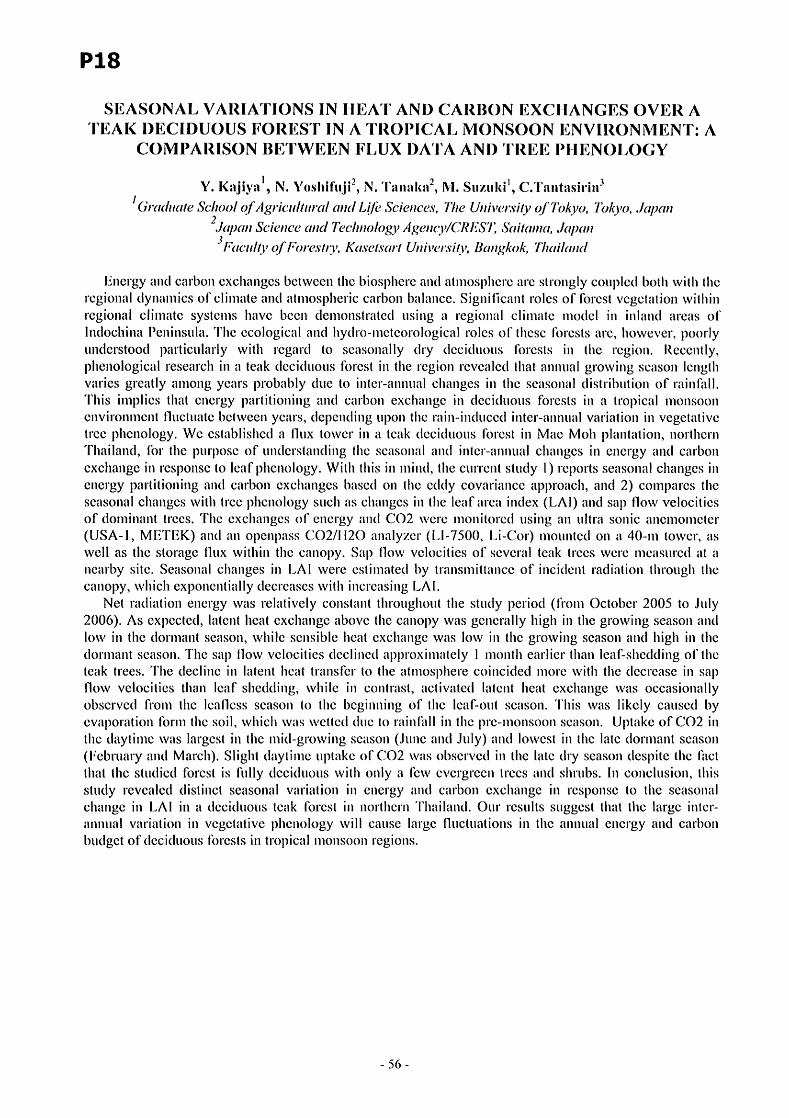
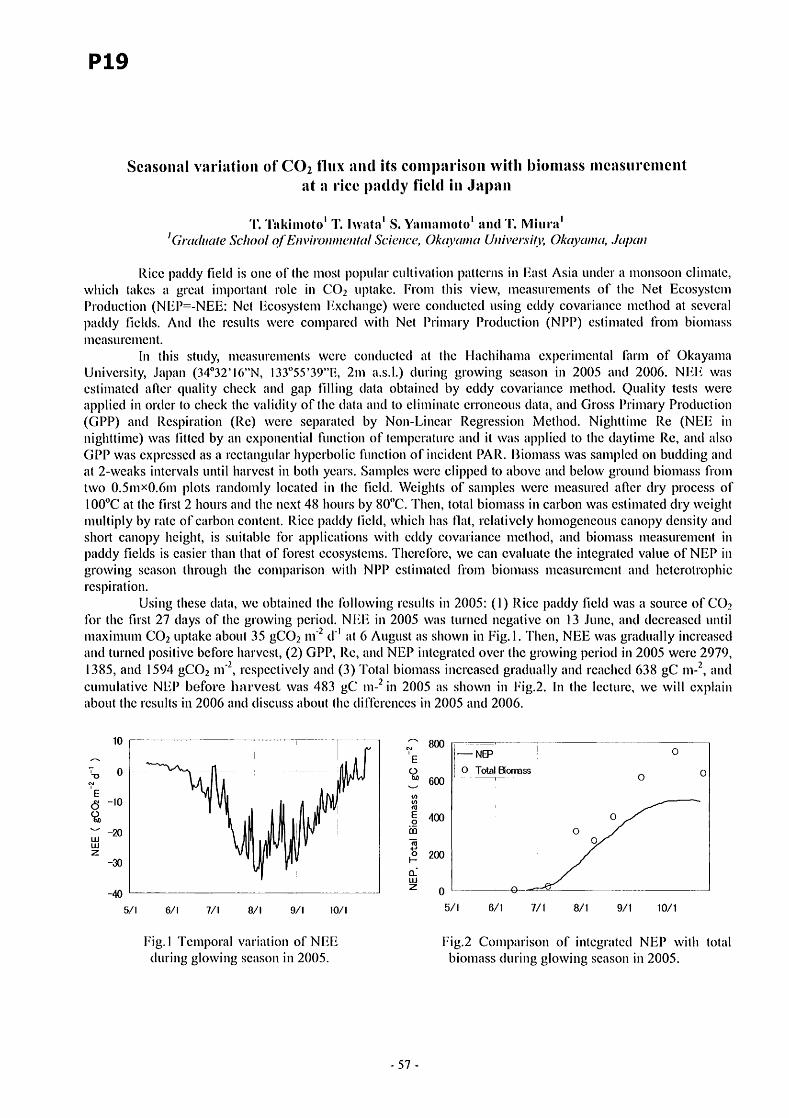
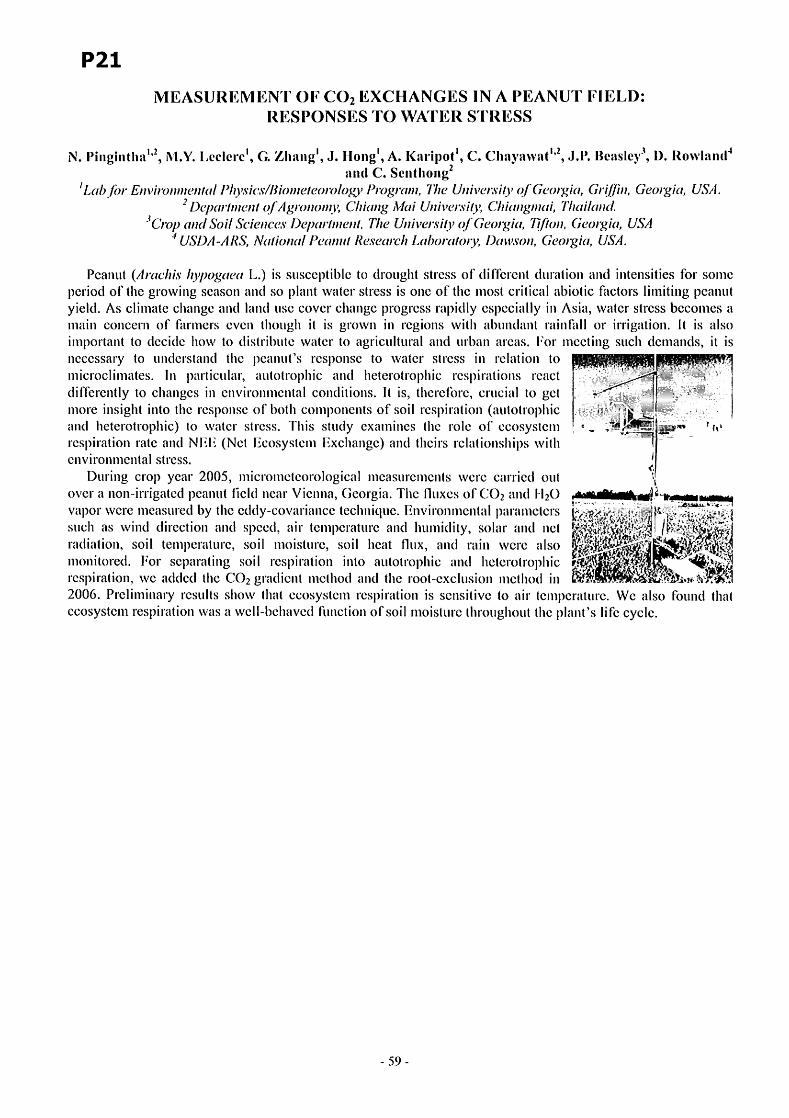
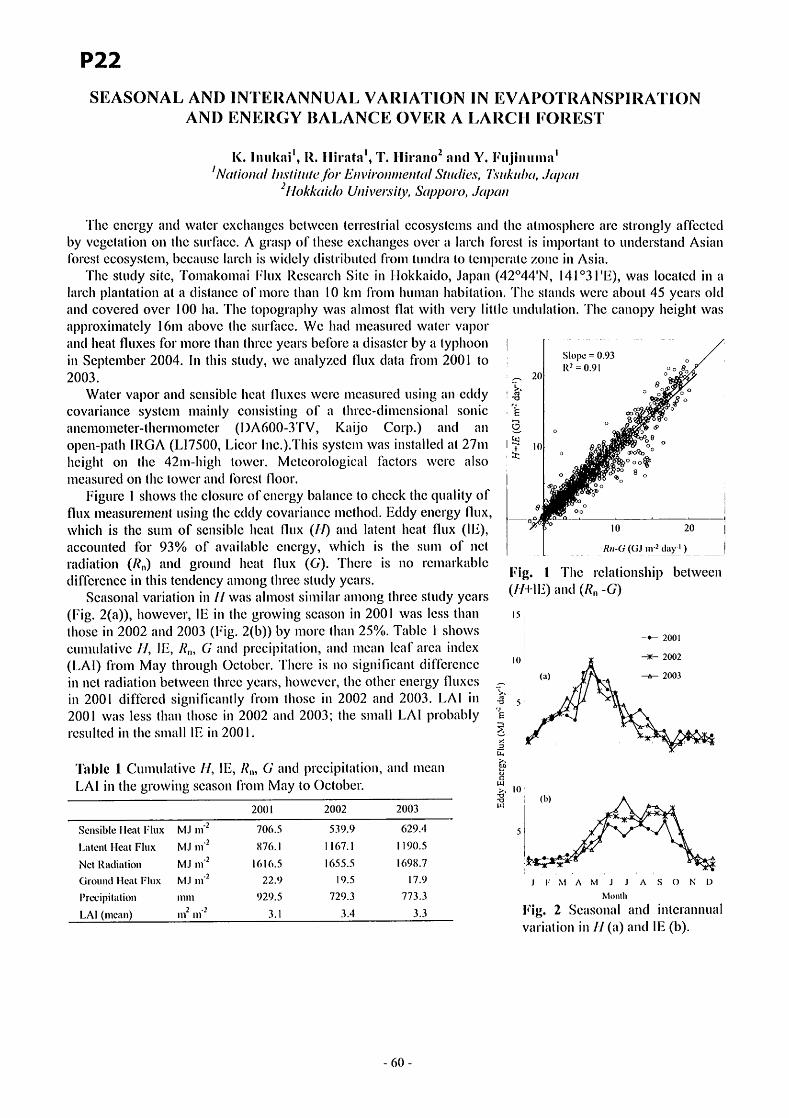
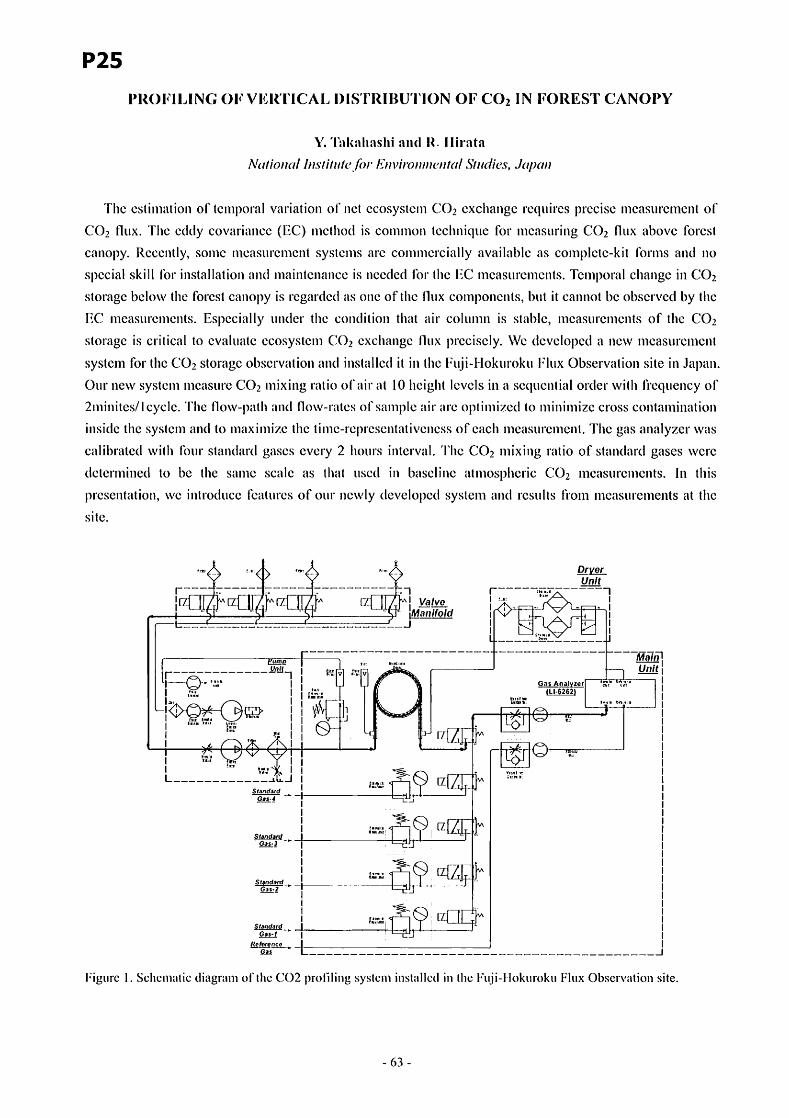
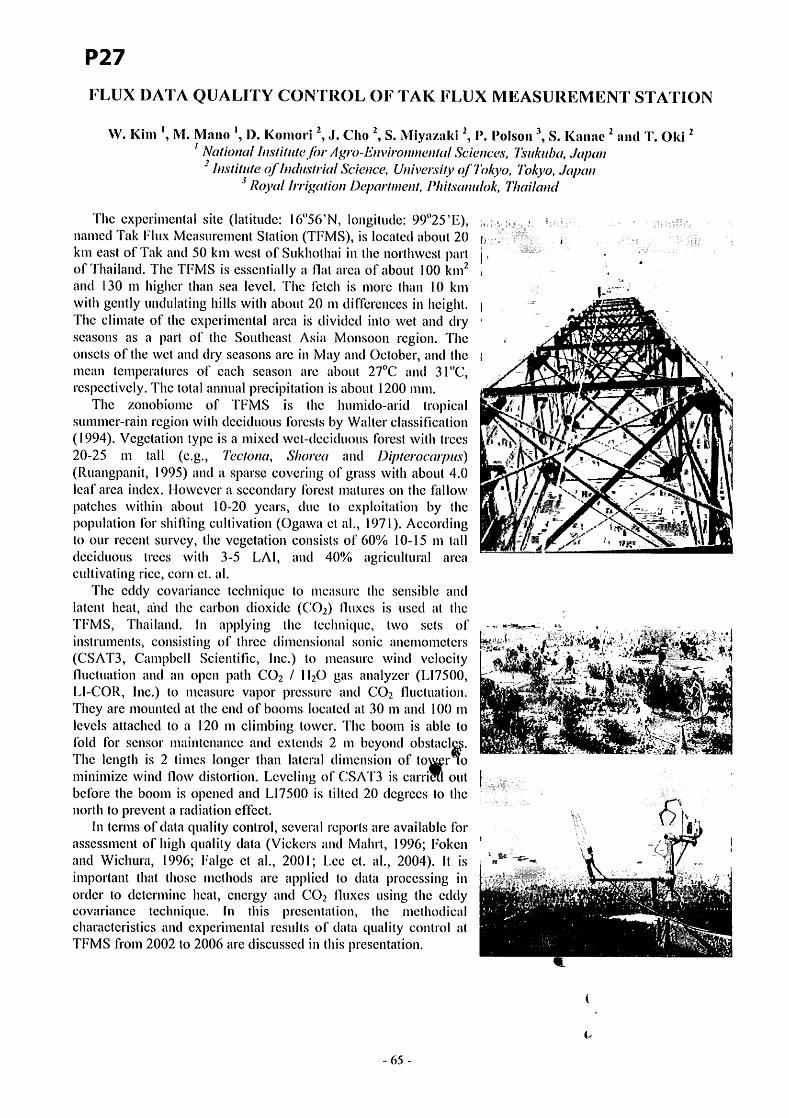
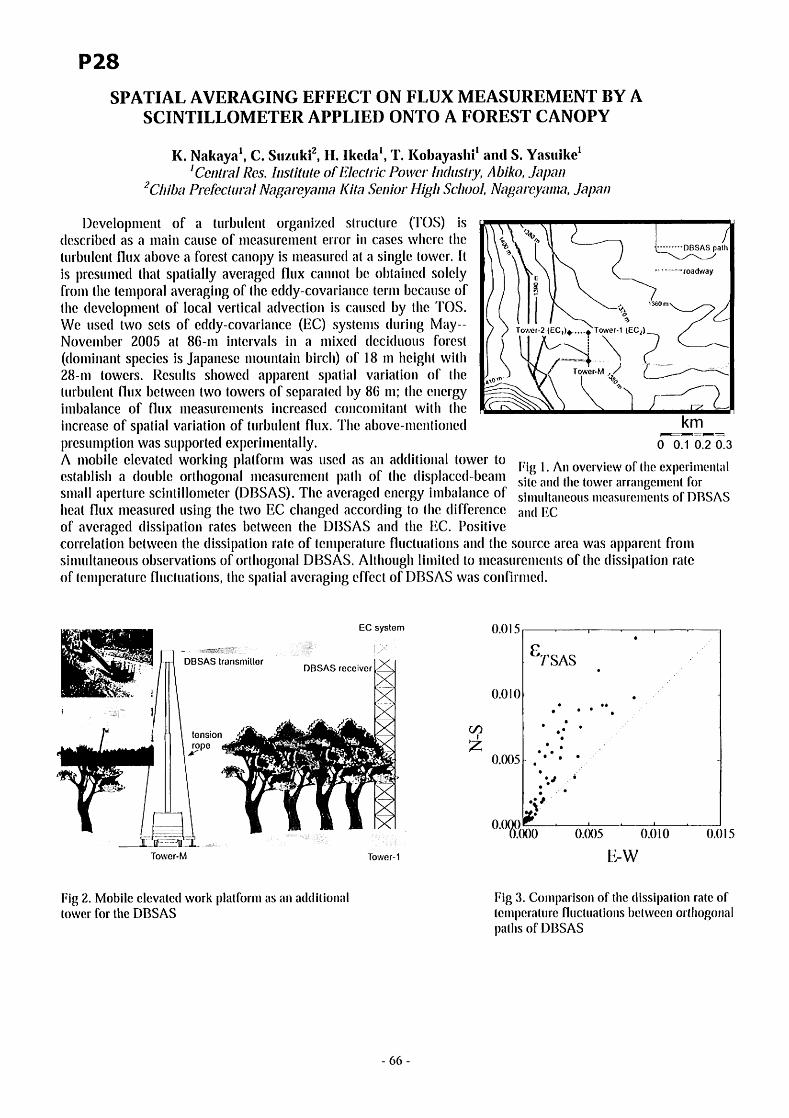
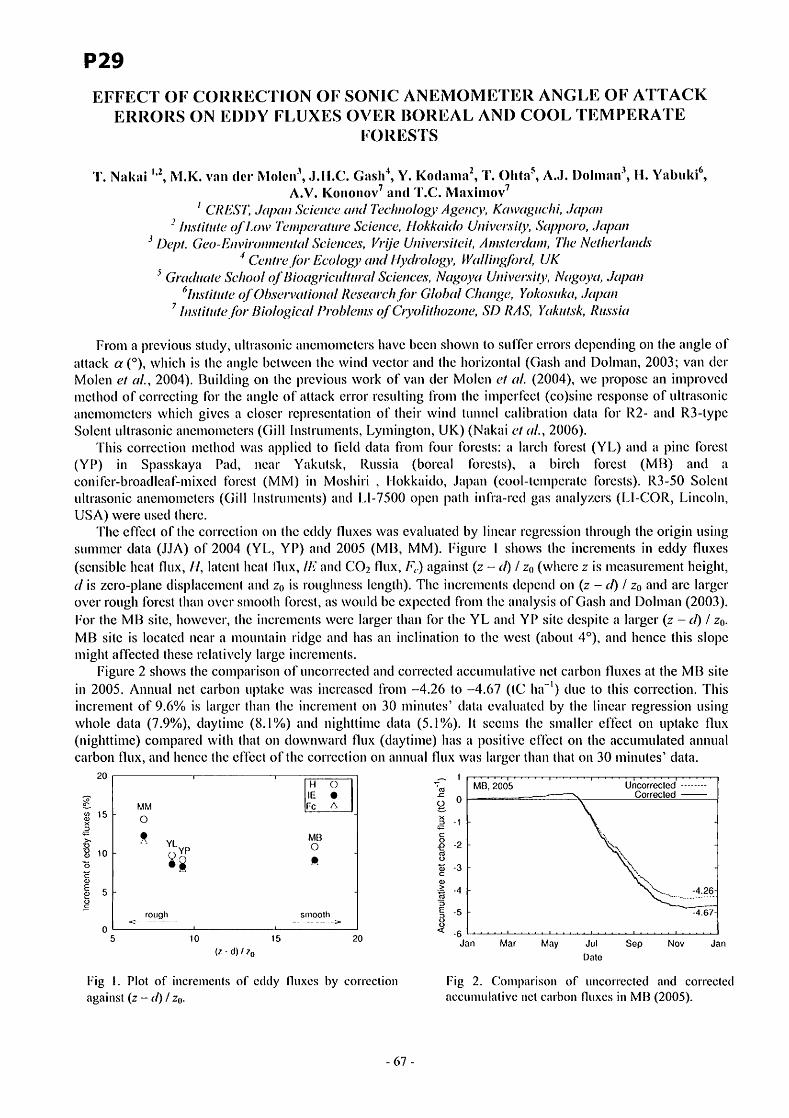
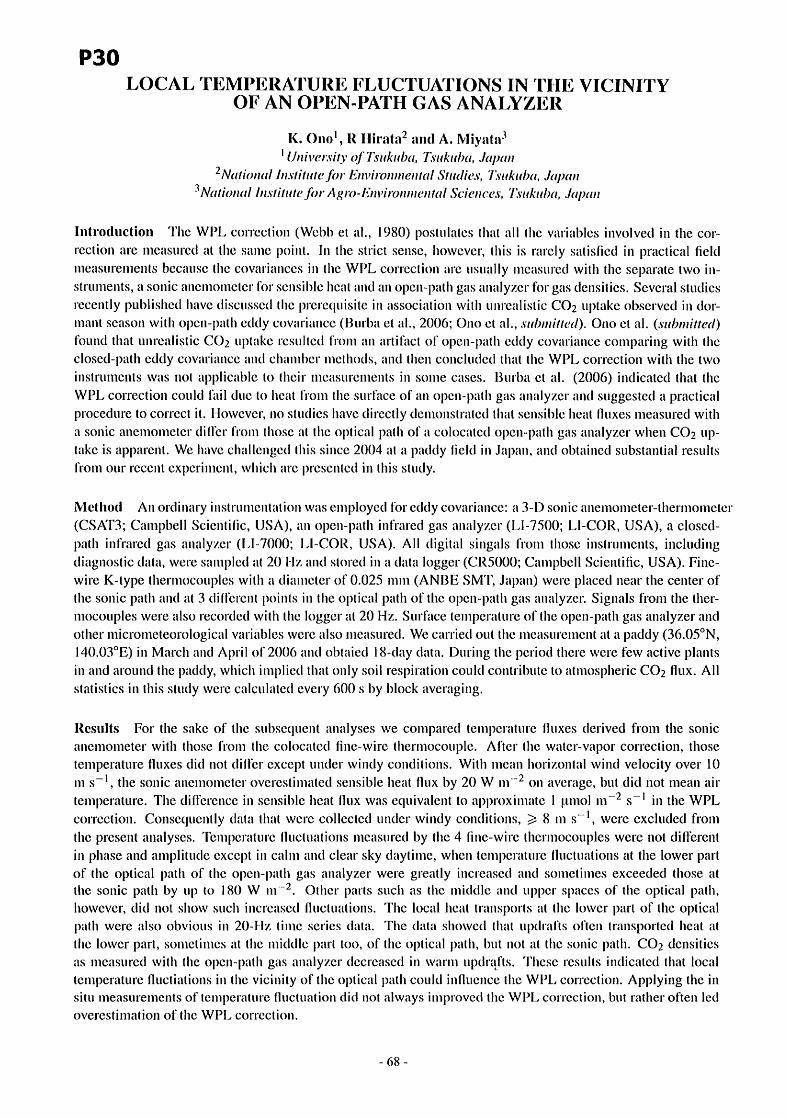
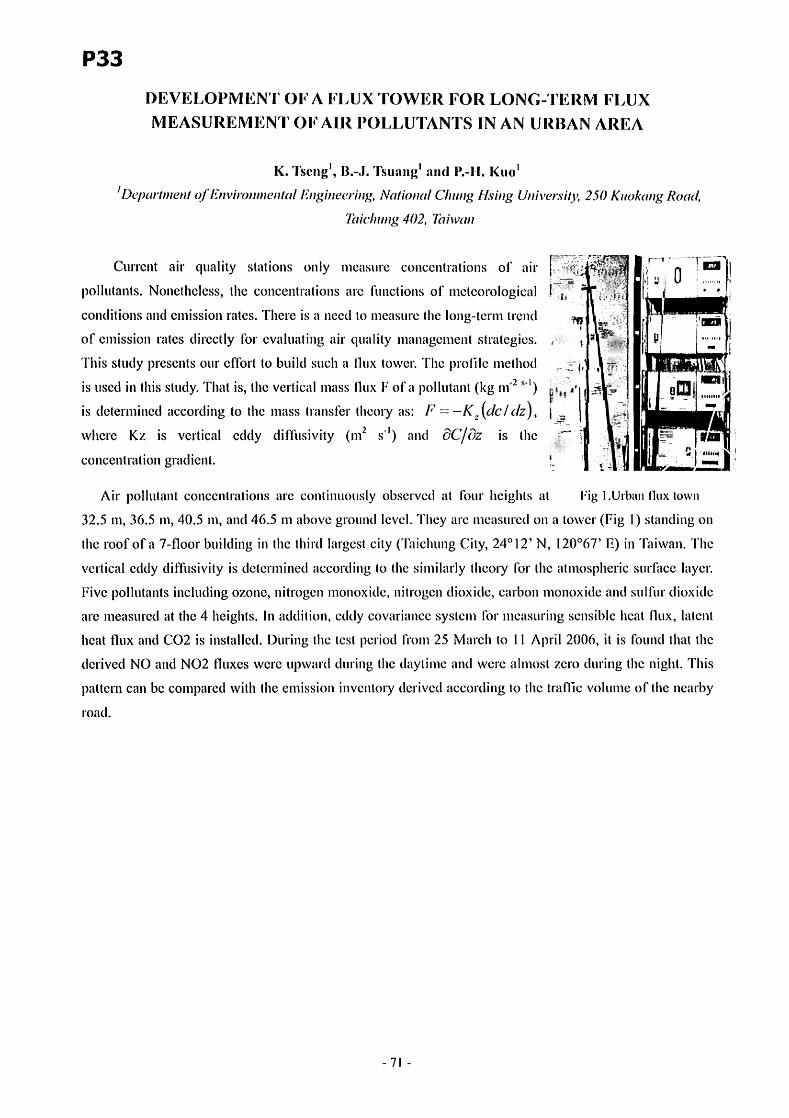
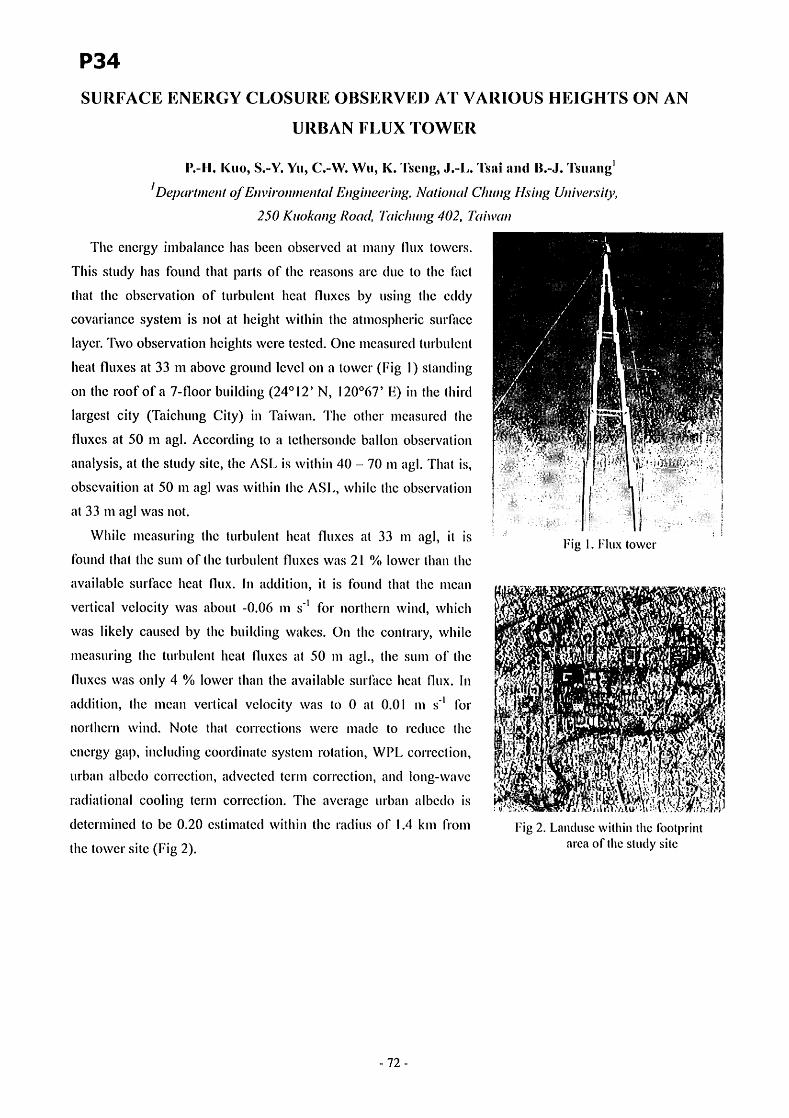
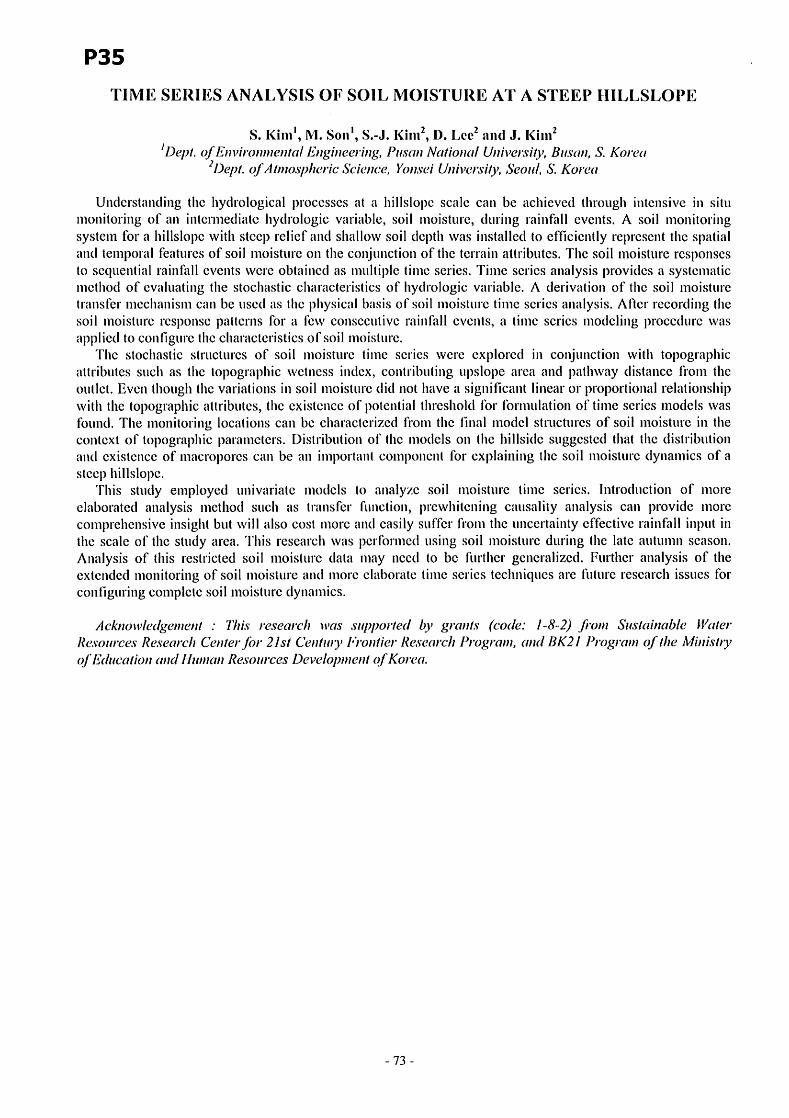
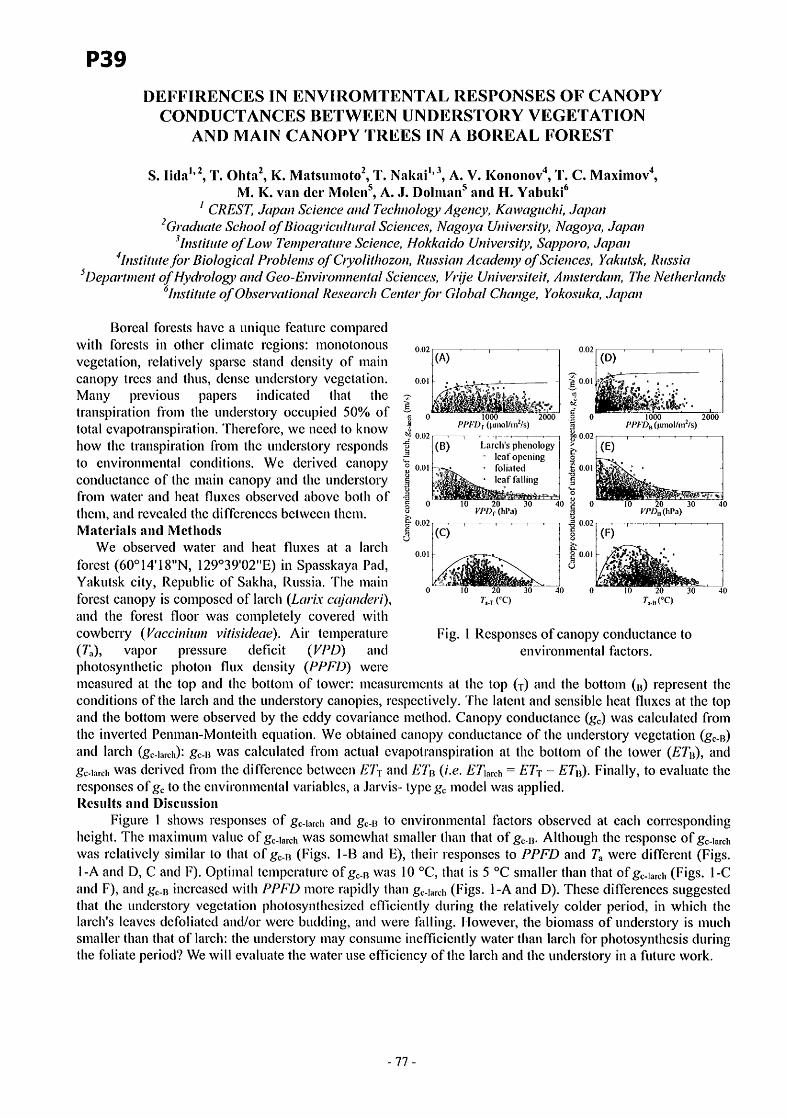
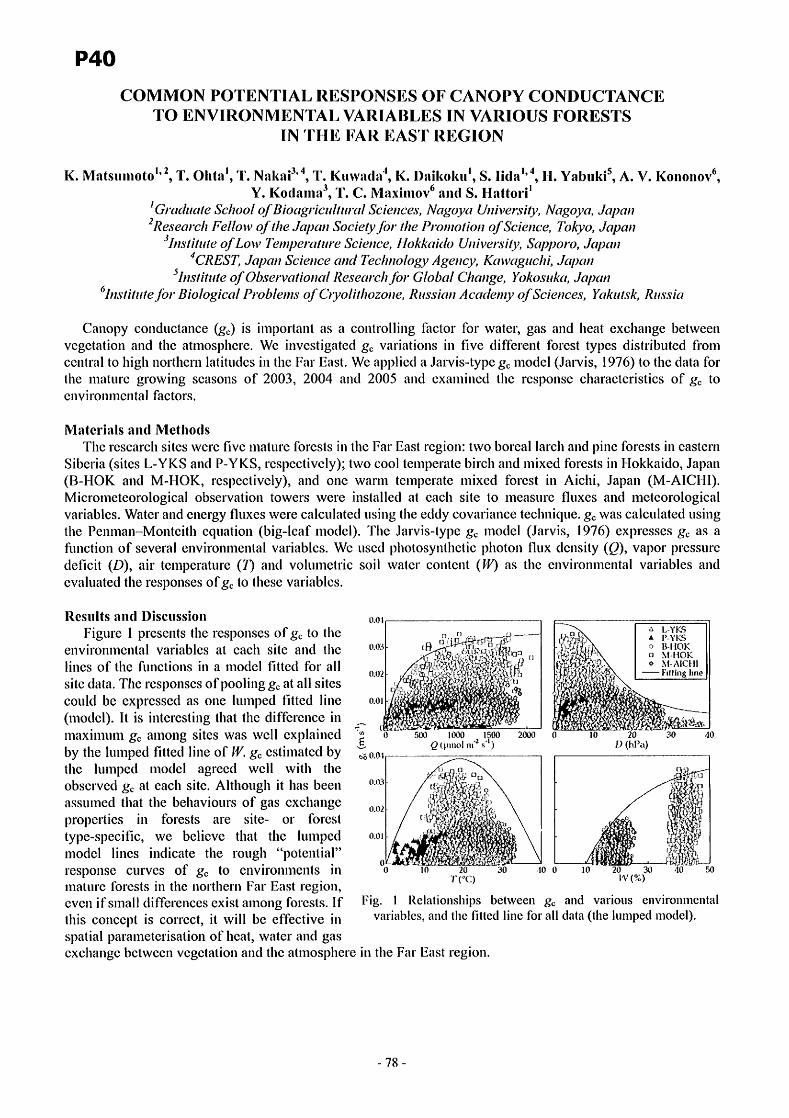
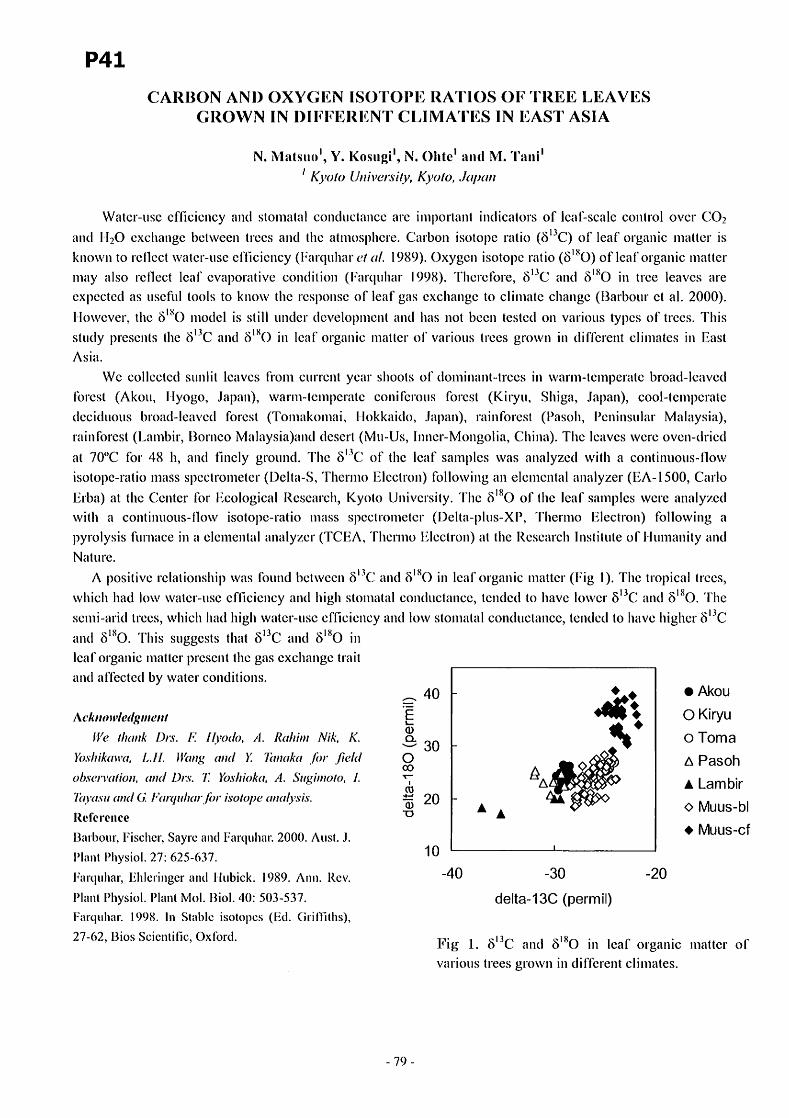
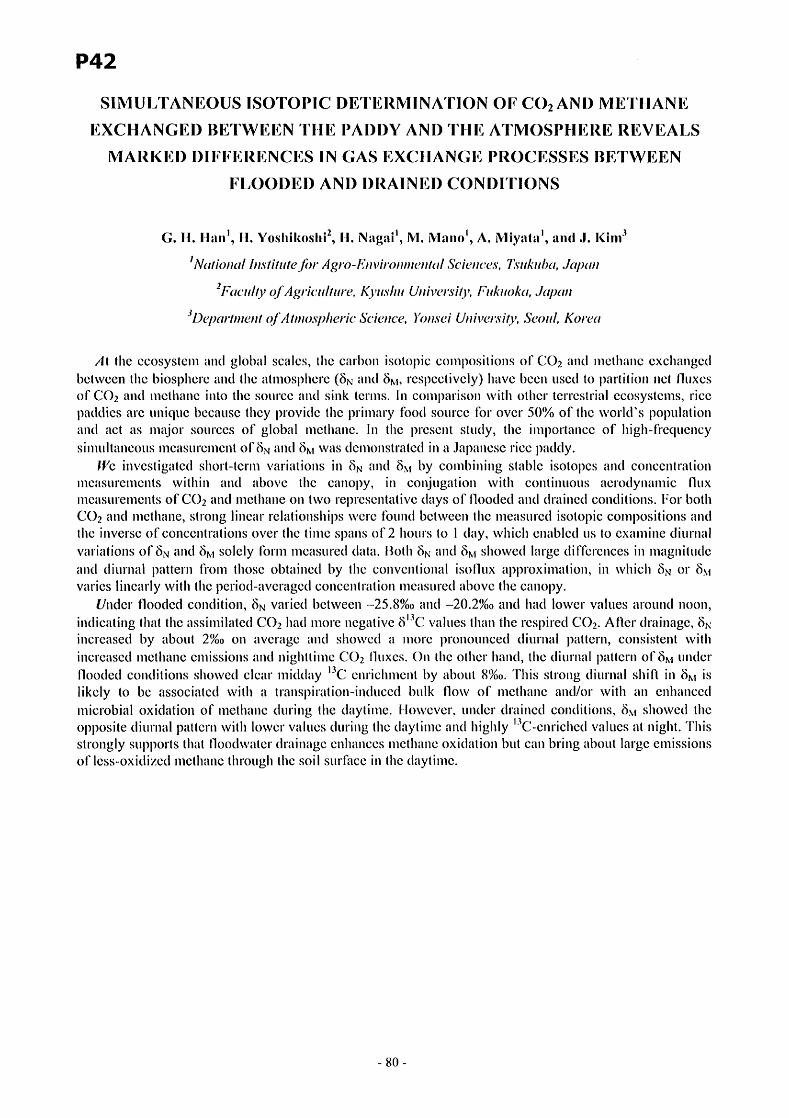
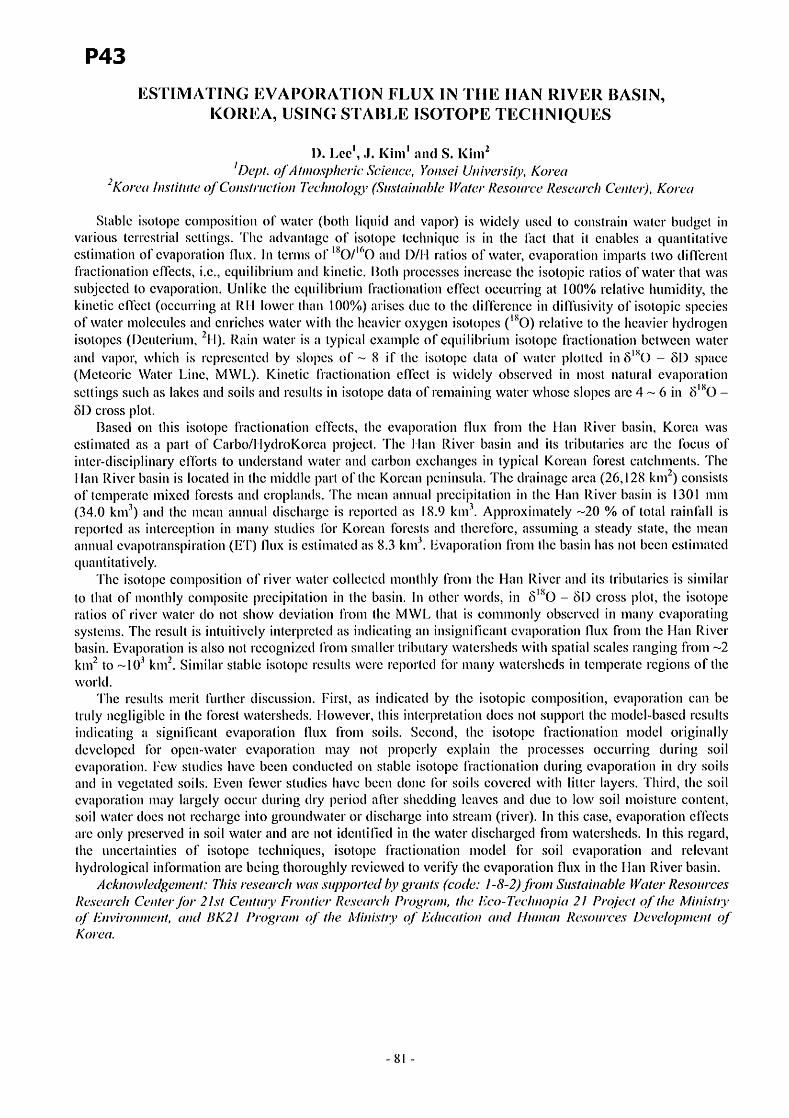
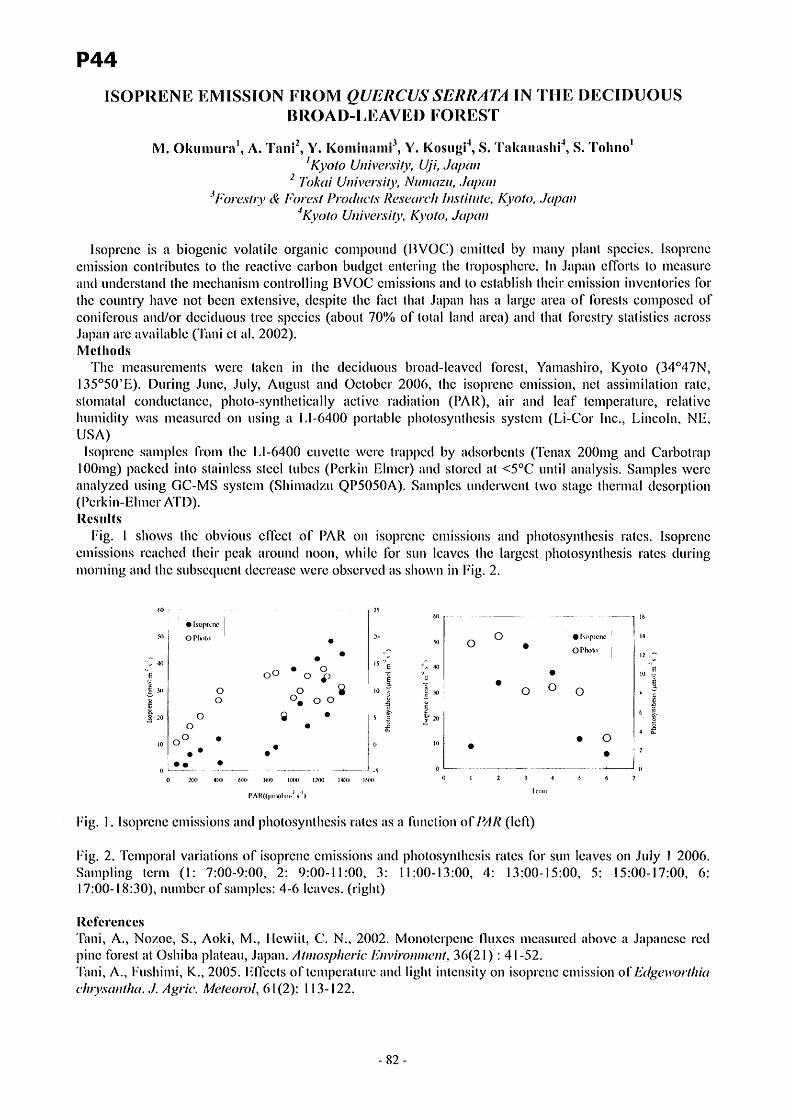
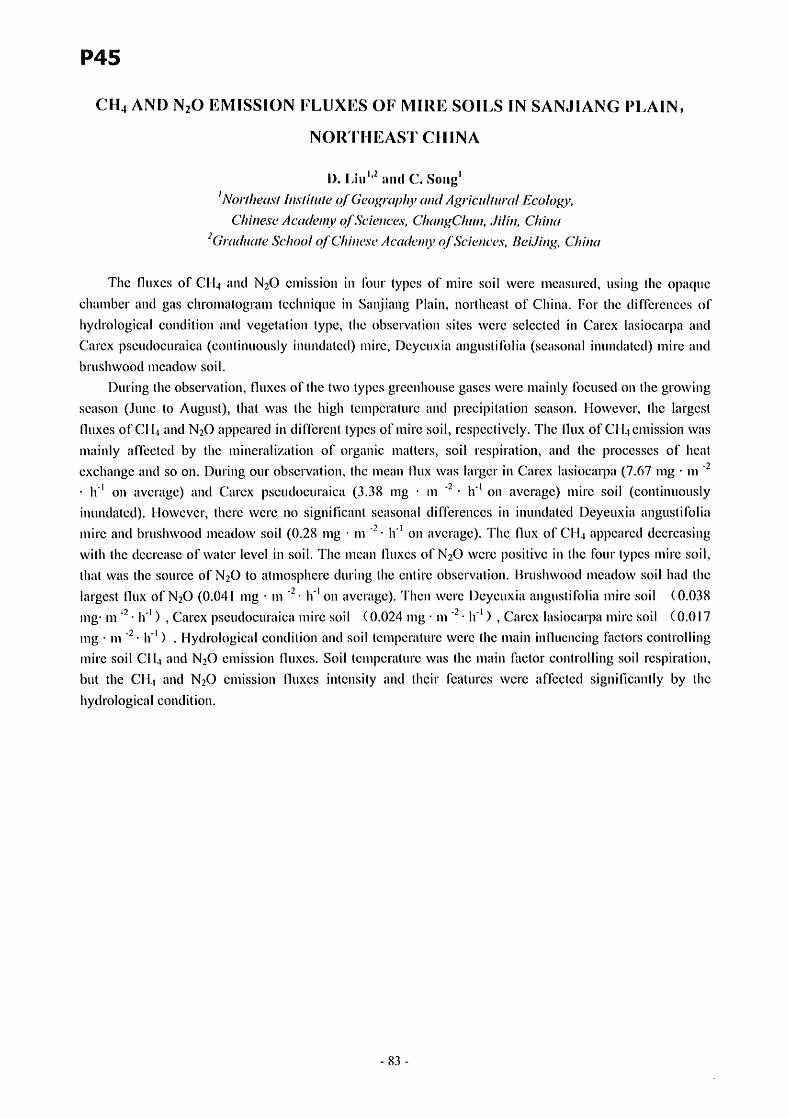
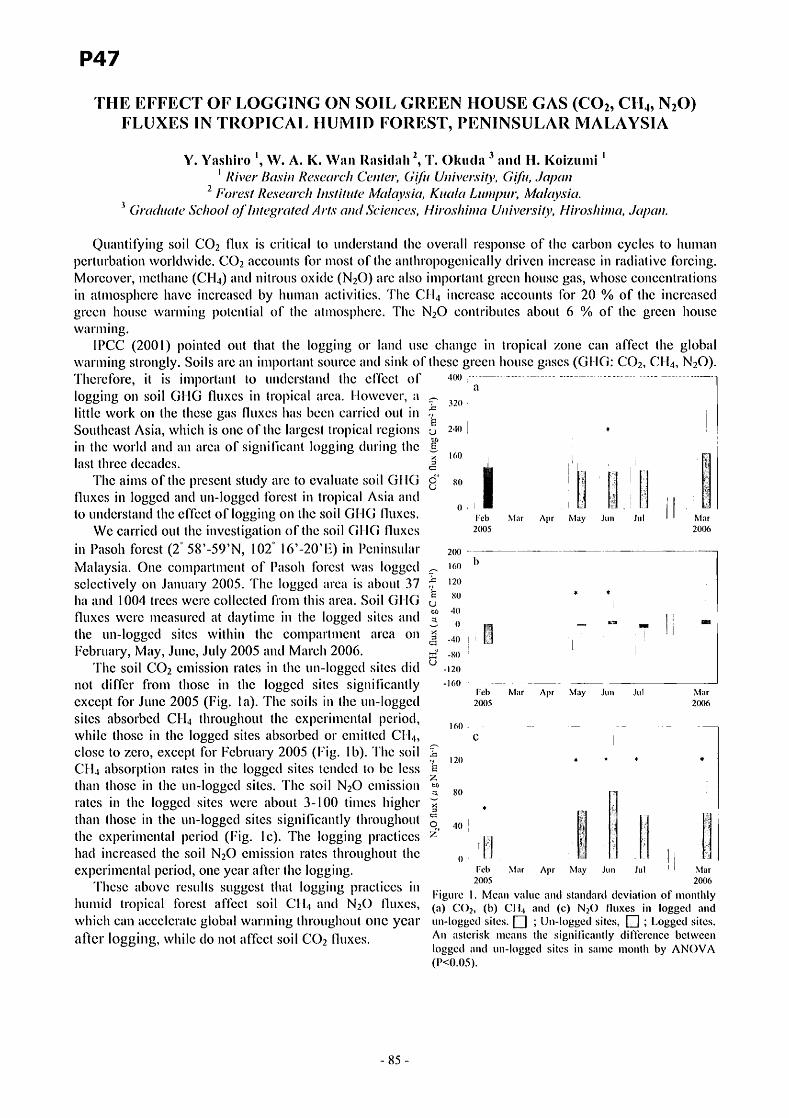
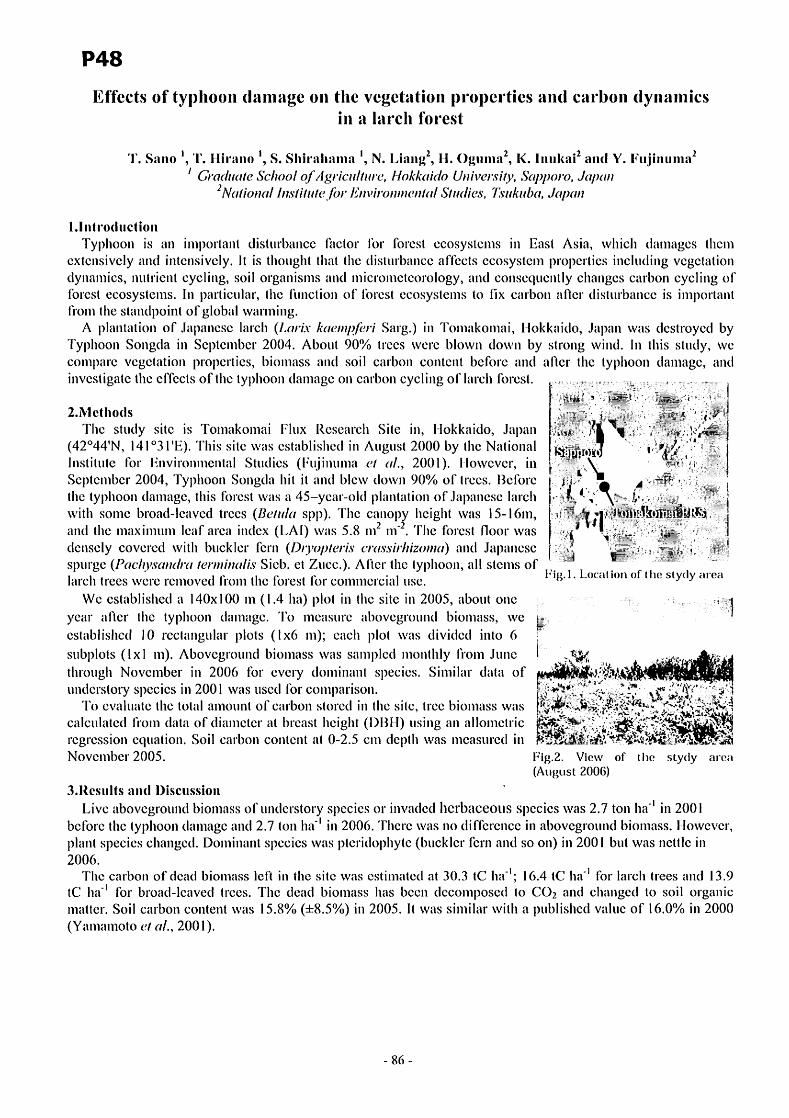
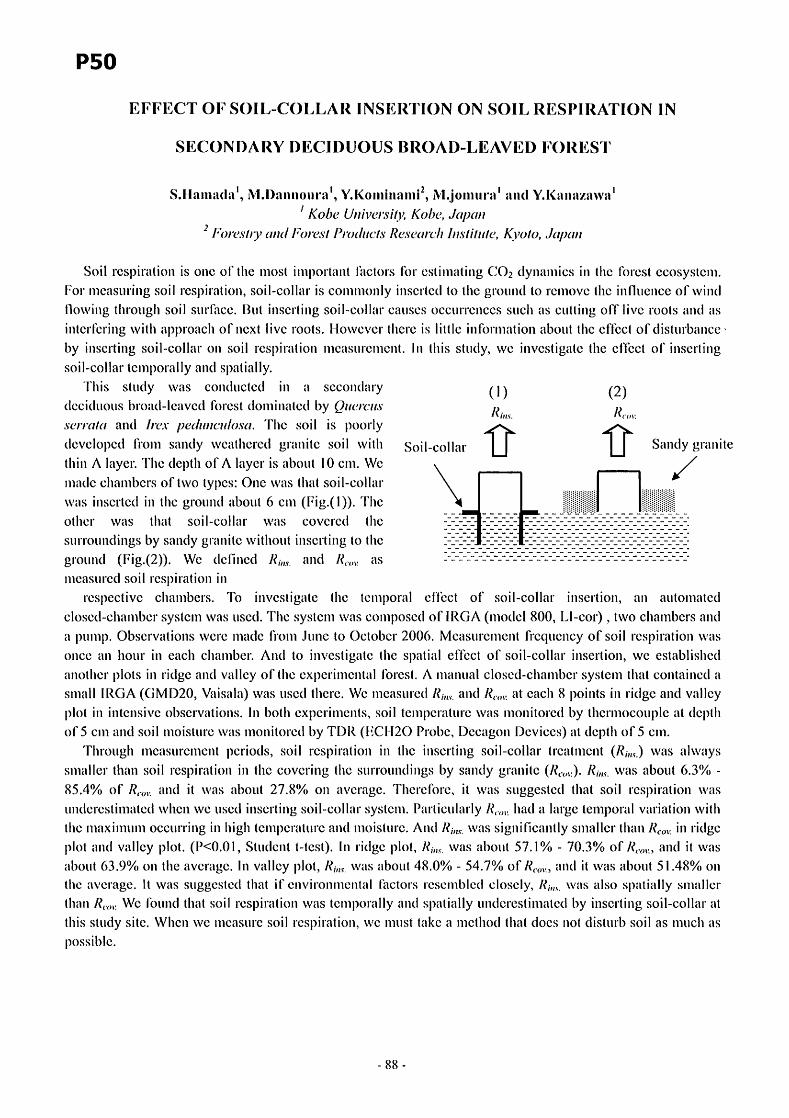
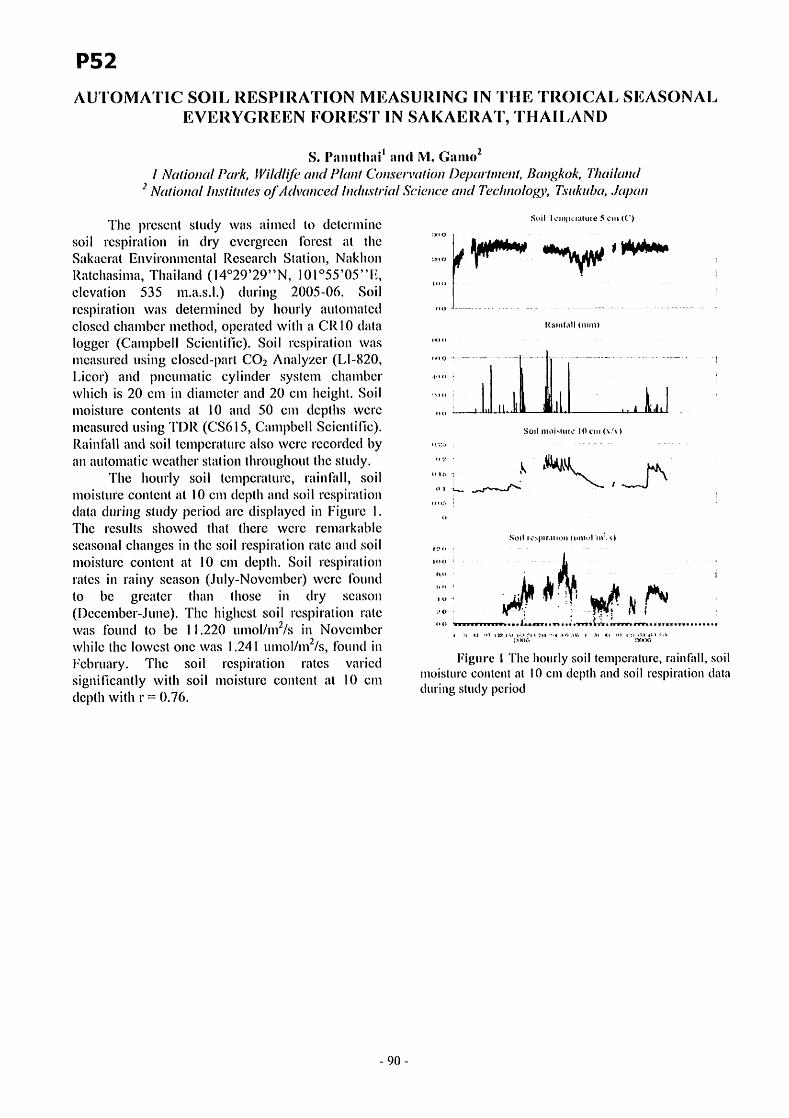
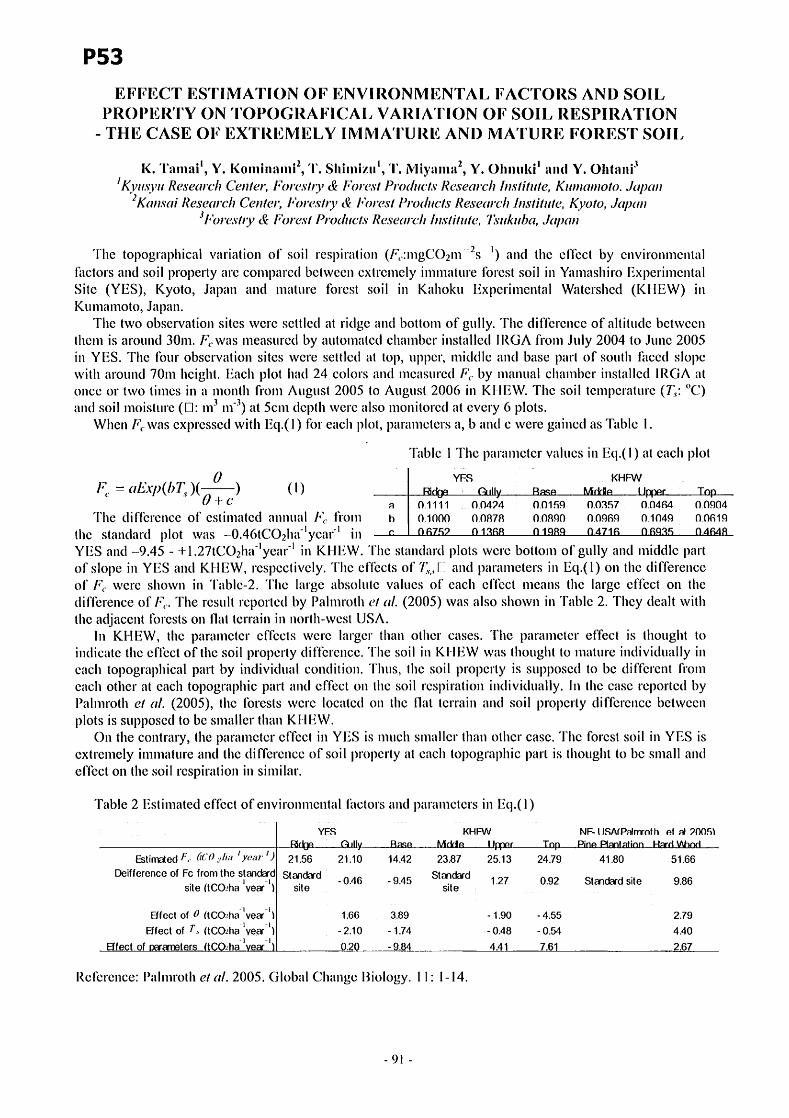
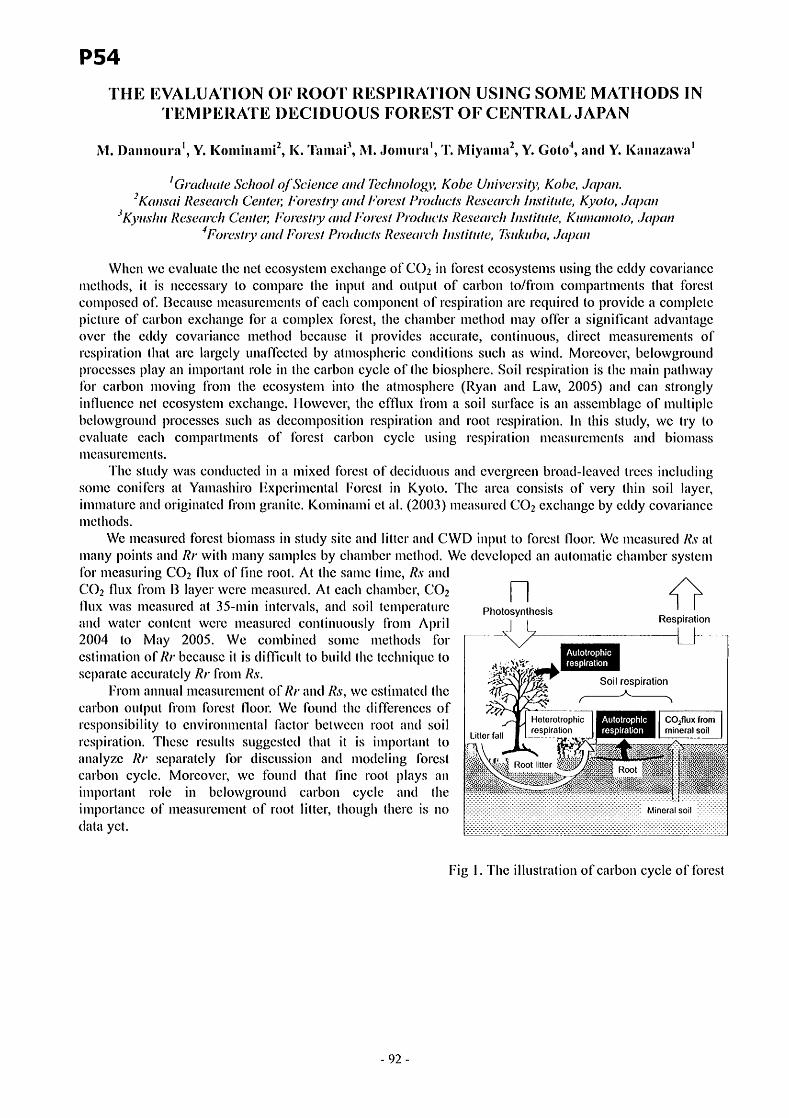
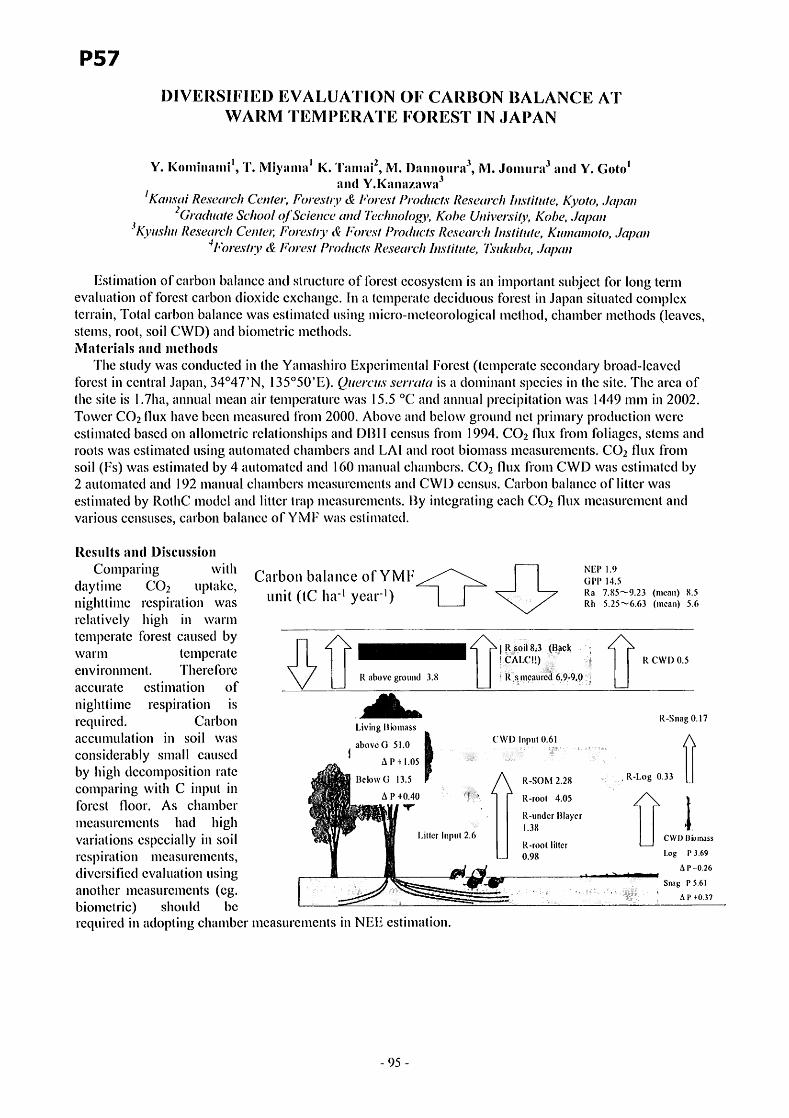
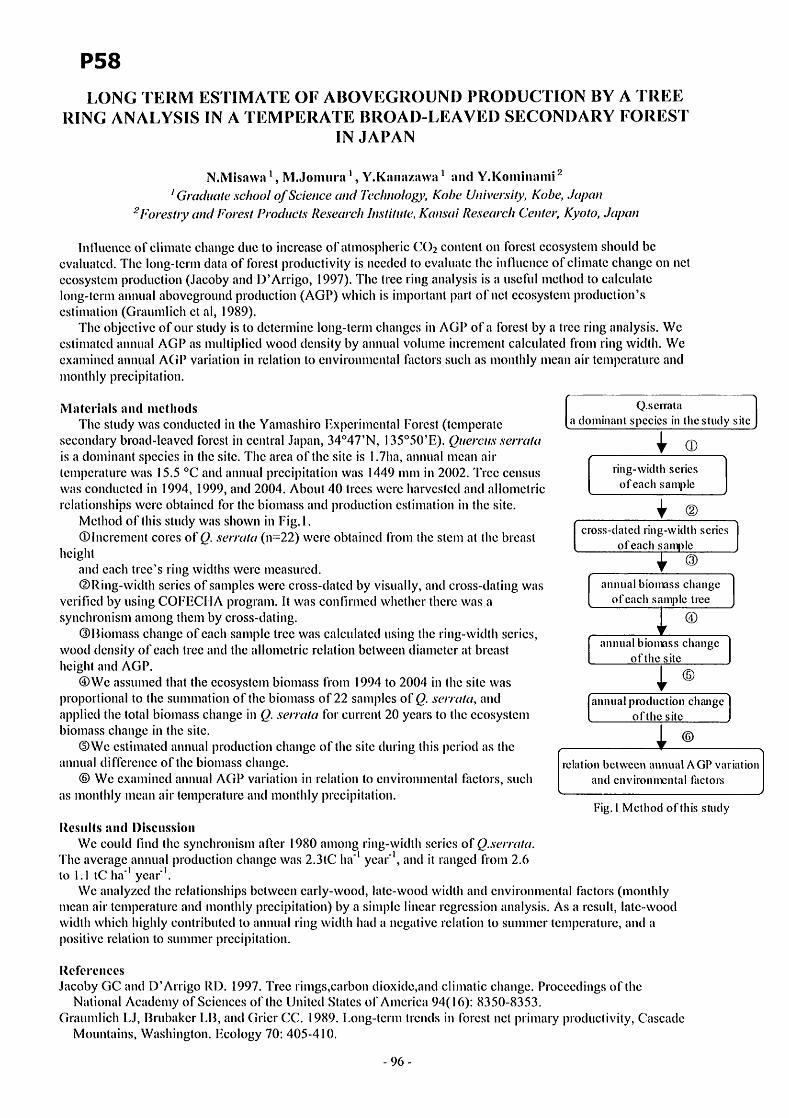
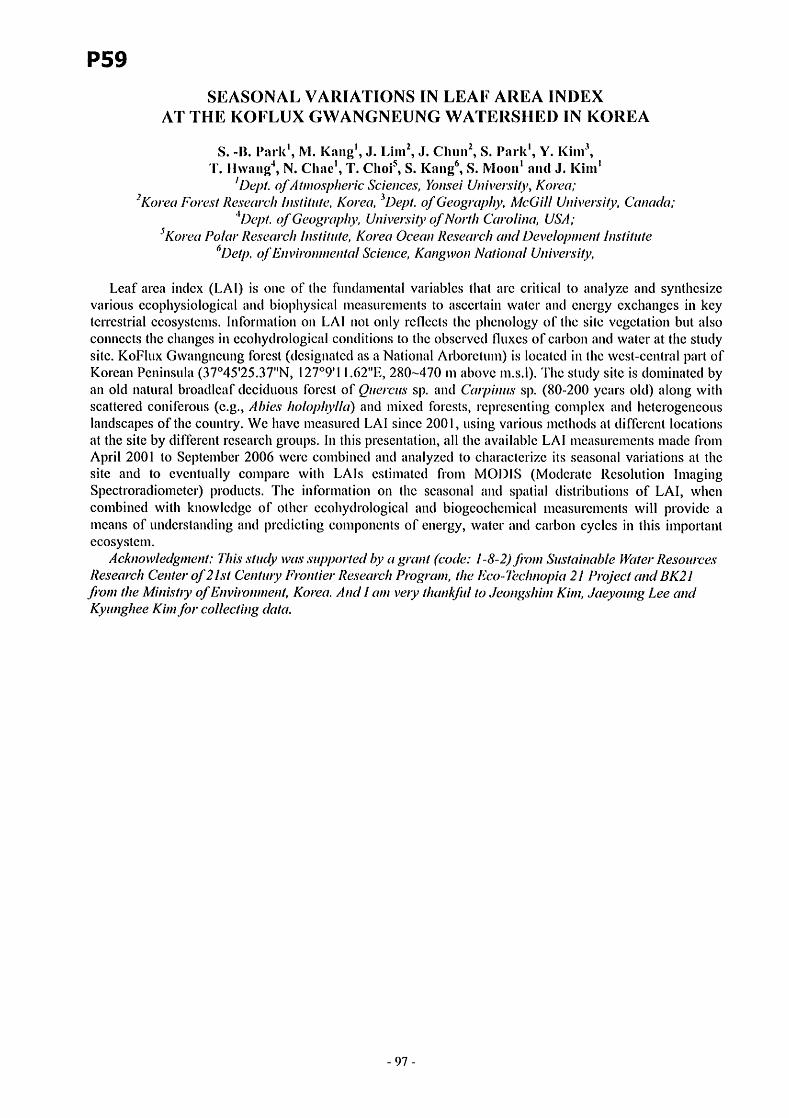
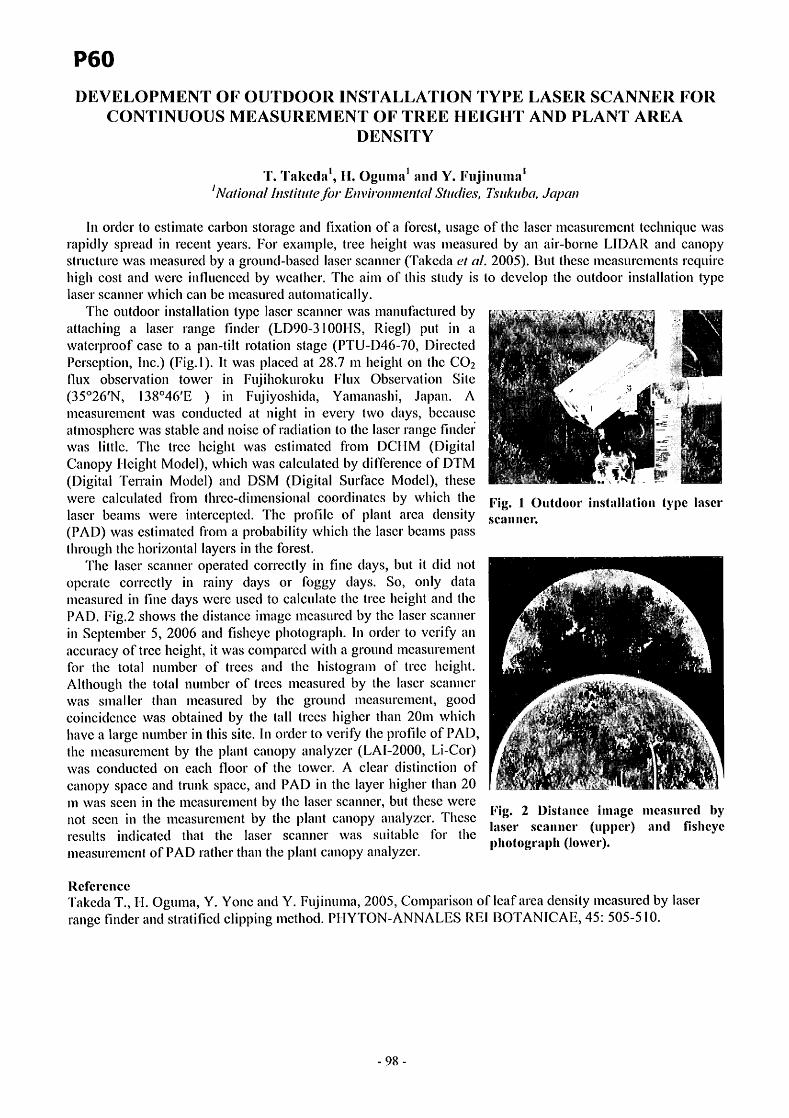
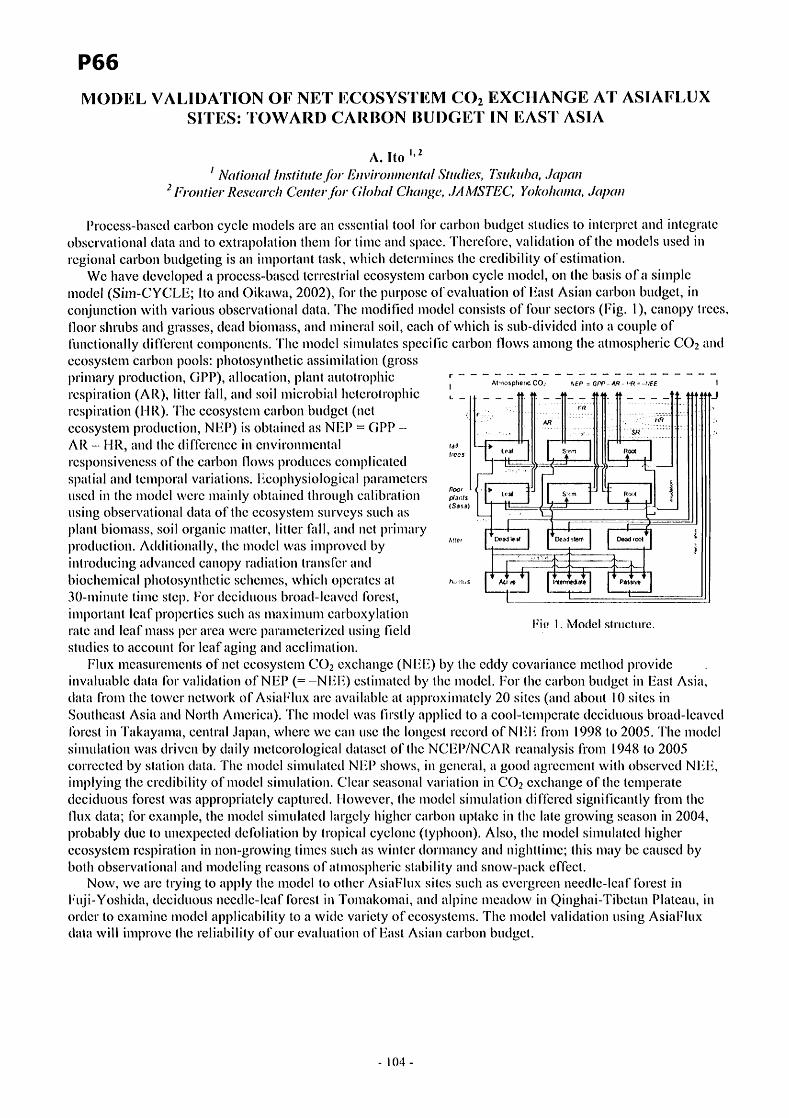
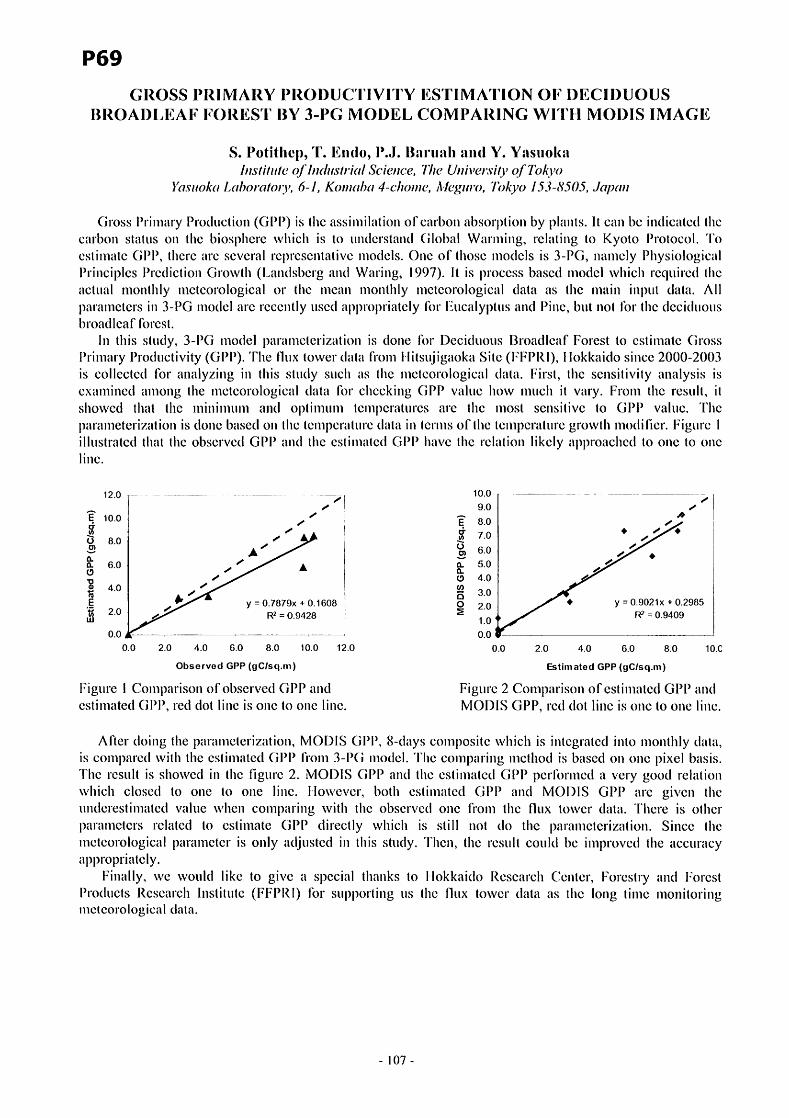
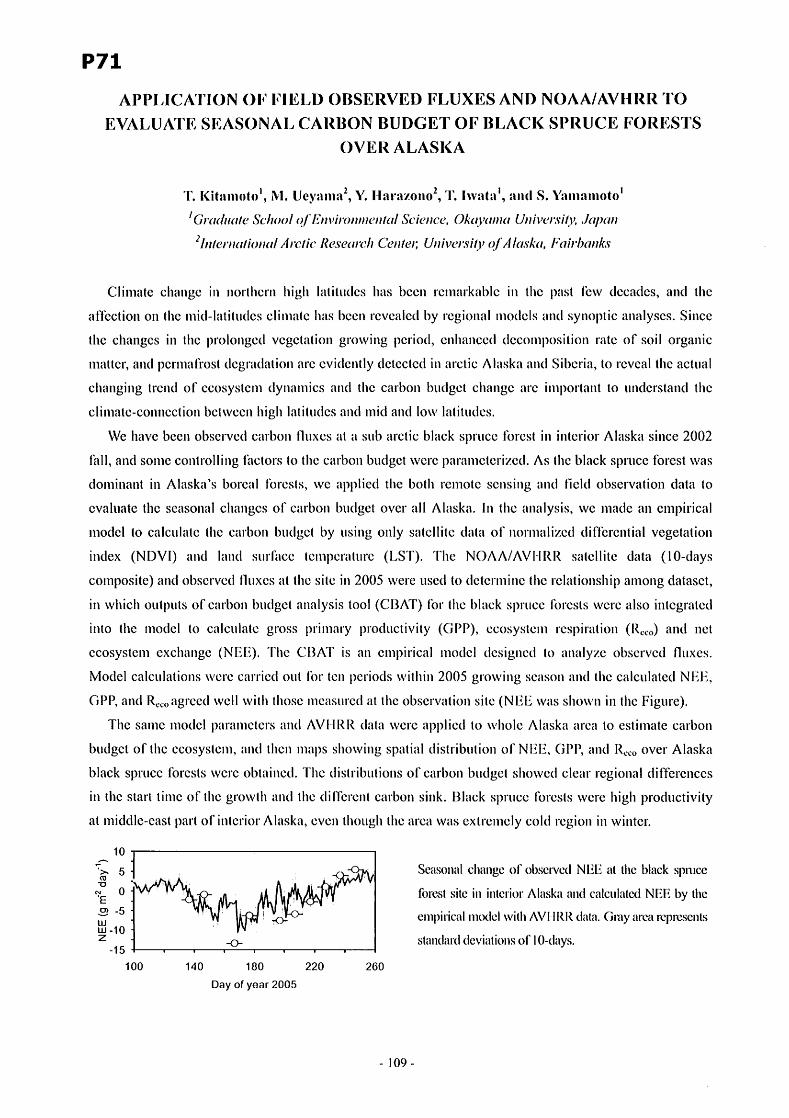
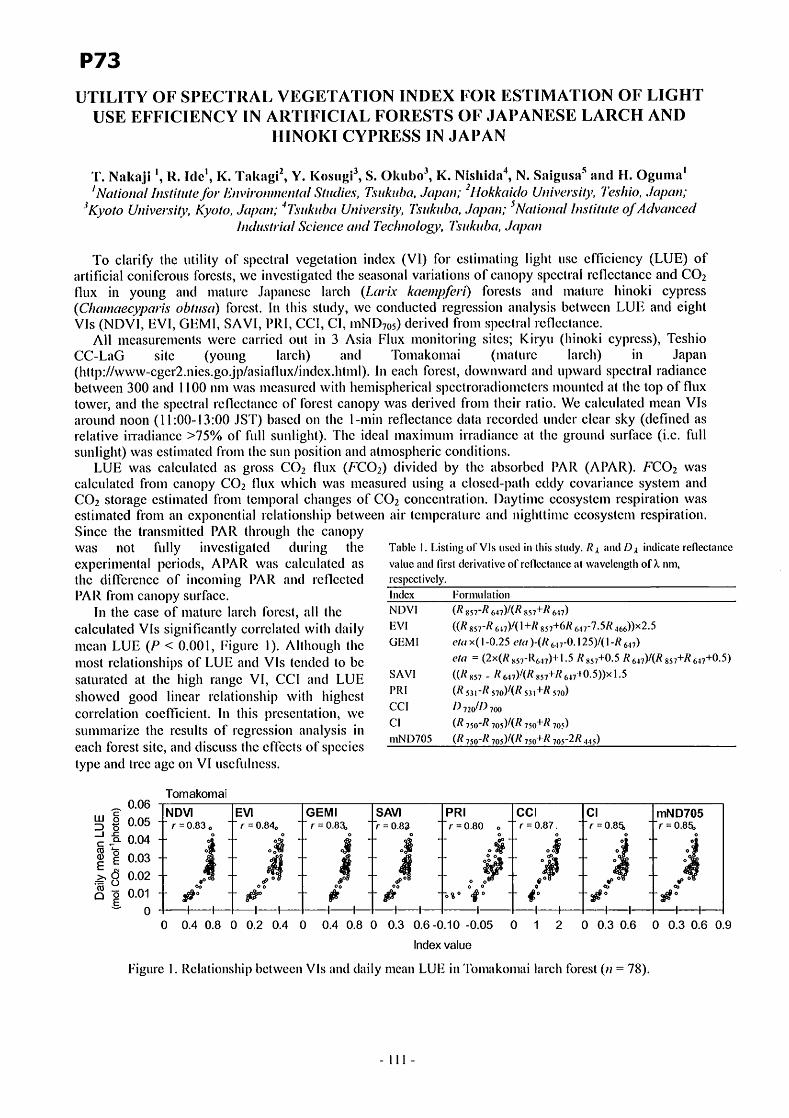

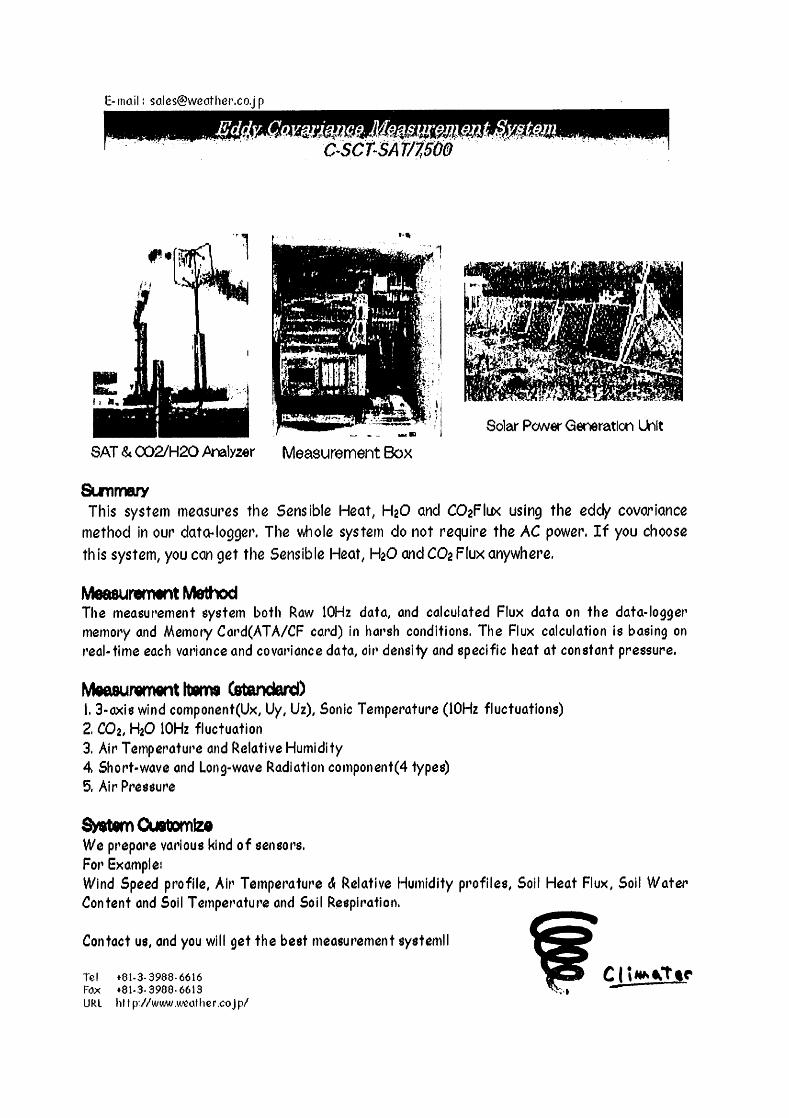
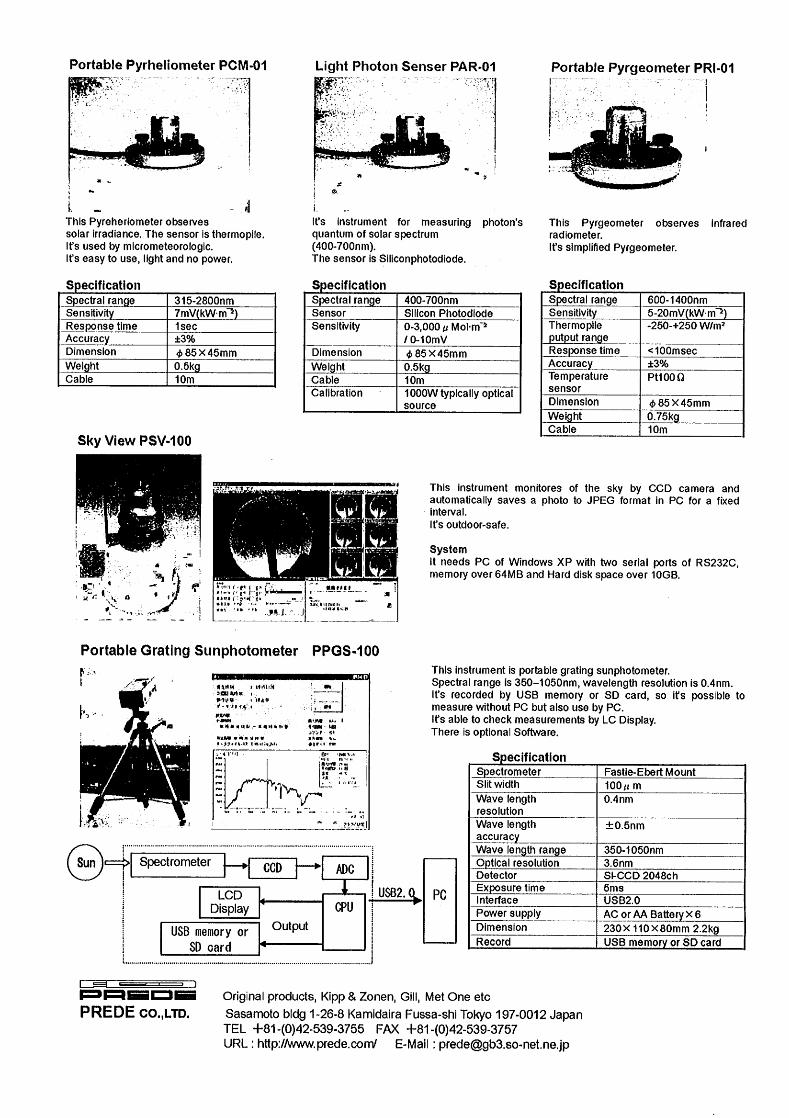
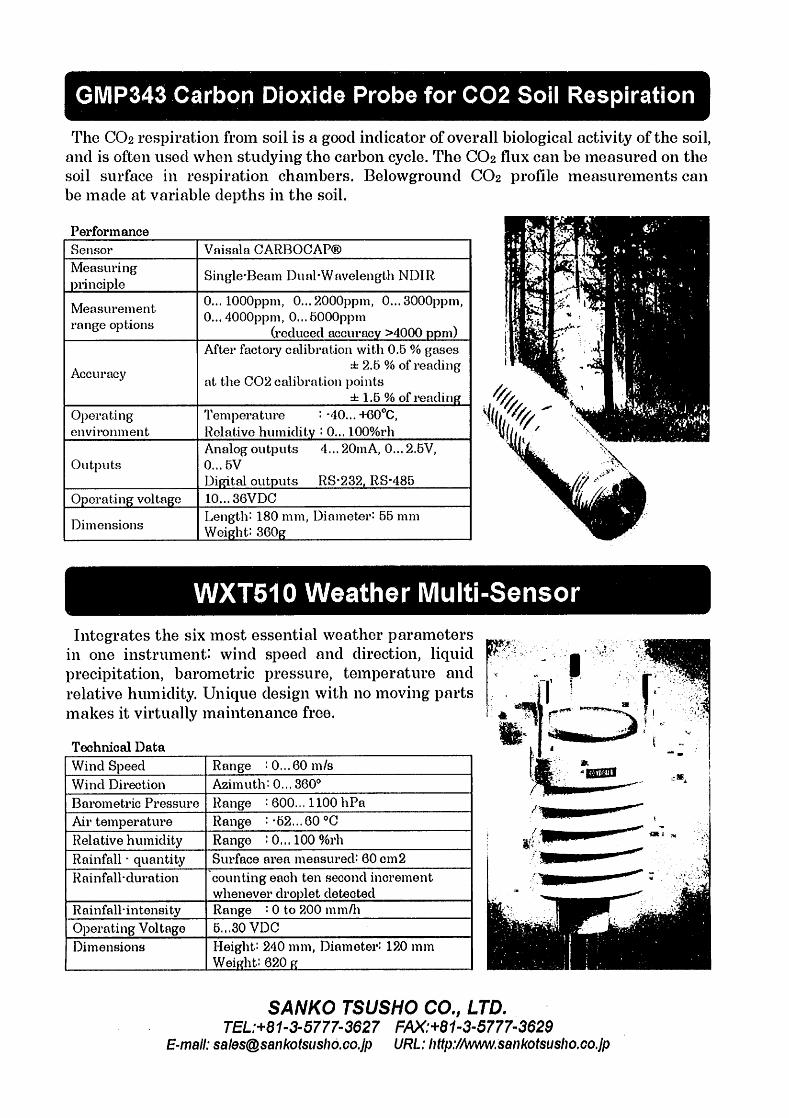
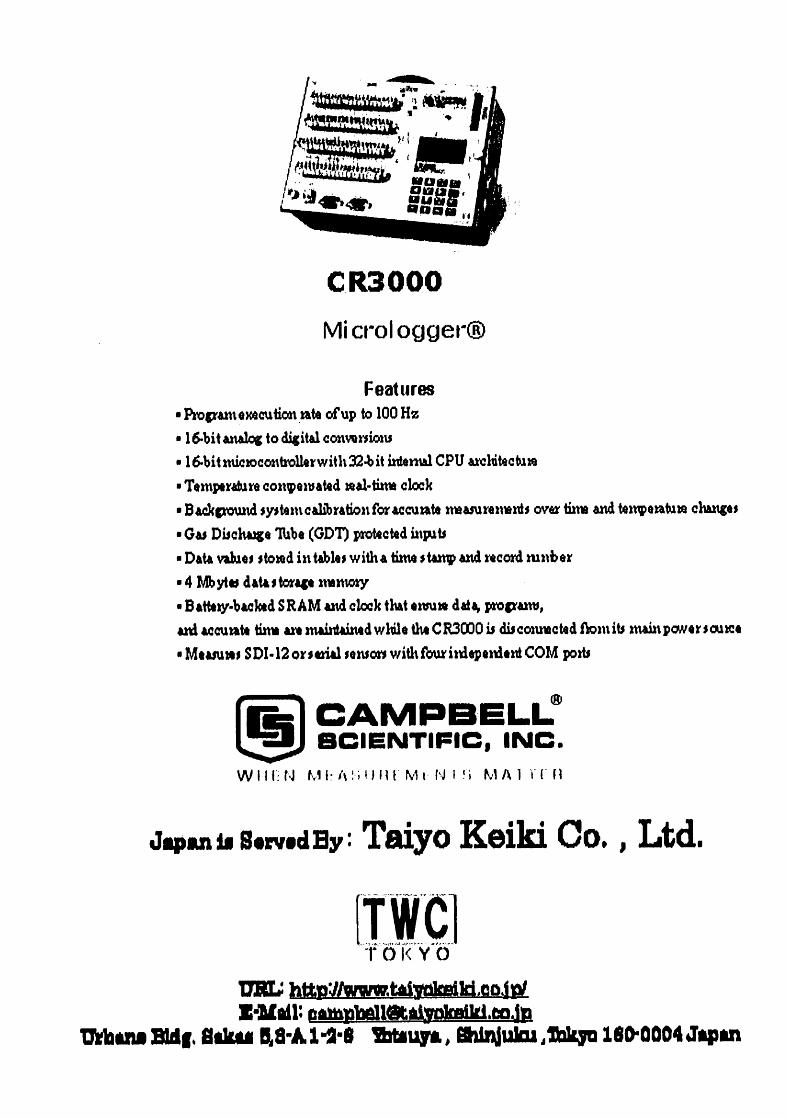

Related Documents