Standard Operating Procedures Water Quality Monitoring Program Revision 8.0 August 2009

Welcome message from author
This document is posted to help you gain knowledge. Please leave a comment to let me know what you think about it! Share it to your friends and learn new things together.
Transcript
Standard Operating Procedures
Water Quality Monitoring Program Revision 8.0 August 2009

STANDARD OPERATING PROCEDURES FOR THE
COLLECTION OF WATER QUALITY & BIOLOGICAL SAMPLES
Resource Data & Restoration Department Water Quality Monitoring Program
Southwest Florida Water Management District Revision 8.0 August 2009

TABLE OF CONTENTS
STATEMENT OF INTENT ............................................................................................... 1 INTRODUCTION ............................................................................................................. 1 WATER QUALITY MONITORING PROJECTS ............................................................... 1 DATA MANAGEMENT .................................................................................................... 3
Field Data ............................................................................................................. 3 Laboratory Data .................................................................................................... 3 Quality Assurance Reports ................................................................................... 6 Data Storage ........................................................................................................ 6
WQMP GROUND WATER PROJECT DESCRIPTIONS ................................................ 7 Coastal Ground-Water Quality Monitoring Network .............................................. 7 Water Use Permitting Ground-Water Quality Monitoring Network ........................ 7 Springs Water Quality Network ............................................................................. 8 Lake Wales Ridge Water Quality Monitoring Network .......................................... 9 Coleman Landing Water Quality Monitoring Network ......................................... 10 Upper Floridan Aquifer Nutrient Monitoring Network .......................................... 11 Lake Panasoffkee Restoration Project ............................................................... 12 Upper Peace River Ground Water Quality Monitoring Network .......................... 13 Salt Water Intrusion Monitoring Network ............................................................ 14 Lake Placid Water Management Plan Monitoring Network – Ground Water ...... 15 Shell, Prairie & Joshua Creek Watersheds Water Quality Monitoring Network .. 15
GROUND WATER PROJECTS - FIELD SAMPLING PROTOCOLS ............................ 16 Project Initiation .................................................................................................. 16 Sample Kits ........................................................................................................ 16 Sample Equipment ............................................................................................. 17 Sample-Run Initiation ......................................................................................... 18 Site Arrival .......................................................................................................... 19 Site Set-Up ......................................................................................................... 19 Depth to Water Measurement ............................................................................ 20 Purge Pump Set-up ............................................................................................ 20 Field Meter Calibration ....................................................................................... 21 Well Purge .......................................................................................................... 22 In-Place Pumps, Flowing Wells, and Springs ..................................................... 25 Sample Preparation ............................................................................................ 26 Sample Collection ............................................................................................... 27 Sample Acidification ........................................................................................... 27 Duplicate and Blank Sample Collection .............................................................. 29
Post Sampling Procedures ............................................................................................ 30 Final Paperwork and Sample Shipment ........................................................................ 30 Post Field-Use Equipment Maintenance ....................................................................... 32 WQMP SURFACE WATER PROJECT DESCRIPTIONS ............................................. 34
Peace River Water Quality Monitoring Network .................................................. 34 Myakka River Water Quality Monitoring Network ............................................... 34 Stream Water Quality Monitoring Network ......................................................... 34 Lake Panasoffkee Water Quality Monitoring Network ........................................ 35 Ambient Lakes Water Quality Monitoring Network ............................................. 36 Rocky Creek Lake Enhancement Project ........................................................... 38
TABLE OF CONTENTS Lake Tsala Apopka Water Quality Monitoring Network ...................................... 39 Lake Placid Water Management Plan Monitoring Network – Surface Water ...... 40 Shell, Prairie & Joshua Creek Watersheds Water Quality Monitoring Network .. 41
SURFACE WATER PROJECTS - FIELD SAMPLING PROTOCOLS ........................... 43 Project Initiation .................................................................................................. 43 Sample Kits ........................................................................................................ 43 Sample Equipment ............................................................................................. 44 Sample Run Initiation ......................................................................................... 45 Field Multiprobe Calibration ................................................................................ 45 Site Arrival .......................................................................................................... 46 Sample Collection Initiation ................................................................................ 46 Field Data Collection .......................................................................................... 47 Sample Preparation ............................................................................................ 48 Sample Collection ............................................................................................... 49 Sample Acidification ........................................................................................... 51 Replicate and Blank Sample Collection .............................................................. 51
Post Sampling Procedures ............................................................................................ 53 Final Paperwork and Sample Shipment ........................................................................ 53 Final Equipment Maintenance ....................................................................................... 55
LIST OF TABLES Table 1. Period of Record, Funding Source, and Project Coordinator for Current Water
Quality Monitoring Projects. ............................................................................. 2 Table 2. Field Data Deliverable Format. ......................................................................... 4 Table 3. Data Value Qualifier Codes and Descriptions. ................................................. 5 Table 4. CGWQMN - Field, Laboratory Parameters, and Bottle Types. ......................... 7 Table 5. Springs Water Quality Network - Field, Laboratory Parameters, and Bottle
Types. .............................................................................................................. 9 Table 6. Lake Wales Ridge Water Quality Monitoring Network - Field, Laboratory
Parameters, and Bottle Types. ....................................................................... 10 Table 7. Coleman Landing Water Quality Network – Field, Laboratory Parameters, and
Bottle Types. .................................................................................................. 11 Table 8. Upper Floridan Aquifer Nutrient Monitoring Network – Field and Laboratory
Parameters .......................................................................................... 12 Table 9. Lake Panasoffkee Restoration Project – Field, Laboratory Parameters, and
Bottle Types for Wells. ................................................................................... 13 Table 10. Lake Panasoffkee Restoration Project – Field, Laboratory Parameters, and
Bottle Types for Surface Water. .................................................................... 13 Table 11. Upper Peace River Ground Water Quality Monitoring Network – Field and
Laboratory Parameters .................................................................................. 14 Table 12. SWIMN - Field, Laboratory Parameters, and Bottle Types. .......................... 15 Table 13. Lake Placid Water Management Plan Monitoring Network – Ground Water -
Field, Laboratory Parameters, and Bottle Types. ........................................... 15 Table 14. Field parameter stabilization limits. .............................................................. 23 Table 15. Ground Water Project Shipping Methods. .................................................... 31 Table 16. Peace and Myakka Rivers and Stream Water Quality Projects - Field,
Laboratory Parameters, and Bottle Types. .................................................... 35 Table 17. Lake Panasoffkee - Field, Laboratory Parameters, and Bottle Types. ......... 36 Table 18. Ambient Lakes Water Quality Monitoring Network- Field, Laboratory
Parameters, and Bottle Types. ...................................................................... 37 Table 19. Polk County subset of lakes – Field and Laboratory Parameters ................. 37 Table 20. Rocky Creek Lake Enhancement Project Field, Laboratory Parameters, and
Bottle Types. ................................................................................................ 38 Table 21. Lake Tsala Apopka Water Quality Monitoring Network - Field, Laboratory
Parameters. ................................................................................................... 39 Table 22. Lake Placid Water Management Plan Monitoring Network – Surface Water –
Field, Laboratory Parameters, and Bottle Types. ........................................... 40 Table 23. SPJC Watersheds - Field, Laboratory Parameters, and Bottle Types. ........ 42 Table 24. Surface Water Project Shipping Methods. .................................................... 54
LIST OF DETAILS Detail 1. WQMP Personnel Organization Chart .............................................................. i Detail 2. Ground and Surface Water Sample Collection Equipment..............................vi Detail 3. Sample Equipment Descriptions ................................................................... xiii Detail 4. Water Level Instrumentation Instructions ...................................................... xxi Detail 5. Well Volume and Purge Rate/Time Calculation Instructions ........................ xxv Detail 6. Cleaning Day Protocols for Sampling Equipment and Sampling Vehicles . xxvii Detail 7. Meter Calibration and Maintenance Protocols ............................................ xxxv Detail 8. Ground and Surface Water Field Measurement Equipment ........................... xl Detail 9. Storage Protocols for Acids, Buffers, and Other Standards ........................ xliv Detail 10. SPJC Watersheds YSI Data Sonde Logging Protocols ............................. xlviii Detail 11. Citrus Canker Sanitation Protocols ............................................................... liv Detail 12. Trimble GPS Information ............................................................................. lviii Detail 13. Habitat Assessment and Stream Condition Index Information .................... lxvi Detail 14. Field Related Forms and Documents .......................................................... lxxi
1
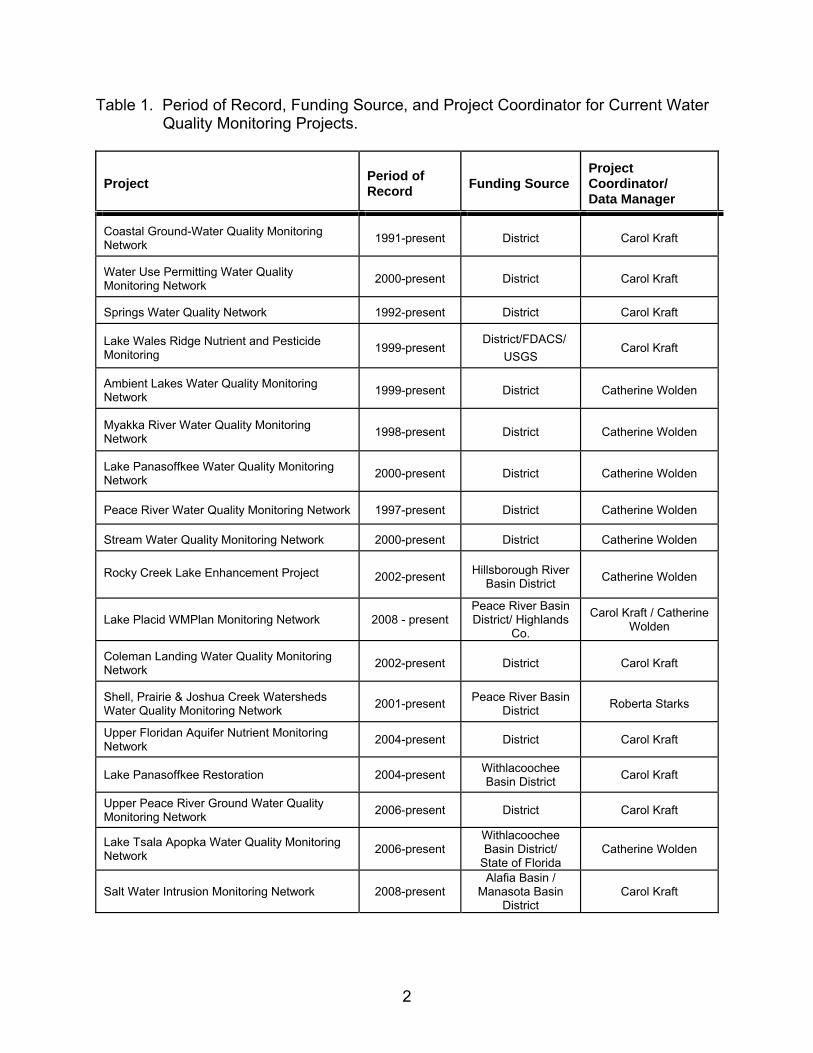
STATEMENT OF INTENT It is the intent of the Water Quality Monitoring Program (WQMP) at the Southwest Florida Water Management District (District) to collect water quality and biological samples in a manner consistent with Florida Department of Environmental Protection (FDEP) Standard Operating Procedure (SOP) FDEP-SOP–001/01, Rule 62-160.800 Florida Administrative Code (F.A.C.) and/or with procedures described in this manual. INTRODUCTION The WQMP is a program within the Resource Data & Restoration Department (RDR) at the District. Tasked with assessing water quality in the face of increasing water use from agriculture, industry, and development, each program within the RDR is responsible for various aspects of water quality data collection and interpretation. The principal function of the WQMP is the collection, management, and analysis of ground water and surface water quality data (see Detail 1 for WQMP Personnel Organization Chart). This SOP manual is intended to describe in detail the procedures used by the WQMP to collect water quality samples for the various monitoring projects currently funded. This manual will be the guidance document for the collection of water quality data within the WQMP. Updates will be made on an annual basis to document the evolution of sampling procedures and new monitoring projects. WATER QUALITY MONITORING PROJECTS The WQMP is currently involved in twenty water quality monitoring projects. Table 1 is a listing of the period of record, funding source, project coordinator, and data manager for each of the current water quality monitoring projects. The projects listed in Table 1 are funded by the District or a District Basin Board and do not have specific Quality Assurance Project Plans. Instead, these projects follow the District Comprehensive Quality Assurance Plan that is created by the District Laboratory and approved by FDEP. This type of plan is generally very broad in scope and does not list detailed sampling methods, so there is a need for the WQMP to document detailed sampling methods for each project. This manual will be used in two ways. First, it will be used to list specific procedures for the collection of water quality samples thereby eliminating variability between field sampling techniques. Secondly, this document will be used as a reference source for field technicians as well as a training manual for new field staff and District cooperators.
2
Table 1. Period of Record, Funding Source, and Project Coordinator for Current Water Quality Monitoring Projects.
Project
Period of Record
Funding Source
Project Coordinator/ Data Manager
Coastal Ground-Water Quality Monitoring Network 1991-present District
Carol Kraft
Water Use Permitting Water Quality Monitoring Network 2000-present District
Carol Kraft
Springs Water Quality Network 1992-present District
Carol Kraft
Lake Wales Ridge Nutrient and Pesticide Monitoring
1999-present District/FDACS/
USGS
Carol Kraft Ambient Lakes Water Quality Monitoring Network 1999-present District
Catherine Wolden
Myakka River Water Quality Monitoring Network 1998-present District
Catherine Wolden
Lake Panasoffkee Water Quality Monitoring Network 2000-present District
Catherine Wolden
Peace River Water Quality Monitoring Network 1997-present District
Catherine Wolden
Stream Water Quality Monitoring Network 2000-present District
Catherine Wolden
Rocky Creek Lake Enhancement Project 2002-present Hillsborough River
Basin District
Catherine Wolden
Lake Placid WMPlan Monitoring Network 2008 - present Peace River Basin District/ Highlands
Co.
Carol Kraft / Catherine Wolden
Coleman Landing Water Quality Monitoring Network 2002-present District
Carol Kraft
Shell, Prairie & Joshua Creek Watersheds Water Quality Monitoring Network 2001-present Peace River Basin
District
Roberta Starks
Upper Floridan Aquifer Nutrient Monitoring Network 2004-present District Carol Kraft
Lake Panasoffkee Restoration 2004-present Withlacoochee Basin District Carol Kraft
Upper Peace River Ground Water Quality Monitoring Network 2006-present District Carol Kraft
Lake Tsala Apopka Water Quality Monitoring Network 2006-present
Withlacoochee Basin District/
State of Florida Catherine Wolden
Salt Water Intrusion Monitoring Network 2008-present Alafia Basin /
Manasota Basin District
Carol Kraft
3
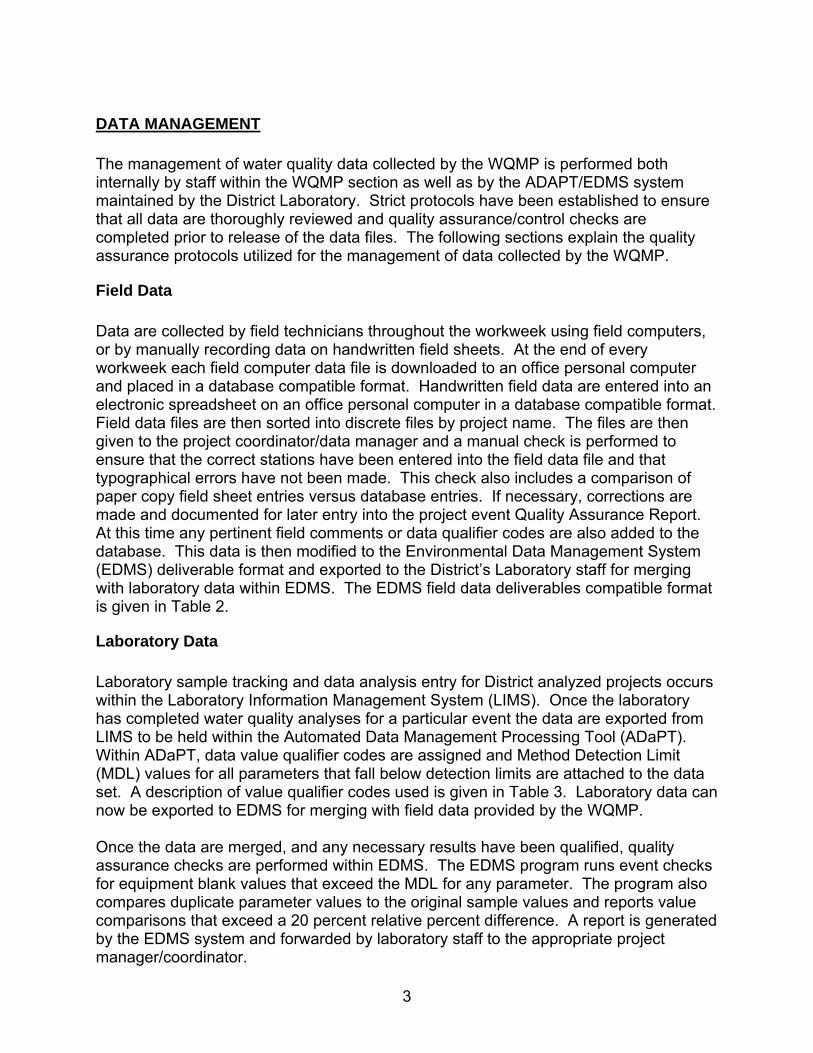
DATA MANAGEMENT The management of water quality data collected by the WQMP is performed both internally by staff within the WQMP section as well as by the ADAPT/EDMS system maintained by the District Laboratory. Strict protocols have been established to ensure that all data are thoroughly reviewed and quality assurance/control checks are completed prior to release of the data files. The following sections explain the quality assurance protocols utilized for the management of data collected by the WQMP.
Field Data Data are collected by field technicians throughout the workweek using field computers, or by manually recording data on handwritten field sheets. At the end of every workweek each field computer data file is downloaded to an office personal computer and placed in a database compatible format. Handwritten field data are entered into an electronic spreadsheet on an office personal computer in a database compatible format. Field data files are then sorted into discrete files by project name. The files are then given to the project coordinator/data manager and a manual check is performed to ensure that the correct stations have been entered into the field data file and that typographical errors have not been made. This check also includes a comparison of paper copy field sheet entries versus database entries. If necessary, corrections are made and documented for later entry into the project event Quality Assurance Report. At this time any pertinent field comments or data qualifier codes are also added to the database. This data is then modified to the Environmental Data Management System (EDMS) deliverable format and exported to the District’s Laboratory staff for merging with laboratory data within EDMS. The EDMS field data deliverables compatible format is given in Table 2.
Laboratory Data Laboratory sample tracking and data analysis entry for District analyzed projects occurs within the Laboratory Information Management System (LIMS). Once the laboratory has completed water quality analyses for a particular event the data are exported from LIMS to be held within the Automated Data Management Processing Tool (ADaPT). Within ADaPT, data value qualifier codes are assigned and Method Detection Limit (MDL) values for all parameters that fall below detection limits are attached to the data set. A description of value qualifier codes used is given in Table 3. Laboratory data can now be exported to EDMS for merging with field data provided by the WQMP. Once the data are merged, and any necessary results have been qualified, quality assurance checks are performed within EDMS. The EDMS program runs event checks for equipment blank values that exceed the MDL for any parameter. The program also compares duplicate parameter values to the original sample values and reports value comparisons that exceed a 20 percent relative percent difference. A report is generated by the EDMS system and forwarded by laboratory staff to the appropriate project manager/coordinator.
4
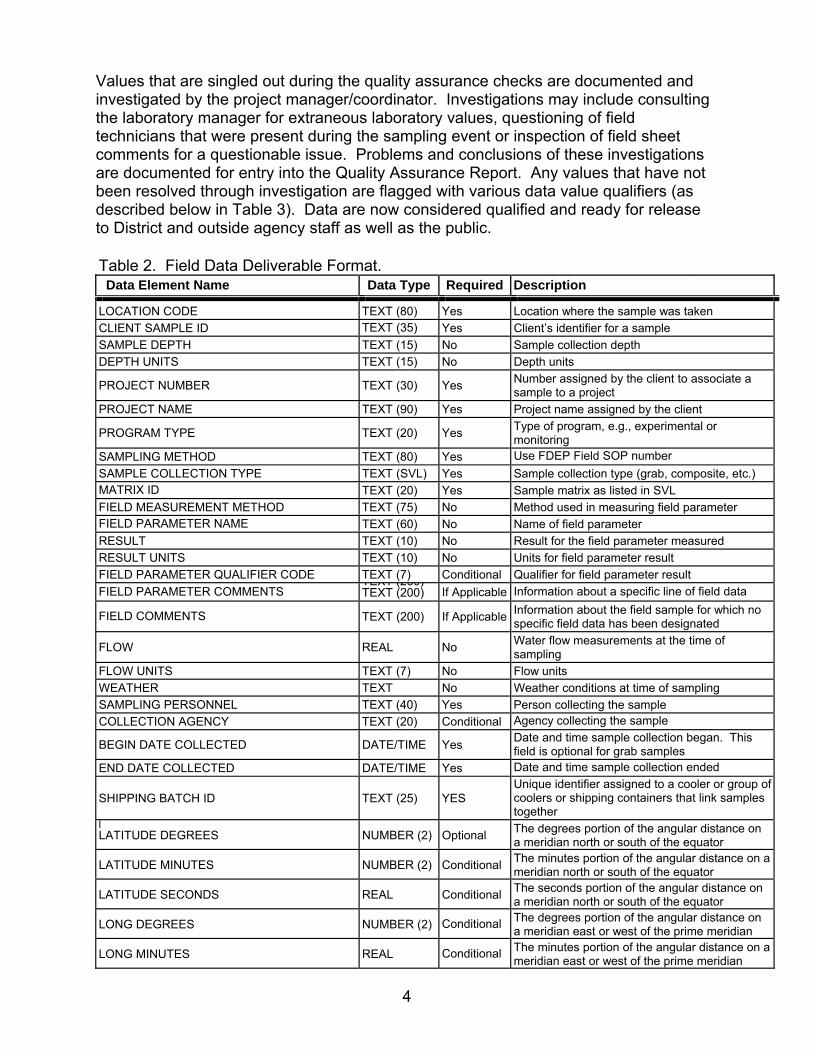
Values that are singled out during the quality assurance checks are documented and investigated by the project manager/coordinator. Investigations may include consulting the laboratory manager for extraneous laboratory values, questioning of field technicians that were present during the sampling event or inspection of field sheet comments for a questionable issue. Problems and conclusions of these investigations are documented for entry into the Quality Assurance Report. Any values that have not been resolved through investigation are flagged with various data value qualifiers (as described below in Table 3). Data are now considered qualified and ready for release to District and outside agency staff as well as the public. Table 2. Field Data Deliverable Format.
Data Element Name Data Type Required Description LOCATION CODE TEXT (80) Yes Location where the sample was taken CLIENT SAMPLE ID TEXT (35) Yes Client’s identifier for a sample SAMPLE DEPTH TEXT (15) No Sample collection depth DEPTH UNITS TEXT (15) No Depth units PROJECT NUMBER TEXT (30) Yes Number assigned by the client to associate a
sample to a project PROJECT NAME TEXT (90) Yes Project name assigned by the client PROGRAM TYPE TEXT (20) Yes Type of program, e.g., experimental or
monitoring SAMPLING METHOD TEXT (80) Yes Use FDEP Field SOP number SAMPLE COLLECTION TYPE TEXT (SVL) Yes Sample collection type (grab, composite, etc.) MATRIX ID TEXT (20) Yes Sample matrix as listed in SVL FIELD MEASUREMENT METHOD TEXT (75) No Method used in measuring field parameter FIELD PARAMETER NAME TEXT (60) No Name of field parameter RESULT TEXT (10) No Result for the field parameter measured RESULT UNITS TEXT (10) No Units for field parameter result FIELD PARAMETER QUALIFIER CODE TEXT (7) Conditional Qualifier for field parameter result FIELD PARAMETER COMMENTS
TEXT (200)TEXT (200) If Applicable Information about a specific line of field data
FIELD COMMENTS TEXT (200) If Applicable Information about the field sample for which no specific field data has been designated
FLOW REAL No Water flow measurements at the time of
sampling FLOW UNITS TEXT (7) No Flow units WEATHER TEXT No Weather conditions at time of sampling SAMPLING PERSONNEL TEXT (40) Yes Person collecting the sample COLLECTION AGENCY TEXT (20) Conditional Agency collecting the sample BEGIN DATE COLLECTED DATE/TIME Yes Date and time sample collection began. This
field is optional for grab samples END DATE COLLECTED DATE/TIME Yes Date and time sample collection ended SHIPPING BATCH ID
TEXT (25)
YES
Unique identifier assigned to a cooler or group ofcoolers or shipping containers that link samples together
l LATITUDE DEGREES NUMBER (2) Optional The degrees portion of the angular distance on
a meridian north or south of the equator LATITUDE MINUTES NUMBER (2) Conditional The minutes portion of the angular distance on a
meridian north or south of the equator LATITUDE SECONDS REAL Conditional The seconds portion of the angular distance on
a meridian north or south of the equator LONG DEGREES NUMBER (2) Conditional The degrees portion of the angular distance on
a meridian east or west of the prime meridian LONG MINUTES REAL Conditional The minutes portion of the angular distance on a
meridian east or west of the prime meridian
5
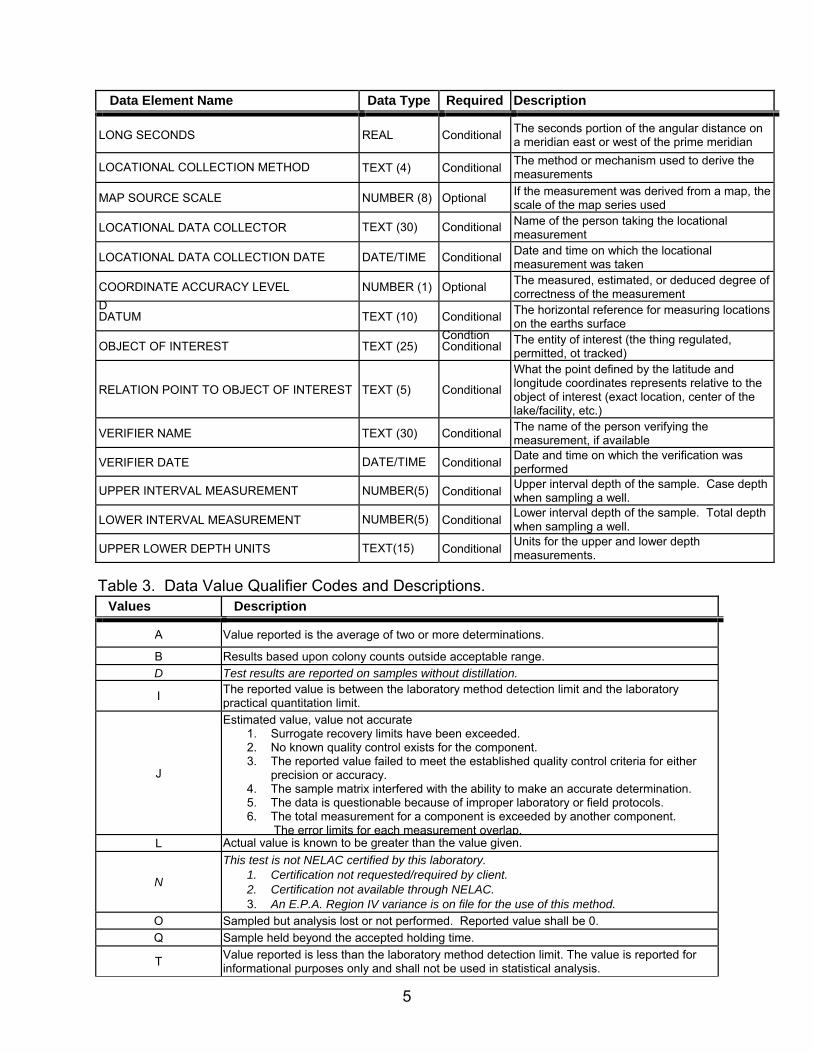
Data Element Name Data Type Required Description LONG SECONDS
REAL
Conditional The seconds portion of the angular distance on
a meridian east or west of the prime meridian
LOCATIONAL COLLECTION METHOD TEXT (4) Conditional The method or mechanism used to derive the measurements
MAP SOURCE SCALE NUMBER (8) Optional If the measurement was derived from a map, the
scale of the map series used LOCATIONAL DATA COLLECTOR TEXT (30) Conditional Name of the person taking the locational
measurement LOCATIONAL DATA COLLECTION DATE DATE/TIME Conditional Date and time on which the locational
measurement was taken COORDINATE ACCURACY LEVEL NUMBER (1) Optional The measured, estimated, or deduced degree of
correctness of the measurement D DATUM TEXT (10) Conditional The horizontal reference for measuring locations
on the earths surface OBJECT OF INTEREST TEXT (25)
CondtionConditional The entity of interest (the thing regulated,
permitted, ot tracked)
RELATION POINT TO OBJECT OF INTEREST
TEXT (5)
Conditional
What the point defined by the latitude and longitude coordinates represents relative to the object of interest (exact location, center of the lake/facility, etc.)
VERIFIER NAME TEXT (30) Conditional The name of the person verifying the
measurement, if available VERIFIER DATE DATE/TIME Conditional Date and time on which the verification was
performed
UPPER INTERVAL MEASUREMENT NUMBER(5) Conditional Upper interval depth of the sample. Case depth when sampling a well.
LOWER INTERVAL MEASUREMENT NUMBER(5) Conditional Lower interval depth of the sample. Total depth
when sampling a well. UPPER LOWER DEPTH UNITS TEXT(15) Conditional Units for the upper and lower depth
measurements.
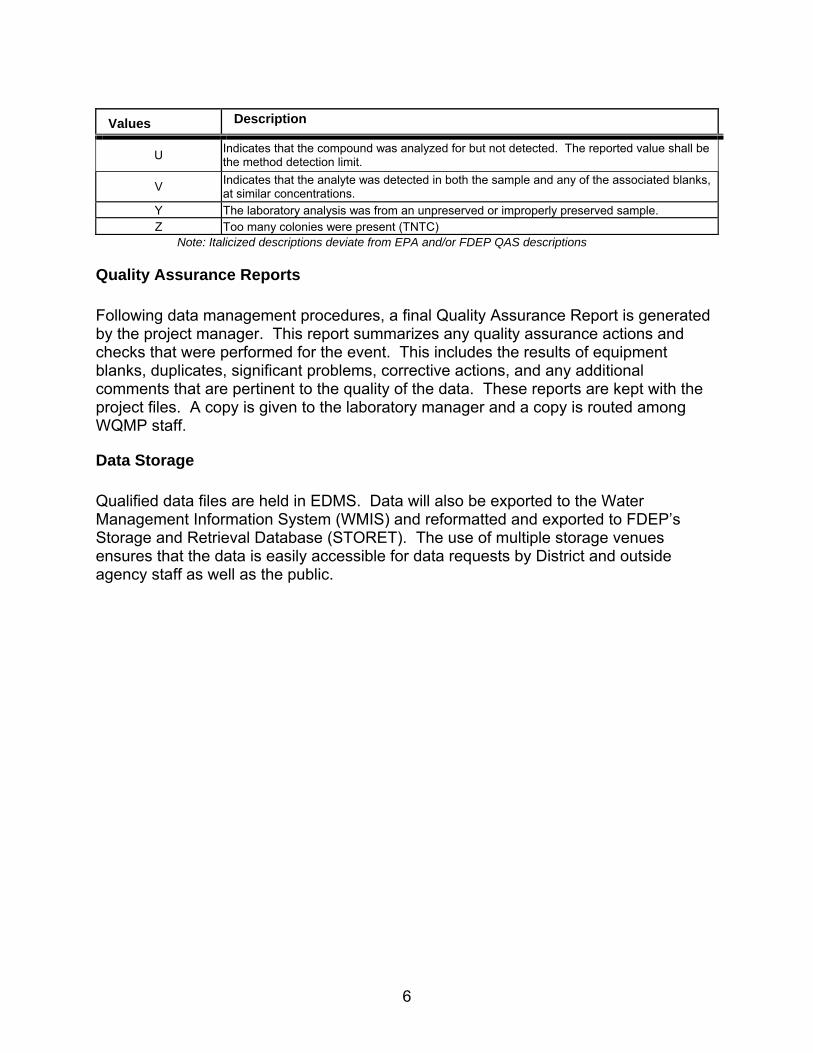
Table 3. Data Value Qualifier Codes and Descriptions. Values
Description
A
Value reported is the average of two or more determinations.
B
Results based upon colony counts outside acceptable range.
D Test results are reported on samples without distillation.
I
The reported value is between the laboratory method detection limit and the laboratory practical quantitation limit.
J
Estimated value, value not accurate
1. Surrogate recovery limits have been exceeded. 2. No known quality control exists for the component. 3. The reported value failed to meet the established quality control criteria for either
precision or accuracy. 4. The sample matrix interfered with the ability to make an accurate determination. 5. The data is questionable because of improper laboratory or field protocols. 6. The total measurement for a component is exceeded by another component.
The error limits for each measurement overlap. L Actual value is known to be greater than the value given.
N
This test is not NELAC certified by this laboratory.
1. Certification not requested/required by client. 2. Certification not available through NELAC. 3. An E.P.A. Region IV variance is on file for the use of this method.
O Sampled but analysis lost or not performed. Reported value shall be 0.
Q Sample held beyond the accepted holding time.
T
Value reported is less than the laboratory method detection limit. The value is reported for informational purposes only and shall not be used in statistical analysis.
6
Values
Description
U Indicates that the compound was analyzed for but not detected. The reported value shall be the method detection limit.
V
Indicates that the analyte was detected in both the sample and any of the associated blanks, at similar concentrations.
Y The laboratory analysis was from an unpreserved or improperly preserved sample.
Z Too many colonies were present (TNTC)
Note: Italicized descriptions deviate from EPA and/or FDEP QAS descriptions
Quality Assurance Reports Following data management procedures, a final Quality Assurance Report is generated by the project manager. This report summarizes any quality assurance actions and checks that were performed for the event. This includes the results of equipment blanks, duplicates, significant problems, corrective actions, and any additional comments that are pertinent to the quality of the data. These reports are kept with the project files. A copy is given to the laboratory manager and a copy is routed among WQMP staff.
Data Storage Qualified data files are held in EDMS. Data will also be exported to the Water Management Information System (WMIS) and reformatted and exported to FDEP’s Storage and Retrieval Database (STORET). The use of multiple storage venues ensures that the data is easily accessible for data requests by District and outside agency staff as well as the public.
7
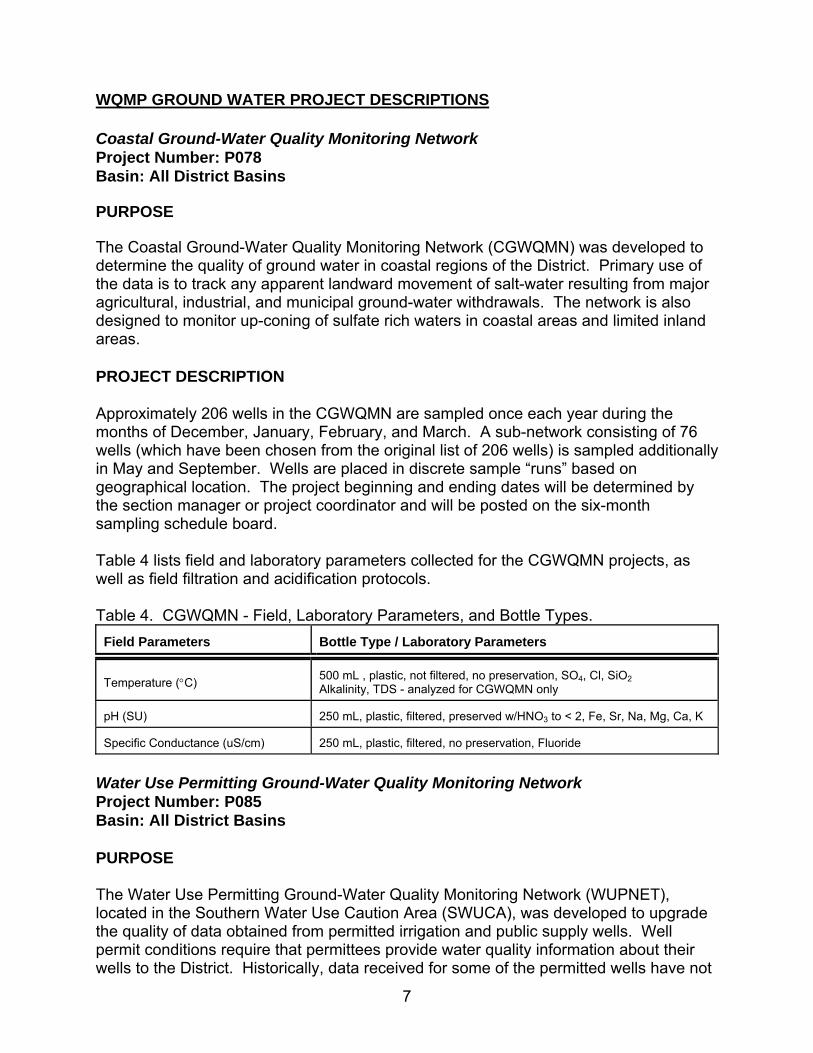
WQMP GROUND WATER PROJECT DESCRIPTIONS Coastal Ground-Water Quality Monitoring Network Project Number: P078 Basin: All District Basins PURPOSE The Coastal Ground-Water Quality Monitoring Network (CGWQMN) was developed to determine the quality of ground water in coastal regions of the District. Primary use of the data is to track any apparent landward movement of salt-water resulting from major agricultural, industrial, and municipal ground-water withdrawals. The network is also designed to monitor up-coning of sulfate rich waters in coastal areas and limited inland areas. PROJECT DESCRIPTION Approximately 206 wells in the CGWQMN are sampled once each year during the months of December, January, February, and March. A sub-network consisting of 76 wells (which have been chosen from the original list of 206 wells) is sampled additionally in May and September. Wells are placed in discrete sample “runs” based on geographical location. The project beginning and ending dates will be determined by the section manager or project coordinator and will be posted on the six-month sampling schedule board. Table 4 lists field and laboratory parameters collected for the CGWQMN projects, as well as field filtration and acidification protocols. Table 4. CGWQMN - Field, Laboratory Parameters, and Bottle Types. Field Parameters
Bottle Type / Laboratory Parameters
Temperature (°C)
500 mL , plastic, not filtered, no preservation, SO4, Cl, SiO2 Alkalinity, TDS - analyzed for CGWQMN only
pH (SU)
250 mL, plastic, filtered, preserved w/HNO3 to < 2, Fe, Sr, Na, Mg, Ca, K
Specific Conductance (uS/cm)
250 mL, plastic, filtered, no preservation, Fluoride
Water Use Permitting Ground-Water Quality Monitoring Network Project Number: P085 Basin: All District Basins PURPOSE The Water Use Permitting Ground-Water Quality Monitoring Network (WUPNET), located in the Southern Water Use Caution Area (SWUCA), was developed to upgrade the quality of data obtained from permitted irrigation and public supply wells. Well permit conditions require that permittees provide water quality information about their wells to the District. Historically, data received for some of the permitted wells have not
8
been reliable. This network provides a continuous, reliable data collection effort which will assist with water resource management decisions. PROJECT DESCRIPTION Wells which are sampled for the WUPNET have been chosen using statistical techniques to determine well density and sampling frequency. From these statistical results a sentinel or “fixed” well network has been established for water quality monitoring of the WUPNET. Monitoring of WUPNET is done concurrently with the CGWQMN and is performed by the WQMP with analyses done by the District Laboratory. Approximately 153 wells in the WUPNET are sampled once each year during the months of January, May, and September. Table 4 lists field and laboratory parameters collected for the WUPNET project, as well as field filtration and acidification protocols. Springs Water Quality Network Project: P889 Basin: Alafia River, Coastal Rivers, Hillsborough River, Manasota, Peace River, Pinellas-Anclote River PURPOSE Increasing nitrate levels in both inland and coastal-area springs within the District are of great concern because these springs contribute large quantities of water to local spring runs and rivers that drain into the Gulf of Mexico. Increased nitrate levels have the potential to affect aquatic ecosystems by stimulating the growth of nuisance aquatic vegetation. In addition, increasing nitrates in springs are indicative of increasing nitrate levels in the ground water of inland areas where the spring water originates. The primary goal of the Springs Water Quality Network is to track nitrate concentrations with the long-term goal of establishing a nitrate management plan in the spring recharge areas. Priority pollutants and nitrogen isotopes are also analyzed for all springs included in this network. PROJECT DESCRIPTION Approximately 52 springs located throughout the District are sampled on a quarterly basis in the months of January, April, July, and October. An additional 13 springs are included with each July sampling event (in prior years these additional springs were sampled in January). The July sampling event includes the 12 first magnitude springs also sampled by the Florida Geological Survey (FGS). Priority pollutants or nitrogen isotopes are also sampled for a varying subset of the springs each July; sampling shifts between priority pollutants (analyzed by the FDEP Central Laboratory) and nitrogen isotopes (analyzed by Coastal Science Laboratory) every other year. Water quality analyses for this project are performed by the District Laboratory.
9
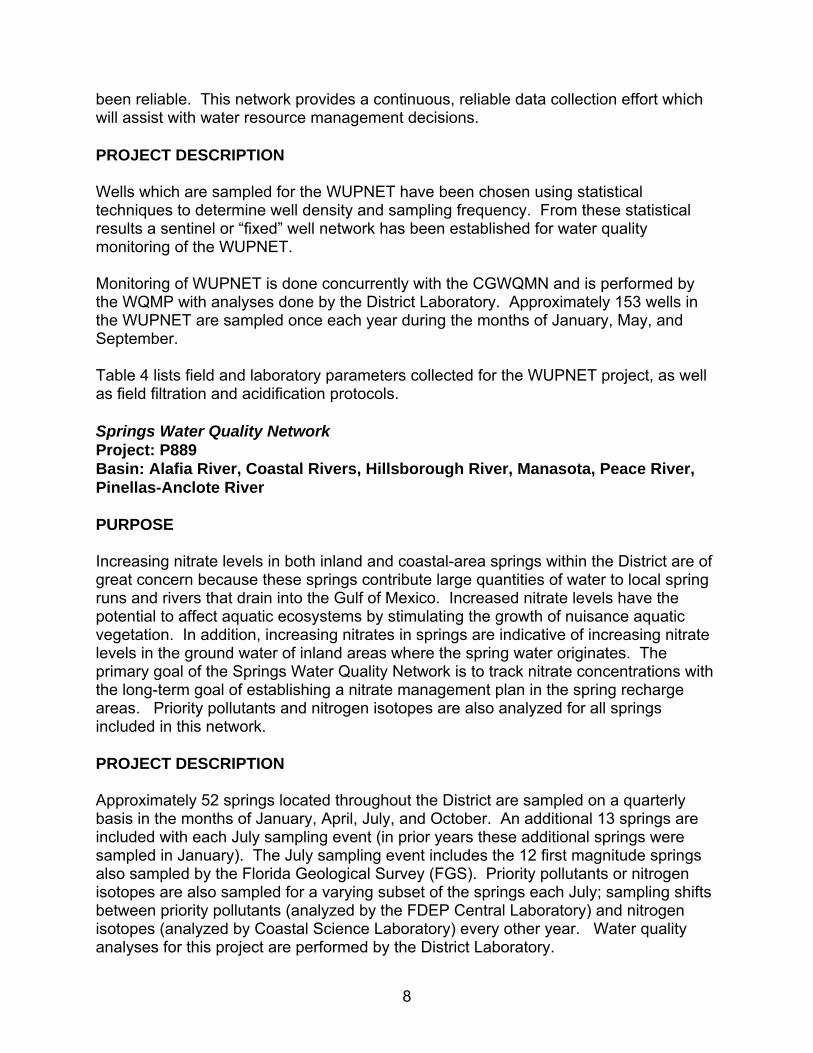
An attempt is made to sample tidally influenced springs during the low-tide cycle. The schedule of estimated beginning and end sample project dates will be determined by the field technician supervisor or project coordinator and posted on the sampling schedule board. Table 5 lists field and laboratory parameters collected for this project, as well as field filtration and acidification protocols. Table 5. Springs Water Quality Network - Field, Laboratory Parameters, and Bottle
Types. Field Parameters Bottle Type / Laboratory Parameters
Temperature (°C) 250 mL, plastic, filtered, preserved w/H2SO4 to < 2, NH3, OPO4, NO2,
NO3
pH (SU) 500 mL, plastic, not filtered, no preservation, SO4, K, Na, F, TDS, Cl,
Mg, Ca Specific Conductance (uS/cm) 250 mL, plastic, filtered, preserved w/HNO3 to < 2, Fe Dissolved Oxygen (mg/L) 250 mL, plastic, filtered, no preservation, Alkalinity, Turbidity, Color 250 mL, plastic, not filtered, preserved w/H2SO4 to < 2, Total N, TPO4 40 mL, amber glass, not filtered, preserved w/H2SO4 to < 2, TOC
Lake Wales Ridge Water Quality Monitoring Network Project: P885 Basin: Green Swamp, Peace River PURPOSE The Lake Wales Ridge Water Quality Monitoring Network was developed to identify the occurrence of pesticide and nitrate contamination within the Lake Wales Ridge region. The predominant land-use of this region is agriculture, which is mostly comprised of citrus crop production. In these areas there is a need to monitor shallow ground water for agricultural chemicals to evaluate potential migration of these chemicals to the subsurface and to deeper aquifers, and to assess the effects of agricultural practices on ground water quality. PROJECT DESCRIPTION Wells selected for this network consist of both existing and newly drilled wells. Existing wells were evaluated as candidates for the network based on location and well-construction specifications for water-quality monitoring. Using probability selection techniques, new well locations were selected in areas that lacked adequate existing wells. Approximately 31 surficial wells in Polk and Highlands counties are sampled for this project twice a year. Chemical water quality analyses are performed by two laboratories: the District Laboratory performs analyses for nutrients, metals, and major
10
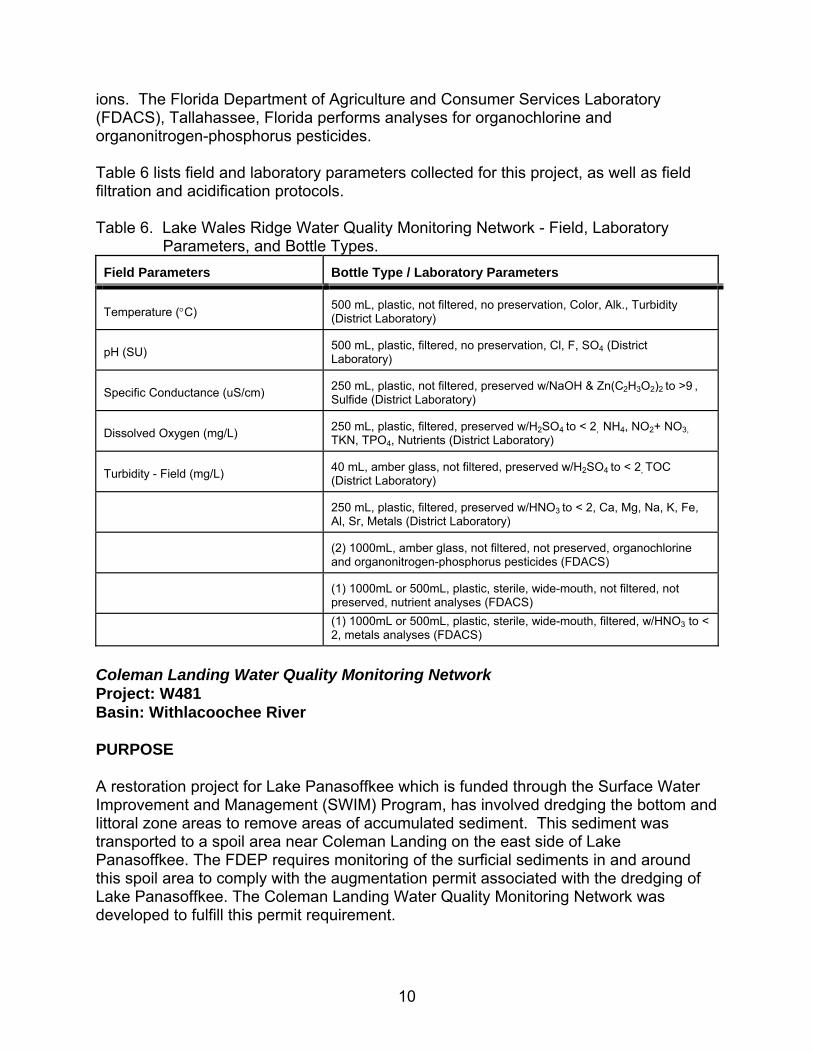
ions. The Florida Department of Agriculture and Consumer Services Laboratory (FDACS), Tallahassee, Florida performs analyses for organochlorine and organonitrogen-phosphorus pesticides. Table 6 lists field and laboratory parameters collected for this project, as well as field filtration and acidification protocols. Table 6. Lake Wales Ridge Water Quality Monitoring Network - Field, Laboratory
Parameters, and Bottle Types. Field Parameters Bottle Type / Laboratory Parameters
Temperature (°C) 500 mL, plastic, not filtered, no preservation, Color, Alk., Turbidity
(District Laboratory)
pH (SU) 500 mL, plastic, filtered, no preservation, Cl, F, SO4 (District
Laboratory)
Specific Conductance (uS/cm) 250 mL, plastic, not filtered, preserved w/NaOH & Zn(C2H3O2)2 to >9 ,
Sulfide (District Laboratory)
Dissolved Oxygen (mg/L) 250 mL, plastic, filtered, preserved w/H2SO4 to < 2, NH4, NO2+ NO3,
TKN, TPO4, Nutrients (District Laboratory)
Turbidity - Field (mg/L) 40 mL, amber glass, not filtered, preserved w/H2SO4 to < 2, TOC
(District Laboratory) 250 mL, plastic, filtered, preserved w/HNO3 to < 2, Ca, Mg, Na, K, Fe,
Al, Sr, Metals (District Laboratory) (2) 1000mL, amber glass, not filtered, not preserved, organochlorine
and organonitrogen-phosphorus pesticides (FDACS) (1) 1000mL or 500mL, plastic, sterile, wide-mouth, not filtered, not
preserved, nutrient analyses (FDACS) (1) 1000mL or 500mL, plastic, sterile, wide-mouth, filtered, w/HNO3 to <
2, metals analyses (FDACS) Coleman Landing Water Quality Monitoring Network Project: W481 Basin: Withlacoochee River PURPOSE A restoration project for Lake Panasoffkee which is funded through the Surface Water Improvement and Management (SWIM) Program, has involved dredging the bottom and littoral zone areas to remove areas of accumulated sediment. This sediment was transported to a spoil area near Coleman Landing on the east side of Lake Panasoffkee. The FDEP requires monitoring of the surficial sediments in and around this spoil area to comply with the augmentation permit associated with the dredging of Lake Panasoffkee. The Coleman Landing Water Quality Monitoring Network was developed to fulfill this permit requirement.
11
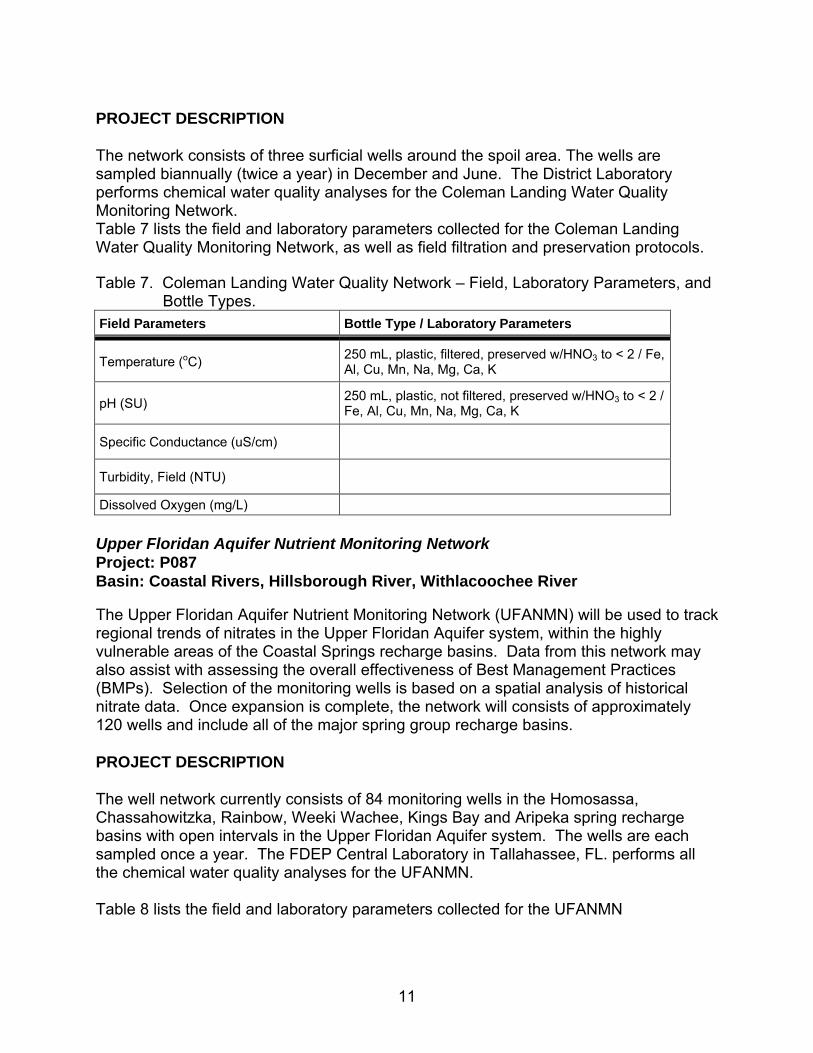
PROJECT DESCRIPTION The network consists of three surficial wells around the spoil area. The wells are sampled biannually (twice a year) in December and June. The District Laboratory performs chemical water quality analyses for the Coleman Landing Water Quality Monitoring Network. Table 7 lists the field and laboratory parameters collected for the Coleman Landing Water Quality Monitoring Network, as well as field filtration and preservation protocols. Table 7. Coleman Landing Water Quality Network – Field, Laboratory Parameters, and
Bottle Types. Field Parameters Bottle Type / Laboratory Parameters
Temperature (oC) 250 mL, plastic, filtered, preserved w/HNO3 to < 2 / Fe, Al, Cu, Mn, Na, Mg, Ca, K
pH (SU) 250 mL, plastic, not filtered, preserved w/HNO3 to < 2 / Fe, Al, Cu, Mn, Na, Mg, Ca, K
Specific Conductance (uS/cm)
Turbidity, Field (NTU)
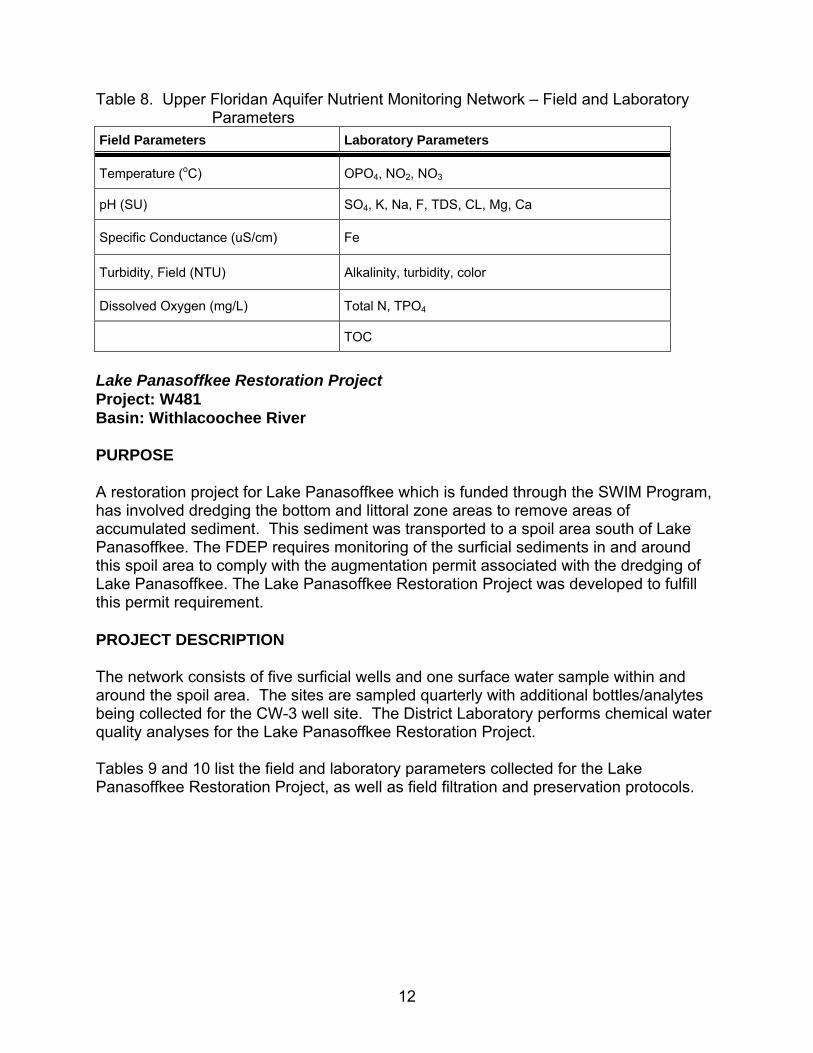
Dissolved Oxygen (mg/L) Upper Floridan Aquifer Nutrient Monitoring Network Project: P087 Basin: Coastal Rivers, Hillsborough River, Withlacoochee River The Upper Floridan Aquifer Nutrient Monitoring Network (UFANMN) will be used to track regional trends of nitrates in the Upper Floridan Aquifer system, within the highly vulnerable areas of the Coastal Springs recharge basins. Data from this network may also assist with assessing the overall effectiveness of Best Management Practices (BMPs). Selection of the monitoring wells is based on a spatial analysis of historical nitrate data. Once expansion is complete, the network will consists of approximately 120 wells and include all of the major spring group recharge basins. PROJECT DESCRIPTION The well network currently consists of 84 monitoring wells in the Homosassa, Chassahowitzka, Rainbow, Weeki Wachee, Kings Bay and Aripeka spring recharge basins with open intervals in the Upper Floridan Aquifer system. The wells are each sampled once a year. The FDEP Central Laboratory in Tallahassee, FL. performs all the chemical water quality analyses for the UFANMN. Table 8 lists the field and laboratory parameters collected for the UFANMN
12
Table 8. Upper Floridan Aquifer Nutrient Monitoring Network – Field and Laboratory Parameters
Field Parameters Laboratory Parameters
Temperature (oC) OPO4, NO2, NO3
pH (SU) SO4, K, Na, F, TDS, CL, Mg, Ca
Specific Conductance (uS/cm) Fe
Turbidity, Field (NTU) Alkalinity, turbidity, color
Dissolved Oxygen (mg/L) Total N, TPO4
TOC
Lake Panasoffkee Restoration Project Project: W481 Basin: Withlacoochee River PURPOSE A restoration project for Lake Panasoffkee which is funded through the SWIM Program, has involved dredging the bottom and littoral zone areas to remove areas of accumulated sediment. This sediment was transported to a spoil area south of Lake Panasoffkee. The FDEP requires monitoring of the surficial sediments in and around this spoil area to comply with the augmentation permit associated with the dredging of Lake Panasoffkee. The Lake Panasoffkee Restoration Project was developed to fulfill this permit requirement. PROJECT DESCRIPTION The network consists of five surficial wells and one surface water sample within and around the spoil area. The sites are sampled quarterly with additional bottles/analytes being collected for the CW-3 well site. The District Laboratory performs chemical water quality analyses for the Lake Panasoffkee Restoration Project. Tables 9 and 10 list the field and laboratory parameters collected for the Lake Panasoffkee Restoration Project, as well as field filtration and preservation protocols.

13
Table 9. Lake Panasoffkee Restoration Project – Field, Laboratory Parameters, and Bottle Types for Wells.
Field Parameters Bottle Type / Laboratory Parameters
Temperature (oC) 500 mL, plastic, not filtered, no preservation / TDS, Turbidity, NO2
pH (SU) 250 mL, plastic, not filtered, preserved w/HNO3 to < 2 / Al, Cr, Cu, Fe
Specific Conductance (uS/cm) 250 mL, plastic, not filtered, preserved w/ H2SO4 to < 2 / NO2+NO3
Turbidity, Field (NTU) 250 mL, plastic, filtered, preserved w/HNO3 to < 2 / Al, Cr, Cu, Fe
Dissolved Oxygen (mg/L) *250 mL, plastic, filtered, preserved w/ H2SO4 to < 2
*250 mL, plastic, not filtered, no preservation * Only collected at well CW-3 Table 10. Lake Panasoffkee Restoration Project – Field, Laboratory Parameters, and
Bottle Types for Surface Water. Field Parameters Bottle Type / Laboratory Parameters
Temperature (oC) 500 mL, plastic, not filtered, no preservation / TDS, Turbidity, NO2
pH (SU) 250 mL, plastic, not filtered, preserved w/HNO3 to < 2 / Al, Cr, Cu, Fe
Specific Conductance (uS/cm) 250 mL, plastic, filtered, preserved w/HNO3 to < 2 / Al, Cr, Cu, Fe
Turbidity, Field (NTU)
Dissolved Oxygen (mg/L) Upper Peace River Ground Water Quality Monitoring Network Project: P545 Basin: Peace River PURPOSE The Upper Peace River Ground Water Quality Monitoring Network was developed to examine if the influx of surface water from the Peace River into the Upper Floridan Aquifer (UFA) is bringing in excessive amounts of bacteria. This project is also examining if the influx of surface water into the UFA is liberating arsenic from pyrite found within limestone, which may be a result from the injection of surface water during aquifer storage and recovery. The wells selected for this project are also a part of the Upper Peace River Karst Investigation. This project consists of nine monitor wells at three separate sites along the Peace River near Bartow, Fl.
14
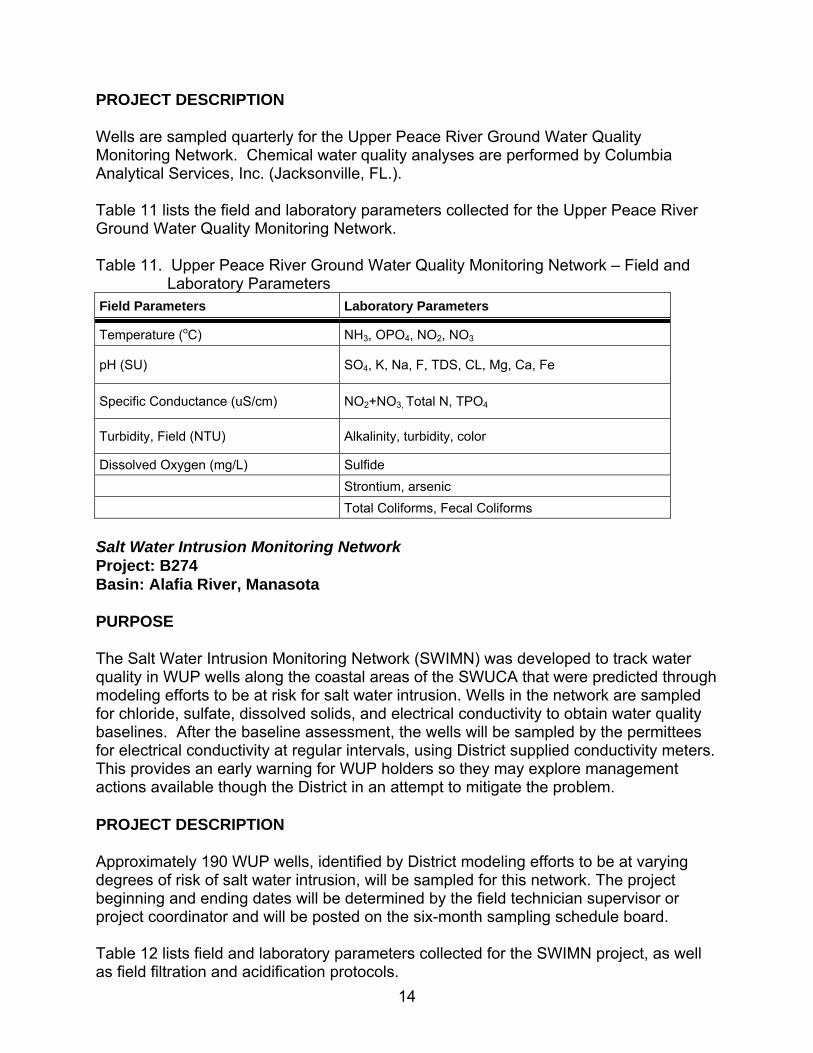
PROJECT DESCRIPTION Wells are sampled quarterly for the Upper Peace River Ground Water Quality Monitoring Network. Chemical water quality analyses are performed by Columbia Analytical Services, Inc. (Jacksonville, FL.). Table 11 lists the field and laboratory parameters collected for the Upper Peace River Ground Water Quality Monitoring Network. Table 11. Upper Peace River Ground Water Quality Monitoring Network – Field and
Laboratory Parameters Field Parameters Laboratory Parameters
Temperature (oC) NH3, OPO4, NO2, NO3
pH (SU) SO4, K, Na, F, TDS, CL, Mg, Ca, Fe
Specific Conductance (uS/cm) NO2+NO3, Total N, TPO4
Turbidity, Field (NTU) Alkalinity, turbidity, color
Dissolved Oxygen (mg/L) Sulfide Strontium, arsenic Total Coliforms, Fecal Coliforms Salt Water Intrusion Monitoring Network Project: B274 Basin: Alafia River, Manasota PURPOSE The Salt Water Intrusion Monitoring Network (SWIMN) was developed to track water quality in WUP wells along the coastal areas of the SWUCA that were predicted through modeling efforts to be at risk for salt water intrusion. Wells in the network are sampled for chloride, sulfate, dissolved solids, and electrical conductivity to obtain water quality baselines. After the baseline assessment, the wells will be sampled by the permittees for electrical conductivity at regular intervals, using District supplied conductivity meters. This provides an early warning for WUP holders so they may explore management actions available though the District in an attempt to mitigate the problem. PROJECT DESCRIPTION Approximately 190 WUP wells, identified by District modeling efforts to be at varying degrees of risk of salt water intrusion, will be sampled for this network. The project beginning and ending dates will be determined by the field technician supervisor or project coordinator and will be posted on the six-month sampling schedule board. Table 12 lists field and laboratory parameters collected for the SWIMN project, as well as field filtration and acidification protocols.
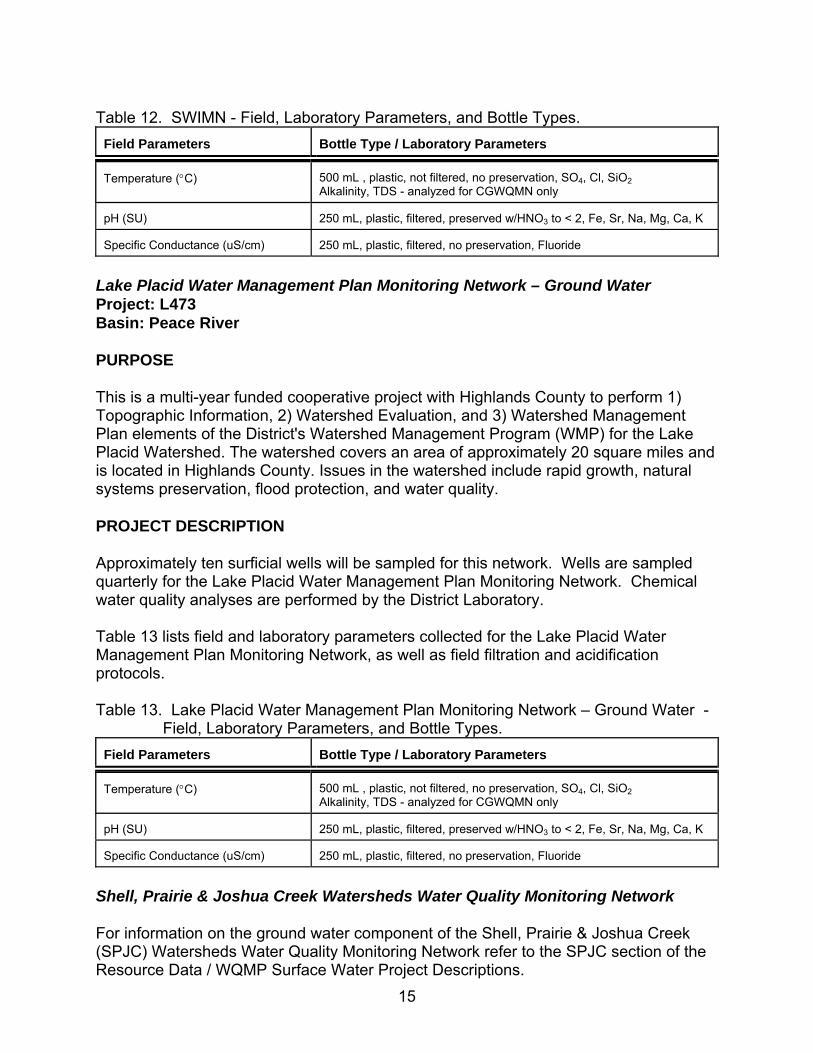
15
Table 12. SWIMN - Field, Laboratory Parameters, and Bottle Types. Field Parameters
Bottle Type / Laboratory Parameters
Temperature (°C)
500 mL , plastic, not filtered, no preservation, SO4, Cl, SiO2 Alkalinity, TDS - analyzed for CGWQMN only
pH (SU)
250 mL, plastic, filtered, preserved w/HNO3 to < 2, Fe, Sr, Na, Mg, Ca, K
Specific Conductance (uS/cm)
250 mL, plastic, filtered, no preservation, Fluoride
Lake Placid Water Management Plan Monitoring Network – Ground Water Project: L473 Basin: Peace River PURPOSE This is a multi-year funded cooperative project with Highlands County to perform 1) Topographic Information, 2) Watershed Evaluation, and 3) Watershed Management Plan elements of the District's Watershed Management Program (WMP) for the Lake Placid Watershed. The watershed covers an area of approximately 20 square miles and is located in Highlands County. Issues in the watershed include rapid growth, natural systems preservation, flood protection, and water quality. PROJECT DESCRIPTION Approximately ten surficial wells will be sampled for this network. Wells are sampled quarterly for the Lake Placid Water Management Plan Monitoring Network. Chemical water quality analyses are performed by the District Laboratory. Table 13 lists field and laboratory parameters collected for the Lake Placid Water Management Plan Monitoring Network, as well as field filtration and acidification protocols. Table 13. Lake Placid Water Management Plan Monitoring Network – Ground Water -
Field, Laboratory Parameters, and Bottle Types. Field Parameters
Bottle Type / Laboratory Parameters
Temperature (°C)
500 mL , plastic, not filtered, no preservation, SO4, Cl, SiO2 Alkalinity, TDS - analyzed for CGWQMN only
pH (SU)
250 mL, plastic, filtered, preserved w/HNO3 to < 2, Fe, Sr, Na, Mg, Ca, K
Specific Conductance (uS/cm)
250 mL, plastic, filtered, no preservation, Fluoride
Shell, Prairie & Joshua Creek Watersheds Water Quality Monitoring Network For information on the ground water component of the Shell, Prairie & Joshua Creek (SPJC) Watersheds Water Quality Monitoring Network refer to the SPJC section of the Resource Data / WQMP Surface Water Project Descriptions.
16
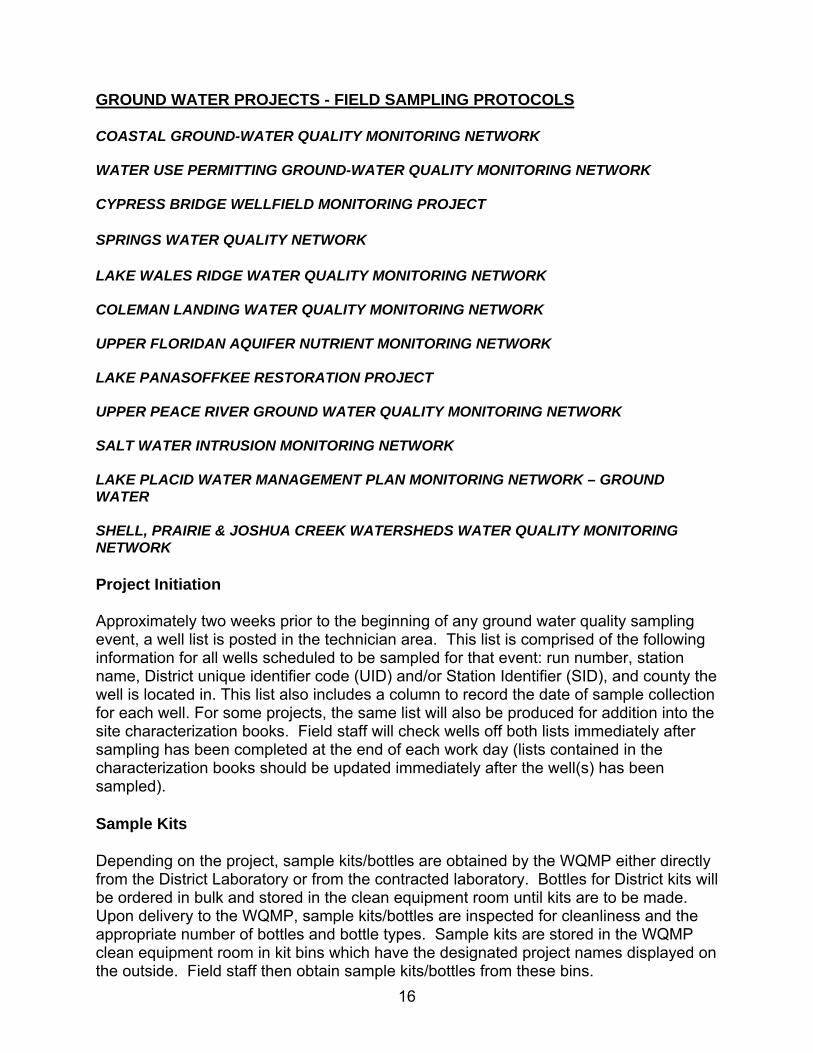
GROUND WATER PROJECTS - FIELD SAMPLING PROTOCOLS COASTAL GROUND-WATER QUALITY MONITORING NETWORK WATER USE PERMITTING GROUND-WATER QUALITY MONITORING NETWORK CYPRESS BRIDGE WELLFIELD MONITORING PROJECT SPRINGS WATER QUALITY NETWORK LAKE WALES RIDGE WATER QUALITY MONITORING NETWORK COLEMAN LANDING WATER QUALITY MONITORING NETWORK UPPER FLORIDAN AQUIFER NUTRIENT MONITORING NETWORK LAKE PANASOFFKEE RESTORATION PROJECT UPPER PEACE RIVER GROUND WATER QUALITY MONITORING NETWORK SALT WATER INTRUSION MONITORING NETWORK LAKE PLACID WATER MANAGEMENT PLAN MONITORING NETWORK – GROUND WATER SHELL, PRAIRIE & JOSHUA CREEK WATERSHEDS WATER QUALITY MONITORING NETWORK Project Initiation Approximately two weeks prior to the beginning of any ground water quality sampling event, a well list is posted in the technician area. This list is comprised of the following information for all wells scheduled to be sampled for that event: run number, station name, District unique identifier code (UID) and/or Station Identifier (SID), and county the well is located in. This list also includes a column to record the date of sample collection for each well. For some projects, the same list will also be produced for addition into the site characterization books. Field staff will check wells off both lists immediately after sampling has been completed at the end of each work day (lists contained in the characterization books should be updated immediately after the well(s) has been sampled). Sample Kits Depending on the project, sample kits/bottles are obtained by the WQMP either directly from the District Laboratory or from the contracted laboratory. Bottles for District kits will be ordered in bulk and stored in the clean equipment room until kits are to be made. Upon delivery to the WQMP, sample kits/bottles are inspected for cleanliness and the appropriate number of bottles and bottle types. Sample kits are stored in the WQMP clean equipment room in kit bins which have the designated project names displayed on the outside. Field staff then obtain sample kits/bottles from these bins.

17
Sample Equipment The necessary equipment, paper work, and miscellaneous supplies needed for ground water sample collection are listed below. This can be used by field staff as a general check-off list to insure that all required items are taken to the field each work day. A complete listing and pictorial description of sample collection and field equipment used by the WQMP can be found in Details 2 & 3.
1) Well characterization books and preprinted sample bottle labels (if labels are missing see project coordinator)
2) Field computer (including power cords and adaptors) for the recording of field measurements and relative comments and for checking historical results
3) Clipboard which includes the following: a. water level instrumentation forms b. ground water field sheets (for use if field PC is inoperable or site is new) c. calculator, writing pens, indelible labeling pens and markers d. custody sheets (if needed) e. Federal Express bills (if needed) f. spare bottle labels
4) Insulated truck bin which includes the following: a. 1,000 mL LDPE Nalgene containers each of pH 4, 7, and 10 standards b. 1,000 mL LDPE Nalgene containers each of at least two conductivity
standard solutions (standards should bracket historical conductivity values for the wells to be sampled)
c. 142 mm / 0.45 um filter papers for tripod filter (0.45 um in-line filters are used for the Lake Wales Ridge project)
d. multiprobe calibration cup (for mid-day check and/or field reference samples)
e. acid (HNO3, H2SO4, ) and pH litmus paper f. acid (NaOH, & Zn(C2H3O2)2) used only for FDACS g. freezer packs or ice will be placed in the bin during summer months
5) Sample bottles (include at least one extra set) 6) Cooler(s) of ice with temperature control bottle(s) 7) YSI multiprobe (in-house or field calibrated) with display unit and back-up 8) YSI multiprobe calibration log and user's manual
10) Turbidity meter (turbidimeter) (for wellfields and Lake Wales Ridge projects) 11) Five gallon bucket (to measure discharge rates of pumps and flowing wells) 12) Field reference samples (if assigned) 13) Sample pump(s) and hoses - based upon wells to be sampled; Teflon Redi- Flow is exclusively used on Lake Wales Ridge Project 14) Purge pump(s) and hoses - based upon wells to be sampled; Teflon Redi- Flow is exclusively used on Lake Wales Ridge Project 15) Five gallons of analyte free deionized water (an extra 20 gallons if an equipment blank will be performed) with all carboy spigots covered with protective bags 16) Equipment blank cylinder (if a blank will be performed) 17) YSI 600XLM flow box and clear flow tubing 18) Tripod filter apparatus
18
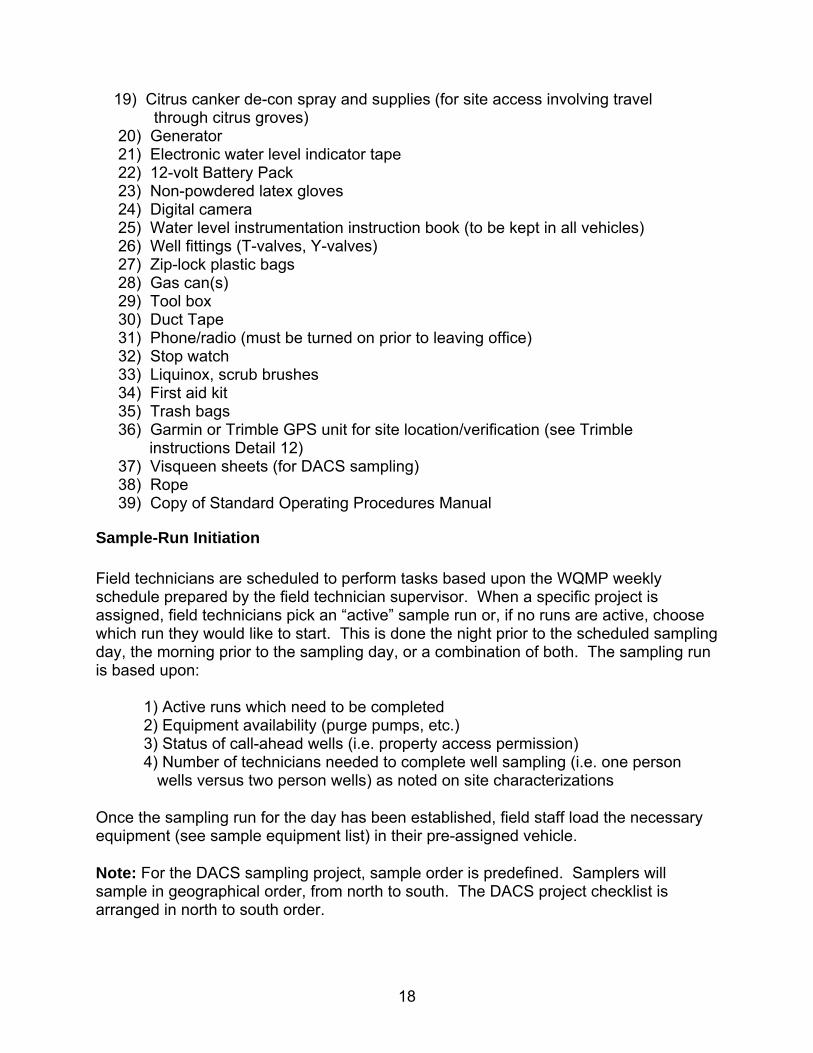
19) Citrus canker de-con spray and supplies (for site access involving travel through citrus groves) 20) Generator 21) Electronic water level indicator tape 22) 12-volt Battery Pack 23) Non-powdered latex gloves 24) Digital camera 25) Water level instrumentation instruction book (to be kept in all vehicles) 26) Well fittings (T-valves, Y-valves) 27) Zip-lock plastic bags 28) Gas can(s) 29) Tool box 30) Duct Tape 31) Phone/radio (must be turned on prior to leaving office) 32) Stop watch 33) Liquinox, scrub brushes 34) First aid kit 35) Trash bags 36) Garmin or Trimble GPS unit for site location/verification (see Trimble instructions Detail 12) 37) Visqueen sheets (for DACS sampling) 38) Rope 39) Copy of Standard Operating Procedures Manual
Sample-Run Initiation Field technicians are scheduled to perform tasks based upon the WQMP weekly schedule prepared by the field technician supervisor. When a specific project is assigned, field technicians pick an “active” sample run or, if no runs are active, choose which run they would like to start. This is done the night prior to the scheduled sampling day, the morning prior to the sampling day, or a combination of both. The sampling run is based upon:
1) Active runs which need to be completed 2) Equipment availability (purge pumps, etc.) 3) Status of call-ahead wells (i.e. property access permission) 4) Number of technicians needed to complete well sampling (i.e. one person wells versus two person wells) as noted on site characterizations
Once the sampling run for the day has been established, field staff load the necessary equipment (see sample equipment list) in their pre-assigned vehicle. Note: For the DACS sampling project, sample order is predefined. Samplers will sample in geographical order, from north to south. The DACS project checklist is arranged in north to south order.
19
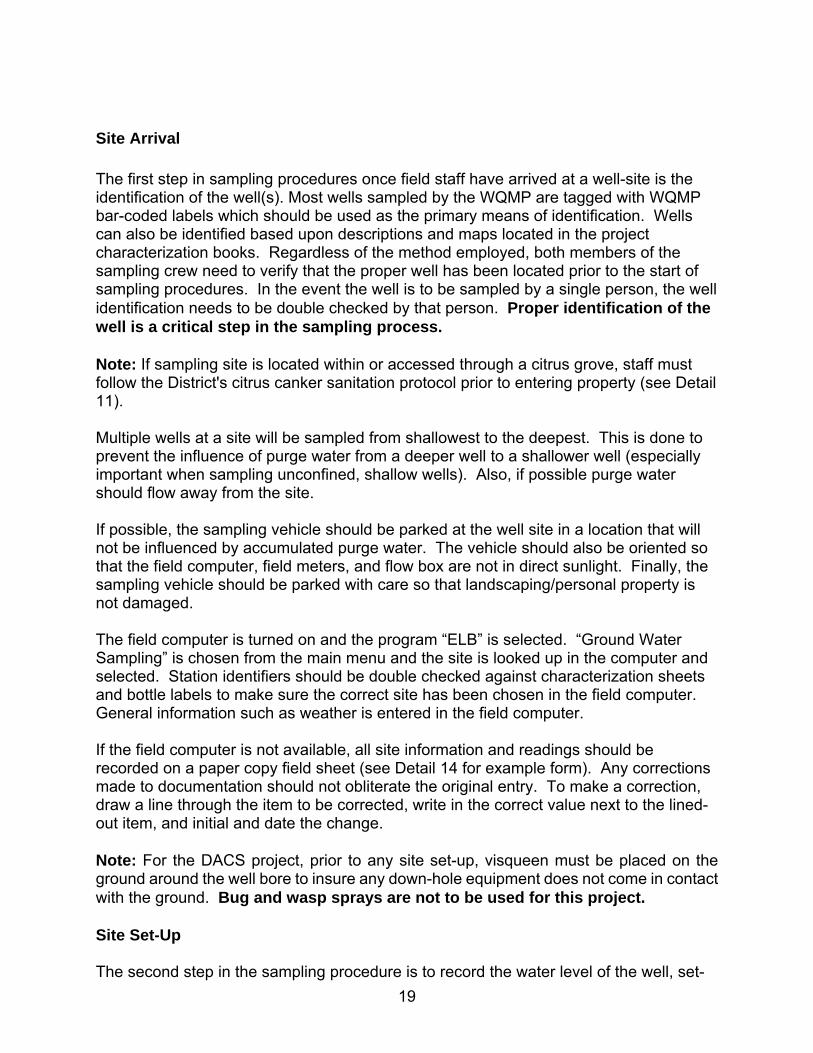
Site Arrival The first step in sampling procedures once field staff have arrived at a well-site is the identification of the well(s). Most wells sampled by the WQMP are tagged with WQMP bar-coded labels which should be used as the primary means of identification. Wells can also be identified based upon descriptions and maps located in the project characterization books. Regardless of the method employed, both members of the sampling crew need to verify that the proper well has been located prior to the start of sampling procedures. In the event the well is to be sampled by a single person, the well identification needs to be double checked by that person. Proper identification of the well is a critical step in the sampling process. Note: If sampling site is located within or accessed through a citrus grove, staff must follow the District's citrus canker sanitation protocol prior to entering property (see Detail 11). Multiple wells at a site will be sampled from shallowest to the deepest. This is done to prevent the influence of purge water from a deeper well to a shallower well (especially important when sampling unconfined, shallow wells). Also, if possible purge water should flow away from the site. If possible, the sampling vehicle should be parked at the well site in a location that will not be influenced by accumulated purge water. The vehicle should also be oriented so that the field computer, field meters, and flow box are not in direct sunlight. Finally, the sampling vehicle should be parked with care so that landscaping/personal property is not damaged. The field computer is turned on and the program “ELB” is selected. “Ground Water Sampling” is chosen from the main menu and the site is looked up in the computer and selected. Station identifiers should be double checked against characterization sheets and bottle labels to make sure the correct site has been chosen in the field computer. General information such as weather is entered in the field computer. If the field computer is not available, all site information and readings should be recorded on a paper copy field sheet (see Detail 14 for example form). Any corrections made to documentation should not obliterate the original entry. To make a correction, draw a line through the item to be corrected, write in the correct value next to the lined-out item, and initial and date the change. Note: For the DACS project, prior to any site set-up, visqueen must be placed on the ground around the well bore to insure any down-hole equipment does not come in contact with the ground. Bug and wasp sprays are not to be used for this project. Site Set-Up The second step in the sampling procedure is to record the water level of the well, set-
20
up of the purge pump, and set-up of the field meters. These steps are generally done simultaneously by a two-person sample crew. Note: For springs, it is necessary to take a depth to vent reading (when possible) in meters, to be entered in the site description screen of the ELB. When it is not possible to see the vent, the depth at which the pump head is set for sampling should be entered. Depth to Water Measurement In conjunction with the measurement of the depth to water, any water level recording instrumentation (SCADA or Campbell equipment) will be removed to access the well bore. See Detail 4 for detailed instructions on the removal of this equipment. The depth to water measurement is usually done with an electronic water level tape. Readings are measured to the nearest 100th of a foot (two decimal places). Readings are to be taken from a known measurement point at the top of the well casing. This point should be identified by a notch in the casing or markings on the well shelter floor. If no measuring point is identifiable, note the point from which the water level was obtained (i.e. north edge of casing) in the field computer and on the characterization. Two water levels will be taken, the values averaged, and the average value recorded in the field computer. If there is a difference between the readings of more than .02 feet, at least two additional readings need to be taken to determine an accurate water level. The tape should be raised above the water level in the well and then slowly lowered into the water for each reading. Readings and equipment information (i.e. agency owner and condition) will be recorded on a Water Level Instrumentation Log (see Detail 14 for example form) and the site characterization will be updated with the most current water level recorder information if necessary. Note: Flowing wells, wells with in-place pumps, and springs assume a depth to water of zero feet for the purposes of calculating purge volumes.
Purge Pump Set-up A description of each purge pump used by the WQMP can be found in Details 2 and 3. Based upon the depth to water, the total depth of the well, and the diameter of the well, the purge volume is automatically calculated in the field computer. The proper purge pump based on the purge amount, as well as the expected yield (often based on the aquifer the well penetrates) is chosen. This decision is also based upon what purge pump has been used historically at the well. It is important to attempt to use the same purge pump at a similar pumping rate as what has been used historically. Check the site characterization for the pump normally used. The purge pump used will be selected from a list in the field computer. Note: If the field computer is not available during the purge pump set-up, please see Detail 5 for instructions on manually calculating the total well volume and purge time.
21
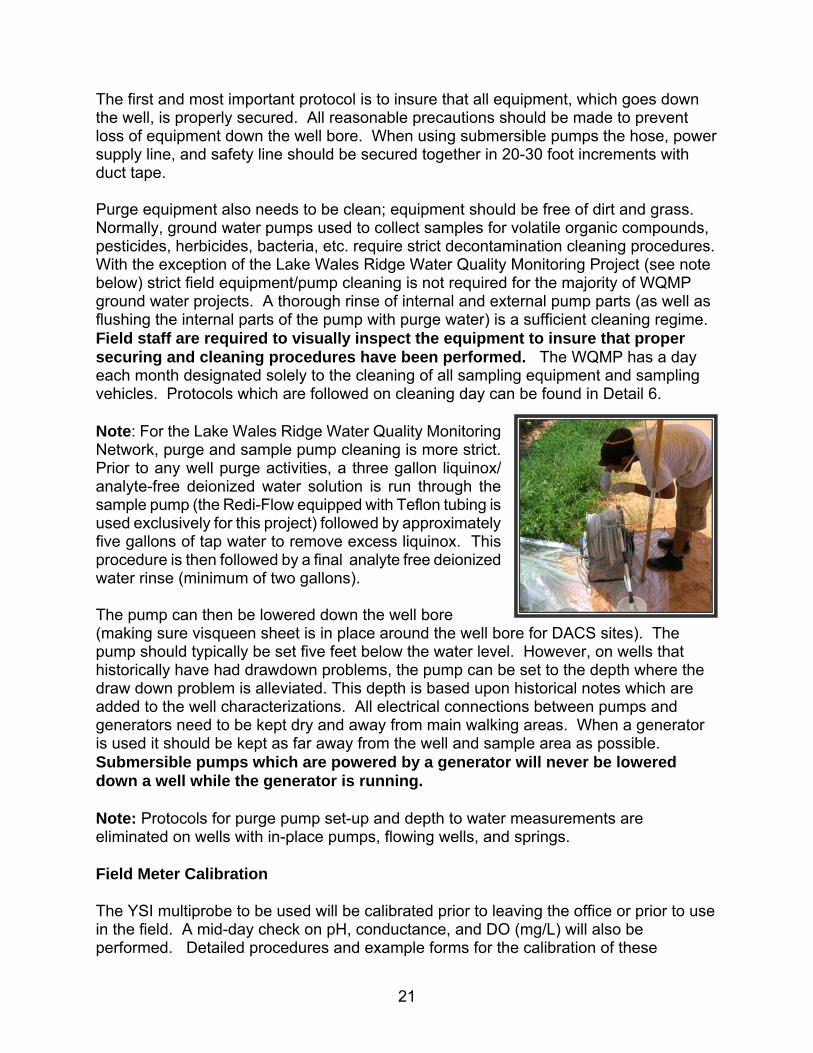
The first and most important protocol is to insure that all equipment, which goes down the well, is properly secured. All reasonable precautions should be made to prevent loss of equipment down the well bore. When using submersible pumps the hose, power supply line, and safety line should be secured together in 20-30 foot increments with duct tape. Purge equipment also needs to be clean; equipment should be free of dirt and grass. Normally, ground water pumps used to collect samples for volatile organic compounds, pesticides, herbicides, bacteria, etc. require strict decontamination cleaning procedures. With the exception of the Lake Wales Ridge Water Quality Monitoring Project (see note below) strict field equipment/pump cleaning is not required for the majority of WQMP ground water projects. A thorough rinse of internal and external pump parts (as well as flushing the internal parts of the pump with purge water) is a sufficient cleaning regime. Field staff are required to visually inspect the equipment to insure that proper securing and cleaning procedures have been performed. The WQMP has a day each month designated solely to the cleaning of all sampling equipment and sampling vehicles. Protocols which are followed on cleaning day can be found in Detail 6. Note: For the Lake Wales Ridge Water Quality Monitoring Network, purge and sample pump cleaning is more strict. Prior to any well purge activities, a three gallon liquinox/ analyte-free deionized water solution is run through the sample pump (the Redi-Flow equipped with Teflon tubing is used exclusively for this project) followed by approximately five gallons of tap water to remove excess liquinox. This procedure is then followed by a final analyte free deionized water rinse (minimum of two gallons). The pump can then be lowered down the well bore (making sure visqueen sheet is in place around the well bore for DACS sites). The pump should typically be set five feet below the water level. However, on wells that historically have had drawdown problems, the pump can be set to the depth where the draw down problem is alleviated. This depth is based upon historical notes which are added to the well characterizations. All electrical connections between pumps and generators need to be kept dry and away from main walking areas. When a generator is used it should be kept as far away from the well and sample area as possible. Submersible pumps which are powered by a generator will never be lowered down a well while the generator is running. Note: Protocols for purge pump set-up and depth to water measurements are eliminated on wells with in-place pumps, flowing wells, and springs. Field Meter Calibration The YSI multiprobe to be used will be calibrated prior to leaving the office or prior to use in the field. A mid-day check on pH, conductance, and DO (mg/L) will also be performed. Detailed procedures and example forms for the calibration of these
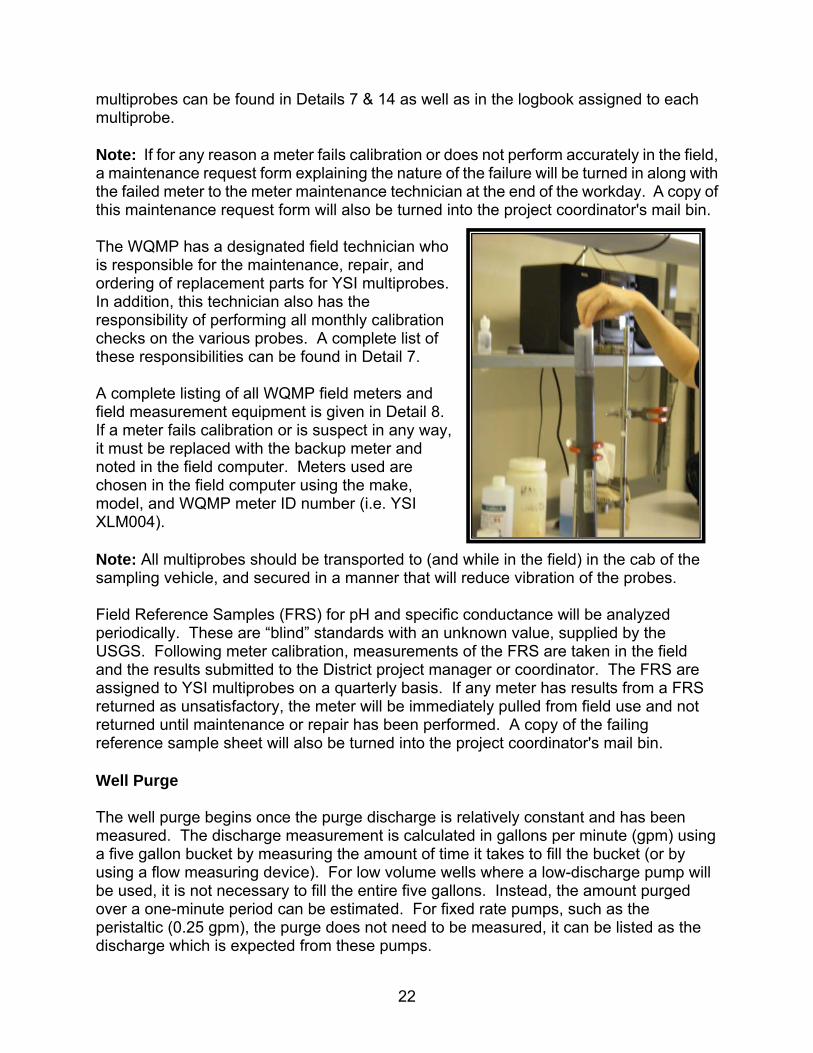
22
multiprobes can be found in Details 7 & 14 as well as in the logbook assigned to each multiprobe. Note: If for any reason a meter fails calibration or does not perform accurately in the field, a maintenance request form explaining the nature of the failure will be turned in along with the failed meter to the meter maintenance technician at the end of the workday. A copy of this maintenance request form will also be turned into the project coordinator's mail bin. The WQMP has a designated field technician who is responsible for the maintenance, repair, and ordering of replacement parts for YSI multiprobes. In addition, this technician also has the responsibility of performing all monthly calibration checks on the various probes. A complete list of these responsibilities can be found in Detail 7. A complete listing of all WQMP field meters and field measurement equipment is given in Detail 8. If a meter fails calibration or is suspect in any way, it must be replaced with the backup meter and noted in the field computer. Meters used are chosen in the field computer using the make, model, and WQMP meter ID number (i.e. YSI XLM004). Note: All multiprobes should be transported to (and while in the field) in the cab of the sampling vehicle, and secured in a manner that will reduce vibration of the probes. Field Reference Samples (FRS) for pH and specific conductance will be analyzed periodically. These are “blind” standards with an unknown value, supplied by the USGS. Following meter calibration, measurements of the FRS are taken in the field and the results submitted to the District project manager or coordinator. The FRS are assigned to YSI multiprobes on a quarterly basis. If any meter has results from a FRS returned as unsatisfactory, the meter will be immediately pulled from field use and not returned until maintenance or repair has been performed. A copy of the failing reference sample sheet will also be turned into the project coordinator's mail bin. Well Purge The well purge begins once the purge discharge is relatively constant and has been measured. The discharge measurement is calculated in gallons per minute (gpm) using a five gallon bucket by measuring the amount of time it takes to fill the bucket (or by using a flow measuring device). For low volume wells where a low-discharge pump will be used, it is not necessary to fill the entire five gallons. Instead, the amount purged over a one-minute period can be estimated. For fixed rate pumps, such as the peristaltic (0.25 gpm), the purge does not need to be measured, it can be listed as the discharge which is expected from these pumps.
23
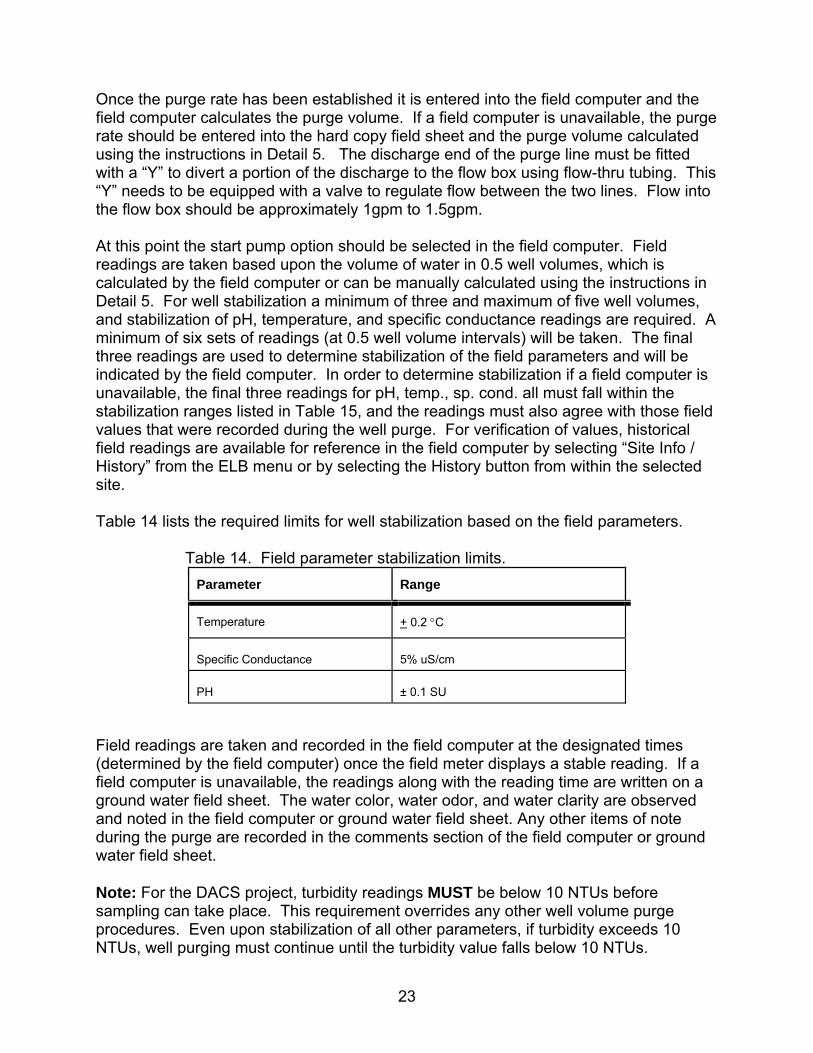
Once the purge rate has been established it is entered into the field computer and the field computer calculates the purge volume. If a field computer is unavailable, the purge rate should be entered into the hard copy field sheet and the purge volume calculated using the instructions in Detail 5. The discharge end of the purge line must be fitted with a “Y” to divert a portion of the discharge to the flow box using flow-thru tubing. This “Y” needs to be equipped with a valve to regulate flow between the two lines. Flow into the flow box should be approximately 1gpm to 1.5gpm. At this point the start pump option should be selected in the field computer. Field readings are taken based upon the volume of water in 0.5 well volumes, which is calculated by the field computer or can be manually calculated using the instructions in Detail 5. For well stabilization a minimum of three and maximum of five well volumes, and stabilization of pH, temperature, and specific conductance readings are required. A minimum of six sets of readings (at 0.5 well volume intervals) will be taken. The final three readings are used to determine stabilization of the field parameters and will be indicated by the field computer. In order to determine stabilization if a field computer is unavailable, the final three readings for pH, temp., sp. cond. all must fall within the stabilization ranges listed in Table 15, and the readings must also agree with those field values that were recorded during the well purge. For verification of values, historical field readings are available for reference in the field computer by selecting “Site Info / History” from the ELB menu or by selecting the History button from within the selected site. Table 14 lists the required limits for well stabilization based on the field parameters. Table 14. Field parameter stabilization limits.
Parameter Range
Temperature + 0.2 °C
Specific Conductance
5% uS/cm
PH
± 0.1 SU
Field readings are taken and recorded in the field computer at the designated times (determined by the field computer) once the field meter displays a stable reading. If a field computer is unavailable, the readings along with the reading time are written on a ground water field sheet. The water color, water odor, and water clarity are observed and noted in the field computer or ground water field sheet. Any other items of note during the purge are recorded in the comments section of the field computer or ground water field sheet. Note: For the DACS project, turbidity readings MUST be below 10 NTUs before sampling can take place. This requirement overrides any other well volume purge procedures. Even upon stabilization of all other parameters, if turbidity exceeds 10 NTUs, well purging must continue until the turbidity value falls below 10 NTUs.
24
Care should be taken to prevent over purging of the well. When stabilization of the field parameters has not occurred and five well volumes have been withdrawn, the decision to continue or stop the purge is made on a well by well basis. Wells that fall into this category are usually redeveloped or removed from the network. There are several deep wells sampled by the WQMP that have relatively large diameters but very low yields. These wells can take over five hours to purge. When a purge is projected to take over five hours, the WQMP has adopted a “five-hour purge rule”. This rule states that readings can be taken at 0.25 well volumes instead of 0.5 well volumes, and a total of 1.5 well volumes is all that is needed to evacuate the well. Thus, a minimum of 1.5 well volumes will be withdrawn and stabilization of field parameters will be achieved. If the five hour purge rule is used, the 0.25 well volume option should be selected in the field computer. A second condition can occur when the well is purged dry. When this occurs, the well is allowed to recover to within ten percent of its original water level and then purged dry again. The well can be sampled once it has recovered sufficiently enough to provide water for the sampling procedure. If this occurs, it is crucial that you “stop pump” in the field computer, while waiting for the well to recover and then start pump when you resume purging the well. A comment should be made in the field computer or on the handwritten field sheet if this procedure has been used. Purge water from the well must be discharged as far off-site as possible. Purge water should by no means be allowed to flood the immediate well site, especially when a shallow unconfined well is located at the site. The best alternative is to discharge purge water to an adjacent ditch, storm sewer, or low lying area off-site. Once the purge is complete (typically three well volumes evacuated and stabilization of field parameters) the purge pump can be removed from the well to be followed by a sample pump, or the purge pump now becomes the sample pump. The flow rate for sampling should be no greater than 1 gpm, if possible. If the purge pump is a submersible, it can be used as the sample pump. If a centrifugal pump is used for purging the well, it must be removed and replaced with a low-flow submersible pump (e.g. peristaltic, or Redi-Flow) for sampling. When removing a centrifugal pump, the pump must be removed from the well while it is still running and pumping water. This is done to remove any stagnant water in the well casing above the pump that has not been evacuated during the purge. This is especially important when the pump is not equipped with a check valve. Stagnant water exists above the pump because it is assumed that the pump removes water from the well below the pump’s set-depth (i.e. water above the pump will not be evacuated from the well casing). Therefore, the removal of the pump while it is running assists in removing this stagnant water. Once the pump is removed, the equipment will be rinsed with clean water (tap or deionized) if it has become significantly fouled from the well. This especially applies to purge water that has remained in the pump tubing or hose.
25
In-Place Pumps, Flowing Wells, and Springs Sampling of wells with in-place pumps, flowing wells, and springs are done in a very similar manner. For wells with in-place pumps, a point along the plumbing from which the purge and sampling will occur must be determined. This point must be located before any filtration or water treatment systems that may have been installed on the well. It should also occur before the pressure tank, if so equipped, and if possible. The purge rate is measured using a bucket. PVC or steel fittings are used to direct a portion of the purge water into the flow box. If purging and sampling occur after the pressure tank, this must be noted in the field computer for the sampling of these types of wells and springs. The sample access point must also be indicated in the field computer in the designated areas. An additional scenario associated with some in-place pumps (such as large turbine pumps on agricultural wells) is the lack of an easily accessible sample point. Sample points for all wells with in-place pumps must be identified on the characterization form so consistency can be maintained. In the case of an in-place pump, flowing well, or spring the purge volume is based upon a depth to water of zero. Purge volumes for in-place pumps are usually less than wells which require the use of a sampling pump because in many instances the pump has been used routinely (for irrigation, public supply, etc.). The frequency of use on these types of pumps should be verified prior to calculating the necessary purge volume to evacuate from the well. Purging procedures for wells with in-place pumps should be performed as follows:
1) If the pump on the well to be sampled is continuously running and the
sample can be collected prior to a tank, the valve should simply be opened and allowed to flush at maximum velocity for at least 15 minutes before field readings are collected.
2) If the pump is continuously running and a tank is located ahead of the
sample location, the purge must include the entire storage tank volume.
3) If the pump is running intermittently, it is necessary to determine, if possible, the volume to be purged, including storage/pressure tanks prior to the sampling point. The pump should then be run continuously at maximum velocity until the required volume has been purged.
Once the correct purge procedure is completed, stabilization of field readings must be confirmed. The well should be purged at 1 gpm for 15 minutes with field parameter readings (pH, temp, sp. cond.) taken at 5 minute intervals. For springs, low flow pumps such as a peristaltic are used. The pump head is placed directly in the spring vent and the discharge line attached to the flow-box. Purge volumes for springs are also less (usually 15 minutes) because in most cases springs are a constantly flowing feature.
26
Note: Once the purge is complete, it may not be possible to lower the flow rate to 1 gpm prior to collecting the sample. When this occurs, comment the situation in the field computer.
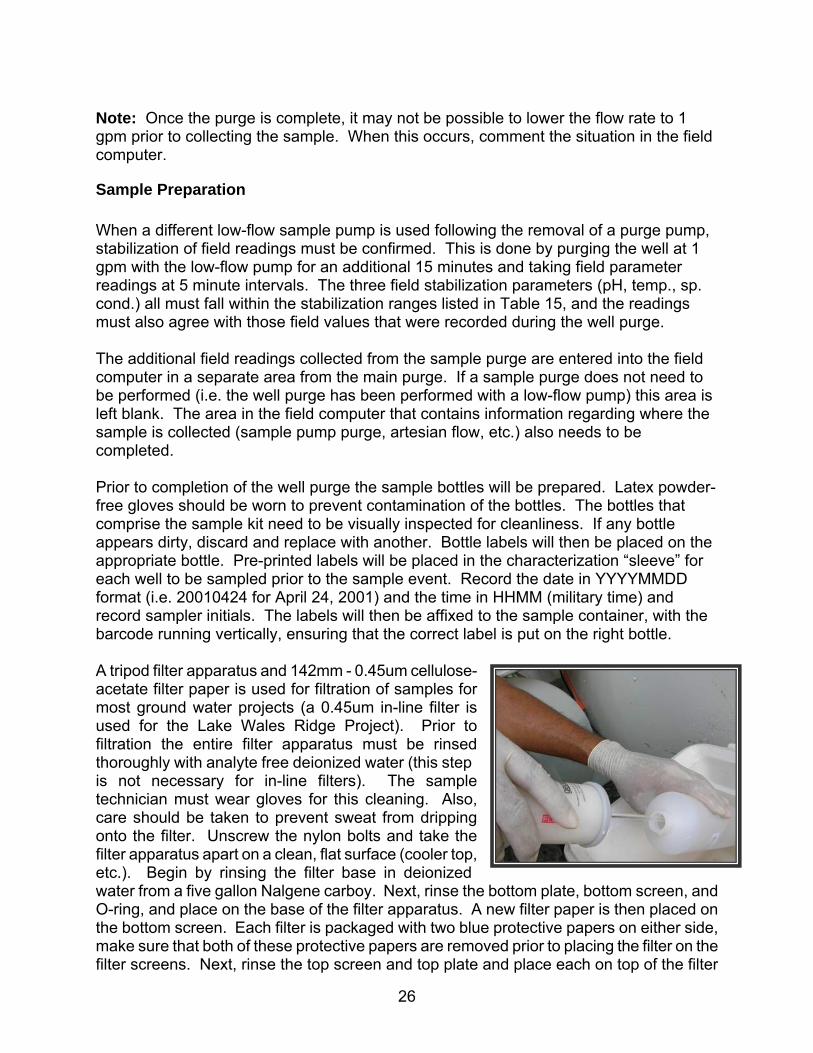
Sample Preparation When a different low-flow sample pump is used following the removal of a purge pump, stabilization of field readings must be confirmed. This is done by purging the well at 1 gpm with the low-flow pump for an additional 15 minutes and taking field parameter readings at 5 minute intervals. The three field stabilization parameters (pH, temp., sp. cond.) all must fall within the stabilization ranges listed in Table 15, and the readings must also agree with those field values that were recorded during the well purge. The additional field readings collected from the sample purge are entered into the field computer in a separate area from the main purge. If a sample purge does not need to be performed (i.e. the well purge has been performed with a low-flow pump) this area is left blank. The area in the field computer that contains information regarding where the sample is collected (sample pump purge, artesian flow, etc.) also needs to be completed. Prior to completion of the well purge the sample bottles will be prepared. Latex powder-free gloves should be worn to prevent contamination of the bottles. The bottles that comprise the sample kit need to be visually inspected for cleanliness. If any bottle appears dirty, discard and replace with another. Bottle labels will then be placed on the appropriate bottle. Pre-printed labels will be placed in the characterization “sleeve” for each well to be sampled prior to the sample event. Record the date in YYYYMMDD format (i.e. 20010424 for April 24, 2001) and the time in HHMM (military time) and record sampler initials. The labels will then be affixed to the sample container, with the barcode running vertically, ensuring that the correct label is put on the right bottle. A tripod filter apparatus and 142mm - 0.45um cellulose-acetate filter paper is used for filtration of samples for most ground water projects (a 0.45um in-line filter is used for the Lake Wales Ridge Project). Prior to filtration the entire filter apparatus must be rinsed thoroughly with analyte free deionized water (this step is not necessary for in-line filters). The sample technician must wear gloves for this cleaning. Also, care should be taken to prevent sweat from dripping onto the filter. Unscrew the nylon bolts and take the filter apparatus apart on a clean, flat surface (cooler top, etc.). Begin by rinsing the filter base in deionized water from a five gallon Nalgene carboy. Next, rinse the bottom plate, bottom screen, and O-ring, and place on the base of the filter apparatus. A new filter paper is then placed on the bottom screen. Each filter is packaged with two blue protective papers on either side, make sure that both of these protective papers are removed prior to placing the filter on the filter screens. Next, rinse the top screen and top plate and place each on top of the filter

27
paper. Tighten the nylon bolts and set aside in a clean, shaded area until use. It is important that the O-ring be seated correctly to prevent leakage of water along seams.
Sample Collection Flow from the sample pump, in-place pump, or artesian well discharge will be reduced to 1 gpm. The flow will be routed from the pump, in-place pump plumbing, or flowing well plumbing via clear-flow PVC tubing. This tubing must be visually clean and unstained (iron discoloration, bacteria and algal growth, surface area dirt, and grass are the most common problems). Refer to Tables 4 through 13 for bottle types and parameters collected for each ground water project. Samplers will wear gloves during the collection of all samples. If possible, sample collection will be done in an area located out of direct sunlight, wind, and rain. Collect all unfiltered bottles first from the discharge line using 50-100 mL’s of sample water as an initial rinse. Replace the cap and gently shake the bottle and then discard the water. Fill the sample bottle with source sample water leaving a slight head space. Filtered samples are collected next. Connect the discharge sample line to the tripod filter and allow water to flow through the filter for approximately 30 seconds to remove any deionized water or unwanted residue from the filter. If leakage occurs around the seams of the filter tighten the nylon bolts. If this does not stop the leakage, follow the steps in cleaning the filter again and be sure the O-ring is seated correctly. Place the first bottle to be filtered beneath the tripod filter and add 50-100 mL’s of sample water to the bottle as a rinse. Gently shake this water in the bottle with the cap on and then discard the water. Place the bottle beneath the filter and fill (leave a slight head space). Repeat this procedure for any additional filtered bottles. Care should be taken to not touch the mouth or inner edge of the sample bottles. Following sample collection keep the sample bottles out of direct sunlight. Bottles that do not require acidification can be immediately placed in ice. Sample Acidification Powder-free latex gloves must be worn throughout the sample acidification process. All acids can cause burns and will damage clothing. Gloves and eye protection must be used. Do not breathe acid fumes. A detailed explanation of storage and disposal protocols for acids, buffers, and other standards used by the WQMP can be found in Detail 9. If possible, keep all acids and sample bottles out of direct sunlight. Identify the sample bottle(s) (red dot on lid) to be preserved with sulfuric acid (H2SO4). This acid is kept in a teflon dropper bottle that has red banding. Note the final field measured pH reading as this may affect the amount of acid needed (e.g. pre-acidified samples with lower pH values will require less acid to reach a pH of <2). The objective with acidification is to add the least amount of H2SO4 to bring the sample down to a pH <2. Start by adding a few drops of
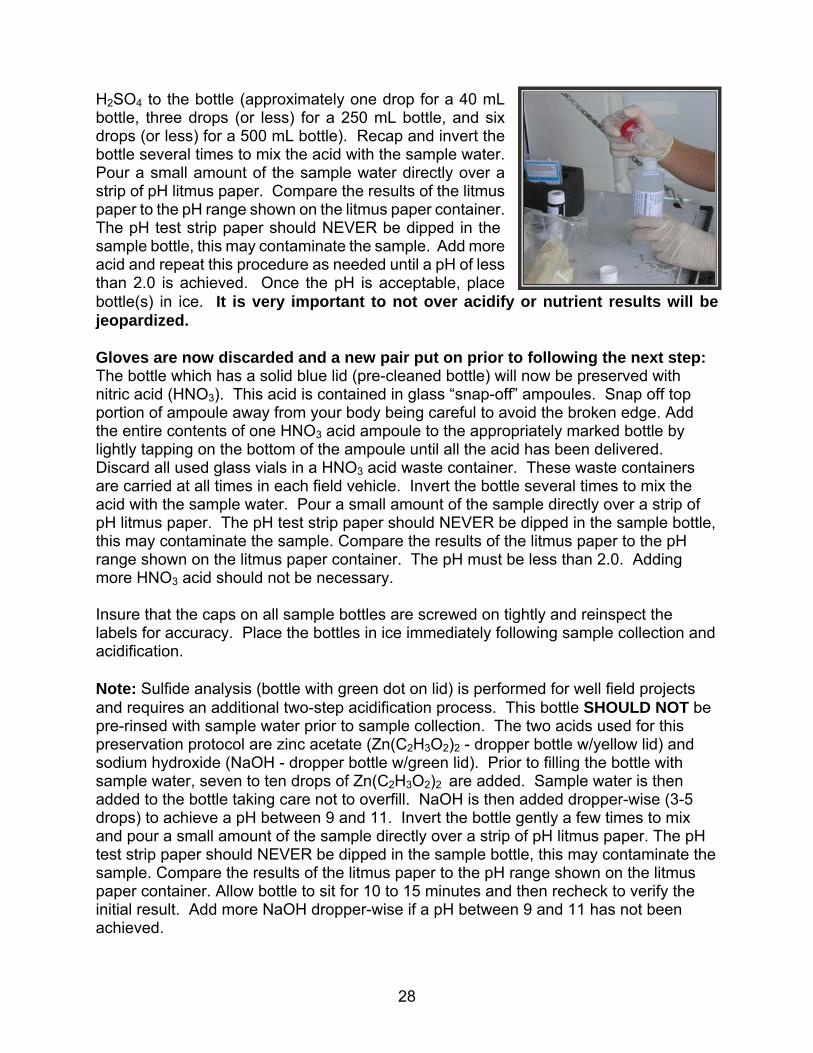
28
H2SO4 to the bottle (approximately one drop for a 40 mL bottle, three drops (or less) for a 250 mL bottle, and six drops (or less) for a 500 mL bottle). Recap and invert the bottle several times to mix the acid with the sample water. Pour a small amount of the sample water directly over a strip of pH litmus paper. Compare the results of the litmus paper to the pH range shown on the litmus paper container. The pH test strip paper should NEVER be dipped in the sample bottle, this may contaminate the sample. Add more acid and repeat this procedure as needed until a pH of less than 2.0 is achieved. Once the pH is acceptable, place bottle(s) in ice. It is very important to not over acidify or nutrient results will be jeopardized. Gloves are now discarded and a new pair put on prior to following the next step: The bottle which has a solid blue lid (pre-cleaned bottle) will now be preserved with nitric acid (HNO3). This acid is contained in glass “snap-off” ampoules. Snap off top portion of ampoule away from your body being careful to avoid the broken edge. Add the entire contents of one HNO3 acid ampoule to the appropriately marked bottle by lightly tapping on the bottom of the ampoule until all the acid has been delivered. Discard all used glass vials in a HNO3 acid waste container. These waste containers are carried at all times in each field vehicle. Invert the bottle several times to mix the acid with the sample water. Pour a small amount of the sample directly over a strip of pH litmus paper. The pH test strip paper should NEVER be dipped in the sample bottle, this may contaminate the sample. Compare the results of the litmus paper to the pH range shown on the litmus paper container. The pH must be less than 2.0. Adding more HNO3 acid should not be necessary. Insure that the caps on all sample bottles are screwed on tightly and reinspect the labels for accuracy. Place the bottles in ice immediately following sample collection and acidification. Note: Sulfide analysis (bottle with green dot on lid) is performed for well field projects and requires an additional two-step acidification process. This bottle SHOULD NOT be pre-rinsed with sample water prior to sample collection. The two acids used for this preservation protocol are zinc acetate (Zn(C2H3O2)2 - dropper bottle w/yellow lid) and sodium hydroxide (NaOH - dropper bottle w/green lid). Prior to filling the bottle with sample water, seven to ten drops of Zn(C2H3O2)2 are added. Sample water is then added to the bottle taking care not to overfill. NaOH is then added dropper-wise (3-5 drops) to achieve a pH between 9 and 11. Invert the bottle gently a few times to mix and pour a small amount of the sample directly over a strip of pH litmus paper. The pH test strip paper should NEVER be dipped in the sample bottle, this may contaminate the sample. Compare the results of the litmus paper to the pH range shown on the litmus paper container. Allow bottle to sit for 10 to 15 minutes and then recheck to verify the initial result. Add more NaOH dropper-wise if a pH between 9 and 11 has not been achieved.
29
Duplicate and Blank Sample Collection The number of duplicate and blank samples collected will be ten percent of total samples collected for the entire event (i.e. if 100 samples will be collected, five duplicates and five equipment blanks will be collected). For ground water projects, these QA samples will usually be assigned to a particular well site or well run and are noted on the project event check-off list. The duplicate labels will be in the “sleeve” of the appropriate characterization with the original set of labels. Quality assurance samples will be collected at an even frequency throughout the sampling event. The duplicate sample is intended as a check of “repeatability” for laboratory analyses and field sampling protocols. A duplicate sample is obtained at a site by duplicating, in rapid succession, the entire sample collection procedure that was used to obtain the first sample. For ground water duplicates, one kit of containers will be filled with sample water from the pump and preserved appropriately. Then a second kit will be filled from the pump and preserved filling the bottles in the same order as the original sample kit. The duplicate should be recorded in the field computer’s QA section. Duplicate samples are assigned a different sample time and sample ID (if using pre-printed labels) than the original sample so the samples can be distinguished from each other. The sample time should be corrected in the field computer to match the time written on the duplicate bottle labels. Note: For the Lake Wales Ridge Project the same 0.045um in-line filter should be used for both the original sample and the duplicate sample. Equipment blanks will be taken on precleaned and/or field cleaned equipment. Data from equipment blank results reflect how thoroughly equipment is cleaned and also insure that contamination is not carried over between well sites. Equipment blanks are usually pre-assigned to specific runs but can be done at any well in that run. Make sure that a low-flow sample pump will be used at the well site where the equipment blank sample will be collected. For example, a well that is purged and sampled with a 2 inch grundfos is not a reasonable site for an equipment blank sample. The same holds true for flowing wells and wells with in-place pumps. The equipment blank is collected by running analyte free deionized water through all equipment that has been used to collect the real sample at that site. The following procedure should be used:
1) Thoroughly rinse and clean outside areas of pump heads and pump
tubing/hoses with analyte free deionized water. Repeat this process with the tripod filter apparatus if filtered samples will be collected.
2) Fill a Teflon “equipment blank tube” with analyte free deionized water and
one to two drops of Liquinox.
3) Put the sample pump head into the tube and run analyte free deionized water through the pump using the following protocol for each specific
30
pump used (continue to replace water in the tube as the pump draws down the water level):
a) Redi-flow and whale pumps - flush 15 gallons through pump prior to collecting equipment blank sample.
b) Peristaltic pumps - flush 2.5 gallons through pump prior to
collecting equipment blank sample.
4) Five gallons of analyte free deionized water will be reserved for collection of the equipment blank sample. To fill blank sample bottles follow sample collection protocols given for each project. Filter and acidify as specified for the project.
Sample bottles used for equipment blank sample collection should be labeled with the appropriate labels assigned to that run. The sample labels also need to contain the date, time and samplers initials. The equipment blank should be recorded in the field computer’s QA section. Post Sampling Procedures Following completion of sample collection procedures, the pump used will be rinsed and/or flushed with deionized water if sampling has resulted in the pump becoming fouled or filled with discolored purge water. All meters will be rinsed with deionized water and stored properly. The well site area will be left clean, including the removal of all trash (even if it is not yours). Any small maintenance items that need to be done at the well site should now be performed (e.g. lubrication of locks, etc). Any major maintenance that needs to be performed at the site will be recorded on a “request for well maintenance form” and given to the field supervisor. Take pictures and record comments as needed to assist in identifying any problem(s). If water level instrumentation devices were disassembled prior to sampling of the well, these devices will need to be reassembled (see Detail 4 for instructions). Any changes at the well site since the last time it was visited will be updated in the characterization book (including new locks, access routes, directions to site, contact persons, etc.). If necessary, new pictures of the site should be taken to be added to the characterization book. Note: For the DACS sampling network updated site photos (north, south, east, west, and general) are required yearly. Final Paperwork and Sample Shipment Upon returning to the office at the end of the day, the samples need to be prepared for shipment and the appropriate paperwork printed and stored. Plug the field computer into the AC adapter so the computer does not shut off during printing. Also, confirm that the field computer is attached to the network and that the correct printer is selected as the default in your printer settings. Once in the ELB software, “output options” should be selected from the main menu. Next select “Ground Water Data Sheets”; the sites
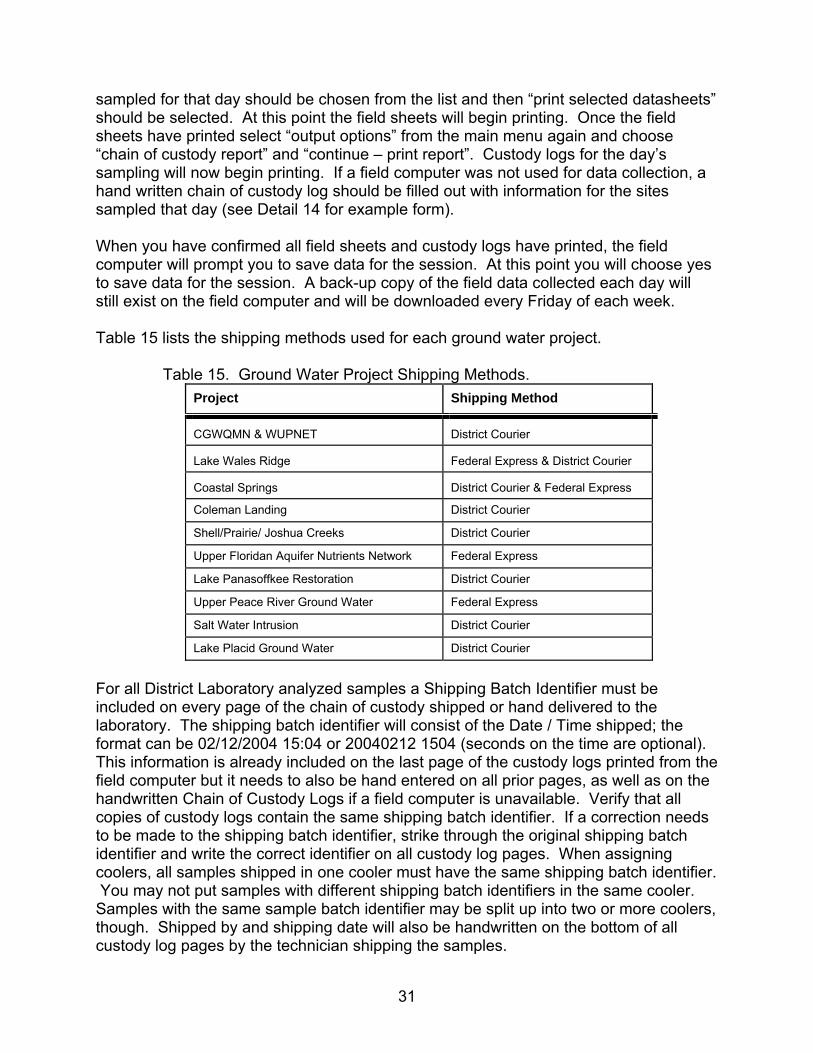
31
sampled for that day should be chosen from the list and then “print selected datasheets” should be selected. At this point the field sheets will begin printing. Once the field sheets have printed select “output options” from the main menu again and choose “chain of custody report” and “continue – print report”. Custody logs for the day’s sampling will now begin printing. If a field computer was not used for data collection, a hand written chain of custody log should be filled out with information for the sites sampled that day (see Detail 14 for example form). When you have confirmed all field sheets and custody logs have printed, the field computer will prompt you to save data for the session. At this point you will choose yes to save data for the session. A back-up copy of the field data collected each day will still exist on the field computer and will be downloaded every Friday of each week. Table 15 lists the shipping methods used for each ground water project. Table 15. Ground Water Project Shipping Methods.
Project Shipping Method
CGWQMN & WUPNET District Courier Lake Wales Ridge Federal Express & District Courier Coastal Springs District Courier & Federal Express Coleman Landing District Courier
Shell/Prairie/ Joshua Creeks District Courier
Upper Floridan Aquifer Nutrients Network Federal Express
Lake Panasoffkee Restoration District Courier
Upper Peace River Ground Water Federal Express
Salt Water Intrusion District Courier
Lake Placid Ground Water District Courier
For all District Laboratory analyzed samples a Shipping Batch Identifier must be included on every page of the chain of custody shipped or hand delivered to the laboratory. The shipping batch identifier will consist of the Date / Time shipped; the format can be 02/12/2004 15:04 or 20040212 1504 (seconds on the time are optional). This information is already included on the last page of the custody logs printed from the field computer but it needs to also be hand entered on all prior pages, as well as on the handwritten Chain of Custody Logs if a field computer is unavailable. Verify that all copies of custody logs contain the same shipping batch identifier. If a correction needs to be made to the shipping batch identifier, strike through the original shipping batch identifier and write the correct identifier on all custody log pages. When assigning coolers, all samples shipped in one cooler must have the same shipping batch identifier. You may not put samples with different shipping batch identifiers in the same cooler. Samples with the same sample batch identifier may be split up into two or more coolers, though. Shipped by and shipping date will also be handwritten on the bottom of all custody log pages by the technician shipping the samples.
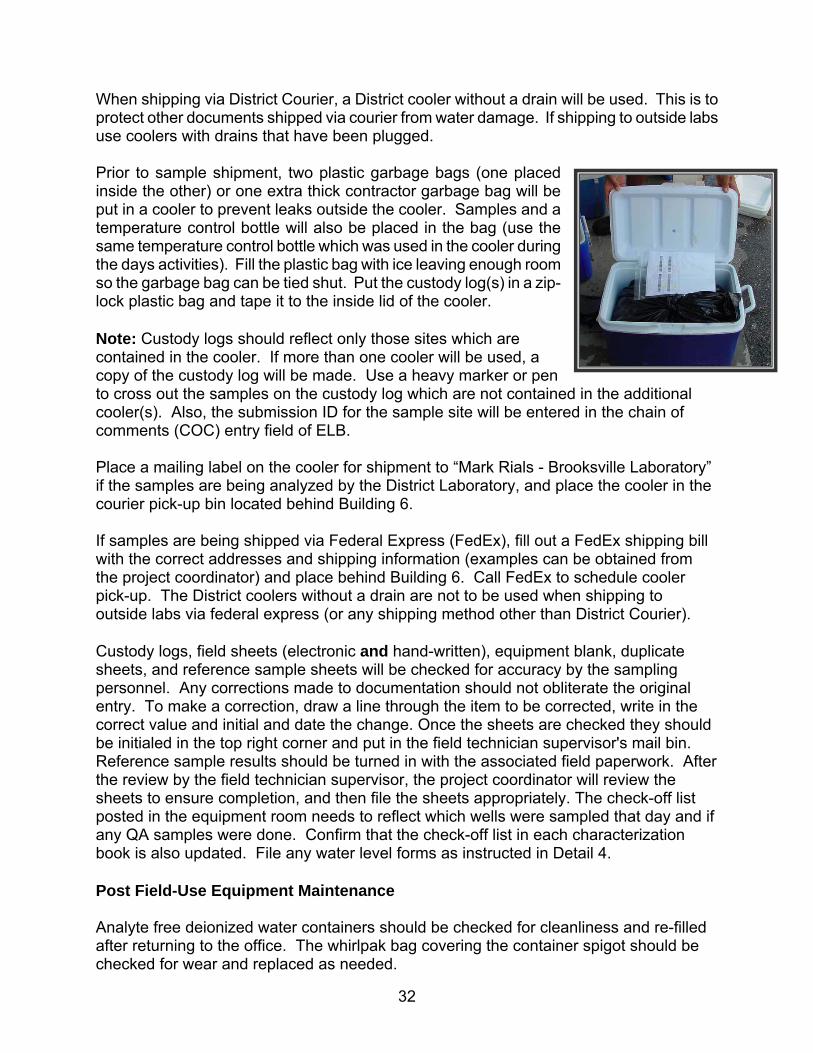
32
When shipping via District Courier, a District cooler without a drain will be used. This is to protect other documents shipped via courier from water damage. If shipping to outside labs use coolers with drains that have been plugged. Prior to sample shipment, two plastic garbage bags (one placed inside the other) or one extra thick contractor garbage bag will be put in a cooler to prevent leaks outside the cooler. Samples and a temperature control bottle will also be placed in the bag (use the same temperature control bottle which was used in the cooler during the days activities). Fill the plastic bag with ice leaving enough room so the garbage bag can be tied shut. Put the custody log(s) in a zip-lock plastic bag and tape it to the inside lid of the cooler. Note: Custody logs should reflect only those sites which are contained in the cooler. If more than one cooler will be used, a copy of the custody log will be made. Use a heavy marker or pen to cross out the samples on the custody log which are not contained in the additional cooler(s). Also, the submission ID for the sample site will be entered in the chain of comments (COC) entry field of ELB. Place a mailing label on the cooler for shipment to “Mark Rials - Brooksville Laboratory” if the samples are being analyzed by the District Laboratory, and place the cooler in the courier pick-up bin located behind Building 6. If samples are being shipped via Federal Express (FedEx), fill out a FedEx shipping bill with the correct addresses and shipping information (examples can be obtained from the project coordinator) and place behind Building 6. Call FedEx to schedule cooler pick-up. The District coolers without a drain are not to be used when shipping to outside labs via federal express (or any shipping method other than District Courier). Custody logs, field sheets (electronic and hand-written), equipment blank, duplicate sheets, and reference sample sheets will be checked for accuracy by the sampling personnel. Any corrections made to documentation should not obliterate the original entry. To make a correction, draw a line through the item to be corrected, write in the correct value and initial and date the change. Once the sheets are checked they should be initialed in the top right corner and put in the field technician supervisor's mail bin. Reference sample results should be turned in with the associated field paperwork. After the review by the field technician supervisor, the project coordinator will review the sheets to ensure completion, and then file the sheets appropriately. The check-off list posted in the equipment room needs to reflect which wells were sampled that day and if any QA samples were done. Confirm that the check-off list in each characterization book is also updated. File any water level forms as instructed in Detail 4. Post Field-Use Equipment Maintenance Analyte free deionized water containers should be checked for cleanliness and re-filled after returning to the office. The whirlpak bag covering the container spigot should be checked for wear and replaced as needed.
33
All acids, pH/conductivity standards, and field meters will be removed from the sampling vehicle and placed in the clean equipment room at the end of each work day. Vehicles should be swept out and all trash thrown away. All multiprobes will be post checked following each sampling day and the appropriate log sheet filled out. If for any reason the multiprobe does not pass the post check, an incident report must be filled out. The sonde and report should then be given to the meter maintenance technician. Any problems associated with the day's activities (equipment, a well purge, a well site, field computer, vehicle, etc.) should be reported immediately to the field sampling supervisor or project coordinator. Planning for the next day’s activities can now begin.
34
WQMP SURFACE WATER PROJECT DESCRIPTIONS Peace River Water Quality Monitoring Network Project: W527 Basin: Peace River Myakka River Water Quality Monitoring Network Project: W528 Basin: Manasota, Peace River Stream Water Quality Monitoring Network Project: Basin: Alafia River, Coastal Rivers, Green Swamp, Hillsborough River, Manasota, Peace River, Withlacoochee River PURPOSE The Peace River, Myakka River, and Stream Water Quality surface-water monitoring networks were developed to support resource management decisions through the collection of monthly water quality samples at selected stream gaging stations in the Peace and Myakka Rivers, and other basins throughout the District. These data are used to determine pollutant loads, characterize water quality conditions, and monitor changes or trends in water quality over time. PROJECT DESCRIPTION Samples are currently collected at eight stations along the main stem and tributaries of the Peace River, and five stations along the Myakka River on a monthly basis. Thirty stations are monitored for the CWM Network, also on a monthly frequency, and are located in Sarasota, Polk, Citrus, Hernando, Hillsborough, and Sumter counties. Monthly monitoring for the Peace and Myakka Rivers and Stream Water Quality projects occurs during the same time period - usually the first week of every month. Sample kits and sample collection protocols for these projects are the same. The Peace and Myakka Rivers and Stream Water Quality project sites are split into nine “runs” based on the geographical location of the sites. Chemical water quality analyses for the Peace and Myakka Rivers and Stream Water Quality projects are performed by the District Laboratory. Table 16 lists field and laboratory parameters collected for the Peace and Myakka Rivers and Stream Water Quality projects, as well as field filtration and acidification protocols.
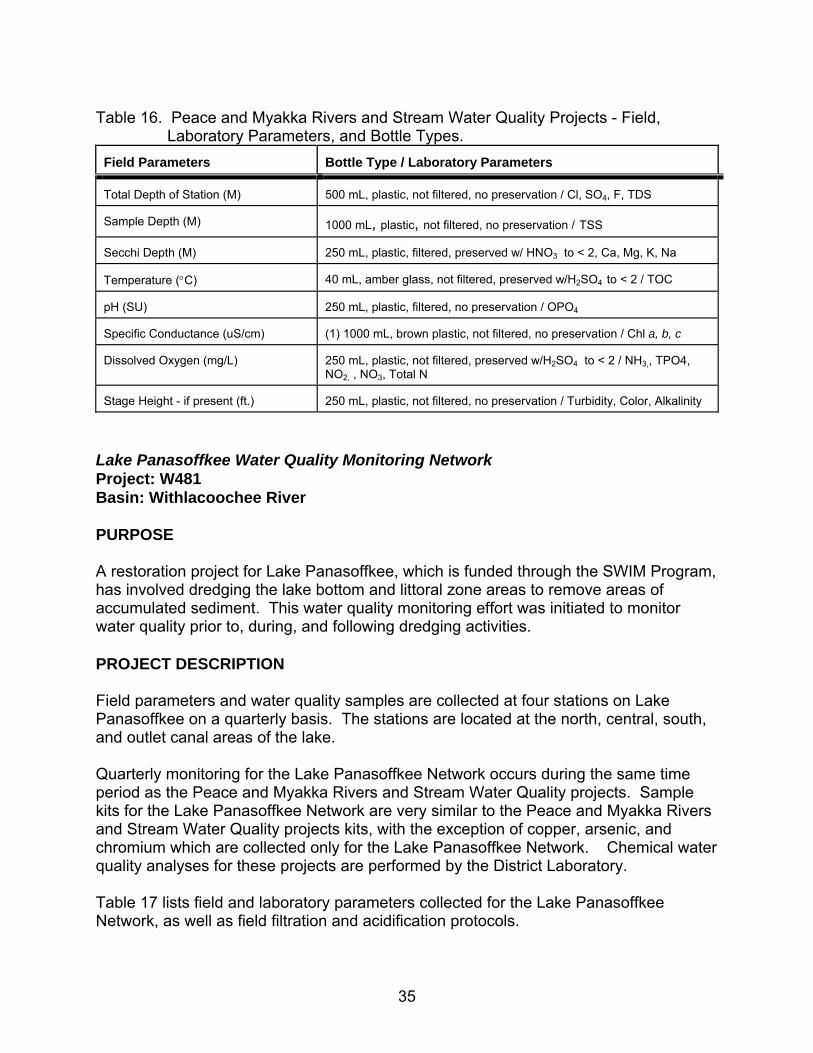
35
Table 16. Peace and Myakka Rivers and Stream Water Quality Projects - Field,
Laboratory Parameters, and Bottle Types. Field Parameters
Bottle Type / Laboratory Parameters
Total Depth of Station (M)
500 mL, plastic, not filtered, no preservation / Cl, SO4, F, TDS
Sample Depth (M)
1000 mL, plastic, not filtered, no preservation / TSS
Secchi Depth (M)
250 mL, plastic, filtered, preserved w/ HNO3 to < 2, Ca, Mg, K, Na
Temperature (°C)
40 mL, amber glass, not filtered, preserved w/H2SO4 to < 2 / TOC
pH (SU)
250 mL, plastic, filtered, no preservation / OPO4
Specific Conductance (uS/cm)
(1) 1000 mL, brown plastic, not filtered, no preservation / Chl a, b, c
Dissolved Oxygen (mg/L)
250 mL, plastic, not filtered, preserved w/H2SO4 to < 2 / NH3,, TPO4, NO2, , NO3, Total N
Stage Height - if present (ft.)
250 mL, plastic, not filtered, no preservation / Turbidity, Color, Alkalinity
Lake Panasoffkee Water Quality Monitoring Network Project: W481 Basin: Withlacoochee River PURPOSE A restoration project for Lake Panasoffkee, which is funded through the SWIM Program, has involved dredging the lake bottom and littoral zone areas to remove areas of accumulated sediment. This water quality monitoring effort was initiated to monitor water quality prior to, during, and following dredging activities. PROJECT DESCRIPTION Field parameters and water quality samples are collected at four stations on Lake Panasoffkee on a quarterly basis. The stations are located at the north, central, south, and outlet canal areas of the lake. Quarterly monitoring for the Lake Panasoffkee Network occurs during the same time period as the Peace and Myakka Rivers and Stream Water Quality projects. Sample kits for the Lake Panasoffkee Network are very similar to the Peace and Myakka Rivers and Stream Water Quality projects kits, with the exception of copper, arsenic, and chromium which are collected only for the Lake Panasoffkee Network. Chemical water quality analyses for these projects are performed by the District Laboratory. Table 17 lists field and laboratory parameters collected for the Lake Panasoffkee Network, as well as field filtration and acidification protocols.
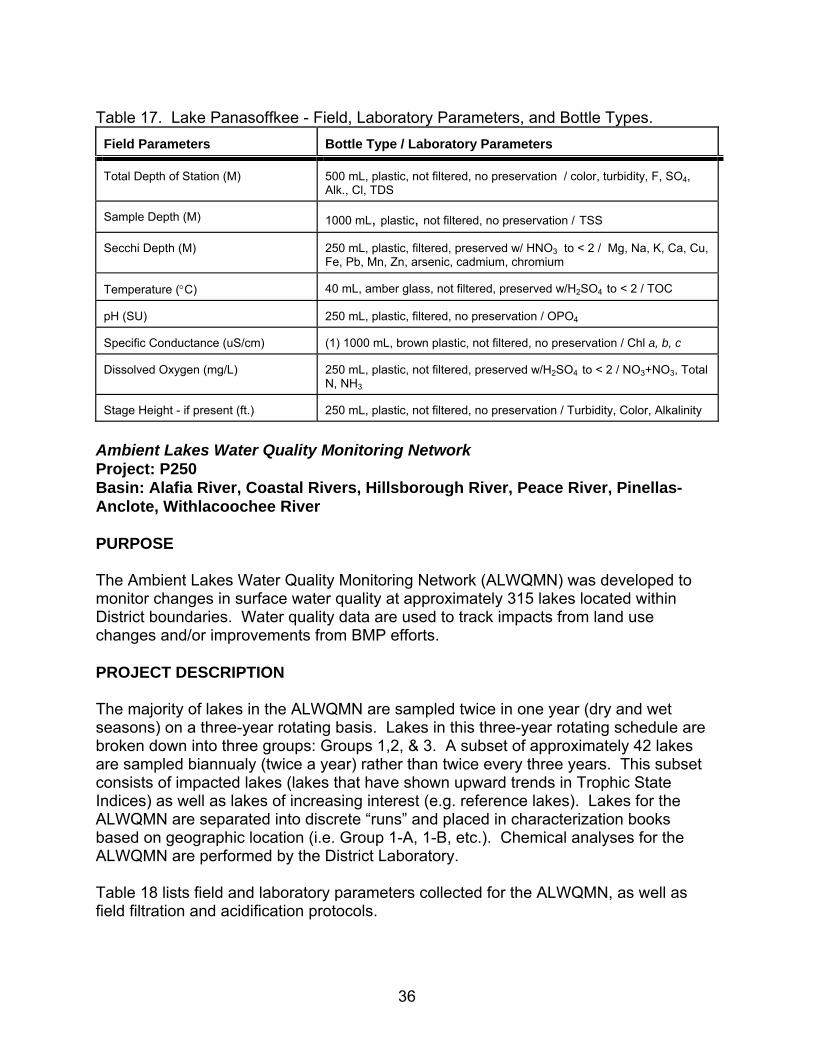
36
Table 17. Lake Panasoffkee - Field, Laboratory Parameters, and Bottle Types. Field Parameters
Bottle Type / Laboratory Parameters
Total Depth of Station (M)
500 mL, plastic, not filtered, no preservation / color, turbidity, F, SO4, Alk., Cl, TDS
Sample Depth (M)
1000 mL, plastic, not filtered, no preservation / TSS
Secchi Depth (M)
250 mL, plastic, filtered, preserved w/ HNO3 to < 2 / Mg, Na, K, Ca, Cu, Fe, Pb, Mn, Zn, arsenic, cadmium, chromium
Temperature (°C)
40 mL, amber glass, not filtered, preserved w/H2SO4 to < 2 / TOC
pH (SU)
250 mL, plastic, filtered, no preservation / OPO4
Specific Conductance (uS/cm)
(1) 1000 mL, brown plastic, not filtered, no preservation / Chl a, b, c
Dissolved Oxygen (mg/L)
250 mL, plastic, not filtered, preserved w/H2SO4 to < 2 / NO3+NO3, Total N, NH3
Stage Height - if present (ft.)
250 mL, plastic, not filtered, no preservation / Turbidity, Color, Alkalinity
Ambient Lakes Water Quality Monitoring Network Project: P250 Basin: Alafia River, Coastal Rivers, Hillsborough River, Peace River, Pinellas-Anclote, Withlacoochee River PURPOSE The Ambient Lakes Water Quality Monitoring Network (ALWQMN) was developed to monitor changes in surface water quality at approximately 315 lakes located within District boundaries. Water quality data are used to track impacts from land use changes and/or improvements from BMP efforts. PROJECT DESCRIPTION The majority of lakes in the ALWQMN are sampled twice in one year (dry and wet seasons) on a three-year rotating basis. Lakes in this three-year rotating schedule are broken down into three groups: Groups 1,2, & 3. A subset of approximately 42 lakes are sampled biannualy (twice a year) rather than twice every three years. This subset consists of impacted lakes (lakes that have shown upward trends in Trophic State Indices) as well as lakes of increasing interest (e.g. reference lakes). Lakes for the ALWQMN are separated into discrete “runs” and placed in characterization books based on geographic location (i.e. Group 1-A, 1-B, etc.). Chemical analyses for the ALWQMN are performed by the District Laboratory. Table 18 lists field and laboratory parameters collected for the ALWQMN, as well as field filtration and acidification protocols.
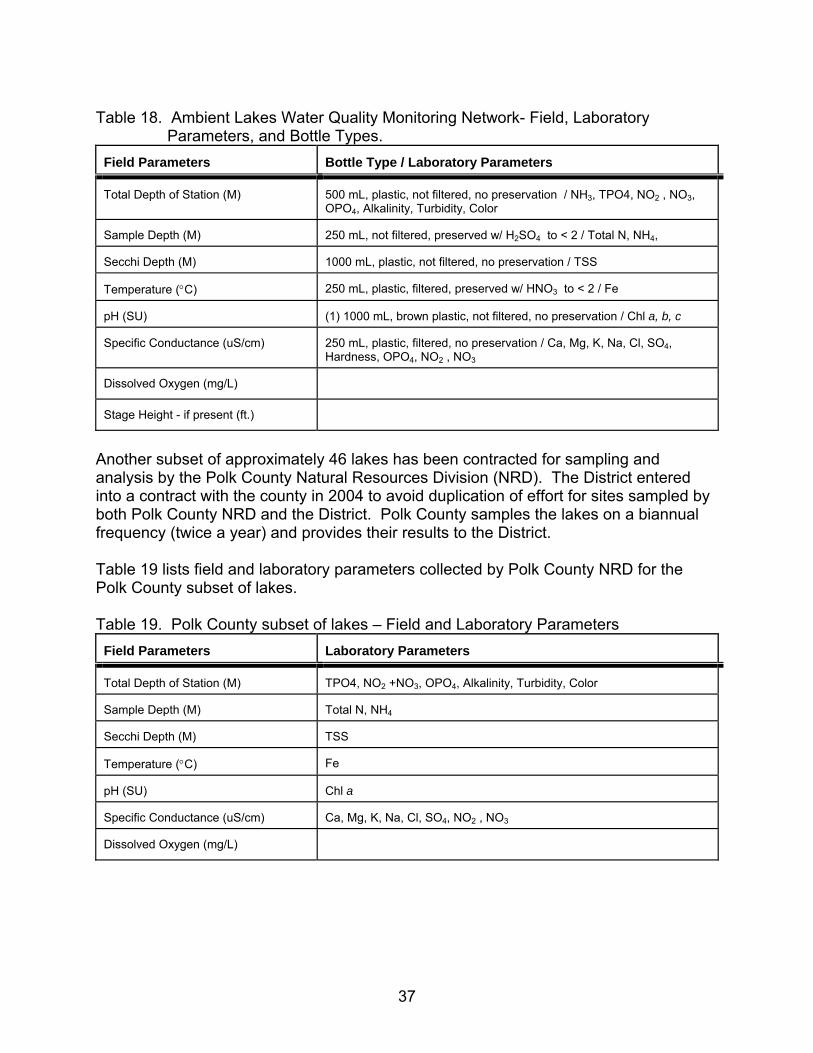
37
Table 18. Ambient Lakes Water Quality Monitoring Network- Field, Laboratory
Parameters, and Bottle Types. Field Parameters
Bottle Type / Laboratory Parameters
Total Depth of Station (M)
500 mL, plastic, not filtered, no preservation / NH3, TPO4, NO2 , NO3, OPO4, Alkalinity, Turbidity, Color
Sample Depth (M)
250 mL, not filtered, preserved w/ H2SO4 to < 2 / Total N, NH4,
Secchi Depth (M)
1000 mL, plastic, not filtered, no preservation / TSS
Temperature (°C)
250 mL, plastic, filtered, preserved w/ HNO3 to < 2 / Fe
pH (SU)
(1) 1000 mL, brown plastic, not filtered, no preservation / Chl a, b, c
Specific Conductance (uS/cm)
250 mL, plastic, filtered, no preservation / Ca, Mg, K, Na, Cl, SO4, Hardness, OPO4, NO2 , NO3
Dissolved Oxygen (mg/L)
Stage Height - if present (ft.)
Another subset of approximately 46 lakes has been contracted for sampling and analysis by the Polk County Natural Resources Division (NRD). The District entered into a contract with the county in 2004 to avoid duplication of effort for sites sampled by both Polk County NRD and the District. Polk County samples the lakes on a biannual frequency (twice a year) and provides their results to the District. Table 19 lists field and laboratory parameters collected by Polk County NRD for the Polk County subset of lakes. Table 19. Polk County subset of lakes – Field and Laboratory Parameters Field Parameters
Laboratory Parameters
Total Depth of Station (M)
TPO4, NO2 +NO3, OPO4, Alkalinity, Turbidity, Color
Sample Depth (M)
Total N, NH4
Secchi Depth (M)
TSS
Temperature (°C)
Fe
pH (SU)
Chl a
Specific Conductance (uS/cm)
Ca, Mg, K, Na, Cl, SO4, NO2 , NO3
Dissolved Oxygen (mg/L)
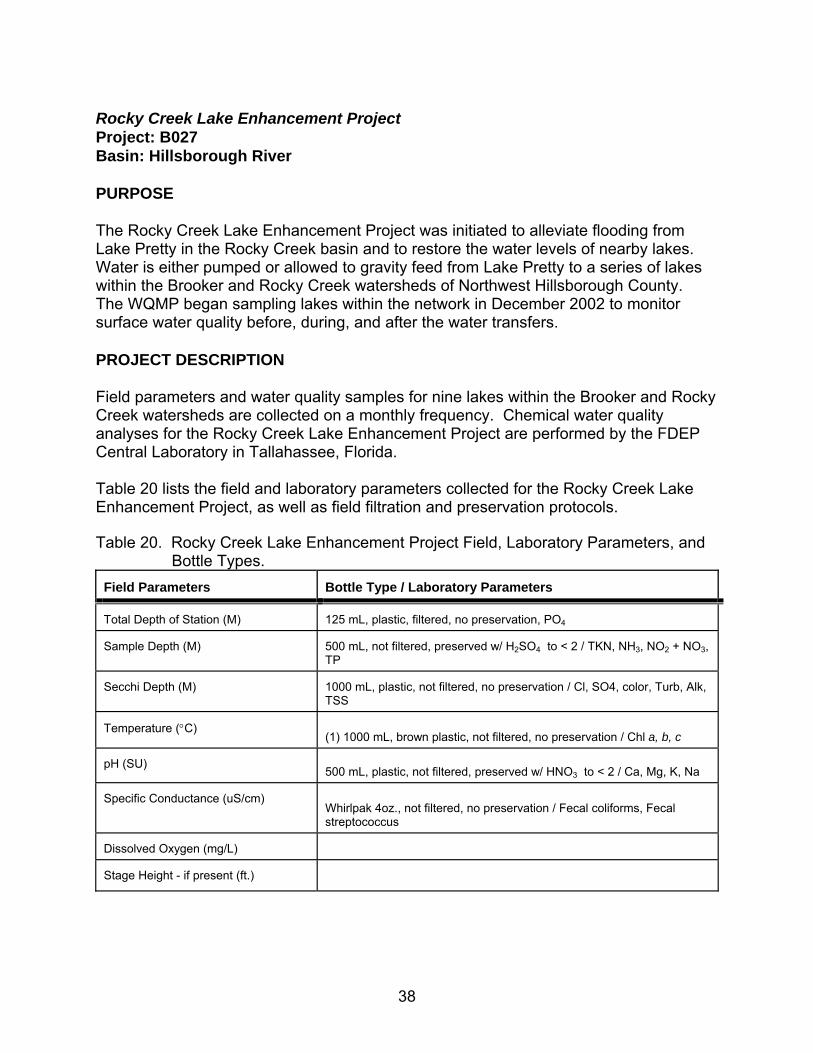
38
Rocky Creek Lake Enhancement Project Project: B027 Basin: Hillsborough River PURPOSE The Rocky Creek Lake Enhancement Project was initiated to alleviate flooding from Lake Pretty in the Rocky Creek basin and to restore the water levels of nearby lakes. Water is either pumped or allowed to gravity feed from Lake Pretty to a series of lakes within the Brooker and Rocky Creek watersheds of Northwest Hillsborough County. The WQMP began sampling lakes within the network in December 2002 to monitor surface water quality before, during, and after the water transfers. PROJECT DESCRIPTION Field parameters and water quality samples for nine lakes within the Brooker and Rocky Creek watersheds are collected on a monthly frequency. Chemical water quality analyses for the Rocky Creek Lake Enhancement Project are performed by the FDEP Central Laboratory in Tallahassee, Florida. Table 20 lists the field and laboratory parameters collected for the Rocky Creek Lake Enhancement Project, as well as field filtration and preservation protocols. Table 20. Rocky Creek Lake Enhancement Project Field, Laboratory Parameters, and
Bottle Types. Field Parameters
Bottle Type / Laboratory Parameters
Total Depth of Station (M)
125 mL, plastic, filtered, no preservation, PO4
Sample Depth (M)
500 mL, not filtered, preserved w/ H2SO4 to < 2 / TKN, NH3, NO2 + NO3, TP
Secchi Depth (M)
1000 mL, plastic, not filtered, no preservation / Cl, SO4, color, Turb, Alk, TSS
Temperature (°C)
(1) 1000 mL, brown plastic, not filtered, no preservation / Chl a, b, c
pH (SU)
500 mL, plastic, not filtered, preserved w/ HNO3 to < 2 / Ca, Mg, K, Na Specific Conductance (uS/cm)
Whirlpak 4oz., not filtered, no preservation / Fecal coliforms, Fecal streptococcus
Dissolved Oxygen (mg/L)
Stage Height - if present (ft.)
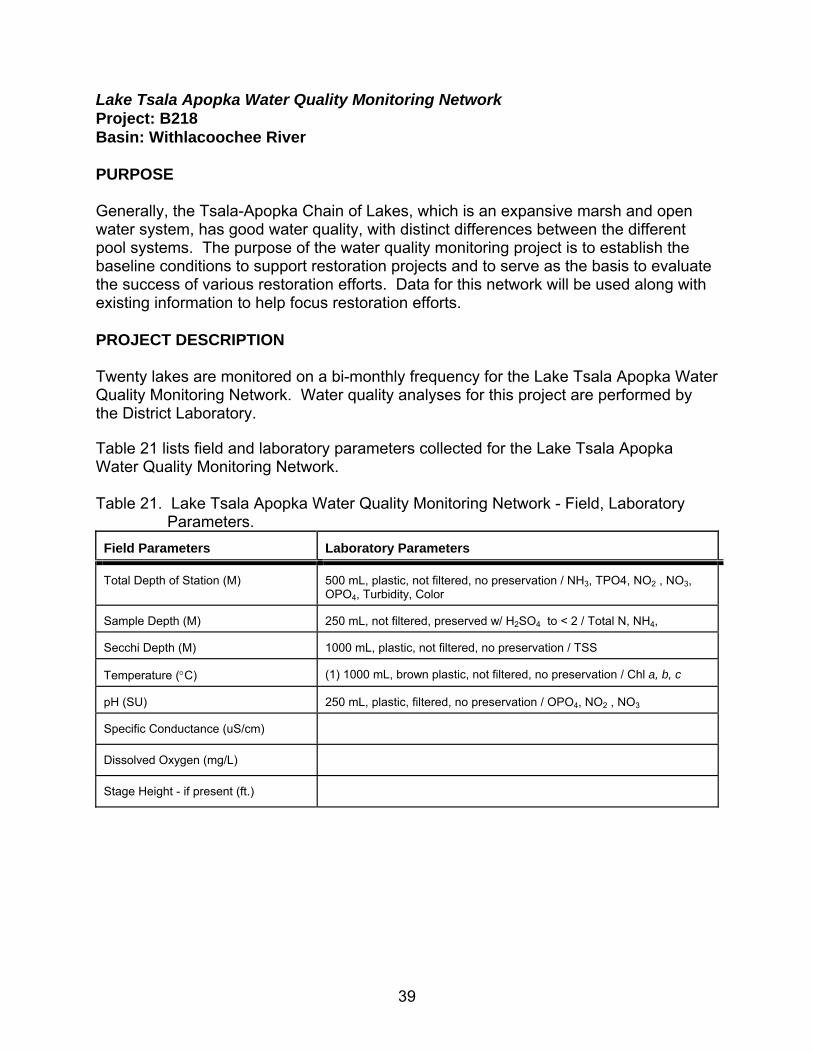
39
Lake Tsala Apopka Water Quality Monitoring Network Project: B218 Basin: Withlacoochee River PURPOSE Generally, the Tsala-Apopka Chain of Lakes, which is an expansive marsh and open water system, has good water quality, with distinct differences between the different pool systems. The purpose of the water quality monitoring project is to establish the baseline conditions to support restoration projects and to serve as the basis to evaluate the success of various restoration efforts. Data for this network will be used along with existing information to help focus restoration efforts. PROJECT DESCRIPTION Twenty lakes are monitored on a bi-monthly frequency for the Lake Tsala Apopka Water Quality Monitoring Network. Water quality analyses for this project are performed by the District Laboratory. Table 21 lists field and laboratory parameters collected for the Lake Tsala Apopka Water Quality Monitoring Network. Table 21. Lake Tsala Apopka Water Quality Monitoring Network - Field, Laboratory
Parameters. Field Parameters
Laboratory Parameters
Total Depth of Station (M)
500 mL, plastic, not filtered, no preservation / NH3, TPO4, NO2 , NO3, OPO4, Turbidity, Color
Sample Depth (M)
250 mL, not filtered, preserved w/ H2SO4 to < 2 / Total N, NH4,
Secchi Depth (M)
1000 mL, plastic, not filtered, no preservation / TSS
Temperature (°C)
(1) 1000 mL, brown plastic, not filtered, no preservation / Chl a, b, c
pH (SU)
250 mL, plastic, filtered, no preservation / OPO4, NO2 , NO3
Specific Conductance (uS/cm)
Dissolved Oxygen (mg/L)
Stage Height - if present (ft.)
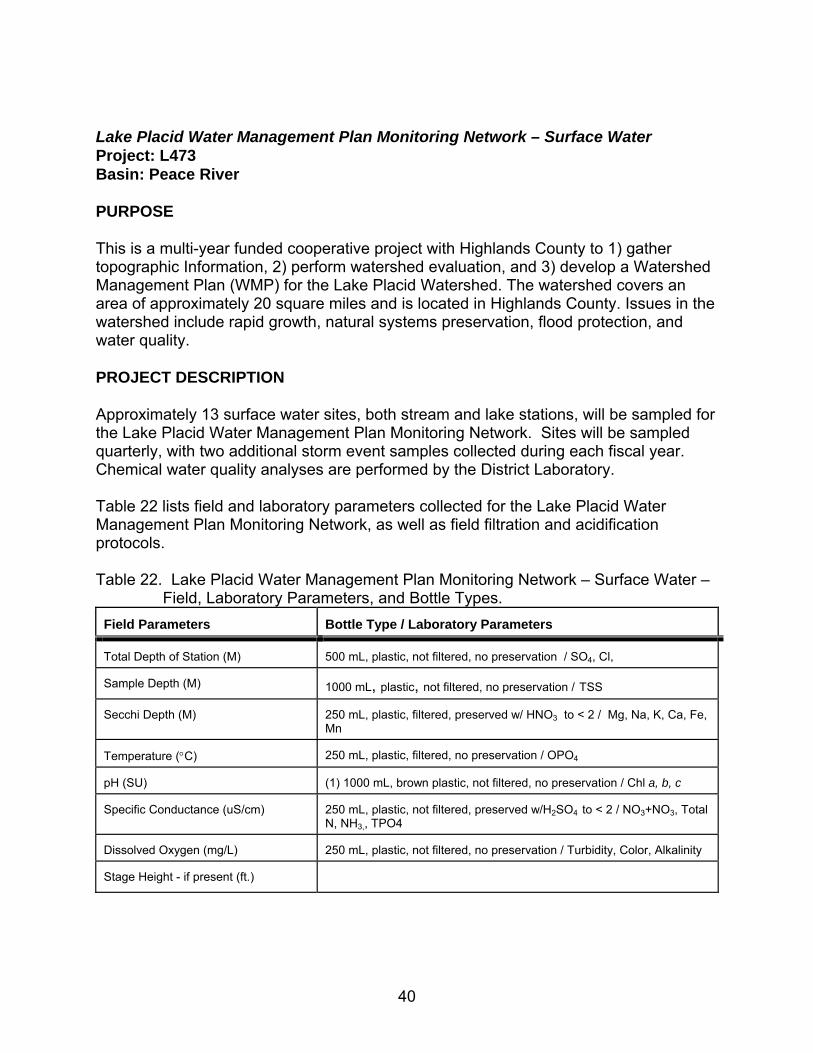
40
Lake Placid Water Management Plan Monitoring Network – Surface Water Project: L473 Basin: Peace River PURPOSE This is a multi-year funded cooperative project with Highlands County to 1) gather topographic Information, 2) perform watershed evaluation, and 3) develop a Watershed Management Plan (WMP) for the Lake Placid Watershed. The watershed covers an area of approximately 20 square miles and is located in Highlands County. Issues in the watershed include rapid growth, natural systems preservation, flood protection, and water quality. PROJECT DESCRIPTION Approximately 13 surface water sites, both stream and lake stations, will be sampled for the Lake Placid Water Management Plan Monitoring Network. Sites will be sampled quarterly, with two additional storm event samples collected during each fiscal year. Chemical water quality analyses are performed by the District Laboratory. Table 22 lists field and laboratory parameters collected for the Lake Placid Water Management Plan Monitoring Network, as well as field filtration and acidification protocols. Table 22. Lake Placid Water Management Plan Monitoring Network – Surface Water –
Field, Laboratory Parameters, and Bottle Types. Field Parameters
Bottle Type / Laboratory Parameters
Total Depth of Station (M)
500 mL, plastic, not filtered, no preservation / SO4, Cl,
Sample Depth (M)
1000 mL, plastic, not filtered, no preservation / TSS
Secchi Depth (M)
250 mL, plastic, filtered, preserved w/ HNO3 to < 2 / Mg, Na, K, Ca, Fe, Mn
Temperature (°C)
250 mL, plastic, filtered, no preservation / OPO4
pH (SU)
(1) 1000 mL, brown plastic, not filtered, no preservation / Chl a, b, c
Specific Conductance (uS/cm)
250 mL, plastic, not filtered, preserved w/H2SO4 to < 2 / NO3+NO3, Total N, NH3,, TPO4
Dissolved Oxygen (mg/L)
250 mL, plastic, not filtered, no preservation / Turbidity, Color, Alkalinity
Stage Height - if present (ft.)
41
Shell, Prairie & Joshua Creek Watersheds Water Quality Monitoring Network Project: H017 Basin: Alafia River, Hillsborough River, Manasota, Peace River, Withlacoochee River PURPOSE During the drought years of 1999, 2000, and 2001, declining trends in water quality in Shell and Prairie Creeks resulted in decreasing trends in water quality in the City of Punta Gorda's Shell Creek Reservoir. The source of the poor water reaching the reservoir is ground water pumped from the deep, highly productive portion of the Floridan aquifer. Agricultural wells utilize this poor water quality zone to obtain the yields necessary to meet their irrigation demands and to provide frost/freeze protection Two programs have been developed to improve surface water quality within the region. The first program is a well back-plugging program. Back-plugging to a recommended well depth will help sustain surface water resources for public supplies and assist in maintaining ground-water resources for the agricultural community. Qualified property owners are eligible for some or all reimbursement costs (not to exceed $6,000 per well and $18,000 annually per landowner) to have deep artesian wells back-plugged, and for costs (not to exceed $1,500per well) to have their pumps pulled and reset. The amount reimbursed is determined by the well's diameter and back plug amount. This reimbursement program is a 50/50 match between the Peace Basin and Governing Board. The second program is the Facilitating Agricultural Resource Management Systems (FARMS) Program. This program is an agricultural BMP cost-share reimbursement program that involves both water quantity and water quality aspects. It is intended to expedite the implementation of production-scale, field demonstration agricultural BMPs that will provide water resource benefits. The FARMS Program is a public/private partnership program developed by the District and the FDACS. The purpose of the FARMS initiative is to implement agricultural BMPs that will provide resource benefits that include water quality improvement; reduced upper Floridian aquifer withdrawals; and/or conserve, restore, or augment the area's water resources and ecology. Water quality monitoring in the SPJC has been initiated for four reasons:
1) Water quality data collected from agricultural water-use-permit wells allows project managers to determine which wells in the SPJC watersheds exhibit poor water quality (e.g. elevated levels of specific conductivity, chloride, and total dissolved solids). These wells, if proven to have poor water quality, are then scheduled for back-plugging.
2) Following back-plugging activities, water quality data are collected to determine if the well back-plugs have resulted in an improvement in water quality.
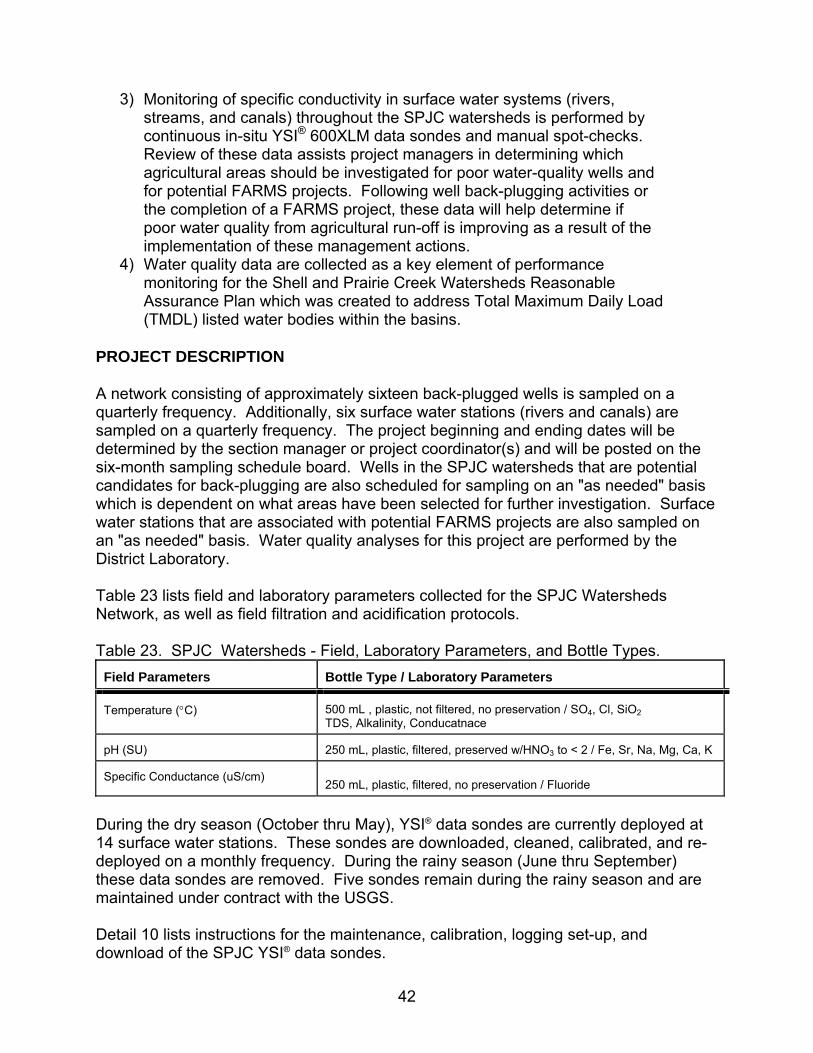
42
3) Monitoring of specific conductivity in surface water systems (rivers, streams, and canals) throughout the SPJC watersheds is performed by continuous in-situ YSI® 600XLM data sondes and manual spot-checks. Review of these data assists project managers in determining which agricultural areas should be investigated for poor water-quality wells and for potential FARMS projects. Following well back-plugging activities or the completion of a FARMS project, these data will help determine if poor water quality from agricultural run-off is improving as a result of the implementation of these management actions.
4) Water quality data are collected as a key element of performance monitoring for the Shell and Prairie Creek Watersheds Reasonable Assurance Plan which was created to address Total Maximum Daily Load(TMDL) listed water bodies within the basins.
PROJECT DESCRIPTION A network consisting of approximately sixteen back-plugged wells is sampled on a quarterly frequency. Additionally, six surface water stations (rivers and canals) are sampled on a quarterly frequency. The project beginning and ending dates will be determined by the section manager or project coordinator(s) and will be posted on the six-month sampling schedule board. Wells in the SPJC watersheds that are potential candidates for back-plugging are also scheduled for sampling on an "as needed" basis which is dependent on what areas have been selected for further investigation. Surface water stations that are associated with potential FARMS projects are also sampled on an "as needed" basis. Water quality analyses for this project are performed by the District Laboratory. Table 23 lists field and laboratory parameters collected for the SPJC Watersheds Network, as well as field filtration and acidification protocols. Table 23. SPJC Watersheds - Field, Laboratory Parameters, and Bottle Types. Field Parameters
Bottle Type / Laboratory Parameters
Temperature (°C)
500 mL , plastic, not filtered, no preservation / SO4, Cl, SiO2 TDS, Alkalinity, Conducatnace
pH (SU)
250 mL, plastic, filtered, preserved w/HNO3 to < 2 / Fe, Sr, Na, Mg, Ca, K
Specific Conductance (uS/cm)
250 mL, plastic, filtered, no preservation / Fluoride
During the dry season (October thru May), YSI® data sondes are currently deployed at 14 surface water stations. These sondes are downloaded, cleaned, calibrated, and re-deployed on a monthly frequency. During the rainy season (June thru September) these data sondes are removed. Five sondes remain during the rainy season and are maintained under contract with the USGS. Detail 10 lists instructions for the maintenance, calibration, logging set-up, and download of the SPJC YSI® data sondes.
43
SURFACE WATER PROJECTS - FIELD SAMPLING PROTOCOLS PEACE RIVER WATER QUALITY MONITORING NETWORK MYAKKA RIVER WATER QUALITY MONITORING NETWORK STREAM WATER QUALITY MONITORING NETWORK LAKE PANASOFFKEE WATER QUALITY MONITORING PROJECT AMBIENT LAKES WATER QUALITY MONITORING NETWORK ROCKY CREEK LAKE ENHANCEMENT PROJECT LAKE TSALA APOPKA WATER QUALITY MONITORING PROJECT LAKE PLACID WATER MANAGEMENT PLAN MONITORING NETWORK -SURFACE WATER SHELL, PRAIRIE & JOSHUA CREEK WATERSHEDS WATER QUALITY MONITORING NETWORK Project Initiation Approximately two weeks prior to any project begin date, a site list will be posted in the technician area. This list is comprised of the following information for all surface water sites scheduled to be sampled for that event: run number, station name, District unique identifier code (UID), and county the site is located in. This list also includes a column to record the date of sample collection for each site. Field staff will check sites off these lists immediately after sampling has been completed at the end of each workday. Habitat assessments and Stream Condition Indexes (SCIs) will also be performed routinely on qualified surface water sites. See Detail 13 for more information. Sample Kits Sample kits/bottles are obtained by the WQMP either directly from the District Laboratory or from the contracted laboratory. Bottles for District kits will be ordered in bulk and stored in the clean equipment room until kits are to be made. Upon delivery to the WQMP, sample kits/bottles are inspected for cleanliness and the appropriate number of bottles and bottle types. If necessary, bottles are sorted into kits. Sample kits are stored in the WQMP “clean" equipment room in kit bins which have the designated project names displayed on the outside. Field staff then obtain sample kits/bottles from these bins.
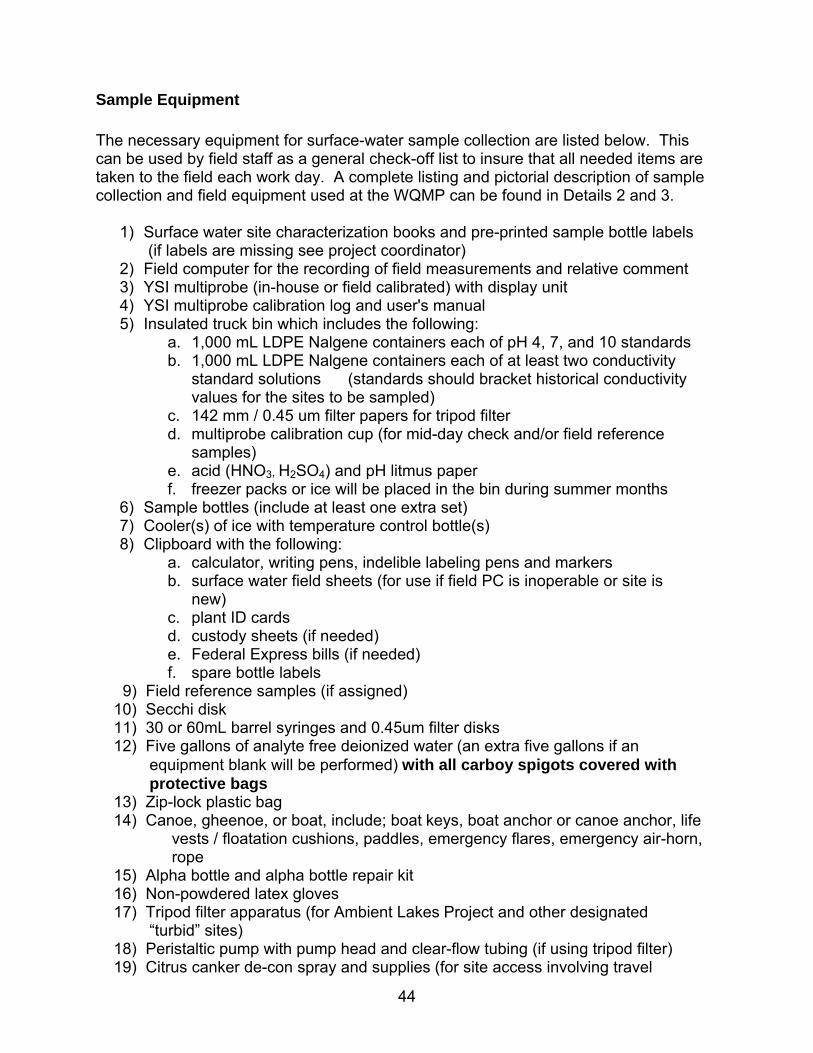
44
Sample Equipment The necessary equipment for surface-water sample collection are listed below. This can be used by field staff as a general check-off list to insure that all needed items are taken to the field each work day. A complete listing and pictorial description of sample collection and field equipment used at the WQMP can be found in Details 2 and 3.
1) Surface water site characterization books and pre-printed sample bottle labels (if labels are missing see project coordinator)
2) Field computer for the recording of field measurements and relative comment 3) YSI multiprobe (in-house or field calibrated) with display unit 4) YSI multiprobe calibration log and user's manual 5) Insulated truck bin which includes the following:
a. 1,000 mL LDPE Nalgene containers each of pH 4, 7, and 10 standards b. 1,000 mL LDPE Nalgene containers each of at least two conductivity
standard solutions (standards should bracket historical conductivity values for the sites to be sampled)
c. 142 mm / 0.45 um filter papers for tripod filter d. multiprobe calibration cup (for mid-day check and/or field reference
samples) e. acid (HNO3, H2SO4) and pH litmus paper f. freezer packs or ice will be placed in the bin during summer months
6) Sample bottles (include at least one extra set) 7) Cooler(s) of ice with temperature control bottle(s) 8) Clipboard with the following:
a. calculator, writing pens, indelible labeling pens and markers b. surface water field sheets (for use if field PC is inoperable or site is
new) c. plant ID cards d. custody sheets (if needed) e. Federal Express bills (if needed) f. spare bottle labels
9) Field reference samples (if assigned) 10) Secchi disk 11) 30 or 60mL barrel syringes and 0.45um filter disks 12) Five gallons of analyte free deionized water (an extra five gallons if an equipment blank will be performed) with all carboy spigots covered with protective bags 13) Zip-lock plastic bag 14) Canoe, gheenoe, or boat, include; boat keys, boat anchor or canoe anchor, life vests / floatation cushions, paddles, emergency flares, emergency air-horn, rope 15) Alpha bottle and alpha bottle repair kit 16) Non-powdered latex gloves 17) Tripod filter apparatus (for Ambient Lakes Project and other designated “turbid” sites) 18) Peristaltic pump with pump head and clear-flow tubing (if using tripod filter) 19) Citrus canker de-con spray and supplies (for site access involving travel
45
through citrus groves) 20) Garmin or Trimble GPS unit (see Trimble instructions in Detail 12 for site location/verification) 21) Digital camera 22) LiCor equipment (if collecting light attenuation data) 23) Flow meter and wading rod (if collecting flow measurements) 24) If collecting macroinvertebrates:
a. Habitat assessment and Stream Condition Index paperwork (Physical/Chemical Characterization Sheet, Stream River Habitat Sketch Sheet, and Stream/River Habitat Assessment Field Sheet)
b. D-Frame net c. wide-mouth Nalgene bottles d. 100 meter tape measure e. Survey tape and(or) flags f. 10 percent buffered formalin g. Brush
25) Chest or hip waders, rubber boots 26) First aid kit 27) Trash bags 28) Phone/radio (must be turned on prior to leaving office) 29) Rope 30) Copy of Standard Operating Procedures Manual
Sample Run Initiation Field technicians are scheduled to perform tasks based upon the WQMP weekly schedule prepared by the field technician supervisor. When a specific project is assigned, field technicians pick an “active” sample run or, if no runs are active, choose which run they would like to start. This is done the night prior to the scheduled sampling day, the morning prior to the sampling day, or a combination of both. The sampling run is based upon:
1) Runs which are active or runs which have not yet been started 2) Equipment availability (canoe/ganoe/boat, multiprobes) 3) Status of call-ahead stations (i.e. property access permission)
Once the sampling run for the day has been established, field staff load the necessary equipment (see equipment list) in their pre-assigned vehicle.
Field Multiprobe Calibration The YSI multiprobe equipment to be used will be calibrated either prior to leaving the office or prior to use in the field. A mid-day check on pH, conductance, and DO (mg/L) will also be performed. Detailed procedures and example forms for the calibration of these multiprobes can be found in Details 7 and 14 as well as in the log book assigned to each multiprobe.
46
Note: If for any reason a meter fails calibration or does not perform accurately in the field, a maintenance request form explaining the nature of the failure will be turned in along with the failed meter to the meter maintenance technician at the end of the work day. A copy of this maintenance request form will also be turned into the project coordinator's mail bin. The WQMP has a designated field technician who is responsible for the maintenance, repair, and ordering of replacement parts for YSI multiprobes. In addition, this technician also has the responsibility of performing all monthly calibration checks on the various probes. A complete list of these responsibilities can be found in Detail 7.
Site Arrival If sampling site is located within or accessed through a citrus grove, staff must follow the District's citrus canker sanitation protocol (see Detail 11). The first step in sampling procedures once the samplers have arrived at the site is the identification of the site. The sites are identified based upon written descriptions, photographs, and maps located in the characterization books, or by Garmin GPS location. Both samplers need to verify that the proper site (bridge, structure, lake, etc.) is located prior to the start of sampling procedures. In the event the site is to be sampled by a single person, the site identification needs to be double checked by that sampler. The proper identification of the site is a critical step in the sampling process. The sampling vehicle should be parked as close to the site as possible. If the site is located at a bridge, extra care should be taken to park in a safe location. When possible, park the truck behind a guard rail or as far off the road as possible. Turn on the flashing yellow caution lights which are located on the roof of every field vehicle and place orange caution cones around the sampling vehicle. Caution vests are also available and should be worn at all times. The field computer is turned on and the program “ELB” is selected. “Surface Water Sampling” is chosen from the main menu and the site is looked up in the computer and selected. Station ID’s should be double checked against characterization sheets and bottle labels to make sure the correct site has been chosen in the field computer. If the field computer is not available, all site information and readings should be recorded on a paper copy field sheet (see Detail 14 for example form). Any corrections made to documentation should not obliterate the original entry. To make a correction, draw a line through the item to be corrected, write in the correct value next to the lined-out item, and initial and date the change.
Sample Collection Initiation A description of sampling equipment and field measurement equipment used by the WQMP for surface water projects can be found in Details 2, 3, and 8. All field parameter data and water quality samples should be collected upstream of bridges or other permanent structures. Sediments and other types of debris can
47
accumulate around bridge abutments and influence the data being collected. Samples which are collected for long-term projects at “fixed” monitoring sites should be taken at the same general location every time the site is visited. Sample collection at lakes which are < 10 hectares in size should occur in the center of the lake in an area free of any submerged or emergent vegetation. Lakes which are > 10 hectares should be sampled in an area away from the littoral zone which is free of any submerged or emergent vegetation. Note: If after speaking with the field technician supervisor and/or the project coordinator, it is determined that it is not possible to follow the above procedures, record the deviation from standard protocols in the comments section of the field computer. Note: If upon site arrival, it is noted that the system is dry (no water at sample collection point) or pooling (water is non-continuous within the system) then the site should not be sampled. Upon returning to the office, the pre-printed labels for the non-sampled site and the reason for the exclusion should be turned into the project coordinator along with the remainder of the day's paperwork. If pre-printed labels are not available a note including the site name, UID or SID, and reason for exclusion should be turned into the project coordinator along with the remainder of the day's paperwork.
Field Data Collection The first step in field data collection for surface water projects is to record general information such as weather, stream flow, submerged and emergent aquatic vegetation present, major/micro land use, staff gage measurement (if present), equipment used (e.g. multiprobe, alpha bottle), and samplers initials in the field computer or on the surface water field sheet, if a field computer is unavailable. The next step in the field data collection procedure is to collect field parameter information. Lower the YSI multiprobe to the bottom of the surface water body, read the total depth of station off the display, and record into the “total depth” field. At this time the secchi depth value should be recorded and entered into the appropriate place in the field computer or on the surface water field sheet. Lower the secchi disk into the water column and note the depth at which the disk disappears and the depth at which it re-appears. The average of these two numbers should be determined and the average value entered in the field PC or surface water field sheet. Polarized sun glasses should be removed prior to taking this measurement. If collecting samples from a boat, canoe, or gheenoe, this procedure should be done on the shady side of the vessel. If the secchi disk is visible to the bottom of the water body, enter the total depth of the site in the “secchi depth” field. Raise the multiprobe to the depth at which samples will be collected. For most surface water projects, field parameter readings and water quality samples are taken at 0.5 meters from the surface or mid-depth, whichever is shallowest (i.e. total depth of site is 0.3 meters, so field parameters and samples will be collected at 0.15 meters; or total depth of site is 1.2 meters so field parameters and samples will be collected at 0.5 meters). Samples and field readings will not be collected if the total depth at the
48
collection point is less than 10cm (0.1 meters). Note: Some projects such as Ambient Lakes or deeper flowing systems require that field parameters be collected throughout the water column (e.g. top, mid, and bottom). Profile readings are usually collected if the total depth is greater than 1.5 meters. When field parameters are collected at bottom depths, the multiprobe should be raised slightly above the bottom (at least 0.2 meters) so the probes are not influenced by bottom sediments and plant material. Water quality samples will be collected only at the top depth of 0.5 meters (unless otherwise specified). Raise the multiprobe to the correct depth, allow to equilibrate for two to three minutes until all readings have stabilized, and enter the field parameters into the appropriate locations in the field computer or surface water field sheet. Specific conductance, pH, salinity, dissolved oxygen (in mg/l), and temperature should all be recorded. For verification of values, historical field readings are available for reference in the field computer by selecting “Site Info / History” from the ELB menu or by selecting the History button from within your selected site. If a second set of field parameters is to be recorded at a different depth, choose “another” in the field computer and record second depth and field parameter values. Continue with this procedure if a third parameter set is to be recorded. Following field parameter data collection, the multiprobe can now be retrieved, turned off (to save battery power) and stored in the protective sleeve or calibration cup. Note: If possible, all multiprobes should be transported to (and while in the field) in the cab of the sampling vehicle, and secured in a manner to reduce vibration of the probes. Field Reference Samples (FRS) for pH and specific conductance will be analyzed periodically. These are “blind” standards with an unknown pH or specific conductance concentration which are supplied by the USGS. Following meter calibration, measurements of the FRS are taken in the field and the results submitted to the District project manager or project coordinator. The FRS are assigned to all WQMP meters on a quarterly basis. If any meter has results from a FRS returned as unsatisfactory, the meter will be immediately pulled from field use and will not be returned until maintenance or repair has been performed. A copy of the failing reference sample sheet will also be turned into the project coordinator's mail bin.
Sample Preparation Either prior to, or following field parameter data collection, sample bottles will be prepared. Latex powder-free gloves should be worn to prevent contamination of the bottles. The bottles that comprise the sample kit need to be visually inspected for cleanliness. If any bottle appears dirty, discard and replace with another. Bottle labels will then be placed on the appropriate bottle. Pre-printed labels will be placed in the characterization “sleeve” for each site to be sampled prior to the sample event initiation. Record the date in a YYYYMMDD format (i.e. 20010424 for April 24, 2001) and the time in HHMM (military time) and record sampler initials. The labels will then be affixed to the sample container, with the bar code running vertically, insuring that the correct label
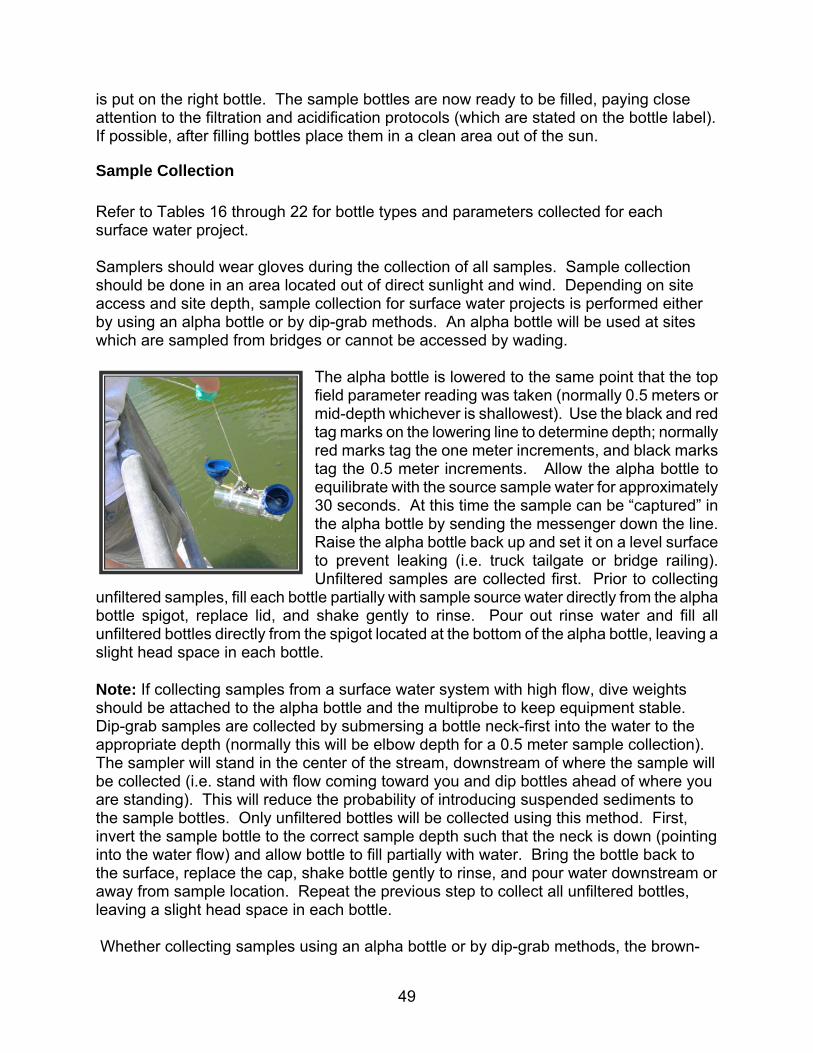
49
is put on the right bottle. The sample bottles are now ready to be filled, paying close attention to the filtration and acidification protocols (which are stated on the bottle label). If possible, after filling bottles place them in a clean area out of the sun.
Sample Collection Refer to Tables 16 through 22 for bottle types and parameters collected for each surface water project. Samplers should wear gloves during the collection of all samples. Sample collection should be done in an area located out of direct sunlight and wind. Depending on site access and site depth, sample collection for surface water projects is performed either by using an alpha bottle or by dip-grab methods. An alpha bottle will be used at sites which are sampled from bridges or cannot be accessed by wading.
The alpha bottle is lowered to the same point that the top field parameter reading was taken (normally 0.5 meters or mid-depth whichever is shallowest). Use the black and red tag marks on the lowering line to determine depth; normally red marks tag the one meter increments, and black marks tag the 0.5 meter increments. Allow the alpha bottle to equilibrate with the source sample water for approximately 30 seconds. At this time the sample can be “captured” in the alpha bottle by sending the messenger down the line. Raise the alpha bottle back up and set it on a level surface to prevent leaking (i.e. truck tailgate or bridge railing). Unfiltered samples are collected first. Prior to collecting
unfiltered samples, fill each bottle partially with sample source water directly from the alpha bottle spigot, replace lid, and shake gently to rinse. Pour out rinse water and fill all unfiltered bottles directly from the spigot located at the bottom of the alpha bottle, leaving a slight head space in each bottle. Note: If collecting samples from a surface water system with high flow, dive weights should be attached to the alpha bottle and the multiprobe to keep equipment stable. Dip-grab samples are collected by submersing a bottle neck-first into the water to the appropriate depth (normally this will be elbow depth for a 0.5 meter sample collection). The sampler will stand in the center of the stream, downstream of where the sample will be collected (i.e. stand with flow coming toward you and dip bottles ahead of where you are standing). This will reduce the probability of introducing suspended sediments to the sample bottles. Only unfiltered bottles will be collected using this method. First, invert the sample bottle to the correct sample depth such that the neck is down (pointing into the water flow) and allow bottle to fill partially with water. Bring the bottle back to the surface, replace the cap, shake bottle gently to rinse, and pour water downstream or away from sample location. Repeat the previous step to collect all unfiltered bottles, leaving a slight head space in each bottle. Whether collecting samples using an alpha bottle or by dip-grab methods, the brown-
50
opaque chlorophyll bottles should be filled first. Try to shade the sample as you fill the bottles. Immediately place the chlorophyll samples on ice. Do not force the bottles down into the ice because dropping the temperature too fast will “shock” the composition of the chlorophyll cells and may adversely impact the chlorophyll analyses. Fill all remaining non-filtered bottles. Filtered samples will be collected last. Filtration of a surface water sample is achieved by using a 30 or 60 mL disposable barrel syringe and 0.45-micron disk filter. If collecting the sample from an alpha bottle, remove the plunger, cover the tip of the syringe and fill the syringe directly from the alpha bottle spigot with source sample water. Replace the plunger and attach a filter disk to the syringe. Flush a full syringe (30 or 60mLs) of sample water through the filter before filling the sample bottle. Filter a small amount of sample water into the bottle as an initial rinse. Discard the rinse water and continue this procedure until the sample bottle is full. If samples are being collected using the dip-grab method, follow the same protocol as listed above and invert the syringe to correct sample depth such that the opening is down (pointing into the water flow) and allow syringe to fill with sample water. Note: The filter disk must be removed from the syringe prior to removing the plunger and re-filling the syringe. Pulling back on the plunger with the filter attached may damage the filter. Note: For all lakes projects, filtered samples are collected using a peristaltic pump equipped with clear flow tubing and pump head, a tripod filter apparatus , and 142 mm / 0.45 um filter papers. Prior to filtration the entire filter apparatus must be rinsed thoroughly with analyte free deionized water. The sample technician must wear gloves for this cleaning. Also, care should be taken to prevent sweat from dripping onto the filter. Unscrew the nylon bolts and take the filter apparatus apart on a clean, flat surface (cooler top, etc.). Begin by rinsing the filter base in deionized water. Next, rinse the bottom plate, bottom screen, and O-ring and place on the base of the filter apparatus. A new filter paper is then placed on the bottom screen. Each filter is packaged with two protective papers on either side; make sure that both of these protective papers are removed prior to placing the filter on the filter screens. Next, rinse the top screen and top plate and place each on top of the filter paper. Tighten the nylon bolts and set aside in a clean, shaded area until use. It is important that the O-ring be seated correctly to prevent leakage of water along seams. When using the peristaltic pump to collect filtered samples, lower the pump head to the desired sample depth (0.5 meters) and use the pump to drive the sample water through the filter apparatus. Allow water to flow through the filter for approximately 30 seconds to flush any deionized water or unwanted residue from the filter. If leakage occurs around the seams of the filter tighten the nylon bolts. If this does not stop the leakage, follow the steps in cleaning the filter again and be sure the O-ring is seated correctly. Place the bottle to be filtered beneath the tripod filter and add approximately 50 mL’s of water to the bottle as a rinse. Shake the bottle with the cap on and then discard the water away from the sample site. Place the bottle beneath the filter and fill (leave a slight head space). Care should be taken to not touch the mouth or inner edge of the
51
sample bottles. Following sample collection keep the sample bottles out of direct sunlight. Bottles that do not require acidification can be immediately placed in ice.
Sample Acidification Powder-free latex gloves must be worn throughout the sample acidification process. All acids can cause burns and will damage clothing. Gloves and eye protection must be used. A detailed explanation of storage and disposal protocols for acids, buffers, and other standards used by the WQMP can be found in Detail 9. If possible, keep sample bottles out of direct sunlight. Identify the sample bottle(s) (red dot on lid) to be preserved with sulfuric acid (H2SO4). This acid is kept in a teflon dropper bottle that has red banding. Note the final pH reading as this may affect the amount of acid needed (e.g. pre-acidified samples with lower pH values will require less acid to reach a pH of <2). Start by adding a few drops of H2SO4 to the bottle (approximately one drop for a 40 mL bottle, 3 drops for a 250 mL bottle, and 6 drops for a 500 mL bottle). Invert the bottle several times to mix the acid with the sample water. Pour a small amount of the sample directly over a strip of pH litmus paper. The pH test strip paper should NEVER be dipped in the sample bottle, this may contaminate the sample. Compare the results of the litmus paper to the pH range shown on the litmus paper container. Add more acid and repeat this procedure as needed until a pH < 2.0 is achieved. Once the pH is acceptable, place bottle(s) in ice. It is very important to not over acidify or nutrient results will be jeopardized. Gloves are now discarded and a new pair put on prior to following the next step: The bottle with a blue cap (precleaned) will now be preserved with nitric acid (HNO3). This acid is contained in glass “snap-off” ampoules. Snap off top portion of ampoule away from your body being careful to avoid the broken edge. Add the entire contents of one HNO3 acid ampoule to the appropriately marked bottle by lightly tapping on the bottom of the ampoule until all the acid has been delivered. Discard all used glass vials in a HNO3 acid waste container. These waste containers are carried at all times in each field vehicle. Invert the bottle gently several times to mix the acid with the sample water. Pour a small amount of the sample directly over a strip of pH litmus paper. The pH test strip paper should NEVER be dipped in the sample bottle, this may contaminate the sample. Compare the results of the litmus paper to the pH range shown on the litmus paper container. The pH must be < 2.0. Adding more HNO3 acid should not be necessary. Insure that the caps on all sample bottles are screwed on tightly and reinspect the labels for accuracy. Place the bottles on ice immediately following sample collection and acidification.
Replicate and Blank Sample Collection The number of replicate and blank samples required to be collected is ten percent of the total samples collected for an entire project (i.e. if 100 samples will be collected, five duplicate and five equipment blank samples will be collected). For surface water projects these QA samples will usually be assigned to a particular site or site run and are described on the project event check-off list. Quality assurance samples need to be collected at an even frequency throughout the sampling event.

52
The replicate sample is intended as a check of “repeatability” for laboratory analyses and field sampling protocols. Replicate samples, rather than duplicate samples, are collected for surface water projects because of how quickly water quality can change in a flowing surface water system. Whether collecting these samples using dip-grab or alpha bottle methods, a replicate sample is collected by filling the same bottle from the replicate kit immediately after filling that same bottle from the original sample kit. All unfiltered bottles should be collected first followed by filtered samples. Preserve appropriate bottle(s) immediately after filling. Sites or runs at which replicate samples will be collected are pre-established. The extra set of labels will be in the “sleeve” with the original set of labels of the appropriate characterization. The replicate should be recorded in the field computer’s QA section (choose “duplicate”). Replicate samples are assigned a different sample time than the original sample so the samples can be distinguished from each other. The sample time should be corrected in the field computer to match the time written on the duplicate bottle labels. Equipment blanks are collected in the field to test the cleanliness of pre-cleaned or field cleaned sample equipment. Data from equipment blank results reflect how thoroughly equipment is cleaned in the field and also insures that contamination is not carried over between sites. Equipment blanks are pre-assigned to specific runs but can be done at any site in that run. The equipment blank is collected by running analyte free deionized water through all equipment that has been used to collect the original sample at a particular site. The following procedure should be used:
1) Thoroughly rinse and clean (using one drop of Liquinox) the inside and outside
areas of alpha bottles. If collecting an equipment blank sample for a lakes project, rinse tripod filter, peristaltic pump head, and pump tubing with analyte free deionized water. Flush the inside of tubing by running approximately 2.5 gallons of analyte free deionized water through the pump.
2) Completely fill the alpha bottle with analyte free deionized water. Collect the equipment blank following sample collection protocols for that specific project (see “sample collection” section). First, collect all unfiltered bottles directly from the spigot on the alpha bottle. Lastly, collect filtered samples and acidify as specified for the project.
3) If samples are collected using dip-grab methods, simply fill all unfiltered bottles with deionized water directly from the spigot on the five gallon Nalgene carboy. Allow deionized water to run for approximately 30 seconds before collecting samples to flush the spigot. Collect the filtered sample by also filling the barrel syringe directly from the carboy.
4) Acidify as specified (see “sample collection” section).
53
Sample bottles used for equipment blank sample collection should be labeled with the blank labels assigned to that run. The sample labels also need to contain the date, time and samplers initials. The equipment blank should be recorded in the field computer’s QA section with the time corrected to match the bottles. Post Sampling Procedures Following the completion of the sampling procedure the alpha bottle will be thoroughly rinsed with deionized water. If used, the tripod filter paper will be removed and the filter apparatus thoroughly rinsed with deionized water. The site needs to be picked-up including the removal of all trash (even if it is not yours). Make notes in the characterization as needed (i.e. new bridge being built, directions to site have changed, problems at site). Take pictures as needed to assist in identifying the sample location. Final Paperwork and Sample Shipment Upon returning to the office at the end of the day, the samples need to be prepared for shipment and the appropriate paperwork printed and stored. Plug the field computer into the AC adapter so the computer does not shut off during printing. Also, confirm that the field computer is attached to the network and that the correct printer is selected as the default in your printer settings. Once in the ELB software “output options” should be selected from the main menu. Next “Surface Water Data Sheets” should be selected; the sites sampled for that day should be chosen from the list and then “print selected datasheets” should be selected. At this point the field sheets will begin printing. Once the field sheets have printed select “output options” from the main menu again and choose “chain of custody report” and “continue – print report”. Custody logs for the day’s sampling will now begin printing. If a field computer was not used for data collection, a hand written chain of custody log should be filled out with information for the sites sampled that day (see Detail 14 for example form). When you have confirmed that all field sheets and custody logs have printed, the field computer will prompt you to save data for the session. At this point you will choose yes to save data for this session. A back-up copy of the field data collected each sampling day will still exist on the field computer and will be downloaded every Friday of each week. Table 24 lists the shipping methods for each surface water project.
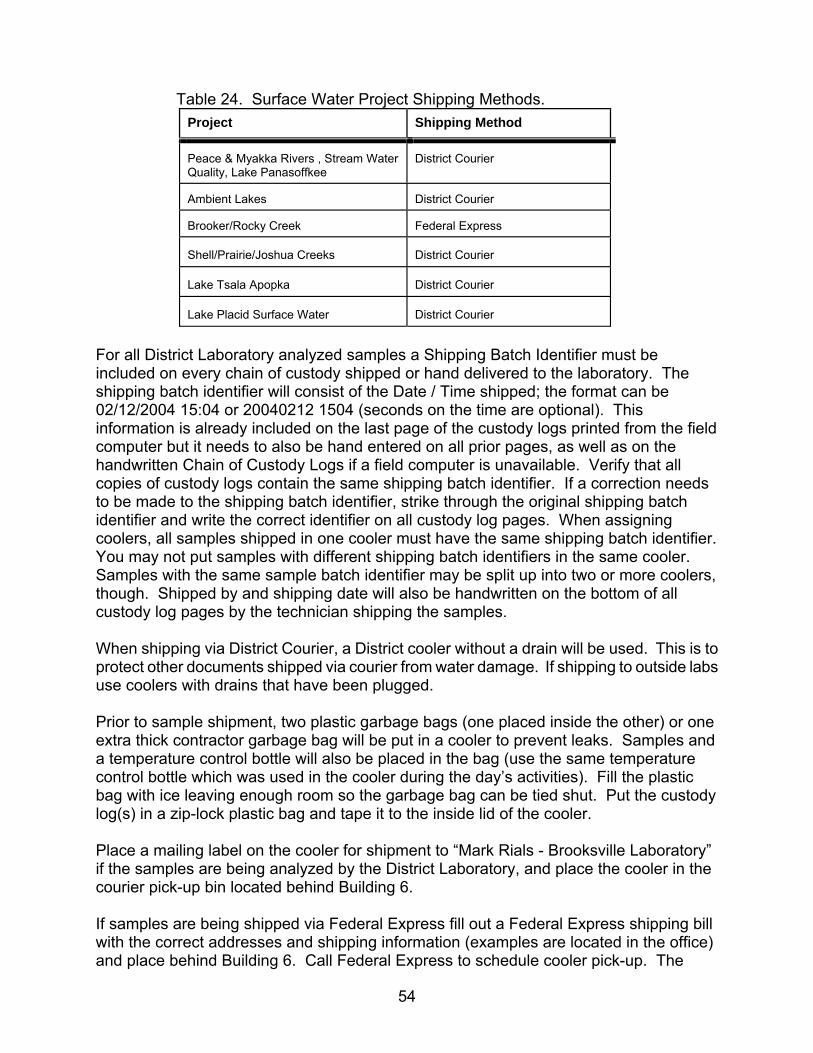
54
Table 24. Surface Water Project Shipping Methods. Project Shipping Method Peace & Myakka Rivers , Stream Water Quality, Lake Panasoffkee
District Courier
Ambient Lakes District Courier Brooker/Rocky Creek Federal Express Shell/Prairie/Joshua Creeks District Courier Lake Tsala Apopka District Courier Lake Placid Surface Water District Courier
For all District Laboratory analyzed samples a Shipping Batch Identifier must be included on every chain of custody shipped or hand delivered to the laboratory. The shipping batch identifier will consist of the Date / Time shipped; the format can be 02/12/2004 15:04 or 20040212 1504 (seconds on the time are optional). This information is already included on the last page of the custody logs printed from the field computer but it needs to also be hand entered on all prior pages, as well as on the handwritten Chain of Custody Logs if a field computer is unavailable. Verify that all copies of custody logs contain the same shipping batch identifier. If a correction needs to be made to the shipping batch identifier, strike through the original shipping batch identifier and write the correct identifier on all custody log pages. When assigning coolers, all samples shipped in one cooler must have the same shipping batch identifier. You may not put samples with different shipping batch identifiers in the same cooler. Samples with the same sample batch identifier may be split up into two or more coolers, though. Shipped by and shipping date will also be handwritten on the bottom of all custody log pages by the technician shipping the samples. When shipping via District Courier, a District cooler without a drain will be used. This is to protect other documents shipped via courier from water damage. If shipping to outside labs use coolers with drains that have been plugged. Prior to sample shipment, two plastic garbage bags (one placed inside the other) or one extra thick contractor garbage bag will be put in a cooler to prevent leaks. Samples and a temperature control bottle will also be placed in the bag (use the same temperature control bottle which was used in the cooler during the day’s activities). Fill the plastic bag with ice leaving enough room so the garbage bag can be tied shut. Put the custody log(s) in a zip-lock plastic bag and tape it to the inside lid of the cooler. Place a mailing label on the cooler for shipment to “Mark Rials - Brooksville Laboratory” if the samples are being analyzed by the District Laboratory, and place the cooler in the courier pick-up bin located behind Building 6. If samples are being shipped via Federal Express fill out a Federal Express shipping bill with the correct addresses and shipping information (examples are located in the office) and place behind Building 6. Call Federal Express to schedule cooler pick-up. The
55
District coolers without a drain are not to be used when shipping to outside labs via federal express (or any shipping method other than District Courier). Note: Custody logs should reflect only those sites which are contained in the cooler. If more than one cooler will be used, a copy of the custody log will be made. Use a heavy marker or pen to draw a line through samples on the custody log which are not contained in the additional cooler(s). Also, the submission ID for the sample site will be entered in the chain of comments (COC) entry field of ELB or handwritten for each site on the chain of custody. Custody logs, field sheets (electronic and hand-written), equipment blank, duplicate sheets, and reference samples sheets will be checked for accuracy. Any corrections made to documentation should not obliterate the original entry. To make a correction, draw a line through the item to be corrected, write in the correct value next to the lined-out item, and initial and date the change. Once the sheets are checked they should be initialed in the top right corner and put in the project coordinator's mail bin. The project coordinator will review the sheets to ensure completion, and then file the sheets appropriately. The check-off list posted in the equipment room needs to reflect which sites were sampled that day and if any QA samples were done. Final Equipment Maintenance Analyte free deionized water containers should be checked for cleanliness and re-filled after returning to the office. The whirlpak bag covering the container spigot should be checked for wear and replaced as needed. All multiprobes, acids, and pH/conductivity standards will be removed from each sampling vehicle and placed in the clean equipment room at the end of each work day. Vehicles should be swept out and all trash thrown away. All multiprobes will be post checked following each sampling day and the appropriate log sheet filled out. If for any reason the multiprobe does not pass the post check, an incident report must be filled out. The sonde and report should then be given to the meter maintenance technician. Any problems associated with the day’s activities (equipment, a sampling site, field computer, vehicle, etc.) should be reported immediately to the sampling supervisor or project coordinator. Planning for the next day's activities can now begin.


i
Detail 1 WQMP Personnel Organization Chart

ii
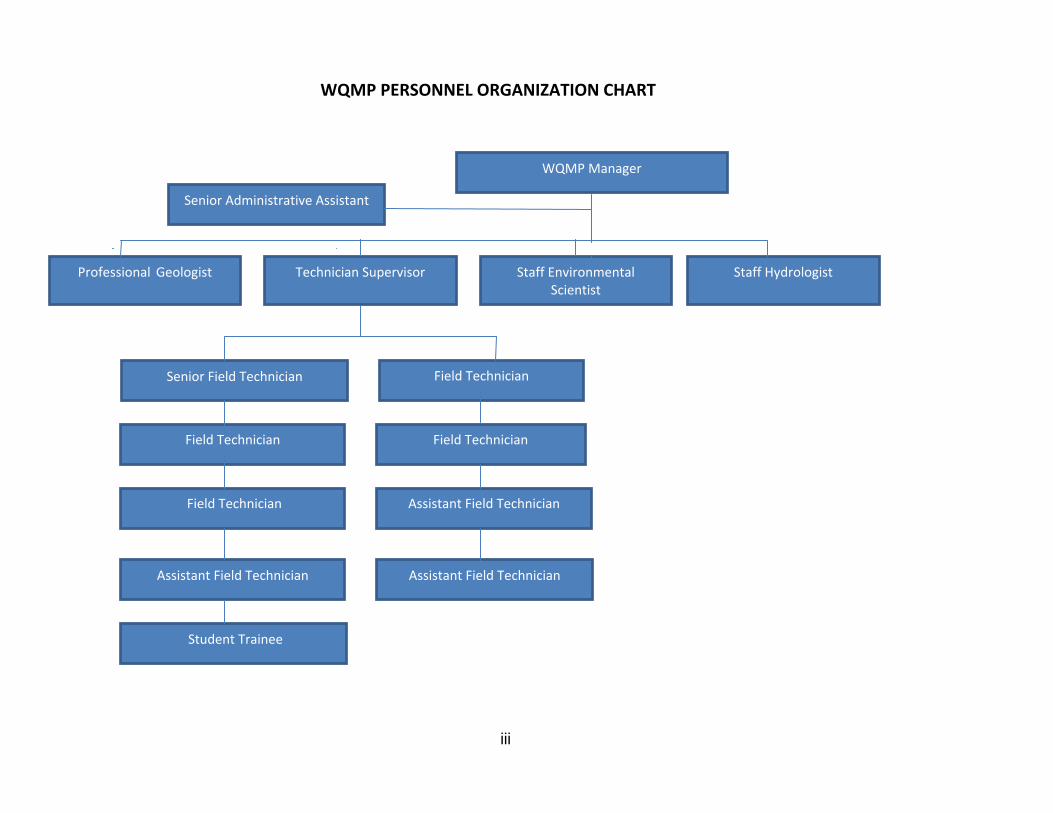
iii
WQMP PERSONNEL ORGANIZATION CHART
WQMP Manager
Senior Administrative Assistant
Professional Geologist Technician Supervisor Staff Environmental Scientist
Staff Hydrologist
Senior Field Technician
Student Trainee
Field Technician
Field Technician Field Technician
Field Technician Assistant Field Technician
Assistant Field Technician Assistant Field Technician

iv
v
Detail 2 Ground and Surface Water
Sample Collection Equipment

vi
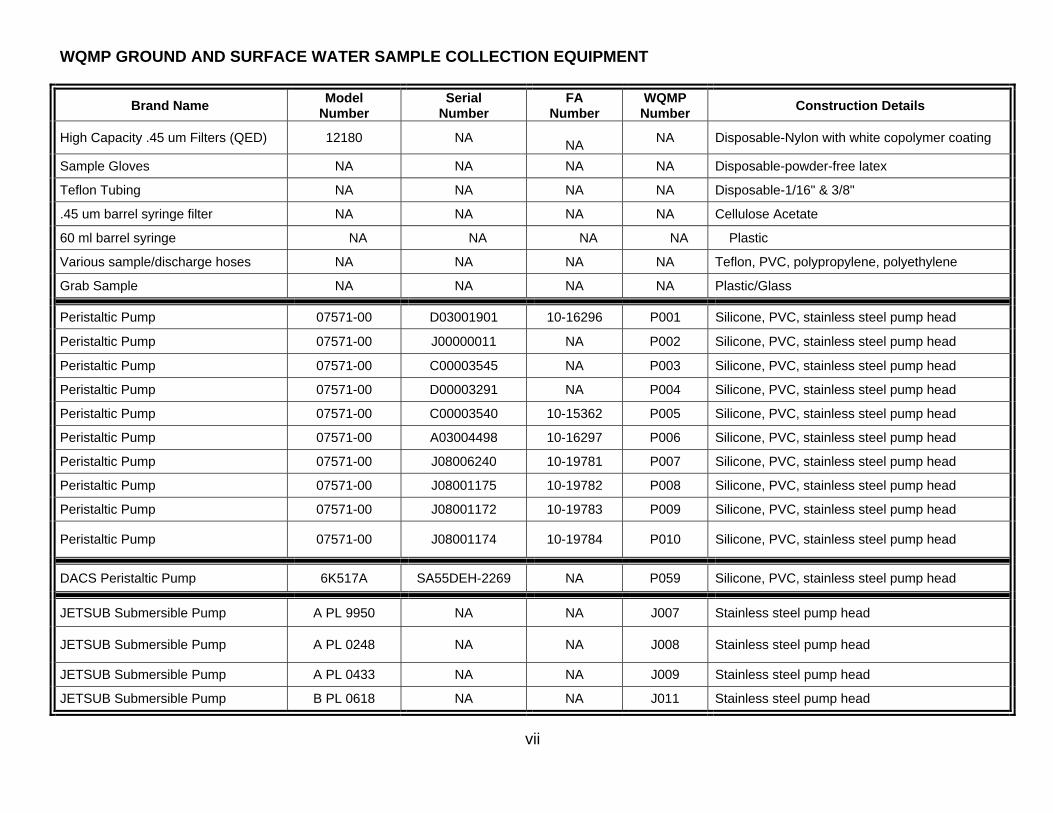
vii
WQMP GROUND AND SURFACE WATER SAMPLE COLLECTION EQUIPMENT
Brand Name Model Number
Serial Number
FA Number
WQMP Number Construction Details
High Capacity .45 um Filters (QED) 12180 NA NA NA Disposable-Nylon with white copolymer coating
Sample Gloves NA NA NA NA Disposable-powder-free latex Teflon Tubing NA NA NA NA Disposable-1/16" & 3/8" .45 um barrel syringe filter NA NA NA NA Cellulose Acetate 60 ml barrel syringe NA NA NA NA Plastic Various sample/discharge hoses NA NA NA NA Teflon, PVC, polypropylene, polyethylene Grab Sample NA NA NA NA Plastic/Glass
Peristaltic Pump 07571-00 D03001901 10-16296 P001 Silicone, PVC, stainless steel pump head Peristaltic Pump 07571-00 J00000011 NA P002 Silicone, PVC, stainless steel pump head Peristaltic Pump 07571-00 C00003545 NA P003 Silicone, PVC, stainless steel pump head Peristaltic Pump 07571-00 D00003291 NA P004 Silicone, PVC, stainless steel pump head Peristaltic Pump 07571-00 C00003540 10-15362 P005 Silicone, PVC, stainless steel pump head Peristaltic Pump 07571-00 A03004498 10-16297 P006 Silicone, PVC, stainless steel pump head Peristaltic Pump 07571-00 J08006240 10-19781 P007 Silicone, PVC, stainless steel pump head
Peristaltic Pump 07571-00 J08001175 10-19782 P008 Silicone, PVC, stainless steel pump head
Peristaltic Pump 07571-00 J08001172 10-19783 P009 Silicone, PVC, stainless steel pump head
Peristaltic Pump 07571-00 J08001174 10-19784 P010 Silicone, PVC, stainless steel pump head
DACS Peristaltic Pump 6K517A SA55DEH-2269 NA P059 Silicone, PVC, stainless steel pump head
JETSUB Submersible Pump A PL 9950 NA NA J007 Stainless steel pump head
JETSUB Submersible Pump A PL 0248 NA NA J008 Stainless steel pump head
JETSUB Submersible Pump A PL 0433 NA NA J009 Stainless steel pump head JETSUB Submersible Pump B PL 0618 NA NA J011 Stainless steel pump head
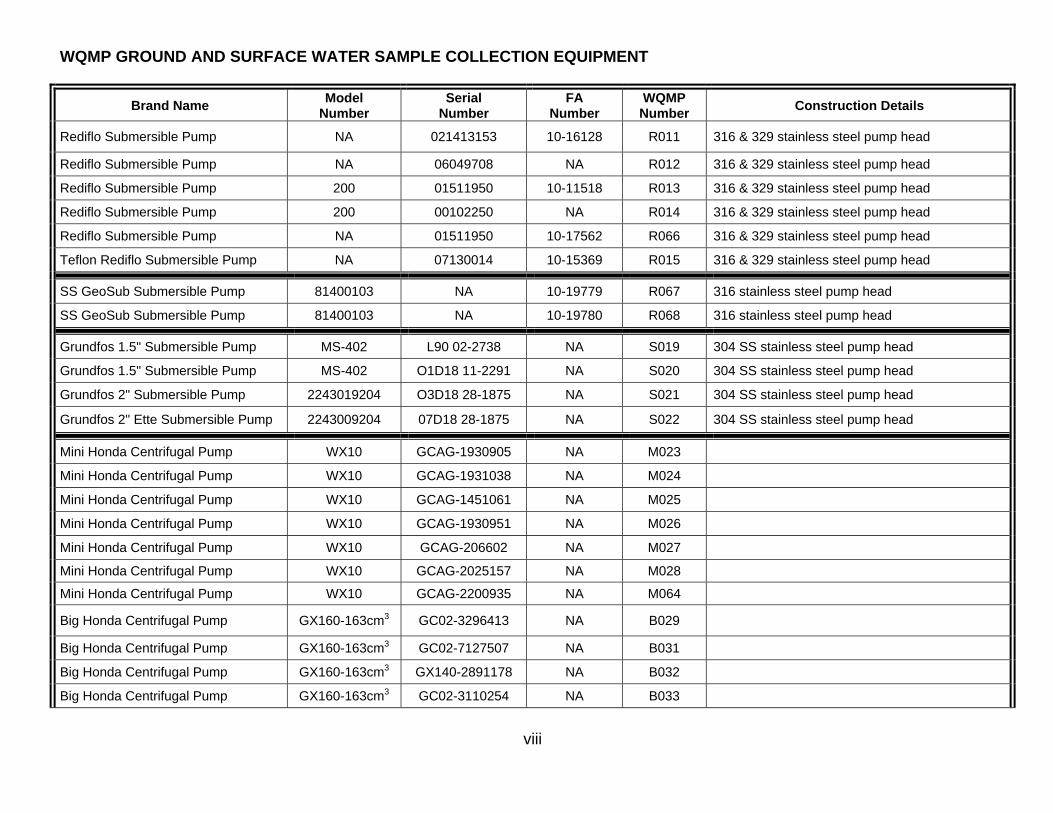
viii
WQMP GROUND AND SURFACE WATER SAMPLE COLLECTION EQUIPMENT
Brand Name Model Number
Serial Number
FA Number
WQMP Number Construction Details
Rediflo Submersible Pump NA 021413153 10-16128 R011 316 & 329 stainless steel pump head Rediflo Submersible Pump NA 06049708 NA R012 316 & 329 stainless steel pump head Rediflo Submersible Pump 200 01511950 10-11518 R013 316 & 329 stainless steel pump head Rediflo Submersible Pump 200 00102250 NA R014 316 & 329 stainless steel pump head Rediflo Submersible Pump NA 01511950 10-17562 R066 316 & 329 stainless steel pump head Teflon Rediflo Submersible Pump NA 07130014 10-15369 R015 316 & 329 stainless steel pump head
SS GeoSub Submersible Pump 81400103 NA 10-19779 R067 316 stainless steel pump head
SS GeoSub Submersible Pump 81400103 NA 10-19780 R068 316 stainless steel pump head
Grundfos 1.5" Submersible Pump MS-402 L90 02-2738 NA S019 304 SS stainless steel pump head Grundfos 1.5" Submersible Pump MS-402 O1D18 11-2291 NA S020 304 SS stainless steel pump head
Grundfos 2" Submersible Pump 2243019204 O3D18 28-1875 NA S021 304 SS stainless steel pump head
Grundfos 2" Ette Submersible Pump 2243009204 07D18 28-1875 NA S022 304 SS stainless steel pump head
Mini Honda Centrifugal Pump WX10 GCAG-1930905 NA M023
Mini Honda Centrifugal Pump WX10 GCAG-1931038 NA M024
Mini Honda Centrifugal Pump WX10 GCAG-1451061 NA M025
Mini Honda Centrifugal Pump WX10 GCAG-1930951 NA M026
Mini Honda Centrifugal Pump WX10 GCAG-206602 NA M027
Mini Honda Centrifugal Pump WX10 GCAG-2025157 NA M028
Mini Honda Centrifugal Pump WX10 GCAG-2200935 NA M064
Big Honda Centrifugal Pump GX160-163cm3 GC02-3296413 NA B029
Big Honda Centrifugal Pump GX160-163cm3 GC02-7127507 NA B031
Big Honda Centrifugal Pump GX160-163cm3 GX140-2891178 NA B032
Big Honda Centrifugal Pump GX160-163cm3 GC02-3110254 NA B033

ix
WQMP GROUND AND SURFACE WATER SAMPLE COLLECTION EQUIPMENT
Brand Name Model Number
Serial Number
FA Number
WQMP Number Construction Details
Honda Generator EM5000S GC05-2888540 NA G034
Honda Generator EM5000S GC05-3078279 10-15552 G036
Honda Generator EB5000 GC05-2796907 10-13855 G037
Honda Generator EM5000S GC05-3683739 10-17376 G039
Honda Generator EM5000S GC05-3858918 NA G041
ONAN Generator 5500 K06E008756 NA G042
ONAN Generator 5500 K06E008617 NA G043
ONAN Generator 5500 K06E008757 NA G044
Alpha Bottle 1160-042 NA NA A041 Acrylic
Alpha Bottle 4106 NA NA A042 Acrylic
Alpha Bottle NA NA NA A043 Acrylic
Alpha Bottle 4106 NA NA A044 Acrylic
Alpha Bottle NA NA NA A045 Acrylic
Electronic Water Level Tape Slope Indicator 16867 NA W051
Electronic Water Level Tape 101 48431 NA W052
Electronic Water Level Tape 101 38367 NA W053
Electronic Water Level Tape 101 43581 NA W054
Electronic Water Level Tape 101 35417 NA W059
Electronic Water Level Tape 101 35429 NA W060

x
xi
Detail 3 Sample Equipment
Descriptions

xii
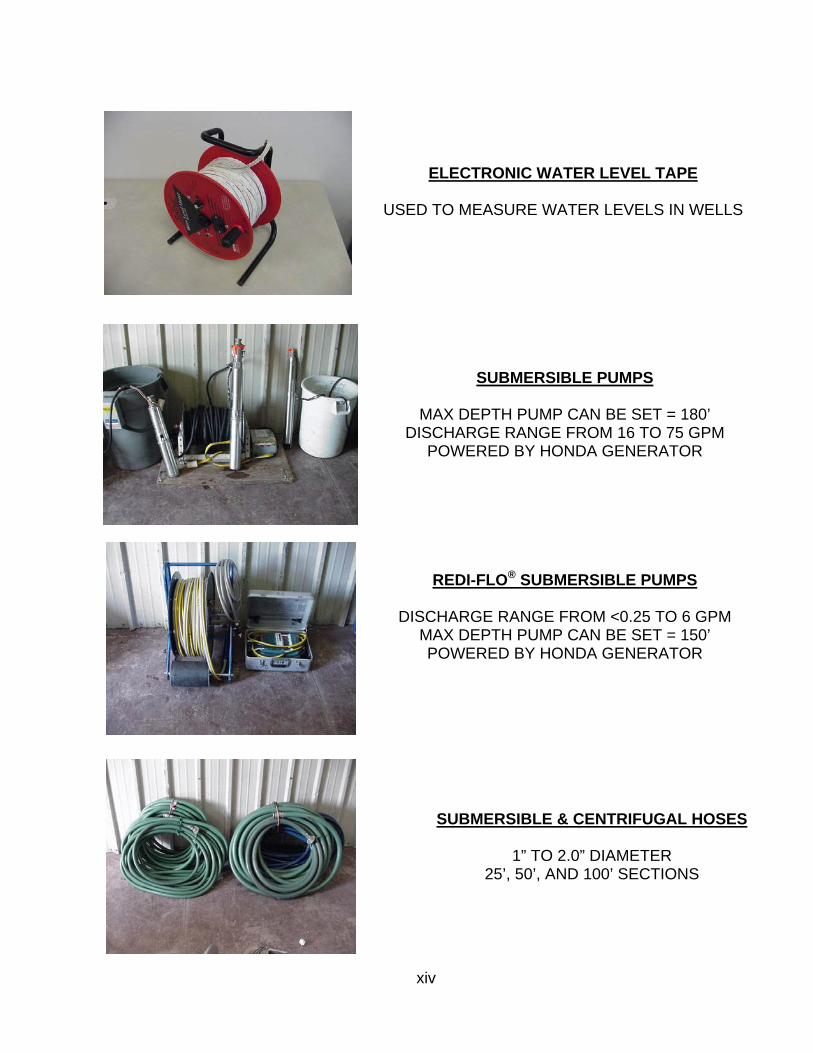
xiv
ELECTRONIC WATER LEVEL TAPE
USED TO MEASURE WATER LEVELS IN WELLS
SUBMERSIBLE PUMPS
MAX DEPTH PUMP CAN BE SET = 180’ DISCHARGE RANGE FROM 16 TO 75 GPM
POWERED BY HONDA GENERATOR
REDI-FLO® SUBMERSIBLE PUMPS
DISCHARGE RANGE FROM <0.25 TO 6 GPM
MAX DEPTH PUMP CAN BE SET = 150’ POWERED BY HONDA GENERATOR
SUBMERSIBLE & CENTRIFUGAL HOSES
1” TO 2.0” DIAMETER 25’, 50’, AND 100’ SECTIONS
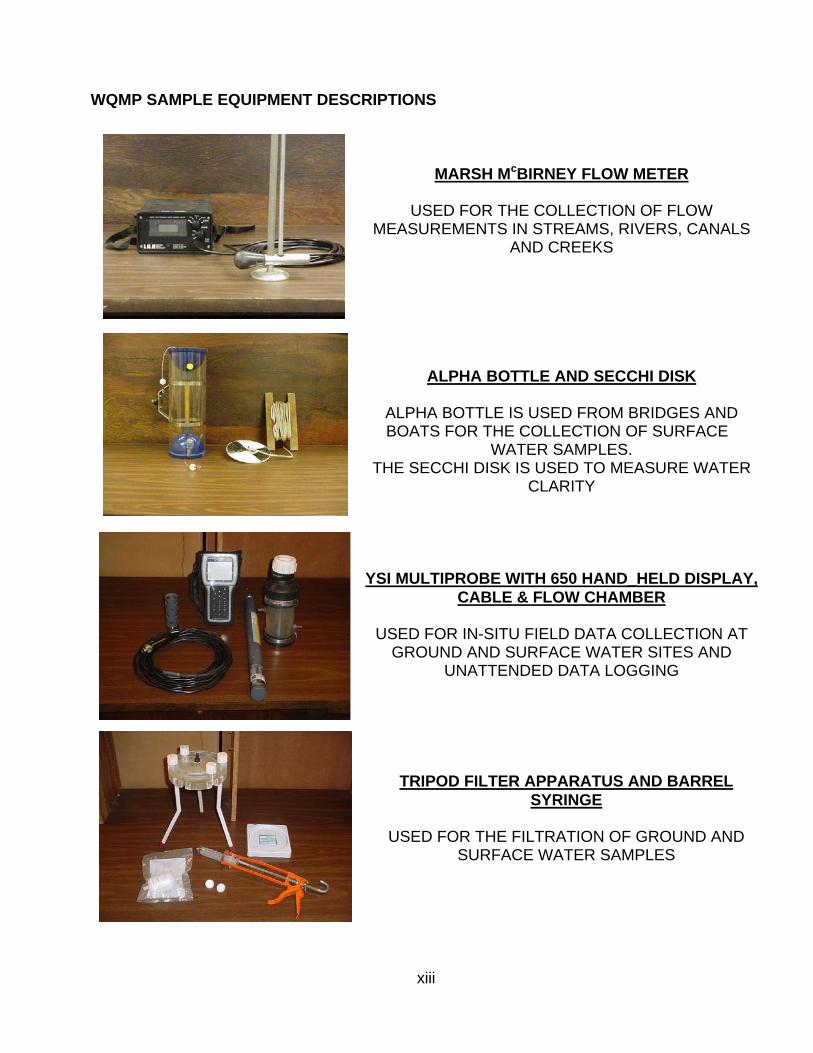
xiii
WQMP SAMPLE EQUIPMENT DESCRIPTIONS
MARSH McBIRNEY FLOW METER
USED FOR THE COLLECTION OF FLOW
MEASUREMENTS IN STREAMS, RIVERS, CANALS AND CREEKS
ALPHA BOTTLE AND SECCHI DISK
ALPHA BOTTLE IS USED FROM BRIDGES AND BOATS FOR THE COLLECTION OF SURFACE
WATER SAMPLES. THE SECCHI DISK IS USED TO MEASURE WATER
CLARITY
YSI MULTIPROBE WITH 650 HAND_HELD DISPLAY, CABLE & FLOW CHAMBER
USED FOR IN-SITU FIELD DATA COLLECTION AT
GROUND AND SURFACE WATER SITES AND UNATTENDED DATA LOGGING
TRIPOD FILTER APPARATUS AND BARREL SYRINGE
USED FOR THE FILTRATION OF GROUND AND
SURFACE WATER SAMPLES
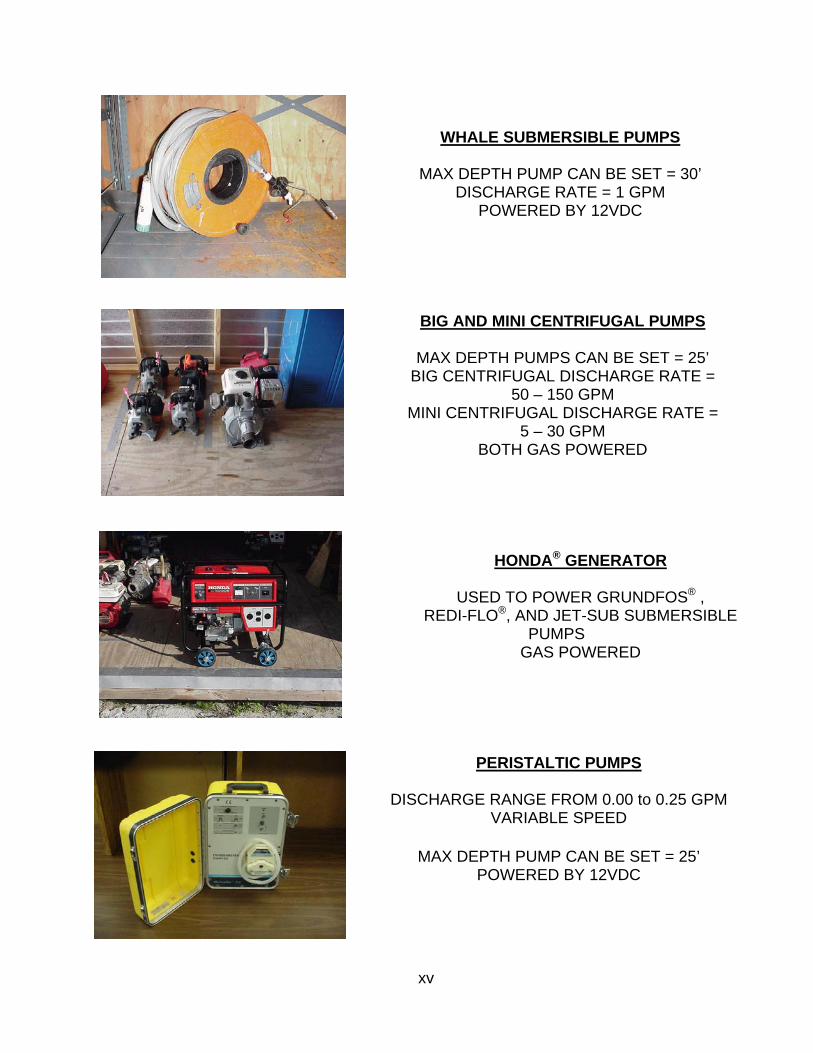
xv
WHALE SUBMERSIBLE PUMPS
MAX DEPTH PUMP CAN BE SET = 30’ DISCHARGE RATE = 1 GPM
POWERED BY 12VDC
BIG AND MINI CENTRIFUGAL PUMPS
MAX DEPTH PUMPS CAN BE SET = 25’ BIG CENTRIFUGAL DISCHARGE RATE =
50 – 150 GPM MINI CENTRIFUGAL DISCHARGE RATE =
5 – 30 GPM BOTH GAS POWERED
HONDA® GENERATOR
USED TO POWER GRUNDFOS® ,
REDI-FLO®, AND JET-SUB SUBMERSIBLE PUMPS
GAS POWERED
PERISTALTIC PUMPS
DISCHARGE RANGE FROM 0.00 to 0.25 GPM VARIABLE SPEED
MAX DEPTH PUMP CAN BE SET = 25’
POWERED BY 12VDC
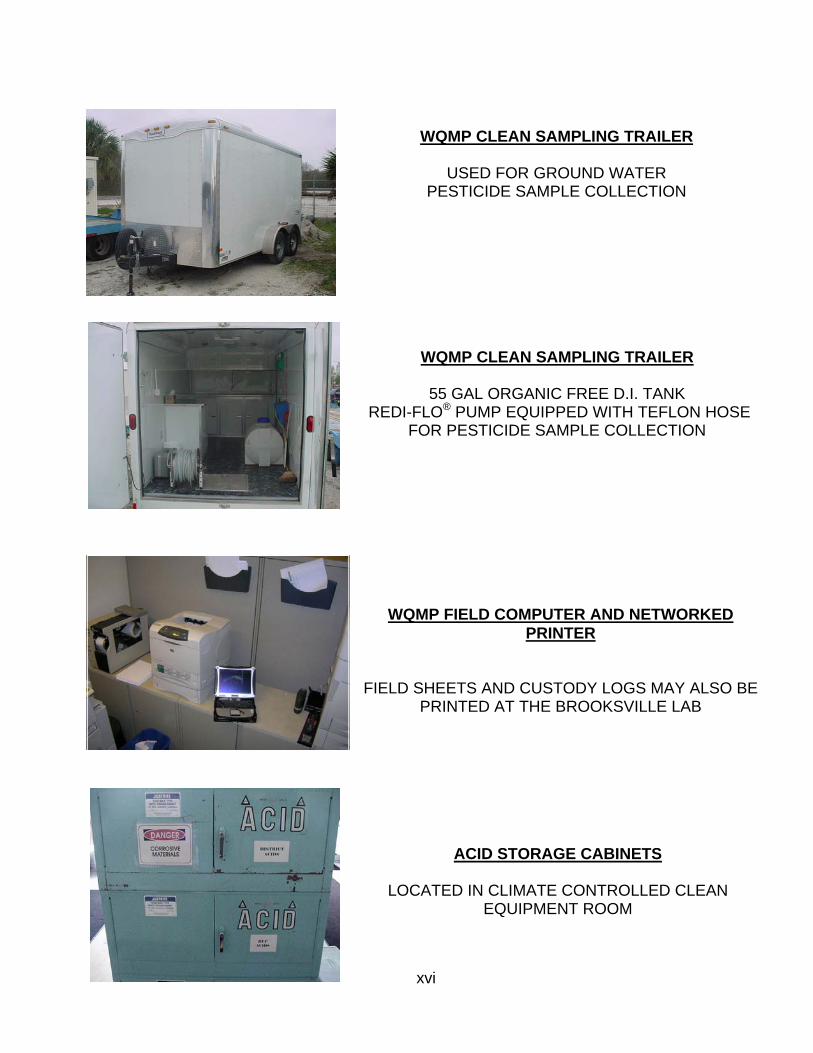
xvi
WQMP CLEAN SAMPLING TRAILER
USED FOR GROUND WATER PESTICIDE SAMPLE COLLECTION
WQMP CLEAN SAMPLING TRAILER
55 GAL ORGANIC FREE D.I. TANK REDI-FLO® PUMP EQUIPPED WITH TEFLON HOSE
FOR PESTICIDE SAMPLE COLLECTION
WQMP FIELD COMPUTER AND NETWORKED PRINTER
FIELD SHEETS AND CUSTODY LOGS MAY ALSO BE PRINTED AT THE BROOKSVILLE LAB
ACID STORAGE CABINETS
LOCATED IN CLIMATE CONTROLLED CLEAN EQUIPMENT ROOM
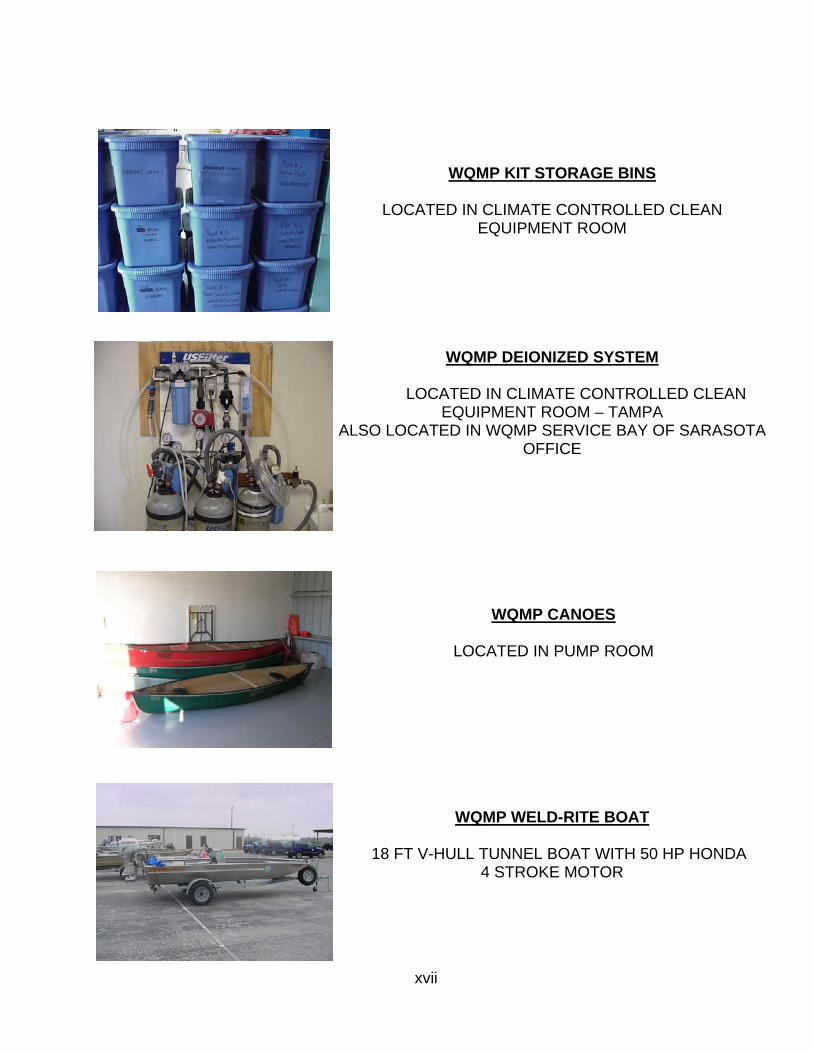
xvii
WQMP KIT STORAGE BINS
LOCATED IN CLIMATE CONTROLLED CLEAN EQUIPMENT ROOM
WQMP DEIONIZED SYSTEM
LOCATED IN CLIMATE CONTROLLED CLEAN EQUIPMENT ROOM – TAMPA
ALSO LOCATED IN WQMP SERVICE BAY OF SARASOTA OFFICE
WQMP CANOES
LOCATED IN PUMP ROOM
WQMP WELD-RITE BOAT
18 FT V-HULL TUNNEL BOAT WITH 50 HP HONDA 4 STROKE MOTOR


xix
Detail 4 Water Level
Instrumentation Instructions

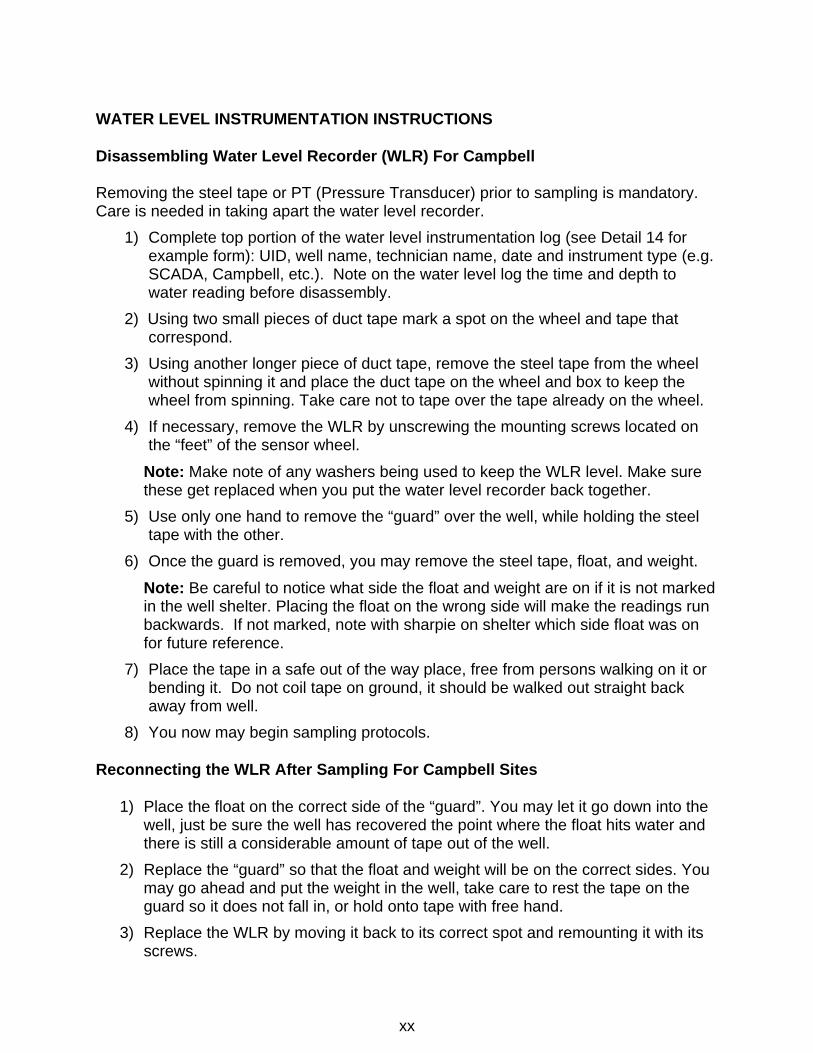
xx
WATER LEVEL INSTRUMENTATION INSTRUCTIONS
Disassembling Water Level Recorder (WLR) For Campbell Removing the steel tape or PT (Pressure Transducer) prior to sampling is mandatory. Care is needed in taking apart the water level recorder.
1) Complete top portion of the water level instrumentation log (see Detail 14 for example form): UID, well name, technician name, date and instrument type (e.g. SCADA, Campbell, etc.). Note on the water level log the time and depth to water reading before disassembly.
2) Using two small pieces of duct tape mark a spot on the wheel and tape that correspond.
3) Using another longer piece of duct tape, remove the steel tape from the wheel without spinning it and place the duct tape on the wheel and box to keep the wheel from spinning. Take care not to tape over the tape already on the wheel.
4) If necessary, remove the WLR by unscrewing the mounting screws located on the “feet” of the sensor wheel.
Note: Make note of any washers being used to keep the WLR level. Make sure these get replaced when you put the water level recorder back together.
5) Use only one hand to remove the “guard” over the well, while holding the steel tape with the other.
6) Once the guard is removed, you may remove the steel tape, float, and weight.
Note: Be careful to notice what side the float and weight are on if it is not marked in the well shelter. Placing the float on the wrong side will make the readings run backwards. If not marked, note with sharpie on shelter which side float was on for future reference.
7) Place the tape in a safe out of the way place, free from persons walking on it or bending it. Do not coil tape on ground, it should be walked out straight back away from well.
8) You now may begin sampling protocols.
Reconnecting the WLR After Sampling For Campbell Sites
1) Place the float on the correct side of the “guard”. You may let it go down into the well, just be sure the well has recovered the point where the float hits water and there is still a considerable amount of tape out of the well.
2) Replace the “guard” so that the float and weight will be on the correct sides. You may go ahead and put the weight in the well, take care to rest the tape on the guard so it does not fall in, or hold onto tape with free hand.
3) Replace the WLR by moving it back to its correct spot and remounting it with its screws.
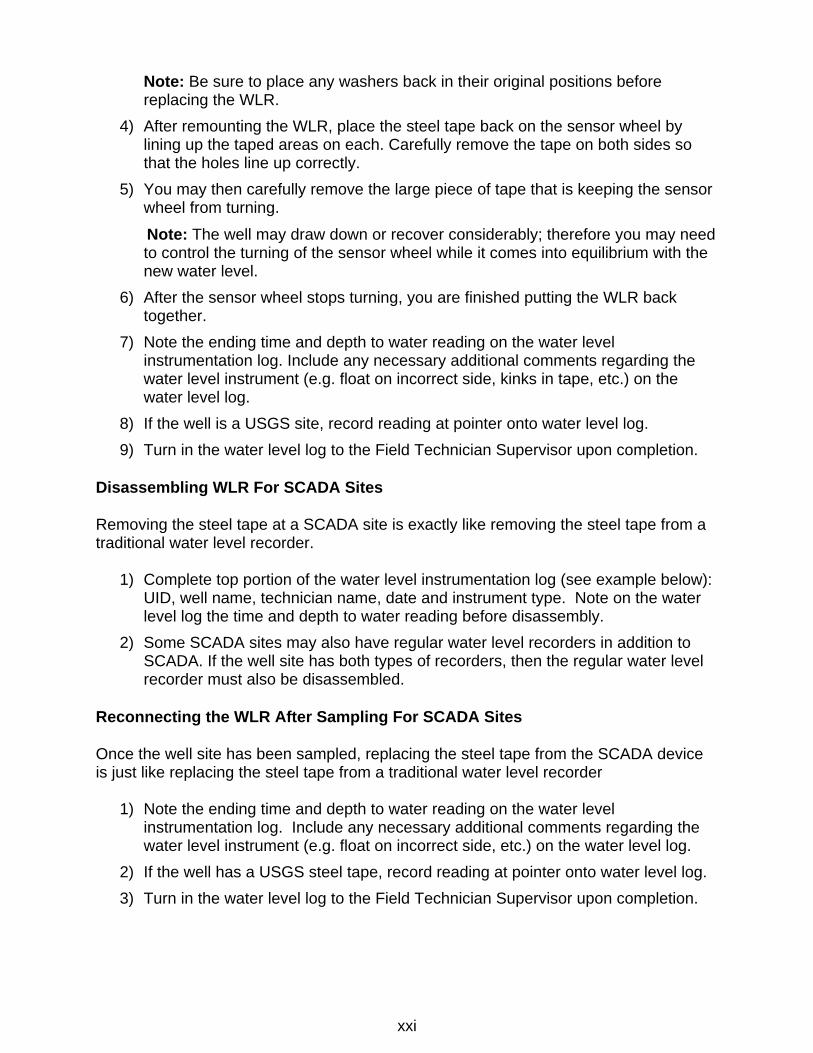
xxi
Note: Be sure to place any washers back in their original positions before replacing the WLR.
4) After remounting the WLR, place the steel tape back on the sensor wheel by lining up the taped areas on each. Carefully remove the tape on both sides so that the holes line up correctly.
5) You may then carefully remove the large piece of tape that is keeping the sensor wheel from turning.
Note: The well may draw down or recover considerably; therefore you may need to control the turning of the sensor wheel while it comes into equilibrium with the new water level.
6) After the sensor wheel stops turning, you are finished putting the WLR back together.
7) Note the ending time and depth to water reading on the water level instrumentation log. Include any necessary additional comments regarding the water level instrument (e.g. float on incorrect side, kinks in tape, etc.) on the water level log.
8) If the well is a USGS site, record reading at pointer onto water level log. 9) Turn in the water level log to the Field Technician Supervisor upon completion.
Disassembling WLR For SCADA Sites Removing the steel tape at a SCADA site is exactly like removing the steel tape from a traditional water level recorder.
1) Complete top portion of the water level instrumentation log (see example below):
UID, well name, technician name, date and instrument type. Note on the water level log the time and depth to water reading before disassembly.
2) Some SCADA sites may also have regular water level recorders in addition to SCADA. If the well site has both types of recorders, then the regular water level recorder must also be disassembled.
Reconnecting the WLR After Sampling For SCADA Sites Once the well site has been sampled, replacing the steel tape from the SCADA device is just like replacing the steel tape from a traditional water level recorder
1) Note the ending time and depth to water reading on the water level
instrumentation log. Include any necessary additional comments regarding the water level instrument (e.g. float on incorrect side, etc.) on the water level log.
2) If the well has a USGS steel tape, record reading at pointer onto water level log. 3) Turn in the water level log to the Field Technician Supervisor upon completion.
xxii
Issues Issues with the water level recording equipment (e.g. cannot be reassembled due to drawdown, weight and float on wrong, the tape and/or float are in bad condition, etc.), will be directed to the appropriate personnel (preferably by e-mail if possible) as listed below, as well as to the technician supervisor and project manager. If the well has USGS equipment on it contact the following USGS personnel: Richard Kane e-mail: [email protected] Office Phone: 813-975-8620 x131 Mark Dickman e-mail: [email protected] Office Phone: 813-975-8620 x165 If the well has District equipment on it contact the following District personnel: Steven Saxon e-mail: [email protected] Office Phone: 352-796-7211 x 4290


xxiii
Detail 5 Well Volume
and Purge Rate/Time Calculation Instructions

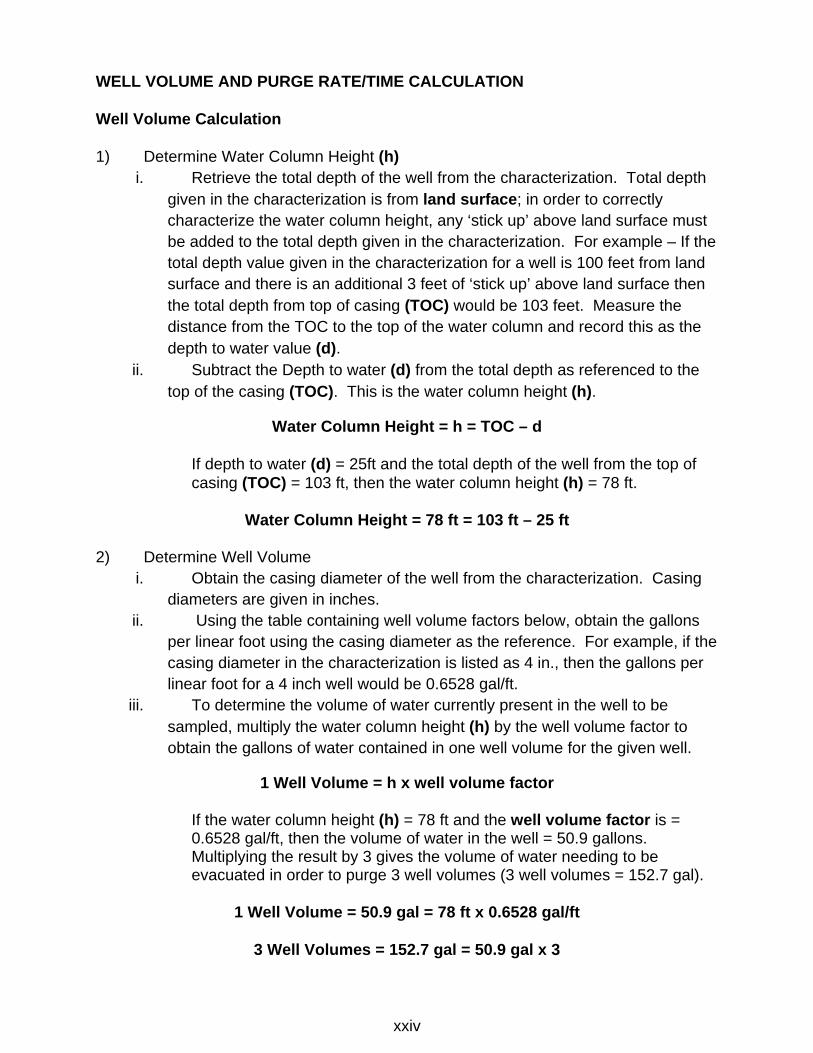
xxiv
WELL VOLUME AND PURGE RATE/TIME CALCULATION Well Volume Calculation 1) Determine Water Column Height (h)
i. Retrieve the total depth of the well from the characterization. Total depth given in the characterization is from land surface; in order to correctly characterize the water column height, any ‘stick up’ above land surface must be added to the total depth given in the characterization. For example – If the total depth value given in the characterization for a well is 100 feet from land surface and there is an additional 3 feet of ‘stick up’ above land surface then the total depth from top of casing (TOC) would be 103 feet. Measure the distance from the TOC to the top of the water column and record this as the depth to water value (d).
ii. Subtract the Depth to water (d) from the total depth as referenced to the top of the casing (TOC). This is the water column height (h).
Water Column Height = h = TOC – d
If depth to water (d) = 25ft and the total depth of the well from the top of casing (TOC) = 103 ft, then the water column height (h) = 78 ft.
Water Column Height = 78 ft = 103 ft – 25 ft
2) Determine Well Volume i. Obtain the casing diameter of the well from the characterization. Casing
diameters are given in inches. ii. Using the table containing well volume factors below, obtain the gallons
per linear foot using the casing diameter as the reference. For example, if the casing diameter in the characterization is listed as 4 in., then the gallons per linear foot for a 4 inch well would be 0.6528 gal/ft.
iii. To determine the volume of water currently present in the well to be sampled, multiply the water column height (h) by the well volume factor to obtain the gallons of water contained in one well volume for the given well.
1 Well Volume = h x well volume factor
If the water column height (h) = 78 ft and the well volume factor is = 0.6528 gal/ft, then the volume of water in the well = 50.9 gallons. Multiplying the result by 3 gives the volume of water needing to be evacuated in order to purge 3 well volumes (3 well volumes = 152.7 gal).
1 Well Volume = 50.9 gal = 78 ft x 0.6528 gal/ft
3 Well Volumes = 152.7 gal = 50.9 gal x 3
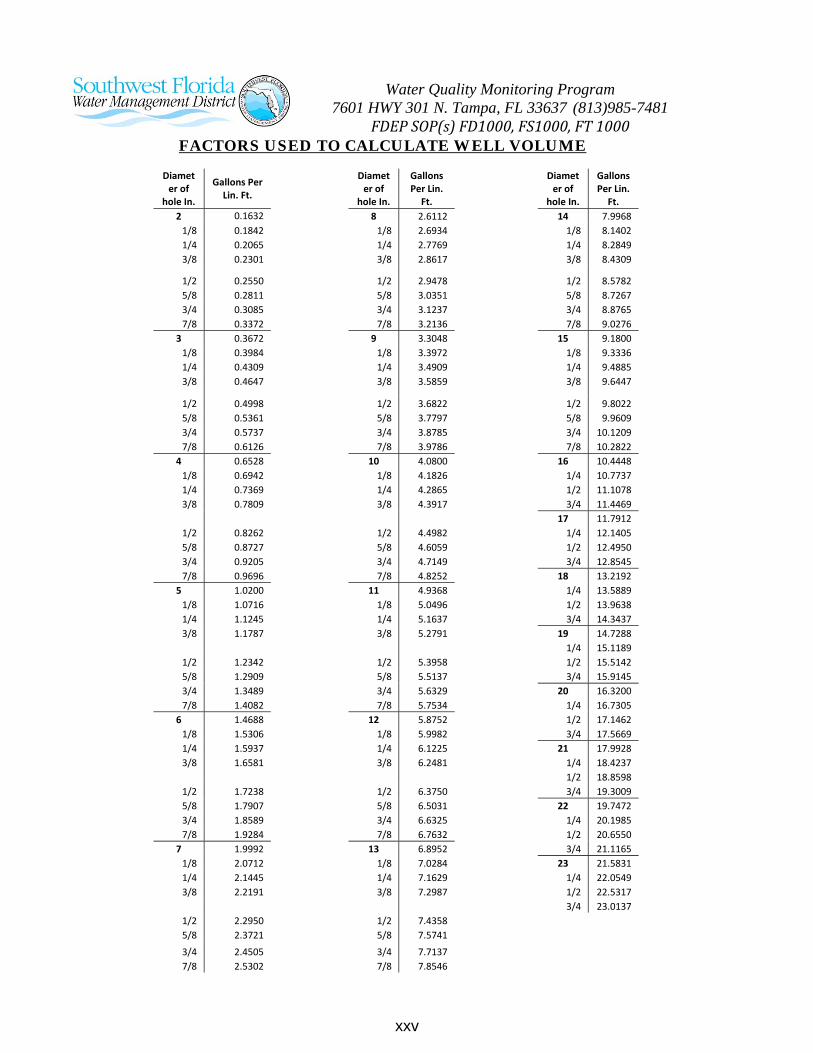
xxv
Water Quality Monitoring Program 7601 HWY 301 N. Tampa, FL 33637 (813)985-7481
FDEP SOP(s) FD1000, FS1000, FT 1000 FACTORS USED TO CALCULATE WELL VOLUME
Diamet
er of hole In.
Gallons Per Lin. Ft.
Diameter of
hole In.
Gallons Per Lin. Ft.
Diameter of
hole In.
Gallons Per Lin. Ft.
2 0.1632 8 2.6112 14 7.9968 1/8 0.1842 1/8 2.6934 1/8 8.1402 1/4 0.2065 1/4 2.7769 1/4 8.2849 3/8 0.2301 3/8 2.8617 3/8 8.4309
1/2 0.2550 1/2 2.9478 1/2 8.5782 5/8 0.2811 5/8 3.0351 5/8 8.7267 3/4 0.3085 3/4 3.1237 3/4 8.8765 7/8 0.3372 7/8 3.2136 7/8 9.0276
3 0.3672 9 3.3048 15 9.1800 1/8 0.3984 1/8 3.3972 1/8 9.3336 1/4 0.4309 1/4 3.4909 1/4 9.4885 3/8 0.4647 3/8 3.5859 3/8 9.6447
1/2 0.4998 1/2 3.6822 1/2 9.8022 5/8 0.5361 5/8 3.7797 5/8 9.9609 3/4 0.5737 3/4 3.8785 3/4 10.1209 7/8 0.6126 7/8 3.9786 7/8 10.2822
4 0.6528 10 4.0800 16 10.4448 1/8 0.6942 1/8 4.1826 1/4 10.7737 1/4 0.7369 1/4 4.2865 1/2 11.1078 3/8 0.7809 3/8 4.3917 3/4 11.4469
17 11.7912 1/2 0.8262 1/2 4.4982 1/4 12.1405 5/8 0.8727 5/8 4.6059 1/2 12.4950 3/4 0.9205 3/4 4.7149 3/4 12.8545 7/8 0.9696 7/8 4.8252 18 13.2192
5 1.0200 11 4.9368 1/4 13.5889 1/8 1.0716 1/8 5.0496 1/2 13.9638 1/4 1.1245 1/4 5.1637 3/4 14.3437 3/8 1.1787 3/8 5.2791 19 14.7288
1/4 15.1189 1/2 1.2342 1/2 5.3958 1/2 15.5142 5/8 1.2909 5/8 5.5137 3/4 15.9145 3/4 1.3489 3/4 5.6329 20 16.3200 7/8 1.4082 7/8 5.7534 1/4 16.7305
6 1.4688 12 5.8752 1/2 17.1462 1/8 1.5306 1/8 5.9982 3/4 17.5669 1/4 1.5937 1/4 6.1225 21 17.9928 3/8 1.6581 3/8 6.2481 1/4 18.4237
1/2 18.8598 1/2 1.7238 1/2 6.3750 3/4 19.3009 5/8 1.7907 5/8 6.5031 22 19.7472 3/4 1.8589 3/4 6.6325 1/4 20.1985 7/8 1.9284 7/8 6.7632 1/2 20.6550
7 1.9992 13 6.8952 3/4 21.1165 1/8 2.0712 1/8 7.0284 23 21.5831 1/4 2.1445 1/4 7.1629 1/4 22.0549 3/8 2.2191 3/8 7.2987 1/2 22.5317
3/4 23.0137 1/2 2.2950 1/2 7.4358 5/8 2.3721 5/8 7.5741 3/4 2.4505 3/4 7.7137
7/8 2.5302 7/8 7.8546

xxvi
Purge Rate/Time Calculation 1) Determine Purge Rate
i. To determine the purge rate for the equipment being utilized to purge the well, use a 5 gallon bucket and a stopwatch. Record the total amount of time (in seconds) it takes to fill the 5 gallon bucket.
ii. Divide the total amount of seconds into 300 sec (since 5 gallons per minute is equal to 5 gals per 300 sec). The result is the purge/flow rate (Q) in gallons per minute (gpm).
Purge Rate = Q gpm = 300 sec / amount of time to fill 5 gallon bucket (in seconds)
If it took 30 secs to fill up the 5 gallon bucket, then the rate at which the pump is purging would be 10 gpm.
Purge Rate = 10 gpm = 300 sec / 30 sec
2) Determine Purge Time i. Using the previously calculated purge volume for the well currently being
sampled, divide by Q (which was obtained when calculating the purge rate). This gives the amount of time in minutes it would take to purge a specific volume from the well.
Purge Time = Purge Volume gal / Q gpm
If the previously calculated purge volume = 50.9 gal for 1 well volume and the purge rate (Q) = 10 gpm, then the time it would take to purge 1 well volume = 5.9 minutes.
Purge Time for 1 Well Volume = 5.9 min = 50.9 gal / 10 gpm
Purge Time for 3 Well Volumes = 15.3 min = 152.7 gal / 10 gpm
3) Determine the Time at which to Collect Readings i. For wells, field readings are typically recorded after each half well volume
has been purged. To determine the time at which each field reading should be recorded, divide the amount of time it would take to purge 3 well volumes by 6. This value can also be obtained by dividing the amount of time it would take to purge 1 well volume by 2.
Time Interval to Collect Field Readings for 0.5 Well Volume = Purge Time for 3 Well Volumes / 6
If the purge time for 3 well volumes = 15.3 min, then the time at which it would take to purge 0.5 well volume = 2.55 min. So every 2.55 min field readings would need to be recorded.
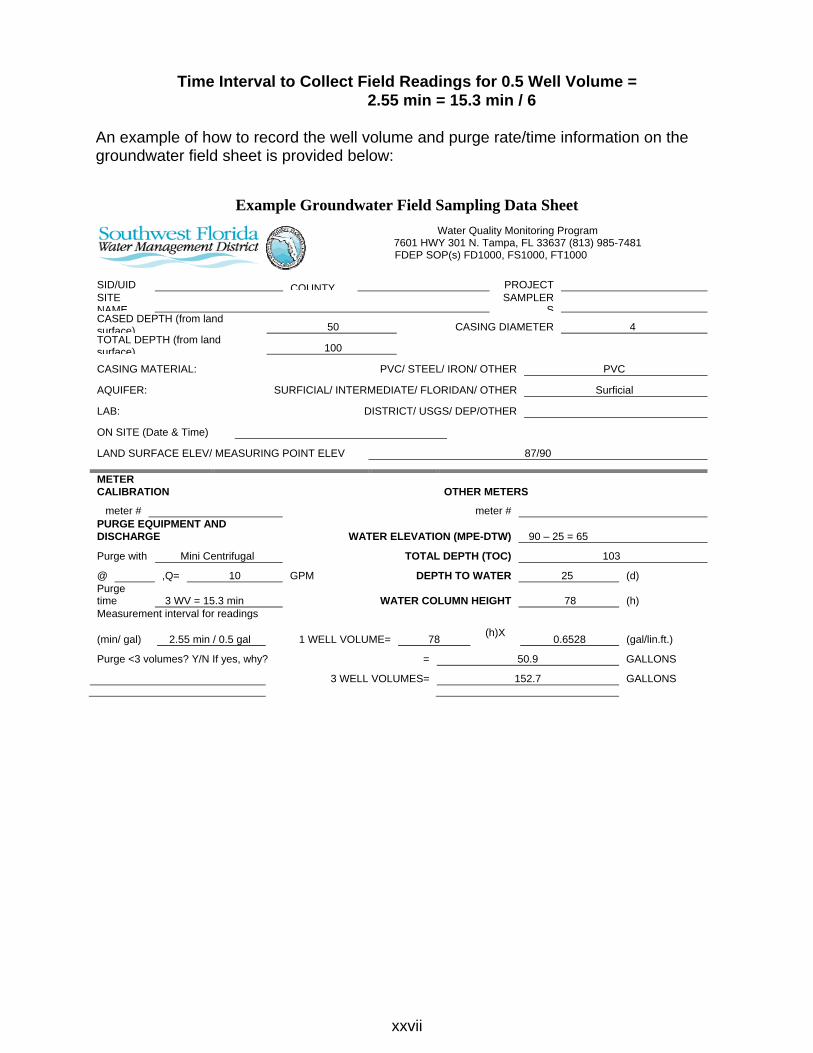
xxvii
Time Interval to Collect Field Readings for 0.5 Well Volume = 2.55 min = 15.3 min / 6
An example of how to record the well volume and purge rate/time information on the groundwater field sheet is provided below:
Example Groundwater Field Sampling Data Sheet
Water Quality Monitoring Program 7601 HWY 301 N. Tampa, FL 33637 (813) 985-7481
FDEP SOP(s) FD1000, FS1000, FT1000
SID/UID COUNTY PROJECT
SITE NAME
SAMPLERS
CASED DEPTH (from land surface) 50 CASING DIAMETER 4 TOTAL DEPTH (from land surface) 100
CASING MATERIAL: PVC/ STEEL/ IRON/ OTHER PVC
AQUIFER: SURFICIAL/ INTERMEDIATE/ FLORIDAN/ OTHER Surficial
LAB: DISTRICT/ USGS/ DEP/OTHER
ON SITE (Date & Time)
LAND SURFACE ELEV/ MEASURING POINT ELEV 87/90
METER CALIBRATION OTHER METERS
meter # meter # PURGE EQUIPMENT AND DISCHARGE WATER ELEVATION (MPE-DTW) 90 – 25 = 65
Purge with Mini Centrifugal TOTAL DEPTH (TOC) 103
@ ,Q= 10 GPM DEPTH TO WATER 25 (d) Purge time 3 WV = 15.3 min WATER COLUMN HEIGHT 78 (h) Measurement interval for readings
(min/ gal) 2.55 min / 0.5 gal 1 WELL VOLUME= 78 (h)X 0.6528 (gal/lin.ft.)
Purge <3 volumes? Y/N If yes, why? = 50.9 GALLONS
3 WELL VOLUMES= 152.7 GALLONS
xxix
Detail 6 Cleaning Day Protocols for
Sample Equipment and Sampling Vehicles

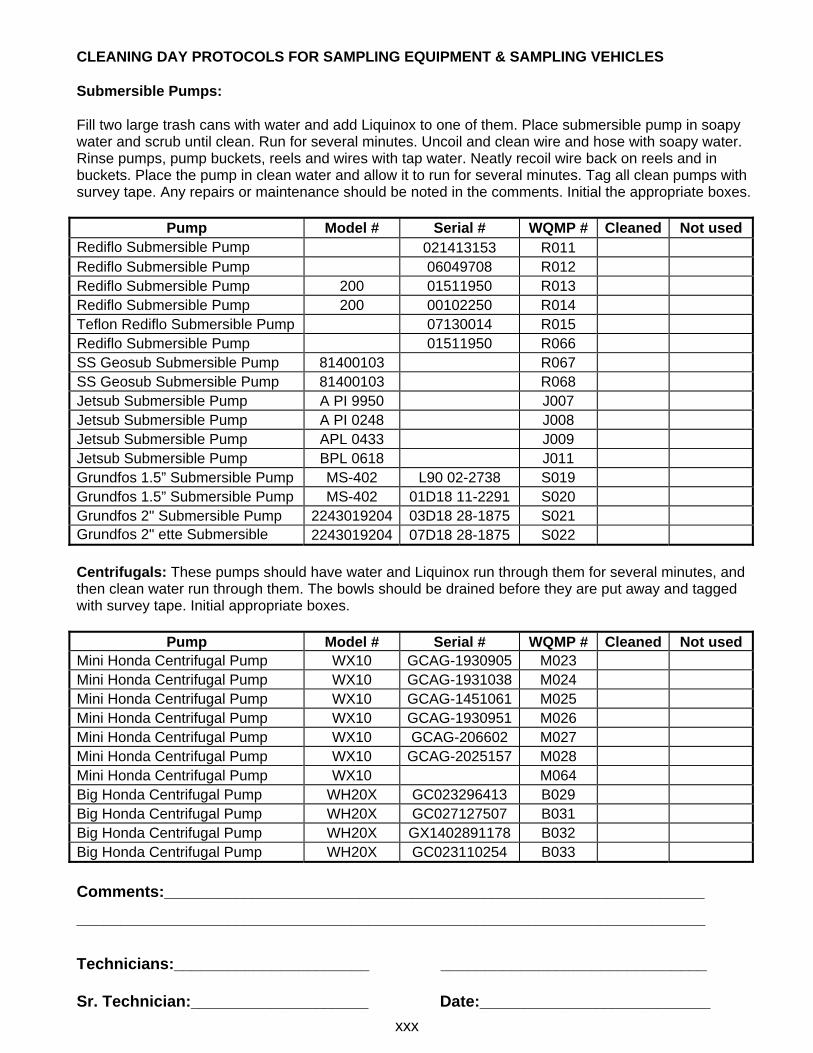
xxx
CLEANING DAY PROTOCOLS FOR SAMPLING EQUIPMENT & SAMPLING VEHICLES Submersible Pumps: Fill two large trash cans with water and add Liquinox to one of them. Place submersible pump in soapy water and scrub until clean. Run for several minutes. Uncoil and clean wire and hose with soapy water. Rinse pumps, pump buckets, reels and wires with tap water. Neatly recoil wire back on reels and in buckets. Place the pump in clean water and allow it to run for several minutes. Tag all clean pumps with survey tape. Any repairs or maintenance should be noted in the comments. Initial the appropriate boxes.
Pump Model # Serial # WQMP # Cleaned Not used Rediflo Submersible Pump 021413153 R011 Rediflo Submersible Pump 06049708 R012 Rediflo Submersible Pump 200 01511950 R013 Rediflo Submersible Pump 200 00102250 R014 Teflon Rediflo Submersible Pump 07130014 R015 Rediflo Submersible Pump 01511950 R066 SS Geosub Submersible Pump 81400103 R067 SS Geosub Submersible Pump 81400103 R068 Jetsub Submersible Pump A PI 9950 J007 Jetsub Submersible Pump A PI 0248 J008 Jetsub Submersible Pump APL 0433 J009 Jetsub Submersible Pump BPL 0618 J011 Grundfos 1.5” Submersible Pump MS-402 L90 02-2738 S019 Grundfos 1.5” Submersible Pump MS-402 01D18 11-2291 S020 Grundfos 2" Submersible Pump 2243019204 03D18 28-1875 S021 Grundfos 2" ette Submersible 2243019204 07D18 28-1875 S022 Centrifugals: These pumps should have water and Liquinox run through them for several minutes, and then clean water run through them. The bowls should be drained before they are put away and tagged with survey tape. Initial appropriate boxes.
Pump Model # Serial # WQMP # Cleaned Not used Mini Honda Centrifugal Pump WX10 GCAG-1930905 M023 Mini Honda Centrifugal Pump WX10 GCAG-1931038 M024 Mini Honda Centrifugal Pump WX10 GCAG-1451061 M025 Mini Honda Centrifugal Pump WX10 GCAG-1930951 M026 Mini Honda Centrifugal Pump WX10 GCAG-206602 M027 Mini Honda Centrifugal Pump WX10 GCAG-2025157 M028 Mini Honda Centrifugal Pump WX10 M064 Big Honda Centrifugal Pump WH20X GC023296413 B029 Big Honda Centrifugal Pump WH20X GC027127507 B031 Big Honda Centrifugal Pump WH20X GX1402891178 B032 Big Honda Centrifugal Pump WH20X GC023110254 B033 Comments:_____________________________________________________________ _______________________________________________________________________ Technicians:______________________ ______________________________ Sr. Technician:____________________ Date:__________________________
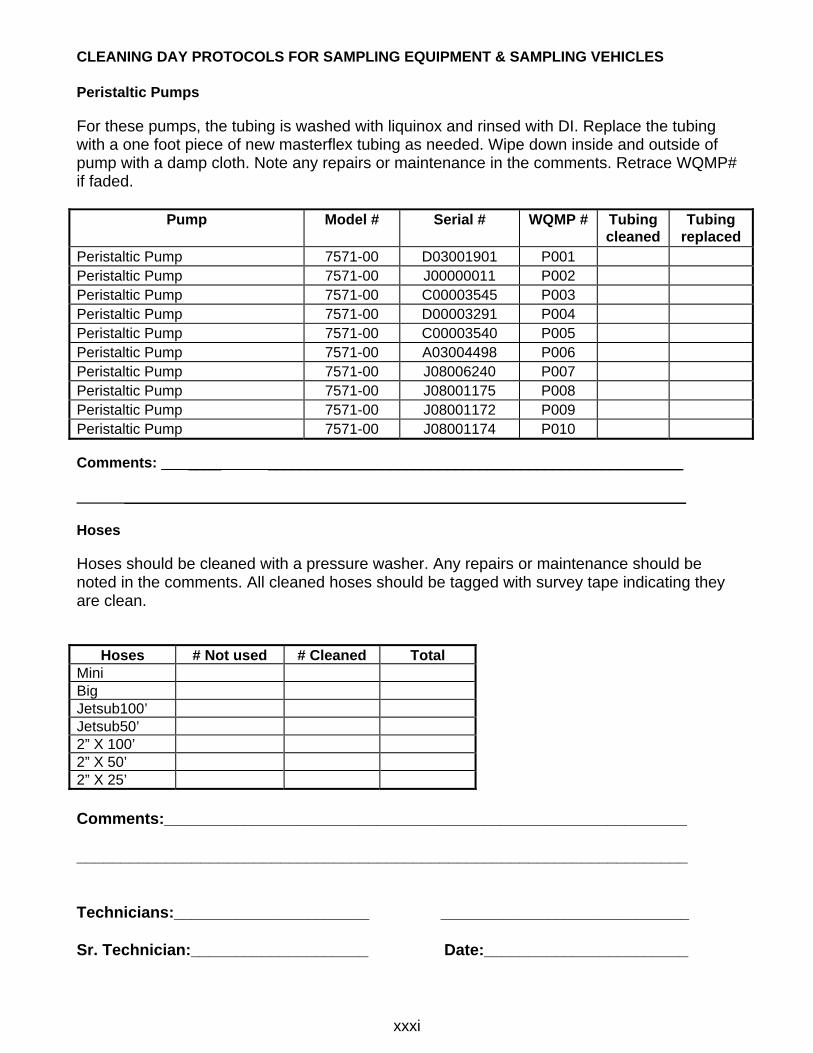
xxxi
CLEANING DAY PROTOCOLS FOR SAMPLING EQUIPMENT & SAMPLING VEHICLES Peristaltic Pumps
For these pumps, the tubing is washed with liquinox and rinsed with DI. Replace the tubing with a one foot piece of new masterflex tubing as needed. Wipe down inside and outside of pump with a damp cloth. Note any repairs or maintenance in the comments. Retrace WQMP# if faded.
Pump Model #
Serial #
WQMP # Tubing cleaned
Tubing replaced
Peristaltic Pump 7571-00 D03001901 P001 Peristaltic Pump 7571-00 J00000011 P002 Peristaltic Pump 7571-00 C00003545 P003 Peristaltic Pump 7571-00 D00003291 P004 Peristaltic Pump 7571-00 C00003540 P005 Peristaltic Pump 7571-00 A03004498 P006 Peristaltic Pump 7571-00 J08006240 P007 Peristaltic Pump 7571-00 J08001175 P008 Peristaltic Pump 7571-00 J08001172 P009 Peristaltic Pump 7571-00 J08001174 P010 Comments: ____ ___________________________________________________ _____________________________________________________________________ Hoses
Hoses should be cleaned with a pressure washer. Any repairs or maintenance should be noted in the comments. All cleaned hoses should be tagged with survey tape indicating they are clean.
Hoses # Not used # Cleaned Total
Mini Big Jetsub100’ Jetsub50’ 2” X 100’ 2” X 50’ 2” X 25’ Comments:___________________________________________________________ _____________________________________________________________________ Technicians:______________________ ____________________________ Sr. Technician:____________________ Date:_______________________
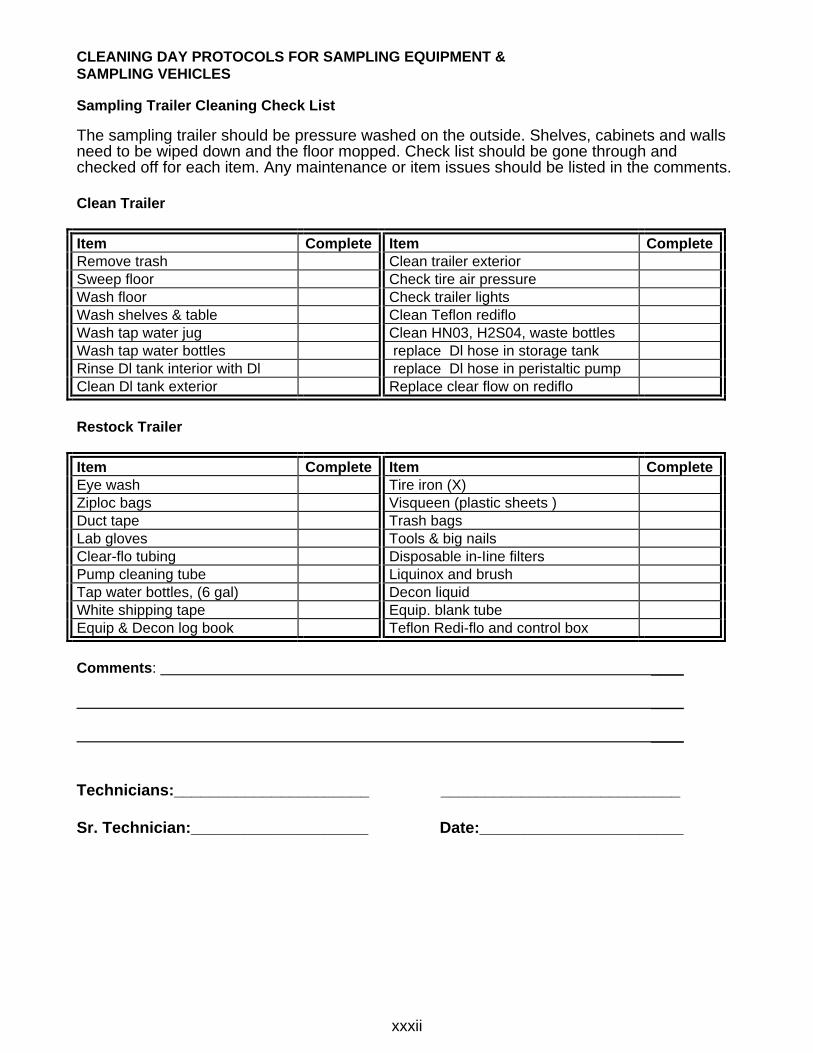
xxxii
CLEANING DAY PROTOCOLS FOR SAMPLING EQUIPMENT & SAMPLING VEHICLES Sampling Trailer Cleaning Check List The sampling trailer should be pressure washed on the outside. Shelves, cabinets and walls need to be wiped down and the floor mopped. Check list should be gone through and checked off for each item. Any maintenance or item issues should be listed in the comments. Clean Trailer Item Complete Item CompleteRemove trash Clean trailer exterior Sweep floor Check tire air pressure Wash floor Check trailer lights Wash shelves & table Clean Teflon rediflo Wash tap water jug Clean HN03, H2S04, waste bottles Wash tap water bottles replace Dl hose in storage tank Rinse Dl tank interior with Dl replace Dl hose in peristaltic pump Clean Dl tank exterior Replace clear flow on rediflo Restock Trailer Item Complete Item CompleteEye wash Tire iron (X) Ziploc bags Visqueen (plastic sheets ) Duct tape Trash bags Lab gloves Tools & big nails Clear-flo tubing Disposable in-Iine filters Pump cleaning tube Liquinox and brush Tap water bottles, (6 gal) Decon liquid White shipping tape Equip. blank tube Equip & Decon log book Teflon Redi-flo and control box Comments: ____ ____ ____
Technicians:______________________ ___________________________ Sr. Technician:____________________ Date:_______________________
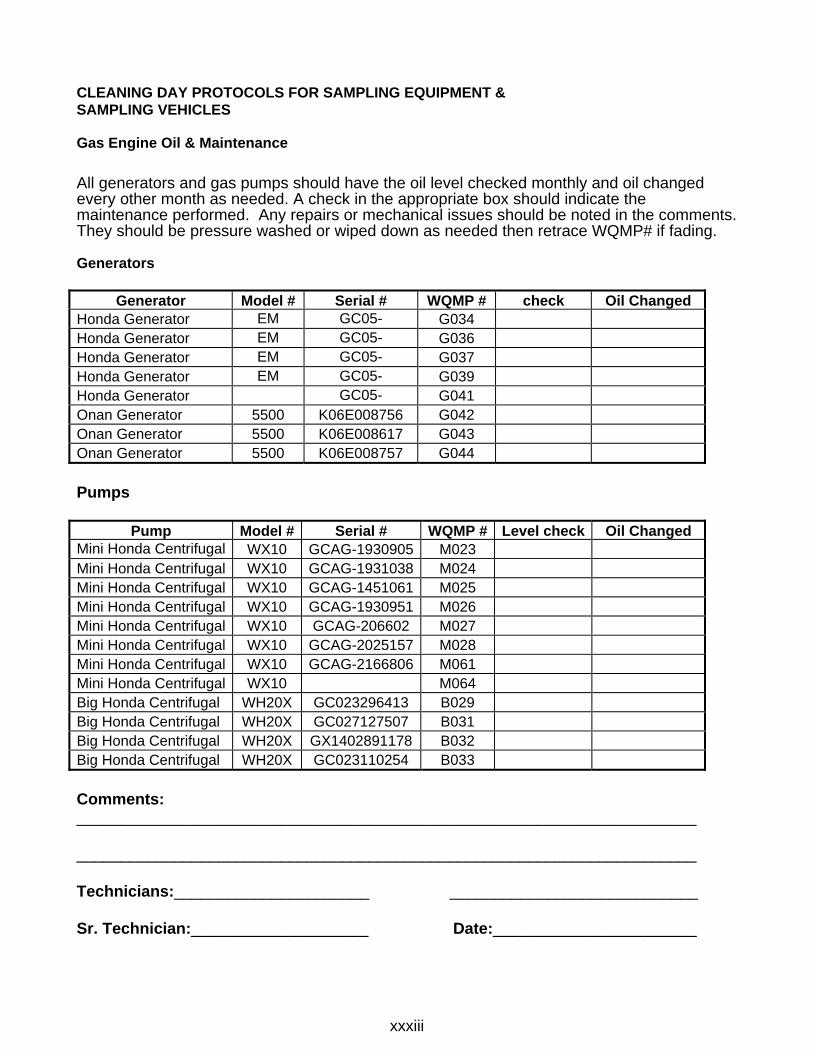
xxxiii
CLEANING DAY PROTOCOLS FOR SAMPLING EQUIPMENT & SAMPLING VEHICLES
Gas Engine Oil & Maintenance
All generators and gas pumps should have the oil level checked monthly and oil changed every other month as needed. A check in the appropriate box should indicate the maintenance performed. Any repairs or mechanical issues should be noted in the comments. They should be pressure washed or wiped down as needed then retrace WQMP# if fading. Generators
Generator Model # Serial # WQMP # check Oil Changed Honda Generator EM GC05- G034 Honda Generator EM GC05- G036 Honda Generator EM GC05- G037 Honda Generator EM GC05- G039 Honda Generator GC05- G041 Onan Generator 5500 K06E008756 G042 Onan Generator 5500 K06E008617 G043 Onan Generator 5500 K06E008757 G044 Pumps
Pump Model # Serial # WQMP # Level check Oil Changed Mini Honda Centrifugal WX10 GCAG-1930905 M023 Mini Honda Centrifugal WX10 GCAG-1931038 M024 Mini Honda Centrifugal WX10 GCAG-1451061 M025 Mini Honda Centrifugal WX10 GCAG-1930951 M026 Mini Honda Centrifugal WX10 GCAG-206602 M027 Mini Honda Centrifugal WX10 GCAG-2025157 M028 Mini Honda Centrifugal WX10 GCAG-2166806 M061 Mini Honda Centrifugal WX10 M064 Big Honda Centrifugal WH20X GC023296413 B029 Big Honda Centrifugal WH20X GC027127507 B031 Big Honda Centrifugal WH20X GX1402891178 B032 Big Honda Centrifugal WH20X GC023110254 B033 Comments: ______________________________________________________________________ ______________________________________________________________________ Technicians:______________________ ____________________________ Sr. Technician:____________________ Date:_______________________
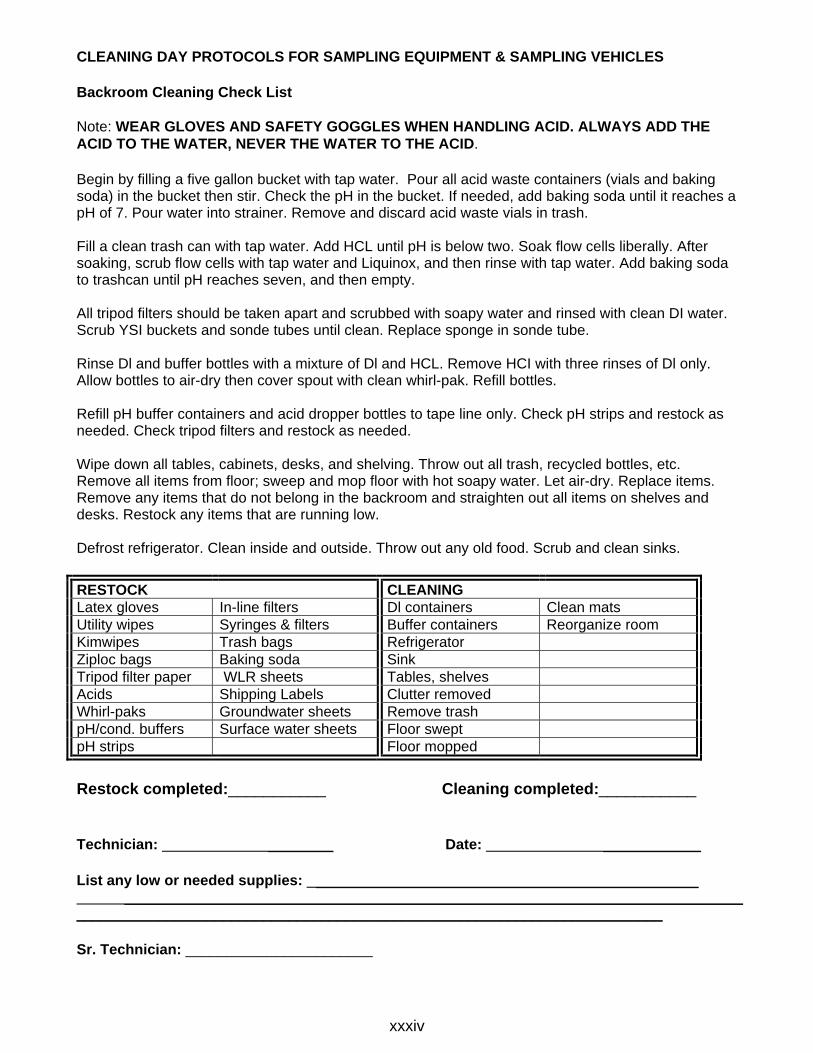
xxxiv
CLEANING DAY PROTOCOLS FOR SAMPLING EQUIPMENT & SAMPLING VEHICLES
Backroom Cleaning Check List
Note: WEAR GLOVES AND SAFETY GOGGLES WHEN HANDLING ACID. ALWAYS ADD THE ACID TO THE WATER, NEVER THE WATER TO THE ACID. Begin by filling a five gallon bucket with tap water. Pour all acid waste containers (vials and baking soda) in the bucket then stir. Check the pH in the bucket. If needed, add baking soda until it reaches a pH of 7. Pour water into strainer. Remove and discard acid waste vials in trash. Fill a clean trash can with tap water. Add HCL until pH is below two. Soak flow cells liberally. After soaking, scrub flow cells with tap water and Liquinox, and then rinse with tap water. Add baking soda to trashcan until pH reaches seven, and then empty. All tripod filters should be taken apart and scrubbed with soapy water and rinsed with clean DI water. Scrub YSI buckets and sonde tubes until clean. Replace sponge in sonde tube. Rinse Dl and buffer bottles with a mixture of Dl and HCL. Remove HCI with three rinses of Dl only. Allow bottles to air-dry then cover spout with clean whirl-pak. Refill bottles. Refill pH buffer containers and acid dropper bottles to tape line only. Check pH strips and restock as needed. Check tripod filters and restock as needed. Wipe down all tables, cabinets, desks, and shelving. Throw out all trash, recycled bottles, etc. Remove all items from floor; sweep and mop floor with hot soapy water. Let air-dry. Replace items. Remove any items that do not belong in the backroom and straighten out all items on shelves and desks. Restock any items that are running low. Defrost refrigerator. Clean inside and outside. Throw out any old food. Scrub and clean sinks. RESTOCK CLEANING Latex gloves In-line filters Dl containers Clean mats Utility wipes Syringes & filters Buffer containers Reorganize room Kimwipes Trash bags Refrigerator Ziploc bags Baking soda Sink Tripod filter paper WLR sheets Tables, shelves Acids Shipping Labels Clutter removed Whirl-paks Groundwater sheets Remove trash pH/cond. buffers Surface water sheets Floor swept pH strips Floor mopped Restock completed:___________ Cleaning completed:___________ Technician: ________ Date: ____________ List any low or needed supplies: _______________________________________________ ____________________________________________________________________________ ________________________________________________________________________ Sr. Technician: _______________________
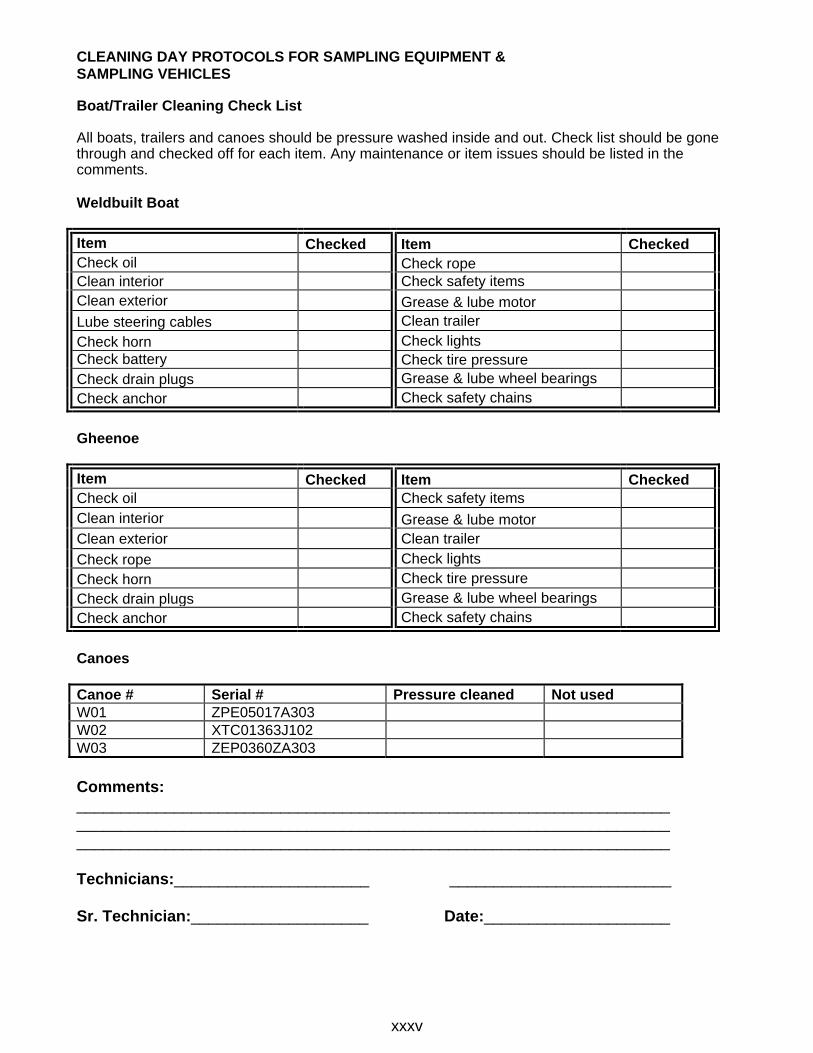
xxxv
CLEANING DAY PROTOCOLS FOR SAMPLING EQUIPMENT & SAMPLING VEHICLES Boat/Trailer Cleaning Check List All boats, trailers and canoes should be pressure washed inside and out. Check list should be gone through and checked off for each item. Any maintenance or item issues should be listed in the comments. Weldbuilt Boat Item Checked Item CheckedCheck oil Check rope Clean interior Check safety items Clean exterior Grease & lube motor Lube steering cables Clean trailer Check horn Check lights Check battery Check tire pressure Check drain plugs Grease & lube wheel bearings Check anchor Check safety chains Gheenoe Item Checked Item CheckedCheck oil Check safety items Clean interior Grease & lube motor Clean exterior Clean trailer Check rope Check lights Check horn Check tire pressure Check drain plugs Grease & lube wheel bearings Check anchor Check safety chains Canoes Canoe # Serial # Pressure cleaned Not used W01 ZPE05017A303 W02 XTC01363J102 W03 ZEP0360ZA303 Comments: ___________________________________________________________________ ___________________________________________________________________ ___________________________________________________________________ Technicians:______________________ _________________________ Sr. Technician:____________________ Date:_____________________
xxxvii
Detail 7 Meter Calibration
and Maintenance Protocols


xxxviii
METER CALIBRATION AND MAINTENANCE PROTOCOLS Meter Calibration Begin by connecting the appropriate length field cable (25ft, 50ft or 100ft) to both the YSI 650 (hand-held display) and the YSI Multi-probe. Make sure all connections are secure and moisture-free. Each sonde has a logbook that is used for documentation of sonde calibrations and mid and post day checks. Select the correct logbook for the sonde you are calibrating and start a new calibration log sheet (see Detail 14 for example form). Begin by filling out the relevant information at the top of the form; sonde #, calibration date, initial calibration time, personnel, and event(s). Initial Calibration Turn on the YSI 650 and scroll to Sonde Menu and hit ENTER. Scroll to Calibrate and hit ENTER ( ) Between and prior to all calibrations rinse the calibration cup well (at least three times with each standard and/or DI). Calibrate in this order: specific conductance, pH, pressure (depth), dissolved oxygen (D.O.). Prior to each calibration add enough standard to the calibration cup to submerse the probes.
1) Specific Conductance – Use a standard of 1000 uS/cm or greater (usually 2764 uS/cm). Write the value of your standard in the ‘Known Value’ field for the Sp. Cond ‘Calibrate’ line of the initial calibration section of your calibration log. Write in the lot # of the standard you are using in the appropriate field of your calibration log.
i. Select Conductivity from the calibrate menu and hit ENTER. ii. Choose SpCond from the conductivity calibration menu and hit ENTER. iii. Input the concentration of your standard in mS/cm (e.g 2764 uS/cm
would be 2.764 mS/cm) and hit ENTER. After you hit enter a real-time display will appear on the screen. Note the specific conductivity and temperature values on the display. Once these values have stabilized, record the specific conductivity value from the display in the “Pre-Calibrated Value” field on your calibration log.
iv. After recording the pre-calibrated value, hit ENTER to calibrate for specific conductivity. The screen will then display the calibrated value. Enter the specific conductivity and temperature values from the display into the ‘Calibrated Value’ and ‘Temp (ºC)’ fields on your calibration log.
v. Hit ENTER to return to the conductivity calibration menu and then ESCAPE (ESC) to get back to the main calibration screen.
vi. Calculate the difference between the known and calibrated values from your calibration log. Then determine if the difference falls within the acceptable range for the parameter (see table below), and write Y or N in the ‘Within Range’ field of the calibration log accordingly.
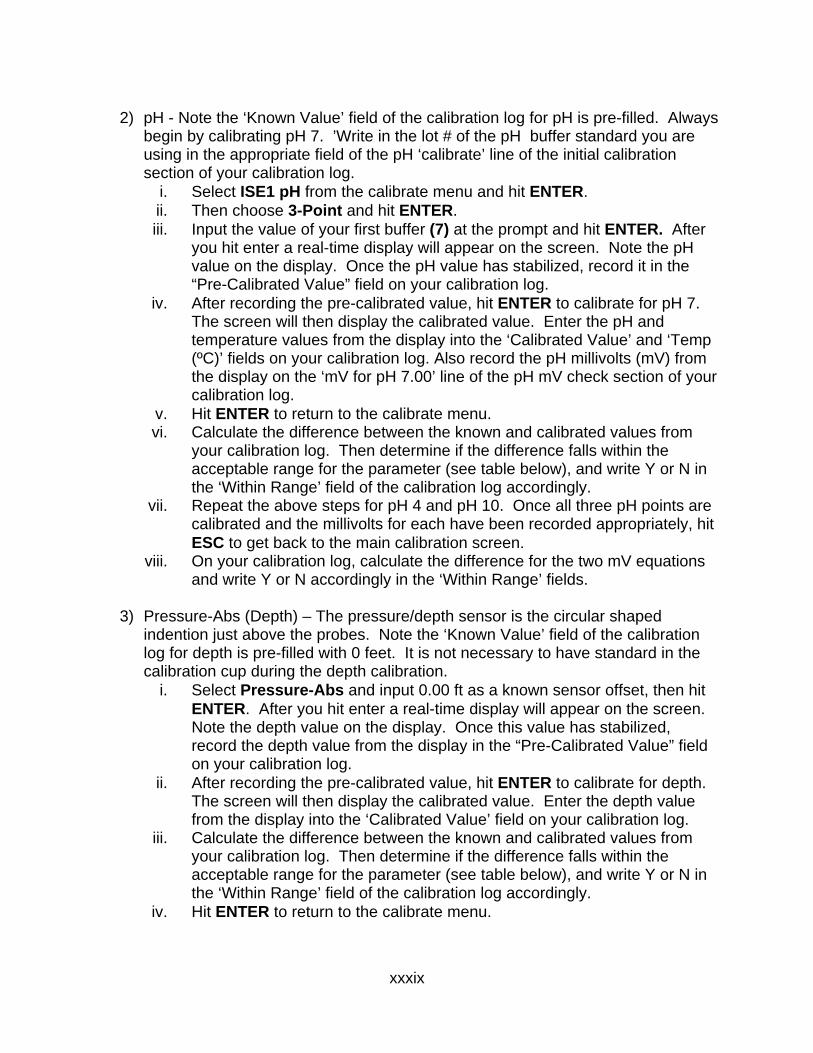
xxxix
2) pH - Note the ‘Known Value’ field of the calibration log for pH is pre-filled. Always begin by calibrating pH 7. ’Write in the lot # of the pH buffer standard you are using in the appropriate field of the pH ‘calibrate’ line of the initial calibration section of your calibration log.
i. Select ISE1 pH from the calibrate menu and hit ENTER. ii. Then choose 3-Point and hit ENTER. iii. Input the value of your first buffer (7) at the prompt and hit ENTER. After
you hit enter a real-time display will appear on the screen. Note the pH value on the display. Once the pH value has stabilized, record it in the “Pre-Calibrated Value” field on your calibration log.
iv. After recording the pre-calibrated value, hit ENTER to calibrate for pH 7. The screen will then display the calibrated value. Enter the pH and temperature values from the display into the ‘Calibrated Value’ and ‘Temp (ºC)’ fields on your calibration log. Also record the pH millivolts (mV) from the display on the ‘mV for pH 7.00’ line of the pH mV check section of your calibration log.
v. Hit ENTER to return to the calibrate menu. vi. Calculate the difference between the known and calibrated values from
your calibration log. Then determine if the difference falls within the acceptable range for the parameter (see table below), and write Y or N in the ‘Within Range’ field of the calibration log accordingly.
vii. Repeat the above steps for pH 4 and pH 10. Once all three pH points are calibrated and the millivolts for each have been recorded appropriately, hit ESC to get back to the main calibration screen.
viii. On your calibration log, calculate the difference for the two mV equations and write Y or N accordingly in the ‘Within Range’ fields.
3) Pressure-Abs (Depth) – The pressure/depth sensor is the circular shaped
indention just above the probes. Note the ‘Known Value’ field of the calibration log for depth is pre-filled with 0 feet. It is not necessary to have standard in the calibration cup during the depth calibration.
i. Select Pressure-Abs and input 0.00 ft as a known sensor offset, then hit ENTER. After you hit enter a real-time display will appear on the screen. Note the depth value on the display. Once this value has stabilized, record the depth value from the display in the “Pre-Calibrated Value” field on your calibration log.
ii. After recording the pre-calibrated value, hit ENTER to calibrate for depth. The screen will then display the calibrated value. Enter the depth value from the display into the ‘Calibrated Value’ field on your calibration log.
iii. Calculate the difference between the known and calibrated values from your calibration log. Then determine if the difference falls within the acceptable range for the parameter (see table below), and write Y or N in the ‘Within Range’ field of the calibration log accordingly.
iv. Hit ENTER to return to the calibrate menu.
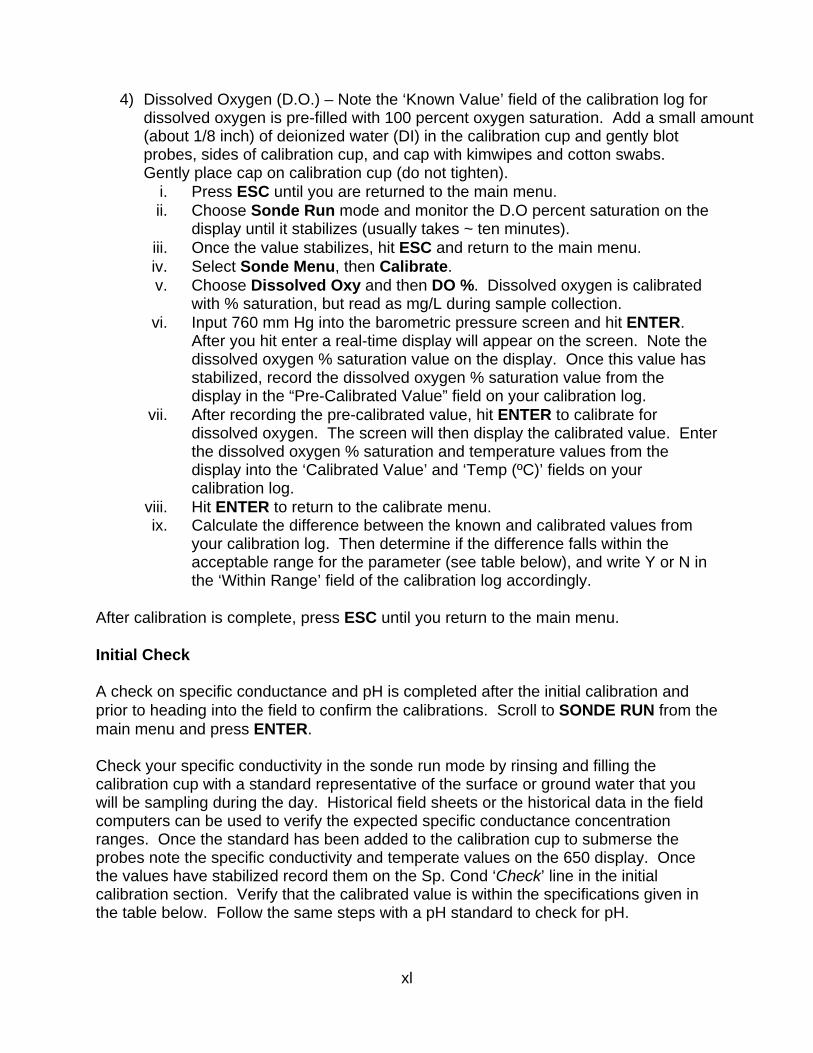
xl
4) Dissolved Oxygen (D.O.) – Note the ‘Known Value’ field of the calibration log for
dissolved oxygen is pre-filled with 100 percent oxygen saturation. Add a small amount (about 1/8 inch) of deionized water (DI) in the calibration cup and gently blot probes, sides of calibration cup, and cap with kimwipes and cotton swabs. Gently place cap on calibration cup (do not tighten).
i. Press ESC until you are returned to the main menu. ii. Choose Sonde Run mode and monitor the D.O percent saturation on the
display until it stabilizes (usually takes ~ ten minutes). iii. Once the value stabilizes, hit ESC and return to the main menu. iv. Select Sonde Menu, then Calibrate. v. Choose Dissolved Oxy and then DO %. Dissolved oxygen is calibrated
with % saturation, but read as mg/L during sample collection. vi. Input 760 mm Hg into the barometric pressure screen and hit ENTER.
After you hit enter a real-time display will appear on the screen. Note the dissolved oxygen % saturation value on the display. Once this value has stabilized, record the dissolved oxygen % saturation value from the display in the “Pre-Calibrated Value” field on your calibration log.
vii. After recording the pre-calibrated value, hit ENTER to calibrate for dissolved oxygen. The screen will then display the calibrated value. Enter the dissolved oxygen % saturation and temperature values from the display into the ‘Calibrated Value’ and ‘Temp (ºC)’ fields on your calibration log.
viii. Hit ENTER to return to the calibrate menu. ix. Calculate the difference between the known and calibrated values from
your calibration log. Then determine if the difference falls within the acceptable range for the parameter (see table below), and write Y or N in the ‘Within Range’ field of the calibration log accordingly.
After calibration is complete, press ESC until you return to the main menu. Initial Check A check on specific conductance and pH is completed after the initial calibration and prior to heading into the field to confirm the calibrations. Scroll to SONDE RUN from the main menu and press ENTER. Check your specific conductivity in the sonde run mode by rinsing and filling the calibration cup with a standard representative of the surface or ground water that you will be sampling during the day. Historical field sheets or the historical data in the field computers can be used to verify the expected specific conductance concentration ranges. Once the standard has been added to the calibration cup to submerse the probes note the specific conductivity and temperate values on the 650 display. Once the values have stabilized record them on the Sp. Cond ‘Check’ line in the initial calibration section. Verify that the calibrated value is within the specifications given in the table below. Follow the same steps with a pH standard to check for pH.
xli
Midday Check Complete a midday check sometime during the day, preferably at or near a sample point that occurs in the middle of the day. The midday is performed in SONDE RUN mode by recording the specific conductance, pH, and dissolved oxygen values from the display on your calibration log in the midday check section and comparing against the acceptable ranges. If no mid-day check is performed, note on the comments section of the calibration log the reason (i.e. no mid-day, only one station sampled). If any parameter fails this check, the sonde will need to be recalibrated for the failed parameter. The recalibration section of the calibration log should be used to record the results of the recalibration. If the recalibration also fails, the technicians should switch to their back-up sonde and begin a new calibration log. Note on the calibration log of the failed sonde the sonde # of the back-up sonde that was used. Post Check At the end of every sample day complete a post-check on the sonde once samplers have arrived back at the office. The post check is performed in SONDE RUN mode by recording the specific conductance, pH, dissolved oxygen, and depth values from the display on your calibration log in the post-use check section and comparing against the acceptable ranges. Meter Failures If any sonde fails the initial calibration/check, midday or post check for a parameter, a Post - Calibration Failure and Sonde Maintenance Report (see Detail 14 for example form) needs to be filled out and turned in to the Field Technician Supervisor along with the field paperwork from the day’s sampling activities. WQMP Meter Maintenance Protocols The responsibility of the meter maintenance technician is to oversee the operation, maintenance, and repair of all the WQMP's meters. The meter maintenance technician is responsible for ensuring that all meters produce reliable and quality data. The meter maintenance technician needs to have a thorough working knowledge of all meters. This requires independent research into the operation of each type of multiprobe. Being familiar with the manuals, consulting knowledgeable District staff, speaking with representatives from the manufacturers, and reading journal articles and texts are all excellent sources of information. The meter maintenance technician must also be able to communicate proper operation and care of the meters as well as any other technical information that may be important to the rest of the WQMP staff. Occasional updates on the proper care and operation of the meters, either during staff meetings or in the form of a memo, are recommended.

xlii
Meter Maintenance
The data that the WQMP collects carries the important underlying assumption that the meters used to collect the data are in proper working order. Routine maintenance is a critical part of the meter maintenance technician's responsibilities; this includes cleaning, calibration and check-ups for all multiprobe meters. Currently the WQMP has (41) YSI® Series 6 sondes. Seventeen of these sondes have the capability to monitor five major field parameters: temperature, pH, specific conductivity, dissolved oxygen, and depth and are currently being used as primary or back-up sondes by WQMP field technicians. Twenty-four of the sondes are equipped to monitor depth, temperature and conductivity – these are used mostly for extended unattended deployments. Each sonde is maintained monthly by the meter maintenance technician in order to keep all aspects of the probes functioning properly. During this maintenance each probe is cleaned, reconditioned, and tested according to manufacturer specifications before being placed back into service. Meter Repair Once the meter maintenance technician is made aware of a problem, they must assess the situation and decide whether the meter is repairable in-house or if it needs to be returned to the manufacturer. If the meter is to be returned for repair to the manufacturer, the company should be contacted to provide information on their return/repair process. The manufacturer will need to receive and assess the meter and provide a quote for the repair cost back to the WQMP. Once the quote has been approved by the WQMP Manager it will be determined if a purchase order (issued by the WQMP administrative assistant) or a District Procurement Card (P-Card) will be used for payment for the repairs. No repairwork should be done to the meter prior to the manufacturer receiving the purchase order in the mail, or the P-card information over the phone.


xliii
Detail 8 Ground and Surface Water
Field Measurement Equipment

xliv
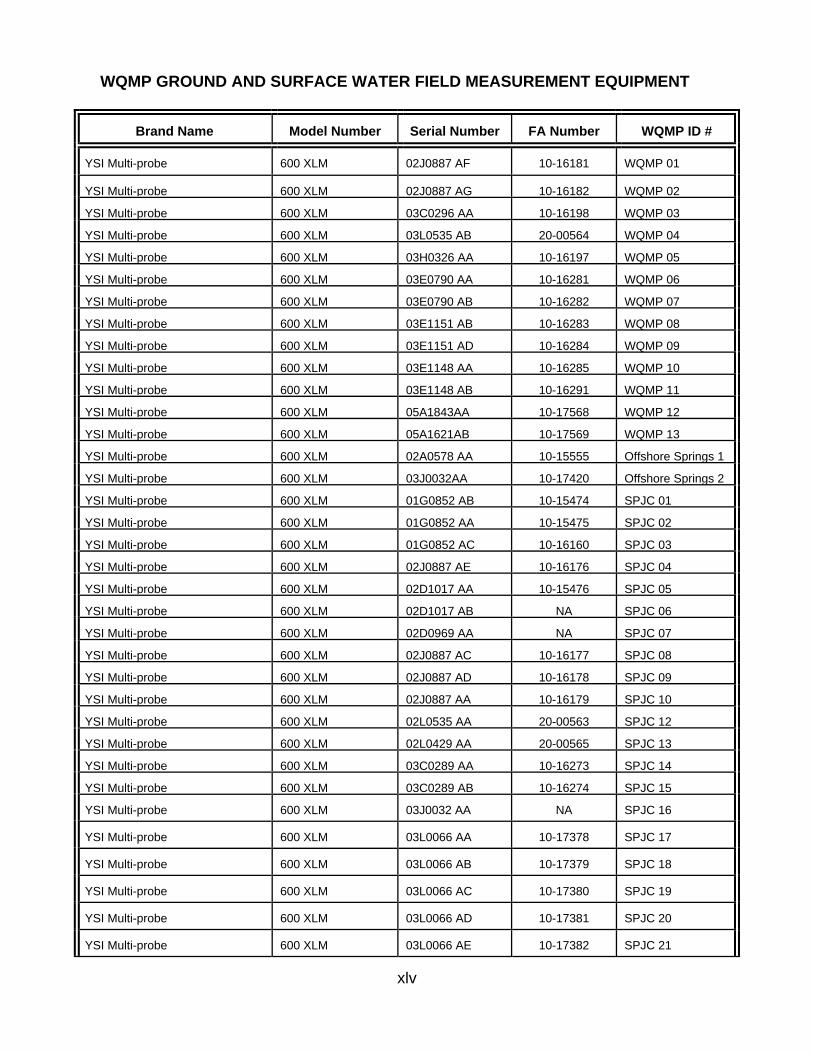
xlv
WQMP GROUND AND SURFACE WATER FIELD MEASUREMENT EQUIPMENT
Brand Name
Model Number Serial Number FA Number
WQMP ID #
YSI Multi-probe
600 XLM 02J0887 AF 10-16181
WQMP 01
YSI Multi-probe
600 XLM 02J0887 AG 10-16182
WQMP 02
YSI Multi-probe
600 XLM 03C0296 AA 10-16198
WQMP 03
YSI Multi-probe
600 XLM 03L0535 AB 20-00564
WQMP 04
YSI Multi-probe
600 XLM 03H0326 AA 10-16197
WQMP 05
YSI Multi-probe
600 XLM 03E0790 AA 10-16281
WQMP 06
YSI Multi-probe
600 XLM 03E0790 AB 10-16282
WQMP 07
YSI Multi-probe
600 XLM 03E1151 AB 10-16283
WQMP 08
YSI Multi-probe
600 XLM 03E1151 AD 10-16284
WQMP 09
YSI Multi-probe
600 XLM 03E1148 AA 10-16285
WQMP 10
YSI Multi-probe
600 XLM 03E1148 AB 10-16291
WQMP 11
YSI Multi-probe
600 XLM 05A1843AA 10-17568
WQMP 12
YSI Multi-probe
600 XLM 05A1621AB 10-17569
WQMP 13
YSI Multi-probe
600 XLM 02A0578 AA 10-15555
Offshore Springs 1
YSI Multi-probe
600 XLM 03J0032AA 10-17420
Offshore Springs 2
YSI Multi-probe
600 XLM 01G0852 AB 10-15474
SPJC 01
YSI Multi-probe
600 XLM 01G0852 AA 10-15475
SPJC 02
YSI Multi-probe
600 XLM 01G0852 AC 10-16160
SPJC 03
YSI Multi-probe
600 XLM 02J0887 AE 10-16176
SPJC 04
YSI Multi-probe
600 XLM 02D1017 AA 10-15476
SPJC 05
YSI Multi-probe
600 XLM 02D1017 AB NA
SPJC 06
YSI Multi-probe
600 XLM 02D0969 AA NA
SPJC 07
YSI Multi-probe
600 XLM 02J0887 AC 10-16177
SPJC 08
YSI Multi-probe
600 XLM 02J0887 AD 10-16178
SPJC 09
YSI Multi-probe
600 XLM 02J0887 AA 10-16179
SPJC 10
YSI Multi-probe
600 XLM 02L0535 AA 20-00563
SPJC 12
YSI Multi-probe
600 XLM 02L0429 AA 20-00565
SPJC 13
YSI Multi-probe
600 XLM 03C0289 AA 10-16273
SPJC 14
YSI Multi-probe
600 XLM 03C0289 AB 10-16274
SPJC 15
YSI Multi-probe
600 XLM 03J0032 AA NA
SPJC 16
YSI Multi-probe
600 XLM 03L0066 AA 10-17378
SPJC 17
YSI Multi-probe
600 XLM 03L0066 AB 10-17379
SPJC 18
YSI Multi-probe
600 XLM 03L0066 AC 10-17380
SPJC 19
YSI Multi-probe
600 XLM 03L0066 AD 10-17381
SPJC 20
YSI Multi-probe
600 XLM 03L0066 AE 10-17382
SPJC 21
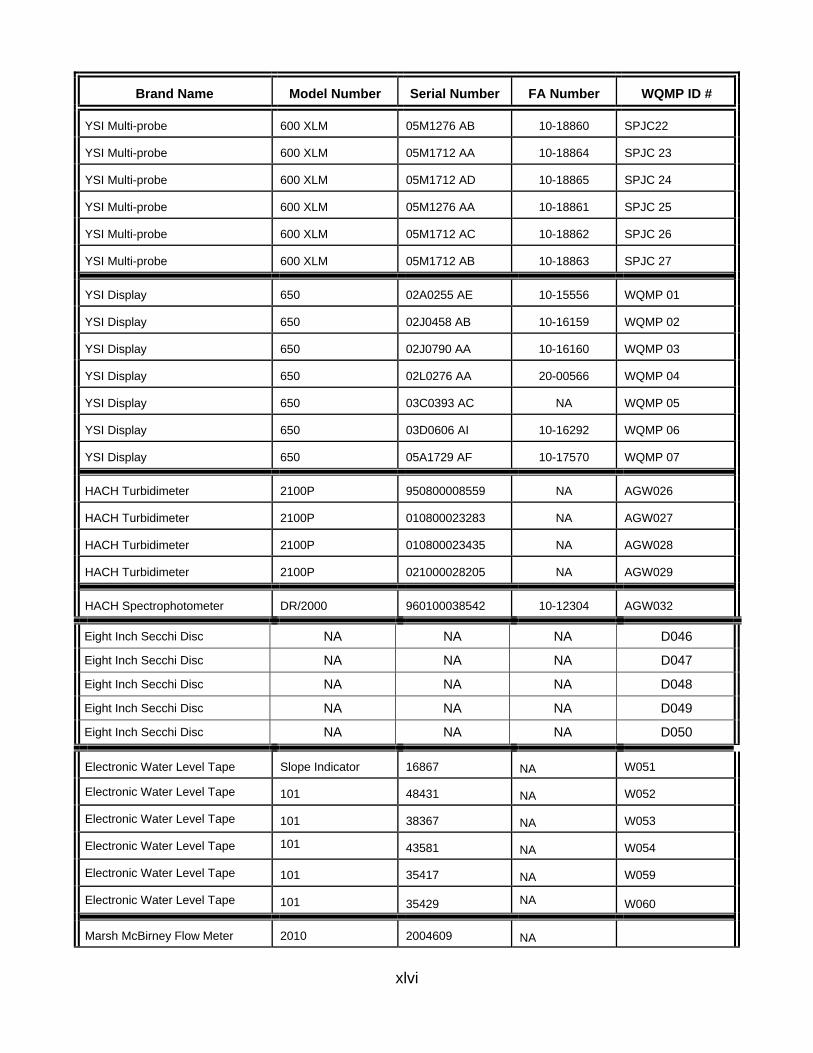
xlvi
Brand Name
Model Number Serial Number FA Number
WQMP ID #
YSI Multi-probe
600 XLM 05M1276 AB 10-18860
SPJC22
YSI Multi-probe
600 XLM 05M1712 AA 10-18864
SPJC 23
YSI Multi-probe
600 XLM 05M1712 AD 10-18865
SPJC 24
YSI Multi-probe
600 XLM 05M1276 AA 10-18861
SPJC 25
YSI Multi-probe
600 XLM 05M1712 AC 10-18862
SPJC 26
YSI Multi-probe
600 XLM 05M1712 AB 10-18863
SPJC 27
YSI Display
650 02A0255 AE 10-15556
WQMP 01
YSI Display
650 02J0458 AB 10-16159
WQMP 02
YSI Display
650 02J0790 AA 10-16160
WQMP 03
YSI Display
650 02L0276 AA 20-00566
WQMP 04
YSI Display
650 03C0393 AC NA
WQMP 05
YSI Display
650 03D0606 AI 10-16292
WQMP 06
YSI Display
650 05A1729 AF 10-17570
WQMP 07
HACH Turbidimeter
2100P 950800008559 NA
AGW026
HACH Turbidimeter
2100P 010800023283 NA
AGW027
HACH Turbidimeter
2100P 010800023435 NA
AGW028
HACH Turbidimeter
2100P 021000028205 NA
AGW029
HACH Spectrophotometer
DR/2000 960100038542 10-12304
AGW032
Eight Inch Secchi Disc NA NA NA D046
Eight Inch Secchi Disc NA NA NA D047
Eight Inch Secchi Disc NA NA NA D048
Eight Inch Secchi Disc NA NA NA D049
Eight Inch Secchi Disc NA NA NA D050 Electronic Water Level Tape
Slope Indicator 16867 NA
W051
Electronic Water Level Tape 101 48431 NA
W052
Electronic Water Level Tape 101 38367 NA
W053
Electronic Water Level Tape 101 43581 NA W054
Electronic Water Level Tape 101 35417 NA
W059
Electronic Water Level Tape 101 35429 NA
W060
Marsh McBirney Flow Meter
2010 2004609 NA

xlvii
Detail 9 Storage Protocols for
Acids, Buffers, and Other Standards

xlviii
WQMP STORAGE PROTOCOLS FOR ACIDS, BUFFERS, AND OTHER STANDARDS Backroom Storage of Acids, Buffers and other Standards The WQMP uses acids and bases for the preservation of samples (Nitric acid - HNO3 and sulfuric acid - H2SO4) and for cleaning certain sampling equipment (Hydrochloricacid - HCl). Acids and bases are stored in approved acid cabinets in the WQMPbackroom, which is kept at a constant, cool temperature. Acids and bases are storedin separate cabinets for safety reasons. Specific conductance standards, pH buffers, and field reference standards are stored in the WQMP backroom on safe and secure shelves. Gallex 900, a Galloway product used for the decontamination of Citrus Canker on trucks, is safely stored in the WQMP backroom on a lower, secure shelf. Anti-bacterial soap, typically used on clothing and foot wear in conjunction with projects requiring Gallex 900, is also stored on adjacent, lower, secure shelf in the WQMP backroom. Isopropyl alcohol, used in small quantities for cleaning various sampling equipment (e.g. meters), is stored in the WQMP backroom in a secure shelving unit. Vehicular Chemical Storage The WQMP maintains a small fleet of trucks used for field acquisition of samples. Meters are taken into the field with sampling crews. These meters are field checked requiring buffers and other standards to be transported. The following chemicals are used in the field and therefore are temporarily stored on trucks: pH buffers and specific conductivity standards. These items are maintained on the truck in a compartment along with internal ice packs for temperature control. Acids and bases used for sample preservation are temporarily stored in field vehicles during the work day. They are maintained on the truck in a compartment along with internal ice packs for temperature control. The acids are removed from the trucks and re-stored in the acid storage cabinet over the weekend. H2SO4 is stored in 40 ml. Teflon dropper bottles (for District projects) and is securely placed in a foam block for transportation into the field. HNO3 is stored in snap-off glass vials which are kept in pre-packaged dual foam storage blocks. Used acid vials are discarded and stored in discrete Nalgene containers which have been partially filled with sodium bicarbonate (baking soda) which serves as a neutralizing agent. Gallex-900 and anti-bacterial soap, used for decontamination of Citrus Canker, are stored on trucks in a safe and stable location to be determined by field sampling crews. Other chemicals stored on trucks include (but are not limited to): wasp and bug spray, 2-cycle and motor oil, Liquid Wrench lubricant spray, sun screen, Liquinox brand soap.
xlix
Other WQMP Safety Issues Eye-wash stations are set up in two locations within the WQMP. The first station is located in the clean equipment room in a clearly marked, easily accessed location. The second station is located on the backdoor of the DACS sampling trailer, and is also easily accessible. Eye-wash bottles contain a mild saline solution and their contents are frequently checked by the WQMP safety representative and/or the District safety representative. District first-aid kits are located in each truck, typically stored in the backseat area of the cab which is easily accessed in time of need. Also stored in this region is a Sawyer Extractor snake and insect bite kit. WQMP staff who are assigned vehicles communicate with the WQMP safety representative to report items which are needed to restock kits. A wall-mounted First-Aid kit is also maintained in the WQMP backroom. It should always be easy to locate. Fire extinguishers are stored in all WQMP and District vehicles. These are checked and refilled annually (at minimum). They are located alongside front seat(s) of cab, on floor boards near doorways. Material Safety Data Sheets (MSDS) The MSDS is stored in a highly visible, readily accessible location in the WQMP clean equipment room. Its contents include information regarding all chemicals stored in the backroom (acids, Gallex, etc.). Chemical contents, clean-up and emergency procedures, contact information, and potential safety hazards, etc., can typically be found within the MSDS for a given chemical. This information is available for all staff. The MSDS is always easy to locate and access, including accessibility by those outside the WQMP in time of fire or other emergency. In time of fire or other emergency, it should be easy to find by firemen or other emergency personnel without assistance by WQMP staff. Therefore, it must be kept visible!
li
Detail 10 SPJC Watersheds YSI Data Sonde
Logging Protocol

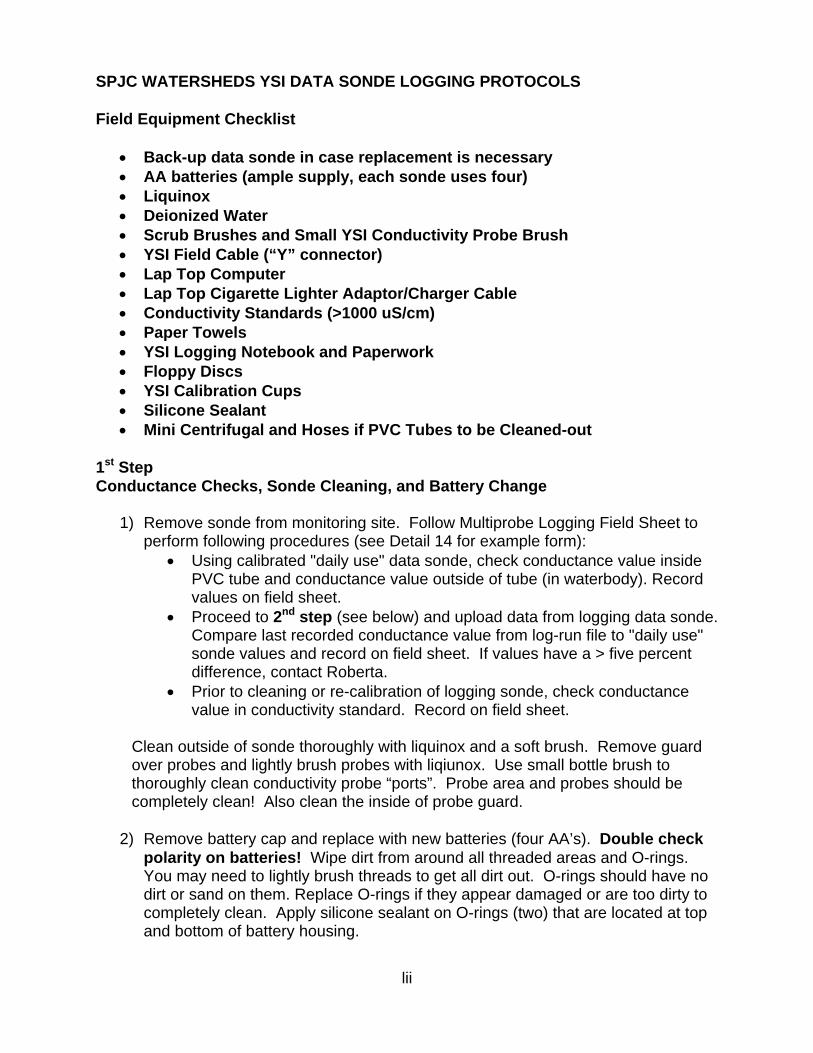
lii
SPJC WATERSHEDS YSI DATA SONDE LOGGING PROTOCOLS Field Equipment Checklist
• Back-up data sonde in case replacement is necessary • AA batteries (ample supply, each sonde uses four) • Liquinox • Deionized Water • Scrub Brushes and Small YSI Conductivity Probe Brush • YSI Field Cable (“Y” connector) • Lap Top Computer • Lap Top Cigarette Lighter Adaptor/Charger Cable • Conductivity Standards (>1000 uS/cm) • Paper Towels • YSI Logging Notebook and Paperwork • Floppy Discs • YSI Calibration Cups • Silicone Sealant • Mini Centrifugal and Hoses if PVC Tubes to be Cleaned-out
1st Step Conductance Checks, Sonde Cleaning, and Battery Change
1) Remove sonde from monitoring site. Follow Multiprobe Logging Field Sheet to perform following procedures (see Detail 14 for example form):
• Using calibrated "daily use" data sonde, check conductance value inside PVC tube and conductance value outside of tube (in waterbody). Record values on field sheet.
• Proceed to 2nd step (see below) and upload data from logging data sonde. Compare last recorded conductance value from log-run file to "daily use" sonde values and record on field sheet. If values have a > five percent difference, contact Roberta.
• Prior to cleaning or re-calibration of logging sonde, check conductance value in conductivity standard. Record on field sheet.
Clean outside of sonde thoroughly with liquinox and a soft brush. Remove guard over probes and lightly brush probes with liqiunox. Use small bottle brush to thoroughly clean conductivity probe “ports”. Probe area and probes should be completely clean! Also clean the inside of probe guard.
2) Remove battery cap and replace with new batteries (four AA’s). Double check
polarity on batteries! Wipe dirt from around all threaded areas and O-rings. You may need to lightly brush threads to get all dirt out. O-rings should have no dirt or sand on them. Replace O-rings if they appear damaged or are too dirty to completely clean. Apply silicone sealant on O-rings (two) that are located at top and bottom of battery housing.
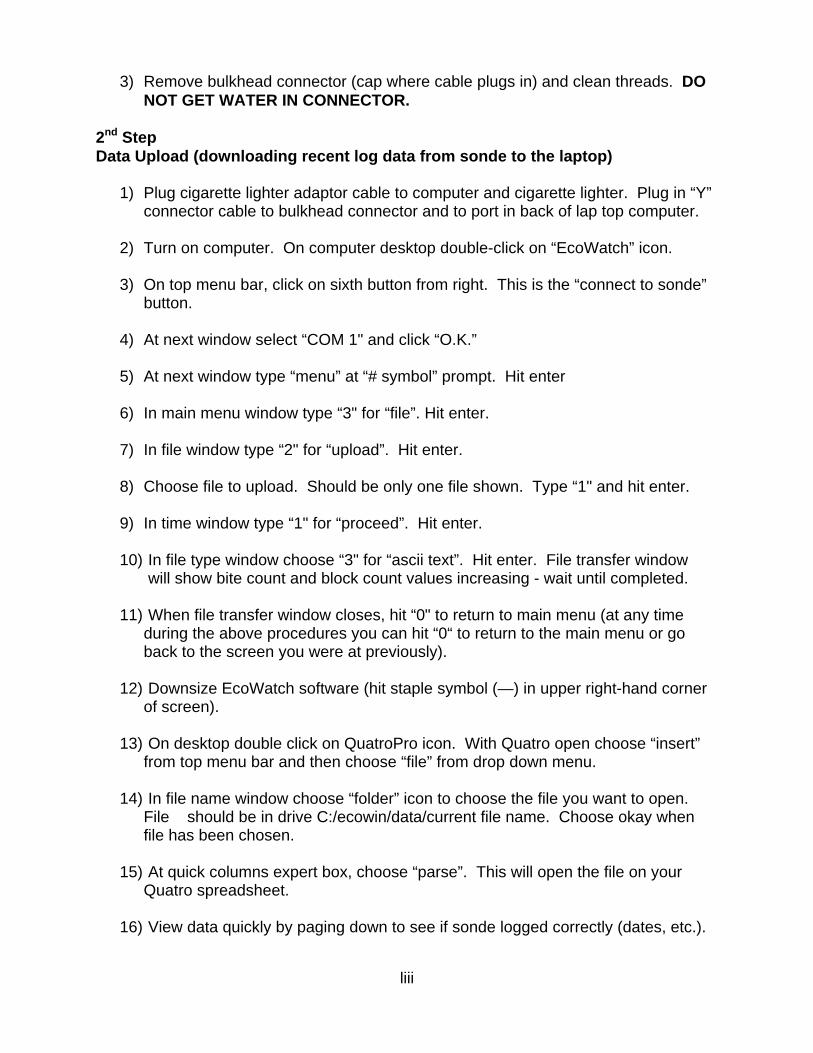
liii
3) Remove bulkhead connector (cap where cable plugs in) and clean threads. DO NOT GET WATER IN CONNECTOR.
2nd Step Data Upload (downloading recent log data from sonde to the laptop)
1) Plug cigarette lighter adaptor cable to computer and cigarette lighter. Plug in “Y” connector cable to bulkhead connector and to port in back of lap top computer.
2) Turn on computer. On computer desktop double-click on “EcoWatch” icon.
3) On top menu bar, click on sixth button from right. This is the “connect to sonde”
button.
4) At next window select “COM 1" and click “O.K.”
5) At next window type “menu” at “# symbol” prompt. Hit enter
6) In main menu window type “3" for “file”. Hit enter.
7) In file window type “2" for “upload”. Hit enter.
8) Choose file to upload. Should be only one file shown. Type “1" and hit enter.
9) In time window type “1" for “proceed”. Hit enter.
10) In file type window choose “3" for “ascii text”. Hit enter. File transfer window will show bite count and block count values increasing - wait until completed.
11) When file transfer window closes, hit “0" to return to main menu (at any time
during the above procedures you can hit “0“ to return to the main menu or go back to the screen you were at previously).
12) Downsize EcoWatch software (hit staple symbol (—) in upper right-hand corner
of screen).
13) On desktop double click on QuatroPro icon. With Quatro open choose “insert” from top menu bar and then choose “file” from drop down menu.
14) In file name window choose “folder” icon to choose the file you want to open.
File should be in drive C:/ecowin/data/current file name. Choose okay when file has been chosen.
15) At quick columns expert box, choose “parse”. This will open the file on your
Quatro spreadsheet.
16) View data quickly by paging down to see if sonde logged correctly (dates, etc.).
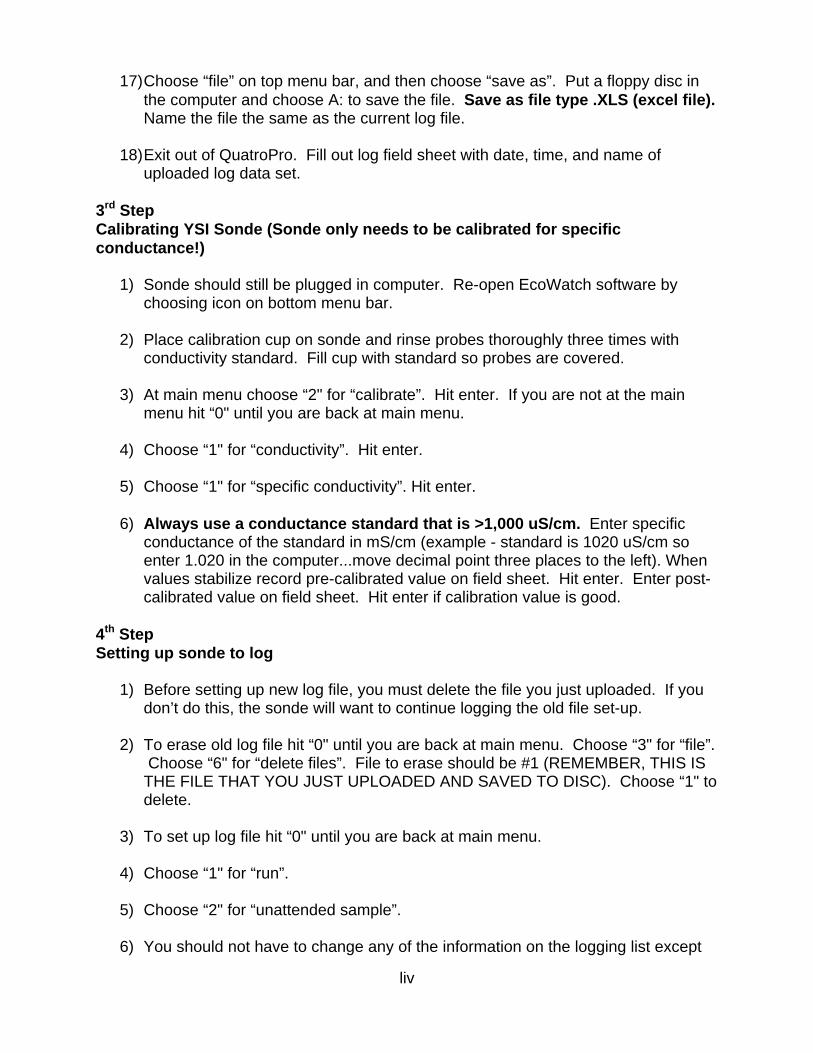
liv
17) Choose “file” on top menu bar, and then choose “save as”. Put a floppy disc in the computer and choose A: to save the file. Save as file type .XLS (excel file). Name the file the same as the current log file.
18) Exit out of QuatroPro. Fill out log field sheet with date, time, and name of
uploaded log data set. 3rd Step Calibrating YSI Sonde (Sonde only needs to be calibrated for specific conductance!)
1) Sonde should still be plugged in computer. Re-open EcoWatch software by choosing icon on bottom menu bar.
2) Place calibration cup on sonde and rinse probes thoroughly three times with
conductivity standard. Fill cup with standard so probes are covered.
3) At main menu choose “2" for “calibrate”. Hit enter. If you are not at the main menu hit “0" until you are back at main menu.
4) Choose “1" for “conductivity”. Hit enter.
5) Choose “1" for “specific conductivity”. Hit enter.
6) Always use a conductance standard that is >1,000 uS/cm. Enter specific
conductance of the standard in mS/cm (example - standard is 1020 uS/cm so enter 1.020 in the computer...move decimal point three places to the left). When values stabilize record pre-calibrated value on field sheet. Hit enter. Enter post-calibrated value on field sheet. Hit enter if calibration value is good.
4th Step Setting up sonde to log
1) Before setting up new log file, you must delete the file you just uploaded. If you don’t do this, the sonde will want to continue logging the old file set-up.
2) To erase old log file hit “0" until you are back at main menu. Choose “3" for “file”.
Choose “6" for “delete files”. File to erase should be #1 (REMEMBER, THIS IS THE FILE THAT YOU JUST UPLOADED AND SAVED TO DISC). Choose “1" to delete.
3) To set up log file hit “0" until you are back at main menu.
4) Choose “1" for “run”.
5) Choose “2" for “unattended sample”.
6) You should not have to change any of the information on the logging list except
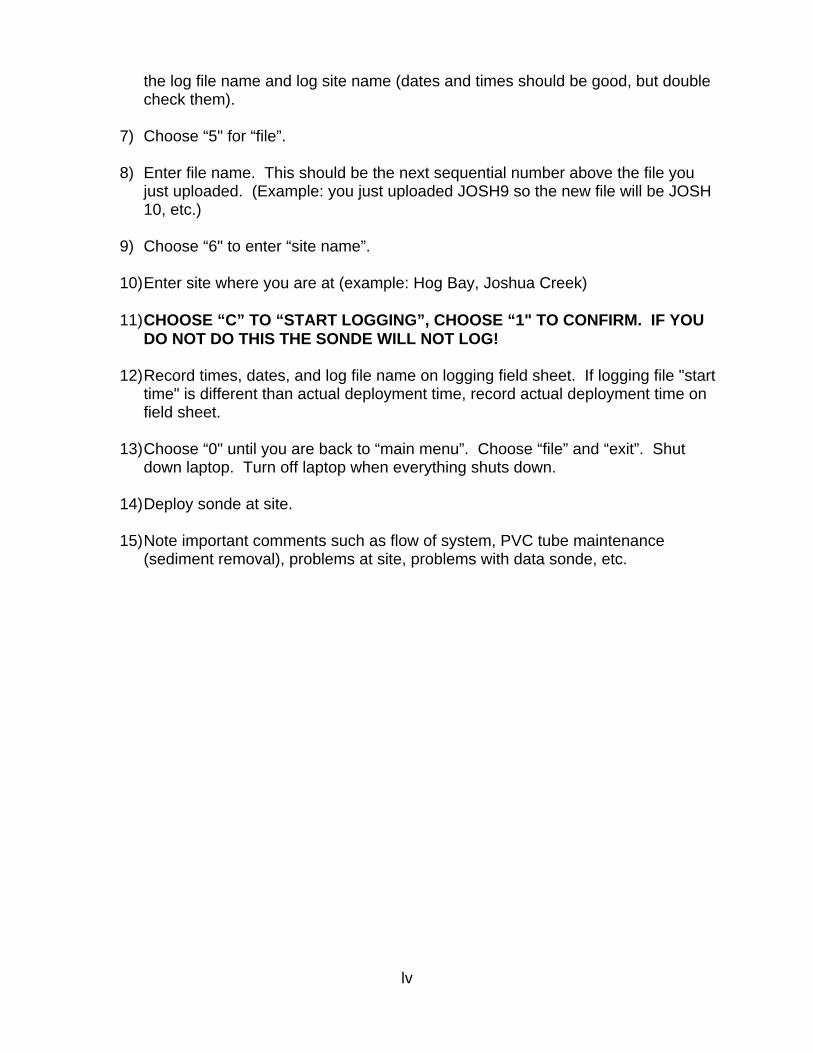
lv
the log file name and log site name (dates and times should be good, but double check them).
7) Choose “5" for “file”.
8) Enter file name. This should be the next sequential number above the file you
just uploaded. (Example: you just uploaded JOSH9 so the new file will be JOSH 10, etc.)
9) Choose “6" to enter “site name”.
10) Enter site where you are at (example: Hog Bay, Joshua Creek)
11) CHOOSE “C” TO “START LOGGING”, CHOOSE “1" TO CONFIRM. IF YOU
DO NOT DO THIS THE SONDE WILL NOT LOG!
12) Record times, dates, and log file name on logging field sheet. If logging file "start time" is different than actual deployment time, record actual deployment time on field sheet.
13) Choose “0" until you are back to “main menu”. Choose “file” and “exit”. Shut
down laptop. Turn off laptop when everything shuts down.
14) Deploy sonde at site.
15) Note important comments such as flow of system, PVC tube maintenance (sediment removal), problems at site, problems with data sonde, etc.

lvii
Detail 11 Citrus Canker
Sanitation Protocol

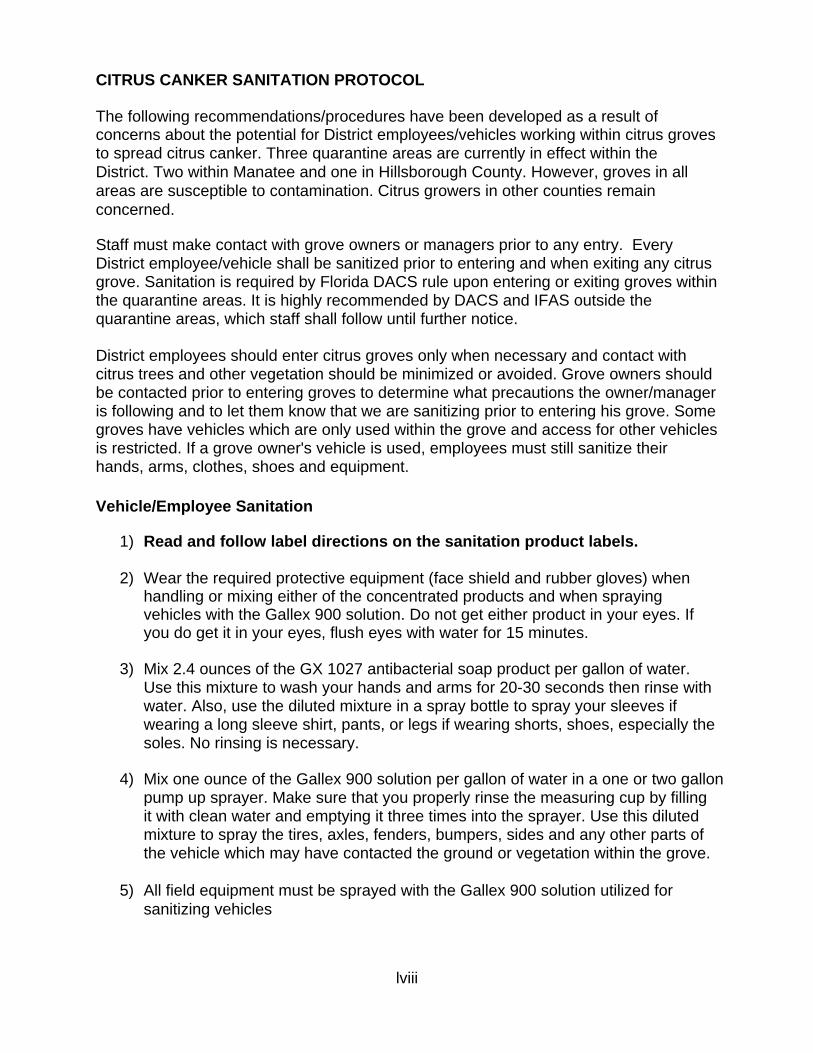
lviii
CITRUS CANKER SANITATION PROTOCOL
The following recommendations/procedures have been developed as a result of concerns about the potential for District employees/vehicles working within citrus groves to spread citrus canker. Three quarantine areas are currently in effect within the District. Two within Manatee and one in Hillsborough County. However, groves in all areas are susceptible to contamination. Citrus growers in other counties remain concerned.
Staff must make contact with grove owners or managers prior to any entry. Every District employee/vehicle shall be sanitized prior to entering and when exiting any citrus grove. Sanitation is required by Florida DACS rule upon entering or exiting groves within the quarantine areas. It is highly recommended by DACS and IFAS outside the quarantine areas, which staff shall follow until further notice.
District employees should enter citrus groves only when necessary and contact with citrus trees and other vegetation should be minimized or avoided. Grove owners should be contacted prior to entering groves to determine what precautions the owner/manager is following and to let them know that we are sanitizing prior to entering his grove. Some groves have vehicles which are only used within the grove and access for other vehicles is restricted. If a grove owner's vehicle is used, employees must still sanitize their hands, arms, clothes, shoes and equipment.
Vehicle/Employee Sanitation
1) Read and follow label directions on the sanitation product labels.
2) Wear the required protective equipment (face shield and rubber gloves) when handling or mixing either of the concentrated products and when spraying vehicles with the Gallex 900 solution. Do not get either product in your eyes. If you do get it in your eyes, flush eyes with water for 15 minutes.
3) Mix 2.4 ounces of the GX 1027 antibacterial soap product per gallon of water. Use this mixture to wash your hands and arms for 20-30 seconds then rinse with water. Also, use the diluted mixture in a spray bottle to spray your sleeves if wearing a long sleeve shirt, pants, or legs if wearing shorts, shoes, especially the soles. No rinsing is necessary.
4) Mix one ounce of the Gallex 900 solution per gallon of water in a one or two gallon pump up sprayer. Make sure that you properly rinse the measuring cup by filling it with clean water and emptying it three times into the sprayer. Use this diluted mixture to spray the tires, axles, fenders, bumpers, sides and any other parts of the vehicle which may have contacted the ground or vegetation within the grove.
5) All field equipment must be sprayed with the Gallex 900 solution utilized for sanitizing vehicles
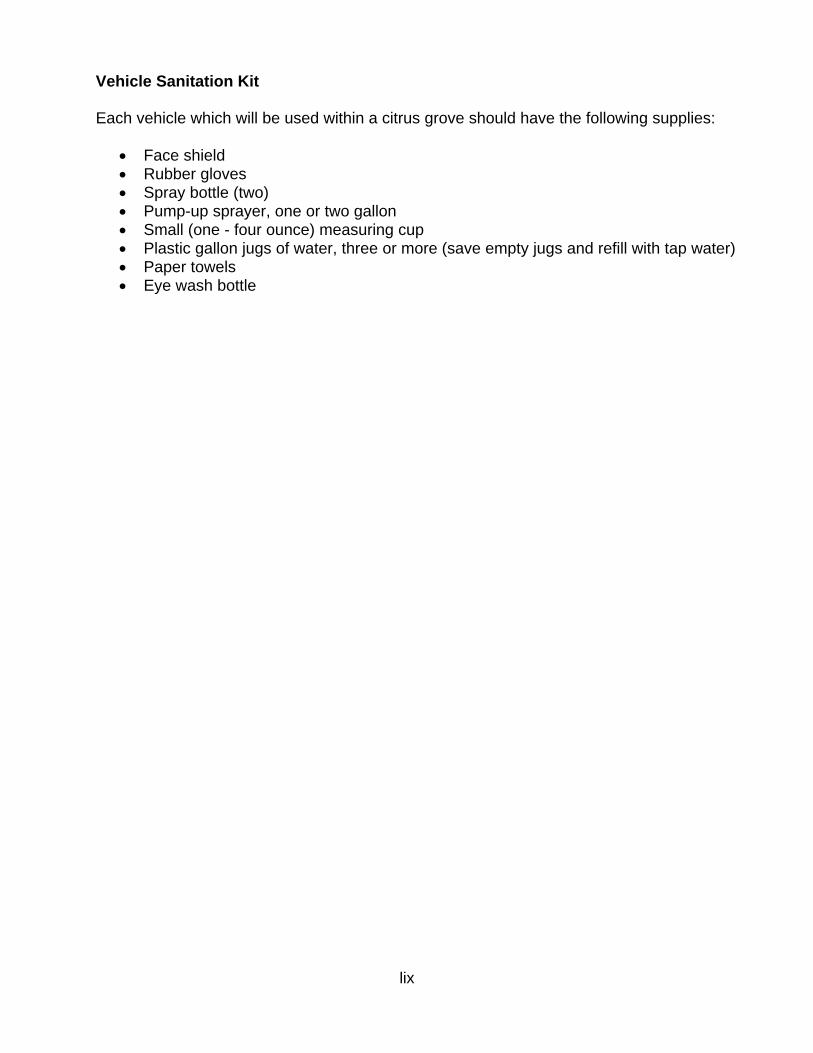
lix
Vehicle Sanitation Kit
Each vehicle which will be used within a citrus grove should have the following supplies:
• Face shield • Rubber gloves • Spray bottle (two) • Pump-up sprayer, one or two gallon • Small (one - four ounce) measuring cup • Plastic gallon jugs of water, three or more (save empty jugs and refill with tap water) • Paper towels • Eye wash bottle

lx
Detail 12 Trimble GPS Information

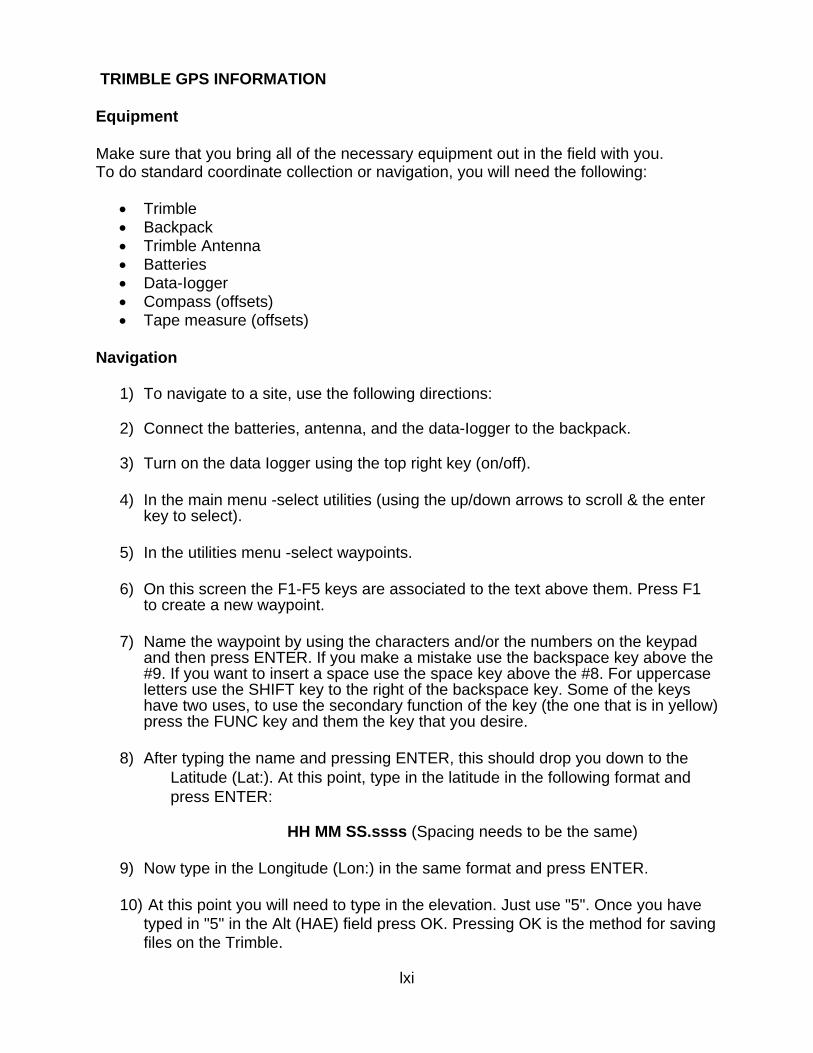
lxi
TRIMBLE GPS INFORMATION
Equipment
Make sure that you bring all of the necessary equipment out in the field with you. To do standard coordinate collection or navigation, you will need the following:
• Trimble • Backpack • Trimble Antenna • Batteries • Data-Iogger • Compass (offsets) • Tape measure (offsets)
Navigation
1) To navigate to a site, use the following directions:
2) Connect the batteries, antenna, and the data-Iogger to the backpack.
3) Turn on the data Iogger using the top right key (on/off).
4) In the main menu -select utilities (using the up/down arrows to scroll & the enter key to select).
5) In the utilities menu -select waypoints.
6) On this screen the F1-F5 keys are associated to the text above them. Press F1 to create a new waypoint.
7) Name the waypoint by using the characters and/or the numbers on the keypad and then press ENTER. If you make a mistake use the backspace key above the #9. If you want to insert a space use the space key above the #8. For uppercase letters use the SHIFT key to the right of the backspace key. Some of the keys have two uses, to use the secondary function of the key (the one that is in yellow) press the FUNC key and them the key that you desire.
8) After typing the name and pressing ENTER, this should drop you down to the Latitude (Lat:). At this point, type in the latitude in the following format and press ENTER:
HH MM SS.ssss (Spacing needs to be the same)
9) Now type in the Longitude (Lon:) in the same format and press ENTER.
10) At this point you will need to type in the elevation. Just use "5". Once you have typed in "5" in the Alt (HAE) field press OK. Pressing OK is the method for saving files on the Trimble.
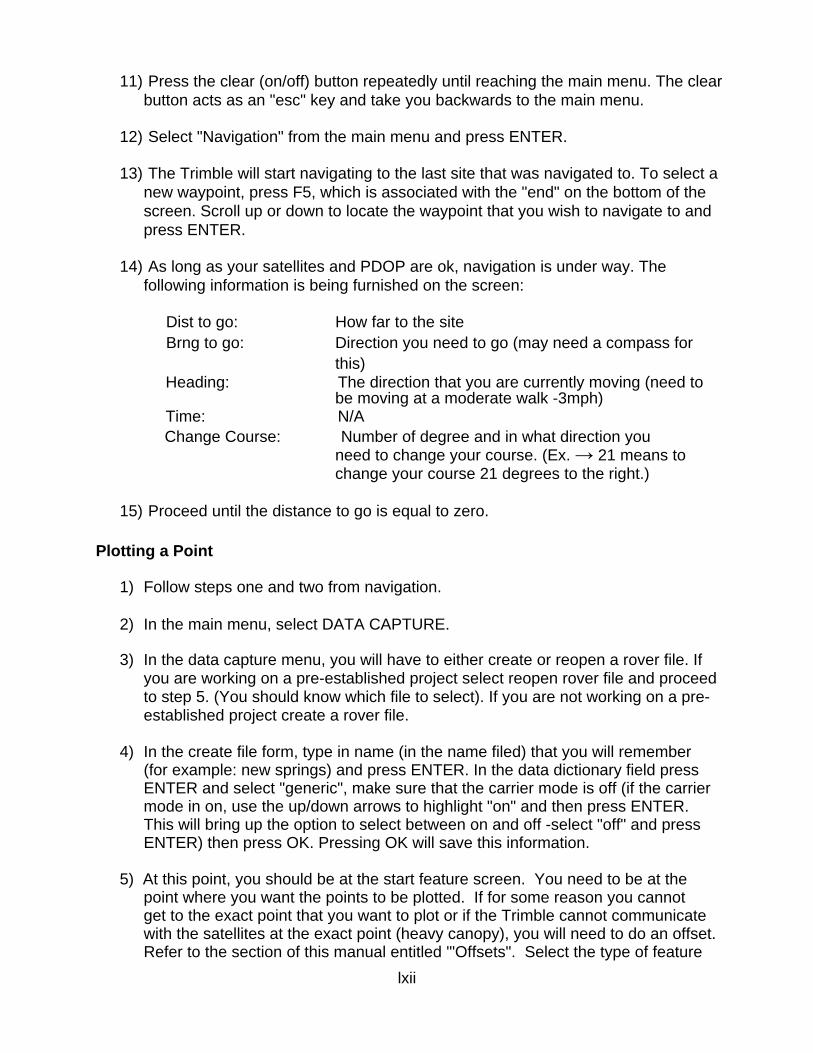
lxii
11) Press the clear (on/off) button repeatedly until reaching the main menu. The clear button acts as an "esc" key and take you backwards to the main menu.
12) Select "Navigation" from the main menu and press ENTER.
13) The Trimble will start navigating to the last site that was navigated to. To select a new waypoint, press F5, which is associated with the "end" on the bottom of the screen. Scroll up or down to locate the waypoint that you wish to navigate to and press ENTER.
14) As long as your satellites and PDOP are ok, navigation is under way. The following information is being furnished on the screen:
Dist to go: How far to the site Brng to go: Direction you need to go (may need a compass for
this) Heading: The direction that you are currently moving (need to
be moving at a moderate walk -3mph) Time: N/A Change Course: Number of degree and in what direction you
need to change your course. (Ex. → 21 means to change your course 21 degrees to the right.)
15) Proceed until the distance to go is equal to zero.
Plotting a Point
1) Follow steps one and two from navigation.
2) In the main menu, select DATA CAPTURE.
3) In the data capture menu, you will have to either create or reopen a rover file. If you are working on a pre-established project select reopen rover file and proceed to step 5. (You should know which file to select). If you are not working on a pre-established project create a rover file.
4) In the create file form, type in name (in the name filed) that you will remember (for example: new springs) and press ENTER. In the data dictionary field press ENTER and select "generic", make sure that the carrier mode is off (if the carrier mode in on, use the up/down arrows to highlight "on" and then press ENTER. This will bring up the option to select between on and off -select "off" and press ENTER) then press OK. Pressing OK will save this information.
5) At this point, you should be at the start feature screen. You need to be at thepoint where you want the points to be plotted. If for some reason you cannot get to the exact point that you want to plot or if the Trimble cannot communicate with the satellites at the exact point (heavy canopy), you will need to do an offset. Refer to the section of this manual entitled '"Offsets". Select the type of feature
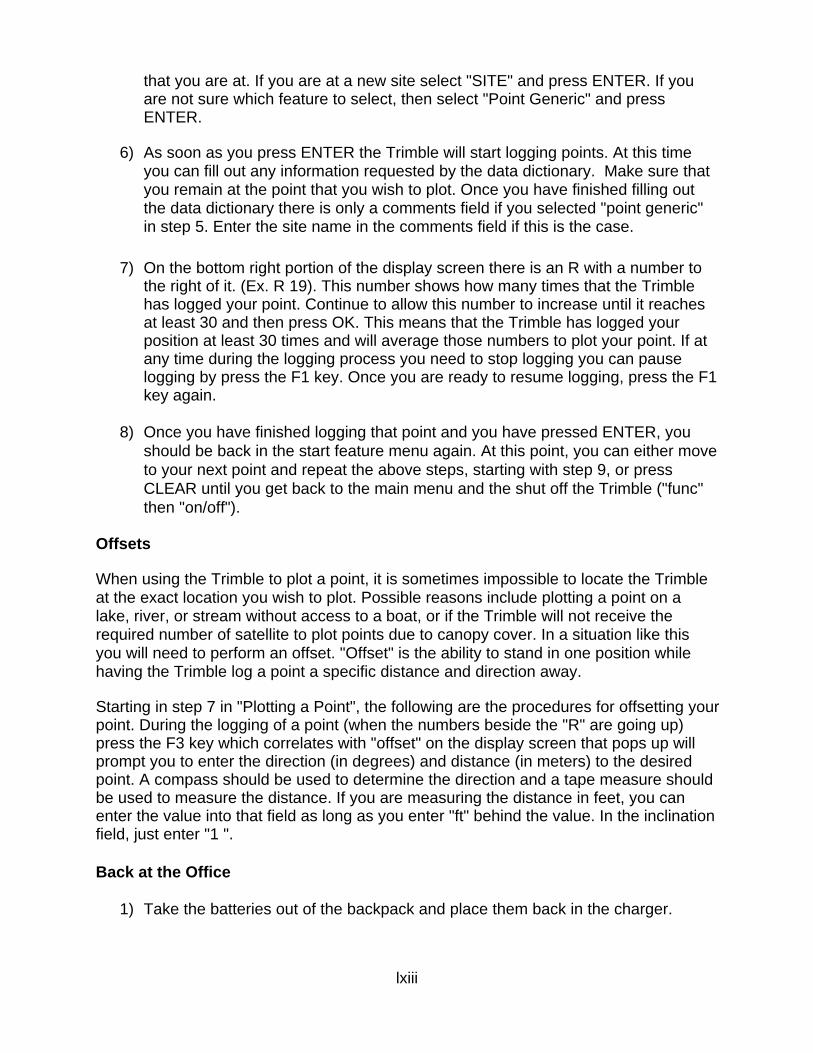
lxiii
that you are at. If you are at a new site select "SITE" and press ENTER. If you are not sure which feature to select, then select "Point Generic" and press ENTER.
6) As soon as you press ENTER the Trimble will start logging points. At this time you can fill out any information requested by the data dictionary. Make sure that you remain at the point that you wish to plot. Once you have finished filling out the data dictionary there is only a comments field if you selected "point generic" in step 5. Enter the site name in the comments field if this is the case.
7) On the bottom right portion of the display screen there is an R with a number to the right of it. (Ex. R 19). This number shows how many times that the Trimble has logged your point. Continue to allow this number to increase until it reaches at least 30 and then press OK. This means that the Trimble has logged your position at least 30 times and will average those numbers to plot your point. If at any time during the logging process you need to stop logging you can pause logging by press the F1 key. Once you are ready to resume logging, press the F1 key again.
8) Once you have finished logging that point and you have pressed ENTER, you should be back in the start feature menu again. At this point, you can either move to your next point and repeat the above steps, starting with step 9, or press CLEAR until you get back to the main menu and the shut off the Trimble ("func" then "on/off").
Offsets
When using the Trimble to plot a point, it is sometimes impossible to locate the Trimble at the exact location you wish to plot. Possible reasons include plotting a point on a lake, river, or stream without access to a boat, or if the Trimble will not receive the required number of satellite to plot points due to canopy cover. In a situation like this you will need to perform an offset. "Offset" is the ability to stand in one position while having the Trimble log a point a specific distance and direction away.
Starting in step 7 in "Plotting a Point", the following are the procedures for offsetting your point. During the logging of a point (when the numbers beside the "R" are going up) press the F3 key which correlates with "offset" on the display screen that pops up will prompt you to enter the direction (in degrees) and distance (in meters) to the desired point. A compass should be used to determine the direction and a tape measure should be used to measure the distance. If you are measuring the distance in feet, you can enter the value into that field as long as you enter "ft" behind the value. In the inclination field, just enter "1 ".
Back at the Office
1) Take the batteries out of the backpack and place them back in the charger.
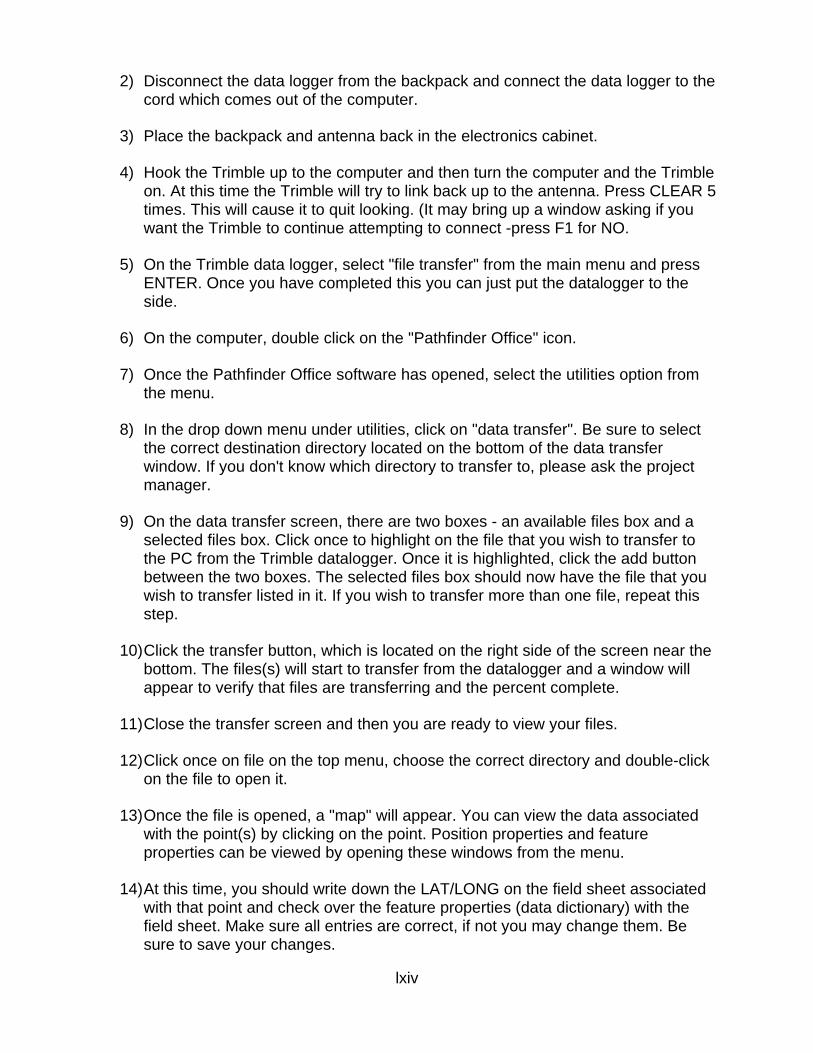
lxiv
2) Disconnect the data logger from the backpack and connect the data logger to the cord which comes out of the computer.
3) Place the backpack and antenna back in the electronics cabinet.
4) Hook the Trimble up to the computer and then turn the computer and the Trimble on. At this time the Trimble will try to link back up to the antenna. Press CLEAR 5 times. This will cause it to quit looking. (It may bring up a window asking if you want the Trimble to continue attempting to connect -press F1 for NO.
5) On the Trimble data logger, select "file transfer" from the main menu and press ENTER. Once you have completed this you can just put the datalogger to the side.
6) On the computer, double click on the "Pathfinder Office" icon.
7) Once the Pathfinder Office software has opened, select the utilities option from the menu.
8) In the drop down menu under utilities, click on "data transfer". Be sure to select the correct destination directory located on the bottom of the data transfer window. If you don't know which directory to transfer to, please ask the project manager.
9) On the data transfer screen, there are two boxes - an available files box and a selected files box. Click once to highlight on the file that you wish to transfer to the PC from the Trimble datalogger. Once it is highlighted, click the add button between the two boxes. The selected files box should now have the file that you wish to transfer listed in it. If you wish to transfer more than one file, repeat this step.
10) Click the transfer button, which is located on the right side of the screen near the bottom. The files(s) will start to transfer from the datalogger and a window will appear to verify that files are transferring and the percent complete.
11) Close the transfer screen and then you are ready to view your files.
12) Click once on file on the top menu, choose the correct directory and double-click on the file to open it.
13) Once the file is opened, a "map" will appear. You can view the data associated with the point(s) by clicking on the point. Position properties and feature properties can be viewed by opening these windows from the menu.
14) At this time, you should write down the LAT/LONG on the field sheet associated with that point and check over the feature properties (data dictionary) with the field sheet. Make sure all entries are correct, if not you may change them. Be sure to save your changes.

lxvi
Detail 13 Habitat Assessment
and Stream Condition Index Information

lxvii
HABITAT ASSESSMENT AND STREAM CONDITION INDEX INFORMATION Methods and Site Selection Criteria All habitat assessments and Stream Condition Indexes (SCIs) performed by the WQMP are completed in accordance with FDEP SOP FT 3100 and FS 7420, respectively. Please refer to these SOPs for specific methods and equipment/materials required for these procedures. Habitat assessments and SCIs are performed on qualified sites, selected from the WQMP surface water networks, with an emphasis on waterbodies or reaches of waterbodies not actively monitored by other agencies, in an effort to increase the coverage of sites monitored within a watershed. Habitat assessment and SCI data are stored by FDEP in their Statewide Biological Database (SBIO) and are used along with water chemistry results in support of TMDL assignment. Habitat Assessment During a habitat assessment, field staff record the availability and quality of habitat (e.g. snags, leaf pack/mats, aquatic vegetation, roots, and rocks) from a 100 meter stretch of a waterbody, with the 100 meter stretch selected ideally containing within its boundaries the regular monthly or quarterly water chemistry sample point. This information is then used to determine which habitats to sample, via the SCI method, in order to get a good representation of the macroinvertebrate community within the system. Access to productive habitat and the condition of surrounding land-use and buffer zone characteristics can impact macroinvertebrate colonization and recruitment. Once all relevant information and observations are assembled by field staff, the 100 meter stretch is assigned a habitat assessment score, based on primary and secondary habitat components. Primary habitat components (i.e. substrate diversity, substrate availability, water velocity, and habitat smothering) are characteristics of the stream stretch and habitat that directly affect the macroinvertebrates ability to find and colonize suitable habitat. Secondary habitat components (i.e. artificial channelization, bank stability, riparian buffer zone width and buffer zone quality) are components that indirectly affect the macroinvertebrates by altering the in-stream environment and/or the system's ability to prevent the introduction of non point-source pollution. Each component is assigned a numerical value (1 -20, 20 being the best score) as well as a categorization of optimal, suboptimal, marginal or poor. The overall habitat assessment score, comprised of the sum of the component scores, is then used in conjunction with the SCI results to rank a site. Stream Condition Index Examination of the macroinvertebrate community within a waterbody provides a systematic and enduring look at the health of the system. Where water chemistry samples provide a snapshot of water quality at the time and location of sample collection, macroinvertebrate analysis is a more long-term indicator of quality, because some macroinvertebrates exhibit a tolerance or lack of tolerance to poor water quality.
lxviii
This is especially true in flowing systems where significant events, both physical and chemical may occur within the system and have their chemical/physical signatures diluted or rapidly transported downstream. Certain macroinvertebrates, by their presence or absence in the area where the event occurred, may indicate a disturbance that may or may not be evident in water chemistry samples. For the SCI macroinvertebrate sample collection method, field staff collect a total of 20 discrete 0.5 meter sweeps with a D-frame dipnet from within the 100 meter stream stretch. The number of sweeps from each habitat type is determined by the number of productive habitats available (as determined in the habitat assessment). Depending on the number of productive habitats, field staff will perform ten, seven, five, four, or three sweeps in each of the productive habitats and complete the remaining sweeps from the minor habitats (e.g. sand, silt, muck, and rock/shell rubble). During the SCI, care is taken to try to choose the optimum habitat available (e.g. habitat in the good flow versus habitat in areas with poor flow, or partially decayed leaves versus new fresh fallen leaves). The 20 dip-net sweeps are transferred into a wide-mouth container and preserved with tenpercent buffered formalin. The wide-mouth containers are then sent off to the analyzing lab for identification and inclusion in SBIO.

lxxi
Detail 14 Field Related Forms
and Documents

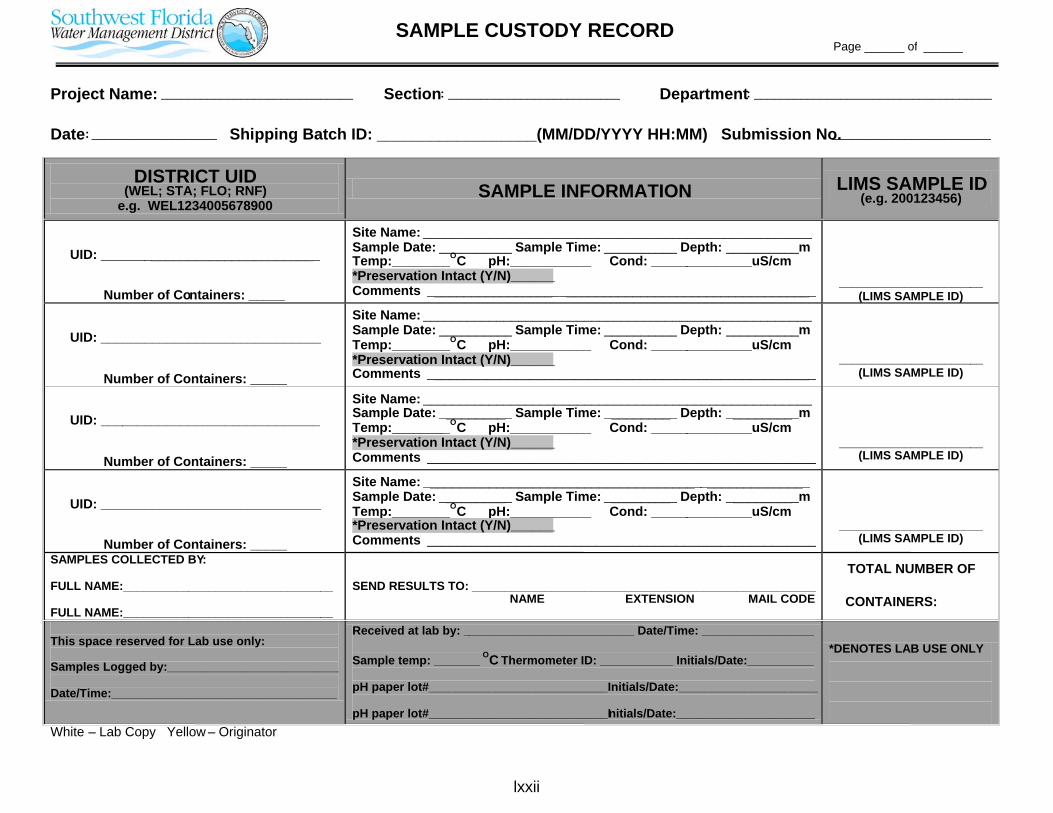
lxxii
Page ______ of ______
Project Name: _____________________________
Section: __________________________
Department: ____________________________________
Date: ___________________
Shipping Batch ID: __________________(MM/DD/YYYY HH:MM) Submission No.________________________
White – Lab Copy Yellow – Originator
DISTRICT UID (WEL; STA; FLO; RNF)
e.g. WEL1234005678900 SAMPLE INFORMATION LIMS SAMPLE ID
(e.g. 200123456)
UID: ______________________________
Number of Containers: _____
Site Name: _____________________________________________________ Sample Date: __________ Sample Time: __________ Depth: __________mTemp:________OC pH:___________ Cond: ______________uS/cm*Preservation Intact (Y/N)______Comments
_____________________________________________________
______________________ (LIMS SAMPLE ID)
SAMPLES COLLECTED BY: FULL NAME:________________________________ FULL NAME:________________________________
SEND RESULTS TO: ____________________________________________________
NAME EXTENSION MAIL CODE
TOTAL NUMBER OF
CONTAINERS:
This space reserved for Lab use only: Samples Logged by:__________________________ Date/Time:__________________________________
Received at lab by: __________________________ Date/Time: _________________
Sample temp: _______ OC Thermometer ID: ___________ Initials/Date:__________ pH paper lot#___________________________Initials/Date:_____________________ pH paper lot#___________________________Initials/Date:_____________________
*DENOTES LAB USE ONLY
SAMPLE CUSTODY RECORD
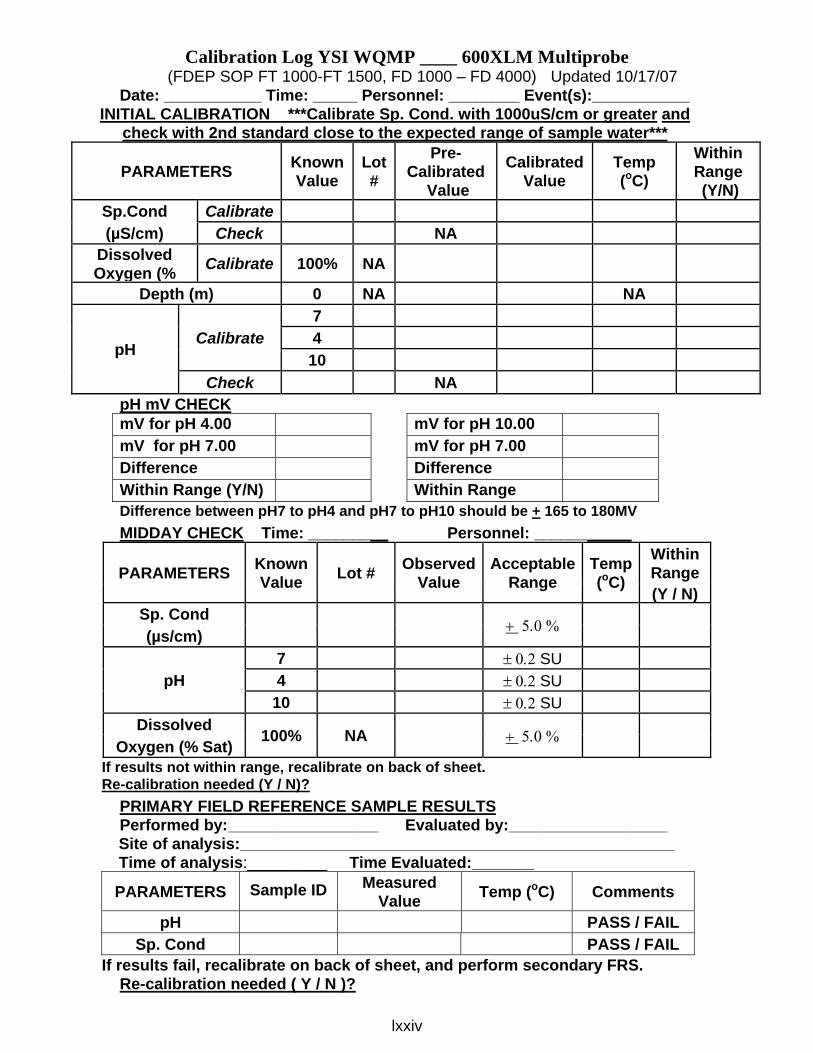
lxxiv
Calibration Log YSI WQMP ____ 600XLM Multiprobe (FDEP SOP FT 1000-FT 1500, FD 1000 – FD 4000) Updated 10/17/07 Date: ___________ Time: _____ Personnel: ________ Event(s):___________
INITIAL CALIBRATION ***Calibrate Sp. Cond. with 1000uS/cm or greater and check with 2nd standard close to the expected range of sample water***
PARAMETERS Known Value
Lot #
Pre-Calibrated
Value
Calibrated Value
Temp (oC)
Within Range (Y/N)
Sp.Cond Calibrate
(µS/cm) Check NA Dissolved Oxygen (% Calibrate 100% NA
Depth (m) 0 NA NA
pH Calibrate
7
4
10
Check NA
pH mV CHECK mV for pH 4.00 mV for pH 10.00 mV for pH 7.00 mV for pH 7.00 Difference Difference Within Range (Y/N) Within Range Difference between pH7 to pH4 and pH7 to pH10 should be + 165 to 180MV MIDDAY CHECK Time: _________ Personnel: ___________
PARAMETERS Known Value Lot # Observed
Value Acceptable
Range Temp (oC)
Within Range (Y / N)
Sp. Cond + 5.0 % (µs/cm)
pH 7 ± 0.2 SU 4 ± 0.2 SU
10 ± 0.2 SU Dissolved 100% NA + 5.0 %
Oxygen (% Sat) If results not within range, recalibrate on back of sheet. Re-calibration needed (Y / N)?
PRIMARY FIELD REFERENCE SAMPLE RESULTS Performed by:_________________ Evaluated by:__________________
Site of analysis:_________________________________________________ Time of analysis:_________ Time Evaluated:_______
PARAMETERS Sample ID Measured Value Temp (oC) Comments
pH PASS / FAIL Sp. Cond PASS / FAIL
If results fail, recalibrate on back of sheet, and perform secondary FRS. Re-calibration needed ( Y / N )?
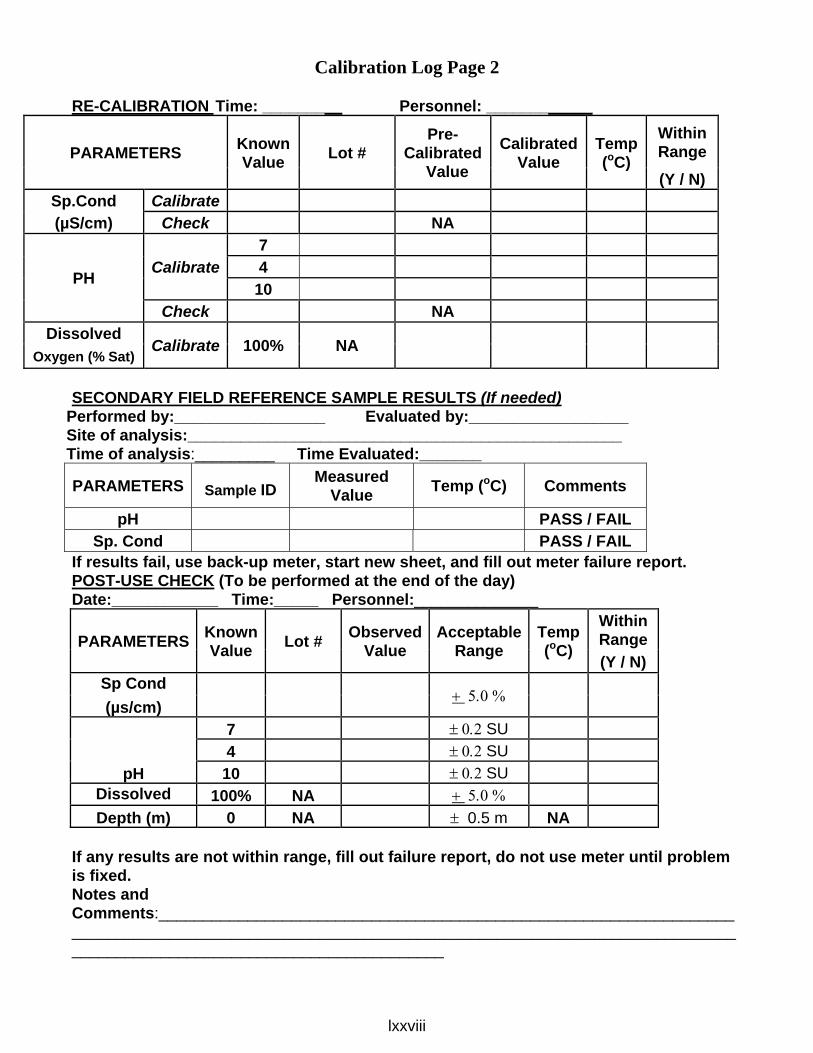
lxxviii
Calibration Log Page 2 RE-CALIBRATION Time: _________ Personnel: ____________
PARAMETERS Known Value Lot #
Pre-Calibrated
Value
Calibrated Value
Temp (oC)
Within Range (Y / N)
Sp.Cond Calibrate
(µS/cm) Check NA
PH Calibrate 7
4
10
Check NA
Dissolved Calibrate 100% NA
Oxygen (% Sat) SECONDARY FIELD REFERENCE SAMPLE RESULTS (If needed)
Performed by:_________________ Evaluated by:__________________ Site of analysis:_________________________________________________ Time of analysis:_________ Time Evaluated:_______
PARAMETERS Sample ID Measured
Value Temp (oC) Comments
pH PASS / FAIL Sp. Cond PASS / FAIL
If results fail, use back-up meter, start new sheet, and fill out meter failure report. POST-USE CHECK (To be performed at the end of the day) Date:____________ Time:_____ Personnel:______________
PARAMETERS Known Value Lot # Observed
Value Acceptable
Range Temp (oC)
Within Range (Y / N)
Sp Cond
+ 5.0 % (µs/cm)
pH
7 ± 0.2 SU 4 ± 0.2 SU 10 ± 0.2 SU
Dissolved 100% NA + 5.0 % Depth (m) 0 NA ± 0.5 m NA
If any results are not within range, fill out failure report, do not use meter until problem is fixed. Notes and Comments:______________________________________________________________________________________________________________________________________________________________________________________
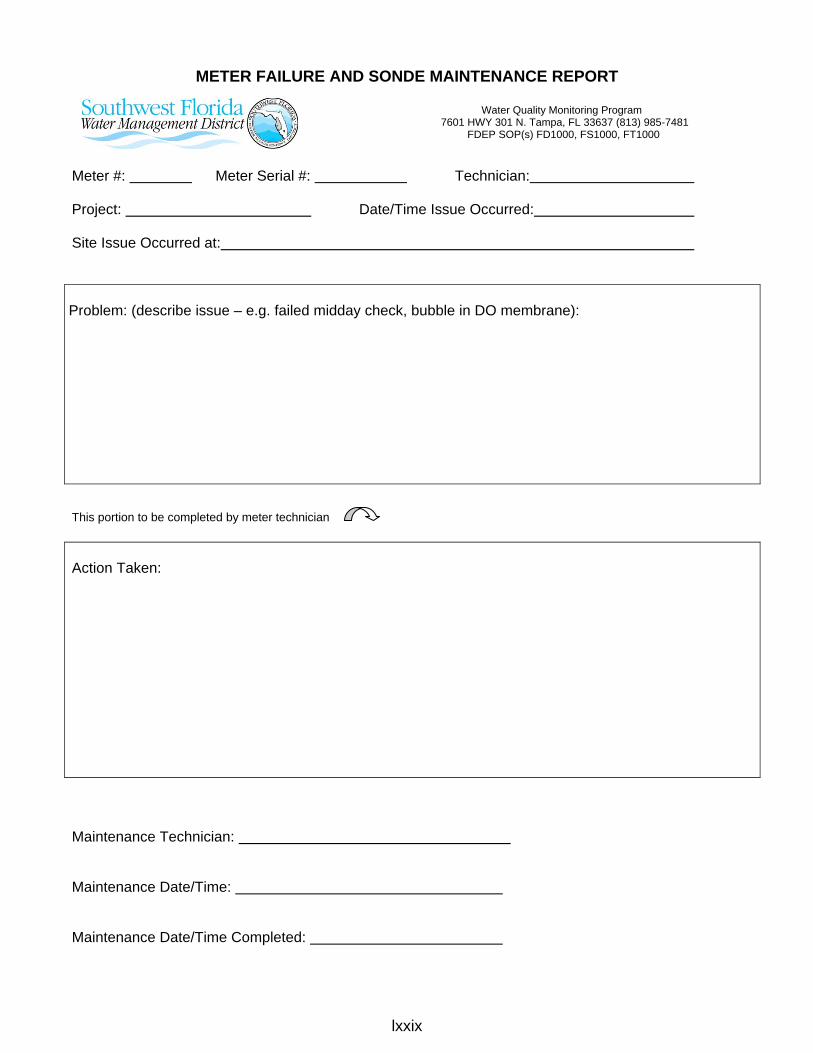
lxxix
METER FAILURE AND SONDE MAINTENANCE REPORT
Water Quality Monitoring Program
7601 HWY 301 N. Tampa, FL 33637 (813) 985-7481 FDEP SOP(s) FD1000, FS1000, FT1000
Meter #: Meter Serial #: Technician:
Project: Date/Time Issue Occurred: Site Issue Occurred at: Problem: (describe issue – e.g. failed midday check, bubble in DO membrane):
This portion to be completed by meter technician
Maintenance Technician:
Maintenance Date/Time:
Maintenance Date/Time Completed:
Action Taken:

lxxx
Surface Water Field Data Sheet Water Quality Monitoring Program
7601 HWY 301 N. Tampa, FL 33637 (813) 985-7481 FDEP SOP(s) FD1000, FS1000, FT1000
Project: _______________________ Sampler Name(s):___________________________ Station Information
Station Name: _____________________________________________________________________________
UID/SID: _____________________ Date: _______________ Time: _____________ (YYYYMMDD) (Sample Time)
Waterbody Type (Circle one): Lake River/Stream Estuary Canal Other________
Weather Conditions (Circle one): Clear Partly Cloudy Cloudy Rain
Air Temperature: ______oF Wind Speed: ______mph Wind Direction: ________ Water Sample Collection Device (circle one): Van Dorn Direct Grab w Sample Bottle
Water Quality Measurements
Total Water Depth :______( meters) Secchi Depth :______( meters) Stage (if applicable) :________( Feet)
Stream Flow (Circle one): No Flow Low Moderate High Flood
Lake Level (Circle one): Low Normal High
Depth from which laboratory samples were collected: __________ (meters)
Sample meter used: ____________________
Field Measurements: Depth
Collected (meters)
pH (SU)
D.O. (mg/L)
Temperature (°C)
Sp. Conductance (uS/cm)
Salinity (ppth)
Comments:
Revised 7/9/2009
QA/QC Time Collected
Duplicate _____________
Blank _____________
Ref. Samp ____________
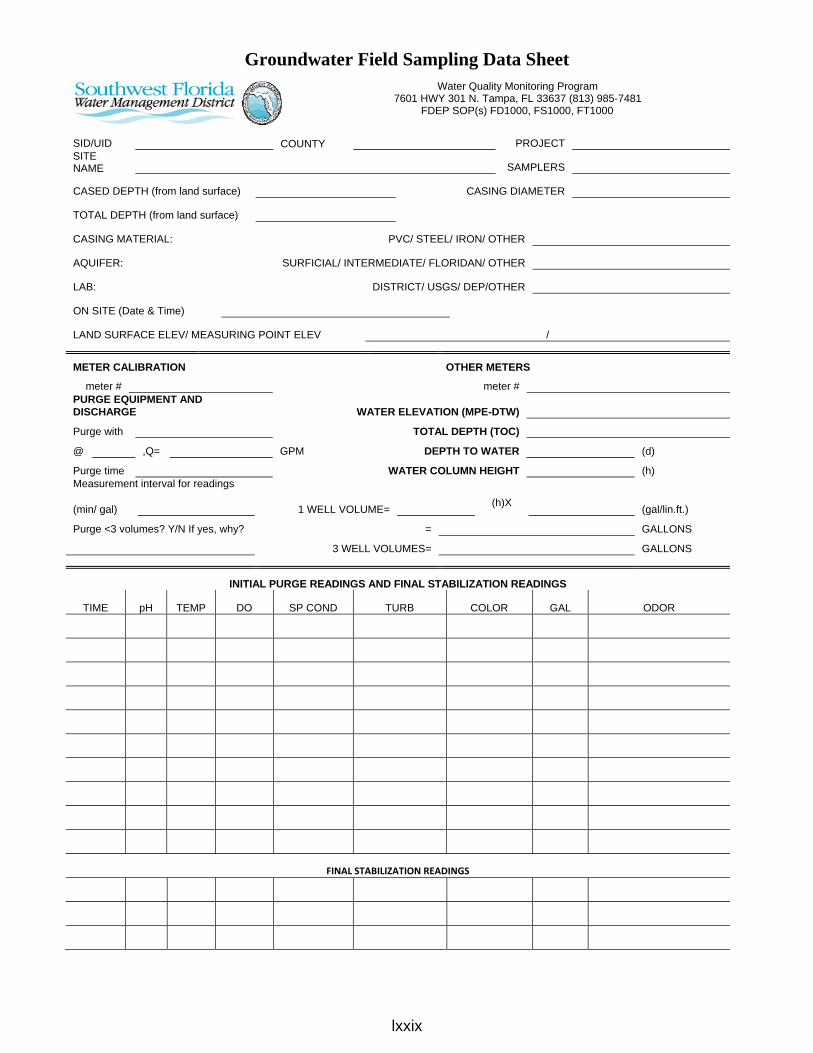
lxxix
Groundwater Field Sampling Data Sheet Water Quality Monitoring Program
7601 HWY 301 N. Tampa, FL 33637 (813) 985-7481 FDEP SOP(s) FD1000, FS1000, FT1000
SID/UID COUNTY PROJECT
SITE NAME SAMPLERS
CASED DEPTH (from land surface) CASING DIAMETER
TOTAL DEPTH (from land surface)
CASING MATERIAL: PVC/ STEEL/ IRON/ OTHER
AQUIFER: SURFICIAL/ INTERMEDIATE/ FLORIDAN/ OTHER
LAB: DISTRICT/ USGS/ DEP/OTHER
ON SITE (Date & Time)
LAND SURFACE ELEV/ MEASURING POINT ELEV /
METER CALIBRATION OTHER METERS
meter # meter # PURGE EQUIPMENT AND DISCHARGE WATER ELEVATION (MPE-DTW)
Purge with TOTAL DEPTH (TOC)
@ ,Q= GPM DEPTH TO WATER (d)
Purge time WATER COLUMN HEIGHT (h) Measurement interval for readings
(min/ gal) 1 WELL VOLUME= (h)X (gal/lin.ft.)
Purge <3 volumes? Y/N If yes, why? = GALLONS
3 WELL VOLUMES= GALLONS
INITIAL PURGE READINGS AND FINAL STABILIZATION READINGS
TIME pH TEMP DO SP COND TURB COLOR GAL ODOR
FINAL STABILIZATION READINGS
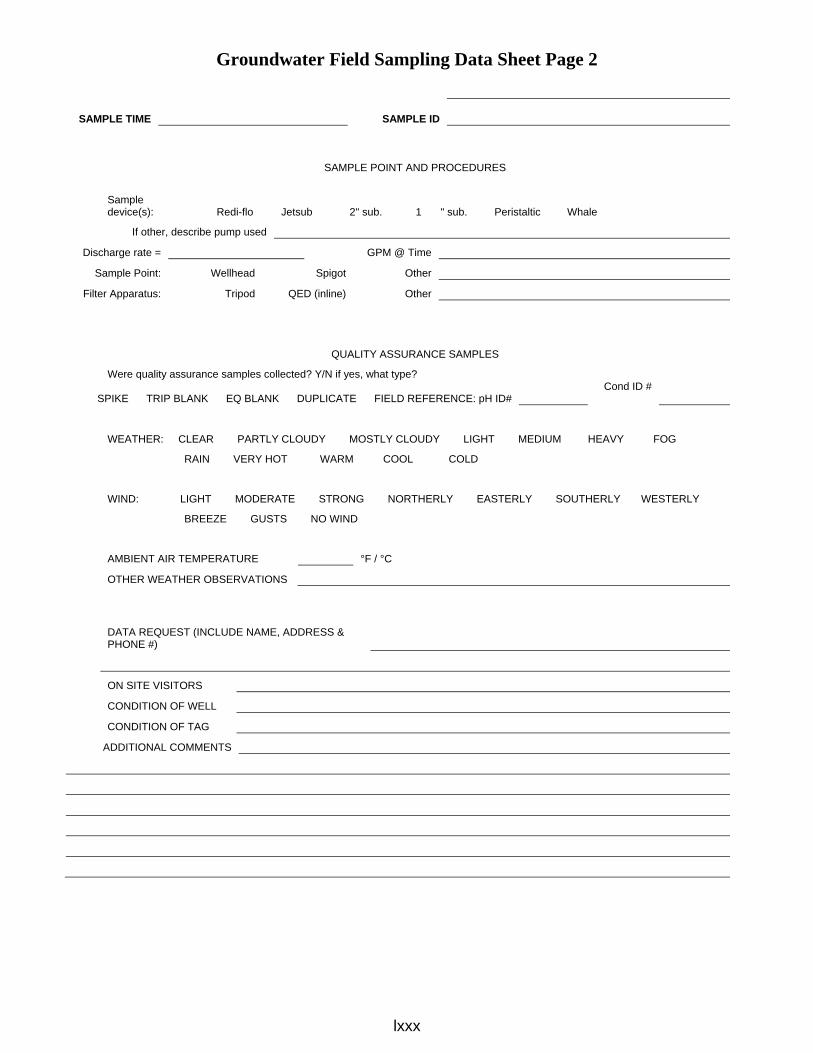
lxxx
Groundwater Field Sampling Data Sheet Page 2
SAMPLE TIME SAMPLE ID
SAMPLE POINT AND PROCEDURES
Sample device(s): Redi-flo Jetsub 2" sub. 1 ��" sub. Peristaltic Whale
If other, describe pump used
Discharge rate = GPM @ Time
Sample Point: Wellhead Spigot Other
Filter Apparatus: Tripod QED (inline) Other
QUALITY ASSURANCE SAMPLES
Were quality assurance samples collected? Y/N if yes, what type?
SPIKE TRIP BLANK EQ BLANK DUPLICATE FIELD REFERENCE: pH ID# Cond ID #
WEATHER: CLEAR PARTLY CLOUDY MOSTLY CLOUDY LIGHT MEDIUM HEAVY FOG
RAIN VERY HOT WARM COOL COLD
WIND: LIGHT MODERATE STRONG NORTHERLY EASTERLY SOUTHERLY WESTERLY
BREEZE GUSTS NO WIND
AMBIENT AIR TEMPERATURE °F / °C
OTHER WEATHER OBSERVATIONS
DATA REQUEST (INCLUDE NAME, ADDRESS & PHONE #)
ON SITE VISITORS
CONDITION OF WELL
CONDITION OF TAG
ADDITIONAL COMMENTS

lxxxi
SWFWMD FIELD REFERENCE SAMPLE Water Quality Monitoring Program
7601 HWY 301 N. Tampa, FL 33637 (813) 985-7481 FDEP SOP(s) FD1000, FS1000, FT1000
*Field Reference samples must be collected in the field.*
ANALYST:
DATE OF ANALYSIS: / /
TIME OF ANALYSIS:
SITE OF ANALYSIS:
PROJECT:
pH
FIELD REFERENCE BOTTLE ID:
INSTRUMENT: make model ID#
MEASURED VALUE:
TEMPERATURE: oC
COMMENTS:
SPECIFIC CONDUCTANCE
FIELD REFERENCE BOTTLE ID:
INSTRUMENT: make model ID #
MEASURED VALUE:
TEMPERATURE: oC
COMMENTS:
FOR OFFICIAL USE ONLY
pH ( PASS / FAIL ) SpCond ( PASS / FAIL )
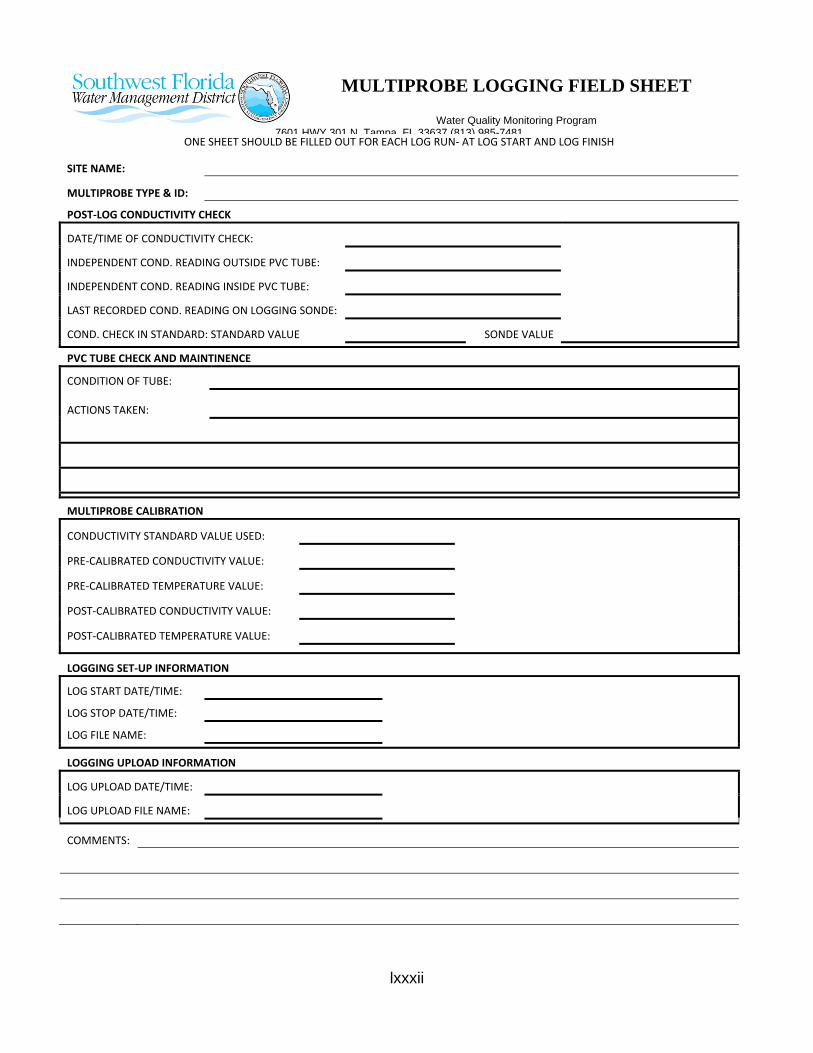
lxxxii
MULTIPROBE LOGGING FIELD SHEET
Water Quality Monitoring Program 7601 HWY 301 N Tampa FL 33637 (813) 985-7481
ONE SHEET SHOULD BE FILLED OUT FOR EACH LOG RUN‐ AT LOG START AND LOG FINISH
SITE NAME:
MULTIPROBE TYPE & ID:
POST‐LOG CONDUCTIVITY CHECK
DATE/TIME OF CONDUCTIVITY CHECK:
INDEPENDENT COND. READING OUTSIDE PVC TUBE:
INDEPENDENT COND. READING INSIDE PVC TUBE:
LAST RECORDED COND. READING ON LOGGING SONDE:
COND. CHECK IN STANDARD: STANDARD VALUE
SONDE VALUE
PVC TUBE CHECK AND MAINTINENCE
CONDITION OF TUBE:
ACTIONS TAKEN:
MULTIPROBE CALIBRATION
CONDUCTIVITY STANDARD VALUE USED:
PRE‐CALIBRATED CONDUCTIVITY VALUE:
PRE‐CALIBRATED TEMPERATURE VALUE:
POST‐CALIBRATED CONDUCTIVITY VALUE:
POST‐CALIBRATED TEMPERATURE VALUE:
LOGGING SET‐UP INFORMATION
LOG START DATE/TIME:
LOG STOP DATE/TIME:
LOG FILE NAME:
LOGGING UPLOAD INFORMATION
LOG UPLOAD DATE/TIME:
LOG UPLOAD FILE NAME:
COMMENTS:
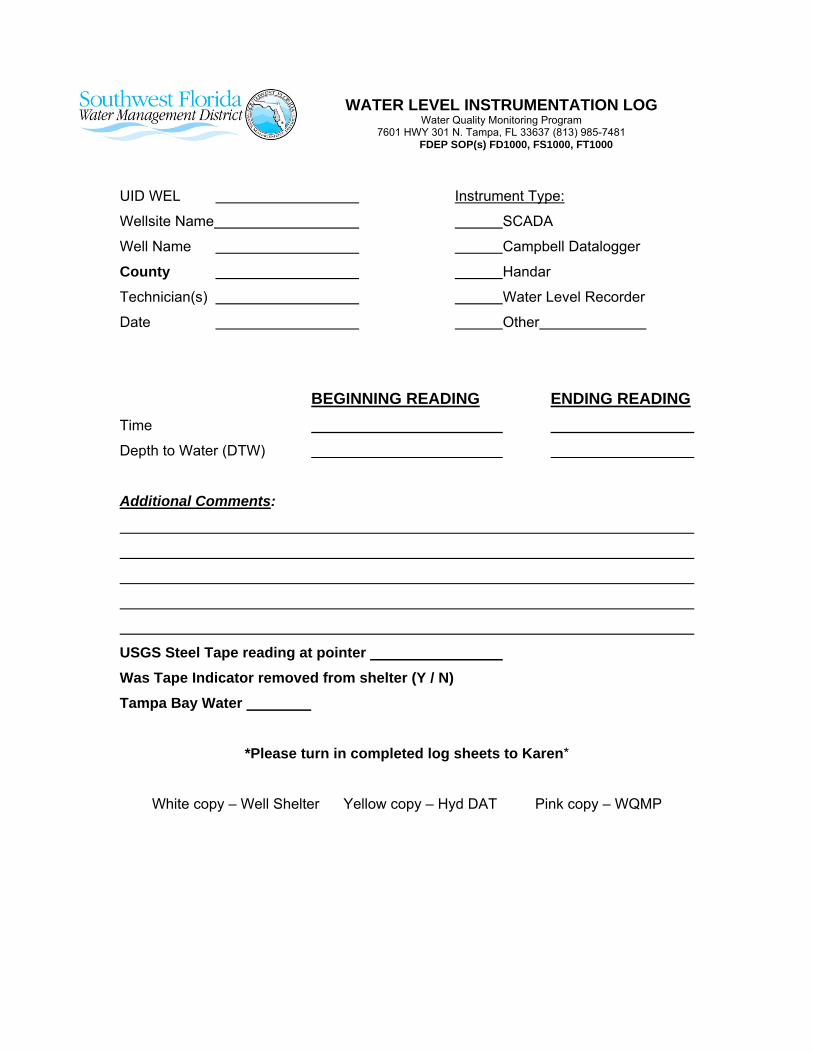
WATER LEVEL INSTRUMENTATION LOG Water Quality Monitoring Program
7601 HWY 301 N. Tampa, FL 33637 (813) 985-7481 FDEP SOP(s) FD1000, FS1000, FT1000
UID WEL Instrument Type:
Wellsite Name SCADA
Well Name Campbell Datalogger
County Handar
Technician(s) Water Level Recorder
Date Other
BEGINNING READING ENDING READING Time Depth to Water (DTW)
Additional Comments:
USGS Steel Tape reading at pointer Was Tape Indicator removed from shelter (Y / N) Tampa Bay Water
*Please turn in completed log sheets to Karen*
White copy – Well Shelter Yellow copy – Hyd DAT Pink copy – WQMP
Related Documents