University of South Wales Master of Sciences Thesis STANDALONE HYBRID GENERATION SYSTEM FOR THE REMOTE AREA OF THAR, PAKISTAN Submitted By: Syed Hassan Raza (08011605) Supervisor: Senior Lecturer Dr Ben Mehenni Thesis submitted to the Faculty of Computing, Engineering and Sciences in partial fulfillment of the requirements for the degree of Master of Science in Sustainable Power Technology. October 2014 ABSTRACT This thesis proposes a standalone hybrid generation system in Thar area of Pakistan combining solar and wind energy with provision of a storage bank and controlled using a bidirectional boost DC-DC converter (BDC) to maintain constant dc-link voltage. A three- phase complex vector control scheme voltage source inverter (VSI) is used to control the load side voltage in terms of the frequency and voltage amplitude. The simulation results obtained from Matlab/Simulink show that the overall hybrid framework is capable of working under the variable weather and load conditions.

Welcome message from author
This document is posted to help you gain knowledge. Please leave a comment to let me know what you think about it! Share it to your friends and learn new things together.
Transcript
University of South Wales
Master of Sciences Thesis
STANDALONE HYBRID GENERATION SYSTEM FOR THE REMOTE AREA OF THAR, PAKISTAN
Submitted By: Syed Hassan Raza (08011605)
Supervisor: Senior Lecturer Dr Ben Mehenni
Thesis submitted to the Faculty of Computing, Engineering and Sciences in partial fulfillment of the requirements for the degree of Master of Science in Sustainable Power Technology.
October 2014
ABSTRACT This thesis proposes a standalone hybrid generation system in Thar area of Pakistan combining solar and wind energy with provision of a storage bank and controlled using a bidirectional boost DC-DC converter (BDC) to maintain constant dc-link voltage. A three-phase complex vector control scheme voltage source inverter (VSI) is used to control the load side voltage in terms of the frequency and voltage amplitude. The simulation results obtained from Matlab/Simulink show that the overall hybrid framework is capable of working under the variable weather and load conditions.

Standalone hybrid generation system for the remote area of Thar, Pakistan
2
ACKNOWLEDGEMENT
First of all, I would like to express my deep sense of respect and gratitude towards my Supervisor Dr Ben Mehenni, Dr Clive Morgan, and Mr. Kang Li who has been the guiding force behind this work. The thesis would not have been accomplished without their readiness to help; their willingness for series of intensive discussions that brought about more valuable suggestions; and their supports are highly appreciated in this regard. Finally, I would like to thank almighty and my parents for giving me strength and supporting me throughout my life.

Standalone hybrid generation system for the remote area of Thar, Pakistan
3
LIST OF ABBREVIATION List of abbreviations Description A Ampere AC Alternating Current Ah Ampere-hour BB Battery Bank BC Battery Capacity CC Capital Cost DC Direct Current DCC Daily Charging Capacity DFC Daily Fuel Consumption DG Diesel Generator DOD Depth of Discharge DRT Daily Running Time of the PV-system DSH Daily Sun Hour ECS Energy Conversion System EPP Electrical Power Processing FC Fuel Cost fc fuel consumption HPSs Hybrid Power systems hr Hour KE Kinetic Energy Km Kilo meters KW Kilo Watt KWh Kilo Watt hour KWP Kilo Watt peak LCC Life-cycle Cost LEL Lower Energy Limit of battery MOO Maximum ON/OFF PMS MPPT OG Maximum Power Point Tracker Only OPB Only PV-arrays partly supplying the PMSs Power Management Strategies PPS Peak Power Shaving PSBB Preliminarily Sized Battery Bank pu per unit PV Photovoltaic RBB Resized Battery Bank RC Replacement Cost RESs Renewable Energy Sources SOC State Of Charge V Voltage VC Variable Cost

Standalone hybrid generation system for the remote area of Thar, Pakistan
4
WG Wind Generator P&O Perturb and Observe PFC Power Factor Correction PI Proportional integral PID Proportional Integral Derivative PMSG Permanent magnet Synchronous Generator PV Photovoltaic Cell PWM Pulse Width Modulation RES Renewable Energy Systems RMS Root Mean Square RV Recreational vehicle SA Standalone SCR Silicon Controlled Rectifier SOC State of Charge STC Standard Test Condition TSP Tip Speed Ratio UPS Uninterrupted Power Supply VAWT Vertical Axis Wind Turbine VSD Variable Speed Drive WECS Wind Energy Conversion System WRSG Wound Rotor Synchronous Generator
Standalone hybrid generation system for the remote area of Thar, Pakistan
5
Table of Contents
ACKNOWLEDGEMENT ................................................................................................................... 2
LIST OF ABBREVIATION ............................................................................................................... 3 Introduction ................................................................................................................................................ 7 Aims ............................................................................................................................................................... 7 Objectives .................................................................................................................................................... 8 System components and Tools ............................................................................................................. 8
CHAPTER 2: Background Research .......................................................................................... 9 2.1. System Location Analysis ............................................................................................................ 11 2.2. Components of the Hybrid generation System .................................................................... 12 2.2.1. Solar Photovoltaic ...................................................................................................................... 12 2.2.2. PV Array System configurations .......................................................................................................... 14 2.2.3. PV Design and Array sizing approaches .......................................................................................... 14 2.2.4. PV-‐array Implementation ...................................................................................................................... 15 2.2.5. PV Array specification .............................................................................................................................. 16
2.3. Wind Turbine .................................................................................................................................. 17 2.3.1. Wind Energy Conversion System ........................................................................................................ 18 2.3.2. Speed and power relation ...................................................................................................................... 18
2.4. Permanent Magnet Synchronous Generator (PMSG) Model ........................................... 23 2.4.2. PMSG Controller Modeling ..................................................................................................................... 24 2.4.2.1. Optimum power control ...................................................................................................................... 24 2.4.2.2. Efficient operation of PMSG ............................................................................................................... 25
2.5. Energy Storage System ................................................................................................................. 27 2.5.1. Rechargeable battery ............................................................................................................................... 28 2.5.3. Battery sizing ............................................................................................................................................... 32
2.6. Power Electronics .......................................................................................................................... 33 2.6.1. PV Array Power Electronics and control Topology .................................................................... 35 2.6.1.1. Three Phase .............................................................................................................................................. 35 2.6.2. Power Electronics and Control Topology for Wind Generation ............................................ 38 2.6.3. Power Electronics and control Topologies for BES .................................................................... 39 2.6.4. Battery Charging/discharging Control algorithm ....................................................................... 42 2.6.4.1. Charging/Discharging Controlling model ................................................................................... 43
2.7. Design Topologies literature Review. ..................................................................................... 45 2.7.1. Technical configurations for hybrid power systems .................................................................. 45 2.7.2. AC/DC-‐coupled Hybrid Power Systems ........................................................................................... 45 2.7.3. AC-‐coupled Hybrid Power Systems ................................................................................................... 46 2.7.4. Centralized AC-‐coupled Hybrid Power Systems. ......................................................................... 46 2.7.4. Distributed AC-‐coupled Hybrid Power Systems. ......................................................................... 46 2.7.5. DC-‐coupled Hybrid Power Systems ................................................................................................... 47 2.7.6. Mixed-‐coupled Hybrid Power Systems ............................................................................................ 48 2.7.7. Series-‐Parallel Hybrid Power System ............................................................................................... 48
2.8. Matlab/Simulink User Manual .................................................................................................. 50 2.8.1. Simulink® ....................................................................................................................................................... 51 2.8.2. Starting up Simulink ................................................................................................................................. 51 2.8.3. SimPowerSystems ..................................................................................................................................... 53
2.9. Devices Used in the Hybrid Generation System Modeling ............................................... 54 2.9.1. Solar Cell ........................................................................................................................................................ 54 2.9.2. Wind turbine ................................................................................................................................................ 56 2.9.4. Permanent Magnet Synchronous Machine ..................................................................................... 59 2.9.5. MOSFET .......................................................................................................................................................... 61 2.9.6. Insulated gate bipolar transistor (IGBT) ......................................................................................... 64

Standalone hybrid generation system for the remote area of Thar, Pakistan
6
2.9.7. Three-‐Level Bridge .................................................................................................................................... 68 CHAPTER-‐3: Load Profile And Preliminary Sizing of the HPS Elements. ................... 71 3.1. Load profiles considered for the Thesis ................................................................................. 71 3.2. Renewable power resources ...................................................................................................... 72 3.2.1. Solar irradiation and wind speed ....................................................................................................... 72 3.2.2. Power outputs of a PV-‐panel and a wind turbine ........................................................................ 73
3.3. Preliminary Sizing of System Elements .................................................................................. 75 3.3.1. Preliminary Sizing of the Battery bank ............................................................................................ 75 3.3.2. Preliminary sizing of PV-‐arrays ........................................................................................................... 75 3.3.3. Sizing of the renewable energy sources in hybrid systems ..................................................... 77
CHAPTER – 4: Implementation, Modeling And Simulation of the Hybrid Generation System. ...................................................................................................................... 78 4.1. Proposed System Design ............................................................................................................. 78 4.2. PV Array Technical Specification .............................................................................................. 79 4.2.1. PV Panel Model ........................................................................................................................................... 79 I-‐V and P-‐V characteristics of Single PV panel ........................................................................................... 80 4.2.2. PV Array Model ........................................................................................................................................... 81 4.2.3. Simulation Result ....................................................................................................................................... 82 4.2.4. Boost converter .......................................................................................................................................... 84 4.2.5. Maximum Power Point Tracking (MPPT) modeling ................................................................... 84 4.2.6. VSC converter .............................................................................................................................................. 86
4.3. Wind Turbine .................................................................................................................................. 87 Technical Specification ........................................................................................................................................ 87 4.3.1. Wind Turbine Model ................................................................................................................................. 88 4.3.2. Simulation Result ....................................................................................................................................... 89
4.4. Three Phase Inverter Using Pulse Width Modulation (PWM) ........................................ 92 4.4.1. Simulation Result ....................................................................................................................................... 93
4.5. Hybrid Generation System Model ............................................................................................. 93 4.5.1. Simulation Result ....................................................................................................................................... 94
5. Conclusion ............................................................................................................................................ 96 6. References ............................................................................................................................................ 97
APPENDIX 1 ................................................................................................................................. 100
APPENDIX 2 ................................................................................................................................. 105

Standalone hybrid generation system for the remote area of Thar, Pakistan
7
Introduction The rapidly increasing costs of fossil fuel and power line extensions, combined with the desire to reduce carbon dioxide emissions pushed the development of hybrid power system suited for remote locations. Hybrid power systems are designed for the generation and use of electrical power. They are independent of a large, centralized electricity grid and incorporate more than one type of power source. They may range in size from relatively large island grids to individual household power supplies. Especially for remote places where electricity has not reached yet it is recommended that decentralized generation, which is based on renewable energy technologies, is perhaps the only efficient way to provide electricity. For the same reasons that make difficulty of extending the conventional grids, transporting fuel to the remote areas and replacement parts needed for the conventional sources like diesel generators. The energy for Renewable energy sources (RES) is locally available and a properly chosen RESs can reduce the operating periods of the conventional power sources considerably which will result in reduction of the fuel consumption and minimizing the need of maintenance. This in turn will result in the improvement of sustainable power generation. A system, which depends entirely upon RESs, is possible but not reliable for the uninsured availability of the resources for the RES systems. In order to meet the sustained load demands during the varying natural conditions, different renewable energy sources are integrated for extended usage of alternative energy, However, a lot of requirements have to be considered first. It is important to understand all the factors that influence its behavior, in order to get the best of it. The most important factors are location, time and user needs (power). Location associates information about climate, energy sources availability and environment conditions. This information is very important to decide what kind of renewable generators can be chosen [1]. This thesis focuses on the combination of wind, solar, Genset and energy storing systems for sustainable power generation. The wind turbine output power varies with the wind speed at different conditions. The solar energy also varies with the hourly, daily and seasonal variation of solar irradiation. Thus, a generator-set system with a battery bank (energy storage bank) can be integrated with the wind turbine(s) and PV-system to ensure that the system performs under all conditions. In the proposed system, when the wind speed and solar irradiation is insufficient to meet the demand and whenever there is excess supply from the RESs, the energy storage bank stores energy, which will be used at times when there are insufficient supplies from the RESs. If either the available power from the wind turbine or from the solar panels cannot satisfy the load demand, the Genset system can meet the excess power demand.
Aims A combination of different renewable energy sources, like wind generator and PV-system, with conventional energy source, like a diesel generator, is known as hybrid power system. Hybrid systems can provide a steady community-level electricity service, such as village electrification, offering also the possibility to be upgraded through grid connection in the future. The advantages of using renewable energy sources for generating power in remote islands are obvious such as the cost of transported fuel are often prohibitive fossil fuel and that there is increasing concern on the issues of climate change and global warming.

Standalone hybrid generation system for the remote area of Thar, Pakistan
8
The project which is presented in this paper is to investigate for the best design layout (connection topology); to size the system elements appropriately; to design different models and simulate for the different power management strategies which are defined for the system of the HPSs, which consists of renewable energy sources (PV-arrays and wind generator), conventional backup energy source (diesel engine generator) and energy storage bank (battery bank) to sustainably and efficiently satisfy the energy demand of remote site.
Objectives The objectives of the project are: -
• To investigate for the best design layout (connection topology), model and simulate the selected topology for different power management strategies of the HPSs, which consists of renewable energy sources (PV-arrays and wind generator), conventional backup energy source (diesel engine generator) and energy storage bank (battery bank) to sustainably and efficiently satisfy the energy demand of remote places, where main grid electricity has not reached yet due to many geographical and economic constraints.
• Understanding micro-grid concept and understanding of power integration between various renewable energy sources with the micro grid
• Understanding and designing of the various power electronics used in integration between generation source and the micro-grid
• Designing an improved prototype, demonstrate the tests and analysing the system output. • Carrying a series of experiments through simulation to achieve the best connection topology
and analysing the outcome generated. • Understand of the MPPT and its principle algorithm. • Achieving the project management skills.
System components and Tools The hybrid generation system, described here includes the following main elements: -
• Renewable energy sources: PV-system, Wind generator • Energy storage bank: Battery bank • Backup energy source: Diesel generator set • AC-loads • Power electronic devices (Rectifier, inverter, PWM) • MATLAB simulation software. • Simscape systems • Simpower systems • Simelectronics systems • SMA off- grid simulation software • Wind farmer simulation software • Computer • Internet

Standalone hybrid generation system for the remote area of Thar, Pakistan
9
CHAPTER 2: Background Research Remote rural areas, especially in developing countries, are in great need of affordable and reliable electricity to achieve development. Likewise, an overview through the most important literature on rural electrification proves that RESs are one of the most suitable and environmentally friendly solutions to provide electricity within rural areas. Autonomous decentralized (off-grid) rural electrification based on the generation of renewable power on the site through the installation of stand-alone power systems in rural households, and the set-up of electricity distribution mini-grids, fed by RES or mixed ones, have been proven for being capable of delivering high quality and reliable electricity for lighting, communication, water supply and motive power, among others. Using RESs have many advantages over conventional sources. Some of the advantages of using RESs are [3]:
- Gain an immediate access to reliable electricity at any time - Avoid long waits for grid extension and permit the connection it comes - Reduce the dependency from oil price fluctuations - Reduce the transportation costs of fuels - Improve health care and reduction in rural areas - Increase economic productivity and create local employment opportunities - Fight climate change and poverty - Allow for a better use of local natural resources
Off-grid renewable energy technologies satisfy energy demand directly and avoid the need for long distribution infrastructures. Hybrid systems can provide a steady community-level electricity service, such as village electrification, offering also the possibility to be upgraded through grid connection in the future. Hybrid systems with a backup Genset run with minimal fuel consumption because the Genset is brought on line only to assist in periods of high loads or low renewable power availability. This in turn results in a large reduction in fuel consumption as compared to a Genset only powered system. Furthermore, due to their high levels of efficiency, reliability and long-term performance, these systems can also be used as an effective backup solution to the public grid in case of blackouts or weak grids, and for professional energy solutions, such as telecommunication stations or emergency rooms at hospitals [3]. The main disadvantage of wind turbines and PV-systems is that naturally variable wind speed and variable solar irradiation cause voltage and power fluctuation problems at the load side. Using appropriate power converters and control strategies can solve these problems. Another significant point is to store the energy generated by wind turbines and PV-systems for future use when no wind and/or no irradiation is available but the user demand exists. For this, an energy storage bank can be incorporated in such a way that the battery stores energy whenever there is excess supply and discharges (or supplies the load) when there is more demand than supply. Successful results have already been obtained with hybrid systems worldwide. Rural communities without hope to be connected to the public grid (at least not in the medium term), lacking resources to keep up with the fuel prices or with unused diesel infrastructures, have found on hybrid systems the most suitable, environmentally friendly and cost competitive solution for power delivery. To mention some [4]: Reference [4, 5] presents a hybrid configuration comprising of a wind–diesel system originally developed by the Hydro-Quebec, aimed at reducing the cost of electricity supply in remote areas. The two main blocks of the system presented are, diesel- driven synchronous generator and the wind

Standalone hybrid generation system for the remote area of Thar, Pakistan
10
turbine driven by the asynchronous (induction) generator. The wind turbine block uses a 2-dimensional lookup table to compute the turbine torque output as a function of wind speed and turbine speed. At low wind speeds both the induction generator and the diesel-driven synchronous generator are required to feed the load. When the wind power exceeds the load demand, it is possible to shut down the diesel-generator. In this all-wind mode, the synchronous machine is used as a synchronous condenser and its excitation system controls the grid voltage at its nominal value. A secondary load bank is used to regulate the system frequency by absorbing the wind power exceeding consumer demand. In comparison to the system the system proposed in this report will be more reliable and economical to provide electricity to the remote area of THAR as it includes wind and solar generation sources that will meet must of the load depends it self and in case due to unavailability of the renewable sources due to climate change, diesel generator can be used to meet the demands and also during peak resources availability power can be stored to the storage banks hence use of Genset will be limited making it more economical and environment friendly system and also in the published design the system is using DC coupled HPS which is more complicated and requires more inverters hence make it more costly and less efficient while in system, proposed in this report will be using mixed coupling system to make it more efficient and economical, Below is the block diagram of the published system design(wind–diesel system originally developed by the Hydro-Quebec).
Figure 2.1 DC coupled Hybrid generation system [4]
Figure 2.2 Mixed coupled Hybrid generation system [5]
In the literature, most of the models using wind turbines are based on a non-linear relationship between rotor power coefficient and linear tip speed of the rotor blade [6, 7] Muljadi and Butterfield mention the advantages of employing a variable speed wind turbine and present a model of it with pitch control. In his model, during low to medium wind speeds, the generator and the power converter control the wind turbine to maximize the energy capture by maintaining the rotor speed at a

Standalone hybrid generation system for the remote area of Thar, Pakistan
11
predetermined optimum value. For high wind speeds the wind turbine is controlled to maintain the aerodynamic power produced by the wind turbine either by pitch control or by generator load control.
The same principle will be adopted in the system proposed in this report for the wind turbine and will also include the Maximum power point tracking (MPPT) for the PV panel to extract the maximum energy falling on the panels, this will be make the system power electronics more complicated but the efficiency of the system can be increased by 30-40% and also in all the new system MPPT technology is used as it significantly increases the efficiency of the system with little increase in the capital cost of the system which in long run make the system economical [6]. A case study reported in [7] describes a cost-effective power supply solution in a remote area in Tunisia. The climate of Tunisia, located in North Africa, well suited to the use of solar energy. There are many small, remote locations in Tunisia that rely on diesel generators for electric power, as grid extension is not economically feasible. The cost of running these generators can be quite expensive when accounting for the transportation costs and efficiency of diesel generators during off-peak periods. As a result, a hybrid solar power with battery storage-based power system was considered for continuous power supply in this area. It has been shown that the power generation cost of hybrid a solar and battery storage system is $240.65 per MWh, whereas a diesel generator based power supply system costs about $289.1 per MWh. In favorable wind conditions, wind turbine-based hybrid power systems can offer a cheaper solution compared with solar energy based hybrid renewable power supply .
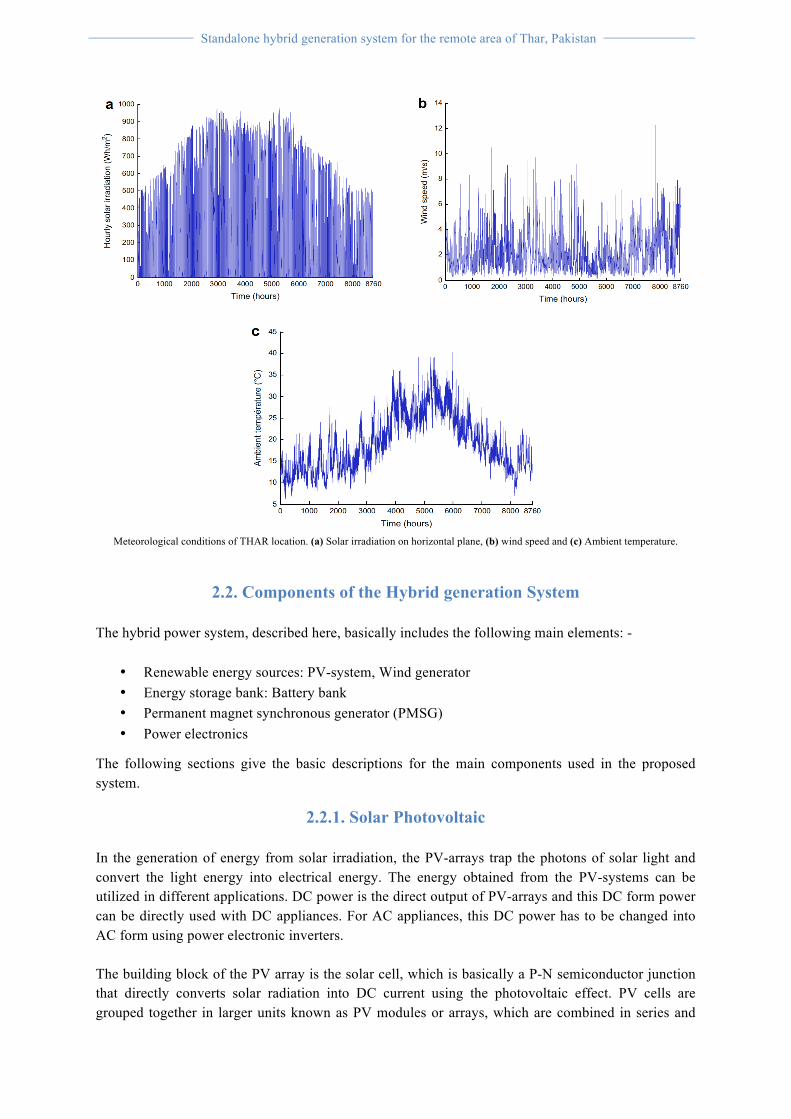
2.1. System Location Analysis It is important to understand the importance of the location where system has to be deployed as location associates information about climate, energy sources availability and environment condition which play a major role in the production and that is the reason I choose THAR location which Is located on the coast Pakistan as the location has abundant amount of solar and wind energy, also the energy produced by the conventional sources raises the greenhouse gas emissions, which may be the key source of global warming. Pakistan’s total GHG emissions in 2012 amounted to 409 million tones (mt) of Carbon dioxide (CO2) equivalent, comprising about 54% CO2, 36% Methane, 9% Nitrous Oxide and 1% other gases. The biggest contributor is the energy sector with 50% share, followed by the agriculture sector (39% share), industrial processes (6% share) and other activities (5% share). Pakistan has also signed the previous Kyoto protocol on reduction of CO2 emission to the atmosphere. For this reason, the Pakistan government is very much concerned about environmental issue and the government wants the overall improvement of the CO2 emission [2] and also THAR is located on the coastal region of Pakistan and coast of Pakistan is about 1,120 kilometers long and It is very expensive to connect small villages to the national electric grid because of the huge infrastructure costs involved and, also Pakistan is facing electricity shortfall since last decade, to overcome this issue a step towards renewable energy is need to be taken. According to the experts, WAPDA (Water and Power Development Authority, Pakistan) at the moment does not have enough money and electricity to supply power to the coastal region. The only way to supply the electricity to the coastal areas of Pakistan is through the use of the renewable resources because abundant natural resources are available nearly all year, below the graphs showing wind and Sun availability throughout the year in the THAR area [2] – [4].
Standalone hybrid generation system for the remote area of Thar, Pakistan
12
Meteorological conditions of THAR location. (a) Solar irradiation on horizontal plane, (b) wind speed and (c) Ambient temperature.
2.2. Components of the Hybrid generation System The hybrid power system, described here, basically includes the following main elements: -
• Renewable energy sources: PV-system, Wind generator • Energy storage bank: Battery bank • Permanent magnet synchronous generator (PMSG) • Power electronics
The following sections give the basic descriptions for the main components used in the proposed system.
2.2.1. Solar Photovoltaic In the generation of energy from solar irradiation, the PV-arrays trap the photons of solar light and convert the light energy into electrical energy. The energy obtained from the PV-systems can be utilized in different applications. DC power is the direct output of PV-arrays and this DC form power can be directly used with DC appliances. For AC appliances, this DC power has to be changed into AC form using power electronic inverters. The building block of the PV array is the solar cell, which is basically a P-N semiconductor junction that directly converts solar radiation into DC current using the photovoltaic effect. PV cells are grouped together in larger units known as PV modules or arrays, which are combined in series and

Standalone hybrid generation system for the remote area of Thar, Pakistan
13
parallel to provide the desired output voltage and current. The well-known equivalent circuit of solar cells arranged in NP-parallel and NS-series is shown in Fig. 2.3. It is composed of a light-generated current source, a diode representing the nonlinear impedance of the pen junction, and series and parallel intrinsic resistances. The mathematical model that predicts the power production of the PV generator becomes an algebraically simply model, being the current-voltage relationship defined in Eq. (1) [6,7]
Where: IA: PV array output current VA: PV array output voltage IPh: Solar cell photocurrent
Fig. 2.3 Equivalent circuit of solar cell
Irs: Solar cell reverse saturation current (aka dark current). q: Electron charge, 1.60217733ee19 Cb. A: P-N junction ideality factor, between 1 and 5. k: Boltzmann’s constant, 1.380658ee23 J/K. Tc: Solar cell absolute operating temperature, K. Rs: Cell intrinsic series resistance. Rp: Cell intrinsic shunt or parallel resistance. The photocurrent Iph for any operating conditions of the PV array is assumed to be related to the photocurrent at standard test conditions (STC) as follows:
fAMa : Absolute air mass function describing solar spectral influence on the photocurrent IPh.
fIA: Incidence angle function describing influence on the photocurrent IPh.
ISC: Cell short-circuit current at STC. aIsc: Cell temperature coefficient of the short-circuit current, A/module/diff. temp. (K). TR: Solar cell absolute reference temperature at STC, K. S: Total solar radiation absorbed at the plane-of-array, W/m2.
SR: Total solar reference radiation at STC, 1000 W/m2.

Standalone hybrid generation system for the remote area of Thar, Pakistan
14
2.2.2. PV Array System configurations In the stand-alone hybrid power systems, PV-array system is used in such a way that loads can be supplied any time in an efficient way. The intensity of solar irradiation varies with time and season. So, the most advisable and efficient way of harvesting the solar energy is by connecting energy storage devices (batteries) in such a way that loads can be supplied any time and the battery can store whenever there is excess supply from the PV-array system. Then, the stored energy in the battery can be used during times where there is less supply or there more demand. Commonly, most appliances and loads are designed to operate on AC. However, the PV-array system only gives a DC power. Thus, an inverter (DC/AC converter) is a must to be used so that AC loads can be supplied from the PV-system.
Fig. 2.4: PV-system supplying AC loads connected at the main DC-bus
Figure 2-4 shows PV-array system, which is a part of the whole system, with battery bank charging or supplying the AC load. When planning for a long-term operation of a stand-alone PV-system, the battery bank is playing important role and it is necessary to avoid the overcharge and deep discharge of the battery to enhance its usable life. Thus, a controller is an important element of the energy storage in the PV-array system. Over and above, it is important to note that a bi-directional converter of DC/DC type is used here allowing the battery to charge at times when there is more generation from the PV-arrays and to discharge (or supply to the load) during times of more demand on load or less supply.
2.2.3. PV Design and Array sizing approaches When designing the PV-array system, many factors have to be considered seriously. These include the technical specification, sizing of individual system components, safety considerations as well as system economics. As it can be referred from Figure 2-4 above, the system comprises basic components: the PV-arrays, inverters and battery. While dealing with the efficiency of the system, the efficiency of the basic components together with the wiring efficiency must be taken into an account. The gross daily energy demand of a load can be given [11] as:
2.3
Where End and Egd are the net and gross energy demands per day, is efficiency with subscripts i and w representing the inverter and wiring respectively. As it is explained in [9], inverters, batteries and the wiring of a well-designed PV-system have typical efficiencies of 85%, 85% and 98% respectively. Once the gross energy demand is calculated, the system voltage can be fixed. As it is suggested in [9],
Standalone hybrid generation system for the remote area of Thar, Pakistan
15
system voltage is chosen to be 24V if daily energy demand is greater than 1KWh and 12V if it is less than 1KWh. The system sizing depends on the estimation of the peak-load demands of loads. The total estimated power demand can be found [9, 11]:
2.4
Where Pest = total estimated peak-load power Pli = Peak power of single load, for loads I = 1, 2, 3…n. The DCC12 of the PV-arrays can then be determined at this point as [9]:
2.5
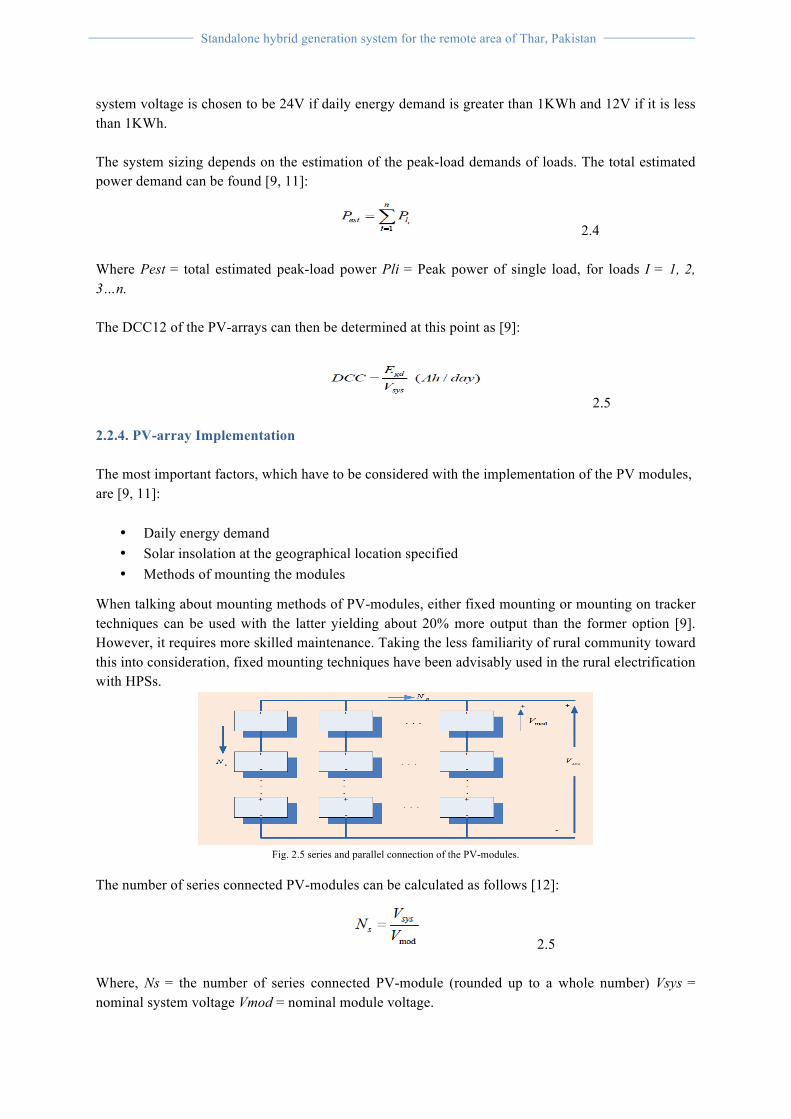
2.2.4. PV-array Implementation The most important factors, which have to be considered with the implementation of the PV modules, are [9, 11]:
• Daily energy demand • Solar insolation at the geographical location specified • Methods of mounting the modules
When talking about mounting methods of PV-modules, either fixed mounting or mounting on tracker techniques can be used with the latter yielding about 20% more output than the former option [9]. However, it requires more skilled maintenance. Taking the less familiarity of rural community toward this into consideration, fixed mounting techniques have been advisably used in the rural electrification with HPSs.
Fig. 2.5 series and parallel connection of the PV-modules.
The number of series connected PV-modules can be calculated as follows [12]:
2.5 Where, Ns = the number of series connected PV-module (rounded up to a whole number) Vsys = nominal system voltage Vmod = nominal module voltage.

Standalone hybrid generation system for the remote area of Thar, Pakistan
16
The number of parallel panels can be determined as [9, 12]:
2.6 Where, Np = number of parallel connected modules (rounded up to a whole number). LDA = Average daily load (A). A:L = average photovoltaic Ah available-to-average daily load Ah ratio. SL = system loss. Imp = module current at maximum power (A). DSH = the daily sun hours. Isc, PV module = Short circuit current per chosen PV module The average daily PV-to-load Ah ratio can be determined from [12]
2.7 Where DRT is the daily running time of the system and typical A:L values are 1.1-1.2 for non-critical loads and 1.3-1.4 or higher for critical loads, and the month with lowest A:L ratio has to be taken when designing a PV-array system[12]. The total number of PV-modules forming PV-array is, therefore [13]:
2.8
2.2.5. PV Array specification PV cells produces around 0.5V and it is the smallest unit of the solar PV system. Cells are further connected in series or/and parallel combination to form a PV array. The power-voltage and current-voltage characteristics of 330 SunPower modules (SPR-305) PV model are obtained according to the value of the variables 𝐼ph, 𝐼o, 𝑅sh, and 𝑅𝑠. The value of the variables are collected from manufacture
datasheet and are shown in the appendices, they usually provide values for 𝐼PV and 𝑉PV at open
circuit, short circuit, and maximum power point and finally the number of the PV cells. The current-voltage and power-voltage characteristics of a solar PV module operating at a standard temperature of 25∘ C and different solar irradiance are shown in Figures 2.6 and 2.7. According to solar irradiation or load current, the maximum output power of the PV module varies. Therefore, a proper control system is needed to use the PV model more efficiently as an electric power source by building a MPPT. There are many different MPPT methods discussed in [12,15], among them perturbation and observation method (P&O) is most widely used because it is much simpler and needs fewer measured variables. The 100-kW PV array of the detailed model uses 330 SunPower modules (SPR-305). The array consists of 66 strings of 5 series-connected modules connected in parallel (66*5*305.2 W= 100.7 kW).

Standalone hybrid generation system for the remote area of Thar, Pakistan
17
Manufacturer specifications for one module are: - Number of series-connected cells: 96. - Open-circuit voltage: Voc= 64.2 V. - Short-circuit current: Isc = 5.96 A. - Voltage and current at maximum power: Vmp =54.7 V, Imp= 5.58 A. The characteristics of the SunPower-SPR305 array are shown below.
Fig. 2.6 I-V characteristics of the PV- Array
Fig. 2.7 P-V characteristics of the PV- Array
Dot on blue curve indicate module manufacturer specifications (Voc, Isc, Vmp, Imp) under standard test conditions (25 degrees Celsius, 1000 W/m2).
2.3. Wind Turbine Wind turbines are used to generate electricity from kinetic power of the wind i.e. the generation of wind energy primarily depends on the wind speed [22]. To enhance the energy capture, the turbine is mounted on a tall tower. Wind is an intermittent resource; however, wind turbines are not unreliable technology. Modern wind turbines capture more than 90% of available energy from wind, compared with fuel efficiency between 30- 40% for a conventional coal fired station, which typically loses a significant portion of energy through heat loss and pollution. Some advantages of using wind turbines to generate power are - Environmentally friendly. - Produce no pollution. - No traditional fuel required.

Standalone hybrid generation system for the remote area of Thar, Pakistan
18
- Requires relatively little maintenance. - Longer life-time (up to 30 years). Disadvantages - Interference with radio/TV signals if located inappropriately. - The wind doesn’t blow all the time at required speed. - High initial cost. The main components of a wind turbine are the rotor of the turbine, which is the prime mover, and the induction generator. The rotor is connected to the generator via a gearbox, which matches and enhances the rotational speed. As the wind does not blow all the time nor does the sun shine all the time, solar and wind power alone can be poor power sources for a long time energy supply. Hybridizing solar and wind power sources together with storage batteries to cover the periods of time without sun or wind provides a realistic form of power generation.
2.3.1. Wind Energy Conversion System The proposed system consists of a variable speed wind turbine, an interior type permanent magnet synchronous generator and a PWM controlled rectifier. The variable speed wind turbine captures aerodynamic power from the wind. The interior type synchronous generator converts this wind power to useable electrical power. The PWM controlled rectifier is used to capture optimum aerodynamic power by controlling the generator’s rotor speed. The structure of the wind energy conversion system is shown below: -
2.3.2. Speed and power relation Air of mass “m” moving with speed “v” has a kinetic energy given by [11]:
2.10 The power “P” in moving air is the flow rate of kinetic energy per second. Thus the mechanical power in the moving air can be given by [11, 22]:
2.11
Where, P = mechanical power in moving air, W ρ = Air density, Kg/m3, Arot = area swept by the rotor blades exposed to the wind, m2 V = wind speed, m/s.
Standalone hybrid generation system for the remote area of Thar, Pakistan
19
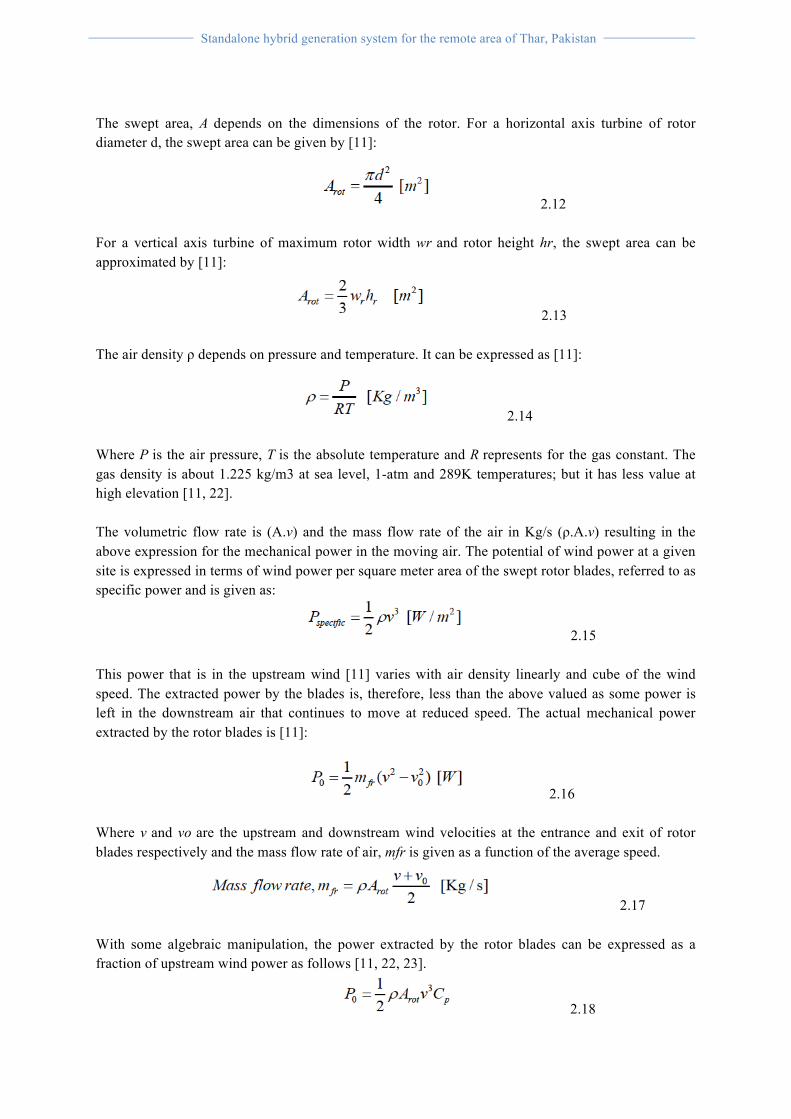
The swept area, A depends on the dimensions of the rotor. For a horizontal axis turbine of rotor diameter d, the swept area can be given by [11]:
2.12
For a vertical axis turbine of maximum rotor width wr and rotor height hr, the swept area can be approximated by [11]:
2.13
The air density ρ depends on pressure and temperature. It can be expressed as [11]:
2.14 Where P is the air pressure, T is the absolute temperature and R represents for the gas constant. The gas density is about 1.225 kg/m3 at sea level, 1-atm and 289K temperatures; but it has less value at high elevation [11, 22]. The volumetric flow rate is (A.v) and the mass flow rate of the air in Kg/s (ρ.A.v) resulting in the above expression for the mechanical power in the moving air. The potential of wind power at a given site is expressed in terms of wind power per square meter area of the swept rotor blades, referred to as specific power and is given as:
2.15 This power that is in the upstream wind [11] varies with air density linearly and cube of the wind speed. The extracted power by the blades is, therefore, less than the above valued as some power is left in the downstream air that continues to move at reduced speed. The actual mechanical power extracted by the rotor blades is [11]:
2.16 Where v and vo are the upstream and downstream wind velocities at the entrance and exit of rotor blades respectively and the mass flow rate of air, mfr is given as a function of the average speed.
2.17 With some algebraic manipulation, the power extracted by the rotor blades can be expressed as a fraction of upstream wind power as follows [11, 22, 23].
2.18

Standalone hybrid generation system for the remote area of Thar, Pakistan
20
Where Cp is the fraction of upstream wind power captured by the rotor blades, also called as power coefficient of the rotor or the rotor efficiency, expressed as:
2.19 Cp depends on vo/v ratio and is a single (theoretical) maximum value function whose value varies between (0.59 – 0.2) depending on the type of turbines i.e. Cp value of less than 0.5 for high speed, 2-pole turbine and Cp value between 0.2 and 0.4 for low speed with more blades are commonly used [11, 23].
Fig.2.8: Rotor efficiency as a function of vo/v ratio[11]
The total (actual) amount of wind energy that passes area Arot by wind speed V is [22, 23]:
2.20 Where Cp = coefficient of performance (0.59 – 0.35 depending on the turbine types). ηg= efficiency of generator. ηgb = gearbox/bearings efficiency. A general characteristic curve that describes the wind turbine output power variation with steady wind speed is shown in Figure 2.9 below [24].
Fig. 2-9: Typical wind turbine power output with steady wind speed characteristics [24]
Standalone hybrid generation system for the remote area of Thar, Pakistan
21
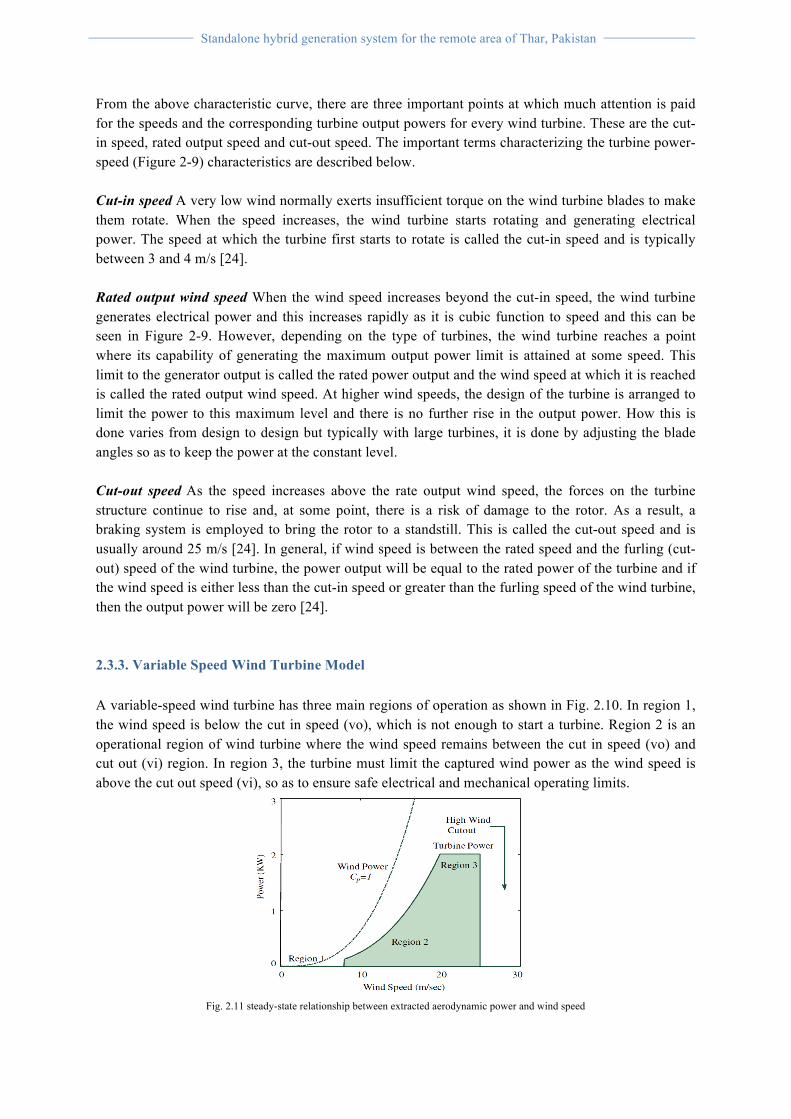
From the above characteristic curve, there are three important points at which much attention is paid for the speeds and the corresponding turbine output powers for every wind turbine. These are the cut-in speed, rated output speed and cut-out speed. The important terms characterizing the turbine power-speed (Figure 2-9) characteristics are described below. Cut-in speed A very low wind normally exerts insufficient torque on the wind turbine blades to make them rotate. When the speed increases, the wind turbine starts rotating and generating electrical power. The speed at which the turbine first starts to rotate is called the cut-in speed and is typically between 3 and 4 m/s [24]. Rated output wind speed When the wind speed increases beyond the cut-in speed, the wind turbine generates electrical power and this increases rapidly as it is cubic function to speed and this can be seen in Figure 2-9. However, depending on the type of turbines, the wind turbine reaches a point where its capability of generating the maximum output power limit is attained at some speed. This limit to the generator output is called the rated power output and the wind speed at which it is reached is called the rated output wind speed. At higher wind speeds, the design of the turbine is arranged to limit the power to this maximum level and there is no further rise in the output power. How this is done varies from design to design but typically with large turbines, it is done by adjusting the blade angles so as to keep the power at the constant level. Cut-out speed As the speed increases above the rate output wind speed, the forces on the turbine structure continue to rise and, at some point, there is a risk of damage to the rotor. As a result, a braking system is employed to bring the rotor to a standstill. This is called the cut-out speed and is usually around 25 m/s [24]. In general, if wind speed is between the rated speed and the furling (cut-out) speed of the wind turbine, the power output will be equal to the rated power of the turbine and if the wind speed is either less than the cut-in speed or greater than the furling speed of the wind turbine, then the output power will be zero [24]. 2.3.3. Variable Speed Wind Turbine Model A variable-speed wind turbine has three main regions of operation as shown in Fig. 2.10. In region 1, the wind speed is below the cut in speed (vo), which is not enough to start a turbine. Region 2 is an operational region of wind turbine where the wind speed remains between the cut in speed (vo) and cut out (vi) region. In region 3, the turbine must limit the captured wind power as the wind speed is above the cut out speed (vi), so as to ensure safe electrical and mechanical operating limits.
Fig. 2.11 steady-state relationship between extracted aerodynamic power and wind speed

Standalone hybrid generation system for the remote area of Thar, Pakistan
22
Fig. 2.11 demonstrates the steady-state relationship between extracted aerodynamic power and wind speed. The dotted line represents the power in the unimpeded wind passing through the rotor swept area, while the solid curve represents the power extracted by a typical variable speed wind turbine. Classic control techniques such as proportional, integral and derivative (PID) control of blade pitch are typically used to limit power and speed on both the low and high-speed shafts for turbines operating in region 3, while generator torque control is usually used in region 2. For a variable speed wind turbine operating in region 2, the control objective is to ensure maximum energy capture by operating the wind turbine at the peak of the Cp – TSR as shown in Fig. 2.11. The power coefficient Cp (λ, β) is a function of the tip speed ration (TSR) λ and the blade pitch β. The TSR is defined as [24,25]:
2.21 From (2.16), the rotor aerodynamic power P increases with Cp. As a result, the wind turbine should be operated at the maximum power coefficient Cpmax. The relationship between TSR λ and blade pitch can be expressed as follows:
2.22 The steady-state power curve of the wind turbine for different wind speeds is given in Fig. 2.12.
The steady-state power curve of the wind turbine for different wind speeds is given in Fig. 2.13.

Standalone hybrid generation system for the remote area of Thar, Pakistan
23
2.4. Permanent Magnet Synchronous Generator (PMSG) Model PMSGs are synchronous ac machines. The PMSG consist of 3-phase stator winding similar to the SCIG, while the rotor winding is replaced by the permanent magnets. The advantages of eliminating the rotor field winding are reduced copper losses, higher power density, lower rotor inertia and more robust rotor construction. The demerits are loss of flexibility in field flux control, possible demagnetization/saturation of magnetic material and parameter variation over time. Depending on the magnet placement on the rotor, PMSGs are divided into two categories:
• Surface permanent magnet machines (SPM) • Interior permanent magnet machines (IPM)
In SPM synchronous machines, the permanent magnets are mounted on the rotor surface as shown in Fig. 2.14(a). The rotor has an iron core that may be solid or made of punched laminations with skewed poles to minimize cogging torque, and the simple design makes it easy to build. This configuration is used for low speed operation, since the magnet may fly during high-speed operation. The permeability of magnetic material approximates air, producing an effectively large air gap. Moreover, the smooth rotor surface design minimizes saliency in the rotor, contributing to a low armature reaction effect due to low magnetization inductance. In IPM synchronous machines, magnets are installed inside the rotor as shown in Fig. 2.14(b). The IPM rotor is difficult to fabricate, although the robust design makes it more suitable for high speed applications. The unequal effective air gap distribution renders it a salient pole machine, where the direct axis inductance is less than quadrature axis inductance (Ld<Lq).27].

Standalone hybrid generation system for the remote area of Thar, Pakistan
24
Fig. 2.14. Cross sectional view of rotor design of a) SPMSG and b) IPMSG.
2.4.1. Operating Principle of PMSG In permanent magnet synchronous machines, magnets are placed on the rotor as alternate N and S poles. These magnets cause the development of magnetic flux in the air gap. When the stator windings are excited, they develop their own magnetic flux, and the close interaction between rotor and stator magnetic fields produces electromagnetic torque in the rotor. Fig. 2.15 shows a simplified cross-section view of 3-phase, 2-pole PMSG with symmetrical stator windings, displaced from each other at a 120° electrical angle. The relative motion between rotor and stator induces sinusoidal MMF waves on the magnetic axes of the respective phases. The phase difference between rotor magnetic flux and the magnetic axis of stator phase-a winding is known as rotor position angle (θr). The rate of change of rotor position angle further calculates the angular rotor speed (ωr )[27, 28].
Fig. 2.15. Cross-section view of 3-phase, 2-pole PMSG.
2.4.2. PMSG Controller Modeling The primary objective of the PMSG control is to extract optimum power from varying wind and ensures efficient operation of the PMSG
2.4.2.1. Optimum power control The optimum power extraction concept can be defined as the extraction of required power from a wind turbine under varying wind conditions [26]-[29]. In a variable speed wind turbine, the relationship between rotor speed and the output power for a given wind speed is shown in Fig. 2.13.

Standalone hybrid generation system for the remote area of Thar, Pakistan
25
The detailed relationship between the rotor speed and the output power for a given wind speed is discussed in the variable speed wind turbine model section. From (2.13) and (2.14), the applied torque or the extracted power from the wind can be controlled by regulating the rotor speed. By rearranging, the relationship between the applied torque and the rotor speed can be defined as follows:
2.23 where Kopt is given by
2.24
The optimum power can be as follows: -
2.25
The rotor speed at optimum power point can be expressed as follows:
2.26 Optimum power can be extracted by controlling the rotor speed. Fig. 2.16 demonstrates the power generated by a turbine as a function of the rotor speed for different wind speeds. As an example, for a particular wind speed (v6), the optimum power (PWopt) can be generated by keeping the rotor speed either equal to ω1 or ω3. However, as ω3 is higher than the base rotor speed, the control system must choose the rotor speed ω1. If the wind speed drops to v5 from v6, the control system sets the rotor speed to ω2 to extract the required power.
Fig. 2.16. Power generation of wind turbine in different rotor and wind speeds.
2.4.2.2. Efficient operation of PMSG Optimum power extraction algorithms can be implemented in wind energy conversion stages in different ways. An unregulated two-level rectifier with a boost or a buck-boost converter is used to

Standalone hybrid generation system for the remote area of Thar, Pakistan
26
regulate the dc-link voltage or rotor speed. This arrangement causes high harmonic distortion, which reduces generator efficiency [30]. A regulated two-level rectifier can improve these distortions [29, 30]. The primary objective of the controller is to regulate d- and q- axis components of the stator current. The reference optimum value of d- and q- axis current determines the operational loss of the IPMSG. The losses of a PMSG can be divided into four components: stator copper loss, core loss, and mechanical loss and stray-load loss. Only the stator copper and core losses are explicitly dependent on the fundamental components of the stator currents. Therefore, optimum reference values of d- and q- axis components of stator current have to be calculated to reduce the operation loss. An algorithm is developed to obtain the optimum reference value of d- and q- axis current to ensure minimum operational loss of IPMSG as discussed in the following. The q-axis stator current component (iq) for constant torque can be expressed as a function of the d-axis stator current component (id):
2.27 The maximum efficiency of the IPM synchronous generator operation can be achieved by minimizing copper and core losses. The copper (PCu) and core (PCore) loss for the IPM synchronous generator can be determined as follows [31].
2.28 Where Rc is the core loss component. The output power from the generator can be given as:
2.29
The optimum value of id can be determined from the output power (Pout) vs d-axis stator current (id) curve based on (2.28) as shown in Fig. 2.9. From Fig. 2.17, optimum value of the d- axis current component is chosen where the output power from IPMSG is maximum. The controller is shown in Fig. 2.18.
Standalone hybrid generation system for the remote area of Thar, Pakistan
27
Fig. 2.17. The d-axis current vs output electric power.
Fig. 2.18. Machine side controller.
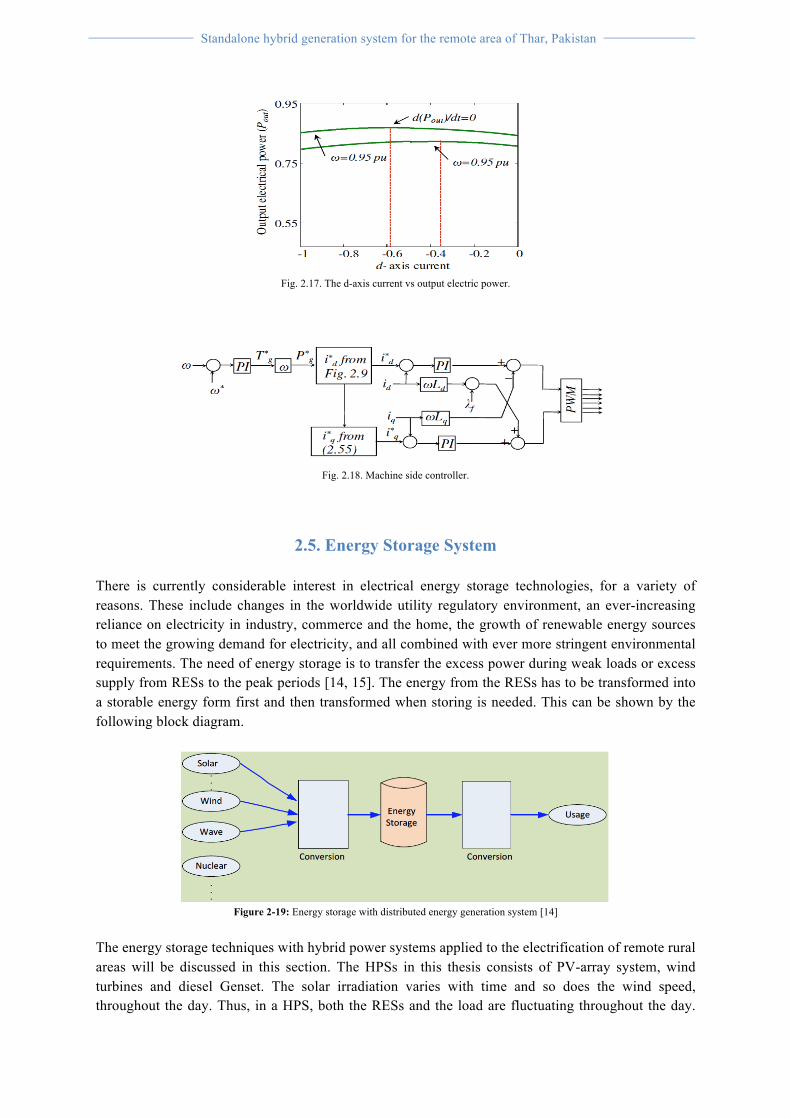
2.5. Energy Storage System There is currently considerable interest in electrical energy storage technologies, for a variety of reasons. These include changes in the worldwide utility regulatory environment, an ever-increasing reliance on electricity in industry, commerce and the home, the growth of renewable energy sources to meet the growing demand for electricity, and all combined with ever more stringent environmental requirements. The need of energy storage is to transfer the excess power during weak loads or excess supply from RESs to the peak periods [14, 15]. The energy from the RESs has to be transformed into a storable energy form first and then transformed when storing is needed. This can be shown by the following block diagram.
Figure 2-19: Energy storage with distributed energy generation system [14]
The energy storage techniques with hybrid power systems applied to the electrification of remote rural areas will be discussed in this section. The HPSs in this thesis consists of PV-array system, wind turbines and diesel Genset. The solar irradiation varies with time and so does the wind speed, throughout the day. Thus, in a HPS, both the RESs and the load are fluctuating throughout the day.

Standalone hybrid generation system for the remote area of Thar, Pakistan
28
These fluctuations may result in imbalances in power distribution (energy sources are not equal to energy sinks). As a result, the voltage and frequency in the power system will be affected. The addition of energy storage will assist balancing the distribution of power in the power network. The energy storage behaves like a large buffer to accommodate the unequal instantaneous energy in the power system. The energy storage element can act as a load or a generator depending on the supply to demand ratio. Ideally, at any instant of time, there should be a zero net exchange between the energy sources and the energy sinks (both real and reactive power) [14-16]. If this balance is not achieved, the voltage and frequency of the system changes to maintain equilibrium. There are many energy storage techniques. To mention some [6, 14]: - Battery Energy Storage System (BESS) - Pumped Hydroelectric Storage System (PHSS) - Superconducting Magnetic Energy Storage System (SMESS) - Ultra-capacitors - Flywheel Energy Storage Systems (FESS), etc. The different energy storage techniques have different applications in power systems. Some of them are [14]: i. Rapid reserve, ii. Area control and frequency responsive reserve, iii. Commodity storage iv. Transmission system stability, v. Transmission voltage regulation, vi. Transmission and Distribution facility deferral, vii. Renewable energy management, viii. Customer energy management, ix. Power quality and reliability. Each technology has its own particular strengths and operational characteristics. In this thesis, the battery bank as energy storage device is only considered.
2.5.1. Rechargeable battery Battery bank is an electrochemical device that uses electrochemical reactions to store electricity in the form of potential chemical energy. The energy storing batteries used with HPSs are rechargeable in a sense that they can charge when there is enough supply from the RESs and discharge when there is larger load demand than there is supply. They are sometimes also called as secondary batteries. The charging time for the battery bank [17] is:
2.30
Standalone hybrid generation system for the remote area of Thar, Pakistan
29
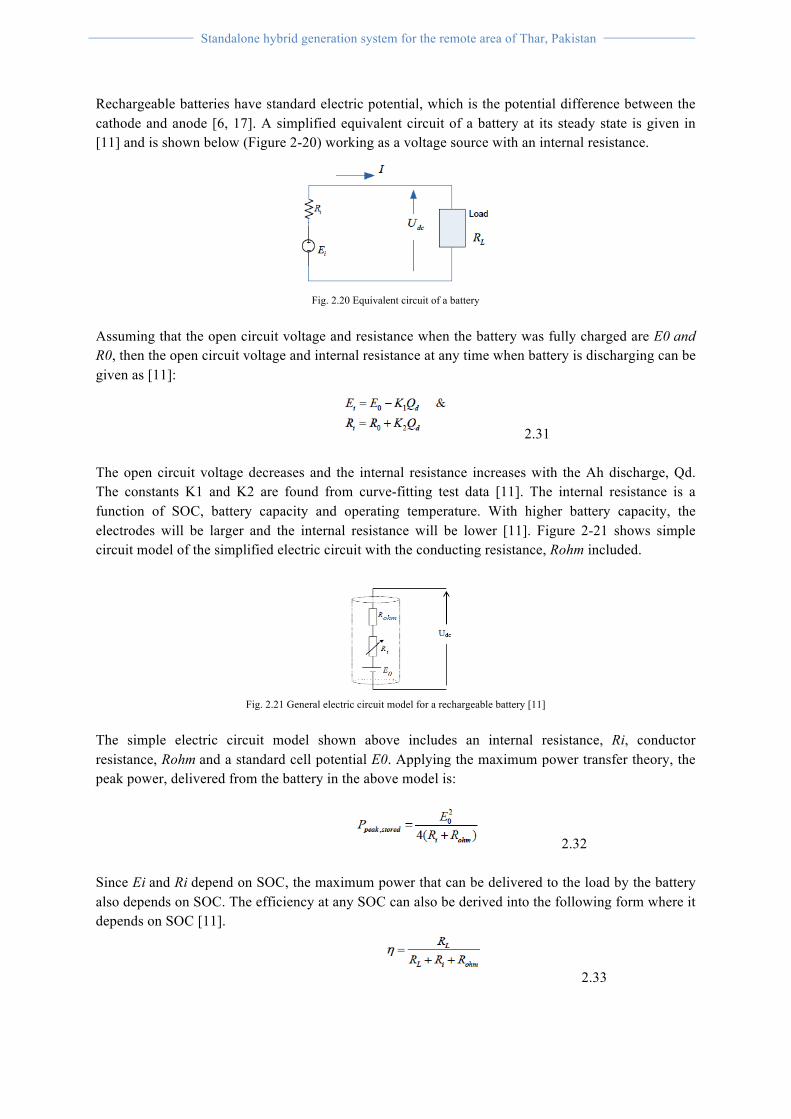
Rechargeable batteries have standard electric potential, which is the potential difference between the cathode and anode [6, 17]. A simplified equivalent circuit of a battery at its steady state is given in [11] and is shown below (Figure 2-20) working as a voltage source with an internal resistance.
Fig. 2.20 Equivalent circuit of a battery
Assuming that the open circuit voltage and resistance when the battery was fully charged are E0 and R0, then the open circuit voltage and internal resistance at any time when battery is discharging can be given as [11]:
2.31 The open circuit voltage decreases and the internal resistance increases with the Ah discharge, Qd. The constants K1 and K2 are found from curve-fitting test data [11]. The internal resistance is a function of SOC, battery capacity and operating temperature. With higher battery capacity, the electrodes will be larger and the internal resistance will be lower [11]. Figure 2-21 shows simple circuit model of the simplified electric circuit with the conducting resistance, Rohm included.
Fig. 2.21 General electric circuit model for a rechargeable battery [11]
The simple electric circuit model shown above includes an internal resistance, Ri, conductor resistance, Rohm and a standard cell potential E0. Applying the maximum power transfer theory, the peak power, delivered from the battery in the above model is:
2.32 Since Ei and Ri depend on SOC, the maximum power that can be delivered to the load by the battery also depends on SOC. The efficiency at any SOC can also be derived into the following form where it depends on SOC [11].
2.33
Standalone hybrid generation system for the remote area of Thar, Pakistan
30
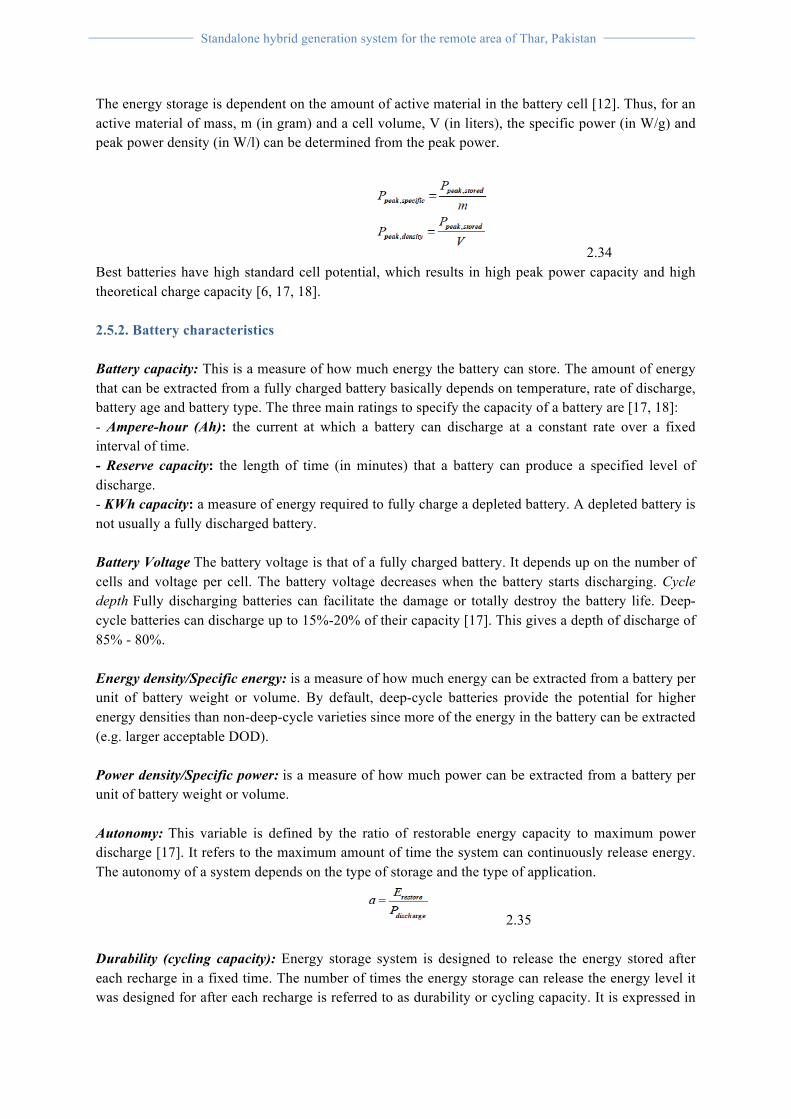
The energy storage is dependent on the amount of active material in the battery cell [12]. Thus, for an active material of mass, m (in gram) and a cell volume, V (in liters), the specific power (in W/g) and peak power density (in W/l) can be determined from the peak power.
2.34 Best batteries have high standard cell potential, which results in high peak power capacity and high theoretical charge capacity [6, 17, 18]. 2.5.2. Battery characteristics Battery capacity: This is a measure of how much energy the battery can store. The amount of energy that can be extracted from a fully charged battery basically depends on temperature, rate of discharge, battery age and battery type. The three main ratings to specify the capacity of a battery are [17, 18]: - Ampere-hour (Ah): the current at which a battery can discharge at a constant rate over a fixed interval of time. - Reserve capacity: the length of time (in minutes) that a battery can produce a specified level of discharge. - KWh capacity: a measure of energy required to fully charge a depleted battery. A depleted battery is not usually a fully discharged battery. Battery Voltage The battery voltage is that of a fully charged battery. It depends up on the number of cells and voltage per cell. The battery voltage decreases when the battery starts discharging. Cycle depth Fully discharging batteries can facilitate the damage or totally destroy the battery life. Deep-cycle batteries can discharge up to 15%-20% of their capacity [17]. This gives a depth of discharge of 85% - 80%. Energy density/Specific energy: is a measure of how much energy can be extracted from a battery per unit of battery weight or volume. By default, deep-cycle batteries provide the potential for higher energy densities than non-deep-cycle varieties since more of the energy in the battery can be extracted (e.g. larger acceptable DOD). Power density/Specific power: is a measure of how much power can be extracted from a battery per unit of battery weight or volume. Autonomy: This variable is defined by the ratio of restorable energy capacity to maximum power discharge [17]. It refers to the maximum amount of time the system can continuously release energy. The autonomy of a system depends on the type of storage and the type of application.
2.35 Durability (cycling capacity): Energy storage system is designed to release the energy stored after each recharge in a fixed time. The number of times the energy storage can release the energy level it was designed for after each recharge is referred to as durability or cycling capacity. It is expressed in

Standalone hybrid generation system for the remote area of Thar, Pakistan
31
number of cycles, N-cycles. The cycling capacity mainly depends on the depth of discharge. Figure 2-22 below shows the number of cycles versus the DOD of VRLA14 batteries.
Figure 2.22: Cycling capacity Vs depth of discharge for lead-acid battery [19, 20]
The higher the DOD, the lower will be the cycles and the lifetime of the batteries (can be seen from Figure 2-22). The battery cycles depend on the DOD and EOL [6].
2.36 The smaller the DOD, the more cycles can be provided by the battery but not in a linear relationship because of the EOL criterion. The EOL, in general, is a decrease of 80% of its capacity [6, 17]. The normal capacity needed can then be given [6] as:
2.37 Self-discharge: This refers to the portion of energy which was initially stored and dissipated in a given non-use period of time. There are different types of batteries, but the most commonly used rechargeable batteries are [6, 11, 17]: - Lead acid battery - Nickel cadmium (NiCad) battery - Nickel metal hydride (NiMH) battery - Lithium ion battery - Lithium-polymer battery - Zinc-air battery The main properties with their main application, the advantages and disadvantages of each these batteries are explained in [6, 11].

Standalone hybrid generation system for the remote area of Thar, Pakistan
32
2.5.3. Battery sizing Batteries are the main components of the PV-wind system used to store energy at times when there is surplus of supply, which can be used to supply the load at times of more demand from the load. Many factors affect the sizing of the battery system and the most important are [11, 12]: - Daily energy demand - Number of days of storage - Maximum depth of discharge The battery voltage is that of a fully charged battery. It depends up on the number of cells and voltage per cell [11].
2.38 Ncells = the number of cells in series V/cell = voltage per cell The battery capacity is the total Ampere-hour required to support the load requirement and is given by [11, 12]:
2.39
Where, BC = Battery capacity (Ah). Ebat= energy required from the battery per discharge. ηdisch =efficiency of discharge path (including inverters, wires, diodes, etc). Ncell = Number of series cells in one battery. Vdisch = average cell voltage during discharge. DOD= maximum allowed Depth of Discharge for required life cycle. Npar = number of parallel batteries. Batteries are generally not allowed to be discharged fully. The minimum value to which a battery can be discharged before it is recharged is called maximum depth of discharge, DOD. Deep discharge batteries can discharge up to 30- 40% of their state of charge, SOC [11]. The total energy required from the battery to supply the required loads is the sum of energies consumed by each load, which is the product of the duty ratio and peak energy consumption. It is given as follows [11, 12]:
2.40
Ebat = Wh energy of battery during discharge when all loads (i=1, 2…n) are connected Ebi = Wh energy of battery during discharge when load-i is connected Dbi= Duty ratio for load-i during battery discharge Pbi = Peak power consumption by load-i during battery discharge in watts Tri = repetition period for load-i in hrs.

Standalone hybrid generation system for the remote area of Thar, Pakistan
33
The parallel strings, Nbat are used to meet design requirements like [11, 17]: - To increase the existing battery capacity - To provide redundancy - To provide battery reserve in case of string disconnection for maintenance To ensure an optimal and safe cell recharge voltage, calculation of the number of series cells is important. The number of series cells can be determined from the battery window voltage limits and voltage per each cell, as given [20] below.
2.41 Where, Ncell = number of series cells. Vbat, max/min = maximum or minimum nominal battery voltage. Vcell,max/min = maximum or minimum cell voltage at Vbat,max or Vbat, min respectivel.y The lowest maximum voltage, Vmax and the highest minimum voltage, Vmin define the voltage window within which all loads in the system operate properly. In general, it is economical and recommended [20] to use fewer cells of higher capacity than more cells of lower capacity while sizing the battery system. The total number of batteries required in series will be [11]:
2.42 And the total batteries required in the system are:
2.43
2.6. Power Electronics A generalized block diagram representation of power electronics interface associated with DE systems is shown in Figure. The power electronics interface accepts power from the distributed energy source and converts it to power at the required voltage and frequency. For the storage systems, bidirectional flow of power between the storages and the utility is required. Figure shown below illustrates a design approach to organize the interface into modules, each of which can be designed to accommodate a range of DE systems and/or storages.
Standalone hybrid generation system for the remote area of Thar, Pakistan
34
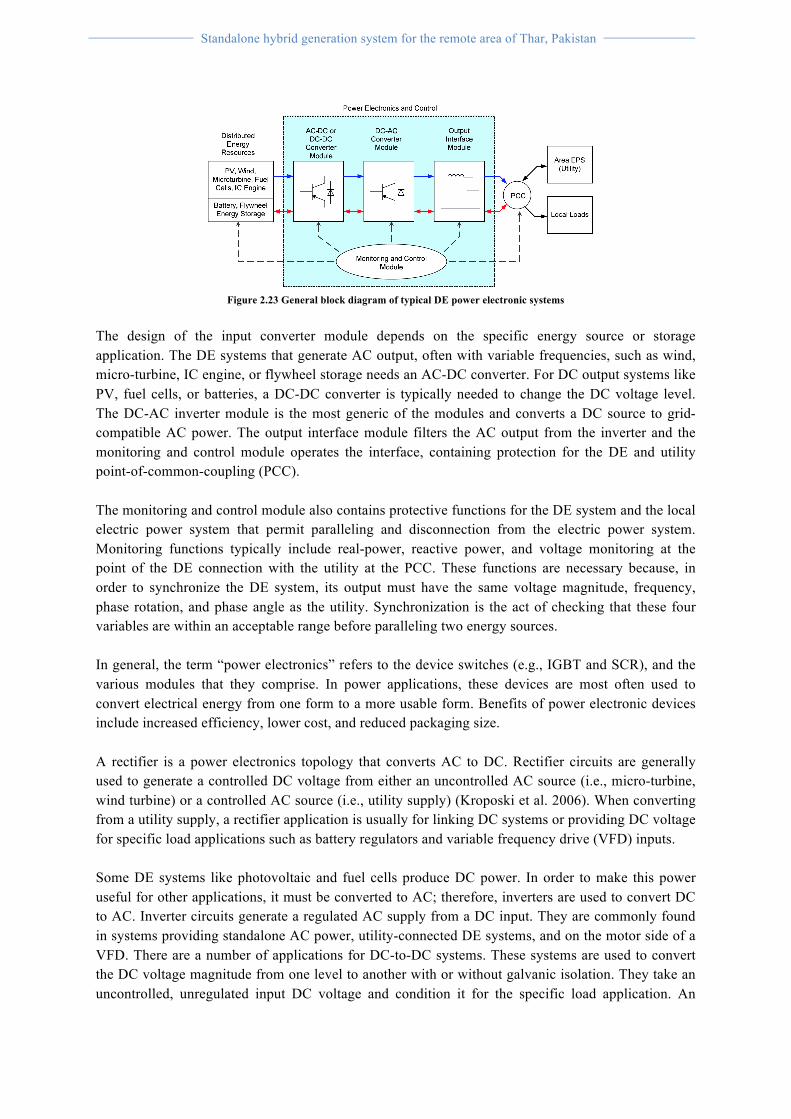
Figure 2.23 General block diagram of typical DE power electronic systems
The design of the input converter module depends on the specific energy source or storage application. The DE systems that generate AC output, often with variable frequencies, such as wind, micro-turbine, IC engine, or flywheel storage needs an AC-DC converter. For DC output systems like PV, fuel cells, or batteries, a DC-DC converter is typically needed to change the DC voltage level. The DC-AC inverter module is the most generic of the modules and converts a DC source to grid-compatible AC power. The output interface module filters the AC output from the inverter and the monitoring and control module operates the interface, containing protection for the DE and utility point-of-common-coupling (PCC). The monitoring and control module also contains protective functions for the DE system and the local electric power system that permit paralleling and disconnection from the electric power system. Monitoring functions typically include real-power, reactive power, and voltage monitoring at the point of the DE connection with the utility at the PCC. These functions are necessary because, in order to synchronize the DE system, its output must have the same voltage magnitude, frequency, phase rotation, and phase angle as the utility. Synchronization is the act of checking that these four variables are within an acceptable range before paralleling two energy sources. In general, the term “power electronics” refers to the device switches (e.g., IGBT and SCR), and the various modules that they comprise. In power applications, these devices are most often used to convert electrical energy from one form to a more usable form. Benefits of power electronic devices include increased efficiency, lower cost, and reduced packaging size. A rectifier is a power electronics topology that converts AC to DC. Rectifier circuits are generally used to generate a controlled DC voltage from either an uncontrolled AC source (i.e., micro-turbine, wind turbine) or a controlled AC source (i.e., utility supply) (Kroposki et al. 2006). When converting from a utility supply, a rectifier application is usually for linking DC systems or providing DC voltage for specific load applications such as battery regulators and variable frequency drive (VFD) inputs. Some DE systems like photovoltaic and fuel cells produce DC power. In order to make this power useful for other applications, it must be converted to AC; therefore, inverters are used to convert DC to AC. Inverter circuits generate a regulated AC supply from a DC input. They are commonly found in systems providing standalone AC power, utility-connected DE systems, and on the motor side of a VFD. There are a number of applications for DC-to-DC systems. These systems are used to convert the DC voltage magnitude from one level to another with or without galvanic isolation. They take an uncontrolled, unregulated input DC voltage and condition it for the specific load application. An

Standalone hybrid generation system for the remote area of Thar, Pakistan
35
example for such topology can be found in PV applications, where the dedicated DC-DC units are often designed to extract the maximum power output of the PV array. AC-to-AC converters can be used convert the AC source voltage magnitude and frequency to a fixed amplitude and frequency, making it compatible with the utility grid. The AC-to-AC converters are not typically used in modern DE applications due to some inherent disadvantages. A summary of the different power converters that are used for DE applications are given in Table 1 (Shepherd et al. 2004; DeBlasio et al. 2006).
Fig. 2.24 Power electronics systems for different power conversions
2.6.1. PV Array Power Electronics and control Topology The power electronics topologies for the PV systems can be categorized on the basis of the number of power processing stages, the location of power decoupling capacitors, utilization transformers, and the types of grid interfaces (Carrasco et al. 2006). The basic classifications based on the number of inverter output phases are
• Single phase • Single- multiple phase • Three phase
In the report I am going emphasis only on the three-phase interface as the system required three phase supply to the micro-grid.
2.6.1.1. Three Phase For larger systems over 10kW, three-phase inverters are most often used. All the configurations for single-phase utility connection can be used for the three phase. But, using a line-frequency transformer or a high-frequency transformer can do the isolation from the grid either. In the later case, an additional converter is required for converting DC from PV into high-frequency AC. Figure 8 shows a typical topology for a three-phase PV inverter utilizing a line-frequency three-phase transformer. The DC output of the PV array is connected across a filter capacitor. The output of the capacitor connects to the input of a voltage-source three-phase inverter. The output of each phase of the converters is connected to an inductor and capacitor to limit the high-frequency harmonics injected into the AC system. A synthesized AC output voltage is produced by appropriately controlling the switches. A three-phase transformer is then used to connect the power to the utility.

Standalone hybrid generation system for the remote area of Thar, Pakistan
36
Fig. 2.25 Three-phase PV topology with line-frequency transformer
Modern inverters tend to use a high-frequency transformer for galvanic isolation. This technology results in entirely new designs, such as the printed circuit board (PCB) integrated magnetic components (Kjaer et al. 2005). One such design is shown in Figure 9, where the transformers are embedded in high-frequency DC-DC converters. Such a topology is also very useful for multi-string configurations, where each of the strings can be connected to a common DC bus and then converted to grid compatible AC by using a single DC-AC inverter.
Fig. 2.26. Multi-string PV topology with high-frequency transformer-based isolation
The most generalized form of power electronics topology for the PV application is the DC-DC converter with embedded high-frequency transformer, along with the DC-AC inverter as shown in Figure 9. In general, the DC-DC converter controller does the MPPT and voltage boost. The power flow control to the utility and the sinusoidal unity power factor current-injection to the utility are produced by the DC-AC inverter controller. A simplified block diagram of the PV system with the power electronics and control is given in Figure 10.
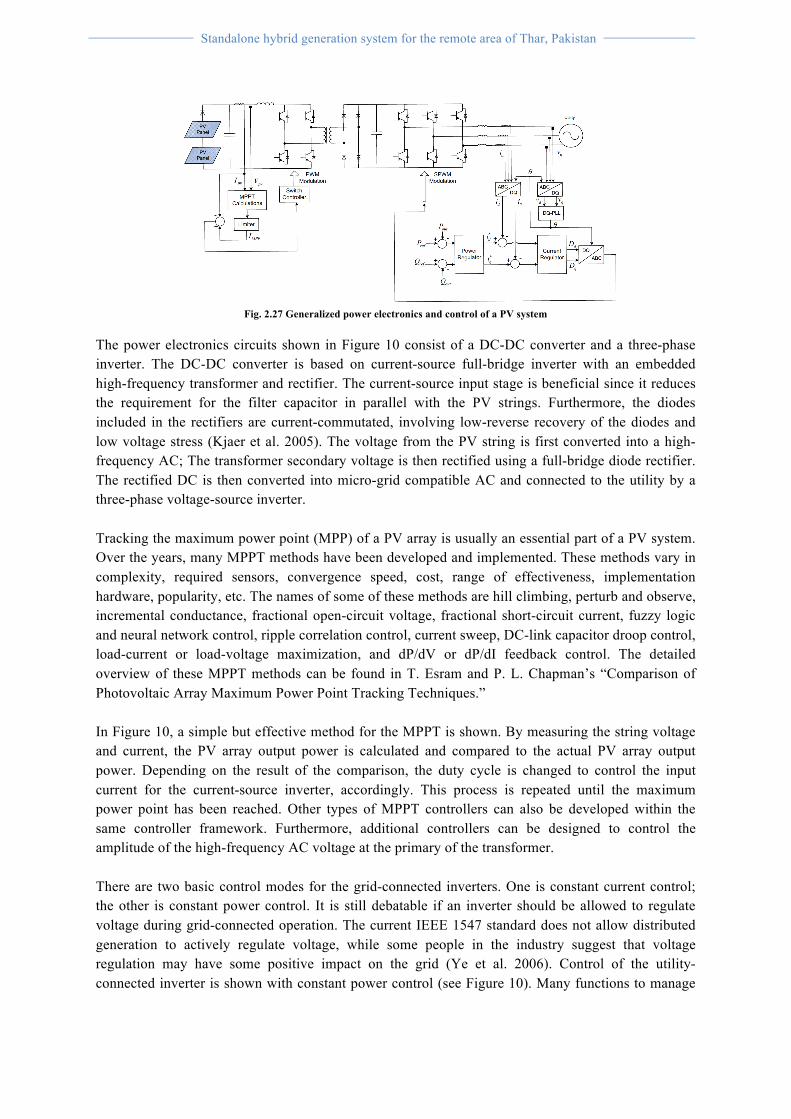
Standalone hybrid generation system for the remote area of Thar, Pakistan
37
Fig. 2.27 Generalized power electronics and control of a PV system
The power electronics circuits shown in Figure 10 consist of a DC-DC converter and a three-phase inverter. The DC-DC converter is based on current-source full-bridge inverter with an embedded high-frequency transformer and rectifier. The current-source input stage is beneficial since it reduces the requirement for the filter capacitor in parallel with the PV strings. Furthermore, the diodes included in the rectifiers are current-commutated, involving low-reverse recovery of the diodes and low voltage stress (Kjaer et al. 2005). The voltage from the PV string is first converted into a high-frequency AC; The transformer secondary voltage is then rectified using a full-bridge diode rectifier. The rectified DC is then converted into micro-grid compatible AC and connected to the utility by a three-phase voltage-source inverter. Tracking the maximum power point (MPP) of a PV array is usually an essential part of a PV system. Over the years, many MPPT methods have been developed and implemented. These methods vary in complexity, required sensors, convergence speed, cost, range of effectiveness, implementation hardware, popularity, etc. The names of some of these methods are hill climbing, perturb and observe, incremental conductance, fractional open-circuit voltage, fractional short-circuit current, fuzzy logic and neural network control, ripple correlation control, current sweep, DC-link capacitor droop control, load-current or load-voltage maximization, and dP/dV or dP/dI feedback control. The detailed overview of these MPPT methods can be found in T. Esram and P. L. Chapman’s “Comparison of Photovoltaic Array Maximum Power Point Tracking Techniques.” In Figure 10, a simple but effective method for the MPPT is shown. By measuring the string voltage and current, the PV array output power is calculated and compared to the actual PV array output power. Depending on the result of the comparison, the duty cycle is changed to control the input current for the current-source inverter, accordingly. This process is repeated until the maximum power point has been reached. Other types of MPPT controllers can also be developed within the same controller framework. Furthermore, additional controllers can be designed to control the amplitude of the high-frequency AC voltage at the primary of the transformer. There are two basic control modes for the grid-connected inverters. One is constant current control; the other is constant power control. It is still debatable if an inverter should be allowed to regulate voltage during grid-connected operation. The current IEEE 1547 standard does not allow distributed generation to actively regulate voltage, while some people in the industry suggest that voltage regulation may have some positive impact on the grid (Ye et al. 2006). Control of the utility-connected inverter is shown with constant power control (see Figure 10). Many functions to manage

Standalone hybrid generation system for the remote area of Thar, Pakistan
38
practical issues are not shown in the diagram, such as the negative sequence regulation, d-q decoupling, etc. The inner central loop regulates current, and the other control loop regulates power. In some cases, the reactive power reference, Qref, could be a power factor reference. By controlling this reference, the injected current to the utility can be maintained at unity power factor. Also, a variation of the constant power control can be implemented to maintain the inverter DC bus voltage at a constant value. In that case, the active power Pref, can be replaced with Vdref, and Pout can be replaced with Vdout so the DC voltage is regulated to the set-point Vdref. The output of this outer control loop is the set point I*d, which is used as a reference signal to the current regulator. When DC bus voltage is increasing, meaning the power from the primary source is increasing; it is charging the DC capacitor. In order to maintain the DC bus voltage, the i*d will be increased so that the power can be transferred to the inverter output.
2.6.2. Power Electronics and Control Topology for Wind Generation A typical power electronics topology that is used for a permanent magnet synchronous generator is shown in Figure 16. The three-phase variable voltage, variable frequency output from the wind turbine is rectified using a diode bridge. With the change in the speed of the synchronous generator, the voltage on the DC side of the diode rectifier changes. To maintain a constant DC-link voltage of the inverter, a step-up chopper is used to adapt the rectifier voltage. As viewed from the DC inputs to the inverter, the generator/rectifier system is then modeled as an ideal current source. This rectified output signal from the diode bride is filtered into a smooth DC waveform using a large capacitor (Carrasco et al. 2006). The DC signal is then inverted through the use of semiconductor switches into a three-phase, 50 Hz waveform. This waveform can then be scaled using a transformer to voltage levels required by the utility’s AC system. The generator is decoupled from the grid by a voltage-sourced DC-link; therefore, this PE interface provides excellent controllable characteristics for the wind energy system. The power converter to the micro-grid enables a fast control of active and reactive power. However, the negative side is a more complex system where more sensitive power electronic parts are required.
Fig. 2.28 Synchronous generator power electronics topology
The most generalized form of power electronics topology for the wind energy application is the back-to-back rectifier/inverter connection, which provides the improved power flow control as well as increased efficiency. The voltage-fed converter scheme used in such systems is shown in Figure 18. A PWM-based IGBT bridge rectifies the variable-frequency variable-voltage power from the wind generator. The rectifier also supplies the excitation needs for the induction generator. The inverter topology is identical to that of the rectifier, and it supplies the generated power at 50 Hz to the utility grid (Simoes and Farret 2004).

Standalone hybrid generation system for the remote area of Thar, Pakistan
39
Fig. 2.29 Generalized power electronics converter for wind systems
This general structure is suitable for any type of wind energy systems. For the PM synchronous generator, as discussed in Figure 16, the rectifier and boost converter can be replaced by the PWM rectifier to achieve the same level of control. Based on the control design for the back-to-back PWM converter system, various advantages can be obtained such as (Simoes and Farret 2004):
• The line-side power factor is unity with no harmonic current injection (satisfies IEEE 519). • Wind generator output current is sinusoidal. • There are no harmonic copper losses. • Continuous power generation from zero to the highest turbine speed is possible. • Islanded operation of the system is possible with a start-up capacitor charging the
battery.
Fig. 2.30 Control block diagram of PWM converter with PMSG
2.6.3. Power Electronics and control Topologies for BES The power electronics topologies for the battery energy storage systems can be of different types based on the number of cascaded stages in the conversion systems, types of converters, presence of galvanic isolation, and utility connection. The most fundamental topology for utility connection of the BESS is the single-stage, self-commutated voltage-source inverter as shown in Figure 49. While the DC output of the battery system is connected across a filter capacitor, the capacitor itself is used to limit the harmonic currents in the battery. The output of the capacitor connects to a voltage-source inverter (VSI) (Ponnaluri et al. 2005; Leung and Sutanto 2000). Depending on the utility connection, the inverter can be single-phase or
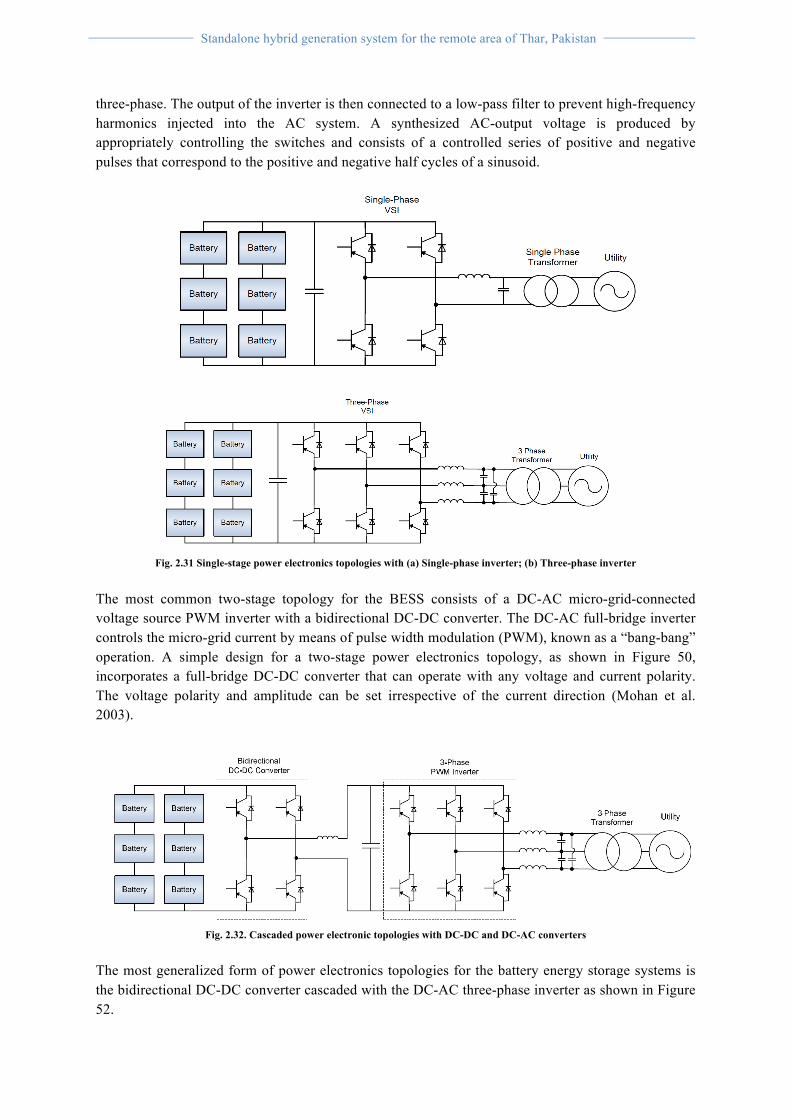
Standalone hybrid generation system for the remote area of Thar, Pakistan
40
three-phase. The output of the inverter is then connected to a low-pass filter to prevent high-frequency harmonics injected into the AC system. A synthesized AC-output voltage is produced by appropriately controlling the switches and consists of a controlled series of positive and negative pulses that correspond to the positive and negative half cycles of a sinusoid.
Fig. 2.31 Single-stage power electronics topologies with (a) Single-phase inverter; (b) Three-phase inverter
The most common two-stage topology for the BESS consists of a DC-AC micro-grid-connected voltage source PWM inverter with a bidirectional DC-DC converter. The DC-AC full-bridge inverter controls the micro-grid current by means of pulse width modulation (PWM), known as a “bang-bang” operation. A simple design for a two-stage power electronics topology, as shown in Figure 50, incorporates a full-bridge DC-DC converter that can operate with any voltage and current polarity. The voltage polarity and amplitude can be set irrespective of the current direction (Mohan et al. 2003).
Fig. 2.32. Cascaded power electronic topologies with DC-DC and DC-AC converters
The most generalized form of power electronics topologies for the battery energy storage systems is the bidirectional DC-DC converter cascaded with the DC-AC three-phase inverter as shown in Figure 52.

Standalone hybrid generation system for the remote area of Thar, Pakistan
41
There are different modes of operation for the BESS connected to the utility. The BESS can either send power to the utility by discharging or it can receive power to charge itself (Chiang et al. 1998). The operation mode control block, as shown in Figure 52, decides the charging/discharging operation for the BESS. The control design for power electronic systems is different for charging and discharging modes. Based on the mode in which the battery is operating, the control signals from charging or discharging blocks are connected to the power electronics system by the selector switches Sw1 and Sw2. The operation mode control block is designed based on a simple charge-discharge schedule of the BESS. The BESS can send the power to the utility during the peak-load period (i.e., from 6 p.m. to 10 p.m.) only if the voltage of BESS is greater than the nominal value (Vb,nom). During the discharge mode—based on the present voltage (Vb) and the state-of-charge (SOC) of the BESS—the Pref signal determines the amount and rate of discharge to be generated. The BESS can be charged any other time, provided the SOC of the battery is smaller than the maximum storage capacity (SOC max). The switch control signal is generated based on a lookup table. According to the design, the signal “0” means no charge/discharge, “1” means discharging, and “2” indicates charging. This signal simultaneously controls switches Sw1 and Sw2. Based on signal status, the power electronics converters are either connected to the charging block or the discharging block. Other charge-discharge schedules can also be programmed in the operation mode control depending on the application. When the mode of operation for the BESS is charging, the power flows to the battery system through power electronic converters. The DC-DC converter determines the voltage at the battery terminals (Vb) based on which the battery is charged. The battery voltage regulator generates the PWM pattern based on the reference battery voltage (Vb*) (coming from operation mode control) such that the (Vb) follows this reference voltage. For the proper control, the DC-DC converter requires a constant DC input. The DC-AC converter works as the controlled rectifier and the controller maintains the DC bus voltage (Vdc) at a preset value. This control design is a variation of the constant power control (Ye et al. 2006). Instead of using the active power reference, a DC bus voltage is regulated while the input to the inverter acts as a constant power source to represent the prime mover. In this case, the output of the DC bus regulator is proportional to the active power.
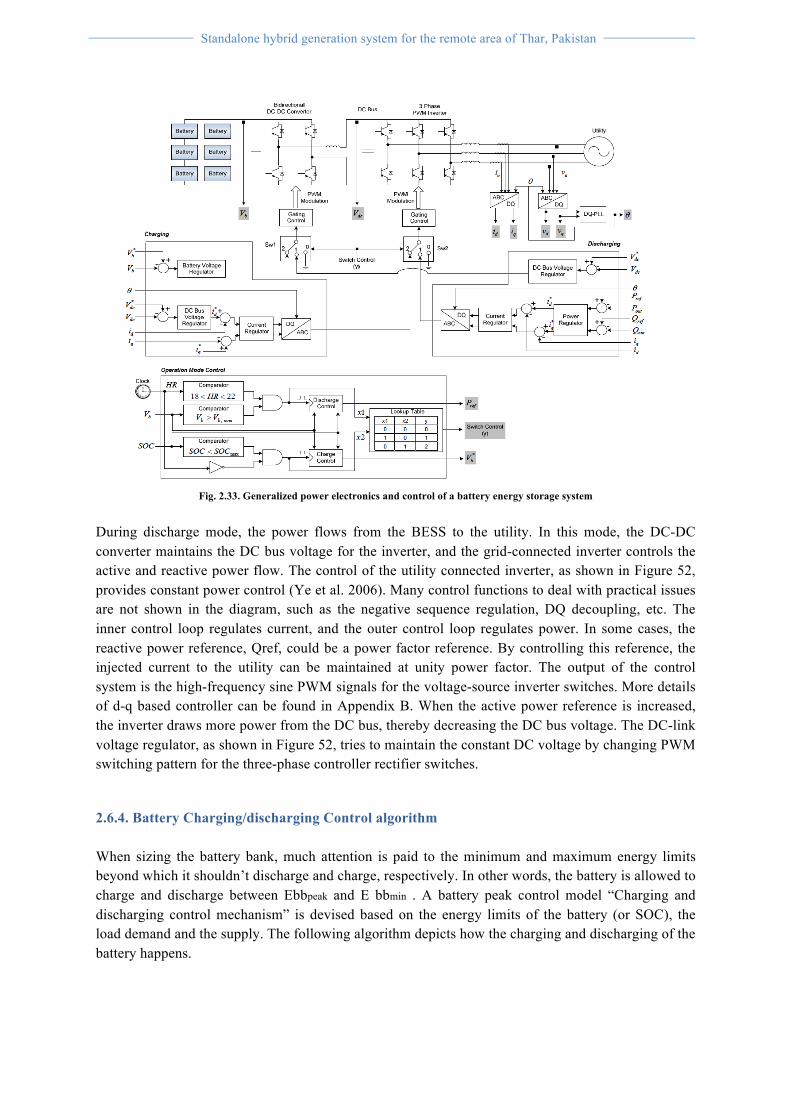
Standalone hybrid generation system for the remote area of Thar, Pakistan
42
Fig. 2.33. Generalized power electronics and control of a battery energy storage system
During discharge mode, the power flows from the BESS to the utility. In this mode, the DC-DC converter maintains the DC bus voltage for the inverter, and the grid-connected inverter controls the active and reactive power flow. The control of the utility connected inverter, as shown in Figure 52, provides constant power control (Ye et al. 2006). Many control functions to deal with practical issues are not shown in the diagram, such as the negative sequence regulation, DQ decoupling, etc. The inner control loop regulates current, and the outer control loop regulates power. In some cases, the reactive power reference, Qref, could be a power factor reference. By controlling this reference, the injected current to the utility can be maintained at unity power factor. The output of the control system is the high-frequency sine PWM signals for the voltage-source inverter switches. More details of d-q based controller can be found in Appendix B. When the active power reference is increased, the inverter draws more power from the DC bus, thereby decreasing the DC bus voltage. The DC-link voltage regulator, as shown in Figure 52, tries to maintain the constant DC voltage by changing PWM switching pattern for the three-phase controller rectifier switches.
2.6.4. Battery Charging/discharging Control algorithm When sizing the battery bank, much attention is paid to the minimum and maximum energy limits beyond which it shouldn’t discharge and charge, respectively. In other words, the battery is allowed to charge and discharge between Ebbpeak and E bbmin . A battery peak control model “Charging and discharging control mechanism” is devised based on the energy limits of the battery (or SOC), the load demand and the supply. The following algorithm depicts how the charging and discharging of the battery happens.
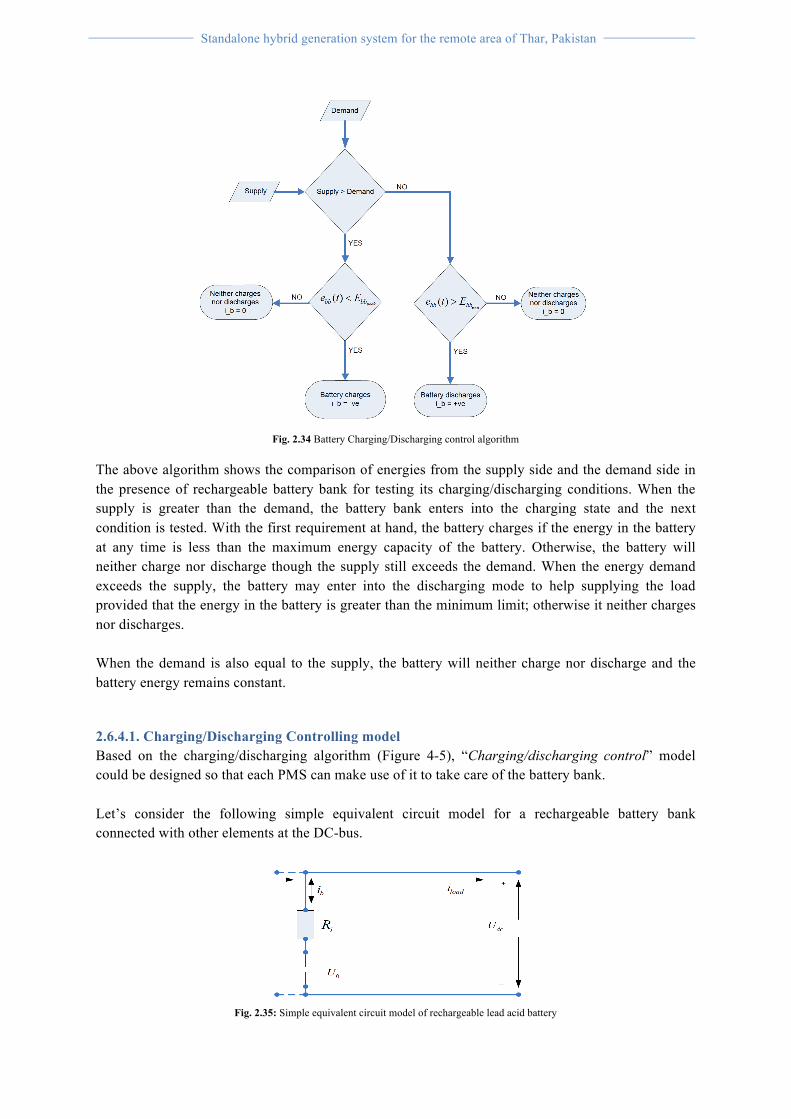
Standalone hybrid generation system for the remote area of Thar, Pakistan
43
Fig. 2.34 Battery Charging/Discharging control algorithm
The above algorithm shows the comparison of energies from the supply side and the demand side in the presence of rechargeable battery bank for testing its charging/discharging conditions. When the supply is greater than the demand, the battery bank enters into the charging state and the next condition is tested. With the first requirement at hand, the battery charges if the energy in the battery at any time is less than the maximum energy capacity of the battery. Otherwise, the battery will neither charge nor discharge though the supply still exceeds the demand. When the energy demand exceeds the supply, the battery may enter into the discharging mode to help supplying the load provided that the energy in the battery is greater than the minimum limit; otherwise it neither charges nor discharges. When the demand is also equal to the supply, the battery will neither charge nor discharge and the battery energy remains constant.
2.6.4.1. Charging/Discharging Controlling model Based on the charging/discharging algorithm (Figure 4-5), “Charging/discharging control” model could be designed so that each PMS can make use of it to take care of the battery bank. Let’s consider the following simple equivalent circuit model for a rechargeable battery bank connected with other elements at the DC-bus.
Fig. 2.35: Simple equivalent circuit model of rechargeable lead acid battery

Standalone hybrid generation system for the remote area of Thar, Pakistan
44
Applying a simple KVL, the voltage at the battery terminal can be expressed as:
45 The power that is drawn from the battery is also given as:
46 The energy, which is left in the battery after the load has drawn power from the battery, can also be expressed as:
47 Where: -
The charging/discharging of the battery can be indicated by the presence of current flow. If the battery is neither charging nor discharging, there will be no current flow and thus no power is available in the battery. In this thesis, the sign of battery current or power identifies the charging or discharging modes. According to the convention used in this thesis, a positive current or power shows the discharging mode and a negative current or power indicates the charging of the battery. When modeling for the simple electrical circuit that represents the rechargeable battery bank, three important points have to be considered. These are: - Battery state is neither minimum nor full
When the battery is neither at its lowest state nor at its full state it can either charge or discharge depending on the load demand and other energy source conditions. Whenever there is more supply from other sources than the demand, it charges and when the demand exceeds the supply, it discharges. Battery has been fully charged and load draws power from it This is the case when the battery is fully charged and it is discharging when the load draws power from it. Depending on the energy sources and the load demand, the conditions that have to meet, in these cases, are:
48 The battery current and power will have positive signs according to the convention used in this paper.

Standalone hybrid generation system for the remote area of Thar, Pakistan
45
Battery has been discharged to its minimum energy and it is charging When the battery has been discharged to its minimum state, and there is more supply than there is demand, the battery charges. The condition, which must be fulfilled during this situation, is:
49 The current flow and the power have negative sign according to the convention used in this paper.
2.7. Design Topologies literature Review. A well-defined framework of a hybrid system is vital, as various energy sources may have different operating characteristics. In an optimal framework, the renewable energy sources, energy storage, and loads are integrated and capable of operating autonomously as a unit. A robust system should also have a “plug-and-play” capability, which renders the system capable of integrating any number of devices without system re-configuration [28], [29]. In this thesis, a hybrid system of solar-wind-Genset with battery bank is considered. Here, we have different power generating units. Some of them generate AC and others DC power directly. These generation systems have to be connected at some point and somewhere before the loads are supplied. In this chapter, an intensive literature study is conducted to know the different connecting topologies and best system layout is chosen. There are various ways to integrate different energy sources and storage to form a hybrid power system. Among them, dc-coupled, ac-coupled and hybrid-coupled are the most popular options [70]-[74], which outlined as below:
2.7.1. Technical configurations for hybrid power systems The hybrid system can be designed following different configurations to effectively use the locally available renewable energy sources and to serve all power appliances.
2.7.2. AC/DC-coupled Hybrid Power Systems For the hybrid power system whose demand is to be supplied from wind turbine, PV-system, a diesel generator and a battery, different configurations are explained in [1, 3, 5, 27]. In general, there are three accepted categories hybrid system technological configurations according to the voltage they are coupled with each other and the load. These are:
• AC-coupled hybrid power systems • DC-coupled hybrid power systems • Mixed-coupled hybrid power systems

Standalone hybrid generation system for the remote area of Thar, Pakistan
46
2.7.3. AC-coupled Hybrid Power Systems With this type of configuration, the different HPSs are connected at the AC-bus with the load. The AC coupled HPSs are further divided into two sub-topologies. i. Centralized AC-coupled HPSs ii. Distributed AC-coupled HPSs These two sub-topologies are explained below in detailed with schematic block diagrams that help help to give us the insight of the overall system.
2.7.4. Centralized AC-coupled Hybrid Power Systems. An AC-coupled HPS is centralized when all the energy conversion systems constituting it are connected to a main AC-bus before being connected to the load. This configuration can be depicted by the following figure, Figure 2.36.
Fig. 2.36: Centralized AC-coupled HPSs.
The wind turbine and diesel generator produce AC powers, thus they can be directly coupled onto the main AC-bus or with AC/AC converters. The PV-array produces DC power and an inverter must be used before it is coupled onto the main AC-bus. The charging or discharging of the battery bank with a DC current seeks for a bidirectional inverter must be used (Figure 3-1).
2.7.4. Distributed AC-coupled Hybrid Power Systems. AC-coupled HPSs is said to be distributed or decentralized when the different ECSs constituting it are not connected to a main AC-bus; otherwise, some or all of them are individually connected to the load. The following figure, Figure 2-37, depicts the configuration.

Standalone hybrid generation system for the remote area of Thar, Pakistan
47
Fig.2.37: Decentralized AC-coupled HPSs [3, 28, 29].
In this topology, the power sources do not need to be connected to one common bus as in the previous cases. These sources may not also be installed close to each other i.e. the sources are distributed in different geographical locations and each source is connected to the load separately. The DC powers obtained from the PV-system and the battery need to be converted to AC before feeding the AC load, thus appropriate inverters are required. This type of topology is advantageous in a sense that the different sources are appropriately located and installed geographically in such a way that the PV-systems are installed in places where there is more solar irradiation and the wind turbines in locations where there is more wind. However, there is also disadvantage with this topology in that controlling of the system is difficult [27]. Comparing the centralized and decentralized ones, centralized HPSs have advantages over decentralized HPSs in that they are robust as they can be controlled more easily.
2.7.5. DC-coupled Hybrid Power Systems In a dc-coupled system, all renewable energy sources are connected to a dc bus either directly or through appropriate power electronic converters. A block diagram of the system is shown in Fig. 1.1. This system can be connected to the dc loads through appropriate dc-dc converter, ac loads through a dc-ac converter or utility grid through a bi-directional dc-ac converter. The system is flexible and can be connected to an ac load of 50/60 Hz system frequency. The dc-coupling scheme is very simple and is not required to be synchronous with the ac system. However, a dc-coupled system suffers from various weaknesses. For example, if the system converter connecting the utility grid with the bus is out of service, the whole system will not be able to supply ac power. To rectify this, several inverters can be connected in parallel. As such, synchronization of output ac voltage and proper power sharing are required to achieve a desired load distribution [31].
Fig. 2.38 DC coupled HPS

Standalone hybrid generation system for the remote area of Thar, Pakistan
48
2.7.6. Mixed-coupled Hybrid Power Systems In hybrid-coupled system as shown in Fig. 1.3, various DG sources are connected to the dc or ac buses of the hybrid system. In this application, some energy sources can be implemented directly without the use of a power electronic interfacing system. As a result, the system can operate with higher efficiency and reduced cost. However, control and energy management can be more complicated than with dc-coupled and ac-coupled systems..
Fig. 2.39: AC-coupled sources connected with DC-coupled sources or mixed HPSs.
A comparison of mixed, AC- and DC-coupled systems show that AC-coupled systems have numerous advantages [29] such as standardized coupling of different components, off-the-shelf grid components can be used, simplified design and operation of island grids, compatibility with existing grids, reduction of system costs, increased reliability of electrical power supply as well as expandability. DC integration in many cases involves high costs for engineering, hardware, repair and maintenance; and more importantly power system expandability for covering needs of growing energy and power demand is also difficult with DC integration [28]. Different coupling schemes have their own appropriate applications. If the major generation sources generate dc power and there is a substantial dc load in the system, a dc-coupling system is preferable. On the other hand, if the main power systems are ac with substantial ac loads, an ac-coupled system is preferred. If the major power generation system is a combination of ac and dc power, then hybrid-coupled system is the best.
2.7.7. Series-Parallel Hybrid Power System Based on how the load is supplied from the RESs and the Genset, a hybrid power system whose power is to be supplied from wind turbine, PV-system, a diesel generator and a battery bank, two broad classes of configurations are explained in [5, 28]. These are
• Series hybrid systems • Parallel hybrid systems
Series hybrid power systems In the series HPSs scheme, all the DC power is fed into the battery. Thus, the power generated by diesel generator, wind generator and solar PV-array are used to charge a battery bank before supplied
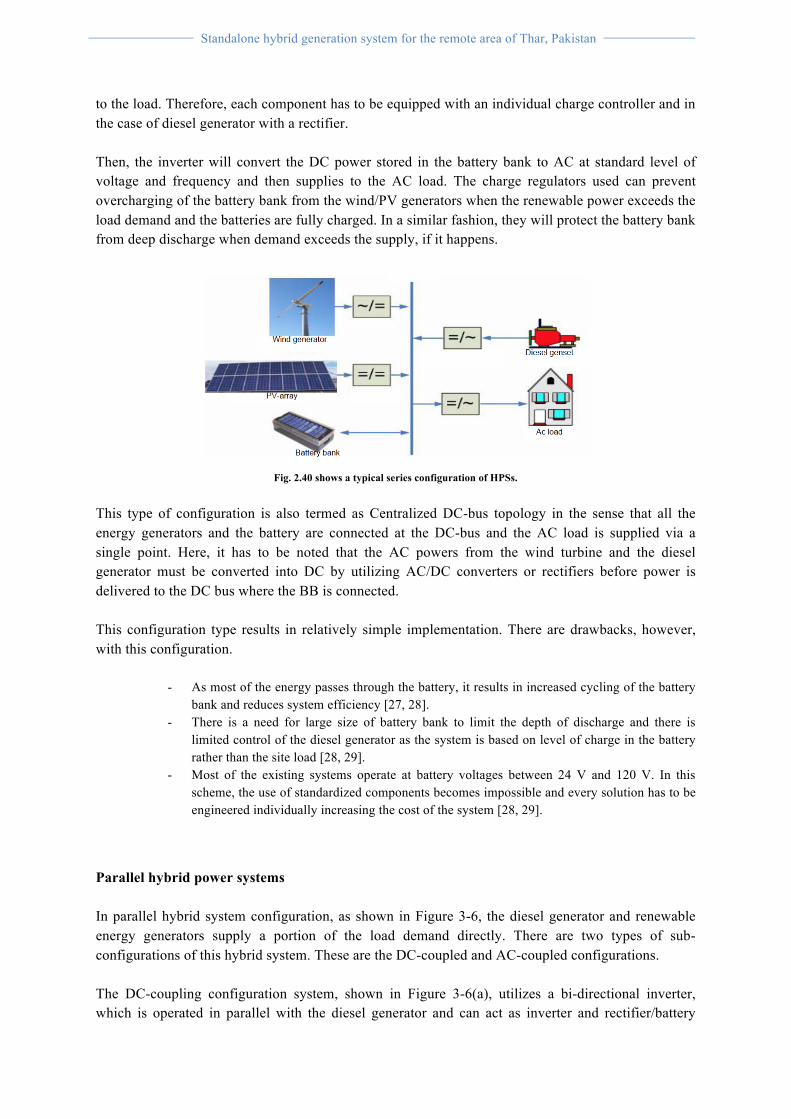
Standalone hybrid generation system for the remote area of Thar, Pakistan
49
to the load. Therefore, each component has to be equipped with an individual charge controller and in the case of diesel generator with a rectifier. Then, the inverter will convert the DC power stored in the battery bank to AC at standard level of voltage and frequency and then supplies to the AC load. The charge regulators used can prevent overcharging of the battery bank from the wind/PV generators when the renewable power exceeds the load demand and the batteries are fully charged. In a similar fashion, they will protect the battery bank from deep discharge when demand exceeds the supply, if it happens.
Fig. 2.40 shows a typical series configuration of HPSs.
This type of configuration is also termed as Centralized DC-bus topology in the sense that all the energy generators and the battery are connected at the DC-bus and the AC load is supplied via a single point. Here, it has to be noted that the AC powers from the wind turbine and the diesel generator must be converted into DC by utilizing AC/DC converters or rectifiers before power is delivered to the DC bus where the BB is connected. This configuration type results in relatively simple implementation. There are drawbacks, however, with this configuration.
- As most of the energy passes through the battery, it results in increased cycling of the battery bank and reduces system efficiency [27, 28].
- There is a need for large size of battery bank to limit the depth of discharge and there is limited control of the diesel generator as the system is based on level of charge in the battery rather than the site load [28, 29].
- Most of the existing systems operate at battery voltages between 24 V and 120 V. In this scheme, the use of standardized components becomes impossible and every solution has to be engineered individually increasing the cost of the system [28, 29].
Parallel hybrid power systems In parallel hybrid system configuration, as shown in Figure 3-6, the diesel generator and renewable energy generators supply a portion of the load demand directly. There are two types of sub-configurations of this hybrid system. These are the DC-coupled and AC-coupled configurations. The DC-coupling configuration system, shown in Figure 3-6(a), utilizes a bi-directional inverter, which is operated in parallel with the diesel generator and can act as inverter and rectifier/battery

Standalone hybrid generation system for the remote area of Thar, Pakistan
50
charger. It is a DC-coupled configuration hybrid system in a sense that the renewable energy sources are connected together at the DC bus to the battery and supply the AC load via the bi-directional inverter. Here, the AC power from the wind turbine must be converted into DC by utilizing AC/DC converters or rectifiers before power is delivered to the DC-bus.
Fig. 2.41: (a) DC coupled configuration; (b) AC coupled configuration
The parallel hybrid power system with DC-coupling configuration can further be improved by connecting all of the renewable generators to the AC-bus to perform an AC-coupling configuration as shown in Figure 2.41(b). The load can be supplied from the renewable energy supplies in parallel with the diesel Genset. A bidirectional inverter is utilized here such that the battery can either supply the load or be charged depending upon the load requirement and the status of other energy sources. Over and above, the DC power obtained from the PV-array system and battery must be converted to AC before it is fed into the AC-bus. This type of configuration is also referred to as centralized AC-bus topology in a sense that all the energy generators are connected at the AC-bus and the load is supplied at a single point [29].
2.8. Matlab/Simulink User Manual MATLAB is a high-performance language for technical computing. It integrates computation, visualization, and programming in an easy-to-use environment where problems and solutions are expressed in familiar mathematical notation. Typical uses include:
• Math and computation • Algorithm development • Modeling, simulation, and prototyping • Data analysis, exploration, and visualization • Scientific and engineering graphics • Application development, including Graphical User Interface building
MATLAB is an interactive system whose basic data element is an array that does not require dimensioning. This allows you to solve many technical computing problems, especially those with matrix and vector formulations, in a fraction of the time it would take to write a program in a scalar noninteractive language such as C or Fortran.

Standalone hybrid generation system for the remote area of Thar, Pakistan
51
The name MATLAB stands for matrix laboratory. MATLAB was originally written to provide easy access to matrix software developed by the LINPACK and EISPACK projects, which together represent the state-of-the-art in software for matrix computation. MATLAB has evolved over a period of years with input from many users. In university environments, it is the standard instructional tool for introductory and advanced courses in mathematics, engineering, and science. In industry, MATLAB is the tool of choice for high-productivity research, development, and analysis. MATLAB features a family of application-specific solutions called toolboxes. Very important to most users of MATLAB, toolboxes allow you to learn and apply specialized technology. Toolboxes are comprehensive collections of MATLAB functions (M-files) that extend the MATLAB environment to solve particular classes of problems. Areas in which toolboxes are available include signal processing, control systems, neural networks, fuzzy logic, wavelets, simulation, and many others.
2.8.1. Simulink® Simulink® is a block diagram environment for multi-domain simulation and Model-Based Design. It supports simulation, automatic code generation, and continuous test and verification of embedded systems. Simulink provides a graphical editor, customizable block libraries, and solvers for modeling and simulating dynamic systems. It is integrated with MATLAB®, enabling you to incorporate MATLAB algorithms into models and export simulation results to MATLAB for further analysis Simulink® is a graphical software package for modeling, simulating, and analyzing dynamic systems and it is based on Matlab®. It supports linear and nonlinear systems, modeled in continuous time, sampled time, or a hybrid of the two. Systems can also be multi-rate, i.e., have different parts that are sampled or updated at different rates. For modeling, Simulink provides a graphical user interface (GUI) for building models as block diagrams, using click-and-drag mouse operations. With this interface, the desired dynamic systems can be easily built. Simulink includes a comprehensive block library of sinks, sources, linear and nonlinear components, and connectors.
2.8.2. Starting up Simulink In order to use Simulink, you must first start MATLAB. With MATLAB running, there are two ways to start Simulink:
• • Click the Simulink icon on the MATLAB toolbar • • Type ‘simulink’ at the MATLAB prompt followed by a carriage return (press the Enter
key)

Standalone hybrid generation system for the remote area of Thar, Pakistan
52
• In response, MATLAB displays the Simulink Library Browser.
• Next, select New Model from the File pull-down menu in the Library Browser. The following blank window appears on your screen. We will refer to this window as the model window.
In this model window, models are drawn and edited mainly by mouse driven commands.

Standalone hybrid generation system for the remote area of Thar, Pakistan
53
Basic Elements There are two major categories of elements in Simulink:
• Blocks • Lines
Blocks Blocks are used to generate, modify, combine, output, and display signals. Lines, on the other hand, are used to transfer signals from one block to another. There are several general classes of blocks, some of which are:
• Sources: Used to generate various signals. Sources blocks have outputs but no inputs. One may want to use a Constant input, a Sine Wave, a Step, a Ramp, a Pulse Generator, or a Uniform Random number to simulate noise. The Clock may be used to create a time index for plotting purposes.
• Sinks: Used to output or display signals. Sinks blocks have inputs but no outputs. Examples are Scope, Display, To Workspace, Floating Scope, X-Y Graph, etc.
• Discrete: Discrete Filter, Discrete State-Space, Discrete Transfer Fcn, Discrete Zero-Pole, Unit Delay, etc.
• Continuous: Integrator, State-Space, Transfer Fcn, Zero-Pole, etc. • Signal routing: Mux, Demux, Switch, etc. • Math Operations: Abs, Gain, Product, Slider Gain, Sign, Sum, etc.
Lines Lines transmit signals in the direction indicated by the arrow. Lines must always transmit signals from the output terminal of one block to the input terminal of another block. One exception to this is that a line can tap off of another line. This sends the original signal to two (or more) destination blocks. Lines can never inject a signal into another line; lines must be combined through the use of block such as a summing junction. A signal can be either a scalar signal or a vector signal.
2.8.3. SimPowerSystems As a part of the Physical Modeling family, SimPowerSystems and SimMechanics work together with Simulink to model electrical, mechanical, and control systems.
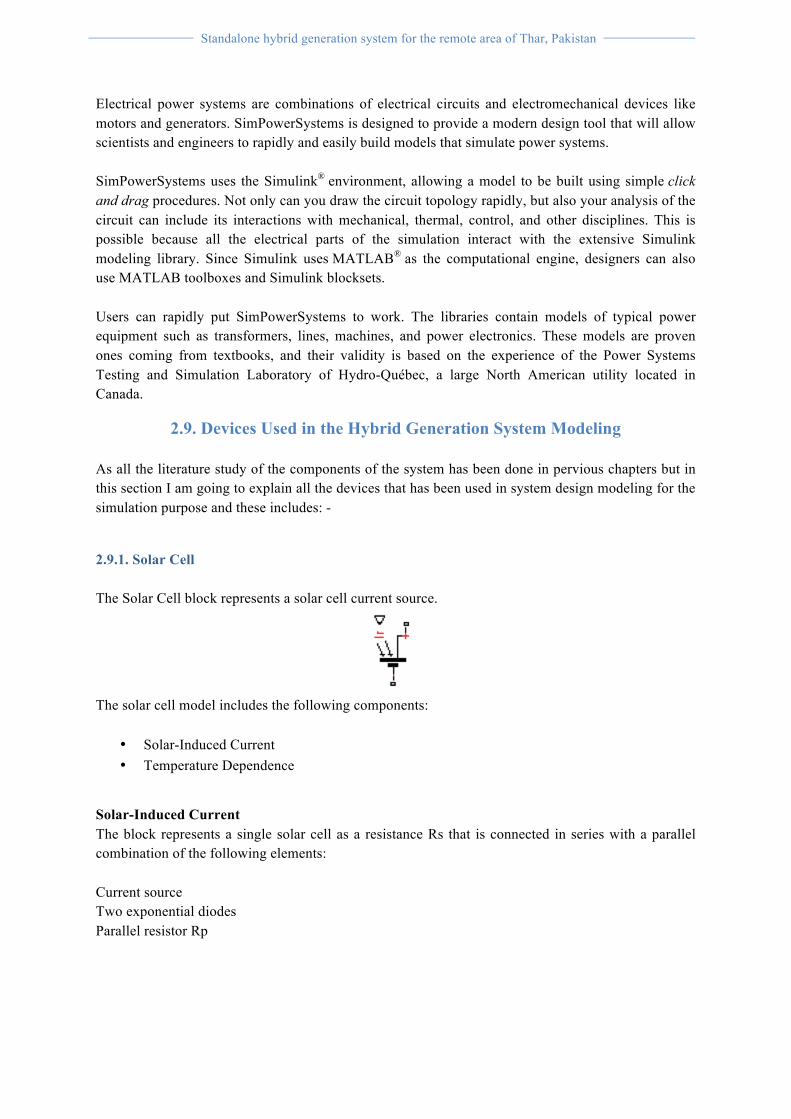
Standalone hybrid generation system for the remote area of Thar, Pakistan
54
Electrical power systems are combinations of electrical circuits and electromechanical devices like motors and generators. SimPowerSystems is designed to provide a modern design tool that will allow scientists and engineers to rapidly and easily build models that simulate power systems. SimPowerSystems uses the Simulink® environment, allowing a model to be built using simple click and drag procedures. Not only can you draw the circuit topology rapidly, but also your analysis of the circuit can include its interactions with mechanical, thermal, control, and other disciplines. This is possible because all the electrical parts of the simulation interact with the extensive Simulink modeling library. Since Simulink uses MATLAB® as the computational engine, designers can also use MATLAB toolboxes and Simulink blocksets. Users can rapidly put SimPowerSystems to work. The libraries contain models of typical power equipment such as transformers, lines, machines, and power electronics. These models are proven ones coming from textbooks, and their validity is based on the experience of the Power Systems Testing and Simulation Laboratory of Hydro-Québec, a large North American utility located in Canada.
2.9. Devices Used in the Hybrid Generation System Modeling As all the literature study of the components of the system has been done in pervious chapters but in this section I am going to explain all the devices that has been used in system design modeling for the simulation purpose and these includes: -
2.9.1. Solar Cell The Solar Cell block represents a solar cell current source.
The solar cell model includes the following components:
• Solar-Induced Current • Temperature Dependence
Solar-Induced Current The block represents a single solar cell as a resistance Rs that is connected in series with a parallel combination of the following elements: Current source Two exponential diodes Parallel resistor Rp

Standalone hybrid generation system for the remote area of Thar, Pakistan
55
Fig. 2.42 Block representation of the solar cell
The output current I is
5.1 Where: -
• Ir is the irradiance (light intensity) in W/m2 falling on the cell. • Iph0 is the measured solar-generated current for the irradiance Ir0. • Is is the saturation current of the first diode. • Is2 is the saturation current of the second diode. • Vt is the thermal voltage, kT/q, where:
k is the Boltzmann constant. T is the device operating temperature parameter value. q is the elementary charge on an electron.
• N is the quality factor (diode emission coefficient) of the first diode. • N2 is the quality factor (diode emission coefficient) of the second diode. • V is the voltage across the solar cell electrical ports.
The quality factor varies for amorphous cells, and is typically 2 for polycrystalline cells. The block lets you choose between two models: An 8-parameter model where the preceding equation describes the output current and a 5-parameter model that applies the following simplifying assumptions to the preceding equation:
• The saturation current of the second diode is zero. • The impedance of the parallel resistor is infinite.
If you choose the 5-parameter model, you can parameterize this block in terms of the preceding equivalent circuit model parameters or in terms of the short-circuit current and open-circuit voltage the block uses to derive these parameters. All models adjust the block resistance and current parameters as a function of temperature.
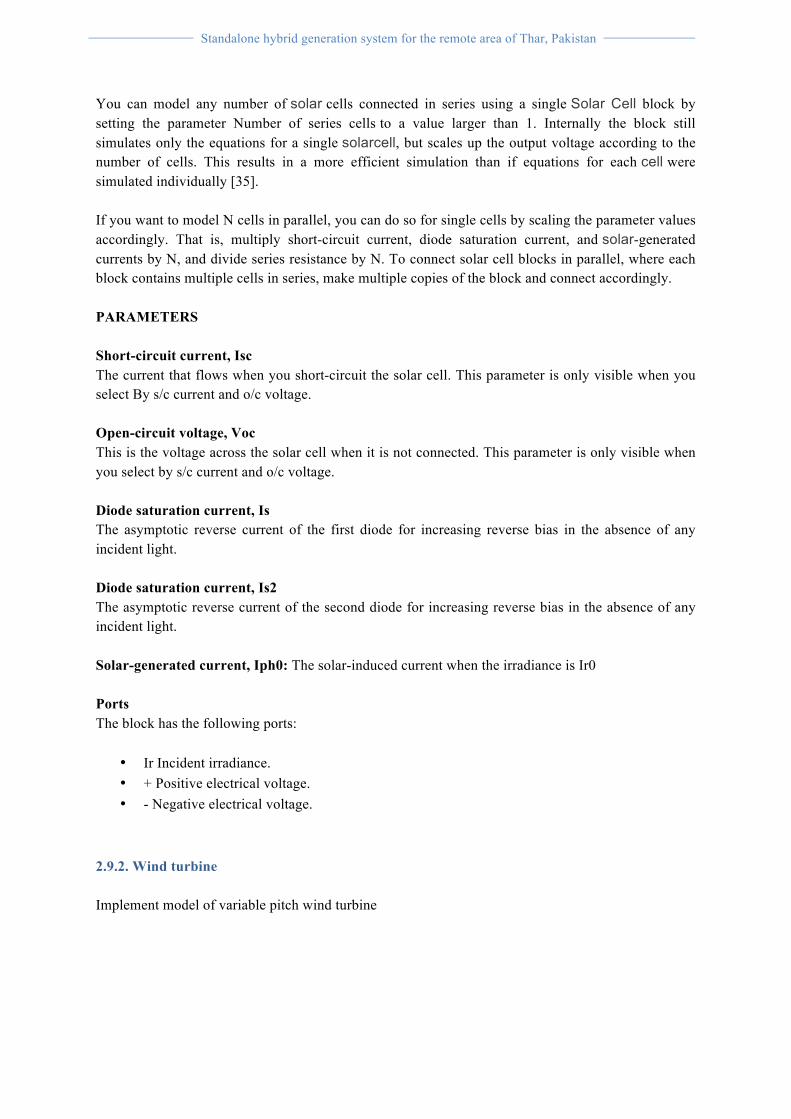
Standalone hybrid generation system for the remote area of Thar, Pakistan
56
You can model any number of solar cells connected in series using a single Solar Cell block by setting the parameter Number of series cells to a value larger than 1. Internally the block still simulates only the equations for a single solarcell, but scales up the output voltage according to the number of cells. This results in a more efficient simulation than if equations for each cell were simulated individually [35]. If you want to model N cells in parallel, you can do so for single cells by scaling the parameter values accordingly. That is, multiply short-circuit current, diode saturation current, and solar-generated currents by N, and divide series resistance by N. To connect solar cell blocks in parallel, where each block contains multiple cells in series, make multiple copies of the block and connect accordingly. PARAMETERS Short-circuit current, Isc The current that flows when you short-circuit the solar cell. This parameter is only visible when you select By s/c current and o/c voltage. Open-circuit voltage, Voc This is the voltage across the solar cell when it is not connected. This parameter is only visible when you select by s/c current and o/c voltage. Diode saturation current, Is The asymptotic reverse current of the first diode for increasing reverse bias in the absence of any incident light. Diode saturation current, Is2 The asymptotic reverse current of the second diode for increasing reverse bias in the absence of any incident light. Solar-generated current, Iph0: The solar-induced current when the irradiance is Ir0 Ports The block has the following ports:
• Ir Incident irradiance. • + Positive electrical voltage. • - Negative electrical voltage.
2.9.2. Wind turbine Implement model of variable pitch wind turbine

Standalone hybrid generation system for the remote area of Thar, Pakistan
57
The model is based on the steady-state power characteristics of the turbine. The stiffness of the drive train is infinite and the friction factor and the inertia of the turbine must be combined with those of the generator coupled to the turbine. The output power of the turbine is given by the following equation.
49 Where: -
• Pm: Mechanical output power of the turbine (W) • Cp: Performance coefficient of the turbine • Ρ: Air density (kg/m3) • A: Turbine swept area (m2)
• Vwind: Wind speed (m/s) • Λ: Tip speed ratio of the rotor blade tip speed to wind speed • β: Blade pitch angle (deg)
Above Equation can be normalized. In the per unit (pu) system we have:
50 Where: - Pm_pu: Power in pu of nominal power for particular values of ρ and A cp_pu: Performance coefficient in pu of the maximum value of cp vwind_pu: Wind speed in pu of the base wind speed. The base wind speed is the mean value of the expected wind speed in m/s. kp: Power gain for cp_pu=1 pu and vwind_pu=1 pu, kp is less than or equal to 1. A generic equation is used to model cp(λ,β). This equation, based on the modeling turbine characteristics of [1], is:

Standalone hybrid generation system for the remote area of Thar, Pakistan
58
51 With
52 The coefficients c1 to c6 are: c1 = 0.5176, c2 = 116, c3 = 0.4, c4 = 5, c5 = 21 and c6 = 0.0068. The cp-λ characteristics, for different values of the pitch angle β, are illustrated below. The maximum value of cp (cpmax = 0.48) is achieved for β = 0 degree and for λ = 8.1. This particular value of λ is defined as the nominal value (λ_nom).
Fig. 2.43 cp-λ characteristics of the wind turbine
The Simulink model of the turbine is illustrated in the figure below. The three inputs are the generator speed (ωr_pu) in pu of the nominal speed of the generator, the pitch angle in degrees and the wind speed in m/s. The tip speed ratio λ in pu of λ_nom is obtained by the division of the rational speed in pu of the base rotational speed (defined below) and the wind speed in pu of the base wind speed. The output is the torque applied to the generator shaft.
Fig. 2.44 Simulink model of the turbine
PARAMETERS Base power of the electrical generator
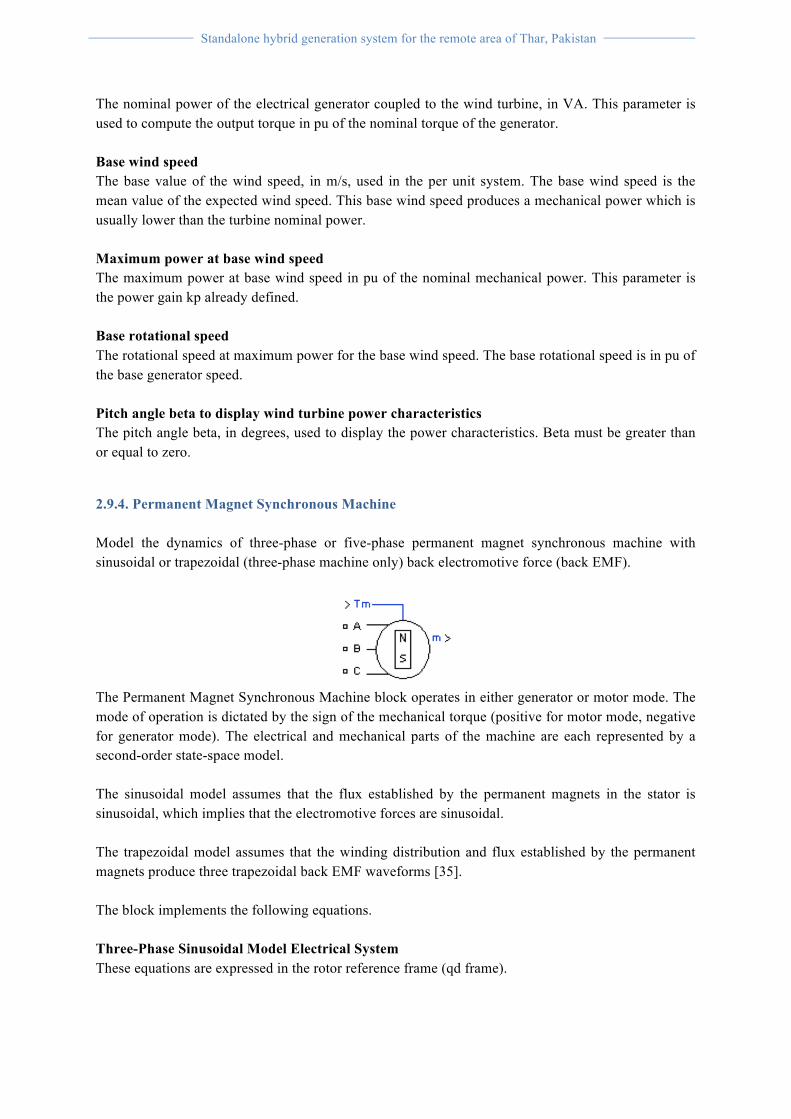
Standalone hybrid generation system for the remote area of Thar, Pakistan
59
The nominal power of the electrical generator coupled to the wind turbine, in VA. This parameter is used to compute the output torque in pu of the nominal torque of the generator. Base wind speed The base value of the wind speed, in m/s, used in the per unit system. The base wind speed is the mean value of the expected wind speed. This base wind speed produces a mechanical power which is usually lower than the turbine nominal power. Maximum power at base wind speed The maximum power at base wind speed in pu of the nominal mechanical power. This parameter is the power gain kp already defined. Base rotational speed The rotational speed at maximum power for the base wind speed. The base rotational speed is in pu of the base generator speed. Pitch angle beta to display wind turbine power characteristics The pitch angle beta, in degrees, used to display the power characteristics. Beta must be greater than or equal to zero.
2.9.4. Permanent Magnet Synchronous Machine Model the dynamics of three-phase or five-phase permanent magnet synchronous machine with sinusoidal or trapezoidal (three-phase machine only) back electromotive force (back EMF).
The Permanent Magnet Synchronous Machine block operates in either generator or motor mode. The mode of operation is dictated by the sign of the mechanical torque (positive for motor mode, negative for generator mode). The electrical and mechanical parts of the machine are each represented by a second-order state-space model. The sinusoidal model assumes that the flux established by the permanent magnets in the stator is sinusoidal, which implies that the electromotive forces are sinusoidal. The trapezoidal model assumes that the winding distribution and flux established by the permanent magnets produce three trapezoidal back EMF waveforms [35]. The block implements the following equations. Three-Phase Sinusoidal Model Electrical System These equations are expressed in the rotor reference frame (qd frame).

Standalone hybrid generation system for the remote area of Thar, Pakistan
60
53 Where (all quantities in the rotor reference frame are referred to the stator) Lq, Ld q and d axis inductances R: Resistance of the stator windings iq, id: q and d axis currents vq, vd: q and d axis voltages ωr: Angular velocity of the rotor λ: Amplitude of the flux induced by the permanent magnets of the rotor in the stator phases p: Number of pole pairs Te: Electromagnetic torque The Lq and Ld inductances represent the relation between the phase inductance and the rotor position due to the saliency of the rotor. For example, the inductance measured between phase a and b (phase c is left open) is given by:
54 Where Θe represents the electrical angle [35]. PARAMETERS Number of phases Allows to select between a three-phase machine model or a five-phase machine model. The five-phase machine model considers only a sinusoidal winding distribution with a round rotor type. Back EMF waveform Allow you to select between the Sinusoidal and the Trapezoidal electromotive force.

Standalone hybrid generation system for the remote area of Thar, Pakistan
61
Rotor type Allow you to select between the Salient-pole and the Round (cylindrical) rotor. This parameter is only visible when the Number of phases parameter is set to 3 and the Back EMF waveform parameter is set to Sinusoidal. Mechanical input Allows you to select either the torque applied to the shaft or the rotor speed as the Simulink signal applied to the block's input. Select Torque Tm to specify a torque input, in N.m., and change labeling of the block's input to Tm. The machine speed is determined by the machine Inertia J and by the difference between the applied mechanical torque Tm and the internal electromagnetic torque Te. The sign convention for the mechanical torque is the following: when the speed is positive, a positive torque signal indicates motor mode and a negative signal indicates generator mode. Select Speed w to specify a speed input, in rad/s, and change labeling of the block's input to w. The machine speed is imposed and the mechanical part of the model (Inertia J) is ignored. Using the speed as the mechanical input allows modeling a mechanical coupling between two machines and interfacing with SimMechanics and SimDriveline models. The next figure indicates how to model a stiff shaft interconnection in a motor-generator set when friction torque is ignored in machine 2. The speed output of machine 1 (motor) is connected to the speed input of machine 2 (generator), while machine 2 electromagnetic torque output Te is applied to the mechanical torque input Tm of machine 1. The Kw factor takes into account speed units of both machines (pu or rad/s) and gearbox ratio w2/w1. The KT factor takes into account torque units of both machines (pu or N.m) and machine ratings. Also, as the inertia J2 is ignored in machine 2, J2 referred to machine 1 speed must be added to machine 1 inertia J1 [35].
2.9.5. MOSFET
The metal-oxide semiconductor field-effect transistor (MOSFET) is a semiconductor device controllable by the gate signal (g > 0). The MOSFET device is connected in parallel with an internal diode that turns on when the MOSFET device is reverse biased (Vds < 0) and no gate signal is applied (g=0). The model is simulated by an ideal switch controlled by a logical signal (g > 0 or g = 0), with a diode connected in parallel [35].

Standalone hybrid generation system for the remote area of Thar, Pakistan
62
The MOSFET device turns on when a positive signal is applied at the gate input (g > 0) whether the drain-source voltage is positive or negative. If no signal is applied at the gate input (g=0), only the internal diode conducts when voltage exceeds its forward voltage Vf. With a positive or negative current flowing through the device, the MOSFET turns off when the gate input becomes 0. If the current I is negative and flowing in the internal diode (no gate signal or g = 0), the switch turns off when the current I becomes 0. The on state voltage Vds varies:
• Vds = Ron*I when a positive signal is applied at the gate input. • Vds = Rd*I-Vf +Lon*dI/dt when the antiparallel diode is conducting (no gate signal).
The Lon diode inductance is available only with the continuous model. For most applications, Lon should be set to zero for both continuous and discrete models. The MOSFET block also contains a series Rs-Cs snubber circuit that can be connected in parallel with the MOSFET (between nodes d and s) [35]. Dialog Box and Parameters
Standalone hybrid generation system for the remote area of Thar, Pakistan
63
FET Resistance Ron The internal resistance Ron, in ohms (Ω). The Resistance Ron parameter cannot be set to 0 when the Inductance Lon parameter is set to 0. Internal diode inductance Lon The internal inductance Lon, in henries (H). The Inductance Lon parameter is normally set to 0 except when the Resistance Ron parameter is set to 0. Internal diode resistance Rd The internal resistance of the internal diode, in ohms (Ω). Internal diode forward voltage Vf The forward voltage of the internal diode, in volts (V). Initial current Ic You can specify an initial current flowing in the MOSFET device. It is usually set to 0 in order to start the simulation with the device blocked. If the Initial current IC parameter is set to a value greater than 0, the steady-state calculation considers the initial status of the MOSFET as closed. Initializing all states of a power electronic converter is a complex task. Therefore, this option is useful only with simple circuits. Snubber resistance Rs The snubber resistance, in ohms (Ω). Set the Snubber resistance Rs parameter to inf to eliminate the snubber from the model. Snubber capacitance Cs The snubber capacitance, in farads (F). Set the Snubber capacitance Cs parameter to 0 to eliminate the snubber, or to inf to get a resistive snubber [35]. Inputs and Outputs g: Simulink signal to control the opening and closing of the MOSFET. m: The Simulink output of the block is a vector containing 2 signals. You can demultiplex these signals by using the Bus Selector block provided in the Simulink library.
MOSFET converter The model below illustrates the use of the MOSFET block in a zero-current quasi-resonant switch converter. In such a converter, the current produced by the Lr-Cr resonant circuit flows through the MOSFET and internal diode. The negative current flows through the internal diode that turns off at 0 current [35]. The switching frequency is 2 MHz and the pulse width is 72 degrees (duty cycle: 20%).

Standalone hybrid generation system for the remote area of Thar, Pakistan
64
2.9.6. Insulated gate bipolar transistor (IGBT)
The IGBT block implements a semiconductor device controllable by the gate signal. The IGBT is simulated as a series combination of a resistor Ron, inductor Lon, and a DC voltage source Vf in series with a switch controlled by a logical signal (g > 0 or g = 0).

Standalone hybrid generation system for the remote area of Thar, Pakistan
65
The IGBT turns on when the collector-emitter voltage is positive and greater than Vf and a positive signal is applied at the gate input (g > 0). It turns off when the collector-emitter voltage is positive and a 0 signal is applied at the gate input (g = 0). The IGBT device is in the off state when the collector-emitter voltage is negative. Note that many commercial IGBTs do not have the reverse blocking capability. Therefore, they are usually used with an antiparallel diode. The IGBT block contains a series Rs-Cs snubber circuit, which is connected in parallel with the IGBT device (between terminals C and E).
The turnoff characteristic of the IGBT model is approximated by two segments. When the gate signal falls to 0, the collector current decreases from Imax to 0.1 Imax during the fall time (Tf), and then from 0.1 Imax to 0 during the tail time (Tt).
Dialog Box and Parameters

Standalone hybrid generation system for the remote area of Thar, Pakistan
66
Resistance Ron The internal resistance Ron, in ohms (Ω). The Resistance Ron parameter cannot be set to 0 when the Inductance Lon parameter is set to 0. Inductance Lon The internal inductance Lon, in henries (H). The Inductance Lon parameter is normally set to 0 except when the Resistance Ron parameter is set to 0. Forward voltage Vf The forward voltage of the IGBT device, in volts (V). Current 10% fall time The current fall time Tf, in seconds (s). This parameter is not modeled when the Enable use of ideal switching devices parameter of the Powergui block is selected. Current tail time The current tail time Tt, in seconds (s). This parameter is not modeled when the Enable use of ideal switching devices parameter of the Powergui block is selected. Initial current Ic You can specify an initial current flowing in the IGBT. It is usually set to 0 in order to start the simulation with the device blocked. If the Initial Current IC parameter is set to a value greater than 0, the steady-state calculation considers the initial status of the IGBT as closed. Initializing all states of a power electronic converter is a complex task. Therefore, this option is useful only with simple circuits. Snubber resistance Rs The snubber resistance, in ohms (Ω). Set the Snubber resistance Rs parameter to inf to eliminate the snubber from the model. Snubber capacitance Cs The snubber capacitance in farads (F). Set the Snubber capacitance Cs parameter to 0 to eliminate the snubber, or to inf to get a resistive snubber. Show measurement port Inputs and Outputs g: Simulink signal to control the opening and closing of the IGBT. m: The Simulink output of the block is a vector containing two signals. You can demultiplex these signals by using the Bus Selector block provided in the Simulink library.
IGBT Converter
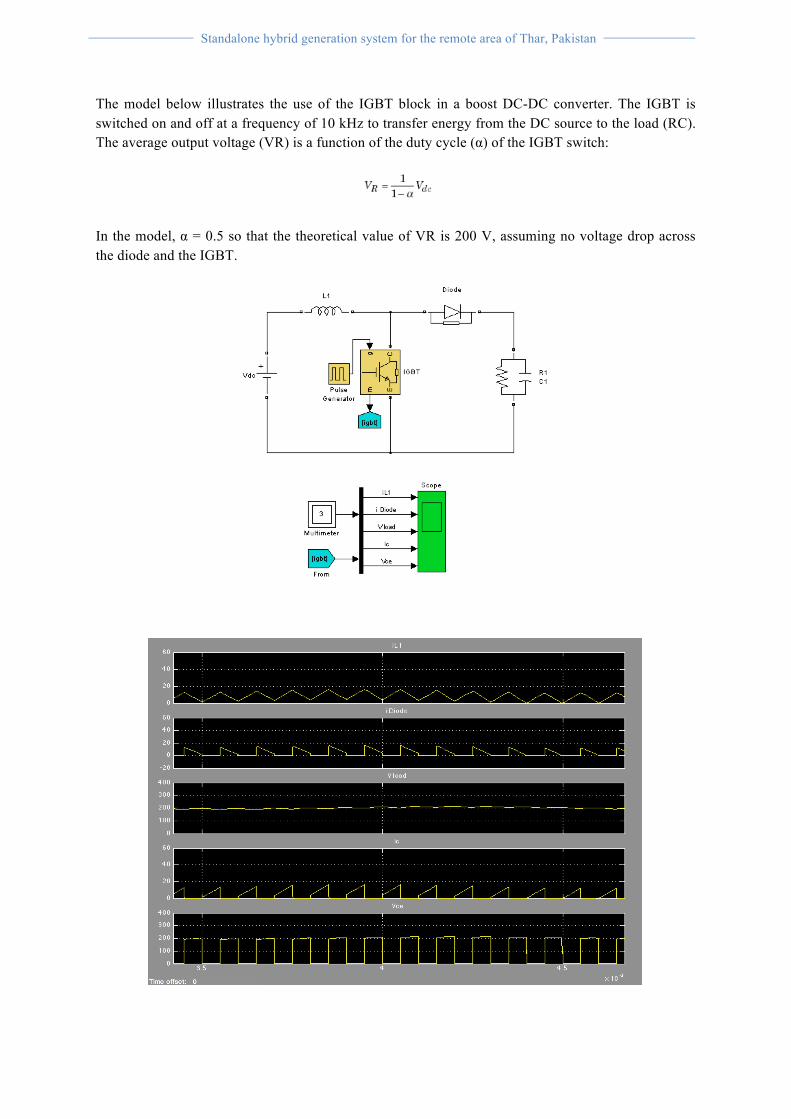
Standalone hybrid generation system for the remote area of Thar, Pakistan
67
The model below illustrates the use of the IGBT block in a boost DC-DC converter. The IGBT is switched on and off at a frequency of 10 kHz to transfer energy from the DC source to the load (RC). The average output voltage (VR) is a function of the duty cycle (α) of the IGBT switch:
In the model, α = 0.5 so that the theoretical value of VR is 200 V, assuming no voltage drop across the diode and the IGBT.

Standalone hybrid generation system for the remote area of Thar, Pakistan
68
The load voltage (197 V) is slightly lower than the theoretical value (200 V) mainly because of the forward voltage (Vf) of the diode (0.8 V) and of the IGBT (Vf = 1 V).
2.9.7. Three-Level Bridge Implement three-level neutral point clamped (NPC) power converter with selectable topologies and power switching devices.
The Three-Level Bridge block implements a three-level power converter that consists of one, two, or three arms of power switching devices. Each arm consists of four switching devices along with their antiparallel diodes and two neutral clamping diodes as shown in the figure below.
The type of power switching device (IGBT, GTO, MOSFET, or ideal switch) and the number of arms (one, two, or three) are selectable from the dialog box. When the ideal switch is used as the switching device, the Three-Level Bridge block implements an ideal switch bridge having a three-level topology as shown in the following figure.
Fig.2.44 Three-level topology
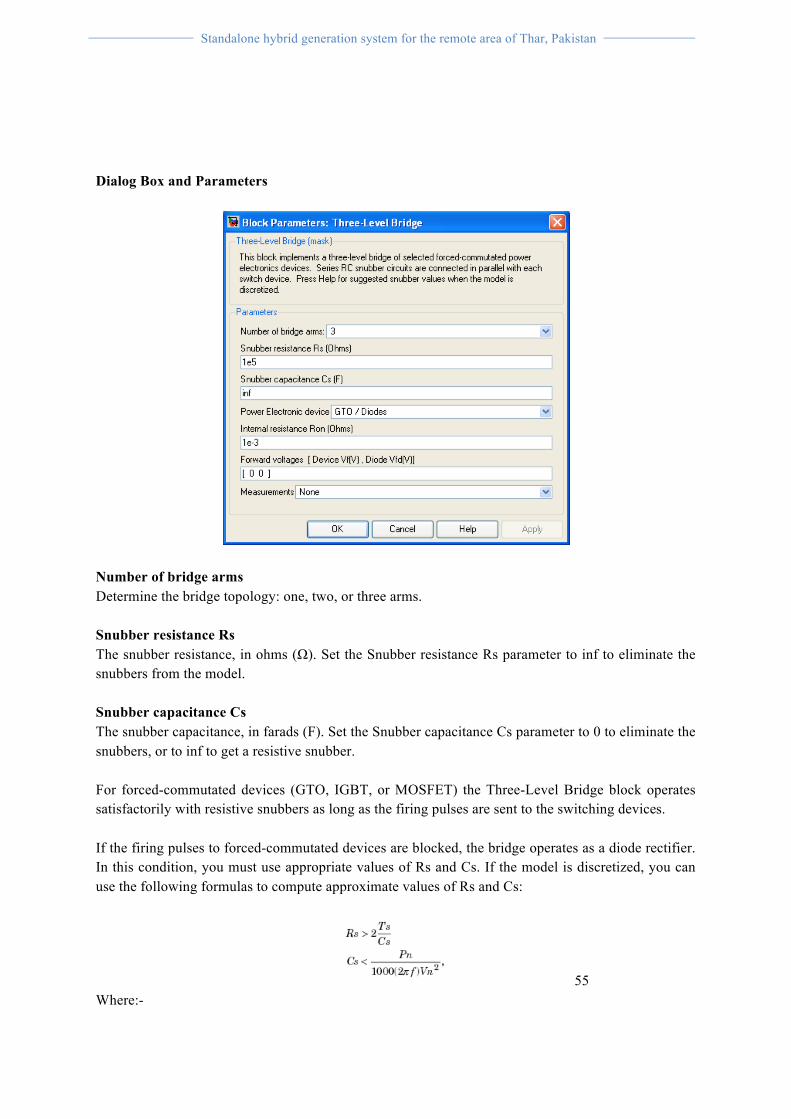
Standalone hybrid generation system for the remote area of Thar, Pakistan
69
Dialog Box and Parameters
Number of bridge arms Determine the bridge topology: one, two, or three arms. Snubber resistance Rs The snubber resistance, in ohms (Ω). Set the Snubber resistance Rs parameter to inf to eliminate the snubbers from the model. Snubber capacitance Cs The snubber capacitance, in farads (F). Set the Snubber capacitance Cs parameter to 0 to eliminate the snubbers, or to inf to get a resistive snubber. For forced-commutated devices (GTO, IGBT, or MOSFET) the Three-Level Bridge block operates satisfactorily with resistive snubbers as long as the firing pulses are sent to the switching devices. If the firing pulses to forced-commutated devices are blocked, the bridge operates as a diode rectifier. In this condition, you must use appropriate values of Rs and Cs. If the model is discretized, you can use the following formulas to compute approximate values of Rs and Cs:
55 Where:-

Standalone hybrid generation system for the remote area of Thar, Pakistan
70
• Pn = nominal power of single- or three-phase converter (VA) • Vn = nominal line-to-line AC voltage (Vrms) • f = fundamental frequency (Hz) • Ts = sample time (s)
These Rs and Cs values are derived from the following two criteria:
• The snubber leakage current at fundamental frequency is less than 0.1% of nominal current when power electronic devices are not conducting.
• The RC time constant of snubbers is higher than two times the sample time Ts.
Note that the Rs and Cs values that guarantee numerical stability of the discretized bridge can be different from actual values used in the physical circuit.

Standalone hybrid generation system for the remote area of Thar, Pakistan
71
CHAPTER-3: Load Profile And Preliminary Sizing of the HPS Elements.
For isolated consumers, Solar-wind-diesel hybrid systems are undoubtedly interesting solutions for the electrification. The sizing of system elements is a very important part in which the demand and the supply should be synchronized. Oversizing of system elements result in their inefficient utilization and unwanted investment. When the system elements are undersized, the load demand might not be met and the system will fail to keep its balance, thus the need for proper sizing is important. The proposed system, including a properly sized battery, leads to a significant reduction of the fuel consumption and a properly designed PV-wind-diesel installation remarkably reduces the required battery capacity, in relation to a PV/wind-only based stand-alone system. For a proper design, the complete load demand profiles and resource profiles of the site have to be known first. In this chapter, typical load profiles are considered and the considered data of the renewable resources are applied to derive their respective powers per unit system. Thus, the preliminary approaches for the sizing of each system elements are developed and presented in this chapter.
3.1. Load profiles considered for the Thesis It is always important the understand the load demand first to design a system that provides enough power so that demand and the supply can be synchronized or power can be backed up to the storage bank for the peak load to avoid the black out or limit the use of fossil fuel generator, proper sizing of the system is very important. Two types of daily load profile are considered in this thesis. One of them is described as load profile-A that is mainly a daytime load and the second load is basically a night time load. The load profiles [25, 26] whose daily demand curves are shown below. The data are extrapolated to a 24-hour load profile and averaged into hourly values.
Fig 3.1: Total estimated daily load profiles- A and B [25, 26].
The load profile-A [25] includes two parts: load profile for the administration/academic part and load profile for the residential part. The administration/academic part of the load profile requires high power during office hours (7:00 – 15:00hrs) and small lighting loads at the corridors are possibly left

Standalone hybrid generation system for the remote area of Thar, Pakistan
72
for the security lighting form 19:00 – 7:00 hrs. Furthermore, demand rises during early morning, lunch time and dinner time for breakfast, lunch and dinner activities respectively than the demand for other normal activities are indicated in Figure 4.1. The load profile-B [26] shows the high demand appears during nighttime. It explicitly accounts for the residential loads like in most rural areas, where power is consumed for lighting and other related activities. In this case, the operation of the load is for about 7 hours/day during nighttime. For the load profile shown in figure 3.1 we can see that during day time we requires around 100-150 kwh of power to match the load and during night time we requires around 250-300 kwh power the match the load so during day time we get mostly power from the sun and system is capable of generating maximum 100kwh from the PV which might will not to enough to match the load so we can use backed up power from the storage system to balance the load during peak periods and similarly in the night time we get mostly wind energy due to location meteorological reasons and wind generation system is capable of generating 300 kwh maximum hence it can easily manage the load but the good part is that, during night time the peak period is only for few hours where we have peak demand so we can save the remaining energy generated by the wind generation system to battery storage that can be used in the morning peak time to manage the load without using diesel generator.
3.2. Renewable power resources The renewable energy resources used here are the solar energy and the wind energy. The renewable energy resources (insolation and wind speed) data are discussed and the corresponding power calculations from a single PV-panel and a wind turbine are discussed and are assumed for both types of load profiles below.
3.2.1. Solar irradiation and wind speed To meet the load demand defined by Figure 3-1, the energy sources (PV-arrays, wind turbines and Genset) with the storage devices must be sized properly so that efficient power utilization can be achieved. The hourly average solar insolation and wind speed data must be collected from the site where the hybrid power system is to be installed and must be examined over a series of years. These data are used in system unit sizing, and the generation and load are assumed to keep constant in each hour interval. For the site in consideration, the solar average hourly insolation and wind speed24 are shown in Figure 3-2.
Fig 3.2: Average hourly solar insolation and wind speed considered.

Standalone hybrid generation system for the remote area of Thar, Pakistan
73
The insolation (irradiation) is the intensity of power per unit area given in (KW/m2) and the wind speed is given in m/s. The insolation and wind speed data considered here are given assuming they are constant each hour though resources vary each hour and seasonally. It is hardly possible to get high solar irradiation and high wind speed at the same time, and from Figure 4-2 it can be seen that high insolation is at daytime (around 12:00 – 16:00hrs) and high wind speed at nighttime (around 19:00 – 01:00hrs). Depending on the geographical location of the site considered, the data of the renewable sources also vary and thus these data are only used here to develop the approach for sizing the renewable energy sources.
3.2.2. Power outputs of a PV-panel and a wind turbine With the renewable resource profiles (Figure 3-2) at hand, the corresponding powers that can be harnessed from the RESs can be calculated. The average hourly insolation data on a single PV-panel shown by Figure 3-3 can be converted into power output from the PV-panel using the following equation [30].
3.1 And the power when referred to the DC-bus where the PMSs are applied can be given as:
3.2 Where, Ppv (t) = power output from the PV-panel (W) Ins(t) = insolation data at time t (W/m2) A pv = area of a single PV-panel (m2) η pv = overall efficiency of the PV-panel η dd = efficiency of the DC/DC converter (regulator) From the average hourly wind speed profile (Figure 3-2), if the wind speed is between the cut-in and the rated speed of the wind turbine, the power output at the AC-bus can be evaluated [30] by:
3.3 The wind turbine output power referred at the DC-bus where the PMSs are applied can be given by:
3.4 Where, Pwind (t) = output power of a wind turbine (W) r = Air density (Kg/m3) Arot = Rotor area (m2) v(t) = wind speed (m/s) Cp = Efficiency of wind turbine η ad = Efficiency of AC/DC

Standalone hybrid generation system for the remote area of Thar, Pakistan
74
The parameters which are used for the calculations of powers from a PV-panel and a wind turbine are from the datasheets 330 SunPower modules (SPR-305) and E33 330 kw wind turbine [24, 32] whose details can be referred to the Appendix. If wind speed is between the rated speed and the furling speed of the wind turbine, the power output will be equal to the rated power of the turbine and if the wind speed is either less than the cut-in speed or greater than the furling speed of the wind turbine, then the output power will be zero [30, 33]. The output power from a single PV-panel and a wind turbine, with the selected parameters of PV-panel & wind turbine and the available resources, which are all mentioned above, are calculated with the above equations equation-3.1 and equation-3.1 respectively. The resulting powers are shown by the following power curves (Figure 3-3).
Fig. 3.3: The power output from a wind turbine and a PV Array.
From Figure 4-3, it can be seen that about 94KW and 295 KW maximum powers could be obtained from a solar and a wind turbine respectively. Based on the output power of the PV-panel and the wind turbine, the energy that can be obtained from the RESs at any time can be observed. Comparing the power output profiles with the power demand profile, the following important points can be noted.
• The data used in this study are hourly average, which is useful for unit sizing. Since the wind-generated power is proportional with the cube of wind speed, more power could be produced at times when there are spikes in the wind speed, which are not actually shown here.
• The load demands are high load at daytime‟ and high load nighttime‟ for load profile-A and profile-B respectively. The resource data doesn’t show times when no wind or solar powers are available. Hence, an energy storage device is required to store the energy when supply is greater than the demand.
• There is a need for sizing of the battery bank such that it is capable of storing enough energy
from the RESs and meeting the daily load demand at times when there are no supplies from other sources (worst case). It should also have a capacity to store the energy from the
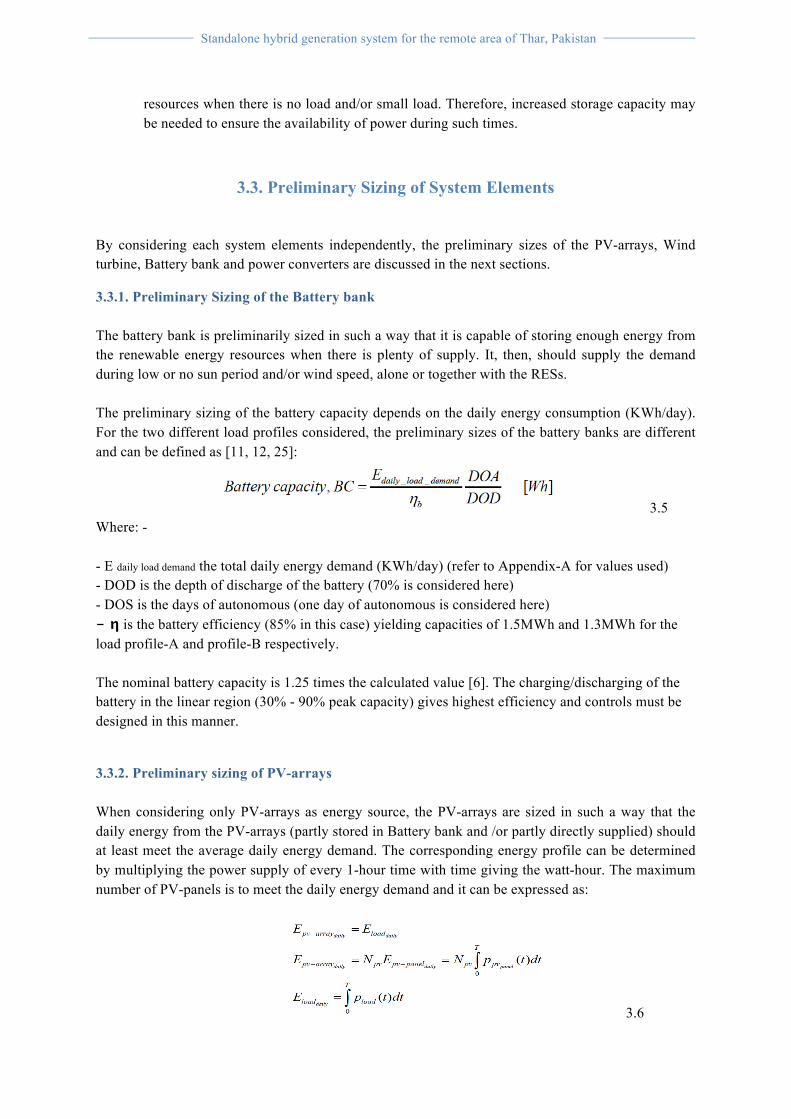
Standalone hybrid generation system for the remote area of Thar, Pakistan
75
resources when there is no load and/or small load. Therefore, increased storage capacity may be needed to ensure the availability of power during such times.
3.3. Preliminary Sizing of System Elements
By considering each system elements independently, the preliminary sizes of the PV-arrays, Wind turbine, Battery bank and power converters are discussed in the next sections.
3.3.1. Preliminary Sizing of the Battery bank The battery bank is preliminarily sized in such a way that it is capable of storing enough energy from the renewable energy resources when there is plenty of supply. It, then, should supply the demand during low or no sun period and/or wind speed, alone or together with the RESs. The preliminary sizing of the battery capacity depends on the daily energy consumption (KWh/day). For the two different load profiles considered, the preliminary sizes of the battery banks are different and can be defined as [11, 12, 25]:
3.5 Where: - - E daily load demand the total daily energy demand (KWh/day) (refer to Appendix-A for values used) - DOD is the depth of discharge of the battery (70% is considered here) - DOS is the days of autonomous (one day of autonomous is considered here) - η is the battery efficiency (85% in this case) yielding capacities of 1.5MWh and 1.3MWh for the load profile-A and profile-B respectively. The nominal battery capacity is 1.25 times the calculated value [6]. The charging/discharging of the battery in the linear region (30% - 90% peak capacity) gives highest efficiency and controls must be designed in this manner.
3.3.2. Preliminary sizing of PV-arrays When considering only PV-arrays as energy source, the PV-arrays are sized in such a way that the daily energy from the PV-arrays (partly stored in Battery bank and /or partly directly supplied) should at least meet the average daily energy demand. The corresponding energy profile can be determined by multiplying the power supply of every 1-hour time with time giving the watt-hour. The maximum number of PV-panels is to meet the daily energy demand and it can be expressed as:
3.6

Standalone hybrid generation system for the remote area of Thar, Pakistan
76
Then, what is required here is, to determine the number of PV-panels forming PV-arrays and can be determined as:
3.7 With the simulations in this paper, the number of the PV-panels is determined using Eq- (3.7). It requires computational manipulations of series of loops and with Npv and Epv, and Eload representing the number of PV-panels, the daily energy obtained from the PV-arrays and the daily energy demand of the loads respectively, the following schematic shows the PV-arrays sizing algorithm from the perspective of the energy demand and energy supply.
Figure 3-4: The algorithm to determine the number of PV-panels with only PV-array source
From the above algorithm block diagram, it can be observed the energies from the PV-panel(s) and the demand are compared. As far as the daily demand is larger than the PVarray supply, the number of PV-panels increases and the energy from the RESs is compared with the energy demand, and this repeats each and every loop until the condition There is also a general relationship between the average daily demand and the watts needed from PV-arrays can be given by the following preliminary solar PV-array capacity sizing formula [25].
3.8 Where Eave_ daily _ demand is the average daily energy demand (refer to Appendix-A for values used), DSH is the daily sun hours (6-hrs/day considered here) and ηdd is the DC/DC converter (regulator) efficiency (98%). Then, the maximum number of PV-panels forming a PV-array is:
3.9

Standalone hybrid generation system for the remote area of Thar, Pakistan
77
3.3.3. Sizing of the renewable energy sources in hybrid systems To size the energy sources used in the HPSs, the power generated from the PV-panel and wind turbine during each hour is first computed as:
3.10 Where, Pres(t) is the equivalent power to the energy generated from the renewable sources at a particular hour, Npv and Nwg are the number of PV-panels and wind turbines respectively, and Ppv(t) &
Pwg(t) are the powers generated from the PV-panel and the wind turbine at time t respectively. By multiplying the power from the renewable energy sources with time, the energy the renewable sources could generate at any time can be given by:
3.11 Where eres(t) is the energy generated from the RESs at a particular hour, and epv(t)& ewg(t) are the energies generated from a PV-panel and a wind turbine at time t respectively. The energy from the renewable sources (Solar and/or wind) and/or Genset could be consumed by the demand directly or after it has been stored in the battery bank. Let’s see the most important cases that have to be considered when sizing the units. i. If the power from the PV/wind is greater than the load demand at a particular hour, the excess power must flow into the battery and the amount of energy stored in the battery bank when seen from the DC-bus is:
3.12 ii. When the load demand at a particular time is greater than the generated energy by the RESs and the battery bank has enough stored energy, the battery bank is used to help supplying the load. The stored energy which is left in the battery at each time t and when seen from the DC-bus is:
3.13
During this situation, it is assumed that the sum of the energy from the RESs and battery are at least capable of satisfying the load demand. iii. If the sum of the energy generated from PV/wind systems and energy available from the storage is not sufficient enough to supply the load demand, the Genset must turn ON to fulfill the demand. The energy required from the DG can be evaluated as at the DC-bus is:
3.13

Standalone hybrid generation system for the remote area of Thar, Pakistan
78
CHAPTER – 4: Implementation, Modeling And Simulation of the Hybrid Generation System.
In this chapter implementation and modeling of the Wind turbine and Photovoltaic, and their corresponding subsystems (MPPT for PV, converters, etc.) have been simulated using “simpowersystem” toolbox discussed in chapter-2. The models for PV, wind turbine and converters have been modeled using literature review discussed in chapter -2 and the system architecture used for the hybrid generation system is Mixed Coupled HPS. The main idea behind this simulation is to demonstrate the system working in MATLAB environment and analyzes the simulation results. Firstly, all the models are simulated individually and then integrated to became a hybrid generation system
4.1. Proposed System Design Any combination of renewable energy technologies with an optional backup diesel engine and storage device is possible though some of them may not be most efficient, cost effective and reliable. The way to determine the most appropriate technological solution for hybrid systems always requires a feasibility study based on gathering the field data for each specific site and on life cycle cost analysis of each components and the system. Different factors may be taken into account while considering choosing the best coupling layout of different energy sources, like geographical location of the site (windy, sunny etc.), types of energy sources (Wind, PV, Genset, etc. or mixed), the nature of load demand (more demand at daytime or at nighttime, all time load), and the efficiency of power electronics devices used in the conversion of power. From the location analysis of the system we can say that as the location has abundant renewable resources but these resources vary as when there is full sun, we don’t have enough wind mostly during day time and similarly during night time more wind and no solar irradiation hence based on the renewable resources availability, power electronics efficiency, cost effectiveness and design sustainability a mixed coupled HPSs is the best option to be considered. A detailed explanation of the mixed hybrid system is already explained above in chapter -2. Below is block diagram of the proposed design used in the system.
Fig. 4.1-Block Diagram of Hybrid PV-Wind generation unit

Standalone hybrid generation system for the remote area of Thar, Pakistan
79
4.2. PV Array Technical Specification The 100-kW PV array of the detailed model uses 330 SunPower modules (SPR-305). The array consists of 66 strings of 5 series-connected modules connected in parallel (66*5*305.2 W= 100.7 kW). Manufacturer specifications for one module are:
• Number of series-connected cells: 96. • Open-circuit voltage: Voc= 64.2 V. • Short-circuit current: Isc = 5.96 A. • Voltage and current at maximum power: Vmp =54.7 V, Imp= 5.58 A.
As the 100 KW PV Array consist of 66 strings of 5 series-connected modules connected in parallel, hence I have to design the single PV panel first by using solar cell then I can add them in series to get the required output voltage.
4.2.1. PV Panel Model
Fig.-4.2 PV panel Model
Each PV panel consists of 96 solar cells with 16 sub-systems with 6 solar cells. Below is the snap of the single sub-system showing how they are connected in series.
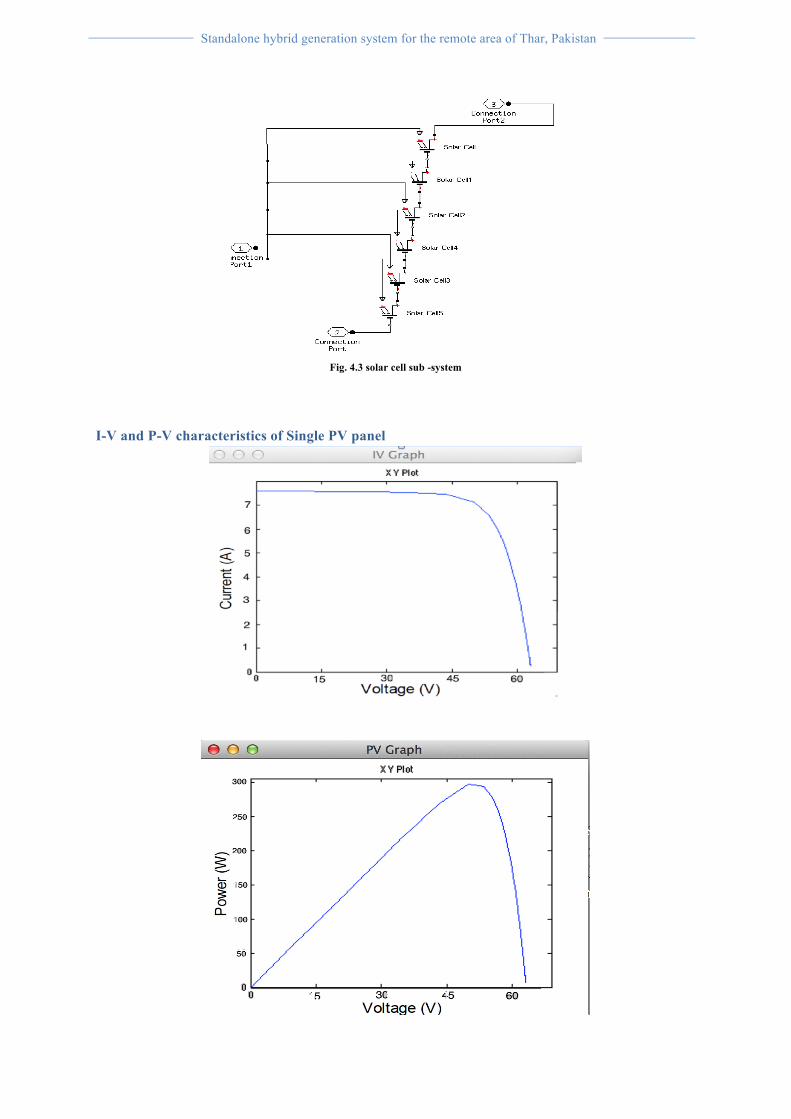
Standalone hybrid generation system for the remote area of Thar, Pakistan
80
Fig. 4.3 solar cell sub -system
I-V and P-V characteristics of Single PV panel

Standalone hybrid generation system for the remote area of Thar, Pakistan
81
From the above graphs we can see that from each panel we are getting3 00 watt while in the data sheet the graph shows maximum power of 305 W but due to losses in the system 300 watt is acceptable. In the thesis as it has been already been explain in the chapter-2 that the maximum power output from PV array system is 100KW hence we need to add 5 panel in series to get the desired output voltage.
4.2.2. PV Array Model
Fig. 4.4 100 KW PV Array Model
Below is the dialog box of the PV Array, from the dialog box we can see that the Array is consists of 66 strings of 5 series-connected modules connected in parallel that gives us (66*5*305.2 W= 100.7 kW).
Fig. 4.5 PV Array dialog box

Standalone hybrid generation system for the remote area of Thar, Pakistan
82
4.2.3. Simulation Result Total output power from the PV array system in shown below in the graph.
Fig. 4.6 Total output power from the PV array
From the graph we can see that PV array is producing 100 KW power from the system which is the proposed output required from the system and the system is also steady because the irradiance is constant with 1000 W/m2, which is shown below in the graph.

Standalone hybrid generation system for the remote area of Thar, Pakistan
83
Fig. 4.7 Different Parameters of the PV Array system
The graph below shows the system PV array voltage, PV current, and diode.
Fig. 4.8 PV array voltage, PV current, and diode

Standalone hybrid generation system for the remote area of Thar, Pakistan
84
4.2.4. Boost converter In the detailed model, the boost converter (orange blocks) boosts DC voltage from 273.5 V to 500V. This converter uses a MPPT system, which automatically varies the duty cycle in order to generate the required voltage to extract maximum power. From the previous graph we can see that the output voltage of the PV array is 273.5V but after using the boost converter now the voltage is boosted to the 500V.
Fig. 4.8 Boost converter output
4.2.5. Maximum Power Point Tracking (MPPT) modeling As discussed in chapter 3, maximum power point is obtained by introducing a DC/DC converter in between the load and the PV panel. The duty cycle of the converter is changed till the peak power is obtained. The duty cycle guarantees the output resistance matching of the circuit and PV operates at the MPP. Here in this simulation, Boost converter has been used and for calculating the duty, the famous and simple algorithm of Perturbed and Observed (P&O) has been used. MPPT Controller. Maximum power point tracking by incremental conductance method + Integral regulator Maximum power point is obtained when dP/dV=0, where P= V*I. -> d(V*I)/dV = I + V*dI/dV = 0. -> dI/dV = -I/V. The integral regulator minimizes the error (dI/dV + I/V) Regulator output = Duty cycle correction.

Standalone hybrid generation system for the remote area of Thar, Pakistan
85
Fig 4.9 MPPT Model
Figure below showing detailed model of the MPPT system implemented on the method explained in the chapter - 3
Fig 4.10 MPPT sub-System Model
Fig 4.11 MPPT Algorithm dI/dV -I/V (magenta)

Standalone hybrid generation system for the remote area of Thar, Pakistan
86
4.2.6. VSC converter The three-level VSC (blue blocks) regulates DC bus voltage at 500 V and keeps unity power factor. The control system uses two control loops: an external control loop which regulates DC link voltage to +/- 250 V and an internal control loop which regulates Id and Iq grid currents (active and reactive current components). Id current reference is the output of the DC voltage external controller. Iq current reference is set to zero in order to maintain unity power factor. Vd and Vq voltage outputs of the current controller are converted to three modulating signals Uref_abc used by the PWM three-level pulse generator. The control system uses a sample time of 100 ms for voltage and current controllers as well as for the PLL synchronization unit. In the detailed model, pulse generators of Boost and VSC converters use a fast sample time of 1ms in order to get an appropriate resolution of PWM waveforms.
Fig. 4.12 VSC converter Result
• From t=0 sec to t= 0.05 sec, pulses to Boost and VSC converters are blocked. PV voltage
corresponds to open-circuit voltage (Nser*Voc=5*64.2=321 V, The three-level bridge operates as a diode rectifier and DC link capacitors are charged above 500 V
• At t=0.05 sec, Boost and VSC converters are de-blocked. DC link voltage is regulated at
Vdc=500V. Duty cycle of boost converter is fixed and sun irradiance is set to 1000 W/m2. Steady state is reached at t=0.25 sec. Resulting PV voltage is therefore V_PV = (1-D)*Vdc= (1-0.5)*500=250V. The PV array output power is 96 kW whereas maximum power with a 1000 W/m2 irradiance is 100.7 kW
• At t=0.4 sec MPPT is enabled. The MPPT regulator starts regulating PV voltage by varying
duty cycle in order to extract maximum power. Maximum power (100.7 kW) is obtained when duty cycle is D=0.453. At t=0.6 sec, PV mean voltage =274 V as expected from PV module specifications (Nser*Vmp=5*54.7= 273.5 V).
• From t=0.7 sec to t=1.2 sec, sun irradiance is ramped down from 1000 W/m2 to 250 W/m2.

Standalone hybrid generation system for the remote area of Thar, Pakistan
87
MPPT continues tracking maximum power. At t=1.2 sec when irradiance has decreased to 250 W/m2, duty cycle is D=0.485. Corresponding PV voltage and power are Vmean= 255 V and Pmean=22.6 kW. Note that the MMPT continues tracking maximum power during this fast irradiance change.
4.3. Wind Turbine The wind turbine used is this system is ENERCON E33 wind turbine which has rated power of 330 KW and is using Permanent magnet synchronous generator (PMSG). The reason for using PMSG is already explained in depth in chapter-2.
Technical Specification
• Rated power: 330 KW • Cut-in speed: 4 m/s • Cut-out speed: 28-34 m/s • Output voltage: 400V • Output Frequency: 50/60 H • No. Of blades: 3 • Hub Height: 50m • Rotor diameter: 33m • Swept Area: 876𝑚! • Rotational speed: 18-45 rpm • Generator: Direct drive permanent synchronous generator.
A detailed datasheet of the wind turbine is attached in the appendices.
Fig. 4.13 Power Curve of the E-33 Wind Turbine.

Standalone hybrid generation system for the remote area of Thar, Pakistan
88
4.3.1. Wind Turbine Model
Fig. 4.14 Wind turbine Model.
From the above model we can see that a wind turbine is connect to the permanent magnet synchronous generator and generator output is connected to the load. As generator used in the wind turbine produce AC voltage hence we don’t need DC-AC converter but still the output voltage from the generator is not steady that’s why in the Hybrid generation system model the output voltage will go through AC-AC inverter to get steady voltage which then become easy to control and transfer to the micro-grid. For the wind turbine to work efficiently two factors are very important, i-e wind speed and type of generator. The generator used in this system has 90-95% which is pretty good and from the site analysis discuss in chapter-2 we can see that the location has have an average wind speed of 8 m/s which is slightly less then desired speed to get the maximum rated power output but generator cut-in speed is 4 m/s hence wind turbine will be able to produce enough energy to balance the demand with the help of other renewable resources. Below figure shows the wind turbine characteristics and wind speed received by the turbine.
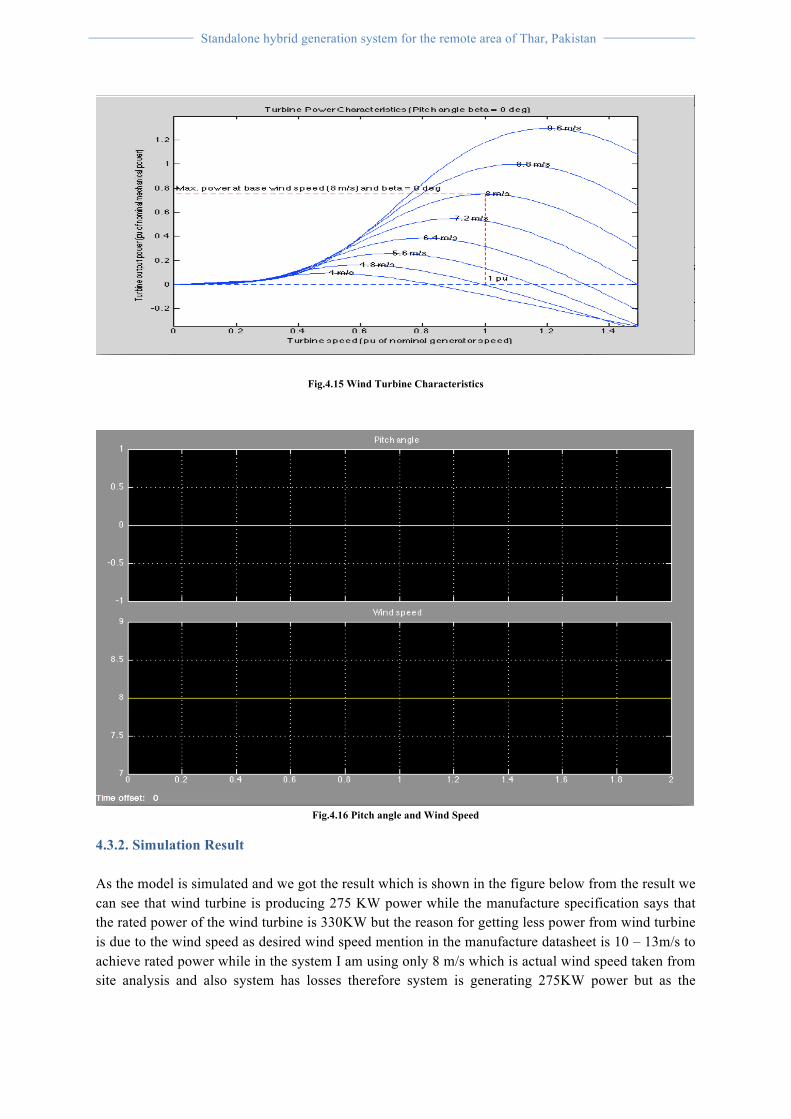
Standalone hybrid generation system for the remote area of Thar, Pakistan
89
Fig.4.15 Wind Turbine Characteristics
Fig.4.16 Pitch angle and Wind Speed
4.3.2. Simulation Result As the model is simulated and we got the result which is shown in the figure below from the result we can see that wind turbine is producing 275 KW power while the manufacture specification says that the rated power of the wind turbine is 330KW but the reason for getting less power from wind turbine is due to the wind speed as desired wind speed mention in the manufacture datasheet is 10 – 13m/s to achieve rated power while in the system I am using only 8 m/s which is actual wind speed taken from site analysis and also system has losses therefore system is generating 275KW power but as the
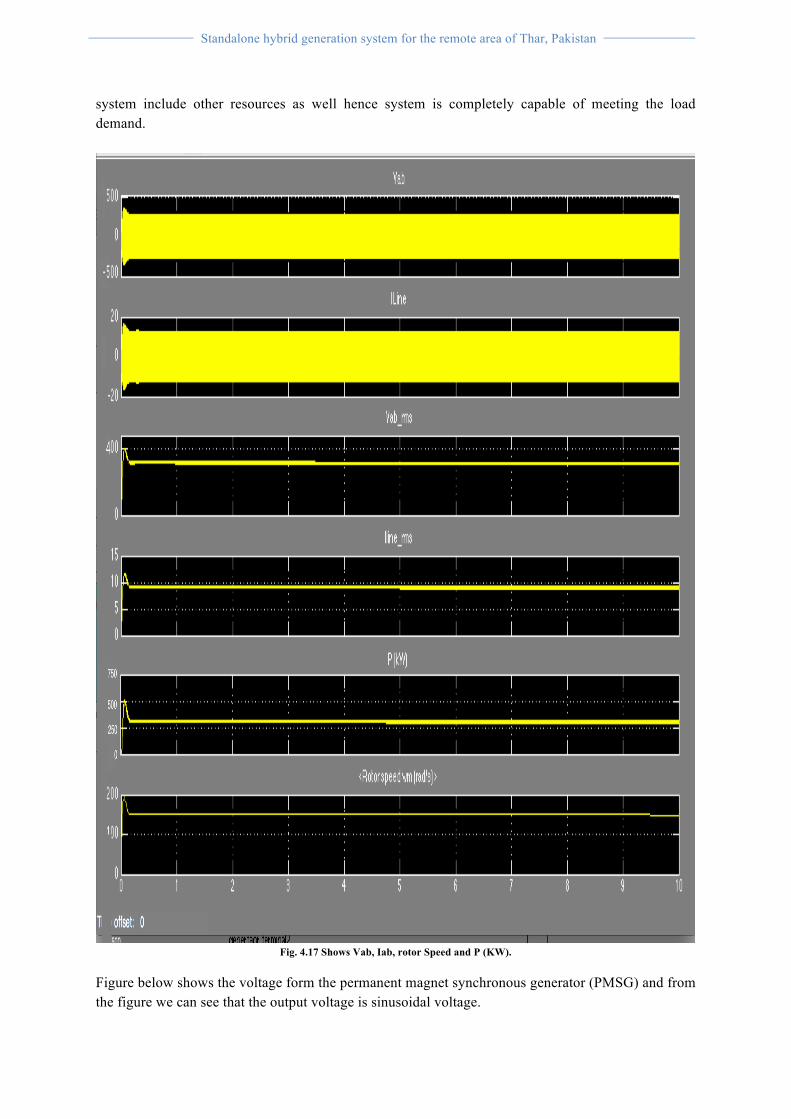
Standalone hybrid generation system for the remote area of Thar, Pakistan
90
system include other resources as well hence system is completely capable of meeting the load demand.
Fig. 4.17 Shows Vab, Iab, rotor Speed and P (KW).
Figure below shows the voltage form the permanent magnet synchronous generator (PMSG) and from the figure we can see that the output voltage is sinusoidal voltage.

Standalone hybrid generation system for the remote area of Thar, Pakistan
91
Fig. 4.18 Three-Phase Vab.
Figure below show the electric torque and mechanical torque of the wind turbine.
Fig.4.19 Electric Torque, and Mechanical Torque

Standalone hybrid generation system for the remote area of Thar, Pakistan
92
As discussed in the chapter-2 that when the machine torque is positive it act as a motor but when the torque is negative Machine act as a generator and from the figure below it can be seen that shaft torque is negative.
Fig.4.20 Shaft Torque (pu)
4.4. Three Phase Inverter Using Pulse Width Modulation (PWM) As the proposed hybrid generation system is consist of solar and wind turbine and we already simulated the PV array and wind turbine model and also got the desired output hence know we have to integrate the PV array and wind turbine. The output of the PV array is already converted to the AC from DC with the help with the help of inverter and wind turbine used in the system produce AC voltage instead of DC voltage so we need to use three phase inverter using Pulse width modulation to integrate them to the micro-grid.
Fig. 4.21 Three Phase Inverter Using Pulse Width Modulation (PWM) Model

Standalone hybrid generation system for the remote area of Thar, Pakistan
93
4.4.1. Simulation Result
Fig. 4.22 Three Phase Inverter Vab and Vab_Load
4.5. Hybrid Generation System Model In the hybrid generation system model solar and wind are integrated under HPW Subsystem and is then connected to the load by breaker to open the circuit in case of any emergency.

Standalone hybrid generation system for the remote area of Thar, Pakistan
94
Fig.4.23-Hybrid Generation System Model
Figure below show the subsystem of HPW in detail, in this subsystem integration of the solar and wind turbine is done.
Fig. 4.24-Detailed model of HPW Sub-System
4.5.1. Simulation Result As the national Grid in Pakistan is using 50Jz frequency hence for the future if the system has to be tied with grid the hybrid generation system is configured to 50Hz frequency and from the figure below we can see that the system frequency of the oscillations of alternating current (AC) is also 50Hz.

Standalone hybrid generation system for the remote area of Thar, Pakistan
95
Fig. 4.25 System frequency of the oscillations of alternating current (AC)
Figure below show the system total power output combining PV array and Wind turbine. System output is not steady as it is fluctuating and the fluctuating of the output power from the start can be removed by using a power full filters that remove any spikes produces in the sine wave that cause unsteadiness in the output power.
Fig. 4.26 Hybrid generation system total Power output P (KW).

Standalone hybrid generation system for the remote area of Thar, Pakistan
96
5. Conclusion A hybrid power system which consists of PV-arrays, and wind turbines with energy storing devices (battery bank) and power electronic devices has been discussed in this paper to achieve an efficient and cost competitive system configuration so electrification of the rural area like THAR, Pakistan can be done where electricity from the main grid has not reached yet due to capital cost and other limitations. For the different energy sources, where some are AC sources and others DC sources, different connecting topologies are proposed in this paper. The proposed connecting configurations are compared to select the one with the best efficiency of power consumption to the consumers by considering each power sources independently. It is found that with the Mixed-coupling HPSs, best efficiency of power consumption can be achieved when compared with the other topologies and the selected topology is used for further investigation. Various significant aspects of system, such as unit sizing and optimization, modeling of system components and optimal energy flow management strategies, are specifically reviewed. Different sizing techniques have been reviewed under classification based on availability of weather data. The equivalent models including several physical mechanisms of these system components have been extensively discussed with a broad classification in modeling section. The different systems components and overall system is modeled using MATLAB/Simulink blocks. The appropriate sizes of system elements are applied to each PMS and the models are simulated. The simulation results verify that the results are in accordance to the mathematical modeling, which depends on the governing energy and power equations. The demand can be met easily at all the time and the charging/discharging of the battery is controlled between the upper and lower limits. The proper sizing of system elements results in the efficient utilization of the power from the renewable sources and the battery bank. Future trends include cutting edge technology development to increase the efficiency of such hybrid systems and encouragement in terms of its implementation. HRES has an immense potential to meet the load demand of remote, isolated sites and can contribute significantly to both rural as well as urban development. This in turn reduces the central generation capacity and increases overall system reliability. These units can supply uninterrupted power at zero emission level, which is the major advantage of such systems. The widespread use of hybrid renewable energy systems will not only solve the energy issues but also ensure a green and sustainable planet.

Standalone hybrid generation system for the remote area of Thar, Pakistan
97
6. References
[1] Osama Omari, Egon Ortjohann, Alaa Mohd, and Danny Morton, "An Online Control Strategy for DC Coupled Hybrid Power Systems," in 2007 IEEE Power Engineering Society General Meeting, Tampa, FL, 23 July- 2007, pp. 1 - 8, ISSN:1932-5517, ISBN:1-4244-1298.
[2] N. Phuangpornpitak and S. Kumar, "PV hybrid systems for rural electrification in Thiland," Renewable
and Sustainable Energy Reviews, ScienceDirect, vol. 11, Iss. 7, pp. 1530-1543, September 2007.
[3] ARE - shining a Light for a progress, "Hybrid power systems based on renewable energies- A suitable
and cost-competitive solution for rural electrification," www.ruralelec.org/fileadmin/DATA/Documents/06_Publications/Position_papers/ARE-WG_Technological_Solutions_-_Brochure_Hybrid_Systems.pdf, Ed.: ARE-Alliance for Rural Electrification, 2008.
[4] O.C. Onar, M. Uzunoglu, and M.S. Alam, "Dynamic modeling, design and simulation of a wind/fuel
cell/ultra-capacitor-based hybrid power generation system," Journal of Power Sources- ScienceDirect, vol. 161, pp. 707-722, 28th March 2006.
[5] Ahmed Agus Setiawan, Yu Zhao, Rob Susanto-Lee, and Chem. V. Nayar, "Design, economic analysis
and environmental considerations of mini-grid hybrid power system with reverse Osmosis desalination plant for remote areas," Renewable Energy-Elsevier, vol. 34, Iss.2, pp. 374-383, February 2009.
[6] J. F. Baalbergen, "System design and power management of a generator-set with energy storage for a
4Q drive," in Electrical Power Engineering, MSc: Delft University of Technology, October 2007.
[7] 7Haruni, AMO and Haque, ME and Gargoom, AMM and Negnevitsky, M,‘Efficient Control of a
Direct Drive IPM Synchronous Generator Based Variable Spwwed Wind Turbine with Energy Storage’, 36th Annual Conference on IEEE Industrial Electronics Society (IECON 2010) , 7-10 Nov 2010, Phoenix AZ, pp. 457-463.
[8] J. Leuchter, P. Bauer, O. Kurka, and V. Hájek, "Efficiency Investigation of Mobile Power Sources with
VSCF Technology," in International Symposium on Power Electronics, Electrical Drives, Automation and Motion, SPEEDAM 2006, Taormina, 05 July 2006, pp. 475 - 480, ISBN: 1-4244-0193-3.
[9] J. Leuchter, P. Bauer, and V. Stekly, "System Variation of Electrical GEN-SET with Energy Buffer,"
in Power Conversion Conference - Nagoya, 2007. PCC '07, 18 June 2007, pp. 1401-1408, ISBN:1-4244-0844-X.
[10] N. Rapapate and Ö. Göl, "Use of photovoltaic systems for rural electrification in Thailand,"
http://www.icrepq.com/icrepq07/352-Rapapate.pdf.
[11] Miro Zeman, " Introduction to solar electricity," in SOLAR CELLS, TU Delft, pp. 1.1- 1.13.
[12] Mukund R. Patel, "Wind and Solar Power Systems". Kings Point, New York: CRC Press LLC, 1999,
ISBN:0-8493-1605-7.
Standalone hybrid generation system for the remote area of Thar, Pakistan
98
[13] IEEE, "IEEE Guide for Array and Battery Sizing in Stand-Alone Photovoltaic (PV) Systems." vol.
IEEE Std 1562™-2007 New York, USA, 12 May 2008.
[14] T.L. Skvarenina, "The Power Electronics handbook": CRC Press LLC, 2000 Corporate Blvd.NW,
2002, ISBN: 0-8493-7336-0.
[15] Hussein Ibrahimab, Adrian Ilincaa, and Jean Perronb, "Comparison and Analysis of Different Energy
Storage Techniques Based on their Performance Index," in IEEE Electrical Power Conference Canada, 2007, pp. 393 - 398.
[16] E. Muljadi and J. T. Bialasiewicz, "Hybrid Power System with a Controlled Energy Storage," in 29th
Annual Conference of the IEEE Industrial Electronics Society (IEEE Cat No 03CH37468) IECON-03. vol. 2 Roanoke, Virginia, 2-6 November 2003, pp. 1296 - 1301, ISBN: 0-7803-7906-3
[17] Justin R. Farmer, "A comparison of power harvesting techniques and related energy storage issues," in
Mechanical Engineering. vol. Master of Science Blacksburg, Virginia: Virginia Polytechnic Institute and State University, 15 May 2007, p. 115.
[18] D. Linden and T. B. Reddy, "Handbook of batteries", 3rd ed. New York: McGraw -Hill Education,
2002, ISBN: 978-0-07-135978-8.
[19] BatteryUniversity.com, "Energy density and Power density, http://www.batteryuniversity.com/partone-
5A.htm," Since 2003.
[20] BAE SECURA PVV CELL Solar, "Technical Specification for Valve Regulated Lead-Acid Batteries
(VRLA), www.bae-berlin.de," BAE Batterien GmbH, Ed. Berlin, August 2008.
[21] IEEE, "IEEE Recommended Practice for Sizing Lead-Acid Batteries for Photovoltaic (PV) Systems."
vol. IEEE Std 1013-2000 3 Park Avenue, New York, NY 10016-5997, USA, 30 March 2000.
[22] Electropaedia, "Battery and Energy Technologies - Performance Characteristics by Ragone Plots,"
http://www.mpoweruk.com/performance.htm.
[23] S.J. Park, B.B. Kang, J.P. Yoon, I.S. Cha, and J.Y. Lim, "A Study on the Stand-Alone Operating or
Photovoltaic-Wind Power Hybrid Generation System," in 35th Annual IEEE Power Electronics Specialists Conference, Aachen, Germany, 20-25 June 2004, pp. 2095 - 2099, ISBN:0-7803-8399-0.
[24] Dr. Recayi Pecen, Dr. MD Salim, and Dr. Marc Timmerman, "A Hybrid Solar-Wind Power Generation
System as an Instructional Resource for Industrial Technology Students," Electronic Publication of the National Association of Industrial Technology, Journal of Industrial Technology, vol. 16, Number 3, May - July 2000.
[25] WIND ENERGY SOLUTIONS, "Technical Specifications of WES18, www.wes18.com
www.windenergysolutions.nl."

Standalone hybrid generation system for the remote area of Thar, Pakistan
99
[26] Prof. Dr.-Ing. E. Ortjohann , M.Sc. Engineer O. Omari, Engineer R. Saiju, Dip.-Ing. N. Hamsic, and Dr. D. Morton, "A simulation Model for Expandable Hybrid Power systems," in 2nd European PV-Hybrid and Mini-Grid Conference: University of Applied Sciences Südwestfalen, Division Soest, Germany, September 2003.
[27] Gajanana Hegde, Pratap Pullammanappallil, and Chem Nayar, "Modular AC Coupled Hybrid Power
Systems for the Emerging GHG Mitigation Products Market," in IEEE- Centre for Renewable Energy & Sustainable Technology. vol. 3 Perth, Australia, 15-17 October 2003 pp. 971-975, ISBN:0-7803-8162-9.
[28] Mike Meinhardt, Martin Rothert, Michael Wollny, and Alfred Engler, "Pure AC-Coupling –The
Concept for Simplified Design of Scalable PV-Hybrid Systems using Voltage/frequency Statics Controlled Battery Inverters."
[29] D.B. Nelson, M.H. Nehrir, and C. Wang, "Unit sizing and cost analysis of stand-alone hybrid
wind/PV/fuel cell power generation systems," Renewable Energy-ScienceDirect, vol. 31, Iss. 10, pp. 1641-1656, August 2006.
[30] MT2YLLC, "More today than yesterday energy: Solar PV Specifications, www.mt2y.com."
[31] FOCUS,"Focus on energy - Wind Turbine Specifications, http://www.focusonenergy.com/Information-
Center/Renewables/Wind-Site-Evaluation-Tools/Wind-Turbine-Specifications.aspx."
[32] WINDPOWER, "Wind turbine power output variation with steady wind speed, http://wind-power-
program.com/turbine_characteristics.htm."

Standalone hybrid generation system for the remote area of Thar, Pakistan
100
APPENDIX 1

Standalone hybrid generation system for the remote area of Thar, Pakistan
101
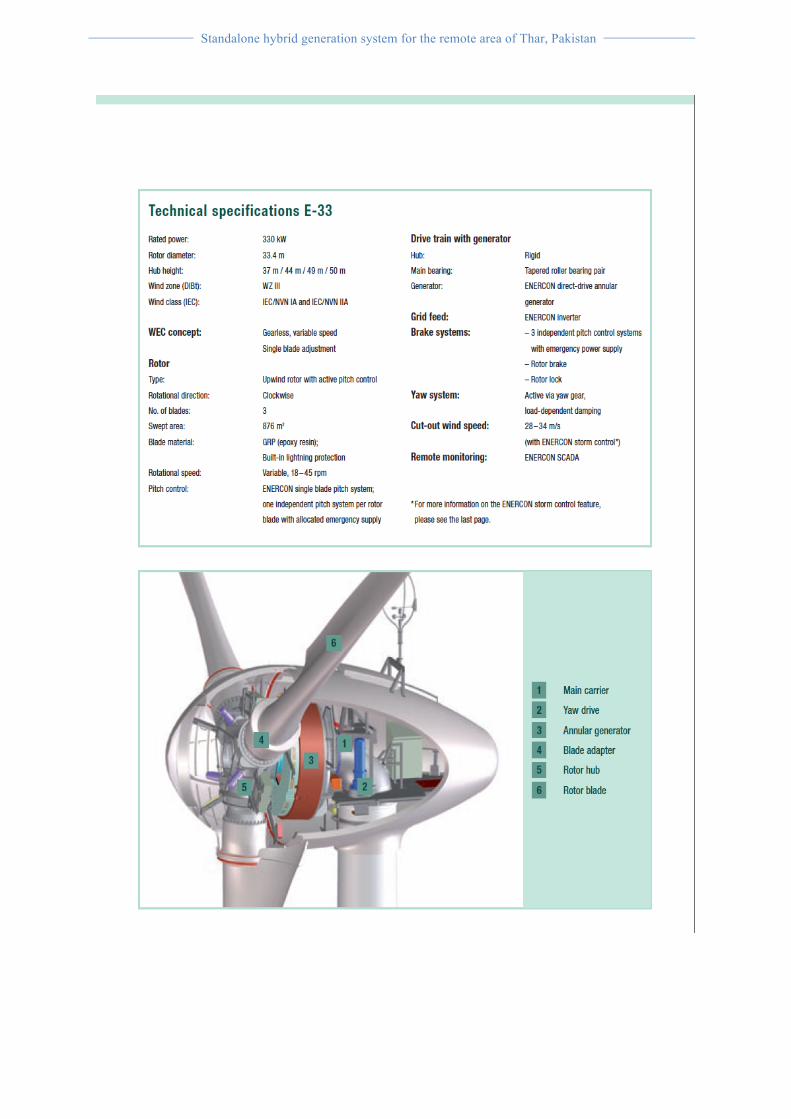
Standalone hybrid generation system for the remote area of Thar, Pakistan
102

Standalone hybrid generation system for the remote area of Thar, Pakistan
103

Standalone hybrid generation system for the remote area of Thar, Pakistan
104

Standalone hybrid generation system for the remote area of Thar, Pakistan
105
APPENDIX 2
Standalone hybrid generation system for the remote area of Thar, Pakistan
106
Interim Report According to statistics made in recent years, it is found that almost 33% of the world’s populations do not have access to electricity [1, 2]. Most of the non-electrified regions are found in developing countries. These regions can be electrified either by extending the grids of the existing power systems or by constructing isolated new power systems, which are alternative energy sources. In general, it is preferred to go for the extension of the existing grids but they are not always affordable the fact that most of the non-electrified regions in developing countries are located in remote and difficult areas, like hilly regions, forests, deserts and islands, which demand huge investment for grid extension, therefore For remote places like THAR, Pakistan where electricity has not reached easily yet it is recommended that decentralized generation, which is based on renewable energy technologies, is perhaps the only efficient way to provide electricity. For the same reasons which make difficulty of extending the conventional grids, transporting fuel to the remote areas and replacement parts needed for the conventional sources like diesel generators, Renewable energy sources (RES) are suggested to constitute the base of the electrical sources. [4, 5] The energy for RESs is locally available and a properly chosen RESs can reduce the operating periods of the conventional power sources considerably which will result in reduction of the fuel consumption and minimizing the need of maintenance. This in turn will result in the improvement of sustainable power generation. A system, which depends entirely upon RESs, is possible but not reliable for the uninsured availability of the resources for the RES systems. In order to meet the sustained load demands during the varying natural conditions, different energy sources and power electronics converters need to be integrated with each other for extended usage of alternative energy. Thus, the best choice is to use electric power generation system, which consists more then one renewable energies as a generation source with energy storage bank and power conditioning system, known as a hybrid power system.
Aims The main aims of this project are to investigate and discuss the benefits of using small-scale renewable energy generation system involving solar and wind energy for the remote area of THAR in Pakistan. The project will mainly focus on the integration and design of the system of the generation system; the system will also include a Gensat as a backup in case renewable resources are not available so Gensat can be used to avoid black out. To design a hybrid generation system for the remote area of the THAR, Pakistan where most of the population is living without the electricity and getting grid connection there is costly and require 2-3 years hence hybrid generation system is the best option as the energy will be produced from renewable resources and also will cost less money and time for the system to be working. The project will also investigate the best design layout (connection topology), power management strategies to design an efficient system, which will require less maintenance and will deliver the energy demand of the THAR community easily and effectively.
Objectives The objectives of the project are: -
• To investigate for the best design layout (connection topology), model and simulate the selected topology for different power management strategies of the HPSs, which consists of renewable energy sources (PV-arrays and wind generator), conventional backup energy source (diesel engine generator) and energy storage bank (battery bank) to sustainably and efficiently satisfy the energy demand of remote places,

Standalone hybrid generation system for the remote area of Thar, Pakistan
107
where main grid electricity has not reached yet due to many geographical and economic constraints.
• Understanding micro grid concept and be familiar with integration between various renewable energy sources with the micro grid
• Familiarise the various power electronics used in integration between generation source and the micro grid
• Producing an improved prototype, demonstrate, test and provide feedback from the software
• Carry a series of experiments on MATLAB, analyse the outcomes and observe the output generated to compare
• Understand of the MPPT and its principle
System components and Tools The hybrid power system, described here, basically includes the following main elements.
• Renewable energy sources: PV-system, Wind generator • Energy storage bank: Battery bank • Backup energy source: Diesel generator set • AC-loads • Power electronic devices • MATLAB simulation software • SMA off- grid simulation software • Wind farmer simulation software
BACKGROUND RESEARCH The project focuses on the combination of wind, solar, Genset and energy storing systems for sustainable power generation. The wind turbine output power varies with the wind speed at different conditions. The solar energy also varies with the hourly, daily and seasonal variation of solar irradiation. Thus, a generator-set system with a battery bank (energy storage bank) can be integrated with the wind turbine(s) and PV-system to ensure that the system performs under all conditions. The dynamic model, design and simulation of a Genset-Solar-Wind hybrid power generation system together with storage bank and with power flow controllers will be proposed. In the proposed system, when the wind speed is sufficient, the wind turbine can meet the load demand. When there is enough energy from the sun, the load demands can be supplied from the PV-array system. Whenever there is excess supply from the RESs, the energy storage bank stores energy, which will be used at times when there are insufficient supplies from the RESs. If either the available power from the wind turbine or from the solar panels cannot satisfy the load demand, the Genset system can meet the excess power demand. The project will investigate for the best design layout (connection topology); to size the system elements appropriately; to design different models and simulate for the different power management strategies (PMS) which are defined for the system of the HPSs, which consists of renewable energy sources (PV-arrays and wind generator), conventional backup energy source (diesel engine generator) and energy storage bank (battery bank) to sustainably and efficiently satisfy the energy demand of remote site.

Standalone hybrid generation system for the remote area of Thar, Pakistan
108
In this paragraph a brief review of some of the published work on the hybrid generating systems. Reference [1, 2] presents a hybrid configuration comprising of a wind–diesel system originally developed by the Hydro-Quebec, aimed at reducing the cost of electricity supply in remote areas. The two main blocks of the system presented are, diesel- driven synchronous generator and the wind turbine driven by the asynchronous (induction) generator. The wind turbine block uses a 2-dimensional lookup table to compute the turbine torque output as a function of wind speed and turbine speed. At low wind speeds both the induction generator and the diesel-driven synchronous generator are required to feed the load. When the wind power exceeds the load demand, it is possible to shut down the diesel-generator. In this all-wind mode, the synchronous machine is used as a synchronous condenser and its excitation system controls the grid voltage at its nominal value. A secondary load bank is used to regulate the system frequency by absorbing the wind power exceeding consumer demand. In comparison to the system the system proposed here will be more reliable and economical to provide electricity to the remote areas as it include other renewable resources as well hence system will not only depend on wind energy and fossil fuel to run the system, in most of the cases when there is no enough wind energy the system uses sun irradiation to store the electricity to the batteries. [4] While if both of the resources is not available and consumer load requirement is high the system can use diesel generator to charge the batteries and also to provide electricity hence use of Genset will be less making it more economical and environment friendly system and also in the published design the system is using mixed coupling system which is more complicated and requires more DC and AC links hence make it more costly as well while In my project I will be adopting DC coupled topology to make it simple and also DC coupled are more efficient then AC, below is the block diagram of the published system design.
[1] In the literature, most of the models used to represent a wind turbine are based on a non-linear relationship between rotor power coefficient and linear tip speed of the rotor blade [1, 4] Muljadi and Butterfield mention the advantages of employing a variable speed wind turbine and present a model of it with pitch control. In his model, during low to medium wind speeds, the generator and the power converter control the wind turbine to maximize the energy capture by maintaining the rotor speed at a predetermined optimum value. For high wind speeds the wind turbine is controlled to maintain the aerodynamic power produced by the wind turbine either by pitch control or by generator load control. However, generator load control in the high wind regions, in some cases suffers from the disadvantage of exceeding the rated current values of the stator windings of the generator. Care should be taken not to exceed the rated values of the current.

Standalone hybrid generation system for the remote area of Thar, Pakistan
109
[3] [5] The same principle will be adopted in the system proposed here for the wind turbine but this will also include the Maximum power point tracking (MPPT) for the PV panel to extract the maximum energy sun, this will be make the system power electronics more complicated but the efficiency of the system can be increased by 30-40% and also in all the new system MPPT technology is used as it significantly increases the efficiency of the system with little increase in the capital cost of the system which in long run make the system more economical and efficient.
Block diagram of the system
[8]
Flow chart of the system
[8]

Standalone hybrid generation system for the remote area of Thar, Pakistan
110
Work Breakdown Structure
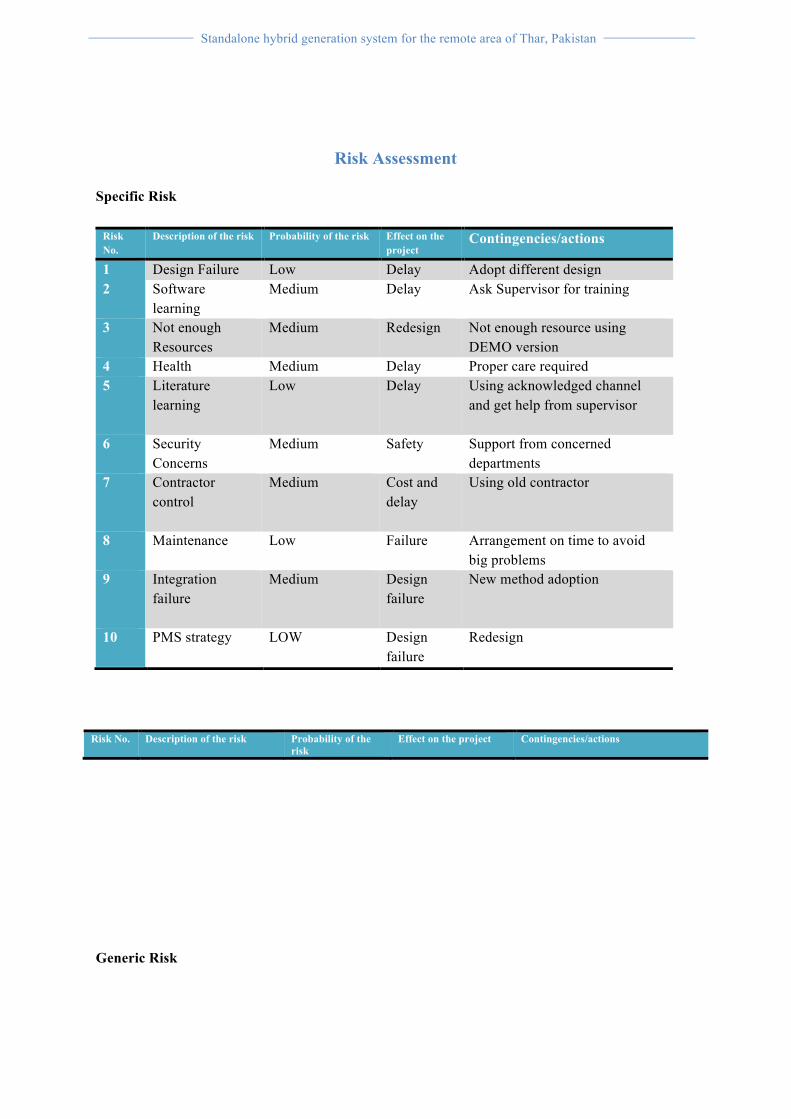
Standalone hybrid generation system for the remote area of Thar, Pakistan
111
Risk Assessment Specific Risk
Generic Risk
Risk No.
Description of the risk Probability of the risk Effect on the project
Contingencies/actions
1 Design Failure Low Delay Adopt different design 2 Software
learning Medium Delay Ask Supervisor for training
3 Not enough Resources
Medium Redesign Not enough resource using DEMO version
4 Health Medium Delay Proper care required 5
Literature learning
Low
Delay
Using acknowledged channel and get help from supervisor
6 Security Concerns
Medium Safety Support from concerned departments
7
Contractor control
Medium
Cost and delay
Using old contractor
8 Maintenance Low Failure Arrangement on time to avoid big problems
9 Integration failure
Medium
Design failure
New method adoption
10 PMS strategy LOW Design failure
Redesign
Risk No. Description of the risk Probability of the risk
Effect on the project Contingencies/actions

Standalone hybrid generation system for the remote area of Thar, Pakistan
112
References
1. M.F.Gillie and W.E.Leithead “Operation and regulation of Hybrid Generation system,” in 17th intl. conf. Electricity Dist., Barcelona, May 20003.
2. J. F. Baalbergen, "System design and power management of a generator-set with energy storage for a 4Q drive," in Electrical Power Engineering, MSc: Delft University of Technology, October 2007.
3. Eduard Muljadi and C. P. Butterfield, “Pitch-controlled variable-speed wind turbine generation,” IEEE Transactions on Industry Applications, vol. 37, no. 1, pp. 240-246, Jan/Feb 2001.
4. J.F. Manwell, J.G. McGowan and A.L. Rogers, Wind energy Explained – Theory, Design and application, John Wiley& Sons, 2002, ch. 7.
5. Osama Omari, Egon Ortjohann, Alaa Mohd, and Danny Morton, "An Online Control Strategy for DC Coupled Hybrid Power Systems," in 2007 IEEE Power Engineering Society General Meeting, Tampa, FL, 23 July- 2007, pp. 1 - 8, ISSN:1932-5517, ISBN:1-4244-1298.
6. N. Phuangpornpitak and S. Kumar, "PV hybrid systems for rural electrification in Thiland," Renewable and Sustainable Energy Reviews, ScienceDirect, vol. 11, Iss. 7, pp. 1530-1543, September 2007.
7. Ahmed Agus Setiawan, Yu Zhao, Rob Susanto-Lee, and Chem. V. Nayar, "Design, economic analysis and environmental considerations of mini-grid hybrid power system with reverse Osmosis desalination plant for remote areas," Renewable Energy-Elsevier, vol. 34, Iss.2, pp. 374-383, February 2009.
8. N. Rapapate and Ö. Göl, "Hybrid generation system for rural electrification in Thailand,"http://www.icrepq.com/icrepq07/352-Rapapate.pdf.
9. IEEE, "IEEE Guide for Array and Battery Sizing in Stand-Alone Photovoltaic (PV) Systems." vol. IEEE Std 1562™-2007 New York, USA, 12 May 2008.
1 Health Medium Delay Proper care required 2 Computer issues Medium Delay Check required frequently
3 University serve issues High Delay Plan accordingly 4 Summer Holidays Medium Delay Get help from Supervisor
5 Environmental Low Delay Health and safety measures.
6 Community disruption Low Delay Marketing and Awareness 7 Act of GOD Medium Budget and Delay Ready for any situation

Standalone hybrid generation system for the remote area of Thar, Pakistan
113
Related Documents