Stakeholders’ Education | Corporate Governance Research | Corporate Governance Score | Proxy Advisory STAKEHOLDERS EMPOWERMENT SERVICES 1 | P AGE SECTOR: TEXTILES REPORTING DATE: 31 ST MAY, 2016 Gangotri Textiles Ltd www.gangotritextiles.com Gangotri Textiles Ltd 31 st May, 2016 TABLE 1 - MARKET DATA (STANDALONE) (As on 27 th May, 2016) NSE Code - GANGOTRI NSE Market Price (₹) 1.30 NSE Market Cap. (₹ Cr.) 4.24 Sector - Textiles Face Value (₹) 5.00 Equity (₹ Cr.) 16.31 52-week High/Low (₹) 1.95/0.80 Net worth (₹ Cr.) -196.60 Business Group - Indian Private TTM P/E N.A. Traded Volume (Shares) 200 Year of Incorporation - 1989 TTM P/BV N.A. Traded Volume (lacs) 0.00 Source - Capitaline Corporate Office: COMPANY BACKGROUND 25, 25 A Venkatachalam Co-op Colony, Gangotri Textiles Ltd is a vertically integrated textile unit. The company is engaged in recycling of waste, open-end spinning, ring spinning, weaving, processing and garments manufacturing. The company have world class in - house facilities from processing yarn to manufacture of finished garments. The company's production facilities are located at Coimbatore, Maharashtra, Dindigul and Erode. The company's products include cotton yarn, elastic yarn and specialty yarn, fabric and readymade garments for men. Their garments are marketed under the brands Tibre, Fugo and E Gen. Gangotri Textiles Ltd was incorporated on July 26, 1989 as a private limited company with the name Gangotri Textiles Pvt Ltd. The company was promoted by the Manoj Kumar Tibrewal. Initially, the company started their business as waste-cotton re-cycler and trader in the late 1980s in Kolkata. In the year 1989, the company was formally incorporated. In January 1993, the company was converted into public limited company and the name was changed to Gangotri Textiles Ltd. R. S. Puram, Coimbatore – 641 002, Tamil Nadu Company Website: www.gangotritextiles.com TABLE 2 - PRICE PERFORMANCE 27 th May, 2016 25 th May, 2015 29 th May, 2014 % Change CAGR for 2 years 2016 vs 2015 2015 vs 2014 Price (₹) 1.30 1.25 0.85 4.00% 47.06% 23.67% Trading Volume (Shares) (yearly avg.) 1,800 2,336 1,078 -22.93% 116.77% - NSE Market Cap. (in ₹ Cr.) 4.24 4.08 2.77 3.92% 47.29% 23.72% Source - Money Control SEBI ORDER IN THE MATTER OF GANGOTRI TEXTILES LTD. SEBI has passed on order dated 13 th April, 2016 restraining the following entities from accessing the securities market: Sl. No. Entity PAN Period 1 Mr. Purshottam Khandelwal ADZPK9831B 5 years 2 Ms. Sunita Gupta AAHPG4700E 3 years 3 Cosmo Corporate Services Ltd. AAACC3529P 5 years 4 Master Finlease Ltd AAACM6050D 5 years 5 Avisha Credit Capital Ltd. AAACA5715D 1 year 6 Vishvas Projects Ltd. AAACM2047A 1 year

Welcome message from author
This document is posted to help you gain knowledge. Please leave a comment to let me know what you think about it! Share it to your friends and learn new things together.
Transcript
Stakeholders’ Education | Corporate Governance Research | Corporate Governance Score | Proxy Advisory
STAKEHOLDERS EMPOWERMENT SERVICES
1 | P A G E
SECTOR: TEXTILES REPORTING DATE: 31ST MAY, 2016
Gangotri Textiles Ltd www.gangotritextiles.com
Gangotri Textiles Ltd 31st May, 2016 TABLE 1 - MARKET DATA (STANDALONE) (As on 27th May, 2016)
NSE Code - GANGOTRI NSE Market Price (₹) 1.30 NSE Market Cap. (₹ Cr.) 4.24
Sector - Textiles Face Value (₹) 5.00 Equity (₹ Cr.) 16.31
52-week High/Low (₹) 1.95/0.80 Net worth (₹ Cr.) -196.60
Business Group - Indian Private TTM P/E N.A. Traded Volume (Shares) 200
Year of Incorporation - 1989 TTM P/BV N.A. Traded Volume (lacs) 0.00
Source - Capitaline
Corporate Office: COMPANY BACKGROUND
25, 25 A Venkatachalam Co-op
Colony, Gangotri Textiles Ltd is a vertically integrated textile unit. The company is engaged in
recycling of waste, open-end spinning, ring spinning, weaving, processing and
garments manufacturing. The company have world class in - house facilities from
processing yarn to manufacture of finished garments. The company's production
facilities are located at Coimbatore, Maharashtra, Dindigul and Erode. The company's
products include cotton yarn, elastic yarn and specialty yarn, fabric and readymade
garments for men. Their garments are marketed under the brands Tibre, Fugo and E
Gen. Gangotri Textiles Ltd was incorporated on July 26, 1989 as a private limited
company with the name Gangotri Textiles Pvt Ltd. The company was promoted by the
Manoj Kumar Tibrewal. Initially, the company started their business as waste-cotton
re-cycler and trader in the late 1980s in Kolkata. In the year 1989, the company was
formally incorporated. In January 1993, the company was converted into public limited
company and the name was changed to Gangotri Textiles Ltd.
R. S. Puram,
Coimbatore – 641 002, Tamil Nadu
Company Website:
www.gangotritextiles.com
TABLE 2 - PRICE PERFORMANCE
27th May,
2016
25th May,
2015
29th May,
2014
% Change CAGR for
2 years 2016 vs 2015 2015 vs 2014
Price (₹) 1.30 1.25 0.85 4.00% 47.06% 23.67%
Trading Volume (Shares)
(yearly avg.) 1,800 2,336 1,078 -22.93% 116.77% -
NSE Market Cap. (in ₹ Cr.) 4.24 4.08 2.77 3.92% 47.29% 23.72%
Source - Money Control
SEBI ORDER IN THE MATTER OF GANGOTRI TEXTILES LTD.
SEBI has passed on order dated 13th April, 2016 restraining the following entities from accessing the securities market:
Sl. No. Entity PAN Period
1 Mr. Purshottam Khandelwal ADZPK9831B 5 years
2 Ms. Sunita Gupta AAHPG4700E 3 years
3 Cosmo Corporate Services Ltd. AAACC3529P 5 years
4 Master Finlease Ltd AAACM6050D 5 years
5 Avisha Credit Capital Ltd. AAACA5715D 1 year
6 Vishvas Projects Ltd. AAACM2047A 1 year

Stakeholders’ Education | Corporate Governance Research | Corporate Governance Score | Proxy Advisory
STAKEHOLDERS EMPOWERMENT SERVICES
2 | P A G E
SECTOR: TEXTILES REPORTING DATE: 31ST MAY, 2016
Gangotri Textiles Ltd www.gangotritextiles.com
TABLE 3 - FINANCIALS
(₹ Cr.) 2015 2014 2013 % Change CAGR for
2 years 2015 vs 2014 2014 vs 2013
Turnover 74.35 80.84 86.63 -8.03% -6.68% -7.36%
Net Worth -196.60 -132.41 -77.50 N.A. N.A. N.A.
Current Assets 14.56 25.26 41.91 -42.36% -39.73% -41.06%
Non-Current Assets 177.47 231.80 255.94 -23.44% -9.43% -16.73%
Total Assets 192.03 257.06 297.86 -25.30% -13.70% -19.71%
Investments 15.29 19.52 19.56 -21.67% -0.20% -11.59%
Finance Cost 29.32 27.93 31.35 4.98% -10.91% -3.29%
Long Term Liabilities 18.35 18.27 31.98 0.44% -42.87% -24.25%
Current Liabilities 370.28 371.20 343.38 -0.25% 8.10% 3.84%
Profit After Tax (PAT, ₹ Cr.) -45.93 -54.73 -108.45 N.A. N.A. N.A.
EPS (₹) -16.00 -19.00 -35.00 N.A. N.A. N.A.
P/E Ratio 74.35 80.84 86.63 N.A. N.A. N.A.
Source - Money Control/Annual Report
Discussion as per Company: The Company mentioned in Annual Report for FY 2014-15 that, the company has effected Yarn
turnover of ₹ 43.16 crores as against a turnover of ₹ 45.93 crores previous year. Similarly, the Company has effected Garments
turnover of ₹ 23.04 crores as against a turnover of ₹ 19.22 crores previous year. During the year under review, the performance
of the company was below possible level due to insufficient Working Capital facility and the overall recession prevailed in the
Textile Industry. With the limited resources available, the company found it extremely difficult to run all the units. At the same
time, it was felt not advisable to close one or more Units and the assets are to be maintained in a good condition at least to get a
good price for that matter.
The total outstanding dues to the consortium of Lenders as on 31st March, 2015 including interest accrued is ₹ 3,651.70 crores.
During the previous year the company has requested the Lenders to defer the sale of remaining two Wind Mills since the
disposal of Windmills would directly affect the operations of the remaining units including the garment production. This would
result in loss of production as well as underutilization of manpower. Sale of Windmill should not be seen in isolation and instead
it should be seen as a facilitator of for running the other units. However, the Lenders have sold the remaining two Wind Mills on
6th November, 2014 for a total consideration of ₹ 136.30 crores. This will have serious impact on the working of the company
and the full impact will be felt in the coming years.

Stakeholders’ Education | Corporate Governance Research | Corporate Governance Score | Proxy Advisory
STAKEHOLDERS EMPOWERMENT SERVICES
3 | P A G E
SECTOR: TEXTILES REPORTING DATE: 31ST MAY, 2016
Gangotri Textiles Ltd www.gangotritextiles.com
AUDIT QUALIFICATIONS
Audit Qualifications in last 3 years: The Auditors have made similar qualification in last 3 years.
The Auditors on the basis for Qualified Opinion have mentioned that:
In our opinion, there prevails material uncertainty related to events /conditions which individually/ collectively
cast significant doubts on going concern assumption.
The Debtors and Loans & Advances are Subject to confirmation. As at advance of ₹ 4.23 crores continues to be
doubtful of recovery, the same has been provided for in the accounts of the company during year ended 31st March,
2014. However, repeated reminders are being received from lenders for the recovery or the same.
The interest provisions for all loans from Banks have been worked based on the than prevailing CDR Package and
not on the original sanction/revised floating rates. Consequent to the company's non-compliance with CDR package
and reverting back to the original sanction, the differentials Interest that ought to have been provided for in the
accounts is estimated at ₹ 103.00 Crores (from 01st July, 2008 to 31st March, 2015) cumulatively for the above periods.
The estimated loss due to the above is understated to the extent or ₹ 18.00 crores for the year Ended 31st March,
2015.
On examination or the books of accounts and the Information and explanations given to us, the Internal control
system continue to be not commensurate considering the nature of company's business.
The Company has been adopting the method of Accounting for also NETTING of balance when transactions are made
with the same party. For the year ended 31st March, 2015 the company has NETTED the debit and credit balances of
the same party. Hence, Debtors and Creditors have got reduced by ₹ 37.59 Crores each as on 31st March, 2015.
The State Bank or India vide its letter dated the 24th April, 2015 has declared company as wilful defaulters and has
given an opportunity to the company to submit Its representation nature of company's business.
The balances shown under Secured Loans and Balances with bank, confirmation of balance Is yet to be given
by the Bankers. Hence, the balances reflected under these two heads are as par the books of account of the
company.
Management explanation: The Company has mention in the AR for FY 2014-15 that the qualification/observation by Statutory
Auditors are self-explanatory.
As a good governance practice, the Company should explain/comment on each qualification.
Response Comment
Frequency of Qualifications - The above mentioned qualifications have been raised in last three years’
annual reports.
Have the auditors made any
adverse remark in last 3 years? No -

Stakeholders’ Education | Corporate Governance Research | Corporate Governance Score | Proxy Advisory
STAKEHOLDERS EMPOWERMENT SERVICES
4 | P A G E
SECTOR: TEXTILES REPORTING DATE: 31ST MAY, 2016
Gangotri Textiles Ltd www.gangotritextiles.com
TABLE 4: BOARD PROFILE (As on 31st March, 2015)
Regulatory norms Company
% of Independent Directors on the Board 50% 22%
% of Promoter Directors on the Board - 22%
Number of Women Directors on the Board At least 1 1
Classification of Chairman of the Board - Not Disclosed
Is the post of Chairman and MD/CEO held by the same person? - -
Average attendance of Directors in the Board meetings (%) - 91.30%
Source - Money Control/Annual Report
Composition of Board: As per Regulation 17(i)(b) of the Listing Regulations, 2015, the Company should have at least 50%
Independent Directors as the Company has not disclosed the Chairman of the Board. The Company as on 31st March, 2015 has
22% of Independent Directors and hence, does not meet the regulatory requirement.
Board Diversity: The Company has 9 directors out of which 8 are male and 1 is female as on 31st March, 2015. The Company is
compliant with the Listing Regulations, 2015 regarding the requirement of at least one-woman director.
TABLE 5 - FINANCIAL RATIOS
Ratios 2015 2014 2013
% Change
2015 vs
2014
2014 vs
2013
Turn
ove
r
Rat
ios
Inventory Turnover 8.59 6.50 7.10 32.01% -8.34%
Debtors Turnover 19.41 10.57 3.74 83.70% 182.63%
Fixed asset Turnover 0.42 0.35 0.34 20.13% 3.03%
Current Asset Turnover 5.11 3.20 2.07 59.56% 54.83%
Ret
urn
Rat
ios Operating Profit Margin -66.56% -55.32% -62.46% N.A. N.A.
Net Profit Margin -61.78% -67.70% -125.19% N.A. N.A.
Return on Assets (ROA) -23.92% -21.29% -36.41% N.A. N.A.
Return on Equity (ROE) N.A. N.A. N.A. N.A. N.A.
Return on Capital Employed (ROCE) N.A. N.A. N.A. N.A. N.A.
Liq
uid
ity
Rat
ios
Current Ratio 0.04 0.07 0.12 -42.22% -44.25%
Quick Ratio 0.02 0.03 0.09 -53.90% -60.04%
Cash Ratio 0.01 0.01 0.02 -59.94% -26.62%
Working Capital Turnover ratio N.A. N.A. N.A. N.A. N.A.
Solv
ency
Rat
ios Debt to equity ratio N.A. N.A. N.A. N.A. N.A.
Interest Coverage Ratio N.A. N.A. N.A. N.A. N.A.
Trad
ing
Rat
ios
Market Cap / Sales 0.06 0.05 0.05 8.73% 7.16%
Market Cap/ Net Worth N.A. N.A. N.A. N.A. N.A.
Market Cap/PAT N.A. N.A. N.A. N.A. N.A.
Market Cap/EBITDA 29.16 27.77 N.A. 4.99% N.A.
Trading Volume (shares) (avg. of 1 year) 1,705 2,306 1,141 -26.04% 102.15%
Trading Volume (shares) (high in 1 year) 20,000 51,000 12,150 -60.78% 319.75%
Trading Volume (shares) (low in 1 year) 1.00 2.00 1.00 -50.00% 100.00%
Ratio - High/low trading volume 20,000.00 25,500.00 12,150.00 -21.57% 109.88%
Ratio - High/average trading volume 11.73 22.12 10.65 -46.98% 107.65%
Source - Money Control
Stakeholders’ Education | Corporate Governance Research | Corporate Governance Score | Proxy Advisory
STAKEHOLDERS EMPOWERMENT SERVICES
5 | P A G E
SECTOR: TEXTILES REPORTING DATE: 31ST MAY, 2016
Gangotri Textiles Ltd www.gangotritextiles.com
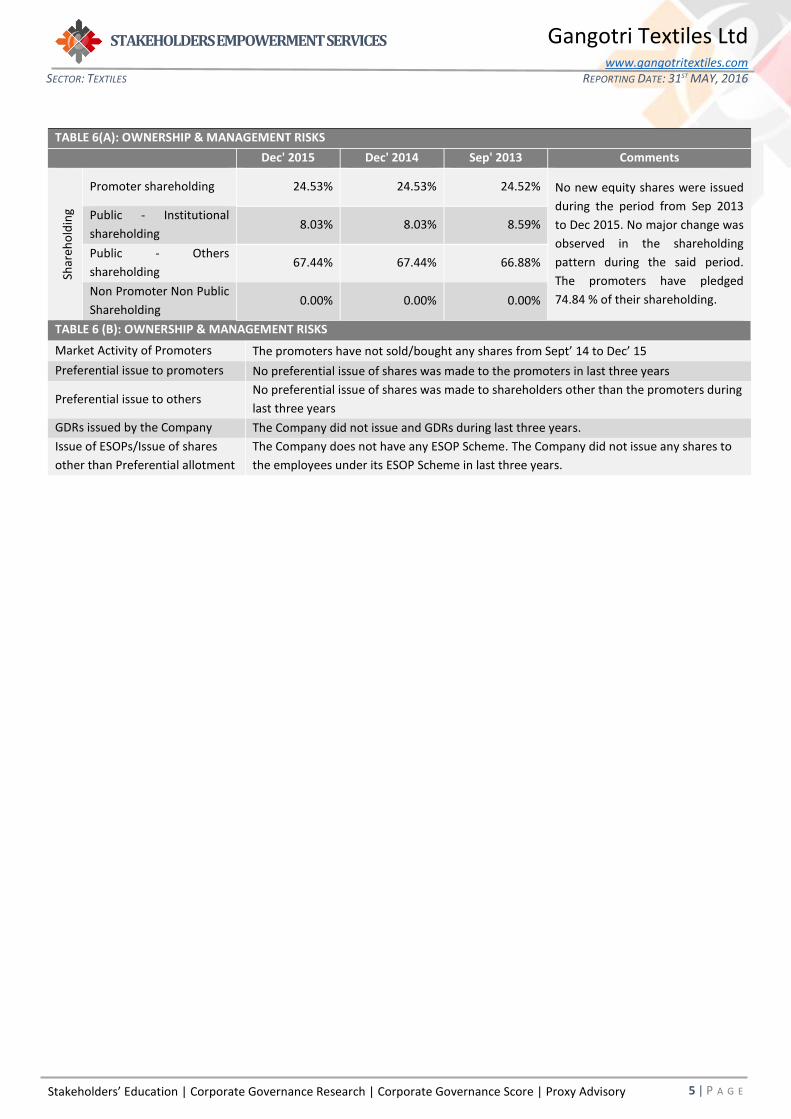
TABLE 6(A): OWNERSHIP & MANAGEMENT RISKS
Dec' 2015 Dec' 2014 Sep' 2013 Comments
Shar
eho
ldin
g
Promoter shareholding 24.53% 24.53% 24.52% No new equity shares were issued
during the period from Sep 2013
to Dec 2015. No major change was
observed in the shareholding
pattern during the said period.
The promoters have pledged
74.84 % of their shareholding.
Public - Institutional
shareholding 8.03% 8.03% 8.59%
Public - Others
shareholding 67.44% 67.44% 66.88%
Non Promoter Non Public
Shareholding 0.00% 0.00% 0.00%
TABLE 6 (B): OWNERSHIP & MANAGEMENT RISKS
Market Activity of Promoters The promoters have not sold/bought any shares from Sept’ 14 to Dec’ 15
Preferential issue to promoters No preferential issue of shares was made to the promoters in last three years
Preferential issue to others No preferential issue of shares was made to shareholders other than the promoters during
last three years
GDRs issued by the Company The Company did not issue and GDRs during last three years.
Issue of ESOPs/Issue of shares
other than Preferential allotment
The Company does not have any ESOP Scheme. The Company did not issue any shares to
the employees under its ESOP Scheme in last three years.

Stakeholders’ Education | Corporate Governance Research | Corporate Governance Score | Proxy Advisory
STAKEHOLDERS EMPOWERMENT SERVICES
6 | P A G E
SECTOR: TEXTILES REPORTING DATE: 31ST MAY, 2016
Gangotri Textiles Ltd www.gangotritextiles.com
Glossary
Equity: The equity shares capital of the Company
Net Worth: The amount by which the Assets exceeds the liabilities excluding shareholders’ funds of the Company
Turnover: The revenue earned from the operations of the Company
EPS: Earning Per Share is net profit earned by the Company per share
𝐸𝑃𝑆 =Profit After Tax
Number of outstanding shares
P/E ratio: It is the ratio of the Company’s share price to earnings per share of the Company
𝑃/𝐸 𝑟𝑎𝑡𝑖𝑜 =Price of each share
Earnings per share
Current Assets: Cash and other assets that are expected to be converted to cash in one year
Fixed Assets: assets which are purchased for long-term use and are not likely to be converted quickly into cash, such as land,
buildings, and equipment
Total Assets: Current Assets + Fixed Assets
Investments: An investment is an asset or item that is purchased with the hope that it will generate income or appreciate in the
future.
Finance Cost: The Financing Cost (FC), also known as the Cost of Finances (COF), is the cost and interest and other charges
incurred during the year in relation to borrowed money.
Long Term Liabilities: Long-term liabilities are liabilities with a maturity period of over one year.
Current Liabilities: A company's debts or obligations that are due within one year.
Inventory Turnover ratio: Inventory Turnover is a ratio showing how many times a company's inventory is sold and replaced over
a period.
𝐼𝑛𝑣𝑒𝑛𝑡𝑜𝑟𝑦 𝑇𝑢𝑟𝑛𝑜𝑣𝑒𝑟 𝑟𝑎𝑡𝑖𝑜 =Sales Turnover
Inventory
Debtors Turnover: Accounts receivable turnover is an efficiency ratio or activity ratio that measures how many times a business
can turn its accounts receivable into cash during a period
𝐷𝑒𝑏𝑡𝑜𝑟𝑠 𝑇𝑢𝑟𝑛𝑜𝑣𝑒𝑟 𝑟𝑎𝑡𝑖𝑜 =Sales Turnover
Accounts recievables
Fixed Asset Turnover: The fixed-asset turnover ratio is a financial ratio of net sales to fixed assets
𝐹𝑖𝑥𝑒𝑑 𝐴𝑠𝑠𝑒𝑡 𝑇𝑢𝑟𝑛𝑜𝑣𝑒𝑟 𝑟𝑎𝑡𝑖𝑜 =Sales Turnover
Fixed Assets
Current Asset Turnover: The current-asset turnover ratio is a financial ratio of net sales to fixed assets
𝐶𝑢𝑟𝑟𝑒𝑛𝑡 𝐴𝑠𝑠𝑒𝑡 𝑇𝑢𝑟𝑛𝑜𝑣𝑒𝑟 𝑟𝑎𝑡𝑖𝑜 =Sales Turnover
Current Assets

Stakeholders’ Education | Corporate Governance Research | Corporate Governance Score | Proxy Advisory
STAKEHOLDERS EMPOWERMENT SERVICES
7 | P A G E
SECTOR: TEXTILES REPORTING DATE: 31ST MAY, 2016
Gangotri Textiles Ltd www.gangotritextiles.com
Operating Profit Margin: Operating margin is a measurement of what proportion of a Company’s revenue is left over after
paying for variable costs of production such as wages, raw materials etc. It can be calculated by dividing a Company’s operating
income (also known as “operating profit”) during a given period by its sales during the same period.
𝑂𝑝𝑒𝑟𝑎𝑡𝑖𝑛𝑔 𝑃𝑟𝑜𝑓𝑖𝑡 𝑀𝑎𝑟𝑔𝑖𝑛 =Operating profit
Sales Turnover
Net Profit Margin: Net profit margin is the percentage of revenue left after all expenses have been deducted from sales
𝑁𝑒𝑡 𝑃𝑟𝑜𝑓𝑖𝑡 𝑀𝑎𝑟𝑔𝑖𝑛 =Net profit
Sales Turnover
Return on Assets: ROA tells you what earnings were generated from invested capital (assets)
𝑅𝑒𝑡𝑢𝑟𝑛 𝑜𝑛 𝐴𝑠𝑠𝑒𝑡𝑠 =Net profit
Total Assets
Return on equity/net worth: return on equity (ROE) is the amount of net income returned as a percentage of shareholders’
equity.
𝑅𝑒𝑡𝑢𝑟𝑛 𝑜𝑛 𝐸𝑞𝑢𝑖𝑡𝑦 =Net profit
Net worth
Return on Capital Employed: Return on capital employed (ROCE) is a financial ratio that measures a company's profitability
and the efficiency with which its capital is employed.
𝑅𝑒𝑡𝑢𝑟𝑛 𝑜𝑛 𝐶𝑎𝑝𝑖𝑡𝑎𝑙 𝐸𝑚𝑝𝑙𝑜𝑦𝑒𝑑 =Net profit
Total Debt + Equity share capital
Current ratio: The current ratio is a financial ratio that measures whether or not a firm has enough resources to pay its debts
over the next 12 months. It compares a firm's current assets to its current liabilities.
𝐶𝑢𝑟𝑟𝑒𝑛𝑡 𝑟𝑎𝑡𝑖𝑜 =Current Assets
Current Liabilities
Quick ratio: The quick ratio is a measure of how well a Company can meet its short term financial liabilities.
𝑄𝑢𝑖𝑐𝑘 𝑟𝑎𝑡𝑖𝑜 =Current Assets − Inventories
Current Liabilities
Cash ratio: The ratio of the liquid assets of a Company to its current liabilities.
𝑄𝑢𝑖𝑐𝑘 𝑟𝑎𝑡𝑖𝑜 =Current Assets − Inventories − Account Recievables
Current Liabilities
Working Capital Turnover ratio: The working capital turnover ratio is also referred to as net sales to working capital. It indicates a
Company's effectiveness in using its working capital.
𝑊𝑜𝑟𝑘𝑖𝑛𝑔 𝐶𝑎𝑝𝑖𝑡𝑎𝑙 𝑇𝑢𝑟𝑛𝑜𝑣𝑒𝑟 𝑟𝑎𝑡𝑖𝑜 =𝑆𝑎𝑙𝑒𝑠 𝑇𝑢𝑟𝑛𝑜𝑣𝑒𝑟
Current Assets − Current Liabilities
Debt to Equity ratio: The debt-to-equity ratio (D/E) is a financial ratio indicating the relative proportion of
shareholders' equity and debt used to finance a company's assets.
𝐷𝑒𝑏𝑡 𝑡𝑜 𝐸𝑞𝑢𝑖𝑡𝑦 𝑟𝑎𝑡𝑖𝑜 =𝑆ℎ𝑜𝑟𝑡 𝑇𝑒𝑟𝑚 𝐷𝑒𝑏𝑡 + 𝐿𝑜𝑛𝑔 𝑇𝑒𝑟𝑚 𝐷𝑒𝑏𝑡
𝑁𝑒𝑡 𝑊𝑜𝑟𝑡ℎ
Interest Coverage ratio: The Interest coverage ratio is a debt ratio and profitability ratio used to determine how easily a
Company can pay interest on outstanding debt.
𝐼𝑛𝑡𝑒𝑟𝑒𝑠𝑡 𝐶𝑜𝑣𝑒𝑟𝑎𝑔𝑒 𝑅𝑎𝑡𝑖𝑜 =𝐸𝑎𝑟𝑛𝑖𝑛𝑔 𝐵𝑒𝑓𝑜𝑟𝑒 𝐼𝑛𝑡𝑒𝑟𝑒𝑠𝑡 𝑎𝑛𝑑 𝑇𝑎𝑥
𝐹𝑖𝑛𝑎𝑛𝑐𝑒 𝐶𝑜𝑠𝑡

Stakeholders’ Education | Corporate Governance Research | Corporate Governance Score | Proxy Advisory
STAKEHOLDERS EMPOWERMENT SERVICES
8 | P A G E
SECTOR: TEXTILES REPORTING DATE: 31ST MAY, 2016
Gangotri Textiles Ltd www.gangotritextiles.com
Market Cap/Sales ratio: Market Cap/sales ratio, Price–sales ratio, P/S ratio, or PSR, is a valuation metric for stocks. It is calculated
by dividing the company's market cap by the revenue in the most recent year; or, equivalently, divide the per-share stock price by
the per-share revenue.
𝑀𝑎𝑟𝑘𝑒𝑡 𝐶𝑎𝑝/𝑆𝑎𝑙𝑒𝑠 𝑟𝑎𝑡𝑖𝑜 =𝑀𝑎𝑟𝑘𝑒𝑡 𝐶𝑎𝑝
𝑆𝑎𝑙𝑒𝑠 𝑇𝑢𝑟𝑛𝑜𝑣𝑒𝑟
Market Cap/ Net Worth ratio: It is a valuation ratio calculated by dividing Company’s market cap to net worth.
𝑀𝑎𝑟𝑘𝑒𝑡 𝐶𝑎𝑝/𝑁𝑒𝑡𝑤𝑜𝑟𝑡ℎ 𝑟𝑎𝑡𝑖𝑜 =𝑀𝑎𝑟𝑘𝑒𝑡 𝐶𝑎𝑝
𝑁𝑒𝑡𝑤𝑜𝑟𝑡ℎ
Market Cap/ PAT ratio: It is a valuation ratio calculated by dividing Company’s market cap to net profit.
𝑀𝑎𝑟𝑘𝑒𝑡 𝐶𝑎𝑝/𝑃𝐴𝑇 𝑟𝑎𝑡𝑖𝑜 =𝑀𝑎𝑟𝑘𝑒𝑡 𝐶𝑎𝑝
𝑛𝑒𝑡 𝑝𝑟𝑜𝑓𝑖𝑡
Market Cap/ EBITDA ratio: It is a valuation ratio calculated by dividing Company’s market cap to EBITDA.
𝑀𝑎𝑟𝑘𝑒𝑡 𝐶𝑎𝑝/𝐸𝐵𝐼𝑇𝐷𝐴 𝑟𝑎𝑡𝑖𝑜 =𝑀𝑎𝑟𝑘𝑒𝑡 𝐶𝑎𝑝
𝐸𝐵𝐼𝑇𝐷𝐴
Trading Volume (shares) (avg. of 1 year): Average number of shares/day traded in 1 year
Trading volume (shares) (high in 1 year): Highest number of shares/day traded in 1 year
Trading volume (shares) (minimum in 1 year): Lowest number of shares traded on any one day in 1 year

Stakeholders’ Education | Corporate Governance Research | Corporate Governance Score | Proxy Advisory
STAKEHOLDERS EMPOWERMENT SERVICES
9 | P A G E
SECTOR: TEXTILES REPORTING DATE: 31ST MAY, 2016
Gangotri Textiles Ltd www.gangotritextiles.com
DISCLAIMER
Sources Company Information
Only publicly available data has been used while making the factsheet. Our
data sources include: BSE, NSE, SEBI, Capitaline, Moneycontrol, Businessweek,
Reuters, Annual Reports, IPO Documents and Company Website.
Analyst Certification
The analysts involved in development of this factsheet certify that no part of
any of the research analyst’s compensation was, is, or will be directly or
indirectly related to the contents of this factsheet.
Disclaimer
While SES has made every effort and has exercised due skill, care and diligence in compiling this factsheet based on publicly available information, it neither guarantees its accuracy, completeness or usefulness, nor assumes any liability whatsoever for any consequence from its use. This factsheet does not have any approval, express or implied, from any authority, nor is it required to have such approval. The users are strongly advised to exercise due diligence while using this factsheet.
This factsheet in no manner constitutes an offer, solicitation or advice to buy or sell securities, nor solicits votes or proxies on behalf of any party. SES, which is a not-for-profit Initiative or its staff, has no financial interest in the companies covered in this factsheet except what is disclosed on its website. The factsheet is released in India and SES has ensured that it is in accordance with Indian laws. Person resident outside India shall ensure that laws in their country are not violated while using this factsheet; SES shall not be responsible for any such violation.
All disputes subject to jurisdiction of High Court of Bombay, Mumbai.
SEBI Reg. No. INH000000016
This factsheet or any portion hereof may not
be reprinted, sold, reproduced or
redistributed without the written consent of
Stakeholders Empowerment Services
Contact Information
Stakeholders Empowerment Services
A 202, Muktangan,
Upper Govind Nagar,
Malad East,
Mumbai – 400 097
Tel +91 22 4022 0322
www.sesgovernance.com.
Research Analyst: Sumit Tank
Related Documents