UbD Stage 3 Mary Frances Pinson FRIT 7430: Instructional Design Stage 3, Understanding by Design Fall 2010

Welcome message from author
This document is posted to help you gain knowledge. Please leave a comment to let me know what you think about it! Share it to your friends and learn new things together.
Transcript

8/3/2019 Stage 3 Pinson Mary Frances
http://slidepdf.com/reader/full/stage-3-pinson-mary-frances 1/21
UbD Stage 3
Mary Frances Pinson
FRIT 7430: Instructional Design
Stage 3, Understanding by Design
Fall 2010
8/3/2019 Stage 3 Pinson Mary Frances
http://slidepdf.com/reader/full/stage-3-pinson-mary-frances 2/21
UbD Stage 3
Title of Unit Data Analysisand Probability
Grade Level 2nd Grade
Standard:Content Standards
Students will pose questions, collect, organize, and interpret data aboutthemselves and their surroundings.
M2D1: Students will create simple tables and graphs and interpret theirmeaning.
a. Create, organize and display data using pictographs, Venn diagrams, bargraphs, picture graphs, simple charts, and tables to record results with scalesof 1, 2 and 5.b. Know how to interpret picture graphs, Venn diagrams, and bar graphs.
Understandings:Students will understand that:
• Students will understand strategies when collecting and organizingdata. The more they use these strategies and re-tell how they came toparticular conclusions when creating, organizing, and displaying theirdata, they will build confidence in explaining their results.
• Students will be given opportunities to answer questions related to theirgraphs where they will have to interpret the data of their graphs andgive explanations from the results.
• Students will apply their knowledge and understanding of addition andsubtractions skills when interpreting and explaining data from graphsthey created.
• Students will create graphs that are relative to their lives to apply theirown experiences. Through this, students will gain understanding howgraphs can be relational through a variety of areas.
Related Misconceptions:
• In a tally chart or picture graph, there may be a key involved. Oftentimes, students will disregard the key and begin counting the marks orpictures and not use the strategies of skip counting when the tally or
pictures represent a different number besides the number one.
8/3/2019 Stage 3 Pinson Mary Frances
http://slidepdf.com/reader/full/stage-3-pinson-mary-frances 3/21
UbD Stage 3
Essential Questions:
Overarching Questions:
• How does the type of data thatis collected help in determiningthe type of graph to use?
• When would it be moreappropriate to use a bar graphover a pictograph? Why?
• Can the data that is collected
be interchangeable betweentally charts, bar graphs, andpictographs?
Topical Questions:
• In what classroom activities canwe collect data and organizethe data in a table or graph?
• What strategies do you usewhen collecting data?
Stage 3: Plan Learning Experiences
Week 1
Type week 1 activities here (use page 26 of the UbD text as anexample)Day 1:
1. Begin with an entry question. Ask the students, how do you stay organized?Write the student’s responses on chart paper. (H)
2. Introduce to the students that our new unit in math is about graphing andorganizing data. (W)
3. Administer the Pre-Assessment. The pre-assessment is 10 questions and willbe read to the students. It will cover what will be taught in the three-weekunit. (E-2)
4. After the pre-assessment, have a second piece of chart paper with a GraphingKWL chart (Know, Want to Know, Learned) across the top. (E-1)
5. Give each student two index cards.
6. Have each student write something that they know about graphing on one
index card. Have students share and tape their responses to the Know columnof the chart. (E-1)
7. On the second index card, have each student write something they want toknow about graphing. Have students share and tape their responses to theWant to Know column of the chart. (E-1)
a. Note: As the unit progresses, we will return to the KWL chart and moveindex cards from the Want to Know column to the Learned column.
8. To summarize, students will write down their personal goals for this unit.Goals will be saved for individual conferences. (R)

8/3/2019 Stage 3 Pinson Mary Frances
http://slidepdf.com/reader/full/stage-3-pinson-mary-frances 4/21
UbD Stage 3
9. After goals are written down, students will share with their neighbor.
Day 2:
1. Introduce the Essential Questions: (W)a. How can I use tables, charts, graphs, and diagrams to collect, organize,
and display data?b. In what classroom activities can we collect data and organize the data
in a table or graph?2. Highlight the Math Word Wall that will be a reference point throughout the
unit and used for Summarizing Activities.
3. Activator: Ask students to think of who their 1st grade teacher was.(H)
4. On the Active Board, list the five 1st grade teachers at our school and give asixth category marked “other” for students who did not attend our school in1st grade.
5. Ask students who his or her 1st grade teacher was and have them come tothe Active Board and place a mark in the row of their 1st grade teacher. (E-1)
6. After students have done this, show that what they made was a tally graph.
Explain that each mark that they made on the graph is called a tally. (E-1)7. Go through and emphasize the main parts of a tally graph. Vocabulary: Title,
Categories, and Tally.
8. Ask students what other categories could we make a tally graph as a class.(E-1)
9. Demonstrate how data of a tally graph can then be made into a bar graph. (E-1)
10. Create a bar graph using the same data from the tally graph. Highlightthe major parts of the bar graph. Vocabulary: Title, Scale, Categories, andBars. (E-1)
11. Summarize the lesson by having five students write one vocabularyword on the word wall. As they write the word on the wall, have them explainwhy that word is essential to charts and graphs. (R, E-2)
12. In the end, have the students tell their neighbor two things they learnedabout charts and graphs. (E-1, E-2)
Day 3:
1. Introduce the Essential Questions: (W)a. How can I use tables, charts, graphs, and diagrams to collect, organize,
and display data?b. In what classroom activities can we collect data and organize the data
in a table or graph?c. Can the data that is collected be interchangeable between tally charts,
bar graphs, and pictographs?2. Activator: Have the unlabeled tally graph from the day before on the ActiveBoard. Have students come up to the Active Board pointing the major parts of the tally graph. Do the same thing with a bar graph. (H)
3. Pass out to the students a two-page packet. The packet will include a blanktally graph page and bar graph page. The packet will match the flip chartsthat will be used in the day’s lesson.
4. Pull up the new flip chart on the Active Board. The new chart will have twelvecategories, each labeled with the months from January to December. It will be

8/3/2019 Stage 3 Pinson Mary Frances
http://slidepdf.com/reader/full/stage-3-pinson-mary-frances 5/21
UbD Stage 3
identical to the student packet. (E-1)
5. Ask each student the month of his or her birthday. Each student will thencome to the Active Board and place a tally mark in the proper row. (E-1, T)
6. As students are coming to the board to make their tally, students at their deskwill be filling in their tally chart in their packet. (E-1)
7.When complete, ask a student a good title for our tally graph. (E-1)
8. Then, pull up the blank bar graph flip chart on the Active Board. Havestudents take the data from their tally graph to make a class bar graph of student birthdays. (E-1, T)
9. As this is being done on the Active Board; students at their desk will completetheir bar graph in their packet. (E-1, T)
10. Introduce to students that we can take the data from tally graphs andbar graphs and create a pictograph. (E-1)
11. Pass out to students a cut out of a birthday cake. Have them write theirname and their birthday on the cut out. (E-1, T)
12.As students are writing, tape butcher paper to the board that has a pre-drawn/blank pictograph.
13. Have students come individually to the board to tape their birthdaycake to the pictograph. (E-1)
14. Highlight new vocabulary: Key. Have a student add this word to theword wall. (E-1, R)
15. Summarize: Compare and contrast Tally Graphs, Bar Graphs, andPictographs. (E-1, E-2)
Day 4:
1. Introduce the Essential Questions: (W)a. How can I use tables, charts, graphs, and diagrams to collect, organize,
and display data?b. In what classroom activities can we collect data and organize the data
in a table or graph?c. Can the data that is collected be interchangeable between tally charts,
bar graphs, and pictographs?
2. Activator: As a class, create a tally graph of Favorite Season using the ActiveBoard. (H)
3. Pass out a three-page packet with a blank tally graph, bar graph, andpictograph.
4. After completing the tally graph together, students with a partner will create abar graph and a pictograph using the data given. (E-1, T)
5. When finished, have two students come to the front of the room and explainhow they used the same data to interchangeably create a bar graph and a
pictograph. (E-1, R)6. Take the opportunity now to ask students what they thought was easy aboutcreating these graphs and what was difficult creating these graphs. (E-1, E-2)
7. Summarizer: Have students pair with a different student from their partnerearlier. Have the pair of students explain to one another the three types of graphs discussed so far. (R)
Day 5:

8/3/2019 Stage 3 Pinson Mary Frances
http://slidepdf.com/reader/full/stage-3-pinson-mary-frances 6/21
UbD Stage 3
1. Introduce the Essential Questions: (W)a. How can I use tables, charts, graphs, and diagrams to collect, organize,
and display data?b. In what classroom activities can we collect data and organize the data
in a table or graph?
2. Activator: Game- Hot Seat. Under three chairs, these students will have anindex card with a new vocabulary word to add to the word wall. (H)
3. The students with an index card will explain their word and add it to the wordwall. Vocabulary Words: Pictograph, Compare, Contrast. (H)
4. Take some time to review the previous words added to the word wall. (E-1)
5. Education City: This is an online teaching tool our school system haspurchased for the use in the classroom. It has activities for each grade levelthat students can play individually or as a whole group. The activities are incorrelation with state standards. (E-1, T)
6. Play the Education City game: Summer Fair. This activity has studentsinterpreting and creating tally graphs, bar graphs, and pictographs.
7. Summarizer: Refer back to the week’s Essential Questions. Go through each
question asking students how these EQ’s were answered through the week’sactivities. (R)
Week 2
Type week 2 activities here (use page 26 of the UbD text as an
example)Day 1:
1. Introduce the Essential Questions: (W)a. How can I use tables, charts, graphs, and diagrams to collect, organize,
and display data?b. In what classroom activities can we collect data and organize the data
in a table or graph?c. What is a Venn Diagram? How can a Venn Diagram be used to organize
data?
2. Activator- On a piece of chart paper, have a blank chart with three categories:1. Swings, 2. See Saw, and 3. Both. The title of the chart is FavoritePlayground Equipment. (H)
3. Ask students to think of their favorite piece of playground equipment.4. Individually, have students to write their name in one of the columns. (E-1)
5. When finished, ask students what conclusions can be drawn from the chart.(E-1)
6. Draw a Venn Diagram on the Active Board. Ask students if they have seen onebefore.
7. Explain the major parts of the Venn Diagram. Vocabulary: Title, Categories,Venn Diagram, Similarities, Differences, Compare, Contrast. (E-1)
8/3/2019 Stage 3 Pinson Mary Frances
http://slidepdf.com/reader/full/stage-3-pinson-mary-frances 7/21
UbD Stage 3
8. Present to the students how our data from our chart of favorite playgroundequipment can be used to create a Venn Diagram. (E-1)
9. Transfer data from the chart onto the Venn Diagram. (E-1)10.When finished, ask students what conclusion can be drawn from the diagram.
Ask which chart or diagram was easier to organize the data.
11.Give the students a piece of drawing paper. Have the students take the
data of the Venn Diagram and create a tally chart to represent the data. (E-1,T)
12. Have two or three students show their tally charts to the class. Havethem explain how they transferred data from the diagram to the tally chart.(E-2, T)
13. Summarize- Ask students what new vocabulary was taught in thelesson. As students state a new word, have the student write it on the wordwall. (E-2)
Day 2:
1. Introduce the Essential Questions: (W)a. How can I use tables, charts, graphs, and diagrams to collect, organize,
and display data?b. In what classroom activities can we collect data and organize the data
in a table or graph?c. What is a Venn Diagram? How can a Venn Diagram be used to organize
data?
2. Activator: Have a blank Venn Diagram on a piece of chart paper. (H)a. Game: Hot Seat. Six students will have an index card under their chair
with the words: Title, Category (2 cards), Similarities, and IndividualPreference (2 cards).
b. Students will look under their chair. The six students with the index
cards will label the Venn Diagram on the chart paper. As they labeleach section, they will explain the importance of that particular part of the diagram.
3. Pull the flip chart on the Active Board of a Venn Diagram. Our two categorieswill be Baseball and Basketball.
4. Complete as a whole group the Venn Diagram of the similarities anddifferences between Baseball and Basketball. (E-1)
5. Explain to the students it is their turn to create a Venn Diagram.
6. Split the students into twos. Give each student a piece of drawing paper witha pre-drawn Venn Diagram. (E-1, T)
7. The two categories will be each other’s names. (E-1)
8. The Venn Diagram will compare and contrast the pairs with teacher guidedquestions. (E-1, T)
9. When complete, allow time for the student pairs to share what they learnedwere the similarities and the differences between each other. (E-2, T)
a. NOTE- I will use the classroom ELMO to enlarge the group’s VennDiagram to allow the others to view it in a larger form.(T)
10. Summarizer: Have the students share with their partner which chart,graph, or diagram they like best. Tell them why. Students can take thisopportunity to make revisions tor their Venn Diagram if needed. (E-2, R)

8/3/2019 Stage 3 Pinson Mary Frances
http://slidepdf.com/reader/full/stage-3-pinson-mary-frances 8/21
UbD Stage 3
Day 3:
1. Introduce the Essential Questions: (W)a. How can I use tables, charts, graphs, and diagrams to collect, organize,
and display data?b. In what classroom activities can we collect data and organize the data
in a table or graph?c. What is a Venn Diagram? How can a Venn Diagram be used to organize
data?
2. Activator: Word Splash- On a half sheet of paper, students will have oneminute to write as many words they can think of when they think of chartsand graphs. (H)
3. Have students compare papers with their neighbors. Allow students to writenew and relevant words to the word wall.(E-2)
4. Explain to students that there will be times when three categories will becompared.
5. On the Active Board, pull up the flip chart of the 3-Circle Venn Diagram.Explain in detail the parts of the diagram. Highlight the three over lappingcircles. (E-1)
6. Use the 3-Circle Venn Diagram to create a class example.
7. The three categories will be: 1. Summer Waves, 2. Six Flags, and 3. WildAdventures. (E-1)
a. NOTE- these are local and state theme and or water parks.
8. Give students a sheet with a 2-Circle Venn Diagram. Have them create a 2-Circle diagram using two of the three categories of the class Venn Diagram.(E-1, R)
9. Summarizer- Have students share with their partner about the two categoriesthey used to create the 2-Cirlce Venn Diagram. (E-2, T, R)
Day 4:
1. Introduce the Essential Questions: (W)a. How can I use tables, charts, graphs, and diagrams to collect, organize,
and display data?b. In what classroom activities can we collect data and organize the data
in a table or graph?c. When would it be more appropriate to use a 2-Circle Venn Diagram
than a 3-Circle Venn Diagram? Why?
2. Activator: Show students a graphic organizer that compares students favoriteflavor of ice cream of vanilla, chocolate, or both. Ask the students which chart,graph, or diagram could they use to display this data. Why? (H)
3. On the Active Board, pull up the flip chart displaying the 3-Circle VennDiagram of the three theme/water park. (E-1)
4. Using the data shown in the diagram, give students a piece of writing paper.
5. Have students write the conclusions that can be drawn from the VennDiagram. (E-1)
6. When finished, have students pair together to proof read and comparewritings. (E-1, T, R)
8/3/2019 Stage 3 Pinson Mary Frances
http://slidepdf.com/reader/full/stage-3-pinson-mary-frances 9/21
UbD Stage 3
7. Have the pairs compare and contrast each other’s conclusions. (T, R)
8. Allow students to sit in the Author’s Chair and share their conclusions. (E-1)
9. Summarizer- Review the week’s Essential Questions. Ask students how theEQ’s were answered throughout the week’s lessons. (E-2, R)
Day 5:
1. 1. Introduce the Essential Questions: (W)a. How can I use tables, charts, graphs, and diagrams to collect, organize,
and display data?b. In what classroom activities can we collect data and organize the data
in a table or graph?c. When would it be more appropriate to use a 2-Circle Venn Diagram
than a 3-Circle Venn Diagram? Why?
2. Activator- Review the word wall. Allow students to add new words to the wallgiving an explanation as to why it should be added. (H)
3. Show What You Know Assessment- Students will have a 10 questionassessment covering Venn Diagrams. (E-2)
a. NOTE- Grades from this assessment will help drive instruction duringsmall groups the following week.
4. Summarizer- Ask students to share what they liked best and what they leastliked when using Venn Diagrams. Why? (E-2)
Week 3
8/3/2019 Stage 3 Pinson Mary Frances
http://slidepdf.com/reader/full/stage-3-pinson-mary-frances 10/21
UbD Stage 3
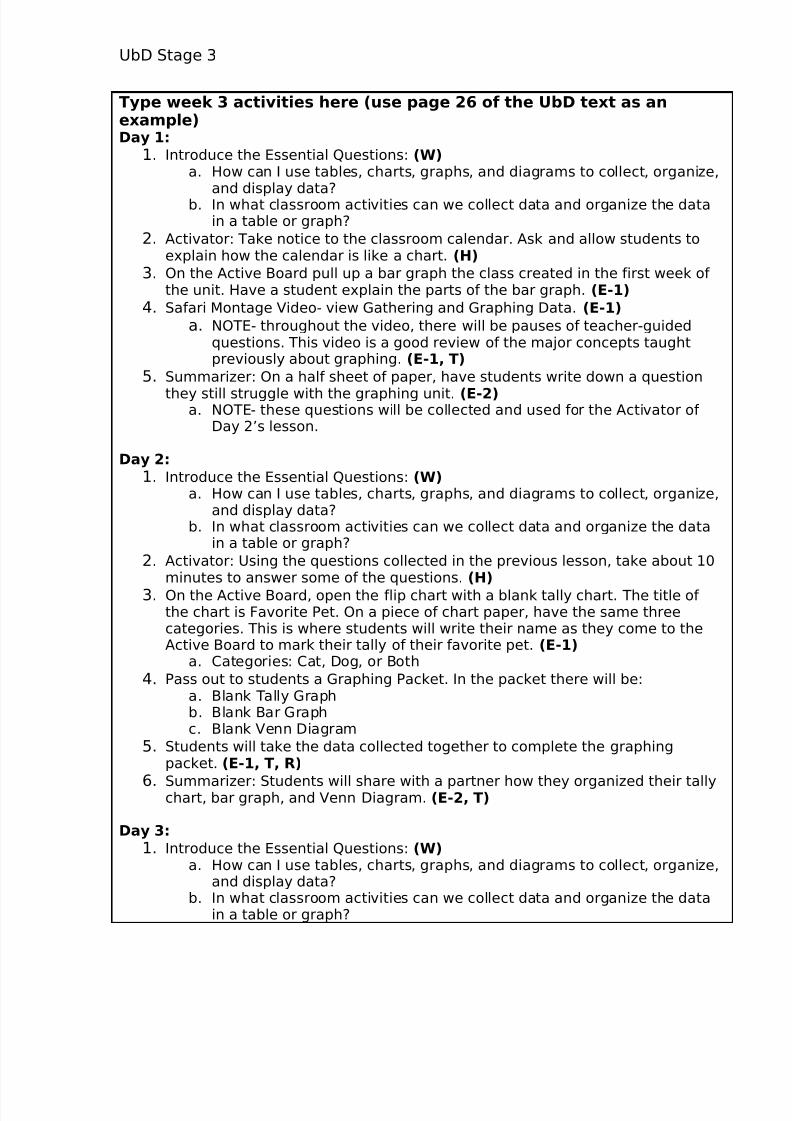
Type week 3 activities here (use page 26 of the UbD text as anexample)Day 1:
1. Introduce the Essential Questions: (W)a. How can I use tables, charts, graphs, and diagrams to collect, organize,
and display data?b. In what classroom activities can we collect data and organize the datain a table or graph?
2. Activator: Take notice to the classroom calendar. Ask and allow students toexplain how the calendar is like a chart. (H)
3. On the Active Board pull up a bar graph the class created in the first week of the unit. Have a student explain the parts of the bar graph. (E-1)
4. Safari Montage Video- view Gathering and Graphing Data. (E-1)
a. NOTE- throughout the video, there will be pauses of teacher-guidedquestions. This video is a good review of the major concepts taughtpreviously about graphing. (E-1, T)
5. Summarizer: On a half sheet of paper, have students write down a question
they still struggle with the graphing unit. (E-2)a. NOTE- these questions will be collected and used for the Activator of
Day 2’s lesson.
Day 2:
1. Introduce the Essential Questions: (W)a. How can I use tables, charts, graphs, and diagrams to collect, organize,
and display data?b. In what classroom activities can we collect data and organize the data
in a table or graph?
2. Activator: Using the questions collected in the previous lesson, take about 10minutes to answer some of the questions. (H)
3. On the Active Board, open the flip chart with a blank tally chart. The title of the chart is Favorite Pet. On a piece of chart paper, have the same threecategories. This is where students will write their name as they come to theActive Board to mark their tally of their favorite pet. (E-1)
a. Categories: Cat, Dog, or Both
4. Pass out to students a Graphing Packet. In the packet there will be: a. Blank Tally Graphb. Blank Bar Graphc. Blank Venn Diagram
5. Students will take the data collected together to complete the graphingpacket. (E-1, T, R)
6. Summarizer: Students will share with a partner how they organized their tallychart, bar graph, and Venn Diagram. (E-2, T)
Day 3:
1. Introduce the Essential Questions: (W)a. How can I use tables, charts, graphs, and diagrams to collect, organize,
and display data?b. In what classroom activities can we collect data and organize the data
in a table or graph?

8/3/2019 Stage 3 Pinson Mary Frances
http://slidepdf.com/reader/full/stage-3-pinson-mary-frances 11/21
UbD Stage 3
c. What strategies do you use when collecting data?d. What strategies do you use when analyzing and interpreting data?
2. Activator: Hot Seat- Four students will have an index card under their chairwith one of the four charts or graphs we have studied. They will have toexplain the chart or graph on their index card. (H)
3. Whole Group Game: Using the ELMO and the Active Board, split the class intoboys and girls.
4. The Frog Game: Charts, Graphs, and Diagrams is a board game with card thathave questions regarding specific topics. (E-1, T)
5. Have the board and two pieces at the front table. Use the ELMO to showcards/questions on the Active Board for all to see. Choose one studentalternating boys and girls to come and answer the multiple-choice question.Upon answering the question, the answer and the number of places thestudent moves is on the back of the card. (E-1, T)
6. Summarizer: Students will share with a partner what strategies they use whenanalyzing and interpreting data and graphs. (E-2, T)
Day 4:1. Introduce the Essential Questions: (W)a. How can I use tables, charts, graphs, and diagrams to collect, organize,
and display data?b. In what classroom activities can we collect data and organize the data
in a table or graph?c. What strategies do you use when collecting data?d. What strategies do you use when analyzing and interpreting data?
2. Activator: Word Wall Review. (H)
3. On the Active Board create a class Bar Graph of the student’s favorite season.(E-1, T)
4. Student Graphing Packet: Students will create a tally chart, bar graph, and
Venn Diagram using the data collected on the class bar graph. (E-1)5. When complete, the class, together, will create a pictograph. With this
pictograph, there will be a key. The key will represent that each picture equalstwo. This will allow students to see how the importance of the key will showthat often times the pictures will be counted for more than one. (E-1, T, R)
6. Summarizer: Education City, Online/Interactive Game- Summer Fair. Use thisgame as a review of the unit. (T)
Day 5:
1. Introduce the Essential Questions: (W)a. How can I use tables, charts, graphs, and diagrams to collect, organize,
and display data?
2. Activator: Discuss with students important test taking strategies. (H)
3. With teacher-guided questions, students with a partner will review the mainideas of the graphing unit. (E-1)
4. Post-Assessment: Students will take a 20-question assessment covering themajor themes of the three-week graphing unit. (E-2)
5. Summarizer: Addition and Subtraction Review- Play ‘Around the World’ withaddition and subtraction flash cards. (T)

8/3/2019 Stage 3 Pinson Mary Frances
http://slidepdf.com/reader/full/stage-3-pinson-mary-frances 12/21
UbD Stage 3
Notes to the Instructor
Use this area, if needed, to explain to the instructor how yourplanned activities above satisfy specific elements of the scoringrubric. This three-week math unit is geared toward whole group instruction. Theassessments and packets will assist in the creation of small groups
throughout the unit. Small groups will change based on ability.
There are many opportunities where this unit utilizes some of Gardener’sMultiple Intelligences.
• Spatial: The use of chart paper and large graphic organizers displayedusing the ACTIVE Board and the ELMO allow students to adequatelyvisualize the creation of charts and graphs. Consistently building uponthe Word Wall also allows students to see the correlation between thecharts and graphs.
• Linguistic: This unit gives many opportunities for students to share withthe group their ideas. There are also chances where the student shares
and collaborates with a partner. Allowing these times to share gives thestudent a chance to utilize the new vocabulary being taught in the unit.Listening to the student and how they explain what they are learningcan be beneficial to the teacher as to what they may bemisunderstanding.
• Logical-Mathematical: After the creation of the charts and graphs, therewill be chances where students will be asked to draw conclusions fromthe chart or graph. This is where students will use previously taught

8/3/2019 Stage 3 Pinson Mary Frances
http://slidepdf.com/reader/full/stage-3-pinson-mary-frances 13/21
UbD Stage 3
skill in math to answer questions such as, how many more and showingcommonality between Venn Diagrams.
• Bodily Kinesthetic: Throughout the unit, students will be givenopportunities to participate in the creation of the charts and graphs.ACTIVE Board games and adding words onto the word wall actively
involves the student in this math unit.• Interpersonal: Most days, the student will be allowed time to interact
with others through sharing ideas and or working together on anactivity.
• Intrapersonal: This unit also allows times where students will reflectupon their own understanding of the graphing concept.
Charts, Graphs, and Diagrams (Pre-Assessment)
Name:__________________________________ Date:_________________________
Use the tally chart below to answer the following questions.
Number of Soup Labels
Mrs. Jones’s class Mrs. Smith’s class
Mr. Clark’s class
1. How many soup labels did Mrs. Jones’s class collect? __________________________
8/3/2019 Stage 3 Pinson Mary Frances
http://slidepdf.com/reader/full/stage-3-pinson-mary-frances 14/21
UbD Stage 3
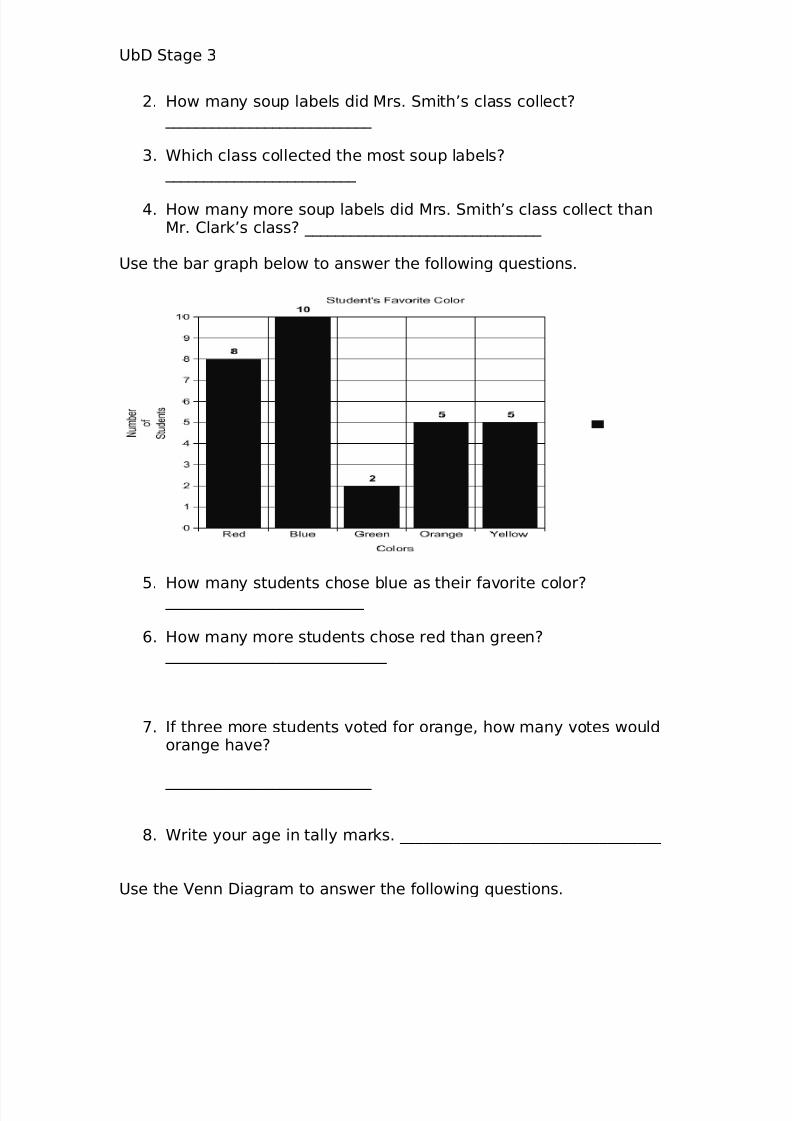
2. How many soup labels did Mrs. Smith’s class collect? ___________________________
3. Which class collected the most soup labels? _________________________
4. How many more soup labels did Mrs. Smith’s class collect thanMr. Clark’s class? _______________________________
Use the bar graph below to answer the following questions.
5. How many students chose blue as their favorite color? __________________________
6. How many more students chose red than green? _____________________________
7. If three more students voted for orange, how many votes wouldorange have?
___________________________
8. Write your age in tally marks. __________________________________
Use the Venn Diagram to answer the following questions.
8/3/2019 Stage 3 Pinson Mary Frances
http://slidepdf.com/reader/full/stage-3-pinson-mary-frances 15/21
UbD Stage 3
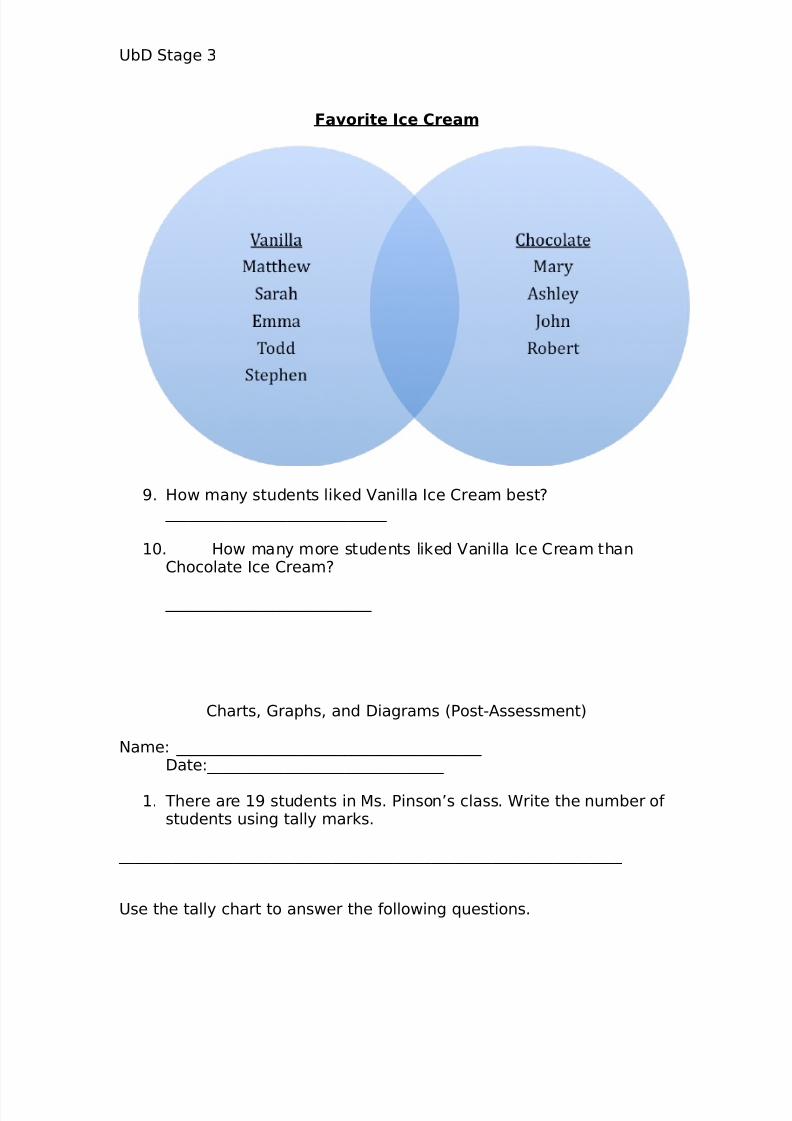
Favorite Ice Cream
9. How many students liked Vanilla Ice Cream best? _____________________________
10. How many more students liked Vanilla Ice Cream thanChocolate Ice Cream?
___________________________
Charts, Graphs, and Diagrams (Post-Assessment)
Name: ________________________________________ Date:_______________________________
1. There are 19 students in Ms. Pinson’s class. Write the number of students using tally marks.
__________________________________________________________________
Use the tally chart to answer the following questions.
8/3/2019 Stage 3 Pinson Mary Frances
http://slidepdf.com/reader/full/stage-3-pinson-mary-frances 16/21
UbD Stage 3
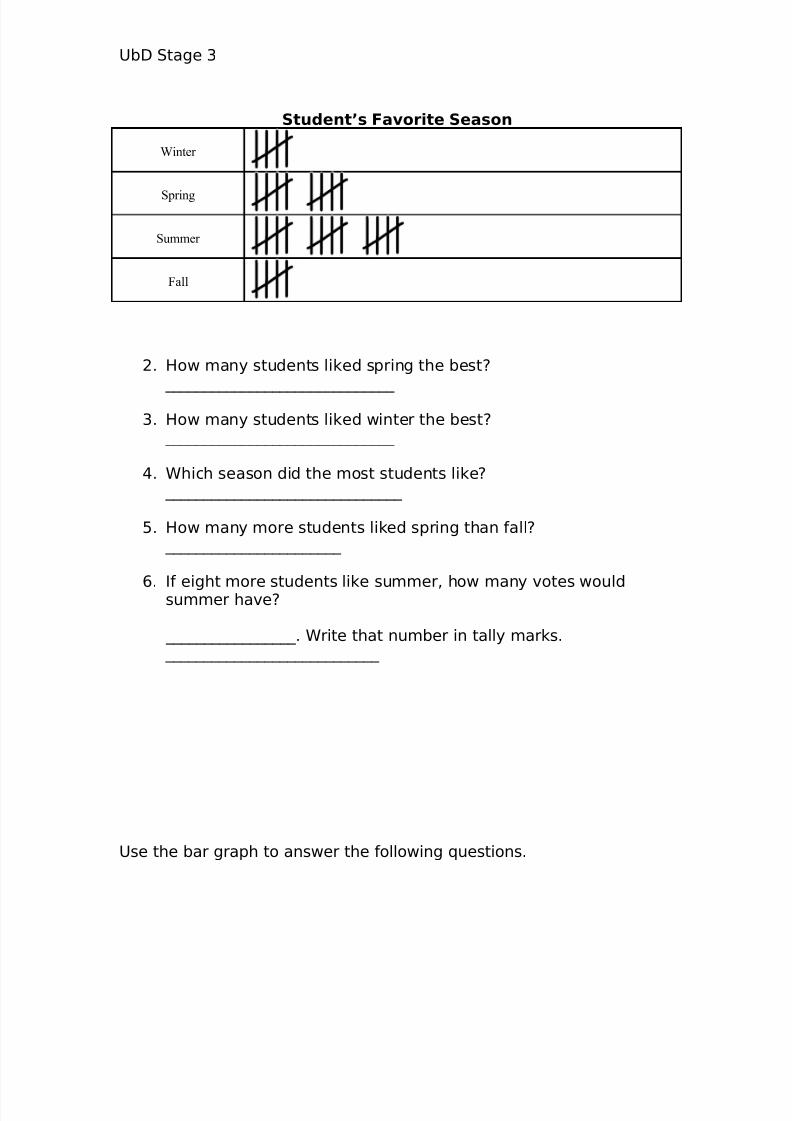
Student’s Favorite Season
Winter
Spring
Summer
Fall
2. How many students liked spring the best? ______________________________
3. How many students liked winter the best? ______________________________
4. Which season did the most students like? _______________________________
5. How many more students liked spring than fall? _______________________
6. If eight more students like summer, how many votes wouldsummer have?
_________________. Write that number in tally marks. ____________________________
Use the bar graph to answer the following questions.

8/3/2019 Stage 3 Pinson Mary Frances
http://slidepdf.com/reader/full/stage-3-pinson-mary-frances 17/21
UbD Stage 3
7. How many students liked cats the best? ________________________________
8. How many students liked guinea pigs best? ____________________________
9. How many more students like dogs than goldfish? ____________________
10. If two more kids liked hamsters, how many votes wouldhamsters have total?
____________________. Write this number using tally marks. _____________________________
8/3/2019 Stage 3 Pinson Mary Frances
http://slidepdf.com/reader/full/stage-3-pinson-mary-frances 18/21
UbD Stage 3
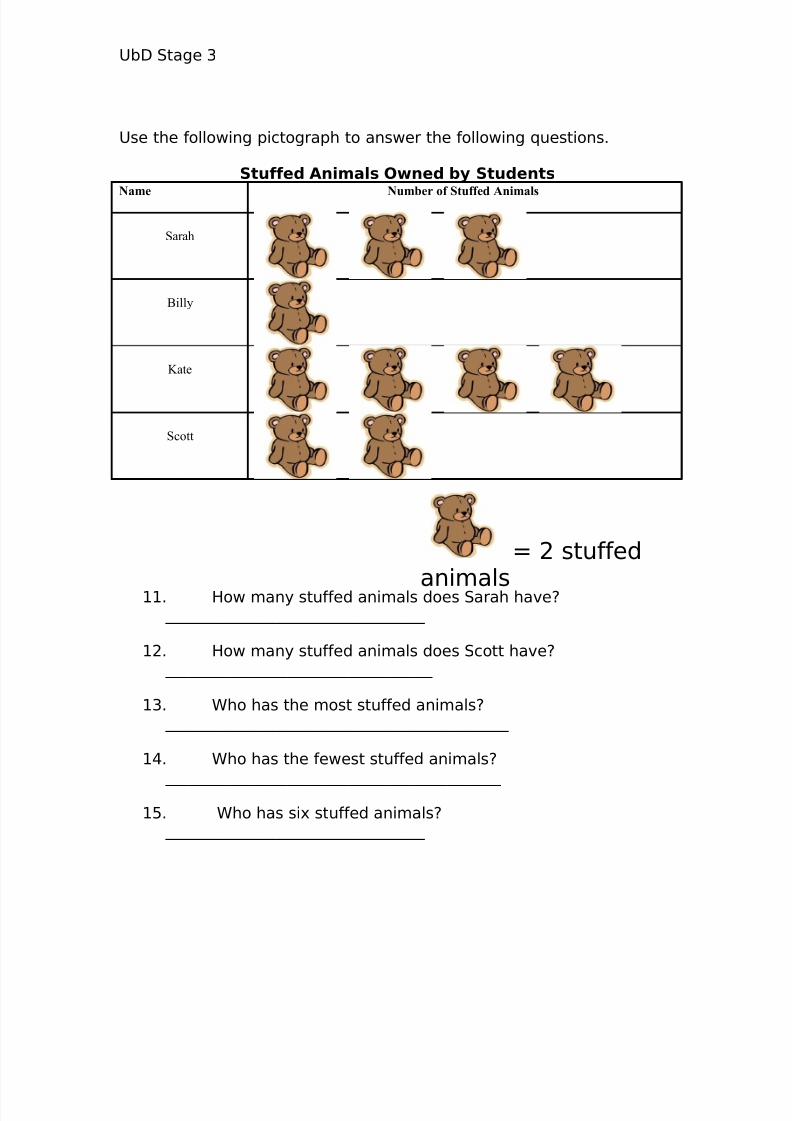
Use the following pictograph to answer the following questions.
Stuffed Animals Owned by StudentsName Number of Stuffed Animals
Sarah
Billy
Kate
Scott
11. How many stuffed animals does Sarah have? __________________________________
12. How many stuffed animals does Scott have? ___________________________________
13. Who has the most stuffed animals? _____________________________________________
14. Who has the fewest stuffed animals?
____________________________________________
15. Who has six stuffed animals? __________________________________
= 2 stuffed
animals
8/3/2019 Stage 3 Pinson Mary Frances
http://slidepdf.com/reader/full/stage-3-pinson-mary-frances 19/21
UbD Stage 3
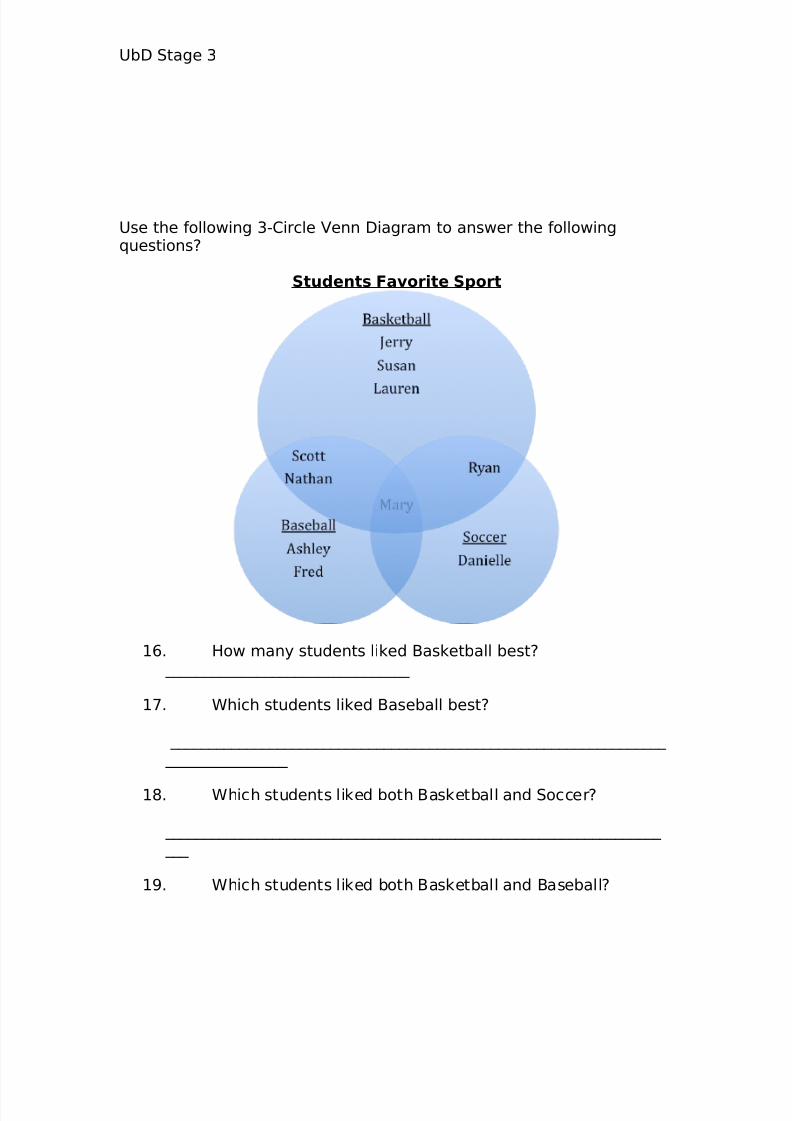
Use the following 3-Circle Venn Diagram to answer the followingquestions?
Students Favorite Sport
16. How many students liked Basketball best? ________________________________
17. Which students liked Baseball best?
_________________________________________________________________ ________________
18. Which students liked both Basketball and Soccer?
_________________________________________________________________ ___
19. Which students liked both Basketball and Baseball?
8/3/2019 Stage 3 Pinson Mary Frances
http://slidepdf.com/reader/full/stage-3-pinson-mary-frances 20/21
UbD Stage 3
_________________________________________________________________ ___
20. Which students liked all three sports, Basketball, Baseball,and Soccer?
_________________________________________________________________ ____
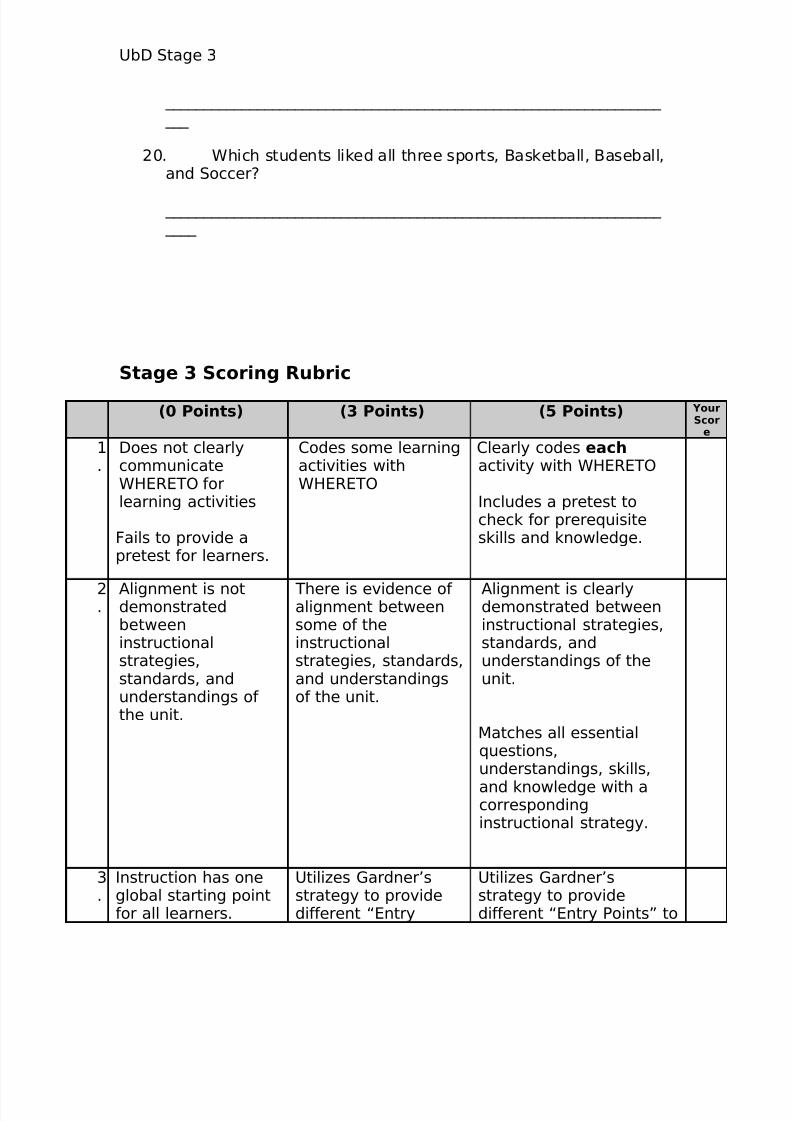
Stage 3 Scoring Rubric
(0 Points) (3 Points) (5 Points) YourScor
e
1.
Does not clearlycommunicateWHERETO forlearning activities
Fails to provide apretest for learners.
Codes some learningactivities withWHERETO
Clearly codes eachactivity with WHERETO
Includes a pretest tocheck for prerequisiteskills and knowledge.
2.
Alignment is notdemonstratedbetweeninstructionalstrategies,standards, andunderstandings of the unit.
There is evidence of alignment betweensome of theinstructionalstrategies, standards,and understandingsof the unit.
Alignment is clearlydemonstrated betweeninstructional strategies,standards, andunderstandings of theunit.
Matches all essentialquestions,understandings, skills,
and knowledge with acorrespondinginstructional strategy.
3.
Instruction has oneglobal starting pointfor all learners.
Utilizes Gardner’sstrategy to providedifferent “Entry
Utilizes Gardner’sstrategy to providedifferent “Entry Points” to
8/3/2019 Stage 3 Pinson Mary Frances
http://slidepdf.com/reader/full/stage-3-pinson-mary-frances 21/21
UbD Stage 3
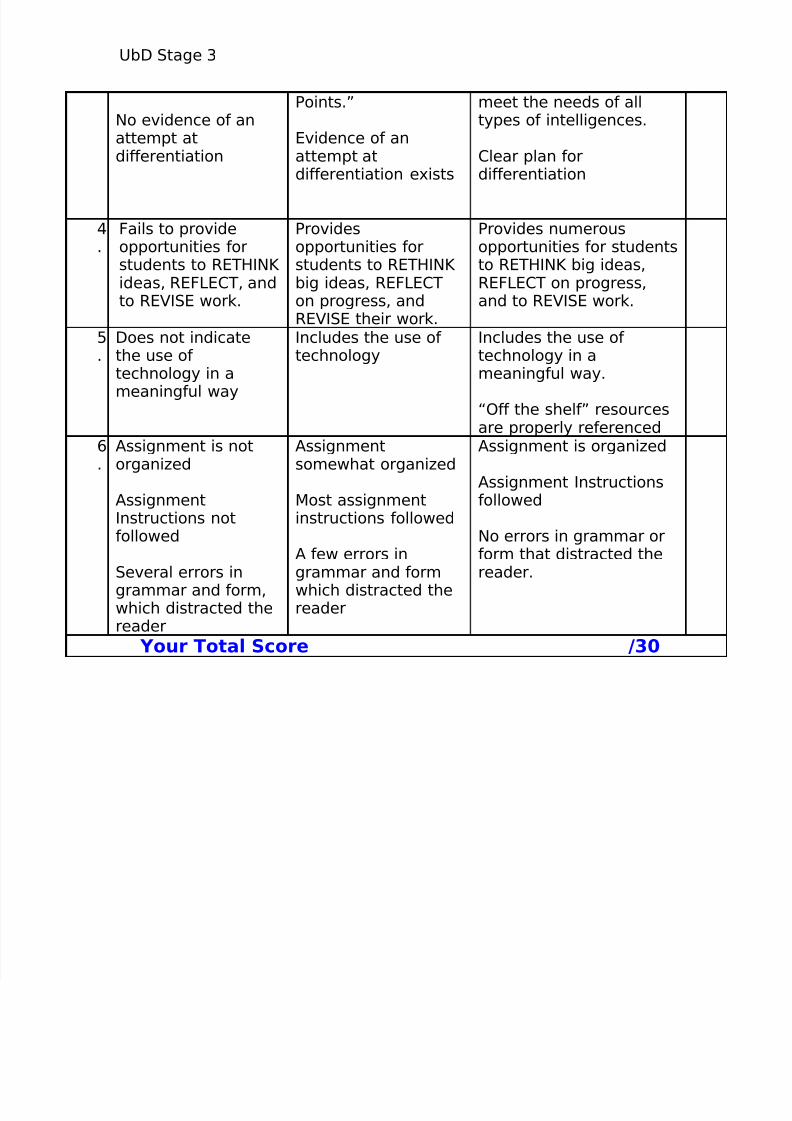
No evidence of anattempt atdifferentiation
Points.”
Evidence of anattempt atdifferentiation exists
meet the needs of alltypes of intelligences.
Clear plan fordifferentiation
4.
Fails to provideopportunities forstudents to RETHINK ideas, REFLECT, andto REVISE work.
Providesopportunities forstudents to RETHINK big ideas, REFLECTon progress, andREVISE their work.
Provides numerousopportunities for studentsto RETHINK big ideas,REFLECT on progress,and to REVISE work.
5.
Does not indicatethe use of technology in a
meaningful way
Includes the use of technology
Includes the use of technology in ameaningful way.
“Off the shelf” resourcesare properly referenced
6.
Assignment is notorganized
AssignmentInstructions notfollowed
Several errors in
grammar and form,which distracted thereader
Assignmentsomewhat organized
Most assignmentinstructions followed
A few errors ingrammar and form
which distracted thereader
Assignment is organized
Assignment Instructionsfollowed
No errors in grammar orform that distracted thereader.
Your Total Score /30
Related Documents