21 © Society for Medieval Archaeology 2014 DOI: 10.1179/0076609714Z.00000000030 Medieval Archaeology, 58, 2014 Stable Isotope Evidence for Dietary Contrast Between Pictish and Medieval Populations at Portmahomack, Scotland By SHIRLEY CURTIS-SUMMERS,1 JANET MONTGOMERY2 and MARTIN CARVER3 THE PICTISH AND MEDIEVAL SITE at Portmahomack contained four skeletal populations belong- ing respectively to the late Iron-Age/early Pictish period (6th/7th century), to a monastery of the late Pictish/early medieval period (8th century), to a Norse and Scottish trading place (9th to 11th century) and to a late medieval parish (15th century). Carbon and nitrogen isotope analyses of bone and tooth root collagen from sample individuals from each period were measured for dietary reconstruction. Faunal bone collagen was also assessed to provide dietary comparisons. The results demonstrate a marked change in diet between the early and late medieval communities at Portmahomack. Faunal data also presented dietary differences between the early and later medieval periods, perhaps related to a change in husbandry practices. Due to the dearth of carbon and nitrogen isotope studies on medieval skeletal collections in many areas of Britain and Ireland, this study provides valuable data to enhance our knowledge of food consumption and subsistence in the medieval period. INTRODUCTION The diet of a community reflects its economy and social organisation; such matters are of particular interest in periods and places characterised by high mobility or instabil- ity. The Highlands of Scotland were susceptible throughout the 1st and 2nd millennia ad to population pressure from north, east, west and south. In the late Iron-Age or early Pictish period (6th/7th century), the pagan people of eastern Scotland were under pressure from Christian polities both from the Irish in the west and the Angles from the south. Between the 6th and the 8th century the first Christian monastic communities are thought to have appeared, forming the vanguard of the conversion process. In the 9th century, Scotland attracted belligerent interest from the Norse, resulting in penetration and settle- ment especially in the Northern and Western Isles. The high Middle Ages witnessed documented hostility from England and continued immigration from the west as indi- cated by the widespread replacement of Pictish by Gaelic place names. The Highlands are not blessed with wide arable lands; barley, cattle, sheep and fish are likely to have 1 Department of Archaeology, Classics and Egyptology, University of Liverpool, Hartley Building, Liverpool L69 3GS, UK. [email protected] 2 Department of Archaeology, Durham University, South Road, Durham DH1 3LE, UK. janet.montgomery@ durham.ac.uk 3 Department of Archaeology, University of York, The King’s Manor, York YO1 7EP, UK. martin.carver@york. ac.uk

Welcome message from author
This document is posted to help you gain knowledge. Please leave a comment to let me know what you think about it! Share it to your friends and learn new things together.
Transcript

21
© Society for Medieval Archaeology 2014 DOI: 10.1179/0076609714Z.00000000030
Medieval Archaeology, 58, 2014
Stable Isotope Evidence for Dietary Contrast Between Pictish and Medieval Populations at Portmahomack, ScotlandBy SHIRLEY CURTIS-SUMMERS,1 JANET MONTGOMERY2
and MARTIN CARVER3
THE PICTISH AND MEDIEVAL SITE at Portmahomack contained four skeletal populations belong-ing respectively to the late Iron-Age/early Pictish period (6th/7th century), to a monastery of the late Pictish/early medieval period (8th century), to a Norse and Scottish trading place (9th to 11th century) and to a late medieval parish (15th century). Carbon and nitrogen isotope analyses of bone and tooth root collagen from sample individuals from each period were measured for dietary reconstruction. Faunal bone collagen was also assessed to provide dietary comparisons. The results demonstrate a marked change in diet between the early and late medieval communities at Portmahomack. Faunal data also presented dietary differences between the early and later medieval periods, perhaps related to a change in husbandry practices. Due to the dearth of carbon and nitrogen isotope studies on medieval skeletal collections in many areas of Britain and Ireland, this study provides valuable data to enhance our knowledge of food consumption and subsistence in the medieval period.
INTRODUCTION
The diet of a community reflects its economy and social organisation; such matters are of particular interest in periods and places characterised by high mobility or instabil-ity. The Highlands of Scotland were susceptible throughout the 1st and 2nd millennia ad to population pressure from north, east, west and south. In the late Iron-Age or early Pictish period (6th/7th century), the pagan people of eastern Scotland were under pressure from Christian polities both from the Irish in the west and the Angles from the south. Between the 6th and the 8th century the first Christian monastic communities are thought to have appeared, forming the vanguard of the conversion process. In the 9th century, Scotland attracted belligerent interest from the Norse, resulting in penetration and settle-ment especially in the Northern and Western Isles. The high Middle Ages witnessed documented hostility from England and continued immigration from the west as indi-cated by the widespread replacement of Pictish by Gaelic place names. The Highlands are not blessed with wide arable lands; barley, cattle, sheep and fish are likely to have
1 Department of Archaeology, Classics and Egyptology, University of Liverpool, Hartley Building, Liverpool L69 3GS, UK. [email protected]
2 Department of Archaeology, Durham University, South Road, Durham DH1 3LE, UK. [email protected]
3 Department of Archaeology, University of York, The King’s Manor, York YO1 7EP, UK. [email protected]

22 curtis-summers, montgomery and carver
been exploited, but the balance between them in any one period indicates the relative emphasis on sedentary and mobile groups and between settled and disputed territory.
Archaeological evidence suggests that cattle were a highly important commodity for meat and milk throughout the medieval period in Ireland and Scotland, particularly in the uplands and among mobile clans.4 By contrast, the coasts of the Firthlands in the north-east were fertile areas for the growing of wheat and barley to the present day. Based on present resources, exploitation of both freshwater and saltwater fish is to be expected. Images of salmon feature on Pictish symbol stones of the 7th century.5 However, investiga-tions of excavated assemblages and stable isotope evidence suggest a high terrestrial meat protein intake in the early medieval period, with very little marine protein consumption, even on coastal sites,6 although faunal evidence elsewhere does suggest some evidence for marine exploitation.7 There is also an expectation, based on later medieval practice, that monastic communities would eat fish. The Rule of St Benedict (c ad 560) proscribed the consumption of meat on fast days, unless a person was ill,8 and in the later medieval period many Christians followed this rule, substituting fish for meat. Religious and social influences on food consumption in the medieval period came mainly from penitentials,9 although fasting practices among the early communities in the north are poorly docu-mented. Before the spread of the Black Death in Scotland in ad 1350,10 most peasants relied on cereals, yet by the 15th century peasant diets changed with the consumption of wheat, ale, fish and meat, providing a range of vitamins that were previously deficient in the diet of many people.11
The reconstruction of diet is especially revealing where a site features a succession of different types of settlement in the same place, and can offer a long-lasting sequence of cemetery evidence with preserved human bone and rich assemblages of faunal and plant remains. Portmahomack on Tarbat Ness in Easter Ross, which was studied by excavation and analysis between 1994 and 2013, offers both. Stable isotope analysis was applied to 40 individuals ranging in date from the 6th to the 16th centuries (Fig 1). The purpose of the exploratory investigation reported here was to determine variations in diet from carbon and nitrogen isotopes in bone and tooth root collagen, and draw some first conclusions on the significance of the differences encountered.
THE SITE AND SEQUENCE AT PORTMAHOMACK
The excavated site is situated in the coastal village of Portmahomack on the Tarbat Peninsula in north-east Scotland (Fig 2), with the area of archaeological interest focused on St Colman’s church.12 The historical importance of this site was recognised in the early 20th century, when Allen and Anderson published carved stones found in and around the church, including one with a Latin inscription.13 The modern campaign (between 1994 and 2007) recovered another 200 fragments of carved stones, including one carrying an image of Apostles. The excavations also unearthed a wealth of finds relating
4 Eg Alcock 2003; Ritchie 1977.5 Gordon 1965.6 Eg Barratt and Richards 2004.7 Eg Wheeler 1977.8 Harvey 2006.9 Meens 1995; 2006.
10 Benedictow 2004.11 Dyer 1989.12 Garner-Lahire 1995; Carver 2005; 2008.13 Allen and Anderson 1903, vol 2, 73–5; Carver 2008, 5–11.
23pictish and medieval populations at portmahomack, scotland
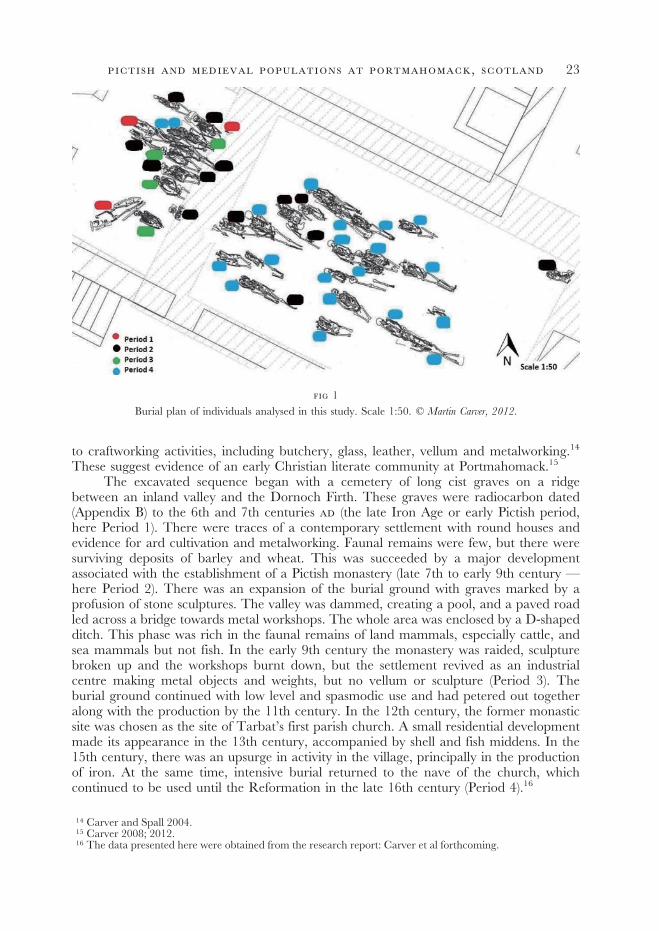
fig 1Burial plan of individuals analysed in this study. Scale 1:50. © Martin Carver, 2012.
to craftworking activities, including butchery, glass, leather, vellum and metalworking.14 These suggest evidence of an early Christian literate community at Portmahomack.15
The excavated sequence began with a cemetery of long cist graves on a ridge between an inland valley and the Dornoch Firth. These graves were radiocarbon dated (Appendix B) to the 6th and 7th centuries ad (the late Iron Age or early Pictish period, here Period 1). There were traces of a contemporary settlement with round houses and evidence for ard cultivation and metalworking. Faunal remains were few, but there were surviving deposits of barley and wheat. This was succeeded by a major development associated with the establishment of a Pictish monastery (late 7th to early 9th century — here Period 2). There was an expansion of the burial ground with graves marked by a profusion of stone sculptures. The valley was dammed, creating a pool, and a paved road led across a bridge towards metal workshops. The whole area was enclosed by a D-shaped ditch. This phase was rich in the faunal remains of land mammals, especially cattle, and sea mammals but not fish. In the early 9th century the monastery was raided, sculpture broken up and the workshops burnt down, but the settlement revived as an industrial centre making metal objects and weights, but no vellum or sculpture (Period 3). The burial ground continued with low level and spasmodic use and had petered out together along with the production by the 11th century. In the 12th century, the former monastic site was chosen as the site of Tarbat’s first parish church. A small residential development made its appearance in the 13th century, accompanied by shell and fish middens. In the 15th century, there was an upsurge in activity in the village, principally in the production of iron. At the same time, intensive burial returned to the nave of the church, which continued to be used until the Reformation in the late 16th century (Period 4).16
14 Carver and Spall 2004.15 Carver 2008; 2012.16 The data presented here were obtained from the research report: Carver et al forthcoming.

24 curtis-summers, montgomery and carver
fig 2Location map of Portmahomack. © Martin Carver, 2005.
THE BURIALS AT PORTMAHOMACK
The burials at Portmahomack were well stratified and comprise four distinct groups: 16 cist burials of Period 1 (6th/7th century); 51 monastic burials of Period 2 (8th century); seven burials from Period 3 (9th/11th century — but here included with Period 2); and 86 from Period 4 (the great majority from the 15th century). The Period 1 burials are characterised by the presence of long-cist graves. They contained adult men and women and were high status, having originally been marked by burial mounds. The Period 2 burials were predominately adult males; these featured head-supports and are assigned to the monastic phase. Only seven burials were recognised from Period 3 and these followed continuously on from Period 2, using the same burial rites. Period 4 burials represent the population of the parish established during the 12th century. Burials from this period are those of men, women and children and the majority date to the 15th and 16th centuries. There were examples of high-status graves, notably Burials 30 and 36 which contained a succession of two large males in the same grave and a selective use of coffins: 11 male (including probable male) burials, four females (including probable females) and four

25pictish and medieval populations at portmahomack, scotland
sub-adults.17 Except for sub-adults, burial in the church ceased definitively about ad 1620 when the church was reformed and a stone floor was laid (Period 5).18
PRINCIPLES AND METHODS
A number of systematic changes in nitrogen (δ15N) ratios have been observed when organic matter is transferred up the food chain, for example, from plants to herbivores to carnivores. This ‘trophic level effect’ is estimated at 3‰ to 5‰ enriched in 15N for each trophic level.19 Nitrogen isotopes are therefore used to examine tropic level effects and to measure the level of marine versus animal protein consumption. Carbon (δ13C) isotope ratios vary between terrestrial and marine ecosystems and between plants of different photosynthetic pathways. These photosynthetic pathways are termed C3, C4 and CAM, the latter of which can alternate between C3 and C4 pathways and mirror their δ13C values. C3 plants, which are found in most temperate zones and are native to Europe, include plants such as wheat, barley and oats.20 C4 plants include tropical vegetation such as sugar cane, maize, millet and sorghum.21 No natural C4 vegetation exists in Britain and before foods like sugar cane were imported in the late medieval period, this dietary component was rare,22 although recent studies have discovered a possible C4 dietary component in individuals from Roman period sites in England.23
Bone turns over at a rate of around ten to thirty years,24 depending on the type of bone.25 Unlike bone, tooth dentine does not continuously remodel,26 hence, tooth dentine should retain δ13C and δ15N values from when it was formed during childhood.27 The root apex of the mandibular first permanent molar (M1), the tooth chosen for this study, is completed by around 9 to 11.5 years,28 hence reflecting a dietary signature from around this age. Stable isotope data can therefore elucidate the diet of an adult’s life from the last ten years or so and from childhood if tooth dentine collagen is measured.
Human cortical rib samples from 40 adult humans (n=3 Period 1, n=13 Period 2, n=4 Period 3, n=20 Period 4) were selected and for ten of these (n=2 Period 2, n=3 Period 3, n=4 Period 4), a sample of first molar bulk root dentine was also taken. Bone samples were taken from 16 animals from Periods 2 and 4: cattle, sheep, pig, dog and cod. Sample preparation and isotope analysis procedures followed Richards and Hedges,29 with an extra stage of ultrafiltration as proposed by Brown et al,30 following a modified Longin method.31 These procedures are described in Appendix A.
RESULTS
All δ13C and δ15N data are presented in Tables 1, 2 and 3. The majority of samples yielded good quality collagen, with those for the human samples ranging from 1.2 wt% to 12.4 wt%,32 One
17 Carver et al forthcoming.18 Ibid, 111.19 Schoeninger and DeNiro 1984; Schoeninger 1985; Sealy et al 1987; Sponheimer et al 2003.20 Lee-Thorp and Sponheimer 2006; Mays and Beavan 2012.21 van der Merwe 1982.22 Mays 1997; Bayliss et al 2004.23 Müldner et al 2011; Pollard et al 2011.24 Libby et al 1964; Stenhouse and Baxter 1979.25 Hedges et al 2007.26 Hillson 1986.27 Fuller et al 2003.28 Gustafson and Koch 1974.29 Richards and Hedges 1999.30 Brown et al 1988.31 Longin 1971.32 van Klinken 1999.

26 curtis-summers, montgomery and carver
tooth sample (140T) was excluded due to a low collagen yield of 0.2 wt%. All weight percentages for carbon and nitrogen fell within the acceptable range of 30–50 wt% for carbon and 10–20 wt% for nitrogen. C:N ratios for human and faunal samples were between 3.2 and 3.6 and are therefore within the acceptable range of well-preserved collagen.33 Although there are some differences, in δ13C and δ15N values between the Period 1 and Period 2 burials, no great distinctions were noted overall between Periods 1–3. Therefore, human and faunal samples from the early medieval periods (1–3) will be hereafter referred to as the ‘EMG’ (early medieval group), with those from Period 4 referred to as the ‘LMG’ (later medieval group). The most useful comparison noted by this research to date is between the 8th-century monastery (Period 2) and the 15th-century parish community (Period 4).
faunal bone collagen dataFaunal samples from Portmahomack (Tab 1) were included in this study to provide compa-
rable data to interpret the human δ13C and δ15N values (Fig 3). Mean δ13C and δ15N values for the EMG cattle (n=7) were –22.1‰ ± 0.3‰ (1σ) and 5.9‰ ± 1.2‰ (1σ) respectively. One cattle sam-ple (C3122/10) from the EMG is considerably lower when compared to mean δ15N values from cattle in the same period. This difference (∆ = 3.0‰) may be due to a number of factors, such as originating from a different geographical region and consuming different types of fodder or grazing on unimproved pasture, which resulted in lower δ15N values.34 For example, δ15N values in chaff and cereal straw are suggested to be lower and more variable than in grain.35 The faunal baseline shift in δ15N values from the EMG to LMG periods is reflected in the human isotope ratios. The δ15N ratios for humans from the EMG and LMG are higher than corresponding cattle, sheep/goat and pigs, reflecting a trophic level increase. Human isotope values are therefore higher than the fauna by around 2‰–6‰ in δ15N and 2‰–3‰ in δ13C.
33 DeNiro 1985.34 Upper case Greek delta letter (∆) refers to difference between isotope mean values. Lower case Greek delta
letter (δ) refers to the measurement of deviation in isotope ratios from a particular standard.35 Bogaard et al 2007.
Table 1δ13C and δ15N faunal bone collagen results and archaeological data from Portmahomack.
Sample no
Animal/Bone analysed
Mass collagen
(mg)
δ13C δ15N Collagenyield (%)B
%C %N C:NC Period
C3122/1 Pig/skull 12.6 –21.4 8.8 3.2 42.7 15.4 3.2 2C3122/2 Pig/zygomatic 6.1 –21.5 8.1 1.5 40.8 14.8 3.2 2C3122/3 Pig/skull (juvenile) 15.0 –21.4 8.3 3.6 41.0 15.0 3.2 2C3122/4 Cattle/rib 21.7 –22.3 6.8 5.6 41.9 15.2 3.2 2C3122/5 Cattle/rib 27.2 –22.4 6.3 6.8 42.1 15.3 3.2 2C3122/6 Cattle/rib 21.6 –22.2 6.4 5.3 41.6 15.2 3.2 2C3122/7 Cattle/long bone 26.2 –21.8 6.6 6.2 42.5 15.2 3.3 2C3122/8 Cattle/long bone 26.7 –22.4 5.9 7.1 42.2 15.3 3.2 2C3122/9 Cattle/humerus 16.3 –21.8 6.2 4.3 42.1 15.2 3.2 2C3122/10 Cattle/humerus 25.6 –21.9 3.4 6.4 42.0 15.0 3.3 2C1280/1 S/G metacarpal 8.5 –22.0 8.8 2.2 41.7 14.7 3.3 4C1280/2 Cattle/tibia 29.4 –22.0 10.0 6.8 42.2 15.4 3.2 4C1280/3 Dog/L.humerus 11.5 –16.8 15.3 2.9 41.5 14.9 3.2 4C1280/4 Pig/sphenoid 14.1 –21.1 11.9 3.4 41.5 14.8 3.3 4C1280/5 Pig 4th metacarpal 15.7 –21.7 11.8 3.9 41.8 15.0 3.2 4C1303/1 Cod vertebra 5.7 –12.3 14.3 1.3 41.1 14.6 3.3 4
B Yield (%) = Mass mg collagen / weight (bone) mg x 100C Acceptable C:N ratio (see DeNiro 1985)

27pictish and medieval populations at portmahomack, scotland
Table 2δ13C, δ15N human bone and dentine collagen results and archaeological data from Portmahomack.
Skeleton noA
Mass collagen (mg)
δ13C δ15N Collagenyield (%)B
C:NC AgeD SexD Period
166 44.4 –21.0 10.8 10.4 3.2 adult F? 1169 37.8 –20.7 10.0 8.8 3.2 26–45 M 1172 41.9 –20.8 10.9 10.1 3.2 46+ F 1116 43.9 –20.3 13.0 11.0 3.2 26–45 M 2124 21.3 –20.8 11.4 5.1 3.2 17–25 M 2124T 1.2 –21.2 11.7 0.6 3.3 17–25 M 2127 45.4 –20.4 11.8 10.6 3.2 26–45 F? 2128 18.4 –20.5 11.7 4.4 3.3 46+ M? 2140 8.1 –20.3 12.5 2.0 3.2 17–25 M 2144 10.6 –19.1 14.6 2.4 3.2 46+ M 2144T 25.5 –19.9 14.6 8.1 3.2 46+ M 2151 25.8 –20.6 12.6 6.6 3.2 46+ M 2154 37.5 –20.4 11.8 9.3 3.2 26–45 M 2160 32.7 –20.7 11.1 7.7 3.2 46+ M? 2164 34.1 –20.2 12.8 8.3 3.2 26–45 M 2168 15.1 –20.0 12.3 3.8 3.2 26–45 M? 2171 11.7 –19.7 12.2 2.9 3.2 26–45 M 2174 53.5 –21.1 11.4 12.4 3.2 adult F? 2136 5.5 –21.1 11.9 1.3 3.3 46+ M 3147 21.5 –20.4 11.2 5.4 3.2 26–45 M 3147T 12.0 –20.5 12.2 4.7 3.2 26–45 M 3152 25.3 –20.5 11.7 6.0 3.2 26–45 M 3152T 7.4 –20.9 12.6 3.5 3.2 26–45 M 3158 33.9 –20.3 12.4 8.6 3.2 46+ M 3158T 12.0 –20.5 12.8 4.7 3.2 46+ M 335 9.4 –17.3 15.4 2.4 3.2 17–25 M 464 29.5 –19.3 13.9 7.8 3.2 46+ M 469 4.8 –19.7 14.4 1.2 3.6 46+ F 483 26.8 –19.4 14.9 6.4 3.2 26–45 F? 485 22.1 –18.0 15.1 5.2 3.2 17–25 M? 488 14.8 –18.4 15.0 3.5 3.2 26–45 F 488T 10.5 –19.2 13.8 4.9 3.2 26–45 F 490 14.5 –17.9 15.1 3.7 3.2 46+ M 491 15.1 –19.8 14.0 3.5 3.2 26–45 F 493 35.1 –17.1 16.6 8.7 3.2 26–45 M 497 22.4 –18.3 14.9 5.2 3.2 46+ F? 498 32.5 –17.9 15.8 7.7 3.2 26–45 M 4100 16.6 –19.3 15.0 3.8 3.2 26–45 F 4100T 12.1 –19.1 15.8 5.6 3.2 26–45 F 4102 31.5 –17.8 16.1 7.5 3.2 26–45 F 4103 27.1 –18.0 15.5 7.0 3.2 26–45 M 4105 27.4 –20.4 12.7 6.8 3.2 46+ F 4106 14.8 –18.7 15.5 3.4 3.2 46+ F 4108 28.2 –19.5 14.7 6.8 3.2 26–45 M 4109 49.2 –18.2 14.4 11.5 3.2 46+ M 4112 28.1 –18.9 14.3 7.1 3.2 46+ M 4 112T 17.1 –19.5 14.1 7.5 3.2 46+ M 4113 23 –19.1 13.8 5.8 3.2 46+ M 4113T 16.1 –20.0 13.1 7.7 3.2 46+ M 4
A Human bone samples taken from ribs. ‘T’ denotes tooth sample (permanent 1st molar root)B Yield (%) = Mass mg collagen / weight (bone) mg x 100C Acceptable C:N ratio (see DeNiro 1985)D Ageing and sexing (M = male, F = female, ? = probable) information extracted from King (2000)

28 curtis-summers, montgomery and carver
Table 3Comparison of bone and dentine δ13C and δ15N values (measured in ‰) from Portmahomack.
Skeleton no
Sex/Period
Bone δ13C
Dentine δ13C
(∆dentine-bone δ13C)
Bone δ15N
Dentine δ15N
(∆dentine-bone δ15N)
124 M/2 –20.8 –21.2 0.4 11.4 11.7 0.3144 M/2 –19.1 –19.9 0.7 14.6 14.6 0.0147 M/3 –20.4 –20.5 0.1 11.2 12.2 1.0152 M/3 –20.5 –20.9 0.4 11.7 12.6 0.9158 M/3 –20.3 –20.6 0.3 12.4 12.8 0.488 F/4 –18.4 –19.2 0.8 15.0 13.8 1.2100 F/4 –19.3 –19.1 0.2 15.0 15.8 0.8113 M/4 –19.0 –20.0 1.0 13.8 13.1 0.7112 M/4 –18.9 –19.5 0.6 14.3 14.1 0.3
human bone collagen dataThe human EMG (n=20) δ13C values range between –21.1‰ and –19.1‰ (∆ = 2.0‰), with
a mean of –20.5‰ ± 0.5‰ (1σ) and the δ15N values range between 10.0‰ and 14.6‰ (∆ = 4.6‰), with a mean of 11.9‰ ± 1.0‰ (1σ). However, when the outlier (SK144) is removed, the differ-ences for δ13C and δ15N are ∆ = 1.4‰ and ∆ = 3.0‰ respectively, suggesting that the majority of the EMG are within the same trophic level. LMG human (n=20) δ13C values range between –20.4‰ and –17.1‰ (∆ = 3.3‰), with a mean of –18.7‰ ± 0.9‰ (1σ) and δ15N values range from 12.7‰ to 16.6‰ (∆ = 3.9‰), with a mean of 14.9‰ ± 0.9‰ (1σ). Again, when the outlier from this group (SK105) is removed, the differences for δ13C and δ15N are reduced (∆ = 2.7‰ and ∆ = 2.8‰ respectively). The δ13C and δ15N values are therefore higher in the LMG individuals compared to the EMG individuals (Fig 4), representing a diachronic change in diet over these periods at Portmahomack. Unpaired, independent two-sample t-tests revealed a significant differ-ence between the EMG and LMG bone collagen isotope results for both δ13C (t(38) = –7.97, p<.001***) and δ15N (t(38) = –9.92, p<.001***) values (Fig 5).36
Within the EMG (Periods 1–3), Period 1 burials (SK166, SK169 and SK172) showed similar δ13C values compared to the Monastic burials (Period 2). One adult male from Period 1 (SK169) had slightly lower δ15N values than the rest of the EMG group, although not of sufficient magnitude to suggest a trophic level difference (Fig 6). One adult male from Period 2 (SK144) had different isotope results to the rest of the group, with δ13C and δ15N values within the range of the LMG (Period 4) inhabitants. When compared to the mean δ13C and δ15N values of Period 2, the differ-ences in carbon (∆ = 1.2‰) and nitrogen (∆ = 2.4‰) for SK144 suggest this individuals diet may have included some marine protein. One outlier from Period 4, an adult female (SK105), had the lowest δ13C (–20.4‰), and δ15N (12.7‰) values of this group. The isotope results from this indi-vidual fell within the Period 2 group and differed to the other LMG individuals in both δ13C (∆ = 1.3‰) and δ15N (∆ = 2.0‰), suggesting a more terrestrial-based diet.
Two-sample t-tests were performed to determine age and sex differences in diet within the LMG group and age differences within the EMG. Gendered divisions in diet between the EMG could not be statistically tested due to uneven male-female sample numbers, although the δ13C and δ15N isotope values suggest a relatively homogeneous diet (Fig 7). Apart from SK105, mean δ13C and δ15N isotope values for LMG male and female bone collagen revealed little difference in δ13C (∆ = 0.8‰) and δ15N (∆ = 0.3‰) values. Statistical t-test results for δ13C were significant (t(20) = 2.39, p<.05*), although the δ15N data revealed no significant difference (t(18) = 0.59, p>.05).37 However, replication with a larger sample size may decide whether there is a trend towards significance.
36 Exact p values for both δ13C and δ15N are p=.000.37 Exact p values are p=.027 and p=.565 respectively.

29pictish and medieval populations at portmahomack, scotland
fig 4Human bone collagen δ13C and δ15N isotope values with mean and standard errors for Periods 1–3 (bold
circle) and Period 4 (dashed circle) males and females (analytical precision: ± 0.2‰).
fig 3Human and faunal bone collagen δ13C and δ15N isotope values with mean and standard errors (analytical
precision: ± 0.2‰).

30 curtis-summers, montgomery and carver
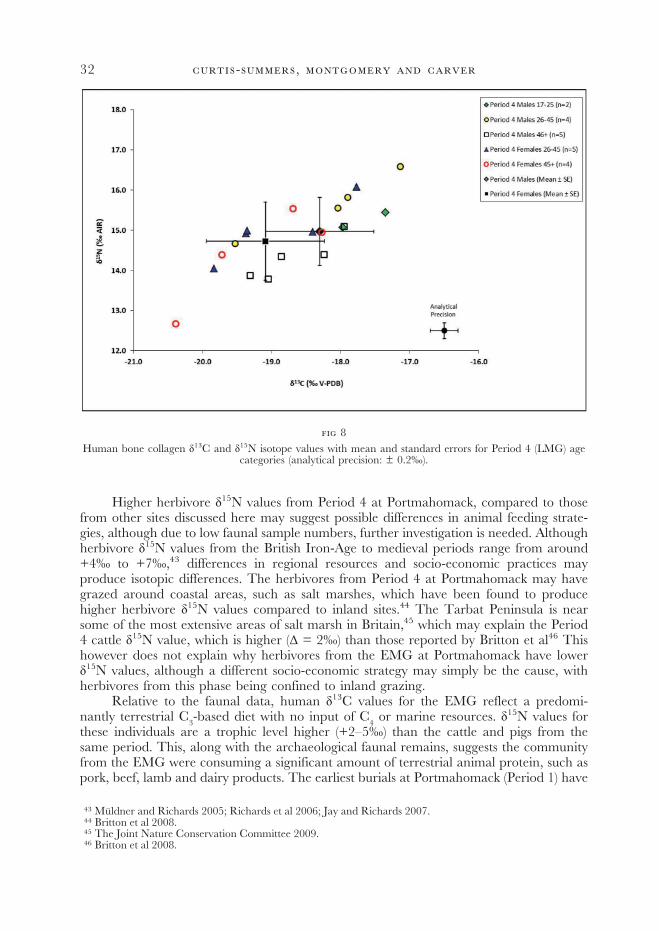
Mean δ13C and δ15N isotope values for the 26–45 years and 46+ years age groups from the EMG revealed little difference in δ13C (∆ = 0.2‰) and δ15N (∆ = 0.3‰) values. Statistical t-test results found no significant difference for δ13C (t(18) = 0.17, p>.05) and δ15N (t(18) = –1.09 p>.05).38 The 17–25 years age group from both the EMG and LMG periods has not been statistically tested due to low sample numbers (n=2). Mean δ13C and δ15N isotope values for the 26–45 years and 46+ years age groups from the LMG revealed little difference in δ13C (∆ = 0.3‰) and δ15N (∆ = 1.0‰) values (Fig 8). Statistical t-test results for δ13C found no significant difference (t(20) = 1.13, p>.05), although for δ15N, there was a significant difference (t(20) = 2.76, p<.05**).39
38 Exact p values are p=.864 and p=.289 respectively.39 Exact p values are p=.273 and p=.012 respectively.
fig 5Box-plots of δ13C and δ15N values of human bone collagen for period 4 (left boxes) and periods 1–3 (right
boxes). Mean points and one standard deviation (1σ) shown. *= outlier: SK144.
fig 6Human bone collagen δ13C and δ15N isotope values with mean and standard errors for Periods 1–4
(analytical precision: ± 0.2‰).

31pictish and medieval populations at portmahomack, scotland
human dentine collagen dataNo tooth samples were provided for females from the EMG or the Period 1 male at Portma-
homack, thus no dentine collagen has been analysed for these individuals. The mean δ13C and δ15N values for the EMG males (n=5) are –20.6‰ ± 0.5‰ (1σ), and 12.8‰ ± 1.0‰ (1σ) respectively. Individual δ13C and δ15N values for the LMG females (n=2) are –19.2‰ and 13.8‰ (SK88) and –19.1‰ and 15.8‰ (SK100) respectively. Individual δ13C and δ15N values for the LMG males (n=2) are –20.0‰ and 13.1‰ (SK113) and –19.5‰ and 14.1‰ (SK112) respectively (Tab 3).
DISCUSSION
Generally, all faunal samples from Portmahomack appear to have δ13C and δ15N values that are consistent with those from comparable sites,40 although some isotopic differences between the two groups are evident. For example, δ15N values are higher for Period 4 cattle versus those from earlier Period 2 cattle (∆ = 4.1‰) and for Period 4 versus Period 2 pigs (∆ = 3.5‰) at Portmahomack. However, there was no real difference in cattle and pig δ13C values from both periods. Interestingly, the Period 4 dog sample from Portmahomack differs greatly, compared to same species isotope results at East Lothian41 in both its δ13C (∆ = 8‰) and δ15N (∆ = 4‰) values. Pigs and dogs have been found to have high δ15N values, suggesting they may have consumed foods similar to that of humans and possibly scavenged marine foods from the coastline.42 High δ15N values from Period 4 pigs are probably due to these animals consuming human refuse, resulting in the 15N enrichment.
40 Müldner and Richards 2005; Richards et al 2006; Jay and Richards 2007.41 Jay and Richards 2007.42 Richards et al 2006; Kosiba et al 2007.
fig 7Male and female bone collagen δ13C and δ15N isotope values with mean and standard errors for Periods 1–3
(EMG). Analytical precision: ± 0.2‰.
32 curtis-summers, montgomery and carver
Higher herbivore δ15N values from Period 4 at Portmahomack, compared to those from other sites discussed here may suggest possible differences in animal feeding strate-gies, although due to low faunal sample numbers, further investigation is needed. Although herbivore δ15N values from the British Iron-Age to medieval periods range from around +4‰ to +7‰,43 differences in regional resources and socio-economic practices may produce isotopic differences. The herbivores from Period 4 at Portmahomack may have grazed around coastal areas, such as salt marshes, which have been found to produce higher herbivore δ15N values compared to inland sites.44 The Tarbat Peninsula is near some of the most extensive areas of salt marsh in Britain,45 which may explain the Period 4 cattle δ15N value, which is higher (∆ = 2‰) than those reported by Britton et al46 This however does not explain why herbivores from the EMG at Portmahomack have lower δ15N values, although a different socio-economic strategy may simply be the cause, with herbivores from this phase being confined to inland grazing.
Relative to the faunal data, human δ13C values for the EMG reflect a predomi-nantly terrestrial C3-based diet with no input of C4 or marine resources. δ15N values for these individuals are a trophic level higher (+2–5‰) than the cattle and pigs from the same period. This, along with the archaeological faunal remains, suggests the community from the EMG were consuming a significant amount of terrestrial animal protein, such as pork, beef, lamb and dairy products. The earliest burials at Portmahomack (Period 1) have
43 Müldner and Richards 2005; Richards et al 2006; Jay and Richards 2007.44 Britton et al 2008.45 The Joint Nature Conservation Committee 2009.46 Britton et al 2008.
fig 8Human bone collagen δ13C and δ15N isotope values with mean and standard errors for Period 4 (LMG) age
categories (analytical precision: ± 0.2‰).

33pictish and medieval populations at portmahomack, scotland
δ13C and δ15N values similar to the monastic phase (Period 2), suggesting they consumed terrestrial animal protein and C3 plant foods but no marine protein consumption. Two outliers, one from Period 2 (SK144) and one from Period 4 (SK105) attest to the dietary variation that can occur within a community. The adult male from Period 2 (SK144) had higher δ13C and δ15N values than his contemporaries, suggesting that as well as consum-ing terrestrial animal protein and C3-based plant foods, he also had access to marine protein. Conversely, the adult female from Period 4 (SK105) had δ13C and δ15N values more in line with the majority of the EMG. When the isotope values for this individual are compared to the faunal results from the same period, a diet of C3-based plant foods and animal protein is suggested, with no marine protein consumed.
Contrary to the earlier periods, δ13C and δ15N values from the LMG reflect a significant trophic level increase in δ15N and a shift towards higher δ13C ratios. Based on archaeological and isotopic evidence, these inhabitants had a diet that probably included beef and lamb (including dairy foods), cereals (eg bread, pottage), pork and marine fish. Although it has been suggested that manuring significantly increases δ15N values in cere-als,47 a major component of cereal grain in the LMG diet would be needed to reflect such high δ15N values, which does not appear evident. Other explanations for greater δ13C and δ15N values in these individuals include increased δ13C values in herbivores that grazed on seaweed,48 or on salt marshes, which can increase δ15N values.49 Such occurrences would result in a shift in human carbon and nitrogen isotope ratios through consumption of these animals. Human isotope results from both the main periods of burial at Portma-homack appear to correlate with associated faunal isotope data, suggesting normal trophi c level increases and isotopic shifts, due to the consumption of animal and possibly marine protein.
dietary differences relating to sexLong cist graves are a common occurrence in south-east Scotland during the early
medieval period, yet only a small proportion have been discovered in north-east Scot-land.50 It has been suggested that long cist graves do not necessarily denote a Christian burial rite, but rather they were an existing mortuary practice adopted by religious com-munities.51 Two adult females from Period 1 (SK172 and SK166) were buried in long cist graves, which may suggest a form of differentiation in their burial rite, compared to the dug grave, containing an adult male, from the same period. The δ15N values of these individuals (Fig 7) suggest that they were consuming similar foods to the majority of the EMG, although the female sample numbers for Period 1 (n=2) and Period 2 (n=2) were too small to provide an informative statistical comparison against the corresponding males. As previously mentioned, mean δ13C and δ15N isotope values for the Period 4 male and female bone collagen (Fig 8) revealed little significant statistical difference suggesting both men and women from this group consumed similar foods of C3 plants and terrestrial and marine protein. Therefore, a gendered division in diet at Portmahomack cannot be ascertained from these data alone.
dietary differences relating to ageWhen individual δ13C and δ15N values are plotted for the 26–45 years and 46+ years
age groups from the EMG burials (Fig 9), no significant difference in diet relating to age is apparent for the corresponding males, apart from the one outlier (SK144) previously
47 Bogaard et al 2007. 48 Balasse et al 2006; 2009.49 Britton et al 2008; Beaumont et al 2012.50 Maldonado 2013.51 Ibid, 27.

34 curtis-summers, montgomery and carver
discussed. The 26–45 female (SK127) from Period 2 had slightly higher δ13C and δ15N values than the other females, although larger sample numbers would be needed to provide any conclusive interpretations. Statistical results previously mentioned revealed no significant difference for either δ13C or δ15N values between these two age groups. This suggests that individuals of different ages consumed similar foods, although the long-term average of diet represented in the adult human bone collagen measured here may hide short-term dietary fluctuations that may have occurred at particular periods of life.
Mean δ13C and δ15N isotope values for the 26–45 years and 46+ years age groups from the LMG suggest no difference in diet, although the aforementioned statistical t-test results for δ15N showed a fairly significant difference between the two age groups. This suggests that some of the 26–45 years individuals had a higher intake of animal protein than some of the 46+ years individuals (Fig 8). This is most notable in the 26–45-year-old male (SK93) that has the highest δ13C and δ15N isotope values out of the whole group and a whole trophic level difference compared to, for example, the two 45+ males (SK64 and SK113) that have the lowest δ15N isotope values out of the males from this group. This may reflect a division in the types of protein that were being consumed, with some of the younger individuals possibly consuming different types of marine protein than the older individuals. This difference may suggest a labour-division in diet, where the younger individuals’ ability to work required a better or different diet, although analysis of a larger sample size would be required to prove this conclusively.
bone and dentine collagen comparisonsAny differences between dentine and bone collagen isotope values (∆dentine-bone) may
reflect a change in diet from adolescence to adulthood.52 An increase in animal and/or
52 Sealy et al 1995.
fig 9Human bone collagen δ13C and δ15N isotope values with mean and standard errors for Periods 1–3 (EMG)
age categories (analytical precision: ± 0.2‰).

35pictish and medieval populations at portmahomack, scotland
marine protein consumption during adulthood may produce higher δ13C and δ15N values in bone collagen than in dentine collagen. δ13C and δ15N values for bone and dentine collagen were obtained for nine individuals from Periods 2–4.
Within the EMG, only one individual (SK144) had no difference in dentine to bone (∆dentine-bone) for δ15N, suggesting no significant change in protein intake during this individual’s lifetime. All δ15N values for dentine collagen from Period 2 were higher than bone collagen and δ13C values were within the C3 terrestrial range of –20‰ to –35‰.53 Conversely, two individuals (SK88 and SK113) from the LMG had higher δ13C and δ15N values in bone collagen than in dentine collagen. These differences may suggest a different protein intake during adulthood for the LMG and conversely, during childhood for the EMG individuals. The change in the LMG diet may be due to the necessity to consume more animal protein in adulthood for sustenance during the working day. The EMG dif-ference may imply that the monks at Portmahomack accepted oblates (children presented to monasteries to become monks or nuns) and their diet conformed to that of the monks by adulthood. However, although the practice of accepting oblates was common at many medieval monasteries,54 only one child burial was found from the monastic levels at Portmahomack, suggesting that oblates either survived to adulthood or this practice was not performed here.
site comparisons: an overall perspectiveWhen comparable isotope data from a selection of archaeological sites in Europe are
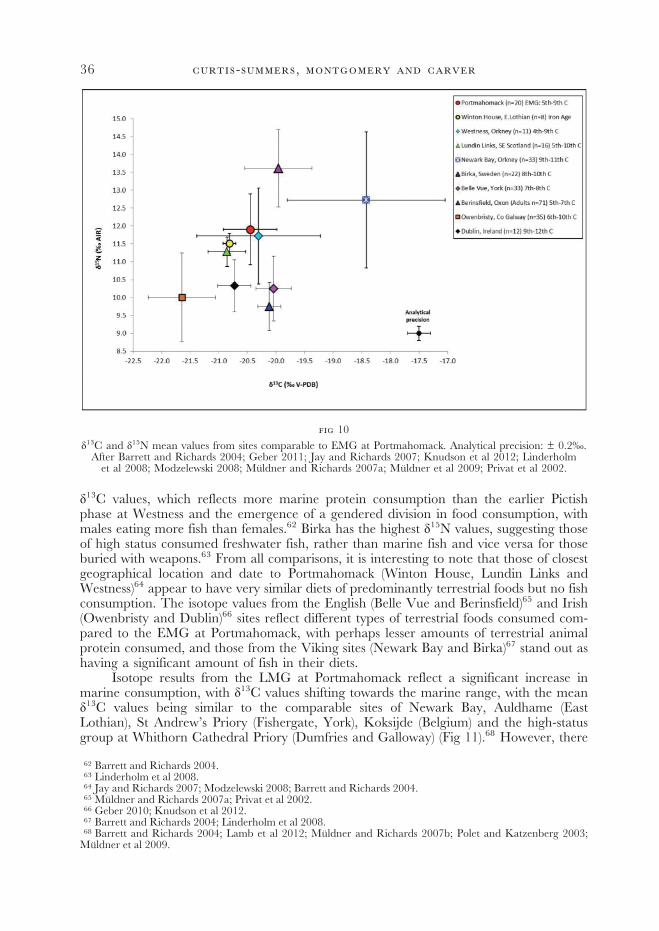
compared to the EMG and LMG results from Portmahomack, a pattern emerges that is consistent with recent studies that suggest a diachronic change in diet from the Iron-Age to medieval periods in Europe.55 The isotope data from the EMG at Portmahomack (Fig 10) has similar mean isotopic values to those from the Iron Age site of Winton House (East Lothian) and the Pictish sites of Lundin Links (Fife) and Westness (Orkney),56 which reflect a predominantly terrestrial-based diet, with significant levels of animal protein intake. Isotope results from Westness have been interpreted to suggest that some marine protein was consumed, although arable and pastoral farming was the dominant form of subsistence during the Pictish phase.57 Although these are coastal sites, the isotopic values do not reflect a significant input in marine consumption, suggesting these coastal dwellers either chose not to exploit resources from the sea or did not have the means to do so. In comparison, the sites of Belle Vue (York), Berinsfield (Oxon), Dublin (Co Dublin) and Owenbristy (Co Galway), Ireland58 all have lower δ15N values, with the latter having the least enriched δ13C values, suggesting that a diet predominantly of vegetation, rather than meat was consumed.59 When compared to the EMG at Portmahomack, these isotope values are within the same trophic level, although the lower δ15N values suggest predominant consumption of C3 plants, such as barley and wheat, with some terrestrial animal protein, although at Berinsfield and Dublin some inclusion of fish consumption is proposed.60 The two sites that stand out the most in the EMG comparisons are the Viking sites of Newark Bay (Orkney) and Birka (Sweden).61 Newark Bay has the most enriched
53 van der Merwe 1982, 598.54 Mays 2006.55 Eg Barrett et al 1999; 2001; Barrett and Richards 2004; Müldner and Richards 2005; 2007a; 2007b; Richards
et al 2006.56 Jay and Richards 2007; Modzelewski 2008; Barrett and Richards 2004.57 Barrett and Richards 2004.58 Müldner and Richards 2007a; Privat et al 2002; Knudson et al 2012; Geber 2010.59 Geber 2010.60 Privat et al 2002; Knudson et al 2012.61 Barrett and Richards 2004; Linderholm et al 2008.
36 curtis-summers, montgomery and carver
δ13C values, which reflects more marine protein consumption than the earlier Pictish phase at Westness and the emergence of a gendered division in food consumption, with males eating more fish than females.62 Birka has the highest δ15N values, suggesting those of high status consumed freshwater fish, rather than marine fish and vice versa for those buried with weapons.63 From all comparisons, it is interesting to note that those of closest geographical location and date to Portmahomack (Winton House, Lundin Links and Westness)64 appear to have very similar diets of predominantly terrestrial foods but no fish consumption. The isotope values from the English (Belle Vue and Berinsfield)65 and Irish (Owenbristy and Dublin)66 sites reflect different types of terrestrial foods consumed com-pared to the EMG at Portmahomack, with perhaps lesser amounts of terrestrial animal protein consumed, and those from the Viking sites (Newark Bay and Birka)67 stand out as having a significant amount of fish in their diets.
Isotope results from the LMG at Portmahomack reflect a significant increase in marine consumption, with δ13C values shifting towards the marine range, with the mean δ13C values being similar to the comparable sites of Newark Bay, Auldhame (East Lothian), St Andrew’s Priory (Fishergate, York), Koksijde (Belgium) and the high-status group at Whithorn Cathedral Priory (Dumfries and Galloway) (Fig 11).68 However, there
62 Barrett and Richards 2004.63 Linderholm et al 2008.64 Jay and Richards 2007; Modzelewski 2008; Barrett and Richards 2004.65 Müldner and Richards 2007a; Privat et al 2002.66 Geber 2010; Knudson et al 2012.67 Barrett and Richards 2004; Linderholm et al 2008.68 Barrett and Richards 2004; Lamb et al 2012; Müldner and Richards 2007b; Polet and Katzenberg 2003;
Müldner et al 2009.
fig 10δ13C and δ15N mean values from sites comparable to EMG at Portmahomack. Analytical precision: ± 0.2‰.
After Barrett and Richards 2004; Geber 2011; Jay and Richards 2007; Knudson et al 2012; Linderholm et al 2008; Modzelewski 2008; Müldner and Richards 2007a; Müldner et al 2009; Privat et al 2002.

37pictish and medieval populations at portmahomack, scotland
are marked differences in δ15N values between the LMG at Portmahomack and these sites, the interpretation of which ranges from possible freshwater rather than marine protein consumption at Auldhame,69 and mainly terrestrial, with some marine protein at Koksijde,70 to varying amounts of marine fish consumption at St Andrew’s Priory,71 and a significant amount of marine consumption, resulting in a ‘strong marine spike’ at Newark Bay.72 Clerics at Whithorn Cathedral Priory were consuming a greater proportion of marine foods compared to the low-status lay population.73 These results support the probability that a significant amount of marine protein was consumed by the LMG at Portmahomack, which is in stark contrast to the EMG. The least enriched in both δ13C and δ15N values are from Owenbristy, Co Galway, where there appears to be little change in terrestrial food consumption, compared to the 6th to 10th century.74 Parallels can be found at Knockrobbin Hill (Co Wicklow) and Cappogue Castle (Co Dublin), suggesting a predominance of plant-based foods with minimal terrestrial animal protein consumption.75 An increase in marine consumption in the mid- to late-medieval period has been associ-ated with growing populations and an increase in the fish trade, as well as a widespread adherence to Christian fasting practices.76
69 Lamb et al 2012.70 Polet and Katzenberg 2003.71 Müldner and Richards 2007b.72 Barrett and Richards 2004.73 Montgomery et al 2009; Müldner et al 2009.74 Geber 2010.75 Geber 2008; 2009; 2010.76 Barrett et al 2004; Barrett and Richards 2004; Müldner and Richards 2005; 2007a; 2007b.
fig 11δ13C and δ15N mean values from sites comparable to LMG at Portmahomack. Analytical precision: ± 0.2‰.
After Barrett and Richards 2004; Geber 2011; Lamb et al 2012; Müldner and Richards 2007b; Müldner et al 2009; Polet and Katzenberg 2003.

38 curtis-summers, montgomery and carver
It is suggested that in medieval Scotland the predominant dietary intake of terres-trial protein, such as lamb, beef and pork, reflected a high-status diet; marine foods, such as salted herring or cod, were consumed by lower-status individuals, with terrestrial ani-mals rarely killed for meat consumption.77 This appears to be the case at Portmahomack, where the EMG consumed terrestrial protein but no marine foods, whereas the subse-quent LMG had a wider dietary intake of foods including both terrestrial and marine protein. This is in contrast to some studies from Scottish monastic sites that suggest the monks’ consumption of fish reflected a high-status diet, whereas terrestrial protein was consumed by lower-status individuals.78 Cod fishing had increased in Tarbat by ad 1670 and by ad 1845 the New Statistical Account of Scotland recorded that herring curing became so important at Portmahomack that the population doubled in size seasonally with people coming from all over the Highlands to assist with the herring curing,79 suggesting that marine fish had become an important commodity for trade as well as consumption at Portmahomack.
CONCLUSIONS
This study has provided new faunal and human stable isotope data from Portma-homack on the Tarbat Peninsula, thereby contributing to current research themes on reconstructions of medieval diets. The 8th-century monastic community had a high terrestrial protein diet, shown by isotopic data and faunal remains to have favoured beef but not fish. The immediately preceding Period 1 (Iron Age/Pictish) and succeeding Period 3 (Scottish/Norse) phases did not differ markedly in their isotope values, but the sample size for these periods in this exploratory project was small, hence further investiga-tion with larger sample sizes is needed. The Iron-Age/Pictish assemblages included a rich deposit of barley and wheat, notably absent from the monastic phase which was probably supplied with grain from an external source.
There is a statistically significant diachronic change in diet between the early medi-eval communities who ate predominantly terrestrial plant and animal protein and the subsequent parish community at Portmahomack who also ate terrestrial plant and animal protein plus marine fish. This temporal increase in carbon and nitrogen isotope ratios was also found in the faunal data and may reflect a change in husbandry practices in the later medieval period, such as increased manuring80 and/or salt marsh grazing.81 No dietary differences relating to sex were found in the LMG, but younger adults had higher δ15N values and, although this finding was only weakly significant, it may suggest they ate more marine protein than the older individuals. No significant change in diet from childhood to adulthood was found for either the EMG or LMG.
Overall, the results are suggestive of an early medieval monastic community that reared animals for a number of uses, including human consumption, yet chose not to exploit nearby marine resources, relying heavily on terrestrial-based foods. In contrast, isotope evidence suggests the subsequent later medieval inhabitants at Portmahomack consumed a wide variety of foods, including animal protein from pork, beef, lamb and fish, which is supported by the faunal remains present. This may have been partly due to an increase in the fishing trade, which supplied a cheap and plentiful food resource.82
77 Gordon Noble pers comm; Grant 1961, 299–300.78 Eg Montgomery et al 2009; Müldner et al 2009.79 The New Statistical Account of Scotland 1845; Carver 2008, 175.80 Bogaard et al 2007.81 Britton et al 2008; Beaumont et al 2012.82 Barrett and Richards 2004.

39pictish and medieval populations at portmahomack, scotland
Archaeological evidence,83 along with stable isotope data presented here, suggests the diets of the individuals from the LMG at Portmahomack reflect a homogeneous community, who farmed the land and exploited the sea.
The results from this study are consistent with other isotope data that suggest a change in diet, from early medieval terrestrial food consumption, through to later-medieval marine exploitation in Scotland.84 Dietary reconstructions using stable isotope analysis from Scottish sites are still quite sparse compared to English sites. This study not only provides new stable isotope data from the first excavated Pictish monastery, but offers new insights into medieval diet overall, thereby contributing to a greater understanding of social, religious and economic influences on diet in Scottish antiquity. This study has reinforced the power of stable isotope analysis to shed light on a sequence of communities and their subsistence therein. Future work will explore inter- and intra-site variations of diet, combining this data with evidence of disease and trauma, in pursuit of reconstructing aspects of food consumption, nutritional health and lifestyle markers on the bodies of individuals from Portmahomack’s past.
acknowledgementsSincere thanks and gratitude to the following people: Cecily Spall for supplying the Portma-
homack samples and for her continued help and support, Michele Cadger at the Tarbat Discovery Centre, Andy Gledhill for his guidance on the isotope analysis, Professor Holger Schutkowski, Dr Gundula Müldner and Dr Gordon Noble for their advice and to two anonymous reviewers for their useful comments. The authors are extremely grateful to Historic Scotland for funding the isotope analysis.
APPENDIX A: SAMPLE PREPARATION
Approximately 200–300 mg of bone and tooth were cleaned by air abrasion and demineral-ised in 0.5 M hydrochloric acid (HCl) at a refrigerated temperature of 4° C for several days. Each sample was rinsed in deionised water (H2O) and three drops of 0.5 M dilute HCl were added to produce a pH 3 solution. The samples were then gelatinised in a Techne Dri-block DB.2A heating block at 70º C for 48 hours. After gelatinisation, each sample was fed through an Amicon® Ultra Ezee® 60–90 µm filter to a clean test tube, with the insoluble residue retained in the filter. Although an additional step of ultrafiltration is not a strict requirement of stable isotope sample preparation, its use may aid the isolation of intact ‘collagen’.85 An Amicon® Ultra -4 Centrifugal Filter tube for each sample was filled with 0.1 M sodium hydroxide solution (NaOH) and centrifuged for 20 min-utes to remove any contaminants. Each sample was placed into an ultrafilter tube and centrifuged, with the remaining filtered liquid transferred to clean test-tubes and frozen at –35º C. All samples were then freeze-dried, weighed (0.9–1.1 mg) and analysed in duplicate using a Roboprep-CN analyser, coupled to a Europa Scientific 20–20 continuous flow isotope ratio mass spectrometer (CF–IRMS). All mass-spectrometric analysis was performed at the University of Bradford’s Stable Light Isotope Facility. δ13C and δ15N ratios are reported relative to the international standards of Vienna-PDB and AIR respectively. International standards used were N2 (δ15N value of +20.41‰) and IAEA 600 (δ13C and δ15N values of –27.77‰ and +1.0‰ respectively). The analytical precision for both carbon and nitrogen was ± 0.2‰ (1σ).86
83 Carver 2008.84 Eg Barrett and Richards 2004.85 Brown et al 1988; Richards et al 2008.86 Lower case Greek letter sigma (σ) refers to standard deviation. The analytical precision for both carbon and
nitrogen was ± 0.2‰ (1σ).

40 curtis-summers, montgomery and carver
APPENDIX B
Skeleton no
Sex Period Samplematerial
Age BP C14 cal dates (AD) 95% (88%) 1σ
Lab no
169 M 1 Rib 1375±30 610–680 SUERC-33412 (GU-23373)172 F 1 L 2nd
Metatarsal1498±34; 1395±30
570–650 (mean)
OxA-9699; SUERC-37079
116 M 2 L Humerus 1268±28 680–880 OxA-13489128 M? 2 R Humerus 1364±28 640–770 OxA-13487144 M 2 R Humerus 1304±28 680–890 OxA-13488160 M? 2 L Femur 1283±27 680–880 OxA-13486171 M 2 Rib 1325±30 660–850 SUERC-33414 (GU-23375)136 M 3 Rib 1020±30 970–1040
(960–1050)SUERC-33406 (GU-23370)
147 M 3 R Humerus 1213±31 720–960 OxA-13485152 M 3 R Humerus 1120±35 780–1000 GU-9297158 M 3 R Humerus 1215±35 680–900 GU-929690 M 4 R Humerus 439±30 1460–1660 OxA-1352197 F? 4 R Humerus 475±27 1440–1640 OxA-1376298 M 4 Rib 520±30 1420–1620 SUERC-33400 (GU-23364)112 M 4 Rib 710±30 1280–1420 SUERC-33403 (GU-23367)113 M 4 R Tibia 659±27 1290–1430 OxA-13491
BIBLIOGRAPHY
Alcock, L 2003, Kings and Warriors, Craftsmen and Priests in Northern Britain AD 550–850, Soc Antiq Scot Monogr Ser 24.
Allen, J R and Anderson, J [1903] 1993, The Early Christian Monuments of Scotland, Balgavies, Forfar: Pinkfoot Press.
Balasse, M, Tresset, A and Ambrose, S H 2006, ‘Stable isotope evidence (δ13C, δ18O) for winter feeding on seaweed by Neolithic sheep of Scotland’, J Zoology 270, 170–6.
Balasse, M, Mainland, I and Richards, M P 2009, ‘Stable isotope evidence for seasonal consump-tion of marine seaweed by modern and archae-ological sheep in the Orkney archipelago (Scotland)’, Environmental Archaeol 14:1, 1–14.
Barrett, J H, Nicholson, R A and Cerón-Carrasc o, R 1999, ‘Archaeo-ichthyological evidence for long-term socioeconomic trends in Northern Scotland: 3500 bc to ad 1500’, J Archaeol Sci 26:4, 353–88.
Barrett, J, Beukens, R P and Nicholson, R A 2001, ‘Diet and ethnicity during the Viking colonization of northern Scotland: evidence from fish bones and stable carbon isotopes’, Antiquity 75:287, 145–54.
Barrett, J H, Locker, A M and Roberts, C M 2004, ‘“Dark Age Economics” revisited: the English fish bone evidence AD 600–1600’, Antiquity 78:301, 618–36.
Barrett, J H and Richards, M P 2004, ‘Identity, gender, religion and economy: new isotope and
radiocarbon evidence for marine resource intensification in early historic Orkney, Scot-land, UK’, European J Archaeol 7:3, 249–71.
Bayliss, A, Shepherd Popescu, E, Beavan-Athfield, N et al 2004, ‘The potential signifi-cance of dietary offsets for the interpretation of radiocarbon dates: an archaeologically significant example from medieval Norwich’, J Archaeol Sci 31:5, 563–75.
Beaumont, J, Geber, J, Powers, N et al 2012, ‘Victims and survivors: stable isotopes used to identify migrants from the Great Irish Famine to 19th Century London’, Am J Phys Anthropol 150, 87–98.
Benedictow, O J 2004, The Black Death, 1346–1353: The Complete History, Woodbridge: Boydell Press.
Bogaard, A, Heaton, T H E, Poulton, P et al 2007, ‘The impact of manuring on nitrogen isotope ratios in cereals: archaeological impli-cations for reconstruction of diet and crop management practices’, J Archaeol Sci 34, 335–43.
Britton, K, Müldner, G and Bell, M 2008, ‘Stable isotope evidence for salt-marsh grazing in the Bronze Age Severn Estuary, UK: implications for palaeodietary analysis at coastal sites’, J Archaeol Sci 35, 2111–18.
Brown, T A, Nelson, D E, Vogel, J S et al 1988, ‘Improved collagen extraction by modified Longin method’, Radiocarbon 30:2, 171–7.

41pictish and medieval populations at portmahomack, scotland
Carver, M O H (ed) 2005, Tarbat Discovery Pro-gramme Data Structure Report, March 2005, <www.york.ac.uk/depts/arch/staff/sites/tarbat/bulletins/datareports/2005.html> [accessed 20 November 2013].
Carver, M O H 2008, Portmahomack: Monastery of the Picts, Edinburgh: Edinburgh University Press.
Carver, M O H and Spall, C A 2004, ‘Excavating a parchmenerie: archaeological correlates of making parchment at the Pictish monastery at Portmahomack, Easter Ross’, Proc Soc Antiq Scot 134, 183–200.
Carver, M O H, Garner-Lahire, J and Spall, C A forthcoming, ‘Portmahomack on Tarbat Ness: a late Iron Age settlement, Pictish monastery, Scotto-Norse trading place and medieval township in north-east Scotland’, Proc Soc Antiq Scot.
Carver, M O H (ed) 2012, Research Excavation Sector 4 Data Structure Report, Tarbat Discovery Programme No 3.
DeNiro, M J 1985, ‘Postmortem preservation and alteration of in vivo bone collagen isotope ratios in relation to palaeodietary reconstruction’, Nature 317, 806–9.
Dyer, C C 1989, Standards of Living in the later Mid-dle Ages, Social Change in England c 1200–1520, Cambridge: Cambridge University Press.
Fuller, B T, Richards, M P and Mays, S A 2003, ‘Stable carbon and nitrogen isotope variations in tooth dentine serial sections from Wharram Percy’, J Archaeol Sci 30, 1673–84.
Garner-Lahire, J 1995, ‘Evaluation in 1994’, in M O H Carver (ed), Bulletin of the Tarbat Discovery Programme 1, <www.york.ac.uk/depts/arch/staff/sites/tarbat/bulletins/bulletin1/contents.html> [accessed 21 November 2013].
Geber, J 2008, Osteological analysis of the human remains from Knockrobbin Hill, Glebe town-land, of the Wicklow Port Access Town Relief Road project, Co Wicklow (License reference: 06E0091) (unpubl rep for Margaret Gowen and Co Ltd).
Geber, J 2009, Osteological report on the human remains from Cappogue Castle, North Co Dublin (06E0228) (unpubl rep for Margaret Gowen and Co Ltd).
Geber, J 2010, ‘Diet analysis’, in J Lehane and F Delaney (eds), ‘Archaeological excavation report E3770 — Owenbristy, Co Galway. Cashel and burial ground’, Eachtra J 8, 180–5.
Gordon, C A 1965, ‘The Pictish animals observed’, Proc Soc Antiq Scot 18, 215–24.
Grant, I F 1961, Highland Folk Ways, London: Routledge and Kegan Paul.
Gustafson, G and Koch, G 1974, ‘Age estimation up to 16 years of age based on dental develop-ment’, Odontologisk Revy 25, 297–306.
Harvey, B F 2006, ‘Monastic pittances in the Middle Ages’, in C M Woolgar (ed), Food in Medieval England: Diet and Nutrition, Oxford: Oxford University Press, 215–27.
Hedges, R E M, Clement, J G, David, C et al 2007, ‘Collagen turnover in the adult femoral mid-shaft: modeled from anthropogenic radiocarbon tracer measurements’, Am J Phys Anthropol 133, 808–16.
Hillson, S 1986, Teeth, Cambridge: Cambridge University Press.
Jay, M and Richards, M P 2007, ‘British Iron Age diet: stable isotopes and other evidence’, Proc Prehist Soc 73, 169–90.
Knudson, K J, O’Donnabhain, B, Carver, C et al 2012, ‘Migration and Viking Dublin: paleomo-bility and paleodiet through isotopic analyses’, J Archaeol Sci 39, 308–20.
Kosiba, S B, Tykot, R H and Carlsson, D 2007, ‘Stable isotopes as indicators of change in the food procurement and food preference of Viking Age and Early Christian populations on Gotland (Sweden)’, J Anthropol Archaeol 26, 394–411.
Lamb, A L, Melikian, M, Ives, R et al 2012, ‘Multi-isotope analysis of the population of the lost medieval village of Auldhame, East Lothian, Scotland’, J Analytical Atom Spectrom 27, 765–77.
Lee-Thorp, J A and Sponheimer, M 2006, ‘Con-tribution of biogeochemistry to understanding hominin dietary ecology’, Yearbook Phys Anthropol 49, 131–48.
Libby, W F, Berger, R, Mead, J et al 1964, ‘Replacement rates for human tissue from atmospheric radiocarbon’, Science 146, 1170–2.
Linderholm, A, Jonson, C H, Svensk, O et al 2008, ‘Diet and status in Birka: stable isotopes and grave goods compared’, Antiquity 82, 446–61.
Longin, R 1971, ‘New methods of collagen extraction for radiocarbon dating’, Nature 230, 241–2.
Maldonado, A 2013, ‘Burial in early medieval Scotland: new questions’, Medieval Archaeol 57, 1–34.
Mays, S 1997, ‘Carbon stable isotope ratios in mediaeval and later human skeletons from northern England’, J Archaeol Sci 24, 561–7.
Mays, S 2006, ‘The osteology of monasticism in medieval England’, in R Gowland and C K Knüsel (eds), Social Archaeology of Funerary Remains, Oxford: Oxbow, 179–89.
Mays, S, and Beavan, N 2012, ‘An investigation of diet in early Anglo-Saxon England using

42 curtis-summers, montgomery and carver
carbon and nitrogen stable isotope analysis of human bone collagen’, J Archaeol Sci 39:4, 867–74.
Meens, R 1995, ‘Pollution in the early middle ages: the case of the food regulations in penitentials’, Early Medieval Europe 4:1, 3–19.
Meens, R 2006, ‘Penitentials and the practice of penance in the tenth and eleventh centuries’, Early Medieval Europe 14:1, 17–21.
Modzelewski, K 2008, Dietary analysis of an early historical southeastern Scottish popula-tion (unpubl MA Thesis, University of Read-ing).
Montgomery, J, Müldner, G and Cook, G 2009, ‘Isotope analysis of bone collagen and tooth enamel’, in C Lowe (ed), Clothing for the Soul Divine: Burials at the Tomb of St Ninian, Excavations at Whithorn Priory, 1957–67, Historic Scotland Archaeol Rep 3, 65–82.
Müldner, G and Richards, M P 2005, ‘Fast or feast: reconstructing diet in later medieval England by stable isotope analysis’, J Archaeol Sci 32, 39–48.
Müldner, G and Richards, M P 2007a, ‘Stable isotope evidence for 1500 years of human diet at the city of York, UK’, Am J Phys Anthropol 133:1, 682–97.
Müldner, G and Richards, M P 2007b, ‘Diet and diversity at later medieval Fishergate: the isotopic evidence’, Am J Phys Anthropol 134:2, 162–74.
Müldner, G, Montgomery, J, Cook, G et al 2009, ‘Isotopes and individuals: diet and mobility among the medieval Bishops of Whithorn’, Antiquity 83, 1–15.
Müldner, G, Chenery, C and Eckardt, H 2011, ‘The “Headless Romans”: multi-isotope inves-tigations of an unusual burial ground from Roman Britain’, J Archaeol Sci 38, 280–90.
Polet, C and Katzenberg, M A 2003, ‘Recon-struction of the diet in a mediaeval monastic community from the coast of Belgium’, J Archaeol Sci 30, 525–33.
Pollard, A M, Ditchfield, P, McCullagh, J S O et al 2011, ‘These boots were made for walking: the isotopic analysis of a C4 Roman inhumation from Gravesend, Kent, UK’, Am J Phys Anthropol 146, 446–56.
Privat, K L, O’Connell, T C and Richards, M P 2002, ‘Stable isotope analysis of human and faunal remains from the Anglo-Saxon Ceme-tery at Berinsfield, Oxfordshire: dietary and social implications’, J Archaeol Sci 29, 779–90.
Richards, M P and Hedges, R E M 1999, ‘Stable isotope evidence for similarities in the types of marine foods used by late Mesolithic humans at sites along the Atlantic coast of Europe’, J Archaeol Sci 26, 717–22.
Richards, M P, Fuller, B T and Molleson, T I 2006, ‘Stable isotope palaeodietary study of humans and fauna from the multi-period (Iron Age, Viking and late medieval) site of Newark Bay, Orkney’, J Archaeol Sci 33, 122–31.
Richards, M P, Taylor, G, Steele, T et al 2008, ‘Isotopic dietary analysis of a Neanderthal and associated fauna from the site of Jonzac (Charente-Maritime), France’, J Hum Evol 55, 179–85.
Ritchie, A 1977, ‘Excavation of Pictish and Viking-age farmsteads at Buckquoy, Orkney’, Proc Soc Antiq Scot 108, 174–227.
Schoeninger, M J 1985, ‘Trophic level effects on 15N/14N and 13C/12C ratios in bone collagen and strontium levels in bone mineral’, J Hum Evol 14, 515–25.
Schoeninger, M J and DeNiro, M J 1984, ‘Nitro-gen and carbon isotopic composition of bone collagen from marine and terrestrial animals’, Geochimica et Cosmochimica Acta 48:4, 625–39.
Sealy, J, van der Merwe, N J, Lee-Thorp, J A et al 1987, ‘Nitrogen isotopic ecology in south-ern Africa: implications for environmental and dietary tracing’, Geochimica et Cosmochimica Acta 51:10, 2707–17.
Sealy, J, Armstrong, R and Schrire, C 1995, ‘Beyond lifetime averages: tracing life histories through isotopic analysis of different calcified tissues from archaeological human skeletons’, Antiquity 69, 290–300.
Sponheimer, M, Robinson, T, Ayliffe, L et al 2003, ‘Nitrogen isotopes in mammalian herbivores: hair δ15N values from a controlled feeding study’, Intl J Osteoarchaeol 13, 80–7.
Stenhouse, M J and Baxter, M S 1979, ‘The up-take of bomb 14C in humans’, in R Berger and H Suess (eds), Radiocarbon Dating, Berkeley: Uni-versity of California Press, 324–41.
The New Statistical Account of Scotland 1845, ‘By the ministers of the respective parishes under the superintendence of a committee of the Society for the Benefit of the Sons and Daughters of the Clergy’, Edinburgh: William Blackwood and Sons, 462–3.
The Joint Nature Conservation Committee (JNCC) 2009, <www.jncc.gov.uk/ProtectedSites/SACselection/sac.asp?EUCode=UK0019806> [accessed 25 October 2013].
van der Merwe, N J 1982, ‘Carbon isotope photosynthesis and archaeology’, Am Sci 70, 596–606.
van Klinken, G J 1999, ‘Bone collagen quality indicators for palaeodietary and radiocarbon measurements’, J Archaeol Sci 26, 687–95.
Wheeler, A 1977, ‘The fish bones from Buck-quoy, Orkney’, in A Ritchie (ed), Excavation of Pictish and Viking-age Farmsteads at Buckquoy, Orkney, Proc Soc Antiq Scot 108, 211–14.

43pictish and medieval populations at portmahomack, scotland
Résumé
Mise en évidence aux isotopes stables des différences de régime alimentaire entre les populations pictes et médiévales de Portma-homack, Écosse par Shirley Curtis-Summers, Janet Montgomery et Martin Carver
Le site picte et médiéval de Portmahomack renfer-mait quatre populations de squelettes appartenant respectivement à la fin de l’Âge du fer/début de la période picte (6ème/7ème siècles), à un monastère de la fin de la période picte/du début de la période médiévale (8ème siècle), à un centre marchand norvé-gien et écossais (9ème–11ème siècle) et à une paroisse de la fin du Moyen Âge (15ème siècle). Les analyses aux isotopes de carbone et d’azote réalisées sur le collagène d’ossements humains et de racines de dent prélevés sur des squelettes de chaque période ont permis de reconstituer le régime alimentaire. Le col-lagène d’ossements animaux a également été analysé pour pouvoir faire des comparaisons. Les résultats ont montré un changement marqué de régime alimentaire entre les communautés du début et de la fin de l’époque médiévale à Portmahomack. Dans les données animales, on a mis également en évidence des différences de régime alimentaire entre le début et la fin du Moyen Âge, ce qui pourrait correspondre à l’évolution des pratiques d’élevage. Vu les rares études aux isotopes de carbone et d’azote réalisées dans les collections de squelettes d’époque médiévale provenant de nombreuses régions de Grande-Bretagne et d’Irlande, cette étude apporte des donnée s précieuses qui viennent enrichir nos connaissances sur la consommation d’aliments et les moyens de subsistance à l’époque médiévale.
Zusammenfassung
Nachweis von Ernährungsunterschieden zwischen der piktischen und mittelalterli-chen Bevölkerung in Portmahomack, Schottland, mit Hilfe stabiler Isotope von Shirley Curtis-Summers, Janet Montgomery und Martin Carver
Die piktischen und mittelalterlichen Fundstätten in Portmahomack umfassen vier Populationen von Skeletten, die aus der späten Eisenzeit /frühen piktischen Zeit (6/7 Jh), aus einem Kloster der späten piktischen/frühmittelalterlichen Zeit (8 Jh), aus einem nordischen und schottischen Handelsort (9–11 Jh), beziehungsweise einer spätmittelalterliche n Kirchengemeinde (15 Jh) stammen. Die Analyse von
Kohlenstoff- und Stickstoffisotopen in Knochen und dem Collagen der Zahnwurzeln verschiedener aus-gewählter Individuen aus den jeweiligen Zeitaltern wurden gemessen, um einen Rückschluss auf deren Ernährung zu erhalten. Ebenfalls wurde das Collagen von Tieren untersucht, um einen Ernährungsvergleich zu bekommen. Die Ergebnisse zeigen eine merkliche Veränderung in der Ernährung zwischen den früh- und spätmittelalterlichen Gemei-nden in Portmahomack. Die Tierdaten wiesen eben-falls einen Unterschied in der Ernährung zwischen der frühmittelalterlichen und der spätmittelalterli-chen Zeit auf, der vielleicht auf Veränderungen in der Tierhaltung zurückgeht. Wegen des Mangels an Untersuchungen von Kohlenstoff- und Stickstoffiso-topen an Sammlungen mittelalterlicher Skelette in vielen Gegenden Großbritanniens und Irlands bietet diese Untersuchung wertvolle Daten, die unser Wissen über Nahrungsaufnahme und Ernährung im Mittelalter erweitern.
Riassunto
La diversità di dieta tra popolazioni Pitte e medievali a Portmahomack in Scozia emers a dalle analisi con isotopi stabili di Shirley Curtis-Summers, Janet Montgomery e Martin Carver
Nel sito Pitto e medievale di Portmahomack si sono rinvenuti scheletri di quattro diverse popolazioni appartenenti rispettivamente alla tarda età del ferro / primo periodo Pitto (VI / VII sec), a un monastero del tardo periodo Pitto / altomedievale (VIII sec), a una località di scambi commerciali norrena e scozz-ese (dal IX all’ XI secolo) e a una parrocchia tardo-medievale (XV secolo). Per la ricostruzione della dieta si sono eseguite le misurazioni delle analisi iso-topiche del carbonio e dell’azoto sul collagene osseo e dentale di alcuni individui campione di ciascun periodo e, a scopo comparativo, si è inoltre analiz-zato il collagene osseo faunistico. I risultati dimostran o una netta differenza di dieta tra le popolazioni altomedievali e tardomedievali di Portmahomack. Anche i dati faunistici hanno presentato differenze tra il periodo altomedievale e quello tardomedievale, forse attribuibili a un cambiamento nelle pratiche agricole. Poiché c’è una carenza di studi con isotopi del carbonio e dell’azoto su collezioni di scheletri medievali di molte zone della Gran Bretagna e dell’Irlanda, questa ricerca fornisce dati preziosi per accrescere la nostra conoscenza sul consumo di cibo e sulla sussistenza durante il Medioevo.
Related Documents