ORIGINAL RESEARCH ARTICLE published: 28 February 2014 doi: 10.3389/fnins.2014.00025 Stable individual characteristics in the perception of multiple embedded patterns in multistable auditory stimuli Susan Denham 1,2 *, Tamás M. Bõhm 3,4 , Alexandra Bendixen 5 , Orsolya Szalárdy 3,6 , Zsuzsanna Kocsis 3,6 , Robert Mill 1 and István Winkler 3,7 1 Cognition Institute, University of Plymouth, Plymouth,UK 2 School of Psychology, University of Plymouth, Plymouth, UK 3 Research Centre for Natural Sciences, Institute of Cognitive Neuroscience and Psychology, Hungarian Academy of Sciences, Budapest, Hungary 4 Department of Telecommunications and Media Informatics, Budapest University of Technology and Economics, Budapest, Hungary 5 Auditory Psychophysiology Lab, Department of Psychology, Cluster of Excellence “Hearing4all” , European Medical School, Carl von Ossietzky University of Oldenburg, Oldenburg, Germany 6 Department of Cognitive Science, Budapest University of Technology and Economics, Budapest, Hungary 7 Institute of Psychology, University of Szeged, Szeged, Hungary Edited by: Susann Deike, Leibniz Institute for Neurobiology, Germany Reviewed by: Claude Alain, Rotman Research Institute, Canada Peter Lakatos, Hungarian Academy of Sciences, Hungary *Correspondence: Susan Denham, School of Psychology, University of Plymouth, Drake Circus, Plymouth, PL4 8aa, UK e-mail: [email protected] The ability of the auditory system to parse complex scenes into component objects in order to extract information from the environment is very robust, yet the processing principles underlying this ability are still not well understood. This study was designed to investigate the proposal that the auditory system constructs multiple interpretations of the acoustic scene in parallel, based on the finding that when listening to a long repetitive sequence listeners report switching between different perceptual organizations. Using the “ABA-” auditory streaming paradigm we trained listeners until they could reliably recognize all possible embedded patterns of length four which could in principle be extracted from the sequence, and in a series of test sessions investigated their spontaneous reports of those patterns. With the training allowing them to identify and mark a wider variety of possible patterns, participants spontaneously reported many more patterns than the ones traditionally assumed (Integrated vs. Segregated). Despite receiving consistent training and despite the apparent randomness of perceptual switching, we found individual switching patterns were idiosyncratic; i.e., the perceptual switching patterns of each participant were more similar to their own switching patterns in different sessions than to those of other participants. These individual differences were found to be preserved even between test sessions held a year after the initial experiment. Our results support the idea that the auditory system attempts to extract an exhaustive set of embedded patterns which can be used to generate expectations of future events and which by competing for dominance give rise to (changing) perceptual awareness, with the characteristics of pattern discovery and perceptual competition having a strong idiosyncratic component. Perceptual multistability thus provides a means for characterizing both general mechanisms and individual differences in human perception. Keywords: auditory scene analysis, multistability, auditory streaming, perceptual switching, individual differences INTRODUCTION Most sound sources of interest in the world around us emit sequences of sound events, e.g., the notes in a birdsong or the words spoken in conversation. These sounds are seldom present in isolation and typical sound events consist of many time- varying components. The problem for auditory perception is to parse this complex scene, and to do so in a timely manner that allows us to interact appropriately with the sound emitting objects of interest. The problem of grouping, both the simul- taneously present components that belong to the same sound event, and the sequential associations between events emitted by the same source, is known as auditory scene analysis (Bregman, 1990). Understanding this seemingly effortless process of per- ceptual organization is an essential step toward explaining what determines our conscious perceptions of the world. Most of the studies in this field to date have focused on trying to identify the general processing strategies used by the human brain for pars- ing the auditory scene. In doing so, inter-individual differences have typically been treated as a source of noise in the experi- mental data, as is the case in many cognitive studies (cf. Kanai and Rees, 2011). In the current study, we asked whether the pat- terns of responses obtained from individual listeners are stable characteristics of the person. Sequential grouping in auditory scene analysis has typically been studied using the auditory streaming paradigm: ABA-ABA- silent interval with the same duration as the two sounds (van Noorden, 1975; Bregman, 1990). There has been a long-standing assumption that in listening to such a sound sequence, listeners make a perceptual decision between integration (the grouping of www.frontiersin.org February 2014 | Volume 8 | Article 25 | 1 where A and B denote different sounds and “-” stands for a

Welcome message from author
This document is posted to help you gain knowledge. Please leave a comment to let me know what you think about it! Share it to your friends and learn new things together.
Transcript
ORIGINAL RESEARCH ARTICLEpublished: 28 February 2014
doi: 10.3389/fnins.2014.00025
Stable individual characteristics in the perception ofmultiple embedded patterns in multistable auditory stimuliSusan Denham1,2*, Tamás M. Bõhm3,4, Alexandra Bendixen5, Orsolya Szalárdy3,6,
Zsuzsanna Kocsis3,6, Robert Mill 1 and István Winkler3,7
1 Cognition Institute, University of Plymouth, Plymouth,UK2 School of Psychology, University of Plymouth, Plymouth, UK3 Research Centre for Natural Sciences, Institute of Cognitive Neuroscience and Psychology, Hungarian Academy of Sciences, Budapest, Hungary4 Department of Telecommunications and Media Informatics, Budapest University of Technology and Economics, Budapest, Hungary5 Auditory Psychophysiology Lab, Department of Psychology, Cluster of Excellence “Hearing4all”, European Medical School, Carl von Ossietzky University of
Oldenburg, Oldenburg, Germany6 Department of Cognitive Science, Budapest University of Technology and Economics, Budapest, Hungary7 Institute of Psychology, University of Szeged, Szeged, Hungary
Edited by:
Susann Deike, Leibniz Institute forNeurobiology, Germany
Reviewed by:
Claude Alain, Rotman ResearchInstitute, CanadaPeter Lakatos, Hungarian Academyof Sciences, Hungary
*Correspondence:
Susan Denham, School ofPsychology, University of Plymouth,Drake Circus, Plymouth, PL4 8aa,UKe-mail: [email protected]
The ability of the auditory system to parse complex scenes into component objects inorder to extract information from the environment is very robust, yet the processingprinciples underlying this ability are still not well understood. This study was designedto investigate the proposal that the auditory system constructs multiple interpretations ofthe acoustic scene in parallel, based on the finding that when listening to a long repetitivesequence listeners report switching between different perceptual organizations. Using the“ABA-” auditory streaming paradigm we trained listeners until they could reliably recognizeall possible embedded patterns of length four which could in principle be extracted fromthe sequence, and in a series of test sessions investigated their spontaneous reportsof those patterns. With the training allowing them to identify and mark a wider varietyof possible patterns, participants spontaneously reported many more patterns than theones traditionally assumed (Integrated vs. Segregated). Despite receiving consistenttraining and despite the apparent randomness of perceptual switching, we found individualswitching patterns were idiosyncratic; i.e., the perceptual switching patterns of eachparticipant were more similar to their own switching patterns in different sessions than tothose of other participants. These individual differences were found to be preserved evenbetween test sessions held a year after the initial experiment. Our results support theidea that the auditory system attempts to extract an exhaustive set of embedded patternswhich can be used to generate expectations of future events and which by competing fordominance give rise to (changing) perceptual awareness, with the characteristics of patterndiscovery and perceptual competition having a strong idiosyncratic component. Perceptualmultistability thus provides a means for characterizing both general mechanisms andindividual differences in human perception.
Keywords: auditory scene analysis, multistability, auditory streaming, perceptual switching, individual differences
INTRODUCTIONMost sound sources of interest in the world around us emitsequences of sound events, e.g., the notes in a birdsong or thewords spoken in conversation. These sounds are seldom presentin isolation and typical sound events consist of many time-varying components. The problem for auditory perception isto parse this complex scene, and to do so in a timely mannerthat allows us to interact appropriately with the sound emittingobjects of interest. The problem of grouping, both the simul-taneously present components that belong to the same soundevent, and the sequential associations between events emitted bythe same source, is known as auditory scene analysis (Bregman,1990). Understanding this seemingly effortless process of per-ceptual organization is an essential step toward explaining whatdetermines our conscious perceptions of the world. Most of the
studies in this field to date have focused on trying to identify thegeneral processing strategies used by the human brain for pars-ing the auditory scene. In doing so, inter-individual differenceshave typically been treated as a source of noise in the experi-mental data, as is the case in many cognitive studies (cf. Kanaiand Rees, 2011). In the current study, we asked whether the pat-terns of responses obtained from individual listeners are stablecharacteristics of the person.
Sequential grouping in auditory scene analysis has typicallybeen studied using the auditory streaming paradigm: ABA-ABA-
silent interval with the same duration as the two sounds (vanNoorden, 1975; Bregman, 1990). There has been a long-standingassumption that in listening to such a sound sequence, listenersmake a perceptual decision between integration (the grouping of
www.frontiersin.org February 2014 | Volume 8 | Article 25 | 1
where A and B denote different sounds and “-” stands for a

Denham et al. Stable individual characteristics
all sounds into the same stream, perceived as a repeating ABA-pattern) and segregation (the parsing of the sequence into two sep-arate streams, perceived as repeating A- and B--- patterns, withone in the foreground and the other in the background). Thisperceptual decision is influenced by the distinctiveness (or simi-larity) of the A and B tones (e.g., differences in frequency, locationor timbre) and the rate at which the sounds are presented (fora review see Moore and Gockel, 2012). The trade-off betweensimilarity and presentation rate has led to the suggestion thatin audition the Gestalt principle of similarity (Köhler, 1947) ismediated by time; i.e., similarity and good continuation combineto determine the likelihood of sequential grouping (Jones, 1976;Winkler et al., 2012; Denham and Winkler, 2014).
In most studies it has been assumed that integration and seg-regation are the only perceptual organizations possible, and thatthey are mutually exclusive (van Noorden, 1975). In addition,because it was thought that integration was always perceived firstand that the build-up of segregation was a rather slow process(on the order of several seconds) (Anstis and Saida, 1985), it wassuggested that perceptual organization could be viewed as a pro-cess in which the auditory system accumulates evidence in favorof an appropriate perceptual decision (Bregman, 1990). However,a number of recent experiments have challenged these ideas.Firstly, it has been found that there are other possible perceptualorganizations, and, when given the possibility to do so, listen-ers also report hearing repeating patterns, sometimes for ratherlong periods of time, which do not match either of the patternsdescribed above (Bendixen et al., 2010; Denham et al., 2013).Secondly, rather than fixing on a single perceptual decision, givensufficient time, perception switches between alternative interpre-tations of the sequence (Denham and Winkler, 2006; Pressnitzerand Hupé, 2006) and does so for all combinations of frequencydifference and presentation rate tested to date, even those thathave been assumed to be strongly biased toward either integra-tion or segregation (Denham et al., 2013). Thirdly, segregationis often reported first for some parameter combinations (Deikeet al., 2012; Denham et al., 2013), and the gradual build-up ofsegregation has been shown to be to some extent an artifact of theanalysis and visualization methods used (Deike et al., 2012).
Based on these new findings it has been proposed that per-ceptual organization is a process in which the auditory systemcontinually attempts to discover patterns (or regularities) in theincoming sequence (Winkler et al., 2012; Denham and Winkler,2014). Multiple such patterns may be detected embedded in asequence and represented in parallel. Consistent with theories ofbinocular rivalry (for a review see Logothetis et al., 1996), the pro-posal is that a sequence of conscious perceptual states arises as aresult of ongoing competition for perceptual dominance betweenconcurrent rivaling percepts; evidence for which has been foundin an auditory mismatch negativity experiment (Horváth et al.,2001). The ease with which each pattern is discovered (related tothe notion of similarity described above) determines how likely itis that the pattern will be perceived, especially at the beginning ofa sound sequence. The auditory system uses each detected pat-tern to generate expectations of future events, that, if violated,signal new (i.e., as yet unmodeled) information in the sequence.Patterns that predict the same events compete for dominance.
Compatible patterns, i.e., those that do not attempt to predictthe same events, form cooperative groups that give rise to theperceptual organizations reported by listeners. Perceptual switch-ing between these cooperative groups, and the correspondingchanges in perceptual awareness, are caused by the competitionbetween incompatible patterns (Winkler et al., 2012). A compu-tational model based on these principles successfully replicatedmany of the phenomena of perceptual bi-stability in the auditorystreaming paradigm (Mill et al., 2013).
EXPERIMENT 1In our previous experiments, having realized that participantssometimes experienced organizations other than integration andsegregation, we used instructions that provided participants witha wider range of possible reports (e.g., see Bendixen et al., 2010;Denham et al., 2013). Participants were instructed to report inte-gration if all tones in the sequence were perceived as belonging toa single repeating pattern (i.e., a single stream); segregation, if thesequence was perceived as consisting of two repeating patterns (orstreams), one containing only the A tones and the other only theB tones; both, if the sequence was perceived as consisting of twostreams, one containing both A and B tones, and the other onlyA or only B tones; and finally, none, if no repeating pattern wasdetected. Over the course of many experiments we found that (1)both is reported on average between 10 and 30% of the total dura-tion, (2) both is almost never reported as the first percept, (3) theincidence of both percepts varies considerably between listeners,and (4) there is a tendency for both reports to be more commonfor parameter combinations supporting more evenly balancedproportions of integration and segregation (Bendixen et al., 2010,2013; Denham et al., 2013; Szalárdy et al., 2013).
Although these experiments have supported the idea that per-ceptual organizations other than integration and segregation canbe perceived when listening to the ABA- sequence, precisely whatpatterns listeners perceive when they report both has not beenpreviously investigated. One possibility is that only integrationand segregation are perceived but there is sometimes very rapidswitching between them, and since there is some sluggishness inthe system, listeners simply report both. In this case we wouldexpect to find no explicit reports of distinctive patterns otherthan ABA-, A-, or B---. Another possibility, suggested by ourmodeling studies, is that the auditory system finds many pat-terns embedded even within this simple sequence, which resultsin the emergence of other compatible groups and thus other per-ceptual organizations; see Figure 1. In the experiments reportedhere, we investigated whether listeners spontaneously report per-ceiving these more uncommon patterns and, if so, to what extenttheir perception is influenced by stimulus parameters.
In order for participants to be able to quickly and reliablyreport what they perceived and to associate the possible patternswith the user interface controls, each participant attended a seriesof training sessions prior to the commencement of the mainexperiment. Previous work (Rogers and Bregman, 1993; Snyderet al., 2008, 2009b; Haywood and Roberts, 2011, 2013) has shownstrong contextual effects of prior learning on auditory stream-ing. However, these studies of contextual influences on perceptionhave typically involved within-session manipulations, and the
Frontiers in Neuroscience | Auditory Cognitive Neuroscience February 2014 | Volume 8 | Article 25 | 2

Denham et al. Stable individual characteristics
FIGURE 1 | Embedded repeating patterns up to length four that can, in
theory, be perceived by listeners in the auditory streaming paradigm.
Yellow rectangles indicate the foreground pattern. Feature differences, inthis case frequency differences, are indicated by displacement in a verticaldirection for the tones in each sequence. The foreground and compatible(background) patterns for each dominant (emphasized) pattern are indicatedto the right in letter form.
perceptual effects have been probed using stimuli of rather shortduration (generally <10 s). To our knowledge the experiments inthis report are the first to include extensive multi-session training.In addition, we are concerned here not with differential effects ofprior training on perception, but rather with the reliability of par-ticipants’ ability to correctly categorize the specific patterns thatmay occupy their perceptual awareness.
Although the characteristics of perceptual switching areknown to be very stochastic (Levelt, 1968), it is also knownthat some characteristics, e.g., typical switching rates, may berather idiosyncratic (Aafjes et al., 1966; Kanai et al., 2010). Wetherefore investigated whether there was internal consistency inthe data; i.e., whether individual listeners’ perceptual switchingbehavior was similar across sessions. If so, this would providesome measure of confidence that listeners were reporting whatthey perceived, and were reliably engaged in the task. Addressingthis question required us to conduct numerous (10 or more) ses-sions with each individual listener, and hence we involved only asmall number of experimental participants (N = 6).
In summary, the two aims of the study were: (1) to determinewhether listeners at least occasionally experience sequences cre-ated according to the auditory streaming paradigm in terms ofpercepts outside the traditional integrated and segregated soundorganizations, and (2) to assess whether the perceptual reportsof individual listeners show stable consistent characteristics (i.e.,whether the patterns of perceptual reports are more similar withina single listener across sessions than between different listeners).
METHODSParticipantsSix healthy volunteers (mean age 22.3 years, range 19–25 years;all right-handed; 4 male, 2 female) took part in Experiment 1,which was conducted over numerous sessions over a period ofapproximately 1 month. All participants had reportedly normalhearing. None of the participants were taking any medicationaffecting the central nervous system. In compliance with theDeclaration of Helsinki, participants gave written informed con-sent after the experimental procedures had been explained to
them. Participants received modest financial compensation fortheir participation.
StimuliSinusoidal tones of 75 ms (ms) duration (including 10 ms rise andfall times) and with an intensity of 40 dB sensation level (abovehearing threshold, adjusted individually for each participant)were arranged according to the auditory streaming paradigm (acyclically repeating “ABA-” pattern) in five stimulus conditions,with frequency difference (�f ) and stimulus onset asynchrony(SOA, onset to onset time interval) as follows: (1) �f = 3 semi-tones (st), SOA = 100 ms; (2) �f = 16 st, SOA = 100 ms; (3)�f = 7 st, SOA = 150 ms; (4) �f = 3 st, SOA = 200 ms; (5)�f = 16 st, SOA = 200 ms. The frequency of the “A” tones was400 Hz, and the frequency of the “B” tones was n semitoneshigher, depending on condition. At each test session, participantswere presented with 10 min long ABA- tone sequences, one foreach of the five conditions, delivered in a randomized order. Anextra 30 s verification segment (see the Test procedure section) wasappended to the end of each 10-min long stimulus block.
Apparatus and proceduresParticipants were seated in an acoustically shielded chamber.Sounds were presented binaurally via headphones. Responseswere given using a touch-screen monitor. As illustrated inFigure 1, restricting the patterns to length no longer than four,there are six possible patterns that can be extracted from the ABA-sequence; ABA-, AB--, -BA-, A-, A---, and B---. A specific area ofthe display was assigned to each of these response options (indi-cated by color and graphical icon). A further area (gray, “0”)allowed listeners to indicate when they could not decide betweenthe patterns (confused). Participants were required to use theindex finger of their right hand to press the button correspondingto the pattern they experienced, and to keep the button depressedfor as long as they continued hearing the pattern. The interfacedid not allow multiple responses to be reported simultaneously.A screenshot of the response screen with one “response button”pressed can be seen in Figure 2.
Training procedureIn order to make sure that listeners understood how each patternsounds, and could reliably report their percepts, they attended anumber of training sessions before the main experiment. In thesesessions they learnt to use the response interface, and to report thedominant (foreground) pattern that they perceived. A detailed logof each participant’s training history was kept. The experimenterscreened performance to decide when to stop training. Only oncelisteners could reliably report the entire set of patterns were theyready to take part in the main experiment.
In each training session the experimenter adaptively adjustedthe training procedure in accord with the participants’ level ofunderstanding and performance. Two pattern repetition speedswere pre-assigned by varying the silent period; slow ABA-- andnormal ABA-, where “-” is a silent period corresponding to theSOA. Participants started with putatively easier tasks, and thenproceeded to more difficult ones as their performance improved.The teaching procedure started with a demonstration in which
www.frontiersin.org February 2014 | Volume 8 | Article 25 | 3

Denham et al. Stable individual characteristics
FIGURE 2 | Response interface. Participants were instructed to press thecolored area corresponding to their dominant (foreground) percept, asindicated by the icons. Starting from the lowest area these patterns can beexpressed using letters as ABA-, AB- -, -BA-, A-, A- - -, B- - -, confused (grayarea “0”). In this screen shot, the -BA- pattern is being reported as thecurrently perceived pattern (indicated by higher intensity and the whitesegment at the outer edge of the region).
the participants listened to each of the possible patterns wherethe tones not included in the pattern were left out and the cor-responding button was depressed on the screen. Next, they werepresented with blocks in which the order of the patterns wererandomized and the duration of the patterns were also different.Participants had to press the button corresponding to their per-cept. These blocks were repeated for as long as the experimenterconsidered it necessary.
Next, the different patterns were introduced by means ofemphasis, i.e., tones not part of the pattern were attenuated(−18 dB). Once again participants were asked to observe each ofthe possible pattern and button combinations, as explained above.Then they were presented with blocks in which the order of thepatterns were randomized and the duration of the patterns werealso different. Participants had to press the button correspondingto their percept. These blocks were again repeated for as long asthe experimenter considered it necessary.
Over the course of three or four sessions these tasks wererepeated until the participants reached the point where they wereable to confidently identify the patterns. Finally, one or two blocksidentical to the test procedure were administered to prepare themfor the test sessions.
Test procedureOnce their training had been completed, participants attendedseven test sessions spread over a period of approximately 1 monthwith at least 2 days between consecutive sessions.
At the start of each test session the experimenter made surethat participants remembered the patterns they were required toreport using both auditory and visual illustrations. They were alsoreminded of their task by means of two to four training blocks inwhich the various patterns were emphasized, as described above.
Participants were instructed to listen to the tone sequences andto continuously indicate their percepts by depressing the region ofthe touch-screen corresponding to the pattern that was currentlymost prominent. Participants were encouraged to employ a neu-tral listening set, and to refrain from attempting to hear out one oranother pattern. A break of at least 30 s separated successive stim-ulus blocks, with additional time given to participants as needed.Each test session lasted up to 1.5 h.
A criticism that has been leveled at the auditory streamingparadigm is that it relies on listeners being able to make accu-rate subjective reports of their perceptions. It is of course difficultto verify whether someone is actually reporting what they hear,rather than simply pressing buttons randomly or in order to sat-isfy the experimenter. We tried to address this issue in two ways.Firstly, an extra 30 s verification segment was appended to theend of each 10-min long stimulus block. In these verification seg-ments, one of the six patterns (ABA-, AB--, -BA-, A-, A---, B---),randomly chosen, was emphasized by attenuating all non-patterntones (−18 dB); i.e., the stimulation was identical to those usedfor training. If listeners are correctly reporting their percepts, thenthey should report the emphasized pattern during this period.Secondly, listeners performed the main experiment repeatedlyand on different occasions (i.e., in seven separate sessions spreadover a period of approximately 1 month). The rationale was thatrandom button pressing should not lead to consistent responsepatterns across sessions. Altogether, including training sessions,four participants took part in 10 sessions, while two participantstook part in 11.
Data recording and analysisThe state of the response buttons was continuously recorded at anominal sampling rate of 250 Hz. However, due to the use of thegraphical user interface for collecting data, it was not possible toguarantee a strictly regular sampling. For this reason the raw datawas resampled at a regular 4 ms sampling period. Before analysingthe button presses, because there was an explicit button for partic-ipants to use if they were confused or heard none of the patterns,we removed the phases where no button was pressed. In addi-tion, all cases in which the duration between successive changesin response (termed a perceptual phase) was shorter than 300 mswere discarded because these were assumed not to result fromintentional reports (Moreno-Bote et al., 2010). In Experiment 1the data removed in these ways amounted to 3.6% of the totaldata duration.
To check that participants were performing the task correctly,the verification data was analyzed to determine the total pro-portion of time spent reporting the emphasized pattern. Thelatency for switching to the emphasized pattern from the startof the verification section was also extracted in order to takeaccount of the time taken for the emphasized pattern to over-come the dominance of whatever pattern participants perceivedat the time the verification section started. The combination of
Frontiers in Neuroscience | Auditory Cognitive Neuroscience February 2014 | Volume 8 | Article 25 | 4

Denham et al. Stable individual characteristics
these two durations gives a good account of the accuracy withwhich participants could identify and report each of the patterns.
To investigate the dynamics of the discovery of alternative pat-terns, the latency for the first report of each pattern was extractedfor each participant for each session and condition. It is not neces-sarily the case that all patterns are experienced, but if they are thisgives a measure of how quickly they are discovered by the auditorysystem. Perceptual phase durations in both auditory and visualmultistability experiments are typically log normally distributed(Pressnitzer and Hupé, 2006). Therefore, mean phase durationsare usually calculated by finding the mean value in the log domainand then converting back to the linear domain. However, herewe found that in some cases the duration data (especially thelatency to the first report of each pattern) was not log normallydistributed, so for consistency, summary durations are given asthe median of the corresponding data.
To characterize the perceptual switching patterns of partic-ipants in response to the tone sequences and to analyse theparameter dependence of perception, transition matrices wereconstructed using the method described by Denham et al. (2012).Each transition matrix is a 7 × 7 matrix with elements that rep-resent the probability of switching from one percept to anotherpercept (i.e., seven possibilities in all: six patterns and con-fused), with the percept of origin corresponding to the col-umn and the destination percept to the row of the element.A global transition matrix that summarizes all of the switchingpatterns found in the experiment was constructed by count-ing the number of occurrences of each transition for all of thedata recorded during the experiment. From this matrix, theoverall proportions and phase durations of each percept wereextracted. A set of five condition transition matrices were con-structed by counting the number of occurrences of each possibletransition, pooling all participants and all test sessions for eachcondition separately. To analyse individual differences betweenparticipants, participant transition matrices were constructed, oneper participant per session. The participant transition matri-ces were calculated by counting the number of occurrences ofeach possible transition, pooling responses from all conditionsfor each participant within each test session. As explained inDenham et al. (2012), the global transition matrix provides neu-tral default values in the case of missing transitions for themore restricted data sets used to construct the condition andparticipant matrices.
Individual differences were investigated using the participanttransition matrices. The Kullback-Leibler divergence (Kullback,1959) between each matrix from an individual participant (intra-participant distances) and between each individual participant’smatrices and all other participants’ transition matrices (inter-participant distances) was used as a measure of similarity betweenperceptual switching patterns. This is a richer characterization ofperceptual switching than the switching rate measure usually usedin this regard.
The overall distributions of the proportions of each of the pat-terns were compared using a repeated-measures ANOVA. Theeffects of condition on the proportion of each pattern were ana-lyzed using a repeated-measures ANOVA followed by post-hocpairwise comparisons using a pairwise sign test to analyse the
influence of stimulus parameters on the proportion of segregated,integrated and both phases. The distributions of overall phasedurations were analyzed using a repeated-measures ANOVA andpairwise Wilcoxon rank sum tests. Wilcoxon rank sum tests wereused to compare cumulative latency distributions. Finally, the dis-tributions of intra- vs. inter-individual differences were comparedseparately for each participant using a Wilcoxon rank sum test.The significance of all statistical tests was assessed at the 95%confidence level (α = 0.05). All analyses were carried out usingMatlab and the Matlab Statistics Toolbox.
RESULTSUnusable dataThree sessions were affected by problems with the user interface,as indicated by the occurrence of blocks in which no responseswere recorded. These sessions (participant 1, session 8, partici-pant 2, sessions 7 and 8) were excluded from the analysis.
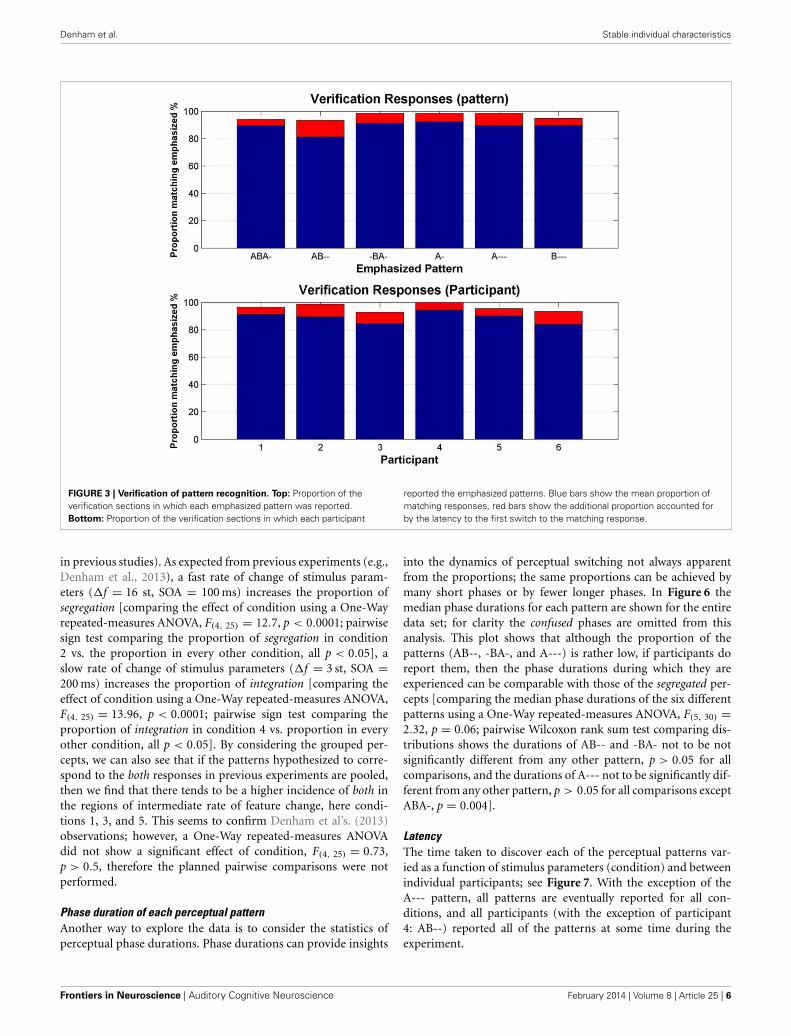
Verification dataThe mean proportion of the total duration of the verificationresponses (i.e., those made during the 30 s verification sequencesappended to the end of the test block, in which particular pat-terns were emphasized) matching the emphasized patterns was88.9%; 96.2%, if the latency to switch to the emphasized pat-tern is included. The latency to the first switch to the emphasizedresponse accounted for a mean of 2.2 s. Figure 3 shows this dataaccording to pattern and according to participant. Overall, these“catch” sections showed that participants reliably categorized eachemphasized pattern.
Proportion of each perceptual patternThe first question we wished to address was whether partici-pants would perceive all of the patterns they encountered duringtraining, or whether only the conventional patterns of integra-tion (ABA-) and segregation (A-, B---) would be reported. Theperceptual reports of all participants, across all test sessions andall conditions were pooled to investigate the overall occurrenceof each pattern. We found that all of the patterns in the train-ing data were reported during the experimental sequences. Thedistribution of the proportions of each varied widely [compar-ing the pattern proportions using a One-Way repeated-measuresANOVA, F(6, 35) = 30.85, p < 0.0001]; Figure 4 (top). Pairwisecomparisons between patterns show that all pattern proportions(except AB-- and A--- p = 0.2, AB-- and confused p = 0.14, -BA-and A- p = 0.22, -BA- and B--- p = 0.46, and A--- and confused,p = 0.32) are significantly different from each other, p < 0.05.Figure 4 (bottom), shows the proportions resulting from poolingthe response alternatives into the categories used in our previ-ous studies, integrated, segregated and both (none was excludedbecause of the very low incidence of confused, and the removalof all instances of no button press); these proportions are compa-rable with those found in previous experiments (e.g., Bendixenet al., 2010; Denham et al., 2013).
The parameter dependence of the proportion of time duringwhich each pattern was perceived was analyzed using the condi-tion transition matrices, both for the original responses and forthe pooled responses (i.e., pooled for the response categories used
www.frontiersin.org February 2014 | Volume 8 | Article 25 | 5
Denham et al. Stable individual characteristics
FIGURE 3 | Verification of pattern recognition. Top: Proportion of theverification sections in which each emphasized pattern was reported.Bottom: Proportion of the verification sections in which each participant
reported the emphasized patterns. Blue bars show the mean proportion ofmatching responses, red bars show the additional proportion accounted forby the latency to the first switch to the matching response.
in previous studies). As expected from previous experiments (e.g.,Denham et al., 2013), a fast rate of change of stimulus param-eters (�f = 16 st, SOA = 100 ms) increases the proportion ofsegregation [comparing the effect of condition using a One-Wayrepeated-measures ANOVA, F(4, 25) = 12.7, p < 0.0001; pairwisesign test comparing the proportion of segregation in condition2 vs. the proportion in every other condition, all p < 0.05], aslow rate of change of stimulus parameters (�f = 3 st, SOA =200 ms) increases the proportion of integration [comparing theeffect of condition using a One-Way repeated-measures ANOVA,F(4, 25) = 13.96, p < 0.0001; pairwise sign test comparing theproportion of integration in condition 4 vs. proportion in everyother condition, all p < 0.05]. By considering the grouped per-cepts, we can also see that if the patterns hypothesized to corre-spond to the both responses in previous experiments are pooled,then we find that there tends to be a higher incidence of both inthe regions of intermediate rate of feature change, here condi-tions 1, 3, and 5. This seems to confirm Denham et al’s. (2013)observations; however, a One-Way repeated-measures ANOVAdid not show a significant effect of condition, F(4, 25) = 0.73,p > 0.5, therefore the planned pairwise comparisons were notperformed.
Phase duration of each perceptual patternAnother way to explore the data is to consider the statistics ofperceptual phase durations. Phase durations can provide insights
into the dynamics of perceptual switching not always apparentfrom the proportions; the same proportions can be achieved bymany short phases or by fewer longer phases. In Figure 6 themedian phase durations for each pattern are shown for the entiredata set; for clarity the confused phases are omitted from thisanalysis. This plot shows that although the proportion of thepatterns (AB--, -BA-, and A---) is rather low, if participants doreport them, then the phase durations during which they areexperienced can be comparable with those of the segregated per-cepts [comparing the median phase durations of the six differentpatterns using a One-Way repeated-measures ANOVA, F(5, 30) =2.32, p = 0.06; pairwise Wilcoxon rank sum test comparing dis-tributions shows the durations of AB-- and -BA- not to be notsignificantly different from any other pattern, p > 0.05 for allcomparisons, and the durations of A--- not to be significantly dif-ferent from any other pattern, p > 0.05 for all comparisons exceptABA-, p = 0.004].
LatencyThe time taken to discover each of the perceptual patterns var-ied as a function of stimulus parameters (condition) and betweenindividual participants; see Figure 7. With the exception of theA--- pattern, all patterns are eventually reported for all con-ditions, and all participants (with the exception of participant4: AB--) reported all of the patterns at some time during theexperiment.
Frontiers in Neuroscience | Auditory Cognitive Neuroscience February 2014 | Volume 8 | Article 25 | 6

Denham et al. Stable individual characteristics
FIGURE 4 | Total proportion of each pattern, pooling the data from
all participants, all sessions and all conditions in Experiment 1.
On each box, the central red line is the median, the upper and loweredges of the boxes are the 25th and 75th percentiles, the whiskersextend to the most extreme data points considered not to beoutliers; outliers are plotted individually as red crosses. Top: Proportion
of each pattern reported by participants (median values: ABA- 51.39%,AB- - 0.13%, -BA- 14.02%, A- 9.49%, A- - - 0.02%, B- - - 20.78%,confused 0.0008%). Bottom: Patterns grouped according to theperceptual organizations that participants were allowed to report in ourprevious studies: integrated (ABA-), segregated (A-, B- - -), and both(AB- -, -BA-, A- - -).
The latencies for reporting each pattern are not normallydistributed; plotting the latency distribution in the log domainclearly shows its bimodal nature (Figure 8, top). This occursbecause there is a tendency in auditory streaming experiments(as reported in vision too, e.g., Mamassian and Goutcher, 2005)for the first phase to be much longer than subsequent phases(Denham et al., 2013); the short latency peak in the distributioncorresponds to the initial responses (typically ABA-, A-, or B---),with the later peak corresponding to the first reports of perceptsin subsequent phases.
The empirical cumulative distributions of latencies, whichshow on the y axis the proportion of latencies less than anygiven latency (in seconds) on the x axis (Figure 8, bottom),demonstrate the strong tendency for the integrated ABA- pat-tern to be reported with a far shorter latency than the otherpatterns, followed by similar latency distributions for the B---,A-, and -BA- patterns, and finally, much later the AB-- andA--- patterns. For example, by reading off the intercepts of eachcumulative plot with the dashed red line we can see that 80%of first reports of ABA- occur within 5.5 s, of B--- within 120 s,-BA 204 s, A- 222 s, AB—308 s, and A--- 440 s. This may explainwhy the other patterns have not been reported in past experi-ments, as most of them have used sequences of short duration(typically <20 s). Wilcoxon rank sum test comparing cumulative
distributions shows ABA- to be significantly different from allother patterns, p < 0.0001, B---, A-, and -BA- to be significantlydifferent from ABA-, A---, and AB--, p < 0.0001, but not fromeach other (B---/-BA- p = 0.11, A-/-BA- p = 0.44, except B---/A- p = 0.013), and A--- and AB—to be significantly differentfrom all other patterns, p < 0.0001, but not from each other,p = 0.098.)
Consistency of individual perceptual switching behaviorThe transition matrices constructed for each participant for eachtest session by pooling the data for all conditions were used toexamine the consistency of individual behavior. Figure 9 belowshows a comparison between intra- and inter-individual differ-ences in terms of explicit difference measures. This demonstratesthat individual participant behavior tends to be idiosyncratic; i.e.,the switching behavior of an individual is more similar to theirown behavior in a different test session than it is to the per-ceptual switching behavior of other participants (Wilcoxon ranksum test: participant 1 p = 0.0002, participants 2–6 p < 0.0001).It should be noted that by comparing the transition matrices ofindividual participants we go beyond just comparing switchingrates; in addition to switching rates, the transition matrices cap-ture the likelihood of reporting and switching between differentperceptual patterns.
www.frontiersin.org February 2014 | Volume 8 | Article 25 | 7

Denham et al. Stable individual characteristics
FIGURE 5 | Proportion of the total stimulus duration during which each
pattern was perceived (color coded as indicated by the accompanying
legend) for each condition, calculated from the condition transition
matrices constructed by pooling the data from all participants for each
condition (Denham et al., 2012). Top: Proportion of each pattern reported byparticipants. Bottom: Proportion of each pattern grouped according to theperceptual organizations that participants were allowed to report in our previousstudies; integrated (ABA-), segregated (A-, B- - -), and both (AB- -, -BA-, A- - -).
FIGURE 6 | Phase durations of each pattern, pooling the data from all participants, all sessions and all conditions in experiment 1; see Figure 4 for
figure conventions.
INTERIM DISCUSSIONWhen listening to tone sequences of the form ABA-, participantsreport patterns other than the traditional integrated (ABA-) andsegregated (A- or B---) ones if they are given the possibility to doso. Although the experiment is rather complex and participantsrequire a number of training sessions before they are reliably ableto perform the task, perceptual reports in the verification sectionsappended to the end of the stimuli provide confidence that par-ticipants were engaged in the task and accurately reported the
patterns they perceived. Individual behavior was also consistent.We found that the perceptual switching behavior of each partici-pant was very similar across sessions; median differences betweenan individual participant’s transition matrices were small. Incomparison, the differences between the transition matrices ofdifferent participants tended to be much larger; median differ-ences were more than twice as large (except for participant 1,1.8 times larger). This stable idiosyncratic behavior is interest-ing in its own right, as well as providing further confidence that
Frontiers in Neuroscience | Auditory Cognitive Neuroscience February 2014 | Volume 8 | Article 25 | 8

Denham et al. Stable individual characteristics
FIGURE 7 | Median latency of each pattern (color coded as indicated by the accompanying legend). Top: Median latency for the first report of eachpattern in each condition, pooling all participants. Bottom: Median latency for the first report of each pattern by each participant, pooling all conditions.
participants were engaged in the task and were reliably reportingtheir perceptual experiences.
The choice of embedded patterns that we tested here wasmotivated in part by our modeling studies (Mill et al., 2013).The CHAINS model, which was used to successfully simulate thedynamics of the discovery and perceptual switching between theintegrated and segregated organizations, can in principle alsodiscover the embedded AB--, -BA-, and A--- patterns. Here wetested the perception of all repeating embedded patterns up tolength 4. It is possible that listeners can spontaneously perceiveeven longer patterns if the sequence allows it, but we have notexplored that possibility yet. Because we considered that partici-pants may find the distinction too difficult to perceive, we did notask participants to distinguish between the A--- and --A- patterns(i.e., complementary to -BA- and AB--, respectively), althoughthe CHAINS model would predict that they are both perceived.The other limitation of the experimental design we used here isthat we did not actually try to establish which perceptual orga-nizations participants experienced; all we asked them to reportwas which pattern they perceived as dominant. On the basis ofour theoretical proposals (Winkler et al., 2012) and the CHAINS
model (Mill et al., 2013) we may infer the perceptual organiza-tions, but these predictions remain to be properly tested in futureexperiments.
The distribution of the patterns other than integration andsegregation (i.e., AB--, BA--, A---) in relation to the stimulusparameters, and the latency with which they are discovered, pro-vide support for our hypothesis that the both response found
in previous experiments (Bendixen et al., 2010; Denham et al.,2013) can be explained by the perception of embedded patternsnot previously considered, rather than rapid switching betweenintegration and segregation. The results are not directly com-parable, as the participants and range of stimulus parameterstested were somewhat different. However, qualitatively the rela-tionship between stimulus parameters and the probability ofreporting both seems to be well explained by a combination of theAB--, -BA-, and A--- patterns. Both is most commonly reportedfor small frequency differences and fast presentation rates, andis less common when the stimulus parameters strongly promotesegregation or integration (Denham et al., 2013). Furthermore,both was hardly ever reported as the first percept (Denham et al.,2013). Here the median latency for reporting the AB--, -BA-,and A--- patterns tended to be rather long, and in all condi-tions in this experiment the median latency for at least oneof the set {ABA-, A-, B---} was always less than the minimummedian latency for the set {AB--, -BA-, A---}. These factors leadus to believe that the both response in previous experiments cor-responds to the dominant perception of one of the followingpatterns AB--, -BA-, or A---.
It could be argued that participants only perceived all thepatterns reported here because they were trained to do so, andthat without this training they would not have heard patternssuch as AB--, -BA-, or A---. There are a number of factorsthat argue against this objection. Firstly, in a pilot experiment(reported in Denham et al., 2013), listeners were asked to ver-bally report all repeating patterns that they experienced during
www.frontiersin.org February 2014 | Volume 8 | Article 25 | 9

Denham et al. Stable individual characteristics
FIGURE 8 | Distribution of response latencies. Top: Distribution oflatencies for all patterns combined, for all data in Experiment 1; forclarity latency is plotted as the log of the latency in milliseconds.Bottom: Cumulative distribution of latency for each pattern separately,combining data from all participants and sessions. Each line represents
the proportion of latencies of the pattern indicated by the color code(see legend) less than the latency indicated along the x axis. Forexample, at a latency of 100 s, less than 20% of first reports of A- - -have occurred, while more than 90% of first ABA- reports haveoccurred.
FIGURE 9 | Individual differences within Experiment 1. Comparisonbetween intra- and inter-individual perceptual switching behavior,characterized by participant transition matrices extracted for each participantfor each test session, pooling data from all conditions; differences between
transition matrices from the same participant at different sessions (blackdots; median—black diamonds, line), differences between the transitionmatrices of each participant and those of all other participants (red dots;median—red diamonds, line).
a 4-min long ABA- sequence. Most of the patterns trained inthe current experiment were described spontaneously by lis-teners in this pilot study. Secondly, in our previous experi-ments both was reported without extensive pattern-specific priortraining. Thirdly, the proportion and latency characteristicsof both responses correspond well to those of the grouped{AB--, -BA-, A---} responses. On this basis, we argue here that
both corresponds to one or other of the patterns AB--, -BA-, orA---. Finally, participants were instructed to adopt a neutral lis-tening approach and not attempt to hear one or other pattern.Therefore, we would argue that the influence of training on thereports of these other patterns was largely limited to facilitatingtheir categorization and reporting, rather than increasing theirincidence.
Frontiers in Neuroscience | Auditory Cognitive Neuroscience February 2014 | Volume 8 | Article 25 | 10

Denham et al. Stable individual characteristics
Experiment 1 raised two important questions that we investi-gated in two follow-up experiments. Firstly, we decided to probethe stability of individual consistency in perceptual switchingbehavior and individual differences between participants over alonger time scale. If these are truly individual differences (i.e.,differences of a physical nature), we would expect to find thatthe perceptual switching behavior of participants is similar evenwhen tested in sessions separated by rather long periods of time,and that the individual differences found here also remain reliablydetectable. Secondly, we were surprised by the relative promi-nence of the B--- pattern relative to the A- pattern. If anythingthe CHAINS model would predict that the A- pattern should bemore prominent as it occurs more often (in CHAINS terms, makesmore successful predictions per unit time) than the B--- one does.We hypothesized that the higher frequency of the B tones relativeto the A tones in all conditions may have made the B tones per-ceptually more salient, and that this was the cause of the higherprominence of the B--- pattern. For these reasons we conductedtwo recall experiments (Experiments 2 and 3) approximately 1year after Experiment 1.
EXPERIMENT 2INTRODUCTIONIndividuals are known to differ markedly in their perceptualbehavior in visual multistability experiments; e.g., individual dif-ferences in perceptual switching rate in binocular rivalry havebeen known for many years (Aafjes et al., 1966). More recently,genetic markers (Miller et al., 2010) and differences in brain struc-ture (e.g., Kanai et al., 2010; Genc et al., 2011), have been associ-ated with differences in typical individual switching rates. Biasestoward different perceptual decisions have also been reported andshown to relate, in the case of bistable motion, to differences ininter-hemispheric connectivity (Kanai and Rees, 2011). However,although there are some pointers toward such differences in audi-tion (e.g., see Kondo and Kashino, 2009; Kashino and Kondo,2012), a systematic investigation of the genetic or physiologicalbasis for differences in auditory perceptual multistability has notyet been attempted. In Experiment 2, we sought to investigatewhether the individual differences found in Experiment 1 werestable over a prolonged period. We hypothesized that if, as invision, auditory individual perceptual differences are a result ofstable physiological or even genetic differences, then we shouldfind that the individual differences in perceptual switching behav-ior reported in Experiment 1 would be detectable 1 year later.
METHODSParticipantsFive (mean age 23.2 years, range 20–26 years; all right-handed;3 male, 2 female) of the original six participants took part inExperiment 2, which was conducted over four sessions approxi-mately 1 year after Experiment 1.
All equipment and procedures were as described forExperiment 1.
Training procedureParticipants attended one training session, which was similar inform to the training sessions for Experiment 1.
Testing procedureParticipants attended three test sessions over a duration of 2 weekswith at least 2 days between consecutive sessions during which thefive 10-min experimental blocks were presented. All instructionsand procedures were as for Experiment 1.
AnalysisTo compare the effects of experiment (i.e., comparing Experiment1 with the recall Experiment 2) we used a Two-Way repeated-measures ANOVA with two factors, experiment comparison (2levels: same vs. other) × participant comparison (2 levels: selfvs. other). For each of the 4 (2 × 2) comparisons we calculatedthe mean of all possible KL distances between the correspondingtransition matrices. The ANOVA was computed on the resulting20 values, i.e., 5 participants × 2 experiment levels × 2 participantlevels.
RESULTSFrom the entire data set for Experiment 2 the removal of phaseswhere no button was pressed or duration was less than 300 msresulted in the removal of 5.1% of the total data.
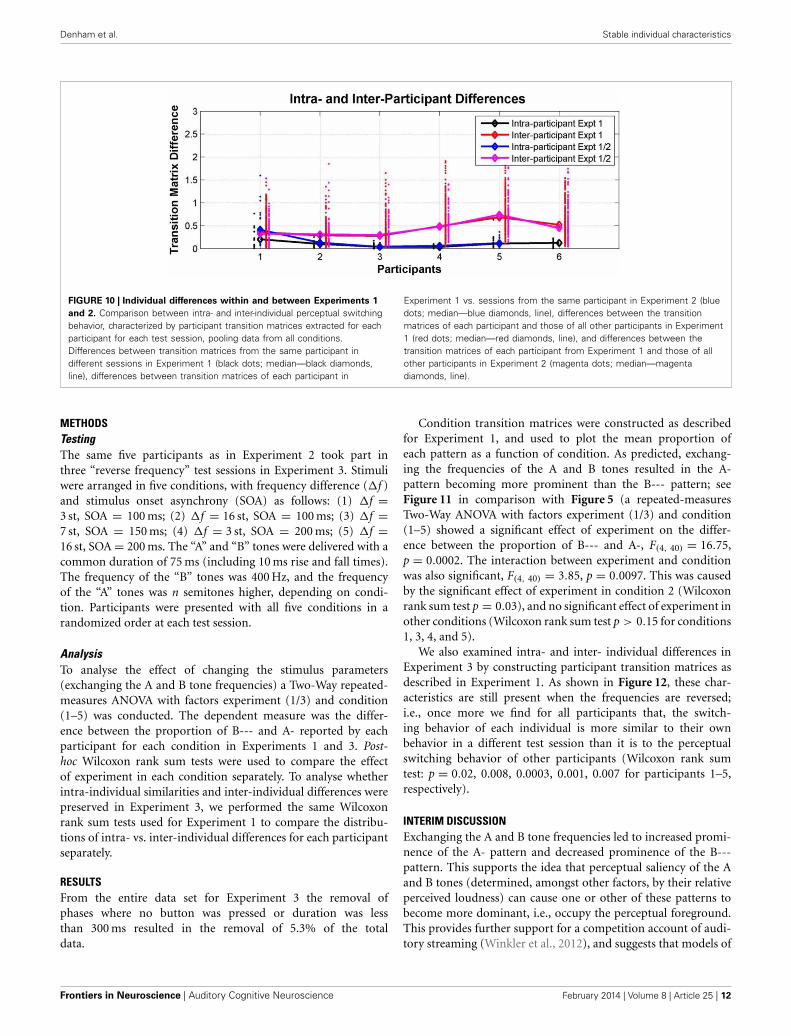
Participant transition matrices were constructed for each par-ticipant for each test session. Figure 10 compares intra- andinter-individual differences in perceptual switching behaviorin Experiments 1 and 2. The ANOVA analysis showed thatthe effect of participant (self vs. other) was highly significant[F(1, 16) = 20.49, p = 0.0003], while the effect of experiment(1 vs. 2) was not significant [F(1, 16) = 0.38, p = 0.55], andthere was no interaction between these factors [F(1, 16) = 0.06,p = 0.81].
INTERIM DISCUSSIONIndividual differences in perceptual switching behavior remainedconsistent and detectable a year after the first experiment. Allof the participants behaved in a way that was more similar totheir behavior at all other sessions, including those separated by ayear from each other, than to any of the other participants. Thisinternal consistency over such a long period suggests that switch-ing patterns in the current multistable auditory paradigm reflectsome stable perceptual or higher-level traits, possibly stemmingfrom physiological and maybe even genetic differences betweenlisteners.
EXPERIMENT 3INTRODUCTIONIn Experiment 3 we investigated whether the frequency rela-tion of the two tones (A lower than B, or vice versa) couldinfluence the extent to which the A- and B--- patterns werereported as the foreground pattern by listeners. In Experiment1 the frequency of the A tones was 400 Hz, and that of theB tones 476, 599, or 1008 Hz. Equal loudness curves of nor-mal listeners (e.g., see Moore, 2003), suggest that the B toneswould be perceptually louder than the A tones, and thus moresalient. Therefore, in this experiment we decided to test whetherswitching the frequencies of the A and B tones would result ina greater tendency for listeners to report the A- than the B---pattern.
www.frontiersin.org February 2014 | Volume 8 | Article 25 | 11
Denham et al. Stable individual characteristics
FIGURE 10 | Individual differences within and between Experiments 1
and 2. Comparison between intra- and inter-individual perceptual switchingbehavior, characterized by participant transition matrices extracted for eachparticipant for each test session, pooling data from all conditions.Differences between transition matrices from the same participant indifferent sessions in Experiment 1 (black dots; median—black diamonds,line), differences between transition matrices of each participant in
Experiment 1 vs. sessions from the same participant in Experiment 2 (bluedots; median—blue diamonds, line), differences between the transitionmatrices of each participant and those of all other participants in Experiment1 (red dots; median—red diamonds, line), and differences between thetransition matrices of each participant from Experiment 1 and those of allother participants in Experiment 2 (magenta dots; median—magentadiamonds, line).
METHODSTestingThe same five participants as in Experiment 2 took part inthree “reverse frequency” test sessions in Experiment 3. Stimuliwere arranged in five conditions, with frequency difference (�f )and stimulus onset asynchrony (SOA) as follows: (1) �f =3 st, SOA = 100 ms; (2) �f = 16 st, SOA = 100 ms; (3) �f =7 st, SOA = 150 ms; (4) �f = 3 st, SOA = 200 ms; (5) �f =16 st, SOA = 200 ms. The “A” and “B” tones were delivered with acommon duration of 75 ms (including 10 ms rise and fall times).The frequency of the “B” tones was 400 Hz, and the frequencyof the “A” tones was n semitones higher, depending on condi-tion. Participants were presented with all five conditions in arandomized order at each test session.
AnalysisTo analyse the effect of changing the stimulus parameters(exchanging the A and B tone frequencies) a Two-Way repeated-measures ANOVA with factors experiment (1/3) and condition(1–5) was conducted. The dependent measure was the differ-ence between the proportion of B--- and A- reported by eachparticipant for each condition in Experiments 1 and 3. Post-hoc Wilcoxon rank sum tests were used to compare the effectof experiment in each condition separately. To analyse whetherintra-individual similarities and inter-individual differences werepreserved in Experiment 3, we performed the same Wilcoxonrank sum tests used for Experiment 1 to compare the distribu-tions of intra- vs. inter-individual differences for each participantseparately.
RESULTSFrom the entire data set for Experiment 3 the removal ofphases where no button was pressed or duration was lessthan 300 ms resulted in the removal of 5.3% of the totaldata.
Condition transition matrices were constructed as describedfor Experiment 1, and used to plot the mean proportion ofeach pattern as a function of condition. As predicted, exchang-ing the frequencies of the A and B tones resulted in the A-pattern becoming more prominent than the B--- pattern; seeFigure 11 in comparison with Figure 5 (a repeated-measuresTwo-Way ANOVA with factors experiment (1/3) and condition(1–5) showed a significant effect of experiment on the differ-ence between the proportion of B--- and A-, F(4, 40) = 16.75,p = 0.0002. The interaction between experiment and conditionwas also significant, F(4, 40) = 3.85, p = 0.0097. This was causedby the significant effect of experiment in condition 2 (Wilcoxonrank sum test p = 0.03), and no significant effect of experiment inother conditions (Wilcoxon rank sum test p > 0.15 for conditions1, 3, 4, and 5).
We also examined intra- and inter- individual differences inExperiment 3 by constructing participant transition matrices asdescribed in Experiment 1. As shown in Figure 12, these char-acteristics are still present when the frequencies are reversed;i.e., once more we find for all participants that, the switch-ing behavior of each individual is more similar to their ownbehavior in a different test session than it is to the perceptualswitching behavior of other participants (Wilcoxon rank sumtest: p = 0.02, 0.008, 0.0003, 0.001, 0.007 for participants 1–5,respectively).
INTERIM DISCUSSIONExchanging the A and B tone frequencies led to increased promi-nence of the A- pattern and decreased prominence of the B---pattern. This supports the idea that perceptual saliency of the Aand B tones (determined, amongst other factors, by their relativeperceived loudness) can cause one or other of these patterns tobecome more dominant, i.e., occupy the perceptual foreground.This provides further support for a competition account of audi-tory streaming (Winkler et al., 2012), and suggests that models of
Frontiers in Neuroscience | Auditory Cognitive Neuroscience February 2014 | Volume 8 | Article 25 | 12

Denham et al. Stable individual characteristics
FIGURE 11 | Proportion of the total stimulus duration during
which each pattern was perceived (color coded as indicated
by the accompanying legend) for each condition, calculated
from the condition transition matrices constructed by pooling
the data from all participants for each condition (Bõhm et al.,
2013).
FIGURE 12 | Comparison between intra- and inter-individual perceptual
switching behavior in Experiment 3; differences between transition
matrices from the same participant at different sessions (black dots;
median—black diamonds, line), and differences between the transition
matrices of each participant and those of all other participants (red dots;
median—red diamonds, line).
auditory scene analysis should also take account of the influenceof event saliency on perceptual organization.
GENERAL DISCUSSIONThe experiments presented here provide support for the hypoth-esis that auditory perception involves the extraction of patterns(regularities) from incoming sequences of sound events and thatmultiple patterns can be detected and held in parallel. Evenwhen listening to simple repeating ABA- sequences, participantsreported up to six different foreground patterns. This suggeststhat given sufficient time, pattern discovery appears to be exhaus-tive, i.e., all possible patterns within a certain length are perceived.We did not attempt to investigate whether there is a limit on thelength of the patterns that are discovered and used by the auditorysystem to parse the auditory scene; this remains to be explored,probably with more complex sequences. However, our inclusionof patterns up to length four is supported by related ERP studies(Boh et al., 2011).
Once patterns have been discovered they come and go fromconscious perception for as long as the stimulus sequence con-tinues. This is consistent with the proposal that the contents of
perceptual awareness are the result of an on-going competitiveprocess between the set of patterns that have been discovered(Winkler et al., 2012). The distribution of these patterns in rela-tion to the stimulus parameters, and the latency with which theywere reported in Experiment 1 leads us to conclude that the bothreports in previous experiments are consistent with the percep-tion of foreground patterns AB--, -BA-, or A---. Based on ourmodeling studies we infer that the background pattern perceivedin each of these cases was --A-, A---, and -BA-, respectively,although we did not attempt to investigate the perception ofbackground patterns here.
Although bi-/multi-stable perceptual switching is highlystochastic, the switching patterns of individuals could be distin-guished from each other. This is the first time to our knowledgethat intra-individual similarities and inter-individual differenceshave been documented for patterns of perceptual switching inauditory streaming. However, individual differences in the num-ber of perceptual switches have been previously reported (Kondoet al., 2012), and in vision individual differences in binocularrivalry have been known for some time (Aafjes et al., 1966). Themethod we use to distinguish individuals is different from the
www.frontiersin.org February 2014 | Volume 8 | Article 25 | 13
Denham et al. Stable individual characteristics
switching rate measure that has previously been used. Here, wecharacterized the difference between two individuals in termsof a single distance measure between their transition matrices.However, much remains to be investigated regarding the detailsof these differences, which are likely to stem from some combi-nation of switching rate, perceptual biases in the proportion ofthe various patterns perceived, and perhaps even higher orderrelationships such as idiosyncratic perceptual transitions.
The finding that individuals behave in a measurably consis-tent manner even between sessions separated by a year leadsus to suggest that relatively stable bases such as anatomical orgenetic differences, similar to those found for other multi-stablephenomena (Kanai et al., 2010; Genc et al., 2011), may be respon-sible. However, the neural correlates of perceptual dominanceand perceptual switching in auditory perception are not yet wellunderstood, although there is some reason to suppose that theremay be some aspects that are shared with vision (e.g., Cusack,2005). We suggest that the paradigm and analysis methods wepresent here may prove useful in the future for investigations ofthe neural basis for auditory perceptual organization.
Another question of interest for future investigations iswhether, and if so what, other individual perceptual or cog-nitive characteristics are related to these individual patterns ofswitching behavior. If our assumption regarding the mechanismsunderlying auditory perception are correct (i.e., discovery andon-going competition between alternative interpretations of theinput), then these individual differences may underlie variation inother characteristics, such as perceptual abilities, cognitive style,personality or creativity.
The results of these experiments have implications for mod-els of auditory scene analysis; in particular, any comprehensivemodel should account for the multitude of patterns that partici-pants report, the parameter dependence of the pattern distribu-tions, and the latencies with which they are discovered. No modelhas been developed yet which can account for all of these aspects.The popular temporal coherence model in its current formula-tion makes a fixed perceptual decision (e.g., Shamma et al., 2011).While this could undoubtedly be modulated by the introductionof noise and adaptation, it is more difficult to see how the otherembedded patterns reported here, e.g., -BA- could be discovered,as the temporal coherence measure would either group or notgroup A’s with B’s. The CHAINS model (Mill et al., 2013) in its cur-rent formulation cannot discover the AB--, -AB-, or A--- patternsreported here either, but this is easily fixed with a simple modifi-cation to the pattern discovery function. However, there is a morefundamental problem; since the links in CHAINS form probabilis-tically between events, patterns involving two events, e.g., AB--,will be easier to discover than patterns involving three events,ABA-. Therefore, CHAINS would predict that AB-- is reportedwith a shorter latency than ABA-, which is not the case.
CONCLUSIONAlthough on the face of it the results we present here appear tochallenge our everyday experience of perception as stable andveridical, we suggest that it is precisely by having the ability toconstruct multiple interpretations of a scene that perception isable to achieve robust performance. The first reported pattern
corresponds to the most likely interpretation; here, typically thatthere is one object in the world producing sounds of differentpitch but similar timbre, although if the frequency differencebecomes too great then the possibility of two sound sourcesbecomes more likely. It is important to note that this initial per-ceptual decision is not simply a function of the physical stimulus;relevant contextual information (Snyder et al., 2008, 2009b) andprior learning (van Zuijen et al., 2005; Snyder et al., 2009a) alsoexert an influence. It also makes sense that perception never fixeson a single solution. If either of these were the case then our per-ceptions would be entirely determined by external factors, leavingno room for autonomous behavior. Since perception is essen-tially about trying to extract information from the world aroundus, a better strategy than simply choosing the “best” interpreta-tion is to explore other interpretations if time allows in case theyoffer insights not available in the most likely scenario. By set-ting up a competition between alternatives and ensuring that nosolution can dominate forever, the perceptual system essentiallyperforms a probabilistic likelihood sampling of the perceptualspace (Moreno-Bote et al., 2011). This view of perception res-onates with a number of earlier perceptual theories, includingHelmholtz’s view of the role of inferential processes in perception(Helmholtz, 1885), Gregory’s notion of perception as hypotheses(Gregory, 1980), and more recent instantiations in work on pre-dictive coding theory by Friston and colleagues amongst others(e.g., Friston and Kiebel, 2009). Competition between patterns,rather than individual elements, also fits well with Gestalt ideasof perception that emphasize the importance of the whole (i.e.,patterns) relative to the parts (i.e., individual tones) (Köhler,1947; Wagemans et al., 2012). In conclusion, studies of per-ceptual multistability can provide new and useful insights intogeneral mechanisms as well as individual differences in humanperception.
SUPPLEMENTARY MATERIALThe Supplementary Material for this article can be foundonline at: http://www.frontiersin.org/journal/10.3389/fnins.2014.00025/abstract
REFERENCESAafjes, M., Hueting, J. E., and Visser, P. (1966). Individual and interindividual
differences in binocular retinal rivalry in man. Psychophysiology 3, 18–22. doi:10.1111/j.1469-8986.1966.tb02674.x
Anstis, S., and Saida, S. (1985). Adaptation to auditory streaming of frequency-modulated tones. J. Exp. Psychol. Hum. Percept. Perform. 11, 257–271. doi:10.1037/0096-1523.11.3.257
Bendixen, A., Bõhm, T. M., Szalárdy, O., Mill, R., Denham, S. L., and Winkler,I. (2013). Different roles of similarity and predictability in auditory streamsegregation. Learn. Percept. 2, 37–54. doi: 10.1556/LP.5.2013.Suppl2.4
Bendixen, A., Denham, S. L., Gyimesi, K., and Winkler, I. (2010). Regular pat-terns stabilize auditory streams. J. Acoust. Soc. Am. 128, 3658–3666. doi:10.1121/1.3500695
Boh, B., Herholz, S. C., Lappe, C., and Pantev, C. (2011). Processing of complexauditory patterns in musicians and nonmusicians. PLoS ONE 6:e21458. doi:10.1371/journal.pone.0021458
Bõhm, T. M., Shestopalova, L., Bendixen, A., Andreou, A. G., Georgiou, J., Garreau,G., et al. (2013). Spatial location of sound sources biases auditory stream seg-regation but their motion does not. J. Learn. Percept. 5(Suppl 2), 55–72. doi:10.1556/LP.5.2013.Suppl2.5
Bregman, A. S. (1990). Auditory Scene Analysis: The Perceptual Organization ofSound. Cambridge, MA: MIT Press.
Frontiers in Neuroscience | Auditory Cognitive Neuroscience February 2014 | Volume 8 | Article 25 | 14
Denham et al. Stable individual characteristics
Cusack, R. (2005). The intraparietal sulcus and perceptual organization. J. Cogn.Neurosci. 17, 641–651. doi: 10.1162/0898929053467541
Deike, S., Heil, P., Böckmann-Barthel, M., and Brechmann, A. (2012). The build-up of auditory stream segregation: a different perspective. Front. Psychol. 3:461.doi: 10.3389/fpsyg.2012.00461
Denham, S., Bendixen, A., Mill, R., Tóth, D., Wennekers, T., Coath, M., et al. (2012).Characterising switching behaviour in perceptual multi-stability. J. Neurosci.Methods 210, 79–92. doi: 10.1016/j.jneumeth.2012.04.004
Denham, S. L., Gyimesi, K., Stefanics, G., and Winkler, I. (2013). Multistabilityin auditory stream segregation: the role of stimulus features in perceptualorganisation. Learn. Percept. 2, 73–100. doi: 10.1556/LP.5.2013.Suppl2.6
Denham, S. L., and Winkler, I. (2006). The role of predictive models inthe formation of auditory streams. J. Physiol. Paris 100, 154–170. doi:10.1016/j.jphysparis.2006.09.012
Denham, S. L., and Winkler, I. (2014). “Auditory perceptual organization,” inOxford Handbook of Perceptual Organization, ed J. Wagemans (Oxford: OxfordUniversity Press). (in press).
Friston, K., and Kiebel, S. (2009). Predictive coding under the free-energyprinciple. Philos. Trans. R. Soc. Lond. B Biol. Sci. 364, 1211–1221. doi:10.1098/rstb.2008.0300
Genc, E., Bergmann, J., Tong, F., Blake, R., Singer, W., and Kohler, A. (2011).Callosal connections of primary visual cortex predict the spatial spreading ofbinocular rivalry across the visual hemifields. Front. Hum. Neurosci. 5:161. doi:10.3389/fnhum.2011.00161
Gregory, R. L. (1980). Perceptions as hypotheses. Philos. Trans. R. Soc. Lond. B Biol.Sci. 290, 181–197. doi: 10.1098/rstb.1980.0090
Haywood, N. R., and Roberts, B. (2011). Effects of inducer continuity on auditorystream segregation: comparison of physical and perceived continuity in differentcontexts. J. Acoust. Soc. Am. 130, 2917–2927. doi: 10.1121/1.3643811
Haywood, N. R., and Roberts, B. (2013). Build-up of auditory stream segregationinduced by tone sequences of constant or alternating frequency and the resettingeffects of single deviants. J. Exp. Psychol. Hum. Percept Perform. 39, 1652–1666.doi: 10.1037/a0032562
Helmholtz, H. V. (1885). On the Sensations of Tone as a Physiological Basis for theTheory Of Music. London: Longmans, Green, and Co.
Horváth, J., Czigler, I., Sussman, E., and Winkler, I. (2001). Simultaneously activepre-attentive representations of local and global rules for sound sequences inthe human brain. Brain Res. Cogn. Brain Res. 12, 131–144. doi: 10.1016/S0926-6410(01)00038-6
Jones, M. R. (1976). Time, our lost dimension: toward a new theory of percep-tion, attention, and memory. Psychol. Rev. 83, 323–355. doi: 10.1037/0033-295X.83.5.323
Kanai, R., Bahrami, B., and Rees, G. (2010). Human parietal cortex structure pre-dicts individual differences in perceptual rivalry. Curr. Biol. 20, 1626–1630. doi:10.1016/j.cub.2010.07.027
Kanai, R., and Rees, G. (2011). The structural basis of inter-individual differ-ences in human behaviour and cognition. Nat. Rev. Neurosci. 12, 231–242. doi:10.1038/nrn3000
Kashino, M., and Kondo, H. M. (2012). Functional brain networks underlying per-ceptual switching: auditory streaming and verbal transformations. Philos. Trans.R. Soc. Lond. B Biol. Sci. 367, 977–987. doi: 10.1098/rstb.2011.0370
Köhler, W. (1947). Gestalt Psychology: An Introduction To New Concepts in ModernPsychology. New York, NY: Liveright Publishing Corporation.
Kondo, H. Kitagawa, M., N., Kitamura, M. S., Koizumi, A., Nomura, M., andKashino, M. (2012). Separability and commonality of auditory and visualbistable perception. Cereb. Cortex 22, 1915–1922. doi: 10.1093/cercor/bhr266
Kondo, H. M., and Kashino, M. (2009). Involvement of the thalamocortical loopin the spontaneous switching of percepts in auditory streaming. J. Neurosci. 29,12695–12701. doi: 10.1523/JNEUROSCI.1549-09.2009
Kullback, S. (1959). Information Theory and Statistics.. New York, NY: John Wileyand Sons.
Levelt, W. J. M. (1968). On Binocular Rivalry. Paris: Mouton.Logothetis, N. K., Leopold, D. A., and Sheinberg, D. L. (1996). What is rivalling
during binocular rivalry? Nature 380, 621–624. doi: 10.1038/380621a0Mamassian, P., and Goutcher, R. (2005). Temporal dynamics in bistable perception.
J. Vis. 5, 361–375. doi: 10.1167/5.4.7Mill, R. W., Bõhm, T. M., Bendixen, A., Winkler, I., and Denham, S. L. (2013).
Modelling the emergence and dynamics of perceptual organisation in auditorystreaming. PLoS Comput. Biol. 9:e1002925. doi: 10.1371/journal.pcbi.1002925
Miller, S. M., Hansell, N. K., Ngo, T. T.,. Liu, G. B., Pettigrew, J. D., Martin,N. G., et al. (2010). Genetic contribution to individual variation in binocu-lar rivalry rate. Proc. Natl. Acad. Sci. U.S.A. 107, 2664–2668. doi: 10.1073/pnas.0912149107
Moore, B. C., and Gockel, H. E. (2012). Properties of auditory stream formation.Philos. Trans. R. Soc. Lond. B Biol. Sci. 367, 919–931. doi: 10.1098/rstb.2011.0355
Moore, B. C. J. (2003). An Introduction to the Psychology of Hearing. 5th edn.Amsterdam: Academic Press.
Moreno-Bote, R., Knill, D. C., and Pouget, A. (2011). Bayesian samplingin visual perception. Proc. Natl. Acad. Sci. U.S.A. 108, 12491–12496. doi:10.1073/pnas.1101430108
Moreno-Bote, R., Shpiro, A., Rinzel, J., and Rubin, N. (2010). Alternation rate inperceptual bistability is maximal at and symmetric around equi-dominance.J. Vis. 10, 1. doi: 10.1167/10.11.1
Pressnitzer, D,. and Hupé, J. M. (2006). Temporal dynamics of auditory and visualbistability reveal common principles of perceptual organization. Curr. Biol. 16,1351–1357. doi: 10.1016/j.cub.2006.05.054
Rogers, W. L., and Bregman, A. S. (1993). An experimental evaluation of threetheories of auditory stream segregation. Percept Psychophys 53, 179–189. doi:10.3758/BF03211728
Shamma, S. A., Elhilali, M., and Micheyl, C. (2011). Temporal coherenceand attention in auditory scene analysis. Trends Neurosci. 34, 114–123. doi:10.1016/j.tins.2010.11.002
Snyder, J. S., Carter, O. L., Hannon, E. E., and Alain, C. (2009a). Adaptation revealsmultiple levels of representation in auditory stream segregation. J. Exp. Psychol.Hum. Percept. Perform. 35, 1232–1244. doi: 10.1037/a0012741
Snyder, J. S., Carter, O. L., Lee, S. K., Hannon, E. E., and Alain, C. (2008). Effects ofcontext on auditory stream segregation. J. Exp. Psychol. Hum. Percept. Perform.34, 1007–1016. doi: 10.1037/0096-1523.34.4.1007
Snyder, J. S., Holder, W. T., Weintraub, D. M., Carter, O. L., and Alain, C. (2009b).Effects of prior stimulus and prior perception on neural correlates of audi-tory stream segregation. Psychophysiology 46, 1208–1215. doi: 10.1111/j.1469-8986.2009.00870.x
Szalárdy, O., Bendixen, A., Tóth, D., Denham, S. L., and Winkler, I. (2013).Modulation-frequency acts as a primary cue for auditory stream segregation.Learn. Percept. 5(Suppl 2), 149–161. doi: 10.1556/LP.5.2013.Suppl2.9
van Noorden, L. P. A. S. (1975). Temporal Coherence in the Perception of ToneSequences. Doctoral dissertation, Technical University Eindhoven.
van Zuijen, T. L., Sussman, E., Winkler, I., Näätänen, R., and Tervaniemi,M. (2005). Auditory organization of sound sequences by a temporalor numerical regularity—a mismatch negativity study comparing musi-cians and non-musicians. Brain Res. Cogn. Brain Res. 23, 270–276. doi:10.1016/j.cogbrainres.2004.10.007
Wagemans, J., Elder, J. H., Kubovy, M., Palmer, S. E., Peterson, M. A., Singh, M.et al. (2012). A century of Gestalt psychology in visual perception: I. Perceptualgrouping and figure-ground organization. Psychol. Bull. 138, 1172–1217. doi:10.1037/a0029333
Winkler, I., Denham, S., Mill, R., Bõhm, T. M., and Bendixen, A. (2012).Multistability in auditory stream segregation: a predictive coding view. Philos.Trans. R. Soc. Lond. B Biol. Sci. 367, 1001–1012. doi: 10.1098/rstb.2011.0359
Conflict of Interest Statement: The authors declare that the research was con-ducted in the absence of any commercial or financial relationships that could beconstrued as a potential conflict of interest.
Received: 30 November 2013; paper pending published: 03 January 2014; accepted: 27January 2014; published online: 28 February 2014.Citation: Denham S, Bõhm TM, Bendixen A, Szalárdy O, Kocsis Z, Mill R andWinkler I (2014) Stable individual characteristics in the perception of multiple embed-ded patterns in multistable auditory stimuli. Front. Neurosci. 8:25. doi: 10.3389/fnins.2014.00025This article was submitted to Auditory Cognitive Neuroscience, a section of the journalFrontiers in Neuroscience.Copyright © 2014 Denham, Bõhm, Bendixen, Szalárdy, Kocsis, Mill and Winkler.This is an open-access article distributed under the terms of the Creative CommonsAttribution License (CC BY). The use, distribution or reproduction in other forums ispermitted, provided the original author(s) or licensor are credited and that the originalpublication in this journal is cited, in accordance with accepted academic practice. Nouse, distribution or reproduction is permitted which does not comply with these terms.
www.frontiersin.org February 2014 | Volume 8 | Article 25 | 15
Related Documents