Egypt. J. Agron. Vol. 36, No. 2, pp. 123 - 146 (2014) Stability Parameters for Comparing Bread Wheat Genotypes under Combined Heat and Drought Stress N.E. M. Mohamed and A. A. Said Agronomy Department, Faculty of Agriculture, Sohag University, Egypt COMPARISON of ten local and twelve introduced wheat accessions was performed on twelve different induced environments (2 years × 2 sowing dates × 3 water stresses) to analyze genotype × environment interactions (G×E) and estimate stability indices of yield and its components. Mainly the total variations of studied traits were due to the main effects of environmental factors and their interaction, whereas the significant environmental variations were ranged from 10.62% (harvest index) to 43.95% (spike kernels weight). The genotypes differed significantly for all studied traits, moreover these differences ranged from 6.82 % to 50.42% of total variation in 1000-kernel weight and no. of kernels/spike, respectively. G×E interactions were highly significant and their contributions to the total SS accounted for 40.17, 30.78, 18.17, 22.02, 25.46, 18.61 and 88.46% for heading date, no. of spikes/m2, no. of kernels/spike, spike kernel weight, 1000-kernel weight, grain yield/m2 and harvest index, respectively. Three genotypes (NGB10893, Sids1 and Giza168) were high yielding and stable for most of the studied traits. Thus, these three genotypes could be promoted to the next extensive breeding programs. Keywords: Performance, Genotype × environment interaction, Stability parameters, Wheat. Wheat (Triticum aestivum L.) is a very important cereal crop in Egypt as a source of human food. Growth rate of a human population in Egypt is still relatively high, thus the demand of wheat is being progressively increased. Overcoming the gap between cereal production and consumption depends mainly on horizontal extension of cultivated area of cereals and raising the yield per unit area is encountered by unfavorable conditions such as drought, heat and high salinity of soil. The first step is to identify, the superior tolerant genotypes to be used in the breeding program. However, stable wheat cultivars that are tolerant to different environmental stresses are the ultimate goal of the national wheat research program. Stable genotypes have the same reactions across the environments. Most favorable stability occurs with high yield or performance (Björnsson, 2002). Increasing genetic gains in yield is possible in part from narrowing the adaptation of cultivars, thus maximizing yield in particular areas by exploiting genotype × environment interaction (G × E). G × E is of major importance, A

Welcome message from author
This document is posted to help you gain knowledge. Please leave a comment to let me know what you think about it! Share it to your friends and learn new things together.
Transcript
Egypt. J. Agron. Vol. 36, No. 2, pp. 123 - 146 (2014)
Stability Parameters for Comparing Bread
Wheat Genotypes under Combined Heat and
Drought Stress
N.E. M. Mohamed and A. A. Said
Agronomy Department, Faculty of Agriculture, Sohag
University, Egypt
COMPARISON of ten local and twelve introduced wheat accessions was performed on twelve different induced
environments (2 years × 2 sowing dates × 3 water stresses) to analyze genotype × environment interactions (G×E) and estimate stability indices of yield and its components. Mainly the total variations of studied traits were due to the main effects of environmental factors and their interaction, whereas the significant environmental variations were ranged from 10.62% (harvest index) to 43.95% (spike kernels
weight). The genotypes differed significantly for all studied traits, moreover these differences ranged from 6.82 % to 50.42% of total variation in 1000-kernel weight and no. of kernels/spike, respectively. G×E interactions were highly significant and their contributions to the total SS accounted for 40.17, 30.78, 18.17, 22.02, 25.46, 18.61 and 88.46% for heading date, no. of spikes/m2, no. of kernels/spike, spike kernel weight, 1000-kernel weight, grain yield/m2 and harvest index, respectively. Three genotypes (NGB10893, Sids1 and Giza168) were
high yielding and stable for most of the studied traits. Thus, these three genotypes could be promoted to the next extensive breeding programs.
Keywords: Performance, Genotype × environment interaction,
Stability parameters, Wheat.
Wheat (Triticum aestivum L.) is a very important cereal crop in Egypt as a
source of human food. Growth rate of a human population in Egypt is still
relatively high, thus the demand of wheat is being progressively increased.
Overcoming the gap between cereal production and consumption depends
mainly on horizontal extension of cultivated area of cereals and raising the yield
per unit area is encountered by unfavorable conditions such as drought, heat and
high salinity of soil. The first step is to identify, the superior tolerant genotypes
to be used in the breeding program. However, stable wheat cultivars that are
tolerant to different environmental stresses are the ultimate goal of the national
wheat research program.
Stable genotypes have the same reactions across the environments. Most
favorable stability occurs with high yield or performance (Björnsson, 2002).
Increasing genetic gains in yield is possible in part from narrowing the
adaptation of cultivars, thus maximizing yield in particular areas by exploiting
genotype × environment interaction (G × E). G × E is of major importance,
A

N.E. M. MOHAMED AND A. A. SAID
Egypt. J. Agron. 36, No. 2 (2014)
124
because it provides information about the effect of different environments on
cultivar performance and has a key role for assessment of performance stability
of the breeding materials (Moldovan et al., 2000 and Bose et al., 2014).
The regression coefficient (bi) and the average departure from regression line
(S2di) are two mathematical indices for the assessment of stability (Eberhart &
Russell, 1966). A genotype with high bi and S2di reacts readily to changes in the
environment and possesses considerable variability, whereas cultivars with a bi <
1.0 and S2di near to 0.00 react weakly to changes in growing conditions and are
considered to be stable in yield (Shindin & Lokteva, 2000).
The ability of a crop cultivar to perform reasonably well in variable abiotic
stresses is an important trait for both the stability of production under drought
conditions (Nachit & Ouassou, 1988). Climate and weather conditions greatly
influence the performance of new wheat cultivars both for yield and quality
(Wajid et al., 2004; Sharma et al., 2006 and Abdullah et al., 2007). Selection for
yield stability over stress sites and years was able to improve the stress resistance
(Ortiz-Ferrara et al., 1991). Regression analysis as well as grain yield per se
could be useful for identifying high yielding thermo tolerance genotypes
(Abd-Elghani et al., 1994). In addition, there is a strong evidence that breeding
for drought resistance should include both yield and stability improvement
(Clark & Townley-Smith, 1984). High temperature is one of the most important
abiotic environmental factors during grain filling and may influence both the
quantity and quality of the yield (Rehman et al., 2007, Anwar et al., 2011 and
Hamidou et al., 2013). All genotypes significantly produced higher grain yields
under normal date of sowing compare with late date of sowing,
(Sial et al., 2005).
The objectives of the present study are to: (1) Evaluate the magnitude of G×E
interactions, (2) Assess the stability parameters of grain yield and its
components, (3) Show the degree of linear relationships either between these
stability parameters or between their average of the studied traits of the 22 local
and introduced wheat accessions and (4) Identify most stable genotypes under
abiotic stresses (heat and drought).
Materials and Methods
Plant material and experimental design
Twenty two wheat genotypes from diverse origin including 10 local and 12
introduced genotypes were used in this study (Table 1). The experiments were
conducted at the experimental farm of Faculty of Agriculture, Sohag University,
Egypt. Two experiments were performed in each season at two different sowing
dates (D) 20th November and 20th December, 2011/2012 and 2012/2013 and
three water irrigation treatments. The irrigation treatments were; (1) II as normal
irrigation in which wheat plants were supplied by water irrigation over all

STABILITY PARAMETERS FOR COMPARING BREAD …
Egypt. J. Agron. 36, No. 2 (2014)
125
growth stages (10 irrigation frequencies), (2) III water irrigations were reduced
by three irrigations from the beginning of anthesis stage till harvest stage
(7 irrigation frequencies) and (3) IIII was 5 irrigation frequencies only started
from booting stage till the milk-ripe stage.. Overall, twelve different
environments were created by manipulating environmental factors which were
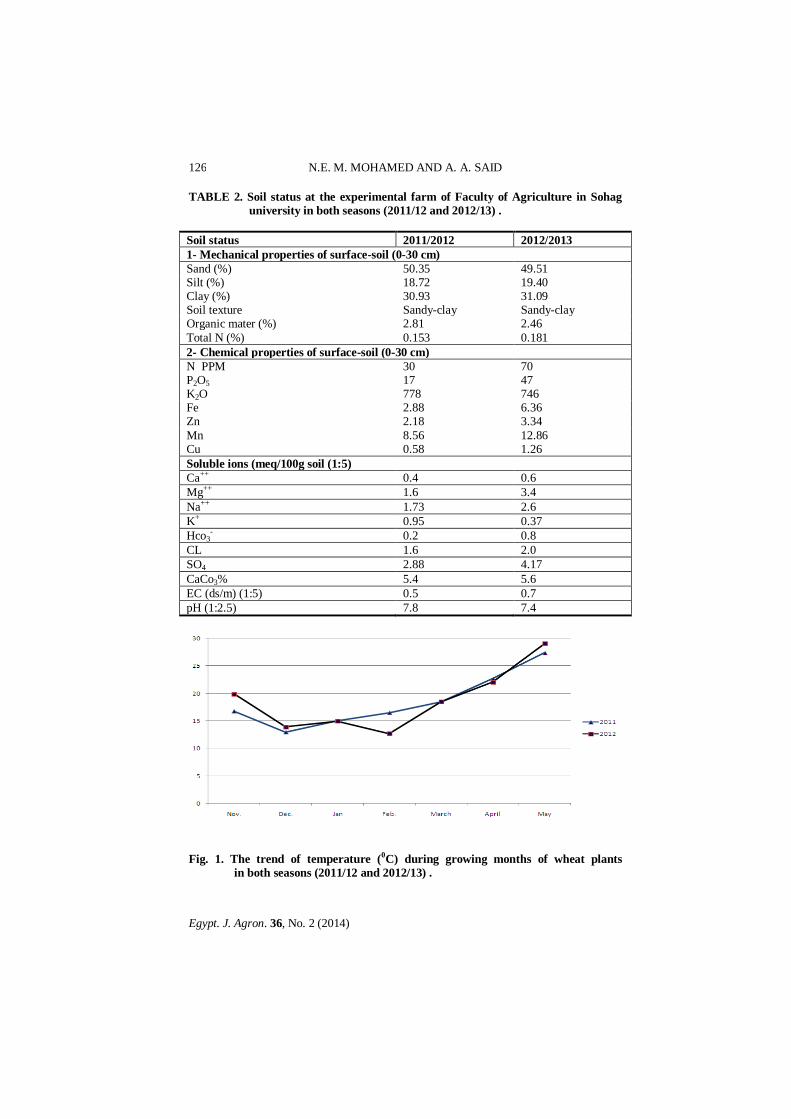
two years × two dates × three water irrigation treatments. Both the trend of
temperature as a climatic factor and the soil status (particle-size distribution, soil
texture and chemical analysis) as an edaphically factor reflected the variation
between the two winter growing seasons of 2011/2012 and 2012/2013 as shown
Fig. 1 and Table 2.
TABLE 1. Pedigree and source of 22 wheat accessions used in the study .
Source Pedigree Genotype Entry
No. Nord gene
bank --- NGB90533 1
Egypt Kvz/Buha”s”//Kai/Bb=Veery”s” Giza 164 2 “ Gemmeiza 3 3 Nord gene
bank --- NGB10992 4
“ --- NGB11185 5 “ --- NGB11418 6 “ --- NGB4769 7 “ --- NGB4823 8 “ --- NGB6404 9 “ --- NGB6406 10 “ --- NGB8188 11 “ --- NGB8218 12 “ --- NGB10893 13 Egypt HD2172/Pavon”s”//1158.57/Maya74”s” Sids 1 14 “ Inia/R1.4220//7C/Yr”s” Sakha 69 15 Nord gene
bank --- NGB10991 16
Egypt --- Gemmiza 7 17
“ Indus 66 x Norteno”s”/PK3418-65-ISW-OS Sakha 8 18 “ Maya 74/on//1160/147/3/Bb/Gall/ Chat”s” Gemmeiza 1 19 “ NS 732/PIMA//Verry”s” Sahel 1 20 “ Cno/Mfd//Man”s” Giza 165 21 “ Mill/Kauz//Kauz. Giza 168 22
N.E. M. MOHAMED AND A. A. SAID
Egypt. J. Agron. 36, No. 2 (2014)
126
TABLE 2. Soil status at the experimental farm of Faculty of Agriculture in Sohag
university in both seasons (2011/12 and 2012/13) .
Soil status 2011/2012 2012/2013
1- Mechanical properties of surface-soil (0-30 cm)
Sand (%) 50.35 49.51 Silt (%) 18.72 19.40 Clay (%) 30.93 31.09 Soil texture Sandy-clay Sandy-clay Organic mater (%) 2.81 2.46
Total N (%) 0.153 0.181
2- Chemical properties of surface-soil (0-30 cm)
N PPM 30 70 P2O5 17 47 K2O 778 746 Fe 2.88 6.36 Zn 2.18 3.34
Mn 8.56 12.86 Cu 0.58 1.26
Soluble ions (meq/100g soil (1:5)
Ca++ 0.4 0.6
Mg++ 1.6 3.4
Na++ 1.73 2.6
K+ 0.95 0.37
Hco3- 0.2 0.8
CL 1.6 2.0
SO4 2.88 4.17
CaCo3% 5.4 5.6
EC (ds/m) (1:5) 0.5 0.7
pH (1:2.5) 7.8 7.4
Fig. 1. The trend of temperature (0C) during growing months of wheat plants
in both seasons (2011/12 and 2012/13) .
STABILITY PARAMETERS FOR COMPARING BREAD …
Egypt. J. Agron. 36, No. 2 (2014)
127
Split-plot design with three replications was used for every planting date, in
which the water irrigation treatments were assigned to the main plots and the
genotypes were randomly distributed to the sub plots. Data were recorded on
days to 50% heading, number of spikes/m2, number of kernels/spike, spike grain
weight (gm), 1000-kernel weight (gm), grain yield/m2 (gm) and Harvest index
(gm) was calculated by using the following formula: Harvest index = (Grain yield)/(Grain + straw yield)
Statistical analyses
The combined analysis, both in detail and collectively, was performed on the
recorded data of grain yield and its components of the 22 genotypes over all the
twelve environments according to Gomez & Gomez (1994). The stability
parameters C.V. %, bi, Bi, S2di and r2 were assessed to each of the 22 genotypes
over all environments. Where C.V.% was estimated according to Francis &
Kannenbert (1978), bi and S2di were estimated by using Eberhart & Russell’s
model (1966) and βi as described by Perkins & Jinks, (1968). Consequently, a
stable genotype is a genotype has a regression coefficient of unity (bi = 1.0) and a deviation from regression mean squares equals zero (S2di = 0) and hence an
ideal genotype would have both a high average performance over a wide range
of environments together with stability parameters as defined by Eberhart &
Russell (1966). The coefficient of determination (r2) was proposed to use by
Pinthus (1973), because it measures the proportion of a genotype's production
variation that is attributable to the linear regression as an index of production
stability over environments.
A correlation among stability indices ( X , C.V. %, bi, βi, S2di, and r2) was
performed by using simple correlation (Fisher & Yates, 1953). LSD was
computed to compare the differences among means of genotypes while each
regression coefficient was tested by t test using the standard error of the
corresponding b value. The degree of linear relationships (r's) was also
calculated among the studied traits in this study to examine their mutual effects.
Results and Discussion
Environment-Genotype variations and GxE interactions
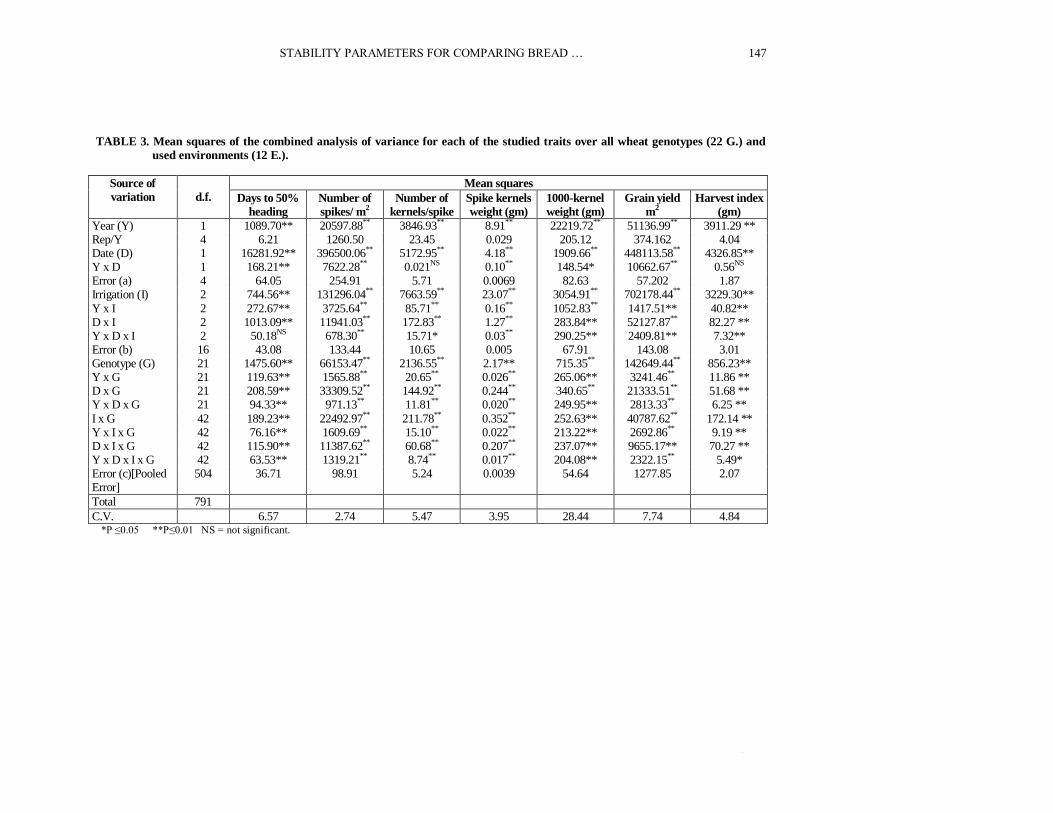
Combined analysis of variance of the studied traits (Table 3) showed that all
the variations in the total sum of squares were attributed to the various
environmental factors (Y, D and I) and their interactions which always were
statistically significant or highly significant with the exception of Y×D
interaction of no. of kernels/spike, 1000-kernel weight and harvest index.
The total variations in the studied traits were mostly due to the main effect of
the environmental factors (Y, D, and I) which their variations ranged from
10.39% for harvest index to 41.82% for grain weight/spike. This range among
the studied wheat features descended from the highest value of the effects of
water stresses (15.29 %) to planting dates (3.68%) to years (0.44%).
Environmental factors interactions also contributed to a small extent to the total
N.E. M. MOHAMED AND A. A. SAID
Egypt. J. Agron. 36, No. 2 (2014)
128
variations and these contributions extended from 0.23% for harvest index to
4.14% for days to heading and most of these interaction variations were due to
D×I interaction over all the studied traits with exception of 100-kernel weight
which was much more sensitive to Y×I interaction (Table 3).
The previous findings reflected on the environmental variations which were
highly significant and estimated by 31.63, 36.42, 27.98, 43.95, 15.28, 12.98 and
10.62 % of the total variations for days to 50% heading, no. of spikes/ plant, No.
of kernels/spike, spike kernel weight, 1000 kernel weight, grain yield plot" and
harvest index, respectively (Table 4). These environmental variations were a
direct result of (1): The wide variations in climatic and edaphic factors between
the two winter growing seasons (Table 1 and Fig. 1), (2) The effects of optimum
and late sowing dates, and (3) the influence of water stress on yield and its
components (EI-Morshidy et al., 1998 and 2000). So, these results emphasize
that adopting the proper agricultural practices, especially sowing on the proper
time with no water stress during the growing season, would visibly reduce a
large amount of the environmental variations either by diminishing its main
effect or by lessening its interactions or both.
The analyzed data also revealed that there were highly significant differences
among genotypes for all the studied features across environments. Moreover, the
contribution of the genotype variations to the total sum of squares was ranged
from 6.82% (100-kernel weight) to 50.42% (no. of kernels/spike). Obviously, all
degrees of G×E interactions were significant with exception of 100-kernel
weight. In addition, the range of G×E contributions to the total SS were from
18.17% (no. of kernels/spike) to 88.46% (harvest index) over all the studied
plant characters in used environments (Tables 3 and 4). The genetic diversity and
the significant G×E interactions imply both sensitivity of genotypes and
differential responses of these genotypes to various environments, suggesting the
importance of stability parameters assessment of these genotypes under these
conditions to identify the best stable suitable genotypes under this range of
environments. Saini & Gautam (1990) stated that the range of contributions of
both environmental effects and genetic differences to the total SS was from 31.0
to 72.1 % for environmental effects and from 8.3 to 34% for the genetic
differences. Moreover, Nachit et al. (1992) showed that the mean squares of
environments, genotypes and G×E interactions of the analysis of variance of
wheat genotypes were highly significant and accounted for 89.3%, 0.5% and
10.2% of the treatment combinations SS, respectively. The results in this study
are generally in harmony with previous studies (EI-Defrawy et al., 1994;
Kheiralla & Ismail, 1995; Ismail, 1995, EI-Morshidy et al., 1998 and 2000;
Kheiralla et al., 2004 and Bose et. al., 2014).

STABILITY PARAMETERS FOR COMPARING BREAD …
Egypt. J. Agron. 36, No. 2 (2014)
129
TABLE 3

N.E. M. MOHAMED AND A. A. SAID
Egypt. J. Agron. 36, No. 2 (2014)
130
TABLE 4
STABILITY PARAMETERS FOR COMPARING BREAD …
Egypt. J. Agron. 36, No. 2 (2014)
131
Joint regression analyses
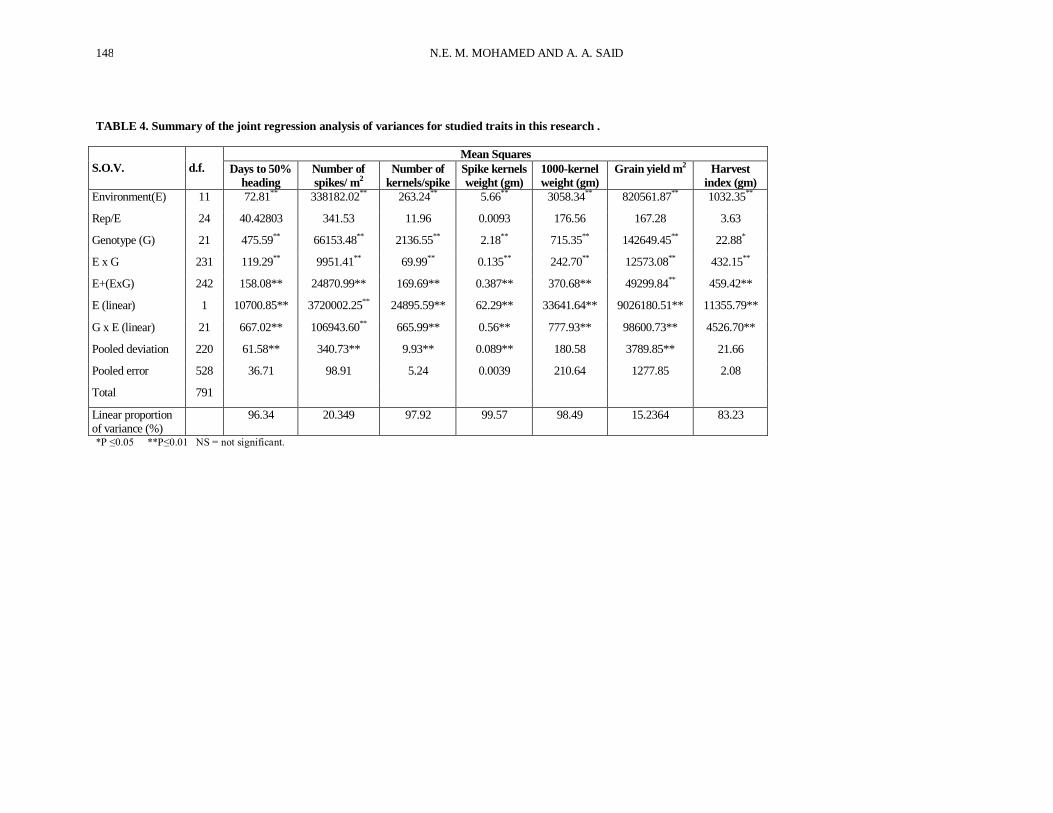
Analysis of variance of the studied traits over all environments and genotypes
when stability parameters are estimated for each genotype across all
environments are presented in Table 4. All mean squares of E+G×E were highly
significant and the contributions of their SS to the total SS over all traits ranged
from 40.74% (1000-kernel weight) to 98.53% (harvest index). In fact, (E+G×E)
ss for each trait is only a makeup of the two parts; Ess and G×Ess of the same
trait. Ess is completely represented by E (linear) ss which its mean square was
highly significant for the studied traits, emphasizing again that there were much
differences among environments and their influences would remarkably reflect
on the studied traits. Also, the partition of G×Ess interaction of the studied traits
into its two components; i.e., regression ss [G×E (Iinear)ss] and deviations from
regression ss [pooled deviations], demonstrated that: (1) GxE (linear) ss's for five
out of the six studied traits were statistically significant, implying that it could be
proceeding in assessment of stability parameters using Eberhart & Russell's
model (1966). (2) The contributions of G×E (linear) ss's to G×E interaction ss's
over all the studied traits ranged from 29.14% (1000-kernel weight) to 96.74%
(no. of spikes/plant), emphasizing the importance of the stable parameter S2di as
defined by the previous studies. (3) The highly significance of deviation mean
squares in this research pointed out to both considerable variations among
genotypes in their stabilities and also visual variability of genotypes relative
ranking from one environment to another. These data are coincident with
Eberhart & Russell (1966), Nachit et al. (1992), Kheiralla and Ismail (1995),
Ismail (1995), EI-Morshidy et al. (1998 and 2000), Kheiralla et al. (2004),
Mustãţea1 et al. (2009) and Koumber et al. (2011).
Estimated stability parameters
It is important to report that plant breeders in executing selection programs
would prefer to select genotypes with high average performance and most stable
across various environments. Our data in Table 6 suggest that it is possible to select from wheat accessions in this study using a combination of both response
and stability production indices. Langer et al. (1979) stated the same conclusion
in oat varieties. Therefore, in the present study genotype will be selected if it has
higher mean performance than the grand mean, higher r2, low c. v. %, bi = 1 and
smaller S2di. This is, in brief, because higher r2 means that the linear model fits
the data with the other parameters which will pronounce on well performed and
the most stable suitable genotype.
Days to 50% heading
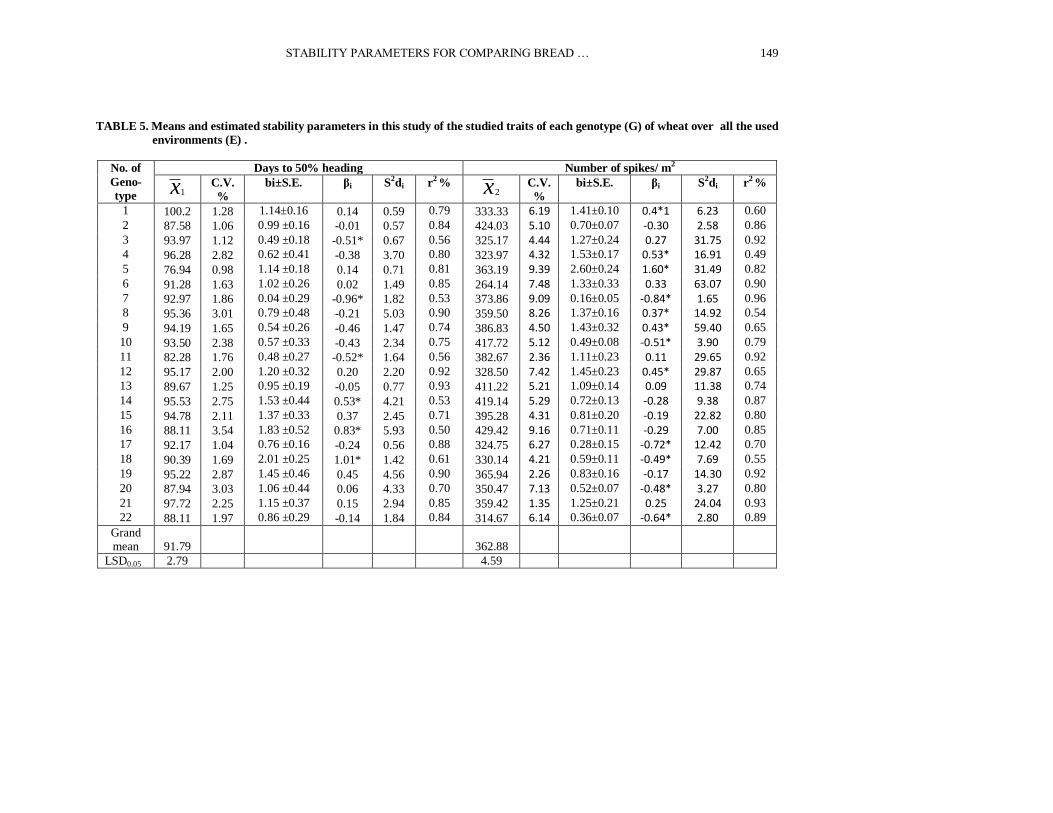
The studied genotypes appeared to have a wide range of variability in mean
heading dates as shown in Table 5 and Fig. 2a. The range of heading dates among genotypes was about 23 days with an average of 91.79 days. Obviously,
the C.V.’s% among genotypes was low, therefore, the stability will be
determined on the basis of r2, bi and S2di (Table 5). Sixteen genotypes were
stable due to their bi’s and S2di’s did not differ from a unit and the zero,
N.E. M. MOHAMED AND A. A. SAID
Egypt. J. Agron. 36, No. 2 (2014)
132
respectively plus showing high r2. Six of the 22 studied genotypes (2, 5, 6, 13, 20
and 22) are considered as ideal in stability parameters although they were
slightly late in heading. This significant deviation from regression for heading
date was attributed by Joppa et al. (1971) to specific cultivar × location or other
specific cultivar × environment interaction. These results are generally in line
with those reported by EI-Defrawy et al. (1994), Kheiralla and Ismail (1995), Ismail (1995) and EI-Morshidy et al. (1998 and 2000).
Number of spikes/plant
Out of the 22 studied genotypes, 8 (2, 6, 11, 13, 14, 15, 16 and 19) showed
acceptable production statistics of both responses and stability for the number of
spikes/plant (Table 5 and Fig. 2b). They demonstrated high or insignificant
average comparing to the grand mean, low c.v.% values, higher r2, and
insignificant bi and S2di. Similar results were reported by Salem et al. (1990),
Ismail (1995), EI-Morshidy et al. (1998 and 2000) and Kheiralla et al. (2004).
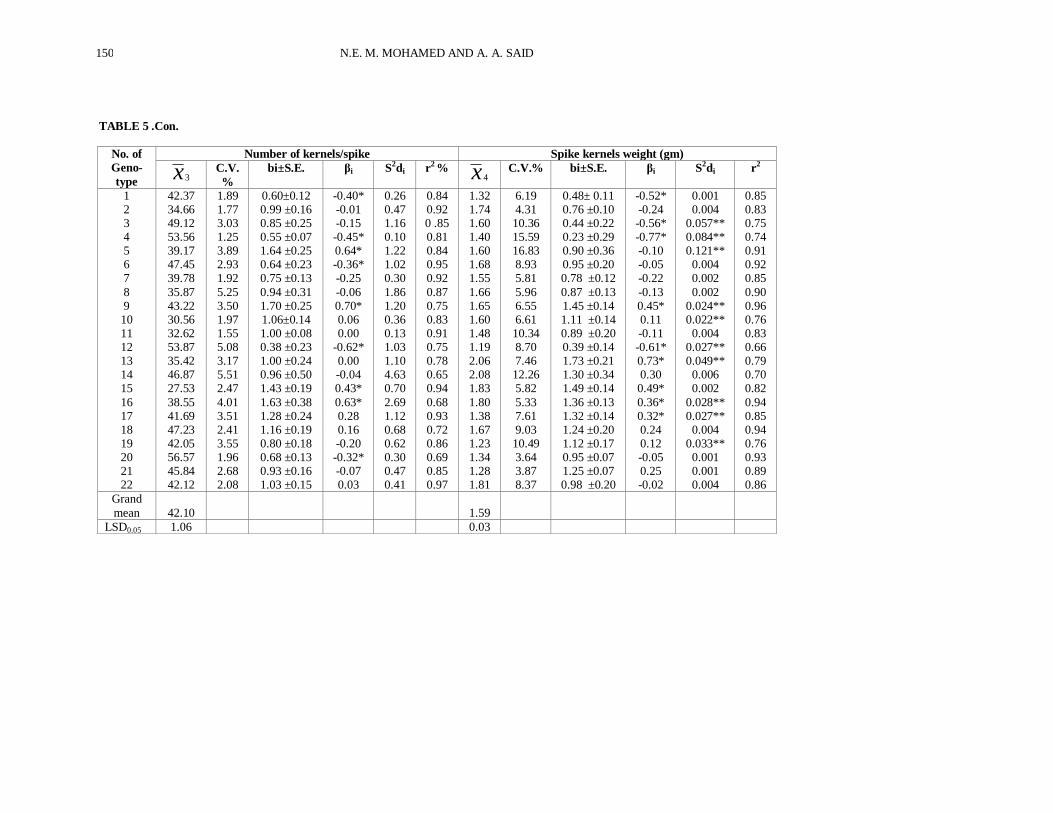
Number of kernels/spike The mean no. of kernels/spike ranged from 27.53 (genotype 14) to 56.57
(genotype 20) with an average of 42.10 (Table 5 and Fig. 2c). Six genotypes (3,
14, 17, 18, 21 and 22) have high average comparing to the grand mean with low
C.V. values, high r2, and insignificant bi and S2di.. Similar results were reported
by Bansal and Sinha (1991 b). The data also revealed that genotypes with higher
bi gave higher number of kernels/spike, this is due to the positively significant
association between x and bi (r= 0.448*). These findings are in agreement with
those obtained by Salem et al. (1990), EI-Morshidy et al. (1998 and 2000) and
Mustãţea1 et al. (2009).
Spike kernels weight (gm) Average Spike kernels weight ranged from 1.19 (genotype 12) to 2.08 gm
(genotype 14) with an average of 1.59 gm (Table 5 and Fig. 2d). Using the
parameters bi, S2di, C.V.% and r2 as selection criteria to the stability in this trait
associated with high mean. Six stable genotypes (2, 6, 8, 14, 18 and 22) were
selected when compared with the average over all genotypes. According to
Eberhart and Russell (1966), these genotypes may be considered superior. Again,
the relationship between x and bi was highly positively significant
(r= 0.523**) (Table 6). Similar results were reported by EI-Morshidy et al. (1998
and 2000).
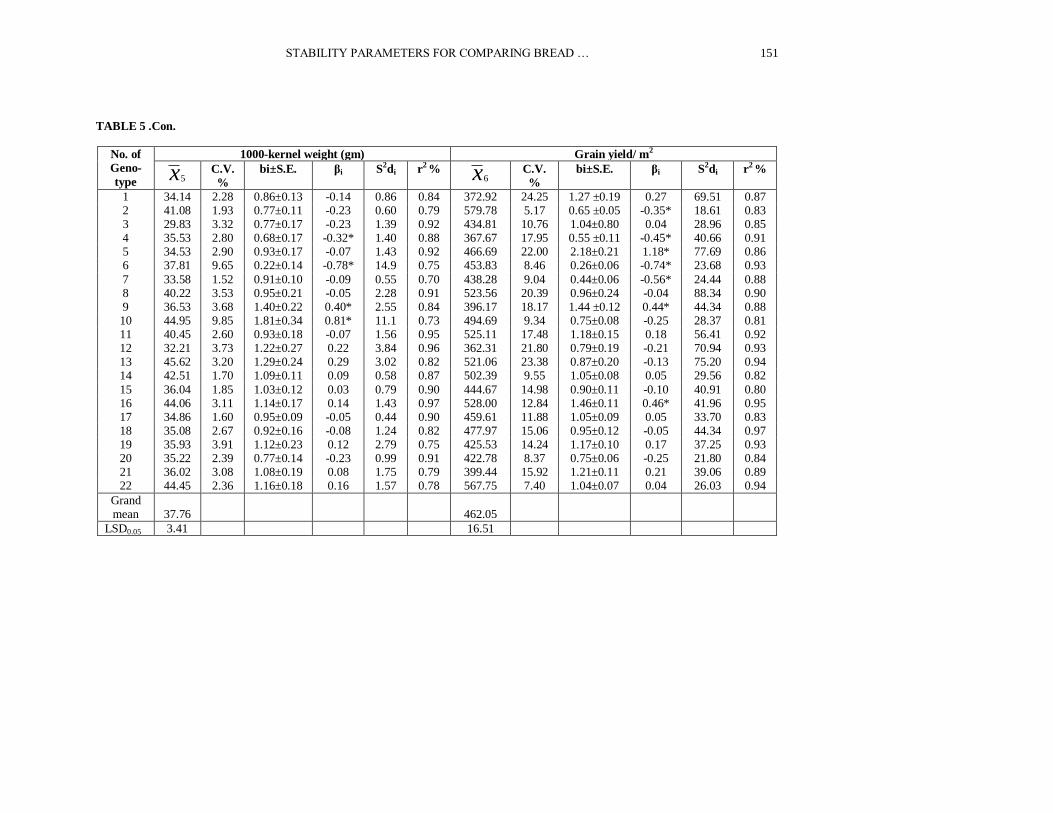
1000-kernels weight (gm)
The studied accessions differed in their averages of 1000-kernels weight
which ranged from 29.83 (genotype 3) to 45.62 gm (genotype 13) with an
average of 37.76 gm (Table 5, and Fig. 3e). Eighteen genotypes could be defined
as the most stable suitable genotypes according to selection criteria. These
genotypes were characterized by having low c.v. %, high r2, insignificant bi and
S2di. Additionally, eight genotypes (2, 8, 12, 11, 13, 14, 16 and 22) were the
most desired genotypes for 1000-kernels weight and showed high mean
STABILITY PARAMETERS FOR COMPARING BREAD …
Egypt. J. Agron. 36, No. 2 (2014)
133
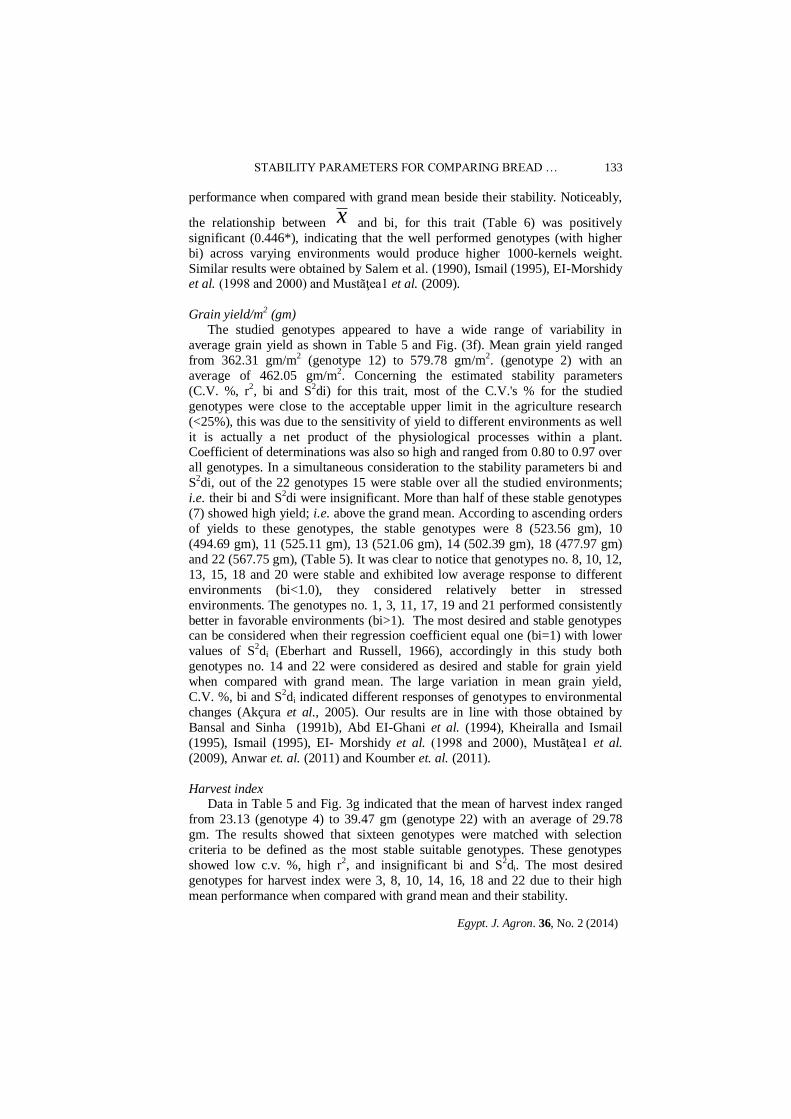
performance when compared with grand mean beside their stability. Noticeably,
the relationship between x and bi, for this trait (Table 6) was positively
significant (0.446*), indicating that the well performed genotypes (with higher
bi) across varying environments would produce higher 1000-kernels weight.
Similar results were obtained by Salem et al. (1990), Ismail (1995), EI-Morshidy et al. (1998 and 2000) and Mustãţea1 et al. (2009).
Grain yield/m2 (gm)
The studied genotypes appeared to have a wide range of variability in
average grain yield as shown in Table 5 and Fig. (3f). Mean grain yield ranged
from 362.31 gm/m2 (genotype 12) to 579.78 gm/m2. (genotype 2) with an
average of 462.05 gm/m2. Concerning the estimated stability parameters
(C.V. %, r2, bi and S2di) for this trait, most of the C.V.'s % for the studied
genotypes were close to the acceptable upper limit in the agriculture research
(<25%), this was due to the sensitivity of yield to different environments as well
it is actually a net product of the physiological processes within a plant. Coefficient of determinations was also so high and ranged from 0.80 to 0.97 over
all genotypes. In a simultaneous consideration to the stability parameters bi and
S2di, out of the 22 genotypes 15 were stable over all the studied environments;
i.e. their bi and S2di were insignificant. More than half of these stable genotypes
(7) showed high yield; i.e. above the grand mean. According to ascending orders
of yields to these genotypes, the stable genotypes were 8 (523.56 gm), 10
(494.69 gm), 11 (525.11 gm), 13 (521.06 gm), 14 (502.39 gm), 18 (477.97 gm)
and 22 (567.75 gm), (Table 5). It was clear to notice that genotypes no. 8, 10, 12,
13, 15, 18 and 20 were stable and exhibited low average response to different
environments (bi<1.0), they considered relatively better in stressed
environments. The genotypes no. 1, 3, 11, 17, 19 and 21 performed consistently
better in favorable environments (bi>1). The most desired and stable genotypes can be considered when their regression coefficient equal one (bi=1) with lower
values of S2di (Eberhart and Russell, 1966), accordingly in this study both
genotypes no. 14 and 22 were considered as desired and stable for grain yield
when compared with grand mean. The large variation in mean grain yield,
C.V. %, bi and S2di indicated different responses of genotypes to environmental
changes (Akçura et al., 2005). Our results are in line with those obtained by
Bansal and Sinha (1991b), Abd EI-Ghani et al. (1994), Kheiralla and Ismail
(1995), Ismail (1995), EI- Morshidy et al. (1998 and 2000), Mustãţea1 et al.
(2009), Anwar et. al. (2011) and Koumber et. al. (2011).
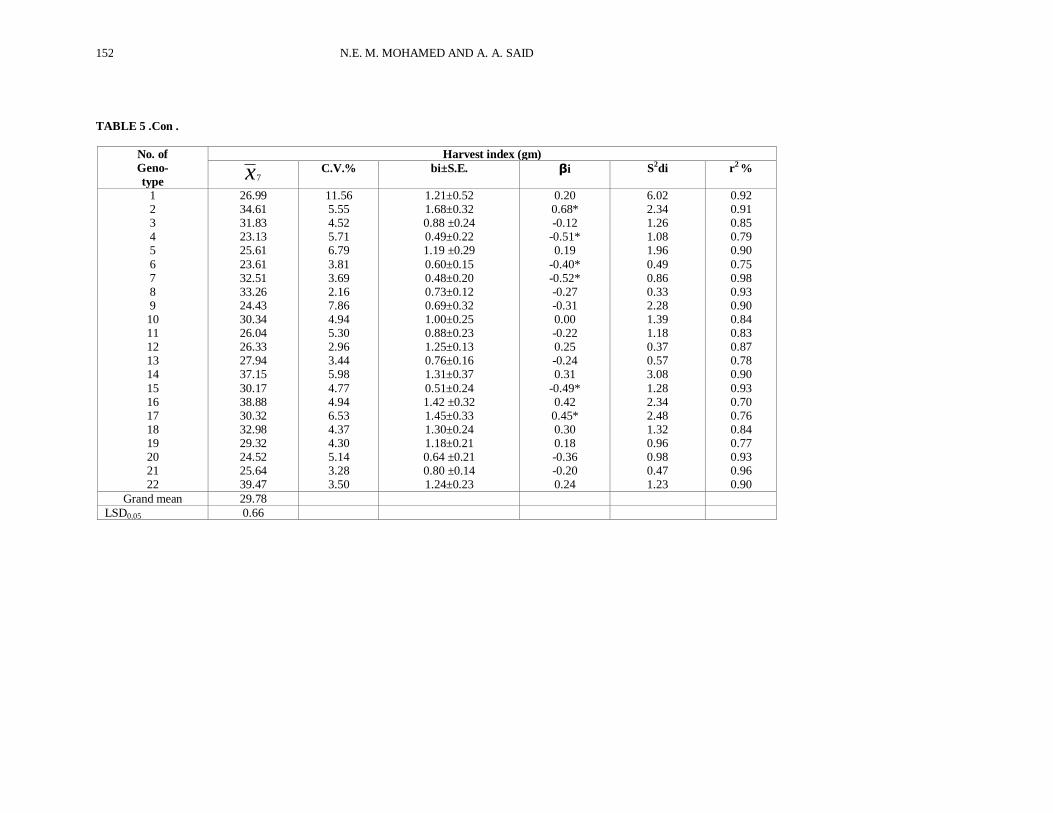
Harvest index Data in Table 5 and Fig. 3g indicated that the mean of harvest index ranged
from 23.13 (genotype 4) to 39.47 gm (genotype 22) with an average of 29.78
gm. The results showed that sixteen genotypes were matched with selection
criteria to be defined as the most stable suitable genotypes. These genotypes
showed low c.v. %, high r2, and insignificant bi and S2di. The most desired
genotypes for harvest index were 3, 8, 10, 14, 16, 18 and 22 due to their high
mean performance when compared with grand mean and their stability.

N.E. M. MOHAMED AND A. A. SAID
Egypt. J. Agron. 36, No. 2 (2014)
134
Table 5

STABILITY PARAMETERS FOR COMPARING BREAD …
Egypt. J. Agron. 36, No. 2 (2014)
135
Table 5

N.E. M. MOHAMED AND A. A. SAID
Egypt. J. Agron. 36, No. 2 (2014)
136
Table 5

STABILITY PARAMETERS FOR COMPARING BREAD …
Egypt. J. Agron. 36, No. 2 (2014)
137
TABLE 5 .Con.
N.E. M. MOHAMED AND A. A. SAID
Egypt. J. Agron. 36, No. 2 (2014)
138
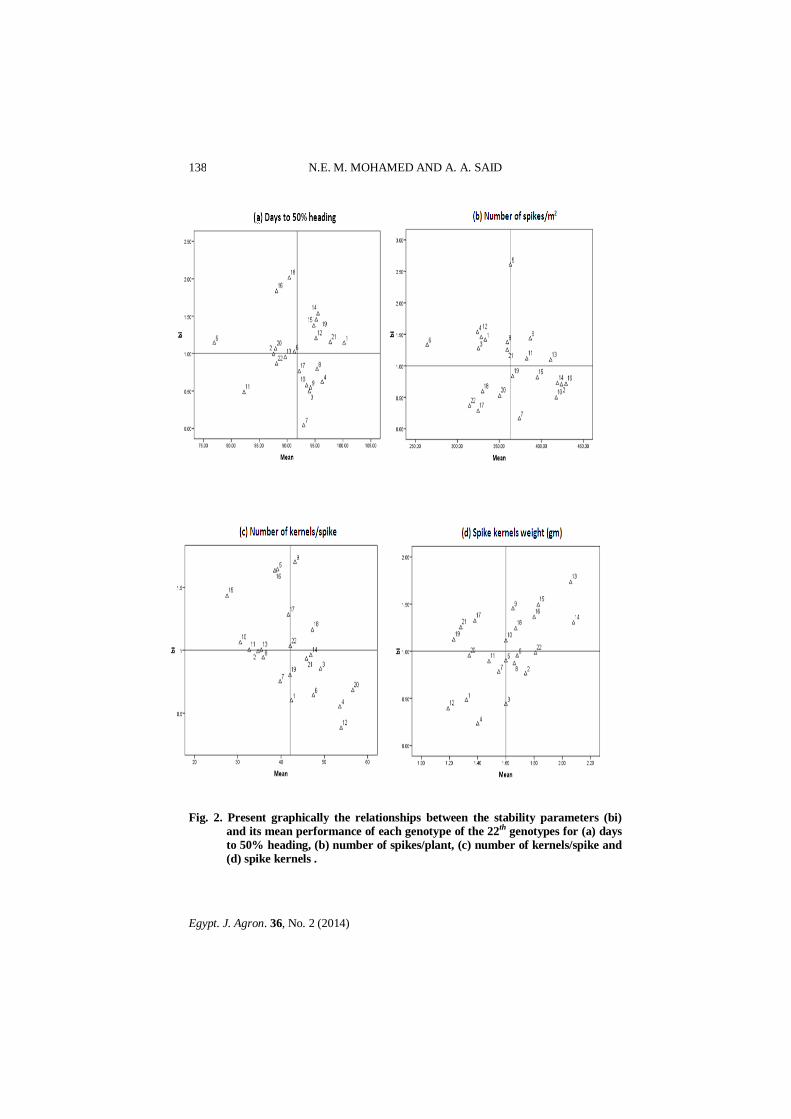
Fig. 2. Present graphically the relationships between the stability parameters (bi)
and its mean performance of each genotype of the 22th
genotypes for (a) days
to 50% heading, (b) number of spikes/plant, (c) number of kernels/spike and
(d) spike kernels .
STABILITY PARAMETERS FOR COMPARING BREAD …
Egypt. J. Agron. 36, No. 2 (2014)
139
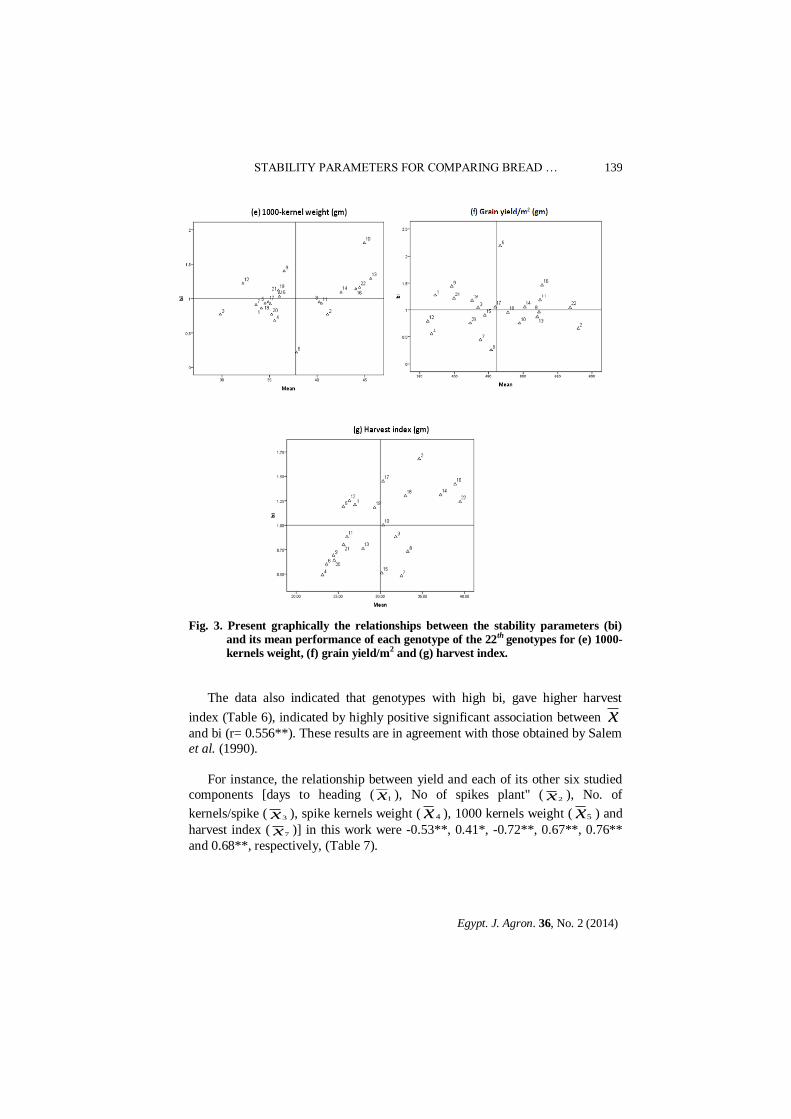
Fig. 3. Present graphically the relationships between the stability parameters (bi)
and its mean performance of each genotype of the 22th
genotypes for (e) 1000-
kernels weight, (f) grain yield/m2 and (g) harvest index.
The data also indicated that genotypes with high bi, gave higher harvest
index (Table 6), indicated by highly positive significant association between x
and bi (r= 0.556**). These results are in agreement with those obtained by Salem
et al. (1990).
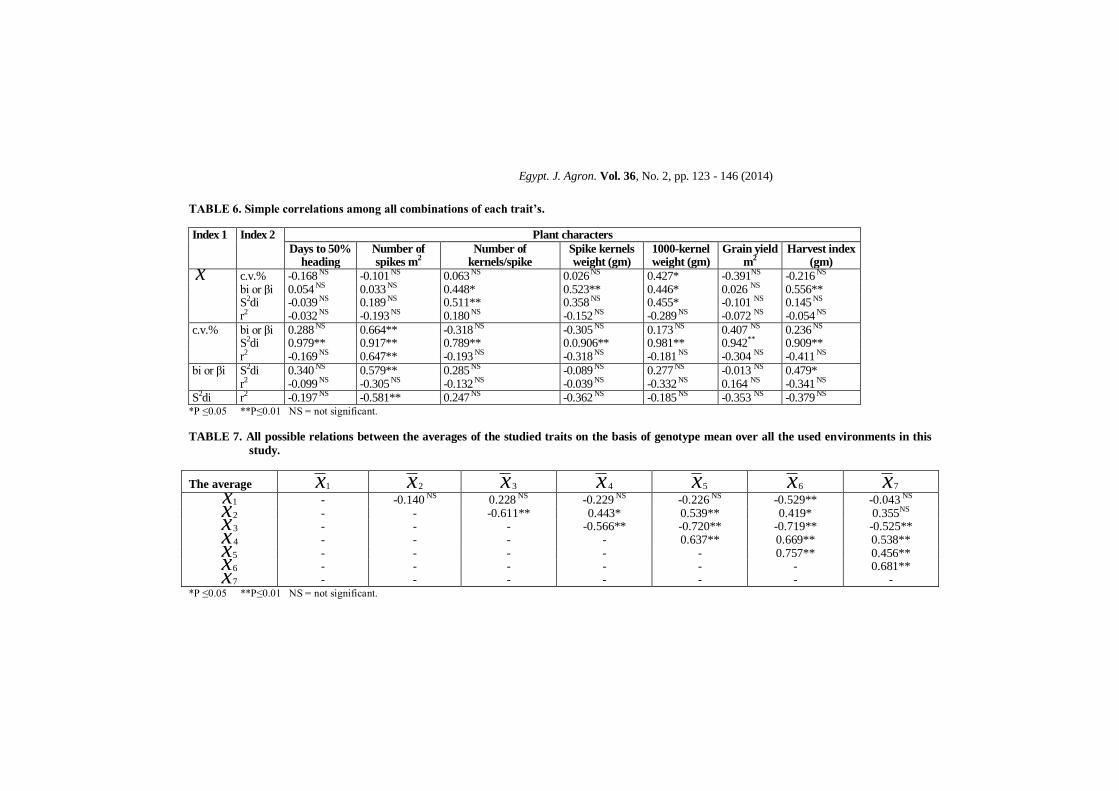
For instance, the relationship between yield and each of its other six studied
components [days to heading ( 1x ), No of spikes plant" ( 2x ), No. of
kernels/spike ( 3x ), spike kernels weight ( 4x ), 1000 kernels weight ( 5x ) and
harvest index ( 7x )] in this work were -0.53**, 0.41*, -0.72**, 0.67**, 0.76**
and 0.68**, respectively, (Table 7).

N.E. M. MOHAMED AND A. A. SAID
Egypt. J. Agron. 36, No. 2 (2014)
140
TABLE 5-6
STABILITY PARAMETERS FOR COMPARING BREAD …
Egypt. J. Agron. 36, No. 2 (2014)
141
These results indicate that wheat breeders should select the earlier plants
which have improved number of spikes, spike kernels weight and, in particular,
heavier 1000 kernels weight to improve grain yield using both production index
( x ) and the estimated stability parameters in this work. Where, Bansal & Sinha
(1991b) stated that the stability in grain yield of T. aestivum (Landraces and
improved wheat cultivars) under stress conditions was strongly depended on the
stability in spikes either per unit area or per plant. In addition, our results were in
agreement with those obtained by EI-Morshidy et al. (1998 and 2000 & Yan and
Hunt, (2001).
Moreover, our data emphasize that both mean performance of a genotype and its stability parameters should be taken together into consideration to recommend
such new genotype to be used in varying environments. Whereas, previous
studies illustrated that the promising genotypes were Ahgaf, Giza 163 and Giza
160, these genotypes which all showed to have at most higher average of
performance than the grand mean and also acceptable stability parameters to its
studied traits (EI-Morshidy et al., 1998 and 2000). Although selection based
upon yield per se should be the most efficient method for increasing the mean
yield of a population (Wells & Kofoid, 1986). Parveen et al. (2010) noticed
some cultivars as stable on the basis of overall mean yields and stability
parameters viz., regression coefficients and minimum deviations from
regression.
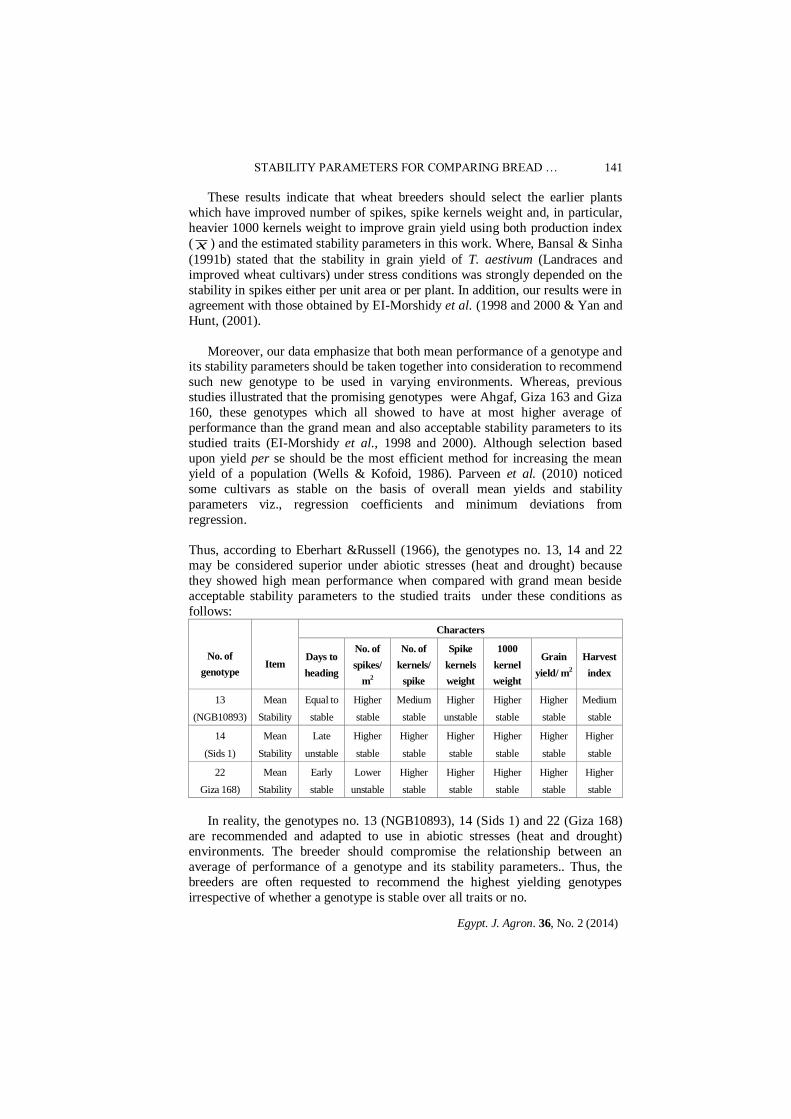
Thus, according to Eberhart &Russell (1966), the genotypes no. 13, 14 and 22
may be considered superior under abiotic stresses (heat and drought) because
they showed high mean performance when compared with grand mean beside
acceptable stability parameters to the studied traits under these conditions as
follows:
No. of
genotype
Item
Characters
Days to
heading
No. of
spikes/
m2
No. of
kernels/
spike
Spike
kernels
weight
1000
kernel
weight
Grain
yield/ m2
Harvest
index
13
(NGB10893)
Mean
Stability
Equal to
stable
Higher
stable
Medium
stable
Higher
unstable
Higher
stable
Higher
stable
Medium
stable
14
(Sids 1)
Mean
Stability
Late
unstable
Higher
stable
Higher
stable
Higher
stable
Higher
stable
Higher
stable
Higher
stable
22
Giza 168)
Mean
Stability
Early
stable
Lower
unstable
Higher
stable
Higher
stable
Higher
stable
Higher
stable
Higher
stable
In reality, the genotypes no. 13 (NGB10893), 14 (Sids 1) and 22 (Giza 168)
are recommended and adapted to use in abiotic stresses (heat and drought)
environments. The breeder should compromise the relationship between an
average of performance of a genotype and its stability parameters.. Thus, the
breeders are often requested to recommend the highest yielding genotypes
irrespective of whether a genotype is stable over all traits or no.
N.E. M. MOHAMED AND A. A. SAID
Egypt. J. Agron. 36, No. 2 (2014)
142
References
Abd-Elghani, A.M., Abd-EI Shafi, A.M. and EI-Monofi, M.M. (1994) Performance of
some wheat germplasm adapted to terminal heat stress in Upper Egypt. Assiut J.
Agric. Sci. 25: 59-67.
Abdullah, M., Rehman, A., Ahmad, N. and Rasul, I. (2007) Planting time effect on
grain and quality characteristics of wheat. Pak. J. Agri. Sci. 44: 200-202.
Akçura, M., Kaya, Y. and Taner, S. (2005) Genotype-environment interaction and
phenotypic stability analysis for grain yield of durum wheat in the Central Anatolian
Region. Turk. J Agric. 29: 369 – 375.
Anwar, J., Ahmad, A., Khaliq, T., Mubeen, M. and Sultana, S.R. (2011)
Optimization of sowing time for promising wheat genotypes in semiarid environment
of Faisalabad. Crop & Environment 2(1), 24-27.
Bansal, K.C. and Sinha, S.K. (1991 b) Assessment of drought resistance in 20
accessions of Triticum aestivum L. and related species. 11- Stability in yield
components. Euphytica, 56: 15-26.
Björnsson, I. (2002) Stability analysis towards understanding genotype x environment
interaction. Plant Agriculture Department of University of Guelph,Ontario, Canada.
www.genfys.slue.se/staff/deg/nova02.
Bose, L.K., Jambhulkar, N. N. , Pande, K. and Singh, O. N. (2014) Use of AMMI and
other stability statistics in the simultaneous selection of rice genotypes for yield and
stability under direct-seeded conditions. Chilean J. Agric. Res. 74 (1) Chillán mar.,
on-line ISSN 0718-5839.
Clarke, J.M. and Townley-Smith, T.F. (1984) Screening and selection techniques for
improving drought resistance. In: "Crop Breeding". P.B. Vose and S.G. Blikt. pp.
137-162. (Pergamon Press).
Eberhart, S.A. and Russell, W.A. (1966) Stability parameters for comparing varieties.
Crop Sci. 6: 36-40.
EI-Defrawy, M.M., Kheiralla, K.A. and Dawood, R.A. (1994) Effect of genotypes,
moisture stress and stability analysis on grain yield and some quality traits in wheat.
Assiut J. Agric. Sci. 25, 341-360.
EI-Morshidy, M.A., Tammam, A.M., Abd EI-Gawad, Y.G. and Elorong, E.E.M.
(1998) Mean performance of some wheat genotypes as influenced by some cultural
practices under new valley conditions. Assiut J. Agric. Sci. 29, 1-22.
EI-Morshidy, M.A., Elorong, E.E.M., Tammam, A.M. and Abd EI-Gawad, Y.G.
(2000) Analysis of genotype x environment interaction and assessment of stability
parameters of grain yield and its components of some wheat genotypes (Triticum
STABILITY PARAMETERS FOR COMPARING BREAD …
Egypt. J. Agron. 36, No. 2 (2014)
143
aestivum L.) under new valley conditions. The 2nd Scientific Conf. of Agri. Sci., Oct.,
Assiut, 13-34.
Fisher, R.A. and Yates, F. (1953) Statistical Tables for Biological, Agricultural, and
Medical Research." Olive and Boyd", Edinbugh, p.94.
Francis, T. R. and Kannenberg, L.W. (1978) Yield stability studies in short-season
maize. 1. A descriptive method for grouping genotypes. Can. J. Plant Sci. 58, 1029-
1034.
Gomez, K.A. and Gomez, A.A. (1984) "Statistical Procedures for Agricultural Research.
Wiley-Interscience Publ. John Wiley & Sons Inc. New York, USA
Hamidou, F., Halilou, O. and Vadez, V. (2013) Assessment of groundnut under
combined heat and drought stress. J. Agronomy and Crop Sci. 199(1), 1–11.
Ismail, A.A. (1995) The performance and stability of some wheat genotypes under
different environments. Assiut J. Agric. Sci. 26, 15-37.
Joppa, L.R, Lebsock, K.L. and Bush, R.H. (1971) Yield stability of selected spring
wheat cultivars (T. aestivum L.) in uniform regional nureries, Crop Sci. 11, 238-241.
Kheiralla, K.A. and Ismail, A.A. (1995) Stability analysis for grain yield and some traits
related to drought resistance in spring wheat. Assiut J. Agric. Sci. 26, 253- 266.
Kheiralla, K.A., Mahdy, E.E. and Dawood, R.A. (1988) Evaluation and genotypic stability
of some accessions of multi-cut Egyptian clover. Assiut. J. Agric Sci. 19 (4), 51-64.
Kheiralla, K.A., EI-Morshidy, M.A., Motawea, M.H. and Saeid, A.A. (2004)
Performance and stability of some wheat genotypes under normal and water stress
conditions. Assiut J. Agric. Sci. 35 (2), 74- 94.
Koumber, R.M., El-Hashash, E.F. and Seleem, S.A. (2011) stability analysis and
genotype x environment interaction for grain yield in bread wheat. Bull.
Fac.Agric.,Cairo Univ. 62: 457-467.
Langer, I., Frey, K.J. and Bailey, T. (1979) Associations among productivity,
production response and stability indexes in oat varieties. Euphytica, 28: 17-24.
Moldovan, V., Moldovan, M. and Kadar, R. (2000) Item from Romania. S.C.A.
Agricultural Research Station. Turda, 3350, str. Agriculturii 27 Jud Chuj, Romania.
Mustãţea1, P., Saulescu, N.N., Ittu1, G., Paunescu, G.,Voinea, L., Stere, I.,
Mîrlogeanu, S., Constantinescu, E. and Nastase, D. (2009) Grain yield and yield
stability of winter wheat cultivars in contrasting weather conditions. Romanian Agric.
Res. 26, 1 – 8.
N.E. M. MOHAMED AND A. A. SAID
Egypt. J. Agron. 36, No. 2 (2014)
144
Nachit, M.M. and Ouassou, A. (1988) Association of yield potential, drought tolerance
and stability in Triticum turgidum var. durum. Seventh International Wheat Genet
Symposium, (1), pp. 867-870.
Nachit, M.M., Nachit, G., Ketata, H., Gauch, H.G. and Zobel, R.W. (1992) Use of
AMMI and linear regression models to analyze genotype - environment Interaction in
durum wheat. Theor. App. & Genet. 83, 597-601
Ortiz-Ferrara, G., Yau, S.K. and Moussa, M.A. (1991) Identification of agronomic
traits associated with yield under stress conditions. "Physiology-Breeding of Winter
Cereals for Stressed Mediterranean Environments". (ICARDA) Ed. INRA Paris.
Parveen, L., Khalil, I.H. and Khalil, S.K. (2010) Stability parameters for tillers, grain
weight and yield of wheat cultivars in north-west of Pakistan. Pak. J. Bot. 42(3),
1613 – 1617.
Perkins, J.M. and Jinks, J.L. (1968) Environmental and genotype environmental
components of variability. Ill. Multiple lines and corsses. Heredity, 23, 339-356.
Pinthus, M.J. (1973) Estimate of genotypic value a proposed method. Euphytica, 2,
121-123.
Rehman, H., Farooq, M. and Afzal, I. (2007) Late sowing of wheat by seed priming.
http://www.pakissan.com/english/index.html.
Saini, D.P. and Gautum, P.L. (1990) Note on G x E analysis in segregation populations
of durum wheat. Indian J. Genet. 50, 199-201.
Salem, A. H., Rabie, H.A. and Selim, M.S. (1990) Stability analysis for wheat grain
yield. Egypt J. Appl. Sci. 5, 225-237.
Sharma, D.L., D’Antuono, M., Mohammad, A., Shackley, B.J., Zaicou-Kunesch,
C.M. and Anderson, W. K. (2006) Differences among wheat cultivars in their
optimum sowing times in Western Australian environments. Proceedings of 13th
Agronomy Conf., Sept., Perth, Western Australia.
Shindin, I.M. and Lokteva, O.V. (2000) Evaluation of spring wheat varieties at
Primorskey for ecological plasticity. Ann. Wheat. Newslet., 46, 105 – 106.
Sial, M.A., Dahot, M.U., Arain, M.A., Mangrio, S.M., Naqvi, M.H. and Nizamani,
N.A. (2005) Effect of time of planting and heat stresses on wheat advanced
genotypes. Pakistan Journal of Biotechnology, 2(1/2): 13-23.
Wajid, A., Hussain, A., Ahmad, A., Goheer, A.R., Ibrahim, M. and Mussaddique,
M. (2004) Effect of sowing date and plant population on biomass, grain yield and
yield components of wheat. Int. J. Agri. Bio. 6, 1003–1005.
Wells, W.C. and Kofoid, K.D. (1986) Selection indices to improve an intermating
population of spring wheat. Crop Sci., 26, 1104-1109.
STABILITY PARAMETERS FOR COMPARING BREAD …
Egypt. J. Agron. 36, No. 2 (2014)
145
Yan, W. and Hunt. L.A. (2001) Interpretation of genotype by environment interaction
for winter wheat yield in Ontario. Crop Sci. 41, 19–25.
(Received 20/7/2014; accepted 19/10/2014)
N.E. M. MOHAMED AND A. A. SAID
Egypt. J. Agron. 36, No. 2 (2014)
146
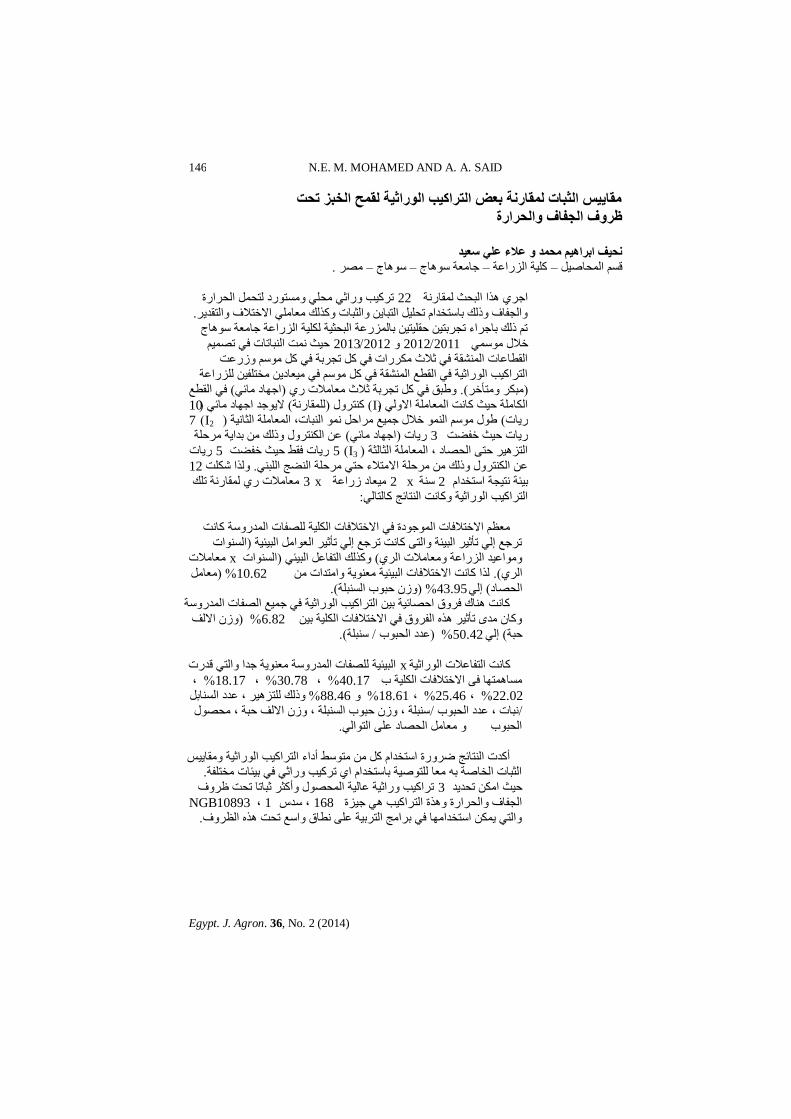
مقاييس الثباث لمقارنت بعض الخراكيب الوراثيت لقمح الخبز ححج
ظروف الجفاف والحرارة
نحيف ابراهيم محمد و عالء علي سعيد
.صش – عبط – عبعخ عبط – و١خ اضساعخ – لغ احبص١
رشو١ت ساص ح غزسد زح احشاسح 22اعش زا اجحش مبسخ
. اغفبف ره ثبعزخذا رح١ ازجب٠ اضجبد وزه عب االخزالف ازمذ٠ش
ر ره ثبعشاء رغشثز١ حم١ز١ ثبضسعخ اجحض١خ ى١خ اضساعخ عبعخ عبط
ح١ش ذ اجبربد ف رص١ 2012/2013 2011/2012خالي ع
امطبعبد اشمخ ف صالس ىشساد ف و رغشثخ ف و ع صسعذ
ازشاو١ت اساص١خ ف امطع اشمخ ف و ع ف ١عبد٠ خزف١ ضساعخ
ف امطع (اعبد بئ)طجك ف و رغشثخ صالس عبالد س . (جىش زأخش)
10)ال٠عذ اعبد بئ ( مبسخ)وزشي (I1)اىبخ ح١ش وبذ اعبخ اال 7 (I2)طي ع ا خالي ع١ع شاح اجبد، اعبخ اضب١خ (س٠بد
ع اىزشي ره ثذا٠خ شحخ (اعبد بئ) س٠بد 3 س٠بد ح١ش خفضذ
س٠بد 5 س٠بد فمظ ح١ش خفضذ 5( I3)ازض١ش حز احصبد ، اعبخ اضبضخ
12زا شىذ . ع اىزشي ره شحخ االزالء حز شحخ اضظ اج
عبالد س مبسخ ره x 3 ١عبد صساعخ x 2 عخ 2ث١ئخ ز١غخ اعزخذا
: ازشاو١ت اساص١خ وبذ ازبئظ وبزب
عظ االخزالفبد اعدح ف االخزالفبد اى١خ صفبد اذسعخ وبذ
اغاد )رشعع إ رأص١ش اج١ئخ از وبذ رشعع إ رأص١ش اعا اج١ئ١خ
عبالد xاغاد )وزه ازفبع اج١ئ (اع١ذ اضساعخ عبالد اش
عب ) %10.62زا وبذ االخزالفبد اج١ئ١خ ع٠خ ازذاد . (اش
. (ص حجة اغجخ) %43.95إ (احصبدوبذ بن فشق احصبئ١خ ث١ ازشاو١ت اساص١خ ف ع١ع اصفبد اذسعخ
ص االف ) %6.82وب ذ رأص١ش ز افشق ف االخزالفبد اى١خ ث١
. (عجخ/ عذد احجة ) %50.42إ (حجخ
اج١ئ١خ صفبد اذسعخ ع٠خ عذا از لذسد xوبذ ازفبعالد اساص١خ
، %18.17 ، %30.78 ، %40.17غبزب ف االخزالفبد اى١خ ة
ره زض١ش ، عذد اغبث 88.46% 18.61% ، 25.46% ، 22.02%
عجخ ، ص حجة اغجخ ، ص االف حجخ ، حصي /جبد ، عذد احجة /
. احجة عب احصبد ع ازا
أوذد ازبئظ ضشسح اعزخذا و زعظ أداء ازشاو١ت اساص١خ مب١٠ظ . اضجبد اخبصخ ث عب زص١خ ثبعزخذا ا رشو١ت ساص ف ث١ئبد خزفخ
رشاو١ت ساص١خ عب١خ احصي أوضش صجبرب رحذ ظشف 3ح١ش اى رحذ٠ذ
NGB10893 ، 1 ، عذط 168اغفبف احشاسح زح ازشاو١ت ع١ضح
.از ٠ى اعزخذاب ف ثشاظ ازشث١خ ع طبق اعع رحذ ز اظشف
STABILITY PARAMETERS FOR COMPARING BREAD …
147
147
TABLE 3. Mean squares of the combined analysis of variance for each of the studied traits over all wheat genotypes (22 G.) and
used environments (12 E.).
Source of
variation
d.f.
Mean squares
Days to 50%
heading
Number of
spikes/ m2
Number of
kernels/spike
Spike kernels
weight (gm)
1000-kernel
weight (gm)
Grain yield
m2
Harvest index
(gm)
Year (Y) 1 1089.70** 20597.88** 3846.93** 8.91** 22219.72** 51136.99** 3911.29 ** Rep/Y 4 6.21 1260.50 23.45 0.029 205.12 374.162 4.04 Date (D) 1 16281.92** 396500.06** 5172.95** 4.18** 1909.66** 448113.58** 4326.85** Y x D 1 168.21** 7622.28** 0.021NS 0.10** 148.54* 10662.67** 0.56NS Error (a) 4 64.05 254.91 5.71 0.0069 82.63 57.202 1.87 Irrigation (I) 2 744.56** 131296.04** 7663.59** 23.07** 3054.91** 702178.44** 3229.30**
Y x I 2 272.67** 3725.64** 85.71** 0.16** 1052.83** 1417.51** 40.82** D x I 2 1013.09** 11941.03** 172.83** 1.27** 283.84** 52127.87** 82.27 ** Y x D x I 2 50.18NS 678.30** 15.71* 0.03** 290.25** 2409.81** 7.32** Error (b) 16 43.08 133.44 10.65 0.005 67.91 143.08 3.01 Genotype (G) 21 1475.60** 66153.47** 2136.55** 2.17** 715.35** 142649.44** 856.23** Y x G 21 119.63** 1565.88** 20.65** 0.026** 265.06** 3241.46** 11.86 ** D x G 21 208.59** 33309.52** 144.92** 0.244** 340.65** 21333.51** 51.68 ** Y x D x G 21 94.33** 971.13** 11.81** 0.020** 249.95** 2813.33** 6.25 **
I x G 42 189.23** 22492.97** 211.78** 0.352** 252.63** 40787.62** 172.14 ** Y x I x G 42 76.16** 1609.69** 15.10** 0.022** 213.22** 2692.86** 9.19 ** D x I x G 42 115.90** 11387.62** 60.68** 0.207** 237.07** 9655.17** 70.27 ** Y x D x I x G 42 63.53** 1319.21** 8.74** 0.017** 204.08** 2322.15** 5.49* Error (c)[Pooled Error]
504 36.71 98.91 5.24 0.0039 54.64 1277.85 2.07
Total 791
C.V. 6.57 2.74 5.47 3.95 28.44 7.74 4.84 *P ≤0.05 **P≤0.01 NS = not significant.
N.E. M. MOHAMED AND A. A. SAID
148
148
TABLE 4. Summary of the joint regression analysis of variances for studied traits in this research .
S.O.V.
d.f.
Mean Squares
Days to 50%
heading
Number of
spikes/ m2
Number of
kernels/spike
Spike kernels
weight (gm)
1000-kernel
weight (gm)
Grain yield m2 Harvest
index (gm)
Environment(E) 11 72.81** 338182.02** 263.24** 5.66** 3058.34** 820561.87** 1032.35**
Rep/E 24 40.42803 341.53 11.96 0.0093 176.56 167.28 3.63
Genotype (G) 21 475.59** 66153.48** 2136.55** 2.18** 715.35** 142649.45** 22.88*
E x G 231 119.29** 9951.41** 69.99** 0.135** 242.70** 12573.08** 432.15**
E+(ExG) 242 158.08** 24870.99** 169.69** 0.387** 370.68** 49299.84** 459.42**
E (linear) 1 10700.85** 3720002.25** 24895.59** 62.29** 33641.64** 9026180.51** 11355.79**
G x E (linear) 21 667.02** 106943.60** 665.99** 0.56** 777.93** 98600.73** 4526.70**
Pooled deviation 220 61.58** 340.73** 9.93** 0.089** 180.58 3789.85** 21.66
Pooled error 528 36.71 98.91 5.24 0.0039 210.64 1277.85 2.08
Total 791
Linear proportion of variance (%)
96.34
20.349 97.92
99.57 98.49
15.2364
83.23
*P ≤0.05 **P≤0.01 NS = not significant.
STABILITY PARAMETERS FOR COMPARING BREAD …
149
149
TABLE 5. Means and estimated stability parameters in this study of the studied traits of each genotype (G) of wheat over all the used
environments (E) .
No. of
Geno-
type
Days to 50% heading Number of spikes/ m2
1x C.V.
%
bi±S.E. βi S2di r
2 %
2x C.V.
%
bi±S.E. βi S2di r
2 %
1 100.2 1.28 1.14±0.16 0.14 0.59 0.79 333.33 6.19 1.41±0.10 0.4*1 6.23 0.60
2 87.58 1.06 0.99 ±0.16 -0.01 0.57 0.84 424.03 5.10 0.70±0.07 -0.30 2.58 0.86
3 93.97 1.12 0.49 ±0.18 -0.51* 0.67 0.56 325.17 4.44 1.27±0.24 0.27 31.75 0.92
4 96.28 2.82 0.62 ±0.41 -0.38 3.70 0.80 323.97 4.32 1.53±0.17 0.53* 16.91 0.49
5 76.94 0.98 1.14 ±0.18 0.14 0.71 0.81 363.19 9.39 2.60±0.24 1.60* 31.49 0.82
6 91.28 1.63 1.02 ±0.26 0.02 1.49 0.85 264.14 7.48 1.33±0.33 0.33 63.07 0.90
7 92.97 1.86 0.04 ±0.29 -0.96* 1.82 0.53 373.86 9.09 0.16±0.05 -0.84* 1.65 0.96
8 95.36 3.01 0.79 ±0.48 -0.21 5.03 0.90 359.50 8.26 1.37±0.16 0.37* 14.92 0.54
9 94.19 1.65 0.54 ±0.26 -0.46 1.47 0.74 386.83 4.50 1.43±0.32 0.43* 59.40 0.65
10 93.50 2.38 0.57 ±0.33 -0.43 2.34 0.75 417.72 5.12 0.49±0.08 -0.51* 3.90 0.79
11 82.28 1.76 0.48 ±0.27 -0.52* 1.64 0.56 382.67 2.36 1.11±0.23 0.11 29.65 0.92
12 95.17 2.00 1.20 ±0.32 0.20 2.20 0.92 328.50 7.42 1.45±0.23 0.45* 29.87 0.65
13 89.67 1.25 0.95 ±0.19 -0.05 0.77 0.93 411.22 5.21 1.09±0.14 0.09 11.38 0.74
14 95.53 2.75 1.53 ±0.44 0.53* 4.21 0.53 419.14 5.29 0.72±0.13 -0.28 9.38 0.87
15 94.78 2.11 1.37 ±0.33 0.37 2.45 0.71 395.28 4.31 0.81±0.20 -0.19 22.82 0.80
16 88.11 3.54 1.83 ±0.52 0.83* 5.93 0.50 429.42 9.16 0.71±0.11 -0.29 7.00 0.85
17 92.17 1.04 0.76 ±0.16 -0.24 0.56 0.88 324.75 6.27 0.28±0.15 -0.72* 12.42 0.70
18 90.39 1.69 2.01 ±0.25 1.01* 1.42 0.61 330.14 4.21 0.59±0.11 -0.49* 7.69 0.55
19 95.22 2.87 1.45 ±0.46 0.45 4.56 0.90 365.94 2.26 0.83±0.16 -0.17 14.30 0.92
20 87.94 3.03 1.06 ±0.44 0.06 4.33 0.70 350.47 7.13 0.52±0.07 -0.48* 3.27 0.80
21 97.72 2.25 1.15 ±0.37 0.15 2.94 0.85 359.42 1.35 1.25±0.21 0.25 24.04 0.93
22 88.11 1.97 0.86 ±0.29 -0.14 1.84 0.84 314.67 6.14 0.36±0.07 -0.64* 2.80 0.89
Grand mean 91.79
362.88
LSD0.05 2.79 4.59
N.E. M. MOHAMED AND A. A. SAID
150
150
TABLE 5 .Con.
No. of
Geno-
type
Number of kernels/spike Spike kernels weight (gm)
3x C.V.
%
bi±S.E. βi S2di r
2 %
4x C.V.% bi±S.E. βi S
2di r
2
1 42.37 1.89 0.60±0.12 -0.40* 0.26 0.84 1.32 6.19 0.48± 0.11 -0.52* 0.001 0.85 2 34.66 1.77 0.99 ±0.16 -0.01 0.47 0.92 1.74 4.31 0.76 ±0.10 -0.24 0.004 0.83 3 49.12 3.03 0.85 ±0.25 -0.15 1.16 0 .85 1.60 10.36 0.44 ±0.22 -0.56* 0.057** 0.75 4 53.56 1.25 0.55 ±0.07 -0.45* 0.10 0.81 1.40 15.59 0.23 ±0.29 -0.77* 0.084** 0.74 5 39.17 3.89 1.64 ±0.25 0.64* 1.22 0.84 1.60 16.83 0.90 ±0.36 -0.10 0.121** 0.91 6 47.45 2.93 0.64 ±0.23 -0.36* 1.02 0.95 1.68 8.93 0.95 ±0.20 -0.05 0.004 0.92 7 39.78 1.92 0.75 ±0.13 -0.25 0.30 0.92 1.55 5.81 0.78 ±0.12 -0.22 0.002 0.85
8 35.87 5.25 0.94 ±0.31 -0.06 1.86 0.87 1.66 5.96 0.87 ±0.13 -0.13 0.002 0.90 9 43.22 3.50 1.70 ±0.25 0.70* 1.20 0.75 1.65 6.55 1.45 ±0.14 0.45* 0.024** 0.96 10 30.56 1.97 1.06±0.14 0.06 0.36 0.83 1.60 6.61 1.11 ±0.14 0.11 0.022** 0.76 11 32.62 1.55 1.00 ±0.08 0.00 0.13 0.91 1.48 10.34 0.89 ±0.20 -0.11 0.004 0.83 12 53.87 5.08 0.38 ±0.23 -0.62* 1.03 0.75 1.19 8.70 0.39 ±0.14 -0.61* 0.027** 0.66 13 35.42 3.17 1.00 ±0.24 0.00 1.10 0.78 2.06 7.46 1.73 ±0.21 0.73* 0.049** 0.79 14 46.87 5.51 0.96 ±0.50 -0.04 4.63 0.65 2.08 12.26 1.30 ±0.34 0.30 0.006 0.70 15 27.53 2.47 1.43 ±0.19 0.43* 0.70 0.94 1.83 5.82 1.49 ±0.14 0.49* 0.002 0.82
16 38.55 4.01 1.63 ±0.38 0.63* 2.69 0.68 1.80 5.33 1.36 ±0.13 0.36* 0.028** 0.94 17 41.69 3.51 1.28 ±0.24 0.28 1.12 0.93 1.38 7.61 1.32 ±0.14 0.32* 0.027** 0.85 18 47.23 2.41 1.16 ±0.19 0.16 0.68 0.72 1.67 9.03 1.24 ±0.20 0.24 0.004 0.94 19 42.05 3.55 0.80 ±0.18 -0.20 0.62 0.86 1.23 10.49 1.12 ±0.17 0.12 0.033** 0.76 20 56.57 1.96 0.68 ±0.13 -0.32* 0.30 0.69 1.34 3.64 0.95 ±0.07 -0.05 0.001 0.93 21 45.84 2.68 0.93 ±0.16 -0.07 0.47 0.85 1.28 3.87 1.25 ±0.07 0.25 0.001 0.89 22 42.12 2.08 1.03 ±0.15 0.03 0.41 0.97 1.81 8.37 0.98 ±0.20 -0.02 0.004 0.86
Grand
mean 42.10
1.59
LSD0.05 1.06 0.03
STABILITY PARAMETERS FOR COMPARING BREAD …
151
151
TABLE 5 .Con.
No. of
Geno-
type
1000-kernel weight (gm) Grain yield/ m2
5x C.V.
%
bi±S.E. βi S2di r
2 %
6x C.V.
%
bi±S.E. βi S2di r
2 %
1 34.14 2.28 0.86±0.13 -0.14 0.86 0.84 372.92 24.25 1.27 ±0.19 0.27 69.51 0.87 2 41.08 1.93 0.77±0.11 -0.23 0.60 0.79 579.78 5.17 0.65 ±0.05 -0.35* 18.61 0.83 3 29.83 3.32 0.77±0.17 -0.23 1.39 0.92 434.81 10.76 1.04±0.80 0.04 28.96 0.85 4 35.53 2.80 0.68±0.17 -0.32* 1.40 0.88 367.67 17.95 0.55 ±0.11 -0.45* 40.66 0.91 5 34.53 2.90 0.93±0.17 -0.07 1.43 0.92 466.69 22.00 2.18±0.21 1.18* 77.69 0.86 6 37.81 9.65 0.22±0.14 -0.78* 14.9 0.75 453.83 8.46 0.26±0.06 -0.74* 23.68 0.93
7 33.58 1.52 0.91±0.10 -0.09 0.55 0.70 438.28 9.04 0.44±0.06 -0.56* 24.44 0.88 8 40.22 3.53 0.95±0.21 -0.05 2.28 0.91 523.56 20.39 0.96±0.24 -0.04 88.34 0.90 9 36.53 3.68 1.40±0.22 0.40* 2.55 0.84 396.17 18.17 1.44 ±0.12 0.44* 44.34 0.88 10 44.95 9.85 1.81±0.34 0.81* 11.1 0.73 494.69 9.34 0.75±0.08 -0.25 28.37 0.81 11 40.45 2.60 0.93±0.18 -0.07 1.56 0.95 525.11 17.48 1.18±0.15 0.18 56.41 0.92 12 32.21 3.73 1.22±0.27 0.22 3.84 0.96 362.31 21.80 0.79±0.19 -0.21 70.94 0.93 13 45.62 3.20 1.29±0.24 0.29 3.02 0.82 521.06 23.38 0.87±0.20 -0.13 75.20 0.94 14 42.51 1.70 1.09±0.11 0.09 0.58 0.87 502.39 9.55 1.05±0.08 0.05 29.56 0.82
15 36.04 1.85 1.03±0.12 0.03 0.79 0.90 444.67 14.98 0.90±0.11 -0.10 40.91 0.80 16 44.06 3.11 1.14±0.17 0.14 1.43 0.97 528.00 12.84 1.46±0.11 0.46* 41.96 0.95 17 34.86 1.60 0.95±0.09 -0.05 0.44 0.90 459.61 11.88 1.05±0.09 0.05 33.70 0.83 18 35.08 2.67 0.92±0.16 -0.08 1.24 0.82 477.97 15.06 0.95±0.12 -0.05 44.34 0.97 19 35.93 3.91 1.12±0.23 0.12 2.79 0.75 425.53 14.24 1.17±0.10 0.17 37.25 0.93 20 35.22 2.39 0.77±0.14 -0.23 0.99 0.91 422.78 8.37 0.75±0.06 -0.25 21.80 0.84 21 36.02 3.08 1.08±0.19 0.08 1.75 0.79 399.44 15.92 1.21±0.11 0.21 39.06 0.89 22 44.45 2.36 1.16±0.18 0.16 1.57 0.78 567.75 7.40 1.04±0.07 0.04 26.03 0.94
Grand mean 37.76
462.05
LSD0.05 3.41 16.51
N.E. M. MOHAMED AND A. A. SAID
152
152
TABLE 5 .Con .
No. of
Geno-
type
Harvest index (gm)
7x C.V.% bi±S.E. βi S
2di r
2 %
1 26.99 11.56 1.21±0.52 0.20 6.02 0.92 2 34.61 5.55 1.68±0.32 0.68* 2.34 0.91 3 31.83 4.52 0.88 ±0.24 -0.12 1.26 0.85 4 23.13 5.71 0.49±0.22 -0.51* 1.08 0.79 5 25.61 6.79 1.19 ±0.29 0.19 1.96 0.90
6 23.61 3.81 0.60±0.15 -0.40* 0.49 0.75 7 32.51 3.69 0.48±0.20 -0.52* 0.86 0.98 8 33.26 2.16 0.73±0.12 -0.27 0.33 0.93 9 24.43 7.86 0.69±0.32 -0.31 2.28 0.90 10 30.34 4.94 1.00±0.25 0.00 1.39 0.84 11 26.04 5.30 0.88±0.23 -0.22 1.18 0.83 12 26.33 2.96 1.25±0.13 0.25 0.37 0.87 13 27.94 3.44 0.76±0.16 -0.24 0.57 0.78 14 37.15 5.98 1.31±0.37 0.31 3.08 0.90
15 30.17 4.77 0.51±0.24 -0.49* 1.28 0.93 16 38.88 4.94 1.42 ±0.32 0.42 2.34 0.70 17 30.32 6.53 1.45±0.33 0.45* 2.48 0.76 18 32.98 4.37 1.30±0.24 0.30 1.32 0.84 19 29.32 4.30 1.18±0.21 0.18 0.96 0.77 20 24.52 5.14 0.64 ±0.21 -0.36 0.98 0.93 21 25.64 3.28 0.80 ±0.14 -0.20 0.47 0.96 22 39.47 3.50 1.24±0.23 0.24 1.23 0.90
Grand mean 29.78
LSD0.05 0.66
Egypt. J. Agron. Vol. 36, No. 2, pp. 123 - 146 (2014)
TABLE 6. Simple correlations among all combinations of each trait’s.
Index 1 Index 2 Plant characters
Days to 50% heading
Number of spikes m
2
Number of kernels/spike
Spike kernels weight (gm)
1000-kernel weight (gm)
Grain yield m
2
Harvest index (gm)
x c.v.% -0.168 NS -0.101 NS 0.063 NS 0.026 NS 0.427* -0.391NS -0.216 NS bi or βi 0.054 NS 0.033 NS 0.448* 0.523** 0.446* 0.026 NS 0.556** S2di -0.039 NS 0.189 NS 0.511** 0.358 NS 0.455* -0.101 NS 0.145 NS r2 -0.032 NS -0.193 NS 0.180 NS -0.152 NS -0.289 NS -0.072 NS -0.054 NS
c.v.% bi or βi 0.288 NS 0.664** -0.318 NS -0.305 NS 0.173 NS 0.407 NS 0.236 NS S2di 0.979** 0.917** 0.789** 0.0.906** 0.981** 0.942** 0.909** r2 -0.169 NS 0.647** -0.193 NS -0.318 NS -0.181 NS -0.304 NS -0.411 NS
bi or βi S2di 0.340 NS 0.579** 0.285 NS -0.089 NS 0.277 NS -0.013 NS 0.479* r2 -0.099 NS -0.305 NS -0.132 NS -0.039 NS -0.332 NS 0.164 NS -0.341 NS
S2di r2 -0.197 NS -0.581** 0.247 NS -0.362 NS -0.185 NS -0.353 NS -0.379 NS *P ≤0.05 **P≤0.01 NS = not significant.
TABLE 7. All possible relations between the averages of the studied traits on the basis of genotype mean over all the used environments in this
study.
The average 1x 2x 3x 4x 5x 6x 7x
1x - -0.140 NS 0.228 NS -0.229 NS -0.226 NS -0.529** -0.043 NS
2x - - -0.611** 0.443* 0.539** 0.419* 0.355NS
3x - - - -0.566** -0.720** -0.719** -0.525**
4x - - - - 0.637** 0.669** 0.538**
5x - - - - - 0.757** 0.456**
6x - - - - - - 0.681**
7x - - - - - - - *P ≤0.05 **P≤0.01 NS = not significant.
Related Documents