UNIVERSITY OF CINCINNATI Date:___________________ I, _________________________________________________________, hereby submit this work as part of the requirements for the degree of: in: It is entitled: This work and its defense approved by: Chair: _______________________________ _______________________________ _______________________________ _______________________________ _______________________________

SrinivaSrinivasn
Dec 21, 2015
Srinivasn Rangesh
Welcome message from author
This document is posted to help you gain knowledge. Please leave a comment to let me know what you think about it! Share it to your friends and learn new things together.
Transcript

UNIVERSITY OF CINCINNATI Date:___________________
I, _________________________________________________________, hereby submit this work as part of the requirements for the degree of:
in:
It is entitled:
This work and its defense approved by:
Chair: _______________________________ _______________________________ _______________________________ _______________________________ _______________________________

1
Study of Trona ( Sodium Sesquicarbonate) Reactivity with Sulfur Dioxide in a Simulated Flue Gas
A thesis submitted to the
Division of Research and Advanced Studies of the University of Cincinnati
in partial fulfillment of the
requirements for the degree of
MASTER OF SCIENCE
In the Department of Civil and Environmental Engineering
of the College of Engineering
2003
by
Rangesh Srinivasan
B.E. Anna University, Madras, India 2000
Committee Chair: Dr. Tim C. Keener

2
Abstract
In the last few years, sulfur dioxide (SO2) has been under heavy scrutiny for reduction
and its emissions are being monitored very closely by both federal and state regulatory agencies.
Most of the conventional flue gas desulfurization techniques are able to meet the standards but
normally come with very high capital and maintenance costs and have other associated problems.
Dry injection of sodium-based sorbents has gained a lot of attention in the last few years. With
Dry injection, it is possible to achieve almost similar and in some cases even higher SO2 removal
efficiencies than with spray dry or wet scrubbing systems.
It is proposed to study the reactivity of Trona (Na2CO3.NaHCO3.2H2O) with SO2 in a
simulated flue gas stream by means of an entrained flow reactor coupled with a fabric filter
simulator. The objective of this study is to provide fundamental kinetic data on the effect of flue
gas variables including temperature, particle size, SO2 concentration and stoichiometric ratio on
removal of SO2. A drop tube reactor with a fabric filter simulator was developed to simulate
sorbent injection and sorbent particle capture. Trona was found to remove SO2 from flue gas at
efficiencies that were comparable to those of sodium bicarbonate under certain conditions. It was
found that the different variables like temperature, SO2 concentration and especially trona
particle size have a very critical effect on removal efficiency.

3

4
ACKNOWLEDGEMENTS
I express my sincere thanks to my advisor Professor Tim Keener for providing me with
this wonderful research opportunity. Without his guidance and encouragement I wouldn’t have
been able to complete my work.
I would also like to thank Dr. Soon Jai Khang and Dr. Mingming Lu for agreeing to serve
on my thesis committee.
I would like to thank Mr. John Mazuik at Solvay Minerals for funding this project and
providing all the trona samples.
Special thanks to all members of the air quality group for all their help in completing my
thesis. Finally, thanks to every one of my friends who made my stay at UC a wonderful and
unforgettable experience.

5

i
TABLE OF CONTENTS
LIST OF TABLES ii
LIST OF FIGURES iii
1. INTRODUCTION 1
1.1 Problem Statement 1
1.2 SO2 background information 2
1.3 Advantages of dry sodium-based sorbent injection 6
1.4 Project Objectives 8
2. LITERATURE REVIEW 9
2.1 Literature Overview 9
3. EXPERIMENTAL SETUP 18
3.1 Entrained Flow Reactor 18
3.2 Sorbent Feeder 21
3.3 Operating Conditions 22
3.4 Experimental Procedure 23
4. RESULTS 26
4.1 Effect of Particle Size on SO2 Removal 26
4.2 Effect of Temperature on SO2 Removal 31
4.3 Effect of Inlet Gas SO2 Concentration on Overall SO2 Removal 36
ii
4.4 Effect of Stoichiometric Ratio on SO2 Removal 40
4.5 Model 42
5. CONCLUSIONS AND FUTURE WORK 49
6. REFERENCES 51
APPENDIX 1 EXPERIMENTAL DATA 53
APPENDIX 2 MODEL CALCULATIONS 63
APPENDIX 3 MODEL CALCULATIONS 66

iii
LIST OF TABLES
Table 1. Flue gas composition 22
Table 2. List of Equipment 23
Table 3. T-200 particle size distribution 27
Table 4. T-200 : Mean mass diameter of particles 28
iv
LIST OF FIGURES
Fig. 1. Schematic of a dry sodium injection system in a coal fired
power plant. 8
Fig. 2. Comparison of nahcolite and trona (200 mesh, A/C : 2.3). 10
Fig. 3. Effect of trona particle size on SO2 removal (A/C : 2.3). 11
Fig. 4. Variation of conversion with time (Temperature : 150 C,
SO2 concentration : 3500 ppm). 12
Fig. 5. Variations of conversion of spray dried soda with time at
lower temperatures. 12
Fig. 6. SO2 removal with trona (O : Pittsburgh seam coal(1.6 % S,
59 µm sorbent) ; ∆ : West Virginia coal(3.1 % S, 32 µm sorbent)). 13
Fig. 7. Results of a pilot plant dry scrubbing demonstration study
using NaHCO3. 15
Fig. 8. Comparison of SO2 removal using trona and sodium bicarbonate. 16
Fig. 9. Effect of stoichiometric ratio on SO2 removal. 17
Fig. 10. Comparison of sorbent costs. 17
Fig. 11. Drop tube reactor schematic. 19
Fig. 12. Drop Tube Reactor. 19
Fig. 13. Fabric Filter Simulator. 20
Fig. 14. Sorbent Feeder System. 21
Fig. 15. Conversion at different stoichiometric ratios (Temperature = 300 F ;
Inlet SO2 concentration = 500 ppm ; Particle Size = <38µ). 29
Fig. 16. Effect of particle size on conversion at different stoichiometric ratios
(Temperature = 300 F ; Inlet SO2 concentration = 500 ppm). 29

v
Fig. 17. Comparison of conversion at a higher stoichiometric ratio. 30
Fig. 18. Comparison of conversion at a lower stoichiometric ratio. 30
Fig. 19. Conversion at different temperatures (Inlet SO2 concentration :
500 ppm; stoichiometric ratio : 2-4). 32
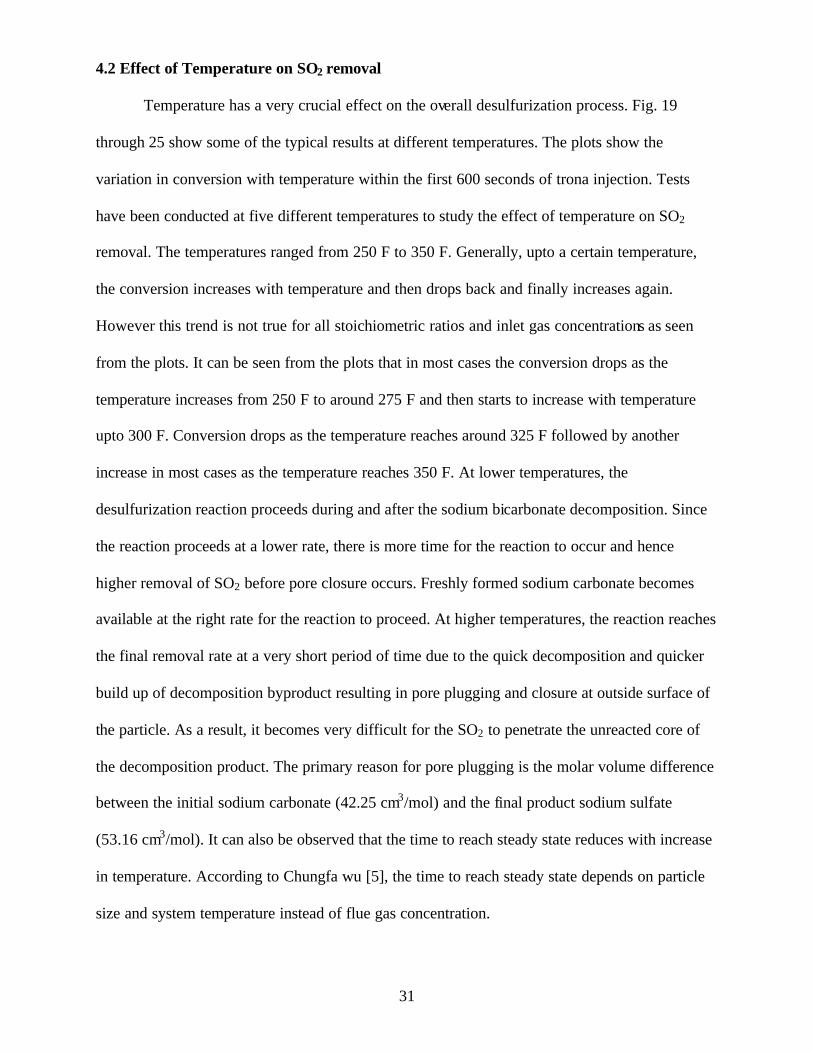
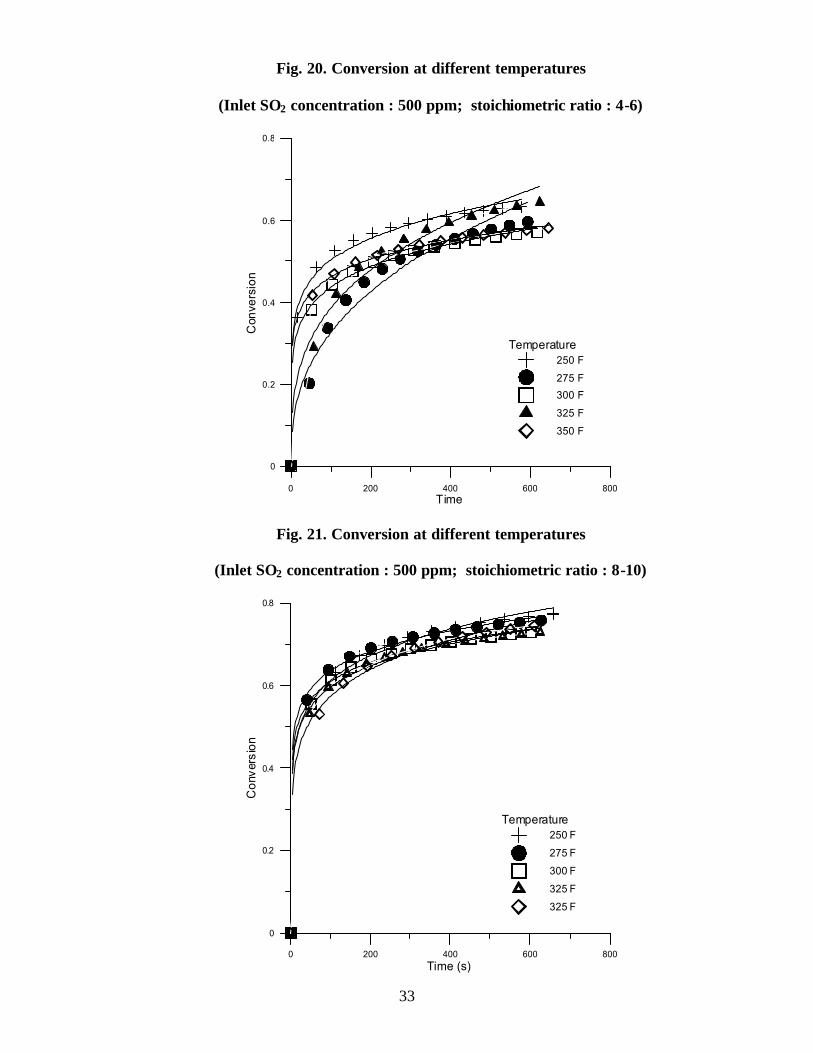
Fig. 20. Conversion at different temperatures (Inlet SO2 concentration :
500 ppm; stoichiometric ratio : 4-6). 33
Fig. 21. Conversion at different temperatures (Inlet SO2 concentration :
500 ppm; stoichiometric ratio : 8-10). 33
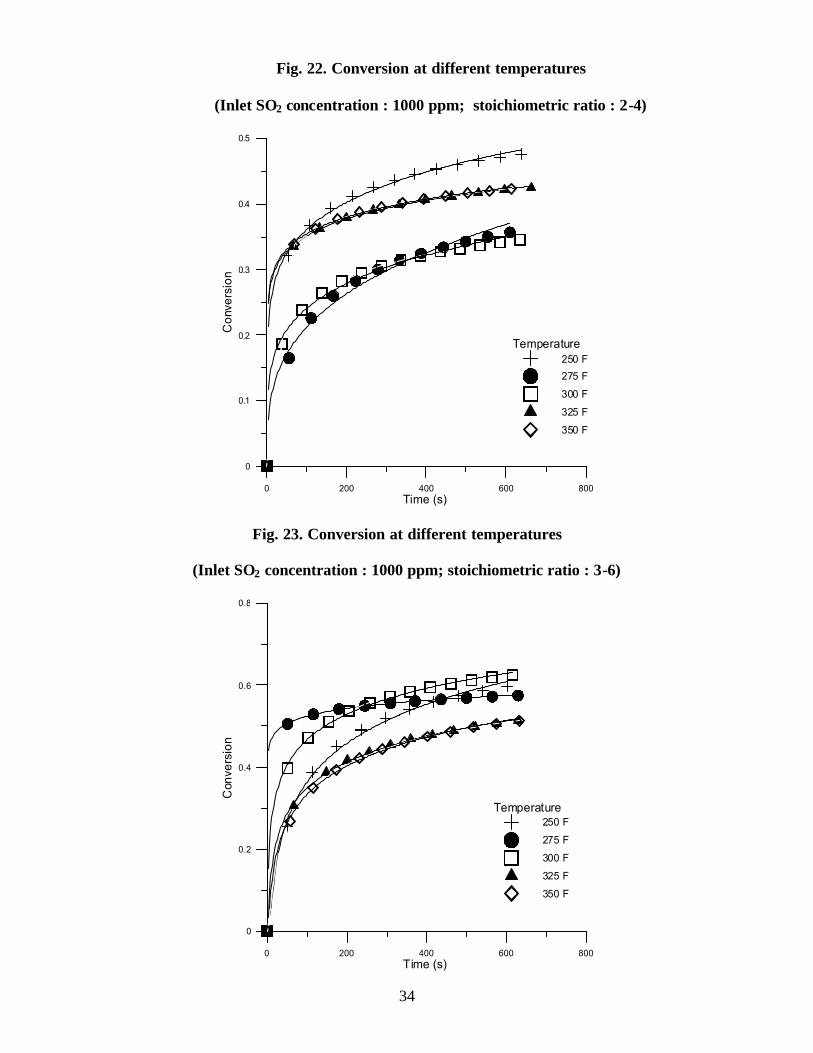
Fig. 22. Conversion at different temperatures (Inlet SO2 concentration :
1000 ppm; stoichiometric ratio : 3-6). 34
Fig. 23. Conversion at different temperatures (Inlet SO2 concentration :
1000 ppm; stoichiometric ratio : 2-4). 34
Fig. 24. Conversion at different temperatures (Inlet SO2 concentration :
1500 ppm; stoichiometric ratio : 2-4). 35
Fig. 25. Conversion at different temperatures (Inlet SO2 concentration :
1500 ppm; stoichiometric ratio = 0-3). 35
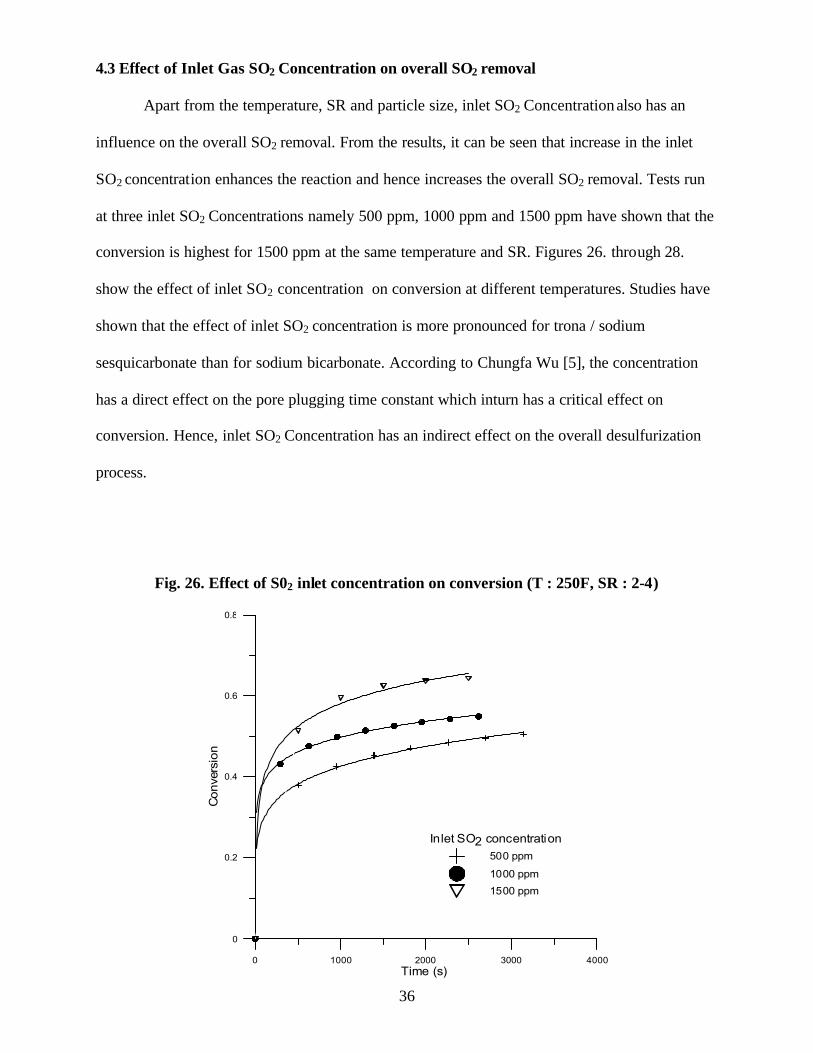
Fig. 26. Effect of S02 inlet concentration on conversion (T : 250F, SR : 2-4). 36
Fig. 27. Effect of S02 inlet concentration on conversion (T : 325F, SR : 2-4). 37
Fig. 28. Effect of S02 inlet concentration on conversion (T : 350F, SR : 2-4). 37
Fig. 29. Comparison of utilization at two different inlet SO2 concentrations
(SR : 2-4). 38
Fig. 30. Utilization versus Temperature (Inlet SO2 concentration : 500 ppm). 39
Fig. 31. Utilization versus Temperature (Inlet SO2 concentration : 1000 ppm). 39
Fig. 32. Utilization versus Temperature (Inlet SO2 concentration : 1500 ppm). 40
vi
Fig. 33. Effect of stoichiometry on conversion (Temperature : 275 F;
Inlet SO2 concentration : 500 ppm). 41
Fig. 34. Effect of stoichiometry on conversion (Temperature : 300 F;
Inlet SO2 concentration : 500 ppm) 41
Fig. 35. Effect of stoichiometry on conversion (Temperature : 250 F;
Inlet SO2 concentration : 1500 ppm). 42
Fig. 36. Shrinking core of NaHCO3 and varying exposure times of Na2CO3. 43
Fig. 37. Pore plugging model fit (Inlet SO2 concentration : 500 ppm). 46
Fig. 38. Pore plugging model fit with actual data (Inlet SO2 concentration :
500 ppm). 46
Fig. 39. X∞ versus temperature at different stoichiometric ratios (Inlet SO2
concentration = 500 ppm). 47
Fig. 40. X∞ versus temperature at different stoichiometric ratios (Inlet SO2
concentration = 1500 ppm). 48
1
1. INTRODUCTION
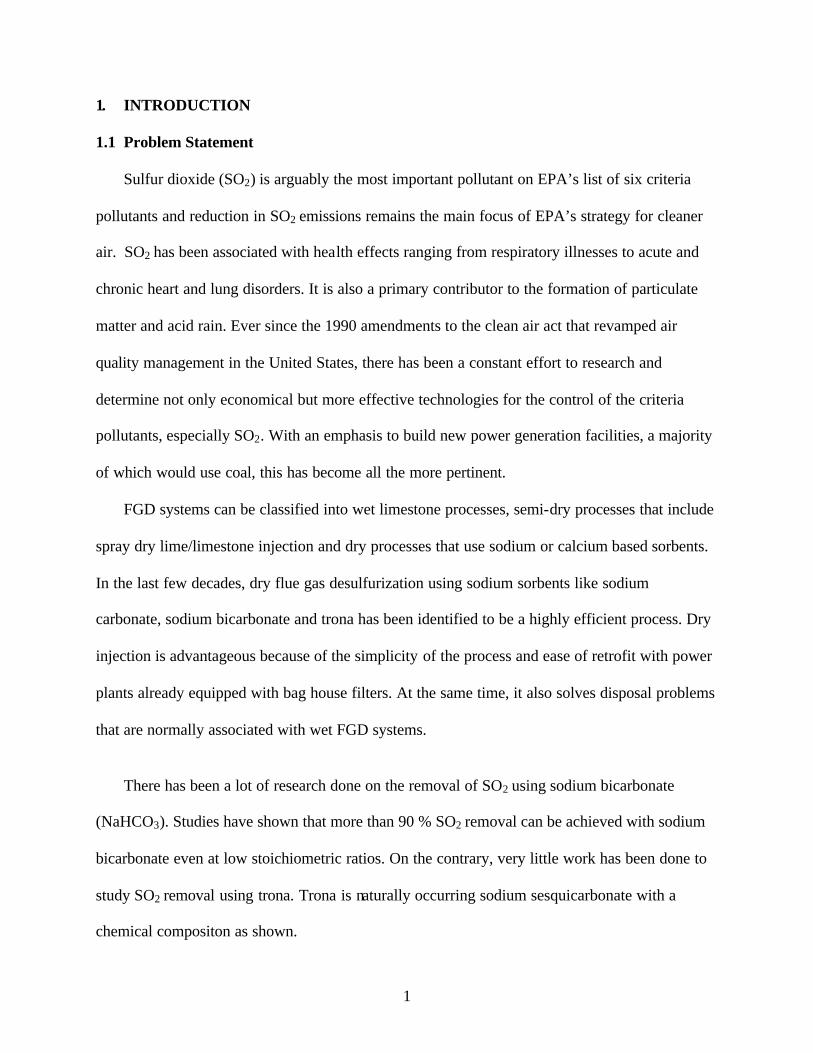
1.1 Problem Statement
Sulfur dioxide (SO2) is arguably the most important pollutant on EPA’s list of six criteria
pollutants and reduction in SO2 emissions remains the main focus of EPA’s strategy for cleaner
air. SO2 has been associated with health effects ranging from respiratory illnesses to acute and
chronic heart and lung disorders. It is also a primary contributor to the formation of particulate
matter and acid rain. Ever since the 1990 amendments to the clean air act that revamped air
quality management in the United States, there has been a constant effort to research and
determine not only economical but more effective technologies for the control of the criteria
pollutants, especially SO2. With an emphasis to build new power generation facilities, a majority
of which would use coal, this has become all the more pertinent.
FGD systems can be classified into wet limestone processes, semi-dry processes that include
spray dry lime/limestone injection and dry processes that use sodium or calcium based sorbents.
In the last few decades, dry flue gas desulfurization using sodium sorbents like sodium
carbonate, sodium bicarbonate and trona has been identified to be a highly efficient process. Dry
injection is advantageous because of the simplicity of the process and ease of retrofit with power
plants already equipped with bag house filters. At the same time, it also solves disposal problems
that are normally associated with wet FGD systems.
There has been a lot of research done on the removal of SO2 using sodium bicarbonate
(NaHCO3). Studies have shown that more than 90 % SO2 removal can be achieved with sodium
bicarbonate even at low stoichiometric ratios. On the contrary, very little work has been done to
study SO2 removal using trona. Trona is naturally occurring sodium sesquicarbonate with a
chemical compositon as shown.

2
Chemical Formula: (Na2CO3·NaHCO3·2H2O)
Composition: Molecular Weight = 226.03 gm
Sodium (Na) : 30.51 %
Hydrogen (H) : 2.23 %
Carbon (C) : 10.63 %
Oxygen (O) : 56.63%
The largest pure deposit of trona in the United States lies underground near Green River,
Wyoming. T-200, which is a natural form of sodium sesquicarbonate, costs less than sodium
bicarbonate and has been found to have removal rates of upto 90% for SO2 [1]. It is currently
being used in a variety of industries including utilities, municipal waste, chemical and cement
plants. Selective research done on trona- SO2 reaction has shown that SO2 removal efficiencies
at slightly higher stoichiometric ratios for sodium bicarbonate and trona are very similar.
This is a potentially innovative and cost-effective method for desulfurization of flue gas.
The problem is the lack of consistent data on the kinetics of the trona- SO2 reaction. Without this
kind of data it would be very difficult to arrive at a model for this reaction and to compare it with
the sodium bicarbonate SO2 reaction.
1.2 SO2 Background information
Sulfur dioxide or SO2, belongs to the family of sulfur oxide gases (SOx). All raw
materials, including crude oil, coal, and ore that contain common metals like aluminum, copper,
zinc, lead, and iron have sulfur in them. SO2 is formed as a result of combustion of fuel
containing sulfur, such as coal and oil, during distillation of crude oil, or metal during
3
extraction. SO2 dissolves in water vapor to form acid, and interacts with other gases and
particles in the air to form particulate matter that can result in serious health and environmental
problems [2].
Electric utilities, especially the ones using coal for combustion, are the primary sources
of SO2 releasing as much as 13 million tons every year, which is about 65 % of the total SO2
released into the air. Other sources of SO2 include industrial facilities that derive their products
from raw materials like metallic ore, coal, and crude oil, or that burn coal or oil to produce
process heat [3]. Petroleum refineries, cement manufacturing, and metal processing facilities,
locomotives, large ships, and other diesel equipment are known to burn high sulfur fuel and
release SO2 emissions to the air in large quantities.
SO2 has been associated with a wide variety of health and environmental effects because
of the manner in which it reacts with other gases and particles in the atmosphere. Effects range
from temporary breathing difficulties to severe heart and lung problems. SO2 contributes to the
formation of particulate matter, which in turn result in increased respiratory symptoms and also
reduce visibility. It also causes damage to crops and forests and aesthetic damage by formation
of acid rain.
The methodologies for SO2 control can be classified into pre-combustion and post-
combustion control. Pre-combustion techniques would deal with either fuel switching or coal
pre-cleaning. Fuel switching is switching to a fuel with low sulfur content, from coal or oil to
natural gas or renewables like wind or solar. For power plants, this would correspond to using
low sulfur coal for the boilers. However the economics of availability and transportation of low
sulfur coal have to be considered. More recently, utilities have started focusing on coal cleaning
to remove sulfur to reduce acid-rain-related emissions. Coal-cleaning methods may be classified
into conventional physical cleaning and various advanced cleaning methods, including advanced
physical cleaning, aqueous phase pretreatment, selective agglomeration, and organic phase
4
pretreatment [4]. The total sulfur removal ranges 10 to 40 percent depending upon the method
used. However in order to make coal cleaning cost effective, the cost and energy requirements
involved have to properly balanced.
The post-combustion control would mainly deal with Flue Gas Desulfurization
technologies (FGD) [4]. FGD systems can be mainly classified into six broad categories.
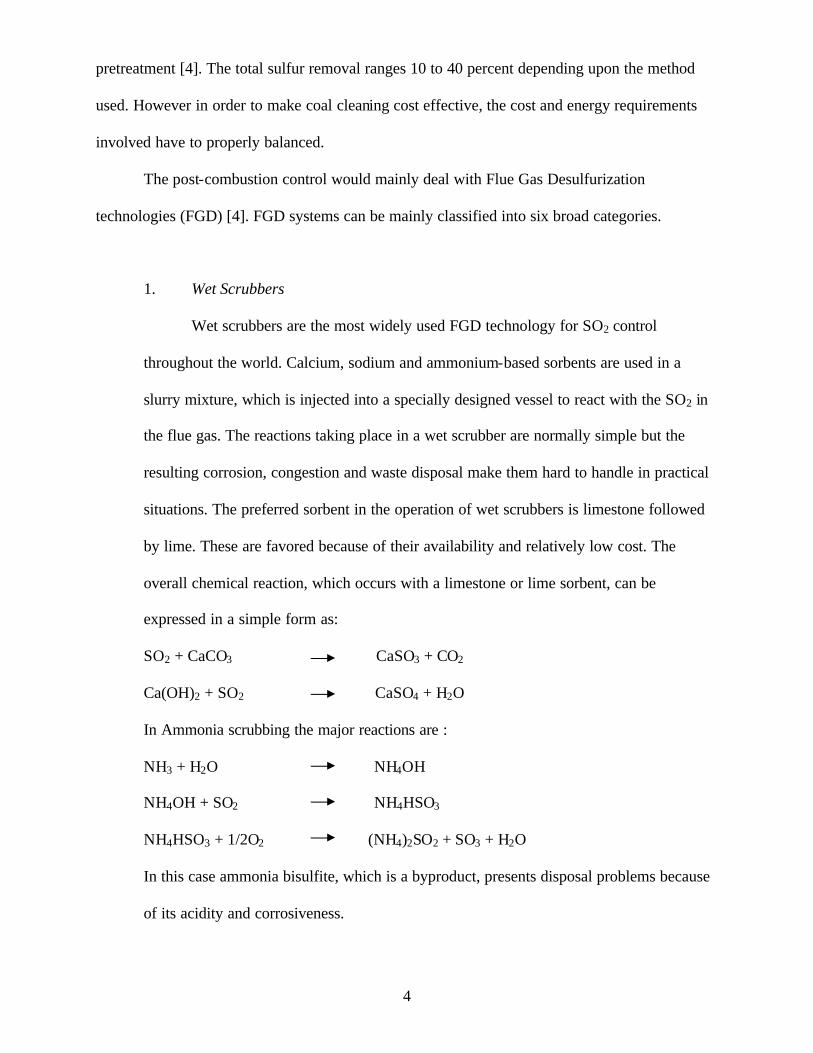
1. Wet Scrubbers
Wet scrubbers are the most widely used FGD technology for SO2 control
throughout the world. Calcium, sodium and ammonium-based sorbents are used in a
slurry mixture, which is injected into a specially designed vessel to react with the SO2 in
the flue gas. The reactions taking place in a wet scrubber are normally simple but the
resulting corrosion, congestion and waste disposal make them hard to handle in practical
situations. The preferred sorbent in the operation of wet scrubbers is limestone followed
by lime. These are favored because of their availability and relatively low cost. The
overall chemical reaction, which occurs with a limestone or lime sorbent, can be
expressed in a simple form as:
SO2 + CaCO3 CaSO3 + CO2
Ca(OH)2 + SO2 CaSO4 + H2O
In Ammonia scrubbing the major reactions are :
NH3 + H2O NH4OH
NH4OH + SO2 NH4HSO3
NH4HSO3 + 1/2O2 (NH4)2SO2 + SO3 + H2O
In this case ammonia bisulfite, which is a byproduct, presents disposal problems because
of its acidity and corrosiveness.

5
2. Spray dry scrubbers
Spray dry scrubbers are the second most widely used FGD technology. However,
their application is limited to small or medium sized coal- fired power plants. Spray dry
scrubbers in commercial use have achieved removal efficiency in excess of 90% with
some suppliers showing more than 95% SO2 removal efficiency as achievable.
Spray dry scrubbers require the use of an efficient particulate control device such
as an ESP or fabric filter. The sorbent usually used is lime or calcium oxide and is
atomized/sprayed into a reactor vessel in a cloud of fine droplets. The SO2 reacts with the
hydrated lime to form a dry mixture of calcium sulfate / sulfite. Wastewater treatment is
not required in spray dry scrubbers because the water is completely evaporated in the
spray dry absorber.
3. Sorbent Injection
Dry sorbent injection involves direct injection of the sorbent into the upper part of
the furnace or the flue gas stream to react with the SO2 forming sulfates of calcium or
sodium which are later captured in a fabric filter. Sodium based compounds or
commercially available limestone (CaCO3) or hydrated lime (Ca(OH)2) are used as
sorbents. It is important to have an even distribution of the sorbent in the flue gas for
higher removal efficiencies. Also, fine sorbent particle size (<5 µm) has been found to
significantly improve the process performance. Typical reactions taking place in a
sodium bicarbonate based dry sorbent injection system are:
2 NaHCO3 Na2CO3 + CO2 + H2O
2 NaHCO3 + SO2 Na2SO3 + 2CO2 + H2O
Na2CO3 + SO2 Na2SO3 + CO2
Na2SO3 + ½ O2 Na2SO4

6
4. Dry Scrubber
In this technology, a dry sorbent, mostly hydrated lime is injected into a circulated
fluid bed or a moving bed to react with the SO2 in the flue gas. The process achieves SO2
removal efficiency of 93-97% at a Ca/S molar ratio of 1.2-1.5.
5. Regenerable processes
In regenerable processes, the sorbent is regenerated chemically or thermally and
re-used. Regenerable processes generally require no waste disposal, produce little waste
water and have low sorbent make-up requirements. Although these processes can achieve
high SO2 removal efficiencies (>95%), they have in general high capital costs and power
consumption.
6. Combined SO2/NOx removal
Combined SO2/NOx removal processes are considered fairly complex and costly.
However, emerging technologies have the potential to reduce SO2 and NOx emissions for
less than the combined cost of conventional FGD for SO2 control and selective catalytic
reduction (SCR) for NOx control. Most processes are in the development stage, although
some processes are commercially used on low to medium-sulphur coal- fired plants.
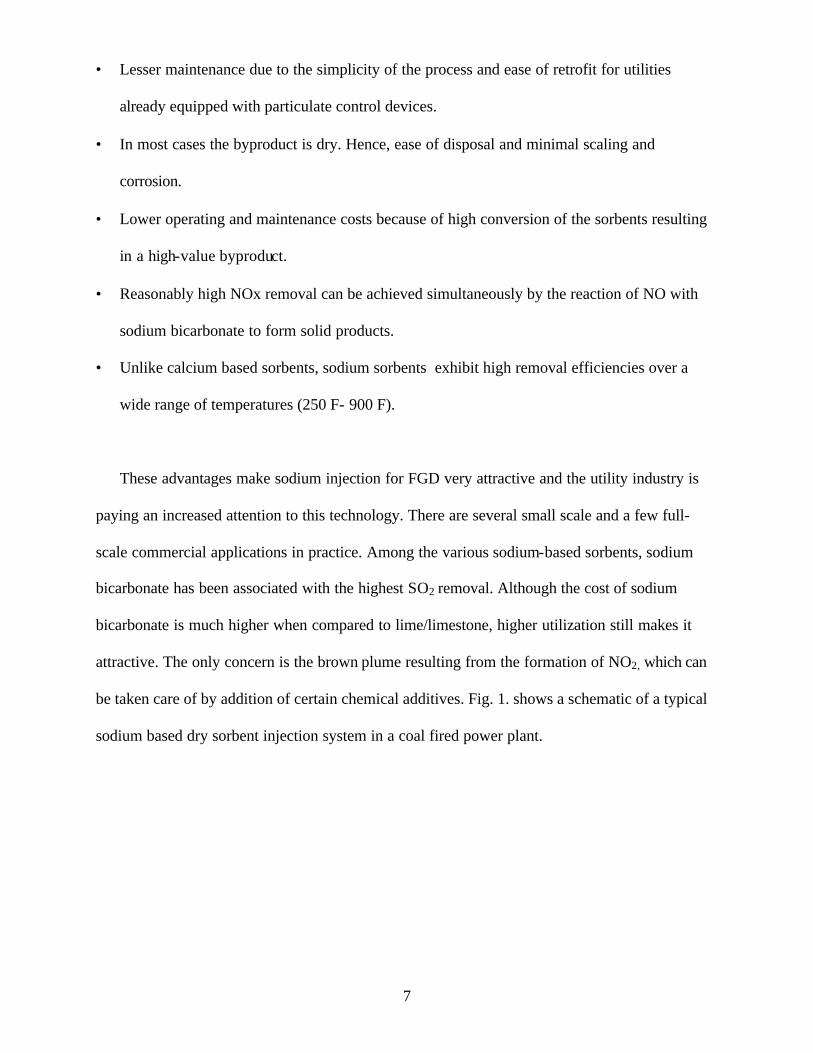
1.3 Advantages of dry sodium-based sorbent injection
Some of the advantages associated with the use of dry sodium-based sorbents for flue gas
desulfurization are [5]:
• Significantly lower capital costs because of the removal of SO2 and particulate matter in a
single device.
7
• Lesser maintenance due to the simplicity of the process and ease of retrofit for utilities
already equipped with particulate control devices.
• In most cases the byproduct is dry. Hence, ease of disposal and minimal scaling and
corrosion.
• Lower operating and maintenance costs because of high conversion of the sorbents resulting
in a high-value byproduct.
• Reasonably high NOx removal can be achieved simultaneously by the reaction of NO with
sodium bicarbonate to form solid products.
• Unlike calcium based sorbents, sodium sorbents exhibit high removal efficiencies over a
wide range of temperatures (250 F- 900 F).
These advantages make sodium injection for FGD very attractive and the utility industry is
paying an increased attention to this technology. There are several small scale and a few full-
scale commercial applications in practice. Among the various sodium-based sorbents, sodium
bicarbonate has been associated with the highest SO2 removal. Although the cost of sodium
bicarbonate is much higher when compared to lime/limestone, higher utilization still makes it
attractive. The only concern is the brown plume resulting from the formation of NO2, which can
be taken care of by addition of certain chemical additives. Fig. 1. shows a schematic of a typical
sodium based dry sorbent injection system in a coal fired power plant.

8
Fig. 1. Schematic of a dry sodium injection system in a coal fired power plant [5].
1.4 Project Objectives
The objective of this project was to identify and study the process parameters that
influence the SO2 removal ability of trona. An entrained flow reactor coupled with a fabric filter
simulator was used to study the effect of various variables like temperature, flue gas
concentrations and stoichiometric ratio on this reaction. Additional consideration was given for
future studies on the effect of moisture content, filter air-cloth ratio and trona particle size.
Kinetic data based on these variables could be used to model the reactions taking place between
trona and SO2 in a dry sorbent injection system.
9
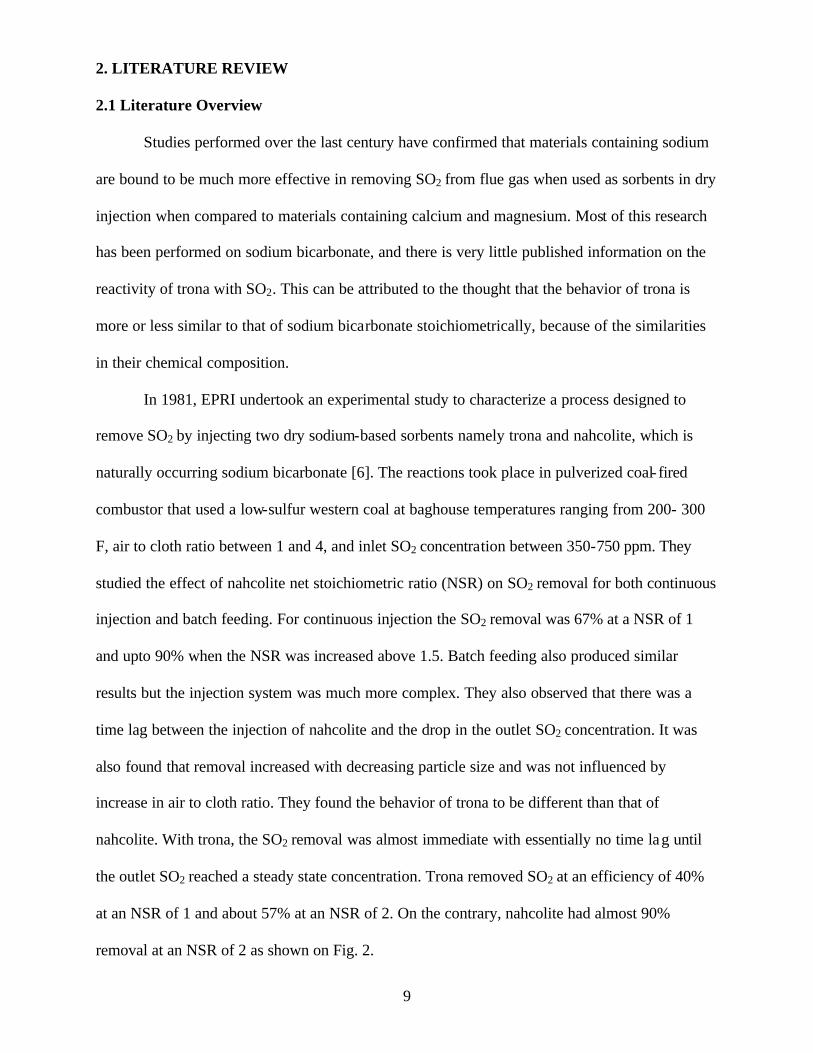
2. LITERATURE REVIEW
2.1 Literature Overview
Studies performed over the last century have confirmed that materials containing sodium
are bound to be much more effective in removing SO2 from flue gas when used as sorbents in dry
injection when compared to materials containing calcium and magnesium. Most of this research
has been performed on sodium bicarbonate, and there is very little published information on the
reactivity of trona with SO2. This can be attributed to the thought that the behavior of trona is
more or less similar to that of sodium bicarbonate stoichiometrically, because of the similarities
in their chemical composition.
In 1981, EPRI undertook an experimental study to characterize a process designed to
remove SO2 by injecting two dry sodium-based sorbents namely trona and nahcolite, which is
naturally occurring sodium bicarbonate [6]. The reactions took place in pulverized coal- fired
combustor that used a low-sulfur western coal at baghouse temperatures ranging from 200- 300
F, air to cloth ratio between 1 and 4, and inlet SO2 concentration between 350-750 ppm. They
studied the effect of nahcolite net stoichiometric ratio (NSR) on SO2 removal for both continuous
injection and batch feeding. For continuous injection the SO2 removal was 67% at a NSR of 1
and upto 90% when the NSR was increased above 1.5. Batch feeding also produced similar
results but the injection system was much more complex. They also observed that there was a
time lag between the injection of nahcolite and the drop in the outlet SO2 concentration. It was
also found that removal increased with decreasing particle size and was not influenced by
increase in air to cloth ratio. They found the behavior of trona to be different than that of
nahcolite. With trona, the SO2 removal was almost immediate with essentially no time lag until
the outlet SO2 reached a steady state concentration. Trona removed SO2 at an efficiency of 40%
at an NSR of 1 and about 57% at an NSR of 2. On the contrary, nahcolite had almost 90%
removal at an NSR of 2 as shown on Fig. 2.

10
Fig. 2. Comparison of nahcolite and trona (200 mesh, A/C : 2.3) [6].
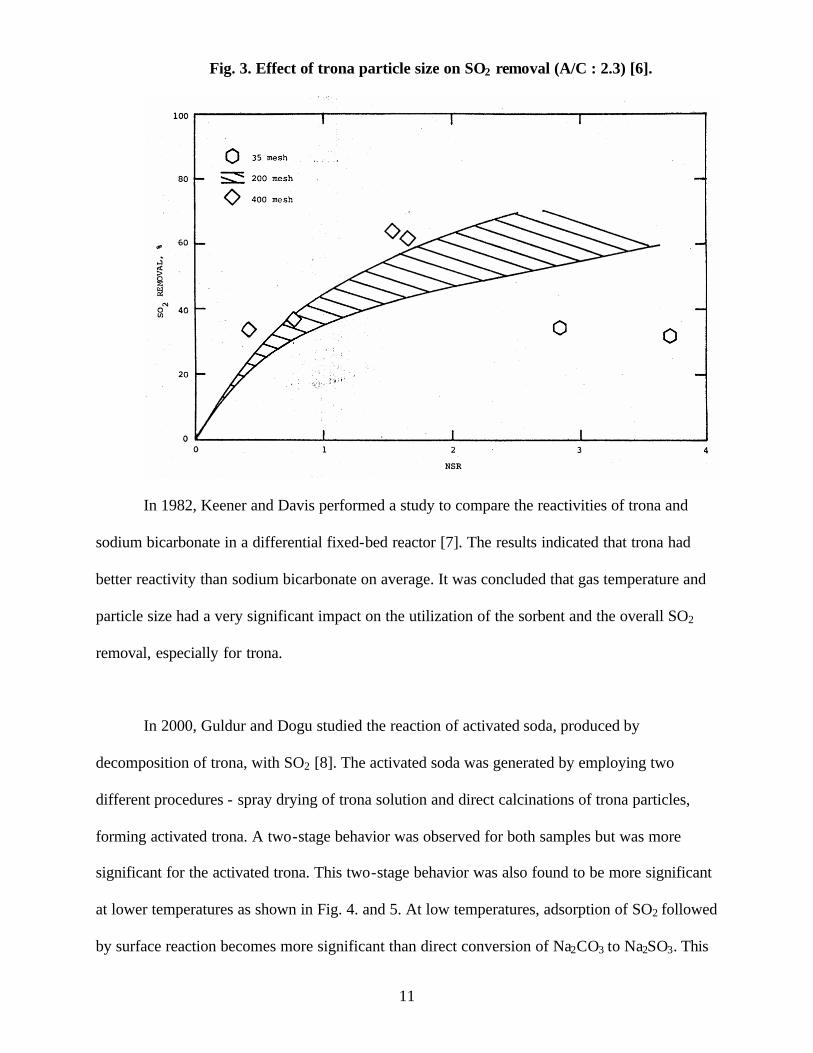
Unlike nahcolite, the baghouse temperature did have an influence on SO2 removal with
trona. As with nahcolite, the variation in air to cloth ratio did not have any significant influence
on the reaction. It was also found that particle size had a very significant effect on SO2 removal
using trona. Fig. 3. compares SO2 removal efficiencies for three different trona particle sizes.
11
Fig. 3. Effect of trona particle size on SO2 removal (A/C : 2.3) [6].
In 1982, Keener and Davis performed a study to compare the reactivities of trona and
sodium bicarbonate in a differential fixed-bed reactor [7]. The results indicated that trona had
better reactivity than sodium bicarbonate on average. It was concluded that gas temperature and
particle size had a very significant impact on the utilization of the sorbent and the overall SO2
removal, especially for trona.
In 2000, Guldur and Dogu studied the reaction of activated soda, produced by
decomposition of trona, with SO2 [8]. The activated soda was generated by employing two
different procedures - spray drying of trona solution and direct calcinations of trona particles,
forming activated trona. A two-stage behavior was observed for both samples but was more
significant for the activated trona. This two-stage behavior was also found to be more significant
at lower temperatures as shown in Fig. 4. and 5. At low temperatures, adsorption of SO2 followed
by surface reaction becomes more significant than direct conversion of Na2CO3 to Na2SO3. This

12
along with textural variations of the solid are the two main reasons for the two-stage behavior.
The authors developed a deactivation model that gave satisfactory results in the prediction of
experimental results for this reaction.
Fig. 4. Variation of conversion with time
(Temperature : 150 C, SO2 concentration : 3500 ppm) [8].
Fig. 5. Variations of conversion of spray dried soda
with time at lower temperatures [8].
In 1985-86, the department of utilities at the City of Colorado Springs, FMC corporation
and EPRI conducted a full-scale demonstration of the injection of dry sodium sorbents, namely
sodium sesquicarbonate and sodium bicarbonate [9]. Sodium sorbents were injected upstream of
one of the fabric filters, side-by-side with an identical fabric filter operating without sorbent
injection. The objective of the study was to run the plant boiler continuously for 55 days with
sodium injection and to determine the SO2 removal and sodium utilization. The results showed
13
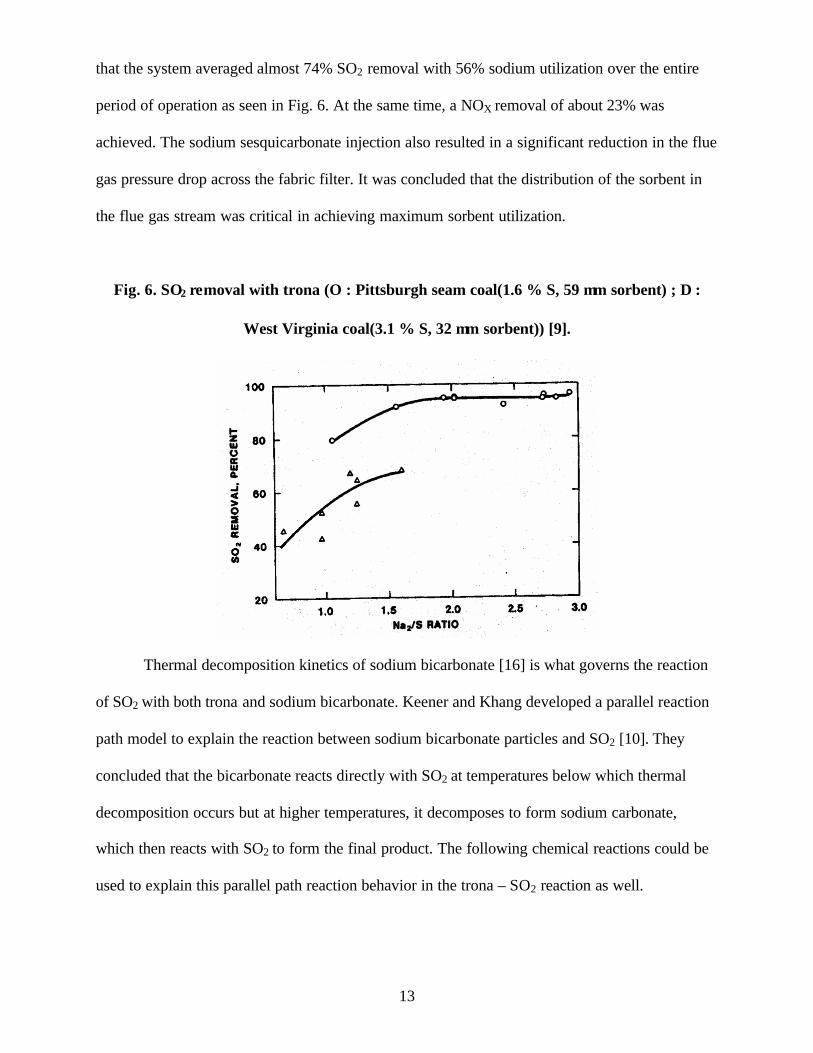
that the system averaged almost 74% SO2 removal with 56% sodium utilization over the entire
period of operation as seen in Fig. 6. At the same time, a NOX removal of about 23% was
achieved. The sodium sesquicarbonate injection also resulted in a significant reduction in the flue
gas pressure drop across the fabric filter. It was concluded that the distribution of the sorbent in
the flue gas stream was critical in achieving maximum sorbent utilization.
Fig. 6. SO2 removal with trona (O : Pittsburgh seam coal(1.6 % S, 59 µm sorbent) ; ∆ :
West Virginia coal(3.1 % S, 32 µm sorbent)) [9].
Thermal decomposition kinetics of sodium bicarbonate [16] is what governs the reaction
of SO2 with both trona and sodium bicarbonate. Keener and Khang developed a parallel reaction
path model to explain the reaction between sodium bicarbonate particles and SO2 [10]. They
concluded that the bicarbonate reacts directly with SO2 at temperatures below which thermal
decomposition occurs but at higher temperatures, it decomposes to form sodium carbonate,
which then reacts with SO2 to form the final product. The following chemical reactions could be
used to explain this parallel path reaction behavior in the trona – SO2 reaction as well.

14
Na2SO3 + CO2 +H2O --- path1
NaHCO3 Na2CO3 + CO2 + H2O
{Na2CO3·NaHCO3·2H2O} Na2SO3 + CO2+H2O --- path 2
(trona) Na2CO3 CO2 + H2O
Na2SO3 + CO2 + H2O --- path 3
The sodium carbonate micro-grains formed in this manner have very high specific
surface area and result in high level of conversion. Hence the overall reaction can be described as
a multipath reaction. For the development of the model, it was assumed that as the reaction
progresses, a shrinking boundary of sodium bicarbonate exists, and at this boundary, micro-
grains of the reaction products, namely sodium sulfite and sodium carbonate are produced. The
overall conversion is the summation of the conversions resulting from paths 1 and 2 and the
reaction kinetics of these 2 paths are derived separately. The model is developed based on the
assumption that the bicarbonate is almost non-porous, path 1 is a first order reaction and that a
semi-empirical pore plugging model can be used for path 2 which is a zero order reaction. The
model was found to be in agreement with kinetic data published earlier. The authors concluded
that this model could be used to give a reasonably good prediction of the behavior of sodium
bicarbonate particles during their reaction with SO2 in flue gas.
SO2
SO2
SO2
K1
Kd1
Kd2
Kd3
K3
K2

15
Fig. 7. Results of a pilot plant dry scrubbing demonstration
study using NaHCO3 [10].
Wu, Keener and Khang proposed a mathematical model for simulation of dry sodium
bicarbonate injection for SO2 removal across a fabric filter [10]. They found out that SO2 removal
took place in two stages- within the duct section and across the fabric filter and developed a two-
stage model on these lines. In the duct section, its was assumed that the particles were in a
monodisperse mode, axial diffusion was negligible when compared to the convective flow for
the flue gas and the solid particles. With a plug flow for both gas and solid and a mass balance
on the SO2, a mathematical expression was arrived at for the duct section. For the fabric filter
section, a pseudo steady-state assumption is used for the height of the particle buildup on the
filter. By doing a mass balance on the sorbent, the height of the sorbent layer is calculated. A
final mathematical expression is derived by performing a mass balance on the SO2. It was found
that SO2 removal predominantly occurs across the filter (95%) and only a small fraction (5%) is
16
removed in the duct section. The model has also been used to discuss the effects of operating
parameters like temperature, stoichiometric ratio, particle size and SO2 concentrations on
removal efficiency and these results were validated with published test data.
Experiments performed by Solvay Minerals at their Central Study and Research Center
[11] have shown that at temperatures over 250 F, trona is rapidly calcined to sodium carbonate
by means of the following reaction, resulting in a popcorn like crystal structure change that
creates a large and reactive surface for adsorption and neutralization of acidic gases like SO2.
4{Na2CO3·NaHCO3·2H2O} → 6 Na2CO3 + 2 CO2 + 10 H2O
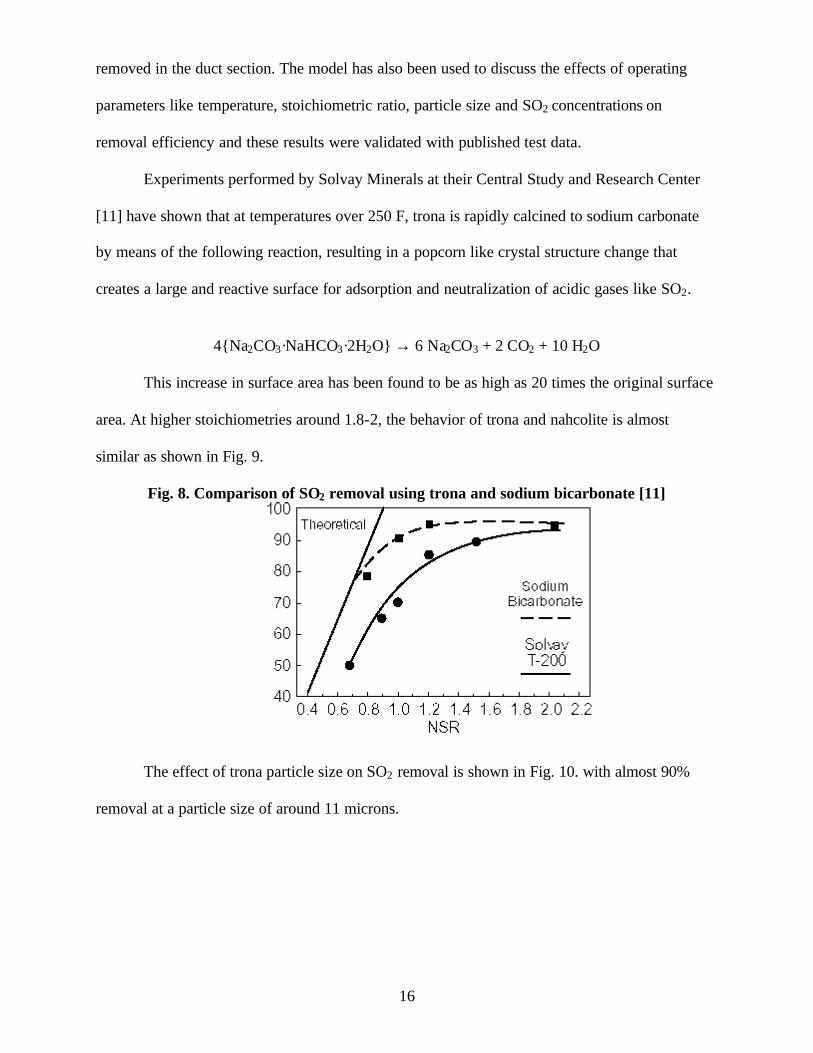
This increase in surface area has been found to be as high as 20 times the original surface
area. At higher stoichiometries around 1.8-2, the behavior of trona and nahcolite is almost
similar as shown in Fig. 9.
Fig. 8. Comparison of SO2 removal using trona and sodium bicarbonate [11]
The effect of trona particle size on SO2 removal is shown in Fig. 10. with almost 90%
removal at a particle size of around 11 microns.

17
Fig. 9. Effect of stoichiometric ratio on SO2 removal [1]
The following figure shows how the economics of the various dry sorbents compare. Trona is
found to be significantly cheaper when compared to sodium bicarbonate.
Fig. 10. Comparison of sorbent costs [1]
18
3 EXPERIMENTAL SETUP
3.1 Entrained Flow Reactor
A drop tube reactor system (Fig. 13 and 14) was developed for the purpose of studying
the reaction between SO2 and trona. The actual test concentrations of SO2, CO2, NO2, NO and
H2O to be used for the baseline tests were first determined. These concentrations were based on
the combustion data for Colorado seam B coal. A known concentration of these gases was
injected by means of individual cylinders into a manifold where these constituent gases mixed to
simulate the flue/reactant gas. There are two streams of gases to the reactor system, the stream on
the right-hand-side is the flow of carrier gas whereas the other contains reactant gases. Sorbent
particles are fed into the carrier gas by means of a sorbent feeder system. The reactant gases
traveled a 10.5 feet long duct, 0.5 inches diameter before entering the reaction chamber. The
carrier gas duct was 6 feet long. All the ductwork was heated to simulate actual flue gas
conditions by means of band heaters, the temperatures on which could be easily adjusted. Steam
was fed at a known rate by injecting water by means of a calibrated syringe pump and by heating
the feed line with a furnace heater, the rate of heating on which could be manually controlled.

19
Fig 11. Drop tube reactor schematic
Fig. 12. Drop Tube Reactor

20
Fig. 13. Fabric Filter Simulator
The reactant gas and the sorbent particles come into contact inside the venturi where by
virtue of turbulence, they are well mixed with the gases before entering the reaction chamber.
The entrained flow reaction chamber is a stainless steel tube 3 ft in height and 2 inches in
diameter. A constant temperature can be maintained in this reaction chamber by means of a
Lindberg 3 zone-heating furnace by manually adjusting the three individual heating zones. This
first stage reaction chamber is used to simulate sorbent injection where the sorbent particles are
in a dispersed mode. Immediately below the entrained chamber is the fabric filter simulator that
is a cylindrical metallic container 1 ft high and 1 ft wide as shown in Fig. 15. A filter made of
NOMEX fiber, 9” diameter was used for collecting the reaction byproducts. The fabric filter

21
simulator also consists of thermocouples, static pressure taps, flanges for disassembly and clamp
heaters for maintaining the test temperatures.
3.2 Sorbent Feeder
The sorbent feeding system as shown in Fig. 15., runs on a variable speed DC motor, a
turning plate with three grooves, a hopper for loading the sorbent particles and an aspirator for
delivering the particles into the reactor. The turntable feeder had three grooves of different sizes
and had provisions for changing the speed of rotation. By setting the rotational speed and by
selecting the appropriate groove, a wide range of sorbent feeding rates could be maintained over
a long period of time
Fig. 14. Sorbent Feeder System
22
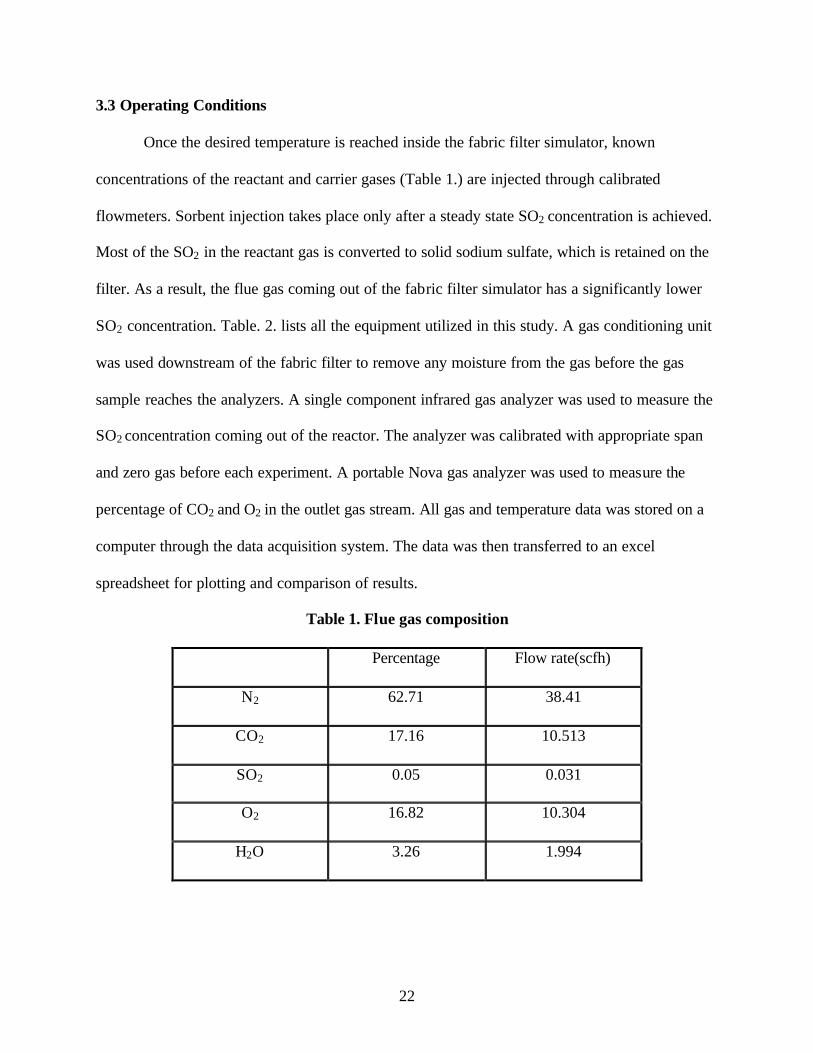
3.3 Operating Conditions
Once the desired temperature is reached inside the fabric filter simulator, known
concentrations of the reactant and carrier gases (Table 1.) are injected through calibrated
flowmeters. Sorbent injection takes place only after a steady state SO2 concentration is achieved.
Most of the SO2 in the reactant gas is converted to solid sodium sulfate, which is retained on the
filter. As a result, the flue gas coming out of the fabric filter simulator has a significantly lower
SO2 concentration. Table. 2. lists all the equipment utilized in this study. A gas conditioning unit
was used downstream of the fabric filter to remove any moisture from the gas before the gas
sample reaches the analyzers. A single component infrared gas analyzer was used to measure the
SO2 concentration coming out of the reactor. The analyzer was calibrated with appropriate span
and zero gas before each experiment. A portable Nova gas analyzer was used to measure the
percentage of CO2 and O2 in the outlet gas stream. All gas and temperature data was stored on a
computer through the data acquisition system. The data was then transferred to an excel
spreadsheet for plotting and comparison of results.
Table 1. Flue gas composition
Percentage Flow rate(scfh)
N2 62.71 38.41
CO2 17.16 10.513
SO2 0.05 0.031
O2 16.82 10.304
H2O 3.26 1.994

23
3.4 Experimental Procedure
A basic stepwise experimental procedure to run a test is shown below:
1. The data acquisition sys tem is turned on in order to view the inlet gas concentrations and
system temperatures at different points.
2. The reactor system is preheated to the required temperature by turning on the Lindberg 3-
zone heating furnace and by adjusting the settings on the controller.
3. The flue gas duct is preheated by turning on the two furnace heaters and setting the
controller to the required temperature. The controllers on the band heaters around the
duct are also adjusted to the right temperature.
4. A fresh filter cut out to the right dimensions is placed inside the fabric filter simulator.
5. The fabric filter section is also heated to the right temperature by turning on the
respective controller.
6. The SO2 analyzer is now calibrated by following the procedure shown below.
7. The gas conditioning unit along with the pumps upstream and downstream of the unit are
turned on.
8. The exhaust system is now turned on before injection of any gas takes place.
9. After approximately two hours of preheating, the different gases namely air, CO2 and
nitrogen are injected into the system at already determined flowrates.
10. Steam is injected into the system by turning on the syringe pump and adjusting to arrive
at the right settings.
11. The overall system temperature is adjusted again to account for the temperature change
because of the gas flow.
12. Pure SO2 is now injected into the system at the predetermined rate.

24
13. The flow rate is adjusted on the flowmeter till the SO2 concentration reaches the required
test concentration.
14. The system temperature and SO2 flowrate are fine tuned to be as close to the required test
conditions as possible.
15. The data acquisition system is brought to the save mode thereby allowing the user to save
all the data till the end of the experimental run.
16. The system conditions are maintained till steady state conditions are reached.
17. The sorbent feeder system is checked for calibration by measuring the turn table
rotational speed. Trona is now injected through the sorbent feeder system by selecting the
appropriate groove and corresponding rotational speed.
18. The dilution effect due to pulling in of atmospheric air is taken into account.
19. The different system parameters like temperature at various points, sorbent feed rate are
monitored during the duration of the test and necessary adjustments made.
20. The pressure drop across the filter is monitored periodically.
21. The experimental run is continued until the outlet SO2 concentration decreases to a
constant value.
22. Once a steady state outlet concentration is achieved, logging of data on the system is
discontinued.
23. The system is now shut down systematically and is allowed to cool.
24. The filter cloth is now removed from the system for analysis.
Calibration of the Gas Analyzer
The SO2 analyzer that works on the non-destructive infra-red principle (NDIR), is calibrated
by following the simple procedure given below:
1. Power the unit on and adjust the knob to the correct range setting.

25
2. Turn on the supply of the zero gas (NO) and adjust the zero knob till the display shows 0
ppm and is steady.
3. Cut the supply of the zero gas and open the regulator on the span gas.
4. Adjust the span knob till the display shows the right SO2 concentration.
5. Turn off the supply of span gas and turn on the supply of zero gas. Check if it the display
goes back to 0 ppm, otherwise adjust accordingly.
6. Repeat the above steps till the analyzer displays consistent concentration values.
Table 2. List of Equipment.
Instrument Manufacturer Model Number Serial Number
1. SO2 gas analyzer California
Analytical
Instruments
100 1M12005
2. Data Acquisition System Superlogics Inc. 8017, 8018 input
modules
3. Gas Dryer IMR Inc. IMR 400 H2507483
4. Three zone heating furnace Lindberg 55347-4 927585
5. Reactor temperature
controller
Lindberg 58434 919021
6. Furnace heaters Lindberg 70 114797
7. Turn table motor Marathon electric
manufacturing co.
SJ92M68W
8. Syringe pump Sage instruments 351
9. Trolley jack Central Hydraulics
Inc.
619S
10. Outlet gas pump Thomas Industries
Inc.
2107CA18TFEL-A
11. Sorbent feeder vibrator Vibco Inc. SPR-21 04760
26
4 RESULTS
Based on the results obtained from carrying out the reaction between SO2 and trona in the
entrained flow reactor, the effects of various operating conditions on SO2 removal are evaluated.
The major parameters in any dry FGD process are temperature, inlet SO2 concentration,
stoichiometric ratio of the sorbent to SO2 and sorbent particle size. For a better understanding of
the comparison of results at different operating conditions, the results have been presented as a
series of charts.
According to Keener et al [15], removal of SO2 takes place in two stages, one within the
duct section and the other in the bag house filter. In the duct section, the residence time of the
particles is very small and generally varies between 1 to 2 seconds. This does not give enough
time for the particles to decompose and hence contribution of the duct section towards SO2
removal is almost negligibly small when compared to the removal in the baghouse. Also within
the duct, smaller particles show higher removal efficiency. It was found that at higher
temperatures, the removal is increased for a short period of time. However, the final removal is a
combined result of both temperature and particle size. It is the baghouse filter where the primary
SO2 removal occurs, where the particles accumulate on the surface of the bag filter and react with
the SO2 in the flue gas in a continuous manner. The SO2 removal is considered to be a very
dynamic process and the reaction between SO2 and sorbent particles at different positions along
the particle layer is considered. However after a certain period of operation, the SO2 removal
reaches a steady state.
4.1 Effect of Particle size on SO2 removal
Previous studies dealing with SO2 removal using dry sorbent injection have demonstrated
that removal of SO2 increases with the decrease in particle size. This can be mainly attributed to

27
the fact that the active surface area for smaller particles is much larger in comparison to bigger
particle sizes under the same stoichiometric conditions. Also the time for smaller particles to
reach steady state is much shorter than for larger particles because the time required for particles
to decompose decreases with size. The diffusion of SO2 into the particles governs this reaction.
According to Keener and Khang [10], the initial sodium bicarbonate is considered to be a non-
porous solid particle and pores are formed as a result of removal of CO2 and water vapor from
the solid matrix. This decomposition process not only provides a path for further reactions but
also results in a large amount of freshly formed active area. Hence, another possible reason for
high reactivity is that the diffusion resistance for SO2 is relatively smaller for particles with a
smaller size when compared to larger particle sizes where the pore structure becomes more
complex.
To study the effect of particle size on the trona- SO2 reaction, tests were run on two
different types of trona - one with particles passing through 38 micron sieve and the other being
the T-200 trona. Result s of sieve analysis showed that the mean mass diameter for T-200
particles was around 41 microns as shown in Table 2 and 3.
Table. 3. T-200 particle size distribution
Sieve Opening Typical weight percent
< 70 µm 75
< 28 µm 50
< 6 µm 10
On the smaller sized trona, tests were run at an inlet SO2 concentration of 500 ppm and a
temperature of 300F and at three different stoichiometric ratios. Fig. 15. shows the conversions
for the finer trona at three different stoichiometric ratios. It can also be observed that the
conversion is higher at higher stoichiometries.
28
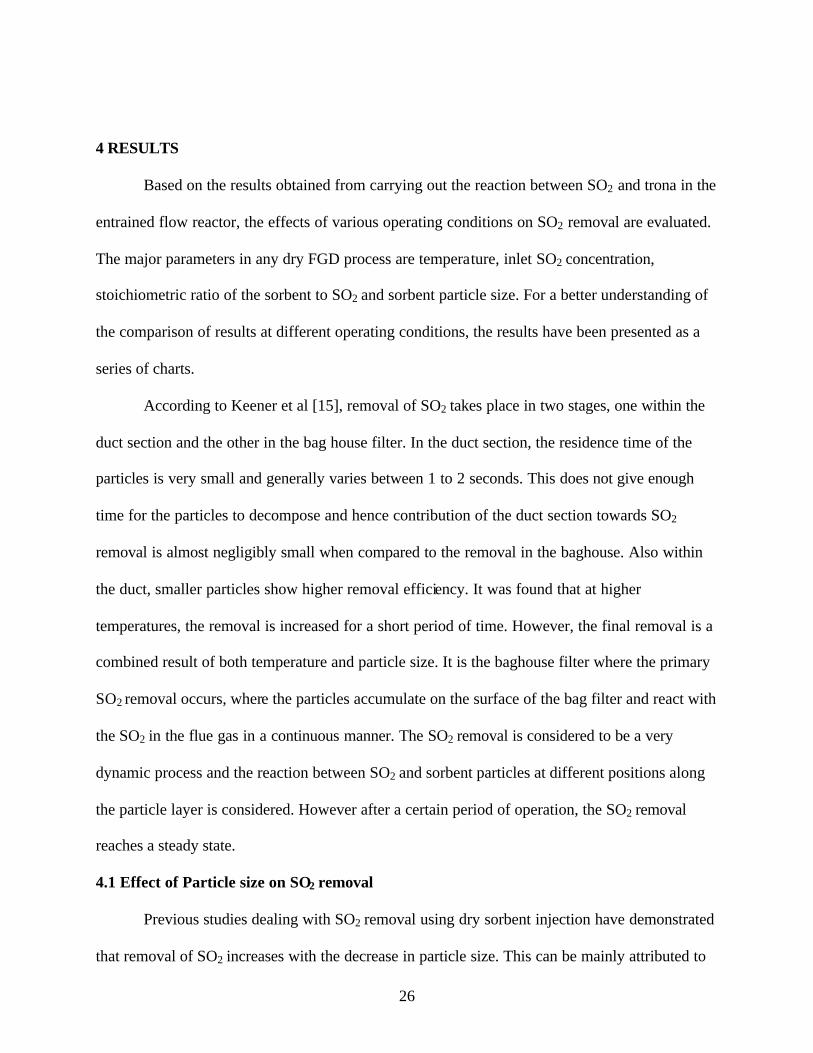
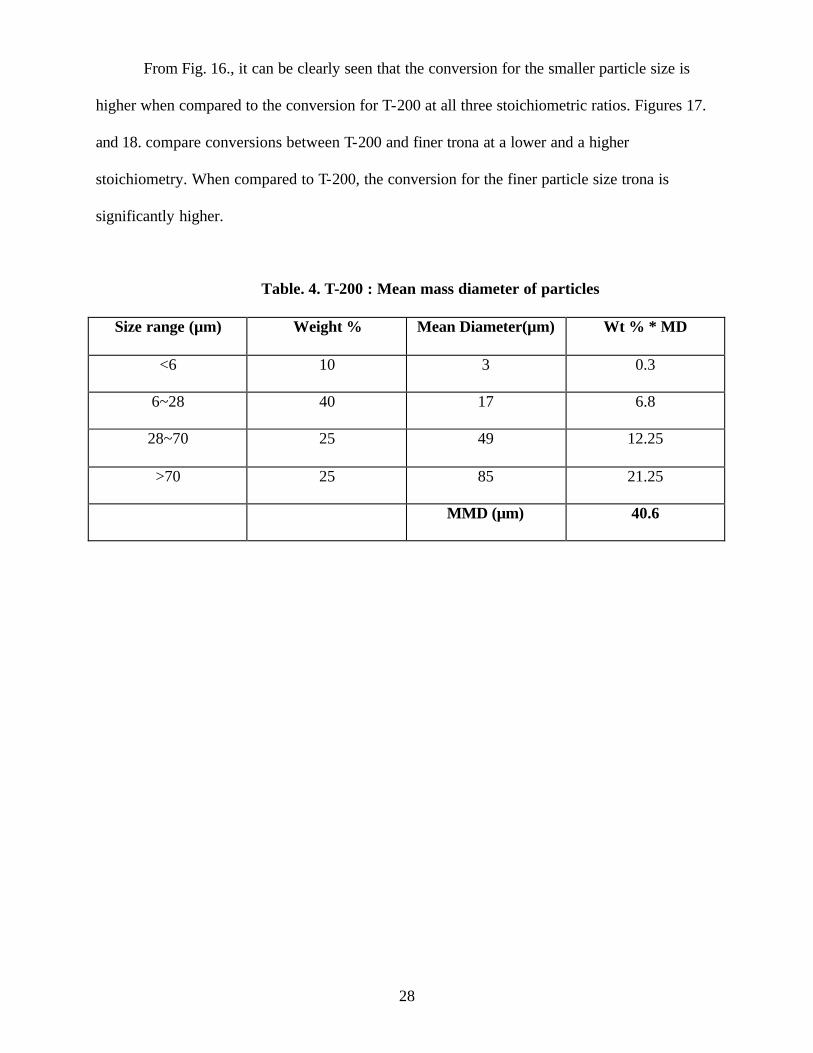
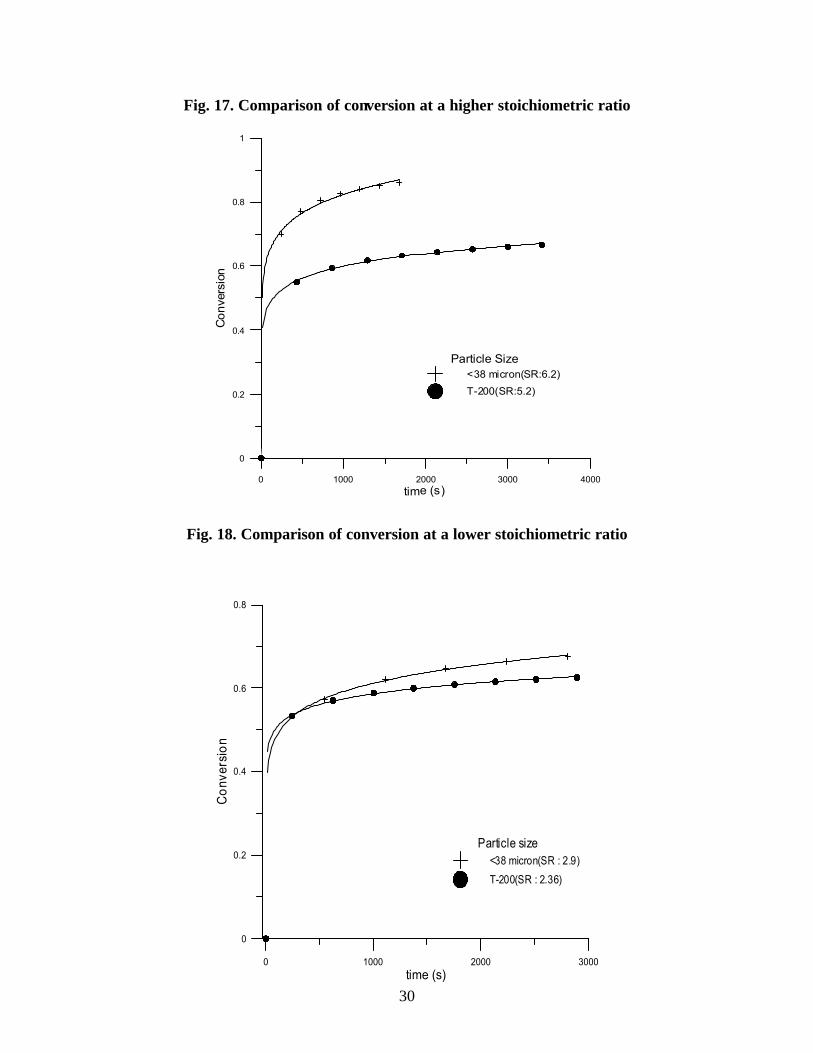
From Fig. 16., it can be clearly seen that the conversion for the smaller particle size is
higher when compared to the conversion for T-200 at all three stoichiometric ratios. Figures 17.
and 18. compare conversions between T-200 and finer trona at a lower and a higher
stoichiometry. When compared to T-200, the conversion for the finer particle size trona is
significantly higher.
Table. 4. T-200 : Mean mass diameter of particles
Size range (µm) Weight % Mean Diameter(µm) Wt % * MD
<6 10 3 0.3
6~28 40 17 6.8
28~70 25 49 12.25
>70 25 85 21.25
MMD (µm) 40.6

29
Fig. 15. Conversion at different stoichiometric ratios
(Temperature = 300 F ; Inlet SO2 concentration = 500 ppm ; Particle Size = <38µ)
0 1000 2000 3000time (s)
0
0.2
0.4
0.6
0.8
1
conv
ersi
on
SR6.2
2.9
1.5
Fig. 16. Effect of particle size on conversion at different stoichiometric ratios
(Temperature = 300 F ; Inlet SO2 concentration = 500 ppm)
0 2 4 6 8 10Stoichiometric Ratio
0
0.2
0.4
0.6
0.8
1
Con
vers
ion
Particle Size<38µ
T-200
30
Fig. 17. Comparison of conversion at a higher stoichiometric ratio
0 1000 2000 3000 4000time (s)
0
0.2
0.4
0.6
0.8
1
Con
vers
ion
Particle Size<38 micron(SR:6.2)
T-200(SR:5.2)
Fig. 18. Comparison of conversion at a lower stoichiometric ratio
0 1000 2000 3000time (s)
0
0.2
0.4
0.6
0.8
Con
vers
ion
Particle size<38 micron(SR : 2.9)
T-200(SR : 2.36)
31
4.2 Effect of Temperature on SO2 removal
Temperature has a very crucial effect on the overall desulfurization process. Fig. 19
through 25 show some of the typical results at different temperatures. The plots show the
variation in conversion with temperature within the first 600 seconds of trona injection. Tests
have been conducted at five different temperatures to study the effect of temperature on SO2
removal. The temperatures ranged from 250 F to 350 F. Generally, upto a certain temperature,
the conversion increases with temperature and then drops back and finally increases again.
However this trend is not true for all stoichiometric ratios and inlet gas concentrations as seen
from the plots. It can be seen from the plots that in most cases the conversion drops as the
temperature increases from 250 F to around 275 F and then starts to increase with temperature
upto 300 F. Conversion drops as the temperature reaches around 325 F followed by another
increase in most cases as the temperature reaches 350 F. At lower temperatures, the
desulfurization reaction proceeds during and after the sodium bicarbonate decomposition. Since
the reaction proceeds at a lower rate, there is more time for the reaction to occur and hence
higher removal of SO2 before pore closure occurs. Freshly formed sodium carbonate becomes
available at the right rate for the reaction to proceed. At higher temperatures, the reaction reaches
the final removal rate at a very short period of time due to the quick decomposition and quicker
build up of decomposition byproduct resulting in pore plugging and closure at outside surface of
the particle. As a result, it becomes very difficult for the SO2 to penetrate the unreacted core of
the decomposition product. The primary reason for pore plugging is the molar volume difference
between the initial sodium carbonate (42.25 cm3/mol) and the final product sodium sulfate
(53.16 cm3/mol). It can also be observed that the time to reach steady state reduces with increase
in temperature. According to Chungfa wu [5], the time to reach steady state depends on particle
size and system temperature instead of flue gas concentration.

32
It is observed that for this type of a system, which can be considered as a combined sytem
of duct and filter house, there exists a temperature at which the SO2 removal is the highest. This
effect is interestingly different from that of sodium carbonate, which always displays a higher
conversion with increasing temperature. According to Keener and Davis, there exists a
temperature at which the release of CO2 and water vapor from the decomposing particle is just at
the right rate to allow maximum counter-diffusion of SO2 into the inner particle for further
reaction. However studies have shown this optimum temperature to be a function of the particle
size and hence, the particle size has to be taken into consideration before making any
conclusions.
Fig. 19. Conversion at different temperatures
(Inlet SO2 concentration : 500 ppm; stoichiometric ratio : 2-4)
0 200 400 600 800Time (s)
0
0.2
0.4
0.6
Con
vers
ion
Temperature250 F
275 F
300 F
325 F
350 F
33
Fig. 20. Conversion at different temperatures
(Inlet SO2 concentration : 500 ppm; stoichiometric ratio : 4-6)
0 200 400 600 800Time
0
0.2
0.4
0.6
0.8
Con
vers
ion
Temperature250 F
275 F
300 F
325 F
350 F
Fig. 21. Conversion at different temperatures
(Inlet SO2 concentration : 500 ppm; stoichiometric ratio : 8-10)
0 200 400 600 800Time (s)
0
0.2
0.4
0.6
0.8
Con
vers
ion
Temperature250 F
275 F
300 F
325 F
325 F
34
Fig. 22. Conversion at different temperatures
(Inlet SO2 concentration : 1000 ppm; stoichiometric ratio : 2-4)
0 200 400 600 800Time (s)
0
0.1
0.2
0.3
0.4
0.5
Con
vers
ion
Temperature250 F
275 F
300 F
325 F
350 F
Fig. 23. Conversion at different temperatures
(Inlet SO2 concentration : 1000 ppm; stoichiometric ratio : 3-6)
0 200 400 600 800Time (s)
0
0.2
0.4
0.6
0.8
Con
vers
ion
Temperature250 F
275 F
300 F
325 F
350 F

35
Fig. 24. Conversion at different temperatures
(Inlet SO2 concentration : 1500 ppm; stoichiometric ratio : 0-3)
0 200 400 600 800Time (s)
0
0.1
0.2
0.3
Con
vers
ion
Temperature250 F
300 F
325 F
Fig. 25. Conversion at different temperatures
(Inlet SO2 concentration : 1500 ppm; stoichiometric ratio : 2-4)
0 200 400 600 800Time (s)
0
0.2
0.4
0.6
Con
vers
ion
Temperature250 F
275 F
300 F
325 F
350 F
36
4.3 Effect of Inlet Gas SO2 Concentration on overall SO2 removal
Apart from the temperature, SR and particle size, inlet SO2 Concentration also has an
influence on the overall SO2 removal. From the results, it can be seen that increase in the inlet
SO2 concentration enhances the reaction and hence increases the overall SO2 removal. Tests run
at three inlet SO2 Concentrations namely 500 ppm, 1000 ppm and 1500 ppm have shown that the
conversion is highest for 1500 ppm at the same temperature and SR. Figures 26. through 28.
show the effect of inlet SO2 concentration on conversion at different temperatures. Studies have
shown that the effect of inlet SO2 concentration is more pronounced for trona / sodium
sesquicarbonate than for sodium bicarbonate. According to Chungfa Wu [5], the concentration
has a direct effect on the pore plugging time constant which inturn has a critical effect on
conversion. Hence, inlet SO2 Concentration has an indirect effect on the overall desulfurization
process.
Fig. 26. Effect of S02 inlet concentration on conversion (T : 250F, SR : 2-4)
0 1000 2000 3000 4000Time (s)
0
0.2
0.4
0.6
0.8
Con
vers
ion
Inlet SO2 concentration500 ppm
1000 ppm
1500 ppm

37
Fig. 27. Effect of S02 inlet concentration on conversion (T : 325F, SR : 2-4)
0 1000 2000 3000 4000Time (s)
0
0.2
0.4
0.6
Con
vers
ion
Inlet SO2 concentration500 ppm
1000 ppm
1500 ppm
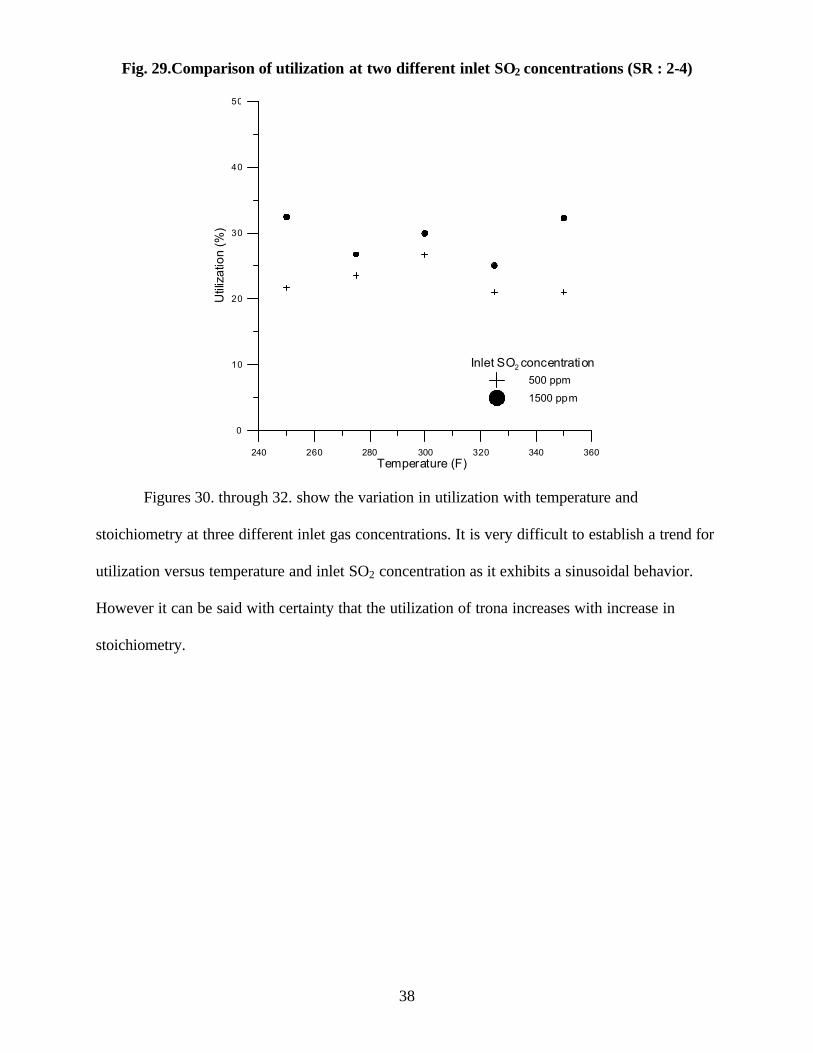
Fig 29. compares the sorbent utilization for two different inlet SO2 concentrations. It is
very clear that the sorbent utilization at the higher inlet gas concentration is higher.
Fig. 28. Effect of S02 inlet concentration on conversion (T : 350F, SR : 2-4)
0 1000 2000 3000 4000Time (s)
0
0.2
0.4
0.6
0.8
Con
vers
ion
Inlet SO2 concentration500 ppm
1000 ppm
1500 ppm
38
Fig. 29.Comparison of utilization at two different inlet SO2 concentrations (SR : 2-4)
240 260 280 300 320 340 360Temperature (F)
0
10
20
30
40
50
Util
izat
ion
(%)
Inlet SO2 concentration500 ppm
1500 ppm
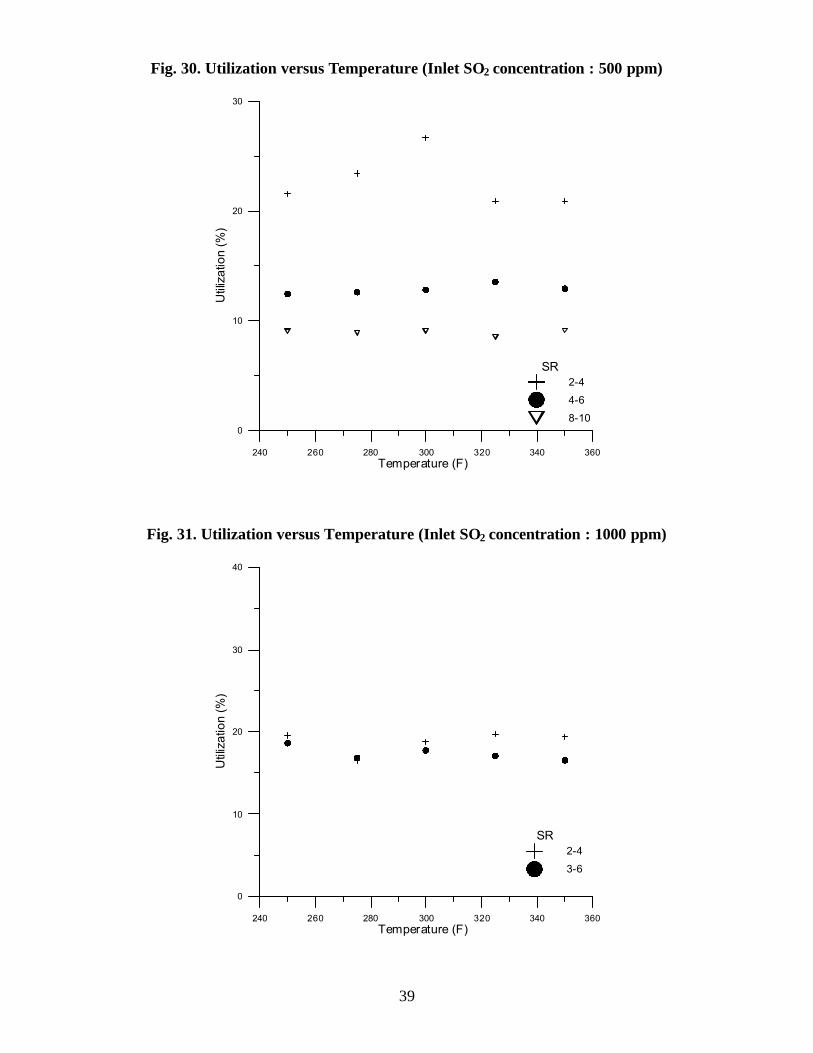
Figures 30. through 32. show the variation in utilization with temperature and
stoichiometry at three different inlet gas concentrations. It is very difficult to establish a trend for
utilization versus temperature and inlet SO2 concentration as it exhibits a sinusoidal behavior.
However it can be said with certainty that the utilization of trona increases with increase in
stoichiometry.
39
Fig. 30. Utilization versus Temperature (Inlet SO2 concentration : 500 ppm)
240 260 280 300 320 340 360Temperature (F)
0
10
20
30
Util
izat
ion
(%)
SR2-4
4-6
8-10
Fig. 31. Utilization versus Temperature (Inlet SO2 concentration : 1000 ppm)
240 260 280 300 320 340 360Temperature (F)
0
10
20
30
40
Util
izat
ion
(%)
SR2-4
3-6

40
Fig. 32. Utilization versus Temperature (Inlet SO2 concentration : 1500 ppm)
240 260 280 300 320 340 360Temperature (F)
0
10
20
30
40
50
Util
izat
ion
(%)
SR0-2
2-4
4.4 Effect of Stoichiometric Ratio on SO2 removal
Stoichiometric ratio corresponds to the amount of trona injection at a certain inlet SO2
concentration at a given flue gas flow rate. The following plots show the results from tests run at
different stoichiometries for the same inlet SO2 concentration and temperature. It is easy to
conclude that as the stoichiometry increases, SO2 removal also increases, irrespective of the other
factors like temperature, particle size and inlet SO2 concentration. From Figures 33. through 35.,
it can be seen that this trend holds for different temperatures and inlet SO2 concentrations.
Theoretically at a net stoichiometric ratio (NSR) of 1, the removal or conversion should be 100
%. However this is not practically possible because of the reaction efficiency, particle behavior
and other factors.

41
Fig. 33. Effect of stoichiometry on conversion
(Temperature : 275 F; Inlet SO2 concentration : 500 ppm)
0 2000 4000 6000Time (s)
0
0.2
0.4
0.6
0.8
1
Con
vers
ion
SR2-4
4-6
8-10
Fig. 34. Effect of stoichiometry on conversion
(Temperature : 300 F; Inlet SO2 concentration : 500 ppm)
0 1000 2000 3000 4000Time (s)
0
0.2
0.4
0.6
0.8
1
Con
vers
ion
SR2-4
4-6
8-10
42
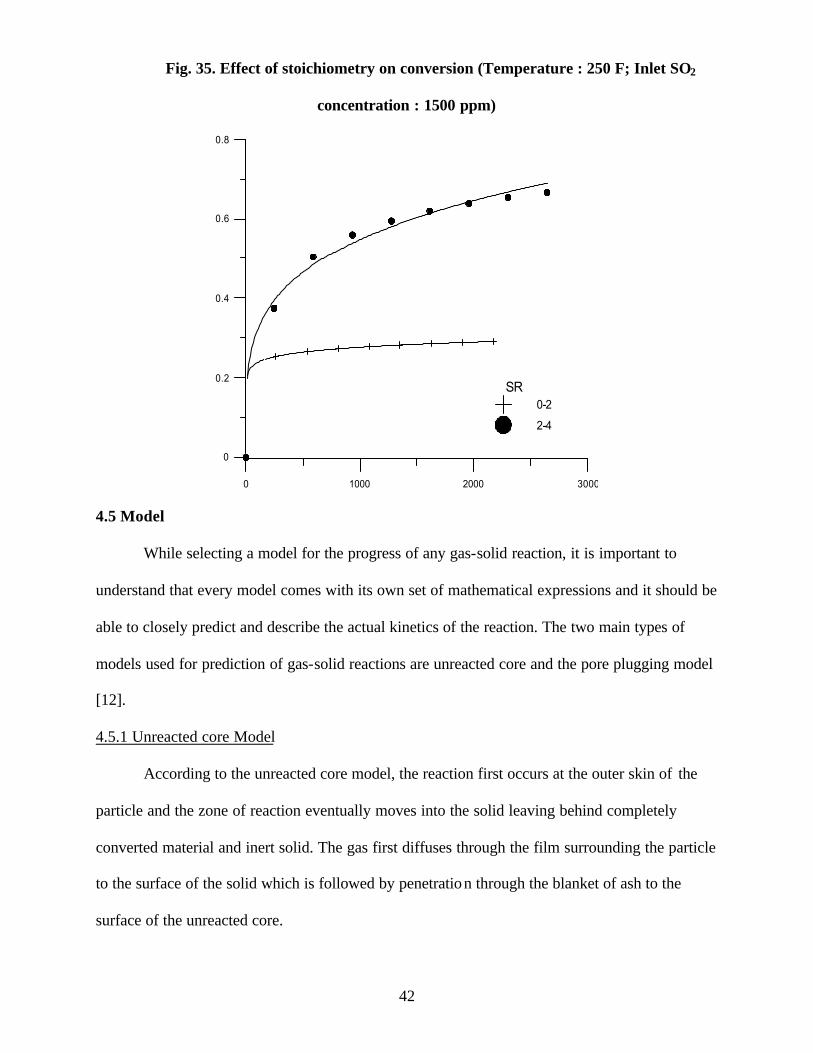
Fig. 35. Effect of stoichiometry on conversion (Temperature : 250 F; Inlet SO2
concentration : 1500 ppm)
0 1000 2000 3000
0
0.2
0.4
0.6
0.8
SR0-2
2-4
4.5 Model
While selecting a model for the progress of any gas-solid reaction, it is important to
understand that every model comes with its own set of mathematical expressions and it should be
able to closely predict and describe the actual kinetics of the reaction. The two main types of
models used for prediction of gas-solid reactions are unreacted core and the pore plugging model
[12].
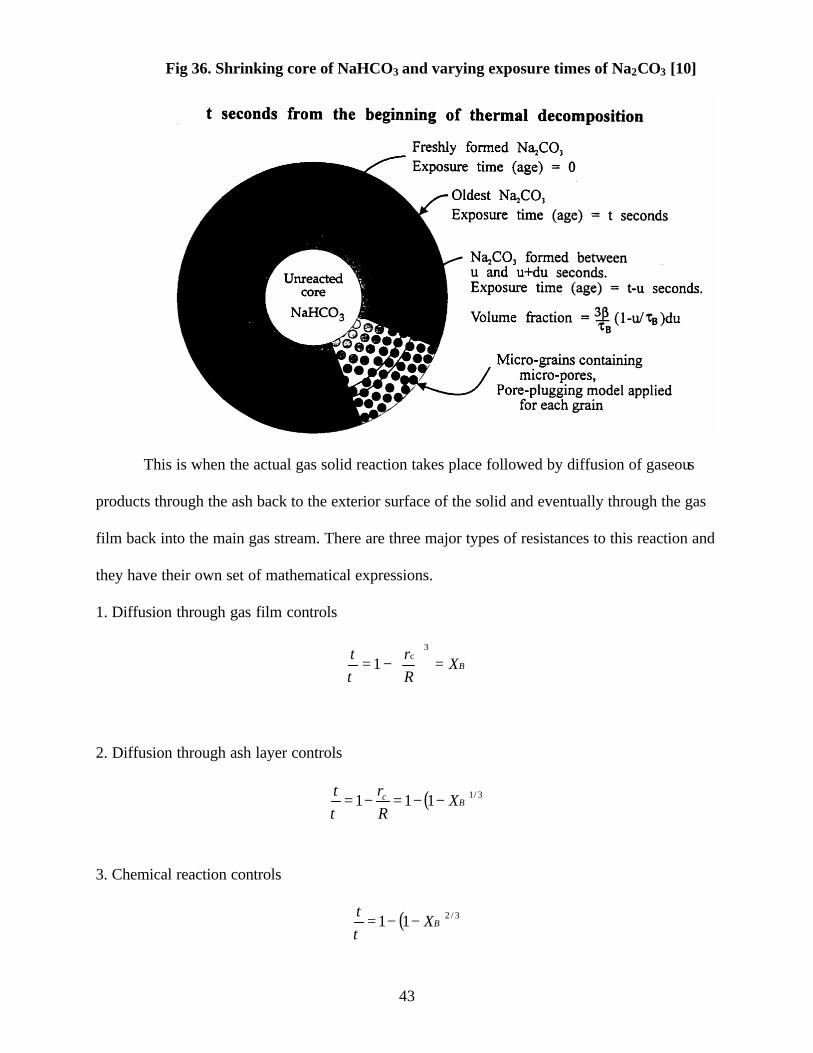
4.5.1 Unreacted core Model
According to the unreacted core model, the reaction first occurs at the outer skin of the
particle and the zone of reaction eventually moves into the solid leaving behind completely
converted material and inert solid. The gas first diffuses through the film surrounding the particle
to the surface of the solid which is followed by penetration through the blanket of ash to the
surface of the unreacted core.
43
Fig 36. Shrinking core of NaHCO3 and varying exposure times of Na2CO3 [10]
This is when the actual gas solid reaction takes place followed by diffusion of gaseous
products through the ash back to the exterior surface of the solid and eventually through the gas
film back into the main gas stream. There are three major types of resistances to this reaction and
they have their own set of mathematical expressions.
1. Diffusion through gas film controls
BXRrt
=
−=
3c
1τ
2. Diffusion through ash layer controls
( ) 3/1111 Bc XRrt
−−=−=τ
3. Chemical reaction controls
( ) 3/211 BXt
−−=τ

44
4.5.2 Pore Plugging Model
During any gas-solid reaction, the pore structure of the solid is altered during the reaction
with the gas and formation of solid product. Depending upon the molar volume of the product,
different pore structures result. If the molar volume of the product is less than that of the
reactant, a more open structure is formed. On the contrary, if the molar volume of the product is
greater than that of the reactant, a more dense pore structure is formed. Conversions of CaO to
CaSO4 and of Na2CO3 to Na2SO4 result in this kind of a structure.
In the past few years, a variety of pore plugging models have been developed to
demonstrate the various gas solid reactions. Chrostowsli and Georgakis [13] proposed a model
for the reaction of SO2 with CaO. Keener [14] modified this model to arrive at a mathematical
expression for the reaction of sodium bicarbonate with SO2. The final simplified expression is
−−=
∞XXt
1lnτ
2
*
SOCP
p =τ
)(*
msf
PX
ρτ=∞
X : Conversion at any time t
X∝ : Conversion at infinite time
t : time
τp : time for complete conversion
P* : Pore plugging constant
CSO2 : gas phase concentration of SO2
ρm : Molar density of the solid
Sp : Specific surface area of particle, gm/cm3
ρ : particle density, gm/cm3
45
Keener [14] proposed a series of steps that need to be followed in order to arrive at the kinetic
parameters.
1. Estimate X∝ experimentally from conversion versus time data
2. Plot versus reaction time to get the slope 1/τp
3. Calculate P* from τp = P*/ CSO2, where CSO2 is known
4. Calculate τsf from the expression X∝ = (P*/τsf)* ρm
5. Calculate the kinetic rate term kηo from the expression, τsf = 1/(ρSpkηo)
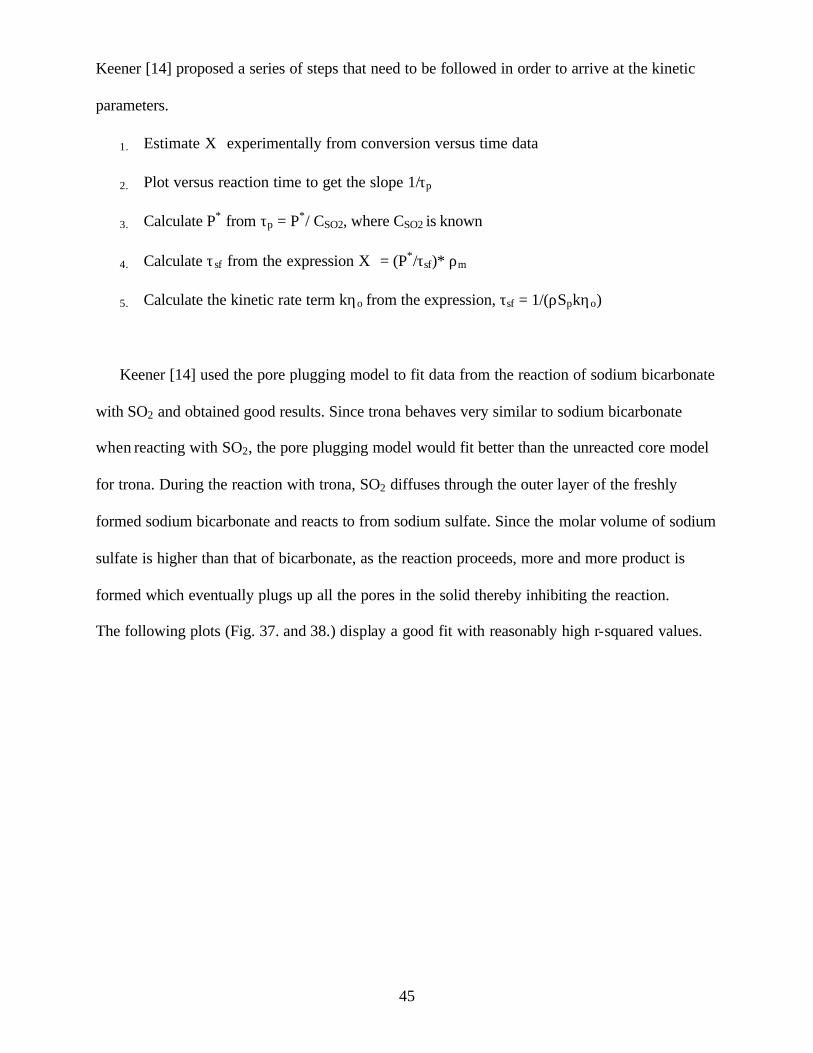
Keener [14] used the pore plugging model to fit data from the reaction of sodium bicarbonate
with SO2 and obtained good results. Since trona behaves very similar to sodium bicarbonate
when reacting with SO2, the pore plugging model would fit better than the unreacted core model
for trona. During the reaction with trona, SO2 diffuses through the outer layer of the freshly
formed sodium bicarbonate and reacts to from sodium sulfate. Since the molar volume of sodium
sulfate is higher than that of bicarbonate, as the reaction proceeds, more and more product is
formed which eventually plugs up all the pores in the solid thereby inhibiting the reaction.
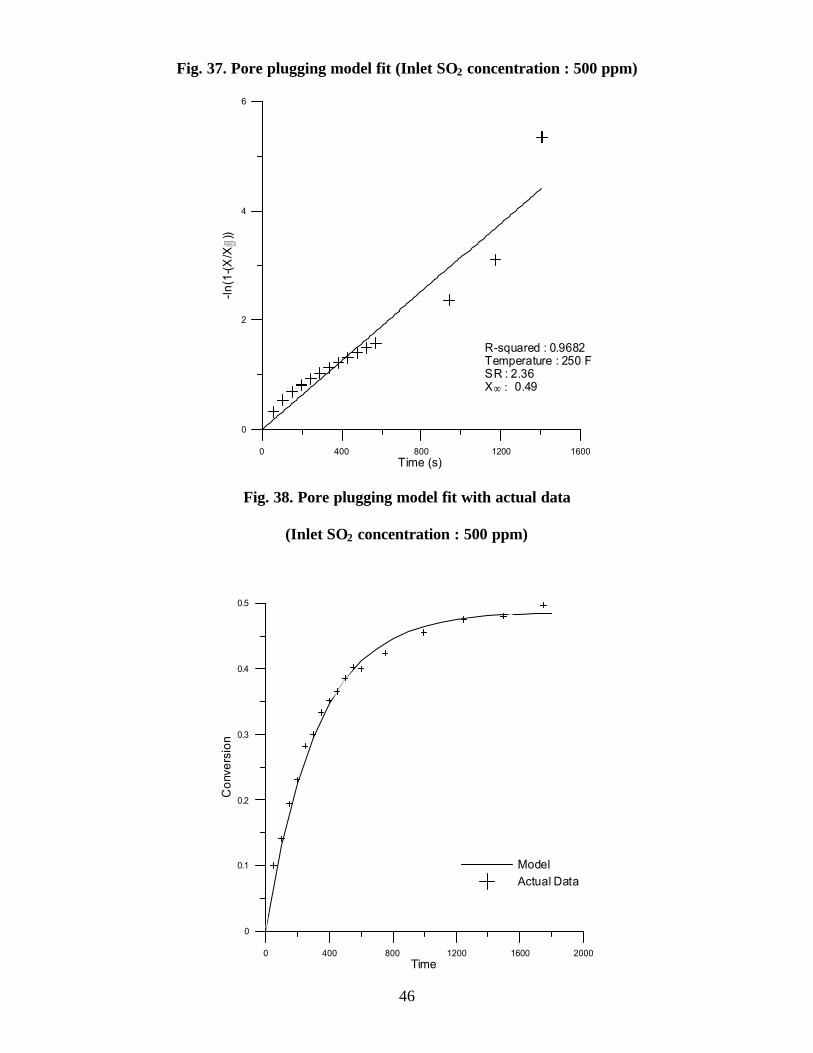
The following plots (Fig. 37. and 38.) display a good fit with reasonably high r-squared values.
46
Fig. 37. Pore plugging model fit (Inlet SO2 concentration : 500 ppm)
0 400 800 1200 1600Time (s)
0
2
4
6
-ln(1
-(X/X4
))
R-squared : 0.9682Temperature : 250 FSR : 2.36X∞ : 0.49
Fig. 38. Pore plugging model fit with actual data
(Inlet SO2 concentration : 500 ppm)
0 400 800 1200 1600 2000Time
0
0.1
0.2
0.3
0.4
0.5
Con
vers
ion
ModelActual Data
47
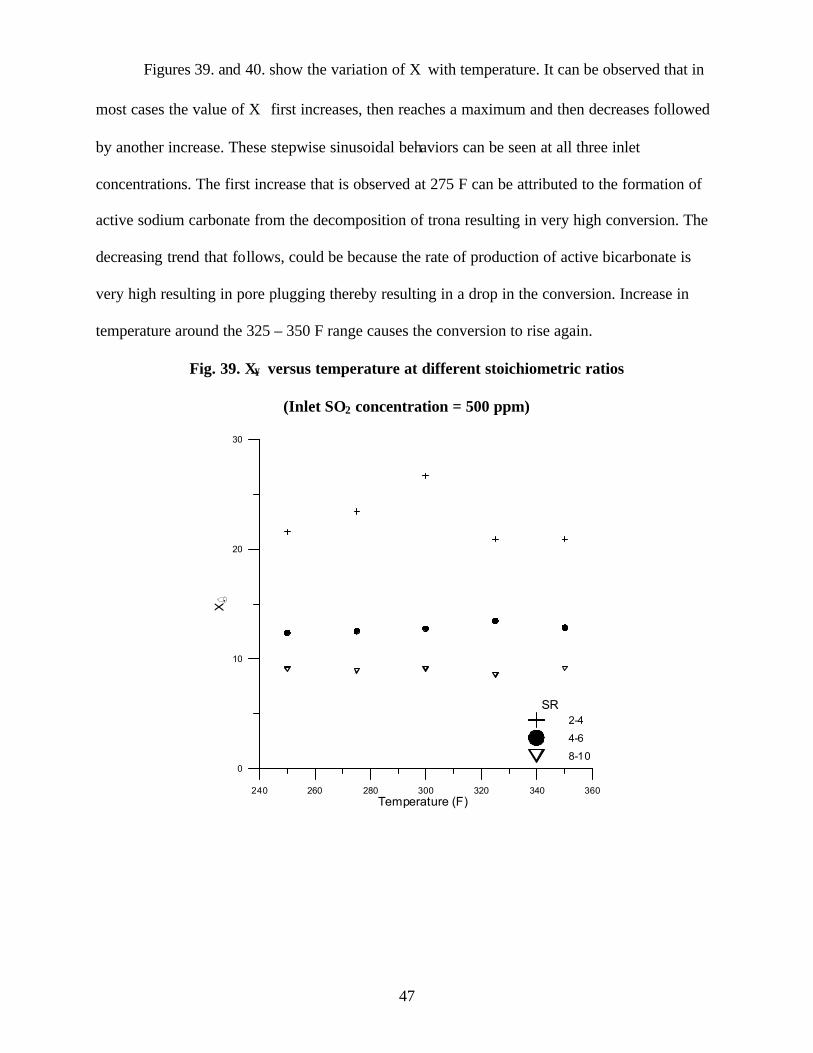
Figures 39. and 40. show the variation of X∝with temperature. It can be observed that in
most cases the value of X∝ first increases, then reaches a maximum and then decreases followed
by another increase. These stepwise sinusoidal behaviors can be seen at all three inlet
concentrations. The first increase that is observed at 275 F can be attributed to the formation of
active sodium carbonate from the decomposition of trona resulting in very high conversion. The
decreasing trend that follows, could be because the rate of production of active bicarbonate is
very high resulting in pore plugging thereby resulting in a drop in the conversion. Increase in
temperature around the 325 – 350 F range causes the conversion to rise again.
Fig. 39. X∞ versus temperature at different stoichiometric ratios
(Inlet SO2 concentration = 500 ppm)
240 260 280 300 320 340 360Temperature (F)
0
10
20
30
X%
SR2-4
4-6
8-10

48
Fig. 40. X∞ versus temperature at different stoichiometric ratios
(Inlet SO2 concentration = 1500 ppm)
240 260 280 300 320 340 360Temperature(F)
0
0.2
0.4
0.6
0.8
X%
SR
0-2
2-4
49
5. CONCLUSIONS AND FUTURE WORK
Use of trona could serve as a very good cost effective alternative for sodium bicarbonate
in dry sorbent injection for flue gas desulfurization. The cost of trona, which is significantly less
than that of sodium bicarbonate, would offset the enhanced removal efficiency of sodium
bicarbonate. It can also be very easily retrofitted into an already existing flue gas desulfurization
system. At higher stoichiometries, conversion and removal efficiency of trona is almost
comparable to that of sodium bicarbonate. Particle size appeared to be the most important factor
influencing the reaction of trona with sulfur dioxide. Results showed trona to achieve
considerably high conversions at small particle sizes. Temperature also seemed to have a
significant effect on the conversion but it was not as direct as the other parameters. There does
not seem to exist a steady trend for conversion with change in temperature, it exhibits a
sinusoidal pattern. It is a complex function of all the other parameters and they have to be taken
into consideration before arriving at any conclusions. Inlet SO2 concentration on the other hand
has a more direct effect. Conversion increases with increase in the inlet gas concentration as it
enhances the reaction. The other important factor considered in the reaction of SO2 with trona is
the stoichiometric ratio. As the stoichiometric ratio increases, there is more and more sorbent in
the system to react with the SO2 and hence higher conversion. Data from the trona-SO2 seem to
fit the pore plugging model more than the unreacted core model. However more data is required
to arrive at numerical values for the kinetic parameters like reaction rate, pore plugging constant,
etc.
For a direct comparison of trona and sodium bicarbonate, it would be ideal to conduct
experiments for both reactions in the same reactor under the same operating conditions. It would
give a very good idea of how they compare and what parameters need to be fine tuned to

50
optimize SO2 removal using trona. To make it commercially feasible it is also important to study
its behaviour as far as removal of other pollutants like mercury is concerned. Studies are also
being performed to test the viability of making a more reactive sorbent from trona by
carbonating the carbonate component to bicarbonate thereby making it similar to sodium
bicarbonate. There has been very little research on the kinetics of the trona –SO2 reaction. More
data needs to be collected in order to arrive at the reaction kinetics. A suitable model can then be
developed and used to predict and explain the reaction between trona and SO2.
51
6. REFERENCES
1. http://www.solvayminerals.com/
2. Spriggs, L.S.,1999, Examination of the ammonia – sulfur dioxide – water system using
FTIR spectroscopy. MS thesis, The University of Cincinnati.
3. Wark, K., Warner, C.F. and Davis, W.T., 1998, Air pollution its origin and control.
Addison Wesley Longman, Inc.
4. Cooper, C.D. and Alley, F.C., 1994, Air pollution control a design approach. Waveland
Press, Inc.
5. Wu, C.,1997, A scrubbing model for dry sodium bicarbonate duct injection flue gas
desulfurization. MS thesis, The University of Cincinnati.
6. Murio, L.J. and Arand, J.K.,1981, Bench scale study of the dry removal of SO2 with
nahcolite and trona. EPRI final report, March 1981.
7. Keener, T.C. and Davis, W.T., 1984, Study of the reaction of SO2 with NaHCO3 and
Na2CO3. JAPCA 34, 651-654.
8. Guldur, C., Dogu, G. and Dogu, T.,2000, Kinetics of trona sulfur dioxide reaction.
Chemical engineering and processing. 40, 13-18.
9. Albin, D.W., Hammond, J. J., Watts, D. B., Ostop, R. L. and Hooper, R. G., Full scale
demonstration of dry sodium injection flue gas desulfurization at city of Colorado
Springs Ray D. Nixon power plant, Abstract, EPRI.
10. Keener, T.C. and Khang, S.J., 1993, Kinetics of the sodium bicarbonate-sulfur dioxide
reaction. Chemical Engineering Science 48, 2859-2865.
52
11. Ninane, L.,1993, Trona use in dry sodium injection for acid gas removal. Central study
and research center, Solvay S.A.
12. Levenspiel, O.,1972, Chemical Reaction Engineering. Wiley, New York.
13. Chrostowski, J.W. and Georgakis, C.,1978.Pore plugging model for gas-solid reactions.
ACS symposium series 65, 225-237.
14. Keener, T. C.,1982, Thermal decomposition of Sodium Bicarbonate and its effect on the
reaction of Sodium Bicarbonate and Sulfur Dioxide in a simulated flue gas. Ph.D.
dissertation, The University of Tennessee.
15. Keener, T. C. and Biswas, P., A dry scrubbing model for SO2 removal. Chemical
Engineering Commun. 81, 97-108.
16. Keener, T.C., Frazier, G.C. and Davis, W.T., 1985, Thermal decomposition of sodium
bicarbonate. Chemical Engineering Commun. 33, 93-105.
17. Ucar, C.,Guruz, G., C., Dogu, G. Durmaz, A., Ercan, Y. and Dogu, T, 1992, Scrubbing of
SO2 with trona solution in a spray drier. The Canadian journal of chemical engineering.
70, 808-812.
18. http://www.epa.gov

53
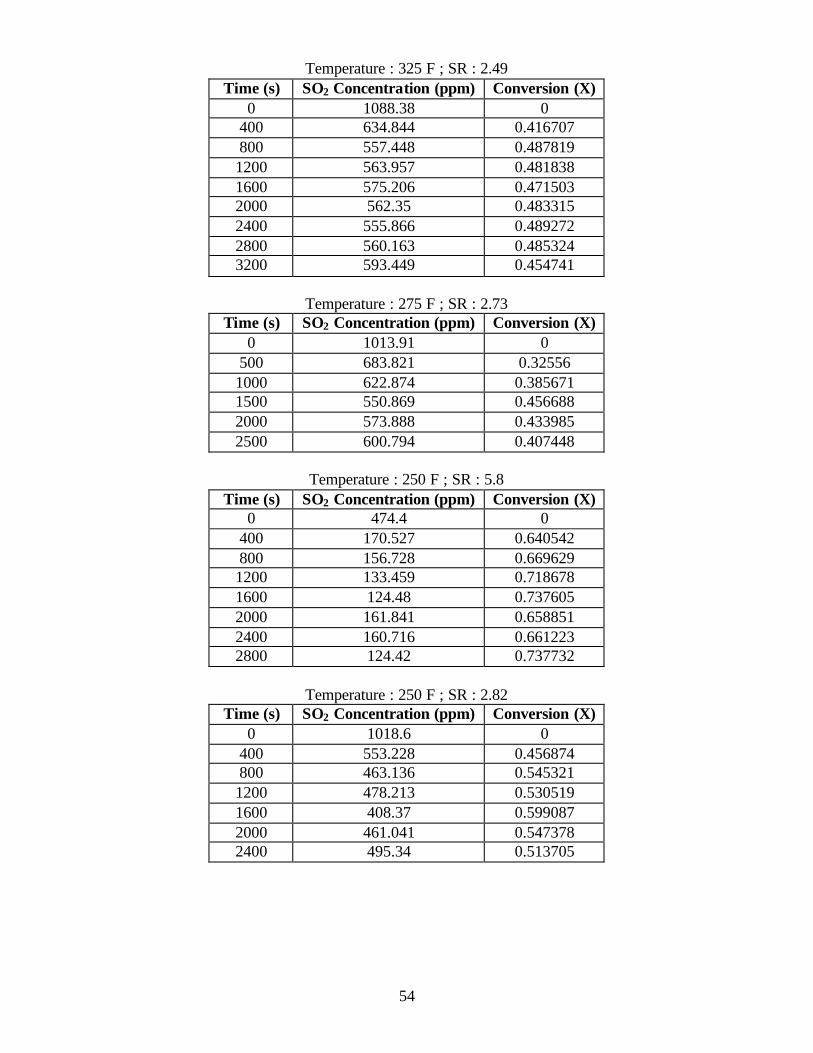
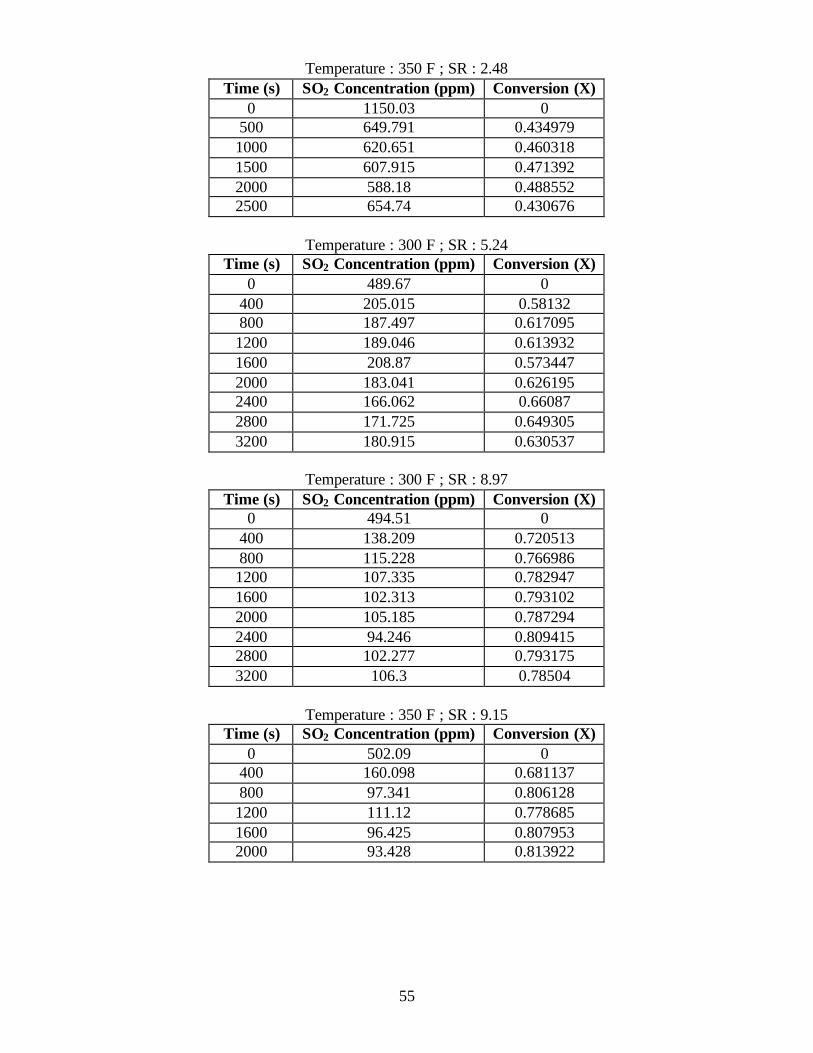
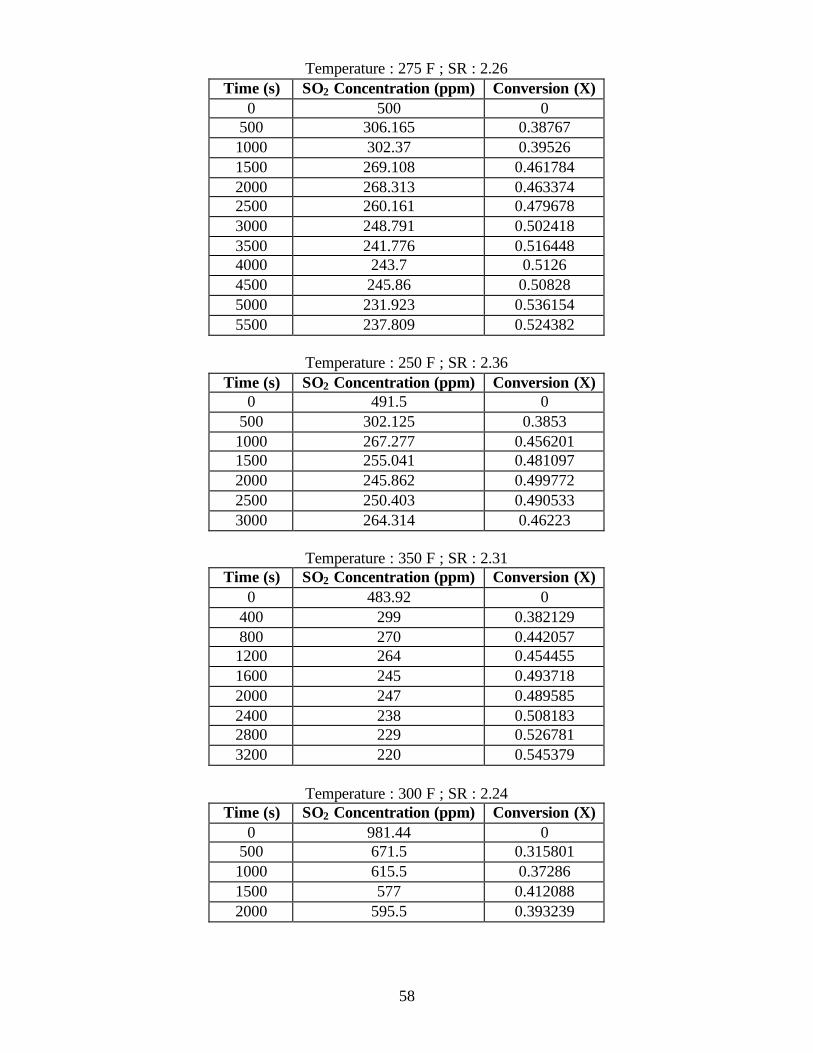
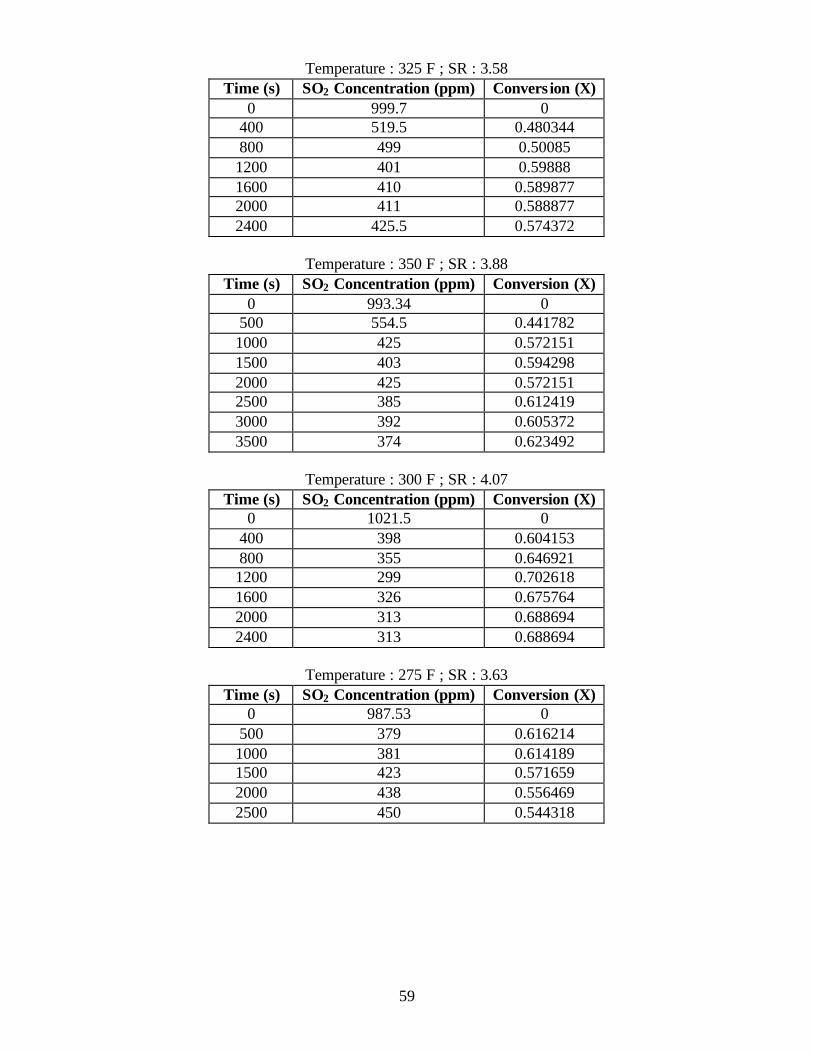
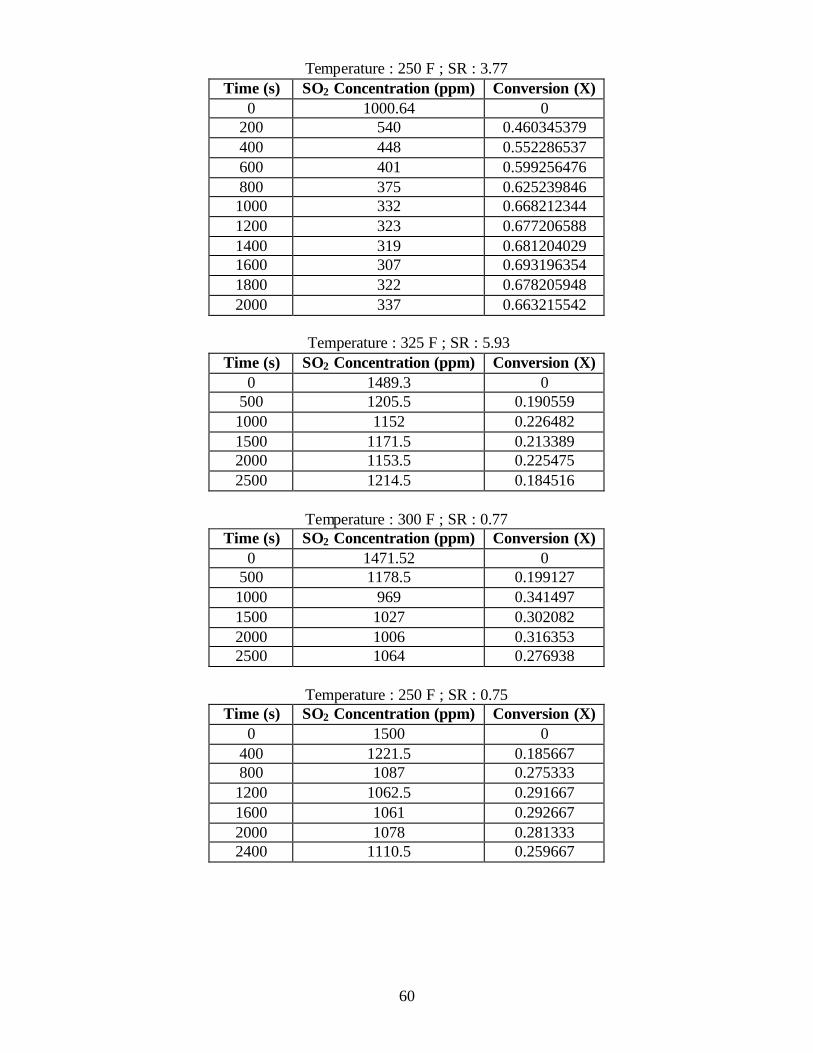
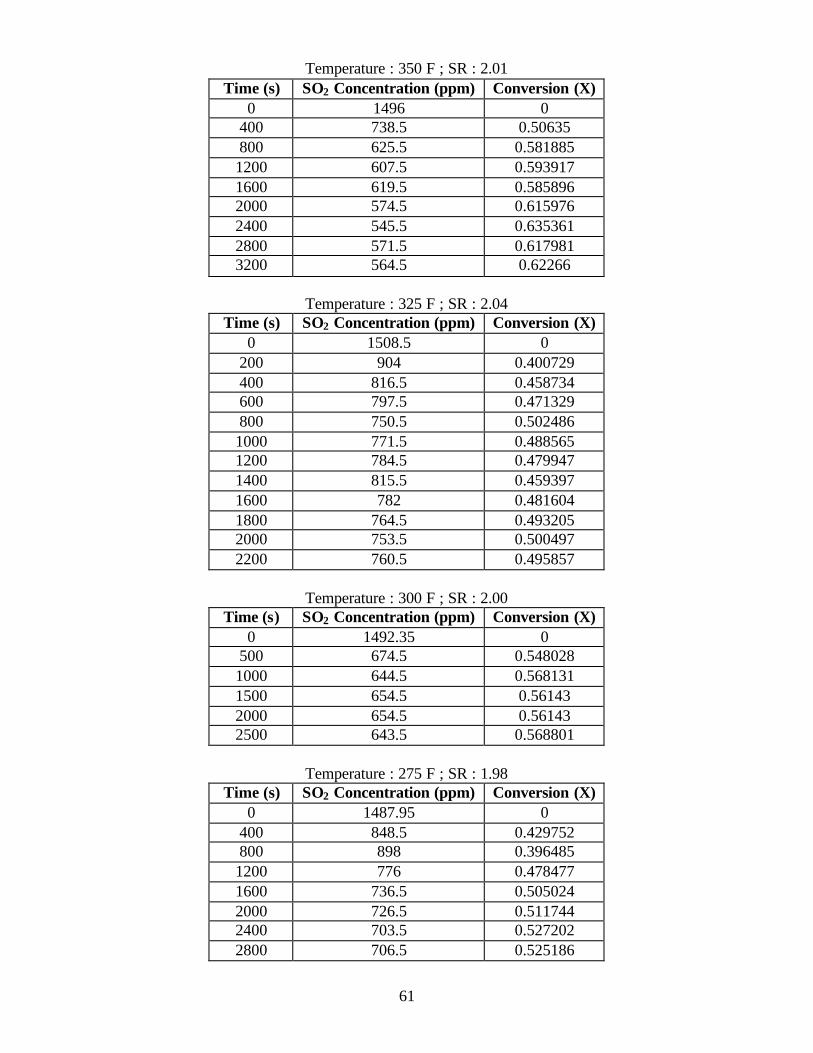
APPENDIX 1 EXPERIMENTAL DATA
The following tables show the experimental data that was used to arrive at the conversion
plots. Data on the temperature and outlet SO2 concentration is recorded every second by the data
acquisition system.
Temperature : 275 F ; SR : 6.05 Time (s) SO2 Concentration (ppm) Conversion (X)
0 472.28 0 400 219.062 0.537431 800 194.053 0.590385 1200 142.261 0.700049 1600 157.029 0.668779 2000 153.098 0.677103 2400 134.226 0.717062 2800 134.274 0.71696 3200 123.205 0.740398 3600 123.03 0.740768 4000 109.292 0.769857
Temperature : 350 F ; SR : 5.2
Time (s) SO2 Concentration (ppm) Conversion (X) 0 530.88 0
400 258.054 0.513913 800 209.998 0.604434 1200 195.241 0.632231 1600 184.042 0.653327 2000 195.877 0.631033 2400 165.122 0.688965 2800 165.132 0.688947 3200 181.904 0.657354
Temperature : 325 F ; SR : 5.93
Time (s) SO2 Concentration (ppm) Conversion (X) 0 465.28 0
500 185.101 0.602173 1000 149.165 0.679408 1500 124.227 0.733006 2000 123.257 0.735091 2500 104.027 0.776421 3000 96.989 0.791547 3500 101.847 0.781106
54
Temperature : 325 F ; SR : 2.49 Time (s) SO2 Concentration (ppm) Conversion (X)
0 1088.38 0 400 634.844 0.416707 800 557.448 0.487819 1200 563.957 0.481838 1600 575.206 0.471503 2000 562.35 0.483315 2400 555.866 0.489272 2800 560.163 0.485324 3200 593.449 0.454741
Temperature : 275 F ; SR : 2.73
Time (s) SO2 Concentration (ppm) Conversion (X) 0 1013.91 0
500 683.821 0.32556 1000 622.874 0.385671 1500 550.869 0.456688 2000 573.888 0.433985 2500 600.794 0.407448
Temperature : 250 F ; SR : 5.8
Time (s) SO2 Concentration (ppm) Conversion (X) 0 474.4 0
400 170.527 0.640542 800 156.728 0.669629 1200 133.459 0.718678 1600 124.48 0.737605 2000 161.841 0.658851 2400 160.716 0.661223 2800 124.42 0.737732
Temperature : 250 F ; SR : 2.82
Time (s) SO2 Concentration (ppm) Conversion (X) 0 1018.6 0
400 553.228 0.456874 800 463.136 0.545321 1200 478.213 0.530519 1600 408.37 0.599087 2000 461.041 0.547378 2400 495.34 0.513705
55
Temperature : 350 F ; SR : 2.48 Time (s) SO2 Concentration (ppm) Conversion (X)
0 1150.03 0 500 649.791 0.434979 1000 620.651 0.460318 1500 607.915 0.471392 2000 588.18 0.488552 2500 654.74 0.430676
Temperature : 300 F ; SR : 5.24
Time (s) SO2 Concentration (ppm) Conversion (X) 0 489.67 0
400 205.015 0.58132 800 187.497 0.617095 1200 189.046 0.613932 1600 208.87 0.573447 2000 183.041 0.626195 2400 166.062 0.66087 2800 171.725 0.649305 3200 180.915 0.630537
Temperature : 300 F ; SR : 8.97
Time (s) SO2 Concentration (ppm) Conversion (X) 0 494.51 0
400 138.209 0.720513 800 115.228 0.766986 1200 107.335 0.782947 1600 102.313 0.793102 2000 105.185 0.787294 2400 94.246 0.809415 2800 102.277 0.793175 3200 106.3 0.78504
Temperature : 350 F ; SR : 9.15
Time (s) SO2 Concentration (ppm) Conversion (X) 0 502.09 0
400 160.098 0.681137 800 97.341 0.806128 1200 111.12 0.778685 1600 96.425 0.807953 2000 93.428 0.813922

56
Temperature : 275 F ; SR : 9.39 Time (s) SO2 Concentration (ppm) Conversion (X)
0 490.54 0.00 400 129.125 0.74 800 103.283 0.79 1200 98.241 0.80 1600 95.312 0.81 2000 91.236 0.81
Temperature : 250 F ; SR : 9.33
Time (s) SO2 Concentration (ppm) Conversion (X) 0 506.14 0
200 163.128 0.677702 400 115.241 0.772314 600 100.398 0.80164 800 97.239 0.807881 1000 93.351 0.815563 1200 92.305 0.81763 1400 98.259 0.805866 1600 96.909 0.808533 1800 96.387 0.809565 2000 94.234 0.813818
Temperature : 325 F ; SR : 9.39
Time (s) SO2 Concentration (ppm) Conversion (X) 0 499.6 0
400 148.095 0.703573 800 133.182 0.733423 1200 122.405 0.754994 1600 108.429 0.782968 2000 105.249 0.789333 2400 101.234 0.79737 2800 100.363 0.799113
Temperature : 300 F ; SR : 6.21
Time (s) SO2 Concentration (ppm) Conversion (X) 0 495.52 0.00
300 130.359 0.74 600 87.224 0.82 900 79.389 0.84 1200 76.255 0.85 1500 76.27 0.85 1800 75.413 0.85

57
Temperature : 300 F ; SR : 1.5 Time (s) SO2 Concentration (ppm) Conversion (X)
0 508.63 0.00 300 313.122 0.38 600 288.024 0.43 900 293.006 0.42 1200 325.173 0.36 1500 323.236 0.36 1800 291.392 0.43
Temperature : 300 F ; SR : 2.9
Time (s) SO2 Concentration (ppm) Conversion (X) 0 484.5 0.00
400 194.916 0.60 800 189.063 0.61 1200 179.025 0.63 1600 186.029 0.62 2000 172.154 0.64 2400 172.148 0.64 2800 160.088 0.67 3200 154.019 0.68 3600 147.166 0.70 4000 140.454 0.71 4400 135.239 0.72
Temperature : 300 F ; SR : 2.36
Time (s) SO2 Concentration (ppm) Conversion (X) 0 479.7 0
400 201.05 0.580884 800 177.184 0.630636 1200 183.104 0.618295 1600 173.983 0.637309 2000 191.159 0.601503 2400 201.08 0.580821 2800 191.097 0.601632
Temperature : 325 F ; SR : 2.1
Time (s) SO2 Concentration (ppm) Conversion (X) 0 499.3 0
200 303.365 0.392419 400 290.162 0.418862 600 290.137 0.418912 800 292.089 0.415003 1000 292.447 0.414286 1200 292.26 0.414661
58
Temperature : 275 F ; SR : 2.26 Time (s) SO2 Concentration (ppm) Conversion (X)
0 500 0 500 306.165 0.38767 1000 302.37 0.39526 1500 269.108 0.461784 2000 268.313 0.463374 2500 260.161 0.479678 3000 248.791 0.502418 3500 241.776 0.516448 4000 243.7 0.5126 4500 245.86 0.50828 5000 231.923 0.536154 5500 237.809 0.524382
Temperature : 250 F ; SR : 2.36
Time (s) SO2 Concentration (ppm) Conversion (X) 0 491.5 0
500 302.125 0.3853 1000 267.277 0.456201 1500 255.041 0.481097 2000 245.862 0.499772 2500 250.403 0.490533 3000 264.314 0.46223
Temperature : 350 F ; SR : 2.31
Time (s) SO2 Concentration (ppm) Conversion (X) 0 483.92 0
400 299 0.382129 800 270 0.442057 1200 264 0.454455 1600 245 0.493718 2000 247 0.489585 2400 238 0.508183 2800 229 0.526781 3200 220 0.545379
Temperature : 300 F ; SR : 2.24
Time (s) SO2 Concentration (ppm) Conversion (X) 0 981.44 0
500 671.5 0.315801 1000 615.5 0.37286 1500 577 0.412088 2000 595.5 0.393239
59
Temperature : 325 F ; SR : 3.58 Time (s) SO2 Concentration (ppm) Convers ion (X)
0 999.7 0 400 519.5 0.480344 800 499 0.50085 1200 401 0.59888 1600 410 0.589877 2000 411 0.588877 2400 425.5 0.574372
Temperature : 350 F ; SR : 3.88
Time (s) SO2 Concentration (ppm) Conversion (X) 0 993.34 0
500 554.5 0.441782 1000 425 0.572151 1500 403 0.594298 2000 425 0.572151 2500 385 0.612419 3000 392 0.605372 3500 374 0.623492
Temperature : 300 F ; SR : 4.07
Time (s) SO2 Concentration (ppm) Conversion (X) 0 1021.5 0
400 398 0.604153 800 355 0.646921 1200 299 0.702618 1600 326 0.675764 2000 313 0.688694 2400 313 0.688694
Temperature : 275 F ; SR : 3.63
Time (s) SO2 Concentration (ppm) Conversion (X) 0 987.53 0
500 379 0.616214 1000 381 0.614189 1500 423 0.571659 2000 438 0.556469 2500 450 0.544318
60
Temperature : 250 F ; SR : 3.77 Time (s) SO2 Concentration (ppm) Conversion (X)
0 1000.64 0 200 540 0.460345379 400 448 0.552286537 600 401 0.599256476 800 375 0.625239846 1000 332 0.668212344 1200 323 0.677206588 1400 319 0.681204029 1600 307 0.693196354 1800 322 0.678205948 2000 337 0.663215542
Temperature : 325 F ; SR : 5.93
Time (s) SO2 Concentration (ppm) Conversion (X) 0 1489.3 0
500 1205.5 0.190559 1000 1152 0.226482 1500 1171.5 0.213389 2000 1153.5 0.225475 2500 1214.5 0.184516
Temperature : 300 F ; SR : 0.77
Time (s) SO2 Concentration (ppm) Conversion (X) 0 1471.52 0
500 1178.5 0.199127 1000 969 0.341497 1500 1027 0.302082 2000 1006 0.316353 2500 1064 0.276938
Temperature : 250 F ; SR : 0.75
Time (s) SO2 Concentration (ppm) Conversion (X) 0 1500 0
400 1221.5 0.185667 800 1087 0.275333 1200 1062.5 0.291667 1600 1061 0.292667 2000 1078 0.281333 2400 1110.5 0.259667
61
Temperature : 350 F ; SR : 2.01 Time (s) SO2 Concentration (ppm) Conversion (X)
0 1496 0 400 738.5 0.50635 800 625.5 0.581885 1200 607.5 0.593917 1600 619.5 0.585896 2000 574.5 0.615976 2400 545.5 0.635361 2800 571.5 0.617981 3200 564.5 0.62266
Temperature : 325 F ; SR : 2.04
Time (s) SO2 Concentration (ppm) Conversion (X) 0 1508.5 0
200 904 0.400729 400 816.5 0.458734 600 797.5 0.471329 800 750.5 0.502486 1000 771.5 0.488565 1200 784.5 0.479947 1400 815.5 0.459397 1600 782 0.481604 1800 764.5 0.493205 2000 753.5 0.500497 2200 760.5 0.495857
Temperature : 300 F ; SR : 2.00
Time (s) SO2 Concentration (ppm) Conversion (X) 0 1492.35 0
500 674.5 0.548028 1000 644.5 0.568131 1500 654.5 0.56143 2000 654.5 0.56143 2500 643.5 0.568801
Temperature : 275 F ; SR : 1.98
Time (s) SO2 Concentration (ppm) Conversion (X) 0 1487.95 0
400 848.5 0.429752 800 898 0.396485 1200 776 0.478477 1600 736.5 0.505024 2000 726.5 0.511744 2400 703.5 0.527202 2800 706.5 0.525186

62
Temperature : 250 F ; SR : 2.06 Time (s) SO2 Concentration (ppm) Conversion (X)
0 1495 0 400 812.5 0.456522 800 637.5 0.573579 1200 595.5 0.601672 1600 557.5 0.62709 2000 544.5 0.635786 2400 530.5 0.645151

63
APPENDIX 2 MODEL CALCULATION
The following fig. shows an example of pore plugging model fit. X is the conversion at
time t. The following mathematical expression represents the pore plugging model.
−−=
∞XXt
1lnτ
The technique for estimating the value of X∞ is to maximize the correlation coefficient
for various assumed values of X∞. The initial value of X∞ is assumed to be the final value of X
plus an incremental value. The final X∞ is the one that gave the highest R-squared value for this
plot.
Fig. 38. Pore plugging model fit (Inlet SO2 concentration : 500 ppm)
0 1000 2000 3000 4000Time (s)
0
1
2
3
4
5
-ln(
1-(X
/X4
))
R-squared = 0.986Temperature : 250 FSR : 2-4Xµ =0.51
The following table gives the R-squared values for the different assumed values of X∞.
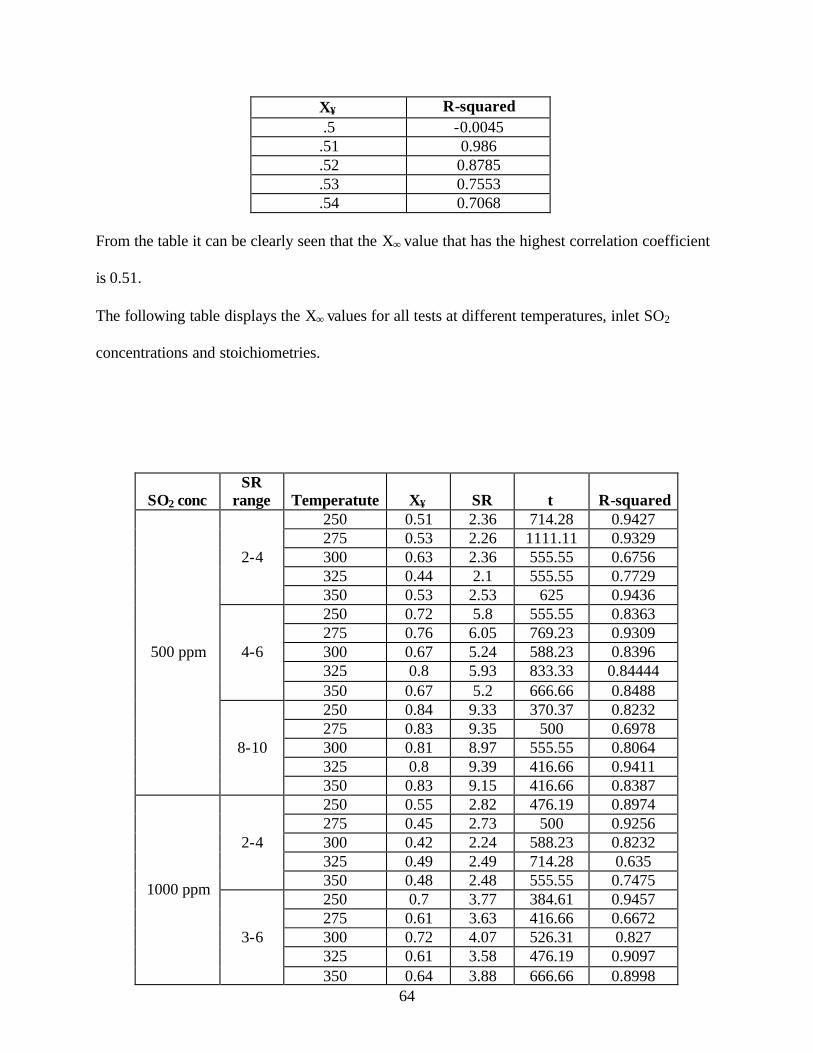
64
X∞ R-squared .5 -0.0045 .51 0.986 .52 0.8785 .53 0.7553 .54 0.7068
From the table it can be clearly seen that the X∞ value that has the highest correlation coefficient is 0.51. The following table displays the X∞ values for all tests at different temperatures, inlet SO2 concentrations and stoichiometries.
SO2 conc SR
range Temperatute X∞ SR t R-squared 250 0.51 2.36 714.28 0.9427 275 0.53 2.26 1111.11 0.9329 300 0.63 2.36 555.55 0.6756 325 0.44 2.1 555.55 0.7729
2-4
350 0.53 2.53 625 0.9436 250 0.72 5.8 555.55 0.8363 275 0.76 6.05 769.23 0.9309 300 0.67 5.24 588.23 0.8396 325 0.8 5.93 833.33 0.84444
4-6
350 0.67 5.2 666.66 0.8488 250 0.84 9.33 370.37 0.8232 275 0.83 9.35 500 0.6978 300 0.81 8.97 555.55 0.8064 325 0.8 9.39 416.66 0.9411
500 ppm
8-10
350 0.83 9.15 416.66 0.8387 250 0.55 2.82 476.19 0.8974 275 0.45 2.73 500 0.9256 300 0.42 2.24 588.23 0.8232 325 0.49 2.49 714.28 0.635
2-4
350 0.48 2.48 555.55 0.7475 250 0.7 3.77 384.61 0.9457 275 0.61 3.63 416.66 0.6672 300 0.72 4.07 526.31 0.827 325 0.61 3.58 476.19 0.9097
1000 ppm
3-6
350 0.64 3.88 666.66 0.8998

65
SO2 conc SR
range Temperatute X∞ SR t R-squared 250 0.3 0.75 526.31 0.4096 300 0.23 0.77 476.19 0.8993 0-2 325 0.34 0.79 714.28 0.9642 250 0.67 2.06 555.55 0.9519 275 0.53 1.98 526.31 0.8758 300 0.6 2 500 0.8155 325 0.51 2.04 454.54 0.8516
1500 ppm
2-4
350 0.65 2.01 666.66 0.9169 6.2 300 0.87 6.21 333.33 0.8638 1.5 300 0.43 1.5 476.19 0.5841 <38 µ
(500 ppm) 2.9 300 0.71 2.9 1000 0.7632
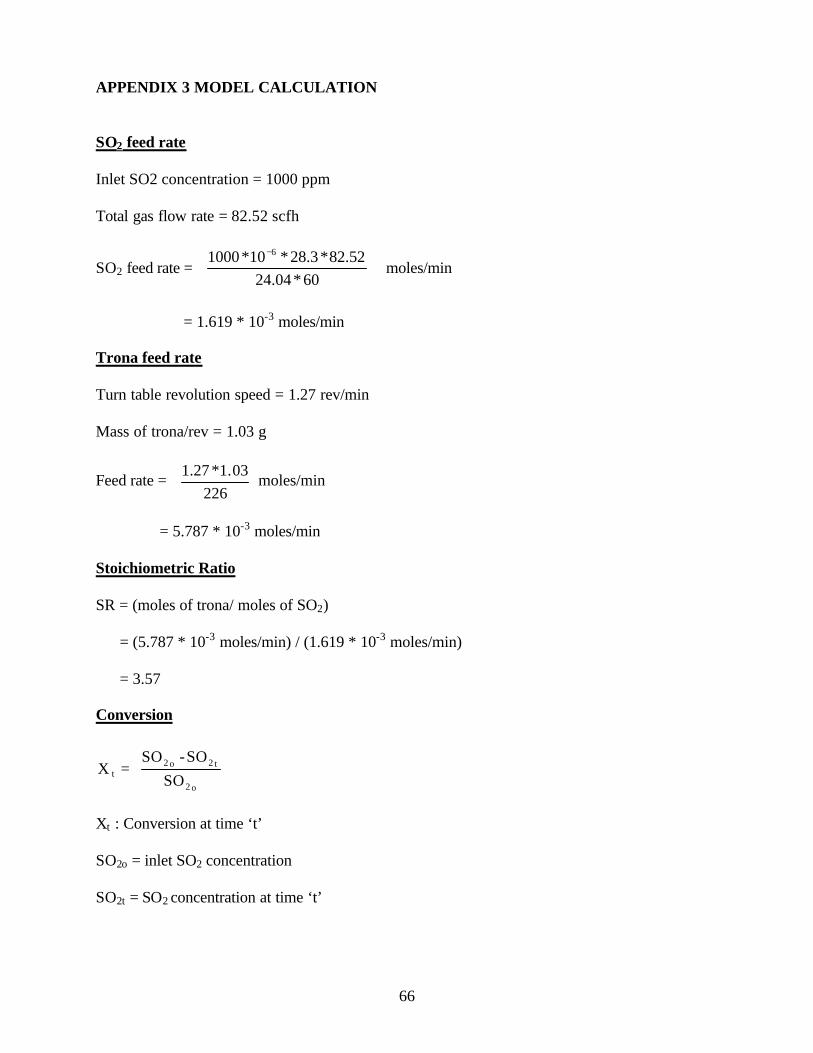
66
APPENDIX 3 MODEL CALCULATION SO2 feed rate
Inlet SO2 concentration = 1000 ppm
Total gas flow rate = 82.52 scfh
SO2 feed rate =
−
60*04.2452.82*3.28*10*1000 6
moles/min
= 1.619 * 10-3 moles/min
Trona feed rate
Turn table revolution speed = 1.27 rev/min
Mass of trona/rev = 1.03 g
Feed rate =
22603.1*27.1
moles/min
= 5.787 * 10-3 moles/min
Stoichiometric Ratio
SR = (moles of trona/ moles of SO2)
= (5.787 * 10-3 moles/min) / (1.619 * 10-3 moles/min)
= 3.57
Conversion
=
o2
t2o2t SO
SO - SOX
Xt : Conversion at time ‘t’
SO2o = inlet SO2 concentration
SO2t = SO2 concentration at time ‘t’