COUNTRY PROFILE Sri Lanka Our quarterly Country Report on Sri Lanka analyses current trends. This annual Country Profile provides background economic and political information 1997-98 The Economist Intelligence Unit 15 Regent Street, London SW1Y 4LR United Kingdom

Welcome message from author
This document is posted to help you gain knowledge. Please leave a comment to let me know what you think about it! Share it to your friends and learn new things together.
Transcript
COUNTRY PROFILE
Sri LankaOur quarterly Country Report on Sri Lanka analyses currenttrends. This annual Country Profile provides backgroundeconomic and political information
1997-98The Economist Intelligence Unit15 Regent Street, London SW1Y 4LRUnited Kingdom
The Economist Intelligence Unit
The Economist Intelligence Unit is a specialist publisher serving companies establishing and managingoperations across national borders. For over 50 years it has been a source of information on businessdevelopments, economic and political trends, government regulations and corporate practice worldwide.
The EIU delivers its information in four ways: through subscription products ranging from newslettersto annual reference works; through specific research reports, whether for general release or for particularclients; through electronic publishing; and by organising conferences and roundtables. The firm is amember of The Economist Group.
London New York Hong KongThe Economist Intelligence Unit The Economist Intelligence Unit The Economist Intelligence Unit15 Regent Street The Economist Building 25/F, Dah Sing Financial CentreLondon 111 West 57th Street 108 Gloucester RoadSW1Y 4LR New York Wanchai United Kingdom NY 10019, USA Hong KongTel: (44.171) 830 1000 Tel: (1.212) 554 0600 Tel: (852) 2802 7288Fax: (44.171) 499 9767 Fax: (1.212) 586 1181/2 Fax: (852) 2802 7638e-mail: [email protected] e-mail: [email protected] e-mail: [email protected]
Website: http://www.eiu.com
Electronic deliveryEIU ElectronicNew York: Lou Celi or Lisa Hennessey Tel: (1.212) 554 0600 Fax: (1.212) 586 0248London: Moya Veitch Tel: (44.171) 830 1007 Fax: (44.171) 830 1023
This publication is available on the following electronic and other media:
Online databases CD-ROM Microfilm
FT Profile (UK) Knight-Ridder Information World Microfilms Publications (UK)Tel: (44.171) 825 8000 Inc (USA) Tel: (44.171) 266 2202
DIALOG (USA) SilverPlatter (USA) University Microfilms Inc (USA)Tel: (1.415) 254 7000 Tel: (1.800) 521 0600
LEXIS-NEXIS (USA)Tel: (1.800) 227 4908
Copyright© 1997 The Economist Intelligence Unit Limited. All rights reserved. Neither this publication nor any part of it may be reproduced, stored in a retrieval system, or transmitted in any form or by anymeans, electronic, mechanical, photocopying, recording or otherwise, without the prior permission of The Economist Intelligence Unit Limited.
All information in this report is verified to the best of the author’s and the publisher’s ability. However,the EIU does not accept responsibility for any loss arising from reliance on it.
Symbols for tables“n/a” means not available; “–” means not applicable
Printed and distributed by Redhouse Press Ltd, Unit 151, Dartford Trade Park, Dartford, Kent DA1 1QB, UK
ISSN 0269-5073
October 15, 1997 Contents
2 Basic data
3 Political background3 Historical background6 Constitution and institutions8 Political forces9 International relations and defence
10 The economy10 Economic structure11 Economic policy14 Economic performance16 Regional trends
17 Resources17 Population18 Education19 Health20 Natural resources and the environment
21 Economic infrastructure21 Transport and communications23 Energy provision24 Financial services28 Other services
29 Production29 Manufacturing30 Mining31 Agriculture33 Construction
33 The external sector33 Merchandise trade35 Invisibles and the current account36 Capital flows and foreign debt37 Foreign reserves and the exchange rate
38 Appendices38 Sources of information39 Reference tables
1
EIU Country Profile 1997-98 © The Economist Intelligence Unit Limited 1997

Sri Lanka
Basic data
Land area 65,610 sq km
Population 18.3 million (mid-1996 estimate)
Main towns Population in ’000, 1990 estimates
Colombo 615 Jaffna 129Dehiwala-Mount Lavinia 193 Kandy 104Moratuwa 170 Galle 84
Climate Tropical
Weather in Colombo Hottest month, May, 26-31°C (average daily minimum); coldest month,December, 22-29°C; driest month, February, 69 mm average rainfall; wettestmonth, May, 371 mm average rainfall
Languages Sinhala, Tamil, English
Measures Metric system is displacing the UK (imperial) system. Local measure for copra:1 candy=254 kg; rice “measure”=2 lb
Currency Rupee (SLRs)=100 cents. Average exchange rate in 1996: SLRs55.27:$1.Exchange rate on October 15, 1997: SLRs59.53:$1.
Time 5 hours ahead of GMT
Fiscal year January-December
Public holidays in 1997 January 14 (Thai-pongal Day), January 23 (Duruthu Full Moon Poya), February 4(Sri Lanka National Day), February 9 (Ramadan Festival Day), February 21(Navam Full Moon Day), March 23 (Medin Full Moon Day), March 28 (GoodFriday), April 13 (Day before Sinhala & Tamil New Year Day), April 14 (Sinhala& Tamil New Year Day), April 22 (Bak Full Moon Day), May 1 (May Day),May 21 (Vesak Full Moon Day), May 22 (Day following Vesak Full Moon Day),June 20 (Poson Full Moon Day), July 18 (Holy Prophet’s Birth Day), July 19(Esala Full Moon Day), August 18 (Nikini Full Moon Day), September 16(Binara Full Moon Day), October 15 (Vap Full Moon Day), October 30(Deepavali Festival), November 14 (Il Full Moon Day), December 13 (UnduvapFull Moon Day), December 25 (Christmas Day)
2 Sri Lanka: Basic data
EIU Country Profile 1997-98 © The Economist Intelligence Unit Limited 1997
Political background
Historical background
History Sri Lanka was ruled by the Portuguese in the 16th century. In the 17th centurythe Dutch superseded the Portuguese, only to be ousted by the British at theend of the following century. Pressure for independence built up in the firsthalf of the 20th century. Sri Lanka (then known as Ceylon) became fullyindependent on February 4, 1948, although it remained a member of theCommonwealth.
The origins of the ethnicconflict lie in the colonial
period
The ethnic question has played a major role in Sri Lankan politics since inde-pendence. The immediate origins of the conflict lie in attempts by the majoritySinhalese to reverse what was seen as the excessive influence of Tamils beforeindependence. After the 1956 election, the Sinhalese-dominated government,seeking to overturn the previous dominance of English, made Sinhala theofficial language, which precipitated antagonism between Tamils andSinhalese. In 1958 the first intercommunal riots occurred. Tension between thetwo groups grew during the 1960s and 1970s; the Tamils sought to obtain afederal system of government and became alienated when this was refused bysuccessive governments.
Sinhalese extremistsemerged in the 1960s
In addition, economic policy, strongly influenced by socialist ideals and plan-ning, failed to provide adequate employment, particularly among educatedyouth. This led to the formation in the late 1960s of the People’s LiberationFront (Janatha Vimukthi Peramuna, JVP), which combined left-wing Marxistradicalism and Sinhalese extremism. In 1971 the first youth uprising occurred;although it was swiftly quelled, sporadic outbreaks of violence involvingextreme Tamils and the JVP erupted during the 1970s.
In the 1980s the LTTEturned to terrorism—
The failure of Tamil political parties to attain their aims by peaceful means ledto demands for an independent Tamil state, to be known as Eelam, and to theformation of terrorist groups dedicated to achieving this goal. Repressive actionby government troops only increased tension. Moderate Tamil parties began tolose influence as the situation deteriorated in the early 1980s. In 1983 a violentoutburst of intercommunal rioting occurred; as a result many Tamils fled thecountry and the more militant Tamil groups gained support. By 1987 the mainTamil terrorist group, the Liberation Tigers of Tamil Eelam (LTTE, or TamilTigers), led by Velupillai Prabhakaran, effectively controlled the northernpeninsula and the city of Jaffna.
—and India intervened— In May 1987 the army launched a full-scale offensive in the north. Underpolitical pressure from the Tamils in the southern Indian state of Tamil Nadu,India was drawn into Sri Lanka’s ethnic conflict and sent aid to the Tamilrebels. To avoid possible armed intervention by India, the Sri Lankan govern-ment held talks with the Indian prime minister at the time, Rajiv Gandhi. Theresulting Indo-Sri Lankan peace accord provided for the formation of provin-cial governments to which limited powers would be devolved. Sri Lanka’s
Sri Lanka: Historical background 3
EIU Country Profile 1997-98 © The Economist Intelligence Unit Limited 1997
Northern and Eastern provinces, corresponding to the Tamils’ desired Eelam,were provisionally united pending a referendum (which has yet to be held) todecide whether the union should be permanent.
—deploying its troopsagainst the Tigers—
The Sri Lankan army was to withdraw and the Tamil groups were to laydown their arms, and the Indian Peace Keeping Force (IPKF) was established toguarantee the end of the fighting. The Tigers, however, accepted the accord onlyreluctantly, and soon resumed their offensive. The IPKF was then deployedagainst the Tigers and took their stronghold of Jaffna, relegating the LTTEtemporarily to a guerrilla role.
—until Mr Premadasaordered them out and
negotiated with the LTTE
The presidential election in December 1988 brought the former prime minister,Ranasinghe Premadasa, to power. This was followed by a parliamentary electionin February 1989. The new president, openly critical of the peace accord,ordered the IPKF to withdraw and embarked on direct negotiations with theTigers. As the IPKF carried out a staged withdrawal, finally leaving in March1990, the Tigers reclaimed effective power in the Jaffna peninsula.
The second JVP uprisingparalysed the country
In 1989 the country was gripped by another, more serious wave of terror andviolence inspired this time by the JVP. Aided by unofficial vigilante groups, thesecurity forces reacted ruthlessly, imposing their own brand of terror. AmnestyInternational estimated that around 60,000 people lost their lives in extra-judicial killings, committed either by the JVP or by the security forces. Thecampaign was finally brought to an end in November 1989 by the capture andexecution of most of the JVP leaders.
The Tigers resumed theiroffensive in 1990
Uneasy negotiations with the Tigers continued throughout the first half of1990, but fighting broke out again in June. In the Eastern province the armywas able to gain control of the towns relatively quickly. In the north the Tigersproved to be more difficult to overcome, although the army had some successin containing their activities.
In 1993 Mr Premadasa wasassassinated—
In 1993 the country was rocked by a double assassination. First, LalithAthulathmudali, the leader of one of the main opposition groups, was shot andkilled. One week later Mr Premadasa was killed by a Tiger suicide bomber. Afterthe assassination the prime minister, Dingiri Banda Wijetunga, served aspresident for the remainder of Mr Premadasa’s term of office. RanilWickremasinghe was appointed prime minister, and his United National Party(UNP) government began cautious constitutional reform.
—and a year later the PAwas voted into power
After suffering political reverses, the UNP government decided to bring forwardthe general election to August 1994, having first announced a generous newwelfare programme. The UNP lost the election. The incoming People’s Alliance(PA) administration, however, is one seat short of an overall majority in parlia-ment and depends on two ethnic minority parties, one Tamil and one Muslim,to remain in power. Chandrika Kumaratunga, the daughter of two formerprime ministers, Solomon and Sirimavo Bandaranaike, and the deputy leaderof the largest party in the PA, the Sri Lanka Freedom Party (SLFP), was ap-pointed prime minister.
4 Sri Lanka: Historical background
EIU Country Profile 1997-98 © The Economist Intelligence Unit Limited 1997
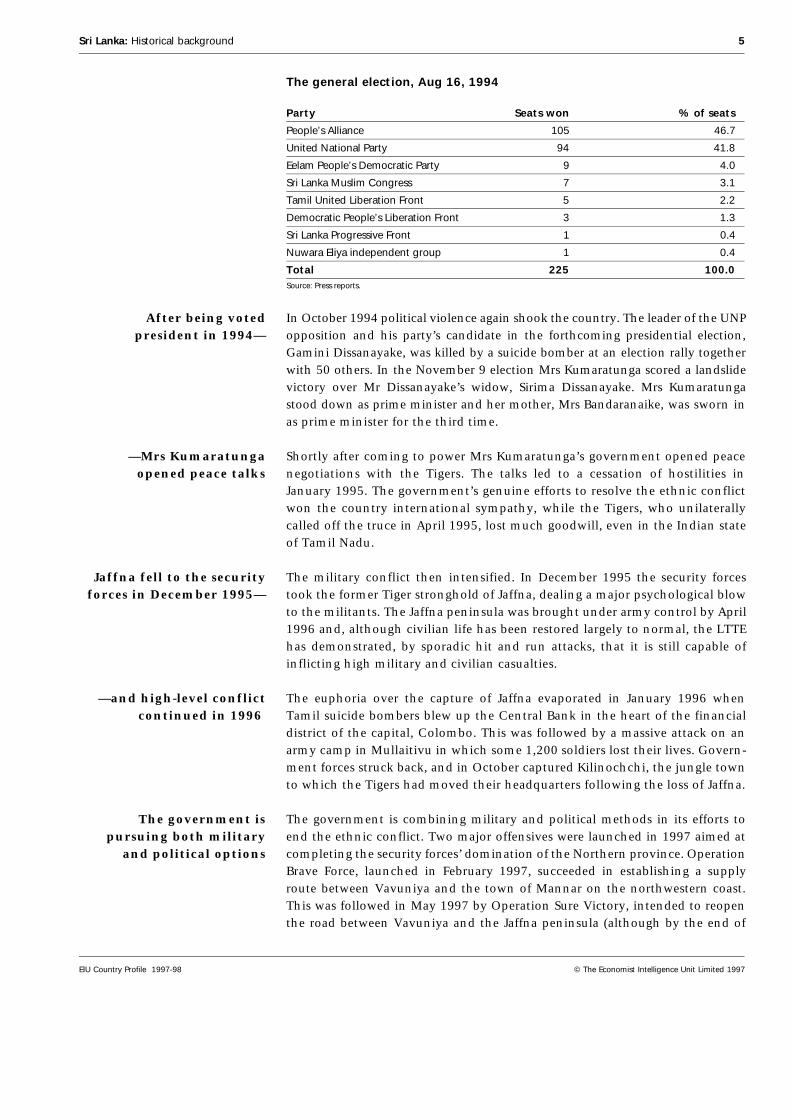
The general election, Aug 16, 1994
Party Seats won % of seats
People’s Alliance 105 46.7
United National Party 94 41.8
Eelam People’s Democratic Party 9 4.0
Sri Lanka Muslim Congress 7 3.1
Tamil United Liberation Front 5 2.2
Democratic People’s Liberation Front 3 1.3
Sri Lanka Progressive Front 1 0.4
Nuwara Eliya independent group 1 0.4
Total 225 100.0Source: Press reports.
After being votedpresident in 1994—
In October 1994 political violence again shook the country. The leader of the UNPopposition and his party’s candidate in the forthcoming presidential election,Gamini Dissanayake, was killed by a suicide bomber at an election rally togetherwith 50 others. In the November 9 election Mrs Kumaratunga scored a landslidevictory over Mr Dissanayake’s widow, Sirima Dissanayake. Mrs Kumaratungastood down as prime minister and her mother, Mrs Bandaranaike, was sworn inas prime minister for the third time.
—Mrs Kumaratungaopened peace talks
Shortly after coming to power Mrs Kumaratunga’s government opened peacenegotiations with the Tigers. The talks led to a cessation of hostilities inJanuary 1995. The government’s genuine efforts to resolve the ethnic conflictwon the country international sympathy, while the Tigers, who unilaterallycalled off the truce in April 1995, lost much goodwill, even in the Indian stateof Tamil Nadu.
Jaffna fell to the securityforces in December 1995—
The military conflict then intensified. In December 1995 the security forcestook the former Tiger stronghold of Jaffna, dealing a major psychological blowto the militants. The Jaffna peninsula was brought under army control by April1996 and, although civilian life has been restored largely to normal, the LTTEhas demonstrated, by sporadic hit and run attacks, that it is still capable ofinflicting high military and civilian casualties.
—and high-level conflictcontinued in 1996
The euphoria over the capture of Jaffna evaporated in January 1996 whenTamil suicide bombers blew up the Central Bank in the heart of the financialdistrict of the capital, Colombo. This was followed by a massive attack on anarmy camp in Mullaitivu in which some 1,200 soldiers lost their lives. Govern-ment forces struck back, and in October captured Kilinochchi, the jungle townto which the Tigers had moved their headquarters following the loss of Jaffna.
The government ispursuing both military
and political options
The government is combining military and political methods in its efforts toend the ethnic conflict. Two major offensives were launched in 1997 aimed atcompleting the security forces’ domination of the Northern province. OperationBrave Force, launched in February 1997, succeeded in establishing a supplyroute between Vavuniya and the town of Mannar on the northwestern coast.This was followed in May 1997 by Operation Sure Victory, intended to reopenthe road between Vavuniya and the Jaffna peninsula (although by the end of
Sri Lanka: Historical background 5
EIU Country Profile 1997-98 © The Economist Intelligence Unit Limited 1997
September only the first 25 km of the 65-km route had been brought undergovernment control). Despite these efforts, the Tigers remain capable of launch-ing attacks throughout the country—as they proved on October 15, when abomb and fighting in the financial district of Colombo left 18 dead and over 100injured, including several foreign businessmen and tourists.
Meanwhile, the government is pursuing its objective of reaching a politicalsettlement to the ethnic problem through constitutional change, by devolvingmore power to Sri Lanka’s troubled provinces. At local government electionsheld in March 1997, the PA won control of 194 of the 238 assemblies, butreceived only 48.9% of the vote, not the level of popular support which wouldhave enabled it to push these constitutional reforms through parliament on itsown. In April hopes for a political settlement received a boost when an under-standing, brokered by the UK government, was reached between the PA andthe UNP, with both parties agreeing not to undermine the peace effort forpolitical gain. The proposals for constitutional reform and the granting oflimited autonomy to Tamils were to be presented to parliament by November1997. However, by the end of September, cross-party support for the proposalswas waning, and delays seemed probable.
Important recent events
1989: JVP uprising in the south.1990: Phased withdrawal of the Indian Peace Keeping Force begins. Tamil Tigersbreak off peace negotiations in June. 1993: Mr Premadasa is assassinated by a Tamil suicide bomber in May. 1994: The PA is voted into power in parliamentary elections. In October theopposition presidential candidate is assassinated; in November Mrs Kumaratungascores a landslide victory in the presidential election. 1995: Cessation of hostilities in January but Tamil Tigers unilaterally resume fightingin April. Fighting intensifies and Jaffna falls to the security forces in December. 1996: The Central Bank is bombed in January and the Tigers overrun an army campkilling 1,200 soldiers. The army retaliates by intensifying its operations in the east,defeating the Tigers in Kilinochchi.1997: The PA and the UNP agree a bipartisan approach to forging a politicalsettlement to the ethnic conflict. The PA scores a victory at local governmentelections. Two major offensives are launched against the Tigers, one in February andone in May. On October 15 a bomb exploded in the central business district.
Constitution and institutions
Democracy has lastedsince independence
Despite its problems, Sri Lanka has managed to maintain an unbroken recordof democracy since independence. Elections have been held regularly and,although abuses have occurred, these elections have in general been freely andfairly contested. The country passes the critical test of democracy in that elec-tions have on several occasions resulted in a peaceful change of government.
Following independence, the country had a Westminster-style constitutionwith the British monarch as head of state, executive power in the hands of aprime minister governing in cabinet, and a bicameral legislature. In 1972 the
6 Sri Lanka: Constitution and institutions
EIU Country Profile 1997-98 © The Economist Intelligence Unit Limited 1997
country became a republic, although remaining within the Commonwealth.Its name was changed from Ceylon to Sri Lanka and the legislature becameunicameral. Although it had a president as head of state, executive powerremained vested in the prime minister and cabinet.
In 1978 the countryswitched to a presidential
system—
Sweeping changes were made in 1978 after J R Jayewardene became primeminister in 1977. The new constitution introduced a presidential system ofgovernment, with the president combining the roles of head of state, head ofgovernment and head of the armed forces, as well as head of the governingparty. The powers of the prime minister and the cabinet were drastically re-duced. The previous first-past-the-post system of voting was replaced by asystem of modified proportional representation. Mr Jayewardene became thefirst president under the 1978 constitution and held the position for two terms,until the end of 1988. In addition to the national legislature, there are twofurther tiers of government, local and provincial. Provincial governments wereestablished as a result of the Indo-Sri Lankan accord of 1987.
—which the presentgovernment has promised
to abolish
Disenchantment with the powerful executive presidency mounted during theauthoritarian rule of Mr Premadasa and after his assassination there was strongpressure for a return to the non-presidential system of government. In late1994 Mrs Kumaratunga pledged herself to abolish the executive presidencyby July 1995. Draft proposals to end the presidential system and return toWestminster-style rule were tabled in mid-January 1995. These proposals havenot yet been put into action (see The presidency, below).
The presidency
Saddled with a flimsy majority in parliament and self-serving coalition partners,Mrs Kumaratunga can thank the powerful executive presidency she inherited for thesurvival of her government. The power of the presidency has come in useful onseveral occasions when Mrs Kumaratunga has intervened to settle controversialdisputes through executive decisions. Ironically, one of the key election pledges thatswept her party into power was the abolition of the presidency, but practicalconsiderations have delayed its implementation. The government has linked theconstitutional amendment required for this with the more contentious amendmentsbeing considered for greater Tamil autonomy. Should the government fail to receivea mandate to implement the devolution package (which must be approved by atwo-thirds vote of parliament), it has a convenient excuse for its failure to abolish thepresidency.
There are 28 ministries and several other governmental departments andagencies. Sri Lanka has approximately 200 public enterprises encompassing avariety of organisational forms, including commercial enterprises, boards,bureaux, authorities, corporations, agencies and institutes.
The judiciary is independent. The Supreme Court has sole jurisdiction overinterpretation of the constitution and also has the final say in adjudicatingupon charges against the president.
Sri Lanka: Constitution and institutions 7
EIU Country Profile 1997-98 © The Economist Intelligence Unit Limited 1997

Political forces
There are many political parties. The three major parties, all Sinhalese-dominated, are the United National Party (UNP), the Sri Lanka Freedom Party(SLFP) and the Democratic United National Lalith Front (DUNLF). Alliancesbetween these parties and a number of minor parties with leftist leanings arecommon for electoral purposes.
The UNP is facing internaldivisions—
The UNP was in power from independence to 1956, from 1965 to 1970 andfrom 1977 to 1994, when it became the first party to embrace free-marketeconomics. Banished to the opposition benches after 17 consecutive years inoffice, the UNP leadership under the command of Mr Wickremasinghe is seek-ing to infuse new life into the party by recruiting young professionals andtechnocrats. However, internal divisions have debilitated the UNP, which hasmounted little challenge to the PA.
—while the SLFP leads theruling coalition—
The SLFP was founded in 1951 by Solomon Bandaranaike and won the 1956general election. It has its roots in Sinhalese nationalism. Mr Bandaranaike wasassassinated in 1959, and was succeeded in 1960 by his widow, Sirimavo, who
Main political figures
Chandrika Kumaratunga: The president’s genuine effortsto resolve the ethnic crisis and accelerate economic reformshave been thwarted by the intransigence of the Tigers andlack of support for her economic policies among her coalitionpartners. Her popularity among Colombo’s elite and theinvestor community has waned, although she still largelyretains the support of the rural population.
Velupillai Prabhakaran: The LTTE leader’s influencewaned significantly after the government took control of theJaffna peninsula, but Mr Prabhakaran is still a key figure.Should the rebel leader opt for negotiations or—lesslikely—accept a political solution, the impact on the countryin general and on the economy would be instantaneous.
Ranil Wickremasinghe: Head of the opposition UNP. Theonly obvious alternative national leader to Mrs Kumaratunga,he appears in no hurry to dislodge her or her government. Heis concentrating on rebuilding the UNP before making a bid forpower. He also favours giving the present regime more time tomake military progress against the LTTE.
Anuruddha Ratwatte: The deputy defence minister, andgenerally credited with having given the security forces thepolitical backing and motivation that made their campaign inthe north successful, he is one of the most powerfulindividuals in the cabinet, and is said to be one of thecontenders for the premiership.
Sirimavo Bandaranaike: Although physically feeble, thegrand old lady of Sri Lankan politics is a steadying influencein the inexperienced and impetuous PA coalition. The primeminister’s position is especially significant in the executivepresidential system; if the president dies, the prime minister isthe immediate successor.
M H M Ashraff: The ports minister and SLMC leader, andan important member of the PA coalition, he has on morethan one occasion quarrelled with the president andthreatened to quit the coalition. As the leader of a minorityparty, Mr Ashraff’s concerns are communal and regional anddo not always coincide with the priorities of the alliance ingeneral. But, if his party were to quit the alliance, the PAwould be hard-pressed to stay in power.
S Thondaman: The livestock minister and CWC leader, hisobscure portfolio in the cabinet disguises the fact that, likeMr Ashraff, Mr Thondaman is a power broker in the alliance.He also controls the largest trade union in the plantationsector, and is in a position to pressure the government forconcessions.
Srimani Athulathmudali: The leader of the DUNLF, she isanother key coalition partner who can make life difficult forthe alliance. She represents a group of alliance members whoinsist on the abolition of the presidency and who wieldsignificant bargaining power.
8 Sri Lanka: Political forces
EIU Country Profile 1997-98 © The Economist Intelligence Unit Limited 1997
became the world’s first woman prime minister. After being defeated in 1965,the SLFP returned to power from 1970 to 1977, still with Mrs Bandaranaike atits head. Its left-wing economic policies included a far-reaching programme ofnationalisation which sapped much of the economy’s dynamism.
Mrs Kumaratunga has succeeded her mother both as leader of the SLFP and thePeople’s Alliance (PA). She is the widow of Vijaya Kumaratunga, a popular filmstar, who was a leading figure in the United Socialist Alliance (USA), a left-wingamalgam of five small parties. In its current term in office the SLFP, as the coreof the PA, has pursued policies of economic reform, including privatisation andfinancial reforms.
—and the DUNLF is aspent force
The DUNLF was formed in 1991, following the failure of a campaign to im-peach Mr Premadasa and the subsequent expulsion from the UNP of eight ofthe campaign’s leaders. It generally supports the UNP’s economic line, butseeks to curb presidential power. After Mr Athulathmudali’s assassination in1993 the leadership passed to Mr Dissanayake, but in the following months theparty split. Mr Dissanayake and other leaders rejoined the UNP. Some othermembers followed Srimani Athulathmudali, the widow of the murdered leader,into the PA.
Smaller parties largelyrepresent ethnic groupings
There are a number of Tamil parties and groups which remain within the main-stream political system (although none has sufficient support yet to speak forthe Sri Lankan Tamil people as a whole). The largest is the Eelam People’sDemocratic Party (EPDP), which has nine seats in parliament, while the trad-itionally moderate Tamil United Liberation Front (TULF) has five and theDemocratic People’s Liberation Front (DPLF), a former guerrilla group, has three.
The Ceylon Workers’ Congress (CWC) is effectively the party of the IndianTamils. Its leader, S Thondaman, has normally worked with the parties inpower and usually holds a cabinet post.
The Sri Lanka Muslim Congress (SLMC) was formed in 1980, and has operatedas a political party since 1986, to promote the interests of Sri Lankan Muslims.In August 1994 it won seven seats in parliament, enabling it to hold thebalance of power along with other small parties.
While the LTTE can be regarded as an extremist Tamil movement, Sinhaleseextremists have found a home in the Janatha Vimukthi Peramuna (JVP). Itsmost durable base has been among the unemployed youth in the south of theisland. After the killing of its leaders at the end of 1989, the JVP lost much ofits force. Elements of the radical movement still exist and there is concern thatserious discontent could again see the JVP grow in influence.
International relations and defence
Relations with Westerngovernments have
fluctuated
Sri Lanka became strongly pro-Western after 1977 when the economy was liber-alised and substantial quantities of aid flowed into the country. Between 1988and 1993 relations with the West deteriorated owing to the government’s poorrecord on human rights; aid was often linked to this issue. Some governments,such as that of the UK, even imposed an embargo on arms sales to Sri Lanka.
Sri Lanka: International relations and defence 9
EIU Country Profile 1997-98 © The Economist Intelligence Unit Limited 1997
Since 1994 Mrs Kumaratunga’s genuine efforts to resolve the ethnic conflicthave won favour with Western governments and restored international sympa-thy for the country’s fight against the Tamil Tigers; inflows of foreign aid haveagain increased.
Relations with India haveimproved in the 1990s
Relations with the dominant regional power, India, have always been of criticalimportance. Indo-Sri Lankan relations were excellent for over three decades,before the eruption of racial conflict in Sri Lanka in the early 1980s and theemergence of what was perceived as Sri Lanka’s pro-Western foreign policy. Theagreement to permit Voice of America to set up a transmitting station on the is-land and the lease of the Trincomalee Oil Farm to a US-led consortium wereviewed with suspicion by India. Relations between the two countries remaineduneasy after the signing of the Indo-Sri Lankan peace accord in 1987, deteriorat-ing to an all-time low during the presidency of Mr Premadasa, who ordered thewithdrawal of the Indian Peace Keeping Force, starting in 1990. India’s disas-trous military involvement in Sri Lanka’s civil war, and the assass-ination of itsprime minister, Rajiv Gandhi, by the LTTE, led it to adopt a less aggressivestance in Sri Lanka’s ethnic conflict. Relations with India have been restored totheir former cordial levels by the present government, and both countries arenow united against the LTTE.
Defence spending is high Despite the civil war and high defence expenditure, the total size of the armedforces is modest, at 110,000-115,000. This includes a navy of 10,300 men, andan air force of 10,000 (according to the Institute of Strategic Studies). Service isvoluntary. The two operations mounted against the Tigers in 1997 causedheavy losses of men and equipment.
The economy
Economic structure
Agriculture remainsimportant—
Sri Lanka’s economy is still largely agricultural; just under 20% of real GDP isgenerated by this sector (including forestry and fishing), and almost 40% of theisland’s labour force is employed in it. The agriculture sector is dominated bythree export crops—tea, rubber and coconut—and by paddy rice (mostly fordomestic consumption), which together account for over half of agriculturalproduction in value terms.
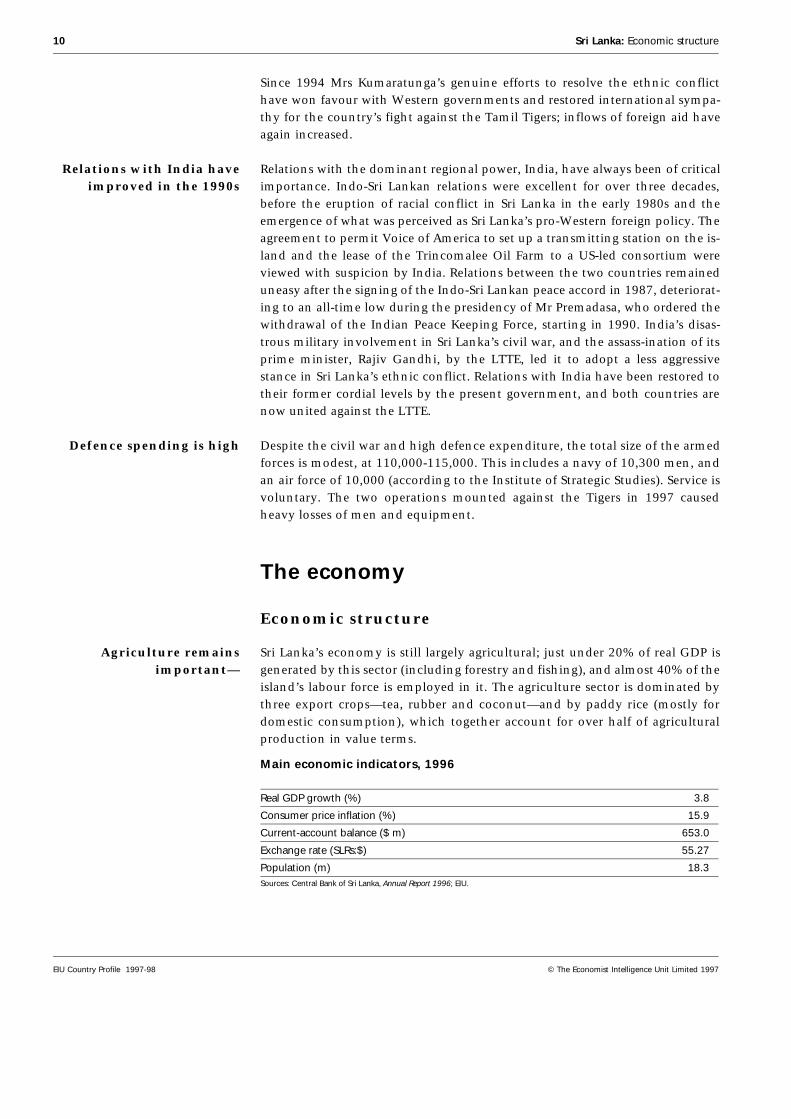
Main economic indicators, 1996
Real GDP growth (%) 3.8
Consumer price inflation (%) 15.9
Current-account balance ($ m) 653.0
Exchange rate (SLRs:$) 55.27
Population (m) 18.3Sources: Central Bank of Sri Lanka, Annual Report 1996; EIU.
10 Sri Lanka: Economic structure
EIU Country Profile 1997-98 © The Economist Intelligence Unit Limited 1997
—but manufacturing’sshare of GDP is larger—
The manufacturing sector has grown rapidly, boosting its share of GDP from18.5% in 1992 to 21% in 1996. Since 1995 manufacturing’s share of GDP hasexceeded that of agriculture. In 1992-96 manufacturing has also emerged as thelead sector underpinning economic growth. Although the country’s manufac-turing base is still dominated by the garment industry (41% of total exports in1996), in recent years the share of other industrial exports, notably jewellery,machinery, and electrical and chemical products, has grown rapidly, from 26%in 1992 to 32% in 1996. Progressive privatisation of state enterprises has en-abled the private sector to dominate manufacturing. Small and medium enter-prises account for nearly 90% of private industrial units.
—and services’ share isgreater still
The services sector accounted for 49.8% of GDP in 1996, and is principallycomposed of wholesale and retail trade, financial services, transport and com-munications, public administration and defence and tourism. The tourismsector remains vulnerable to racial tension on the island.
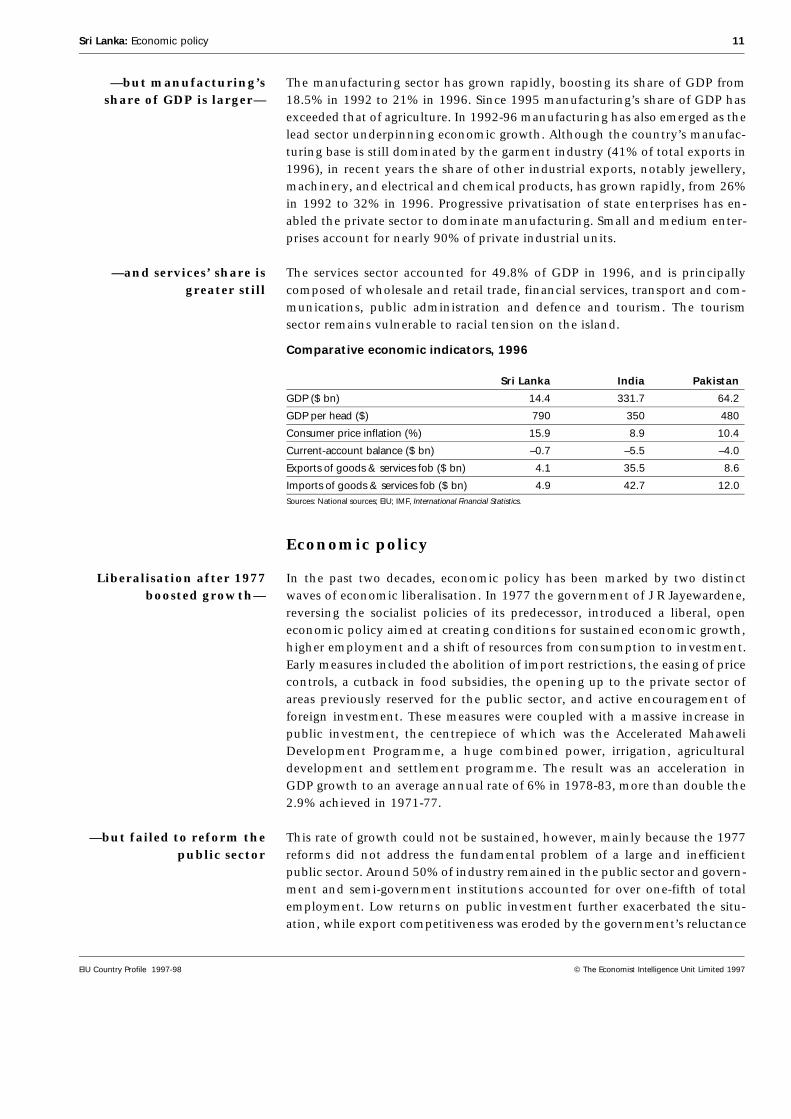
Comparative economic indicators, 1996
Sri Lanka India Pakistan
GDP ($ bn) 14.4 331.7 64.2
GDP per head ($) 790 350 480
Consumer price inflation (%) 15.9 8.9 10.4
Current-account balance ($ bn) –0.7 –5.5 –4.0
Exports of goods & services fob ($ bn) 4.1 35.5 8.6
Imports of goods & services fob ($ bn) 4.9 42.7 12.0Sources: National sources; EIU; IMF, International Financial Statistics.
Economic policy
Liberalisation after 1977boosted growth—
In the past two decades, economic policy has been marked by two distinctwaves of economic liberalisation. In 1977 the government of J R Jayewardene,reversing the socialist policies of its predecessor, introduced a liberal, openeconomic policy aimed at creating conditions for sustained economic growth,higher employment and a shift of resources from consumption to investment.Early measures included the abolition of import restrictions, the easing of pricecontrols, a cutback in food subsidies, the opening up to the private sector ofareas previously reserved for the public sector, and active encouragement offoreign investment. These measures were coupled with a massive increase inpublic investment, the centrepiece of which was the Accelerated MahaweliDevelopment Programme, a huge combined power, irrigation, agriculturaldevelopment and settlement programme. The result was an acceleration inGDP growth to an average annual rate of 6% in 1978-83, more than double the2.9% achieved in 1971-77.
—but failed to reform thepublic sector
This rate of growth could not be sustained, however, mainly because the 1977reforms did not address the fundamental problem of a large and inefficientpublic sector. Around 50% of industry remained in the public sector and govern-ment and semi-government institutions accounted for over one-fifth of totalemployment. Low returns on public investment further exacerbated the situ-ation, while export competitiveness was eroded by the government’s reluctance
Sri Lanka: Economic policy 11
EIU Country Profile 1997-98 © The Economist Intelligence Unit Limited 1997

to adjust the exchange rate. With the escalation in the civil conflict in the northfrom 1983 and the Janatha Vimukthi Peramuna (JVP) terrorist insurgency in thesouth in 1988-89, real annual GDP growth slowed to a mere 2% in 1987-89 andthe country was on the verge of a balance-of-payments crisis.
Further reform in 1989-93paid dividends—
In 1989 a second and more rigorous liberalisation programme was introducedby Ranasinghe Premadasa’s United National Party government. The economicreform programme was supported by an IMF Enhanced Structural AdjustmentFacility (ESAF). Stabilisation measures included a devaluation of the rupee andthe abolition of major subsidies. These were complemented by an ambitiousprivatisation drive. Tax, tariff and trade reforms were also begun, and thecurrent account was freed of exchange controls. GDP growth rose from 2.3% in1989 to 6.9% in 1993.
—but momentum was lostunder the PA
government—
The People’s Alliance (PA) government, elected in 1994, pledged to continuewith the economic reform programme. However, being a coalition of fractiouspolitical parties with differing economic ideologies, the economic policy envi-ronment during the first two years of PA rule was characterised by inconsistentpolicy statements that were not matched by action. For over a year after it cameto power no new privatisations were undertaken. Wheat, flour and fertilisersubsidies were reintroduced which, together with soaring defence expenditure,imposed a severe strain on the budget. Labour unrest reached unprecedentedlevels in early 1995, undermining business confidence. Increased governmentborrowing fuelled a rise in interest rates and inflation climbed to double digitsby the end of 1995. The country’s growth was further crippled by a severedrought and a power crisis in the first half of 1996.
—although there is now astronger effort to
accelerate reforms
In the second half of 1996, the government reinvigorated its policy reforms.The privatisation programme was revived with the sale of six regional plant-ation companies, the steel corporation and two salt companies to privateinvestors. The sale of the remaining plantation companies was to be completedby the end of 1997. In August Japan’s Nippon Telephone and Telegraph boughta 35% stake and full management control of Sri Lanka Telecom. In its budgetfor 1997 the government introduced a comprehensive package of incentivesand regulatory reforms designed to revive investor confidence. Unproductivesubsidies were phased out and efforts to expand infrastructural facilities werestepped up.
Persistently high fiscaldeficits—
The reduction of the fiscal deficit has emerged as the most serious challengefacing policy-makers. Unsustainably high fiscal deficits are the primary causeof macroeconomic instability, since they raise inflation and interest rates. Therecord of successive governments in fiscal management has been poor. In 1994a sharp escalation in defence spending raised the deficit, excluding grants, toaround 10% of GDP. In 1996 the deficit was contained at 8.9% of GDP partlyowing to a reduction in capital spending. Although escalating defence expend-iture has been primarily responsible for the increase in recurrent expenditure,increased spending on subsidies and mounting interest and wage bills havealso played a part. (Reference table 1 gives a breakdown of government revenueand expenditure.)
12 Sri Lanka: Economic policy
EIU Country Profile 1997-98 © The Economist Intelligence Unit Limited 1997

—will be difficult toreduce
The medium-term objective is to reduce the fiscal deficit to 7.5% of GDPin 1997 and 4.5% by 1999. Much government expenditure, such as security/defence costs and interest payments, are difficult to compress, although thegovernment used privatisation proceeds to retire SLRs10bn of public debt inAugust 1997. Most of the reduction will be made by cutting the civil servicewages and pension bill through administrative reforms and by trimming sub-sidies and social transfers. Such measures require considerable political courageand have been avoided by successive governments. Instead, capital expend-iture has been sacrificed to cover increased recurrent expenditure, and as aconsequence public investment has suffered. Nevertheless, in its 1997 budgetthe government made an attempt to prune expenditure. A 20% across-the-board cut in all recurrent expenditure and a 25% reduction in overtime pay-ments is to be effected. The abolition of the wheat subsidy (most of it wasremoved in August 1996, with another reduction in August 1997) will effec-tively reduce welfare payments by 10%.
The 1997 budget The 1997 budget attempted to revive business confidence by introducingseveral measures designed to boost the domestic and export manufacturingsectors. The measures included:
• 100% exemption from duty and taxes on capital and intermediate goods forproducers who export 50% of output, and 50% exemption for producers whoexport 25-49% of output;
• extending offshore borrowing facilities to all exporters;
• lowering the minimum investment requirement for duty-exempt imports fornew investments in “advanced technology” industries from SLRs10m ($169,492) toSLRs4m;
• an investment tax allowance of 75-100% of the cost of new plant to beavailable as a deduction against specified assessable undertakings;
• increased depreciation allowances on plant, machinery and equipment;
• a progressive reduction in corporate and personal taxes from 35% to 25% byApril 1999;
• the national security levy on capital goods reduced from 2% to 0.5%; and
• the planned introduction of a goods and services tax in 1997.
Summary of government finances, 1996a
SLRs m % of GDP
Total revenue & grants 154,779 20.1 Tax revenue 130,202 16.9 of which: income taxes 20,751 2.7 taxes on property 5,279 0.7 taxes on treasury bills 1,604 0.2 general sales & turnover tax 37,361 4.9 excise tax 22,067 2.9 defence levy 16,441 2.1 taxes on international trade 25,463 3.3 Non-tax revenue 16,077 2.1 Grants 8,500 1.1
continued
Sri Lanka: Economic policy 13
EIU Country Profile 1997-98 © The Economist Intelligence Unit Limited 1997

SLRs m % of GDP
Expenditure & lending excl repayments 214,710 27.9 Current expenditure 170,629 22.2 of which: wages, goods & services 78,666 10.2 interest payments 46,021 6.0 transfers & subsidies 46,813 6.1 Capital expenditure 40,034 5.2 Lending excl repayments 4,047 0.5
Memorandum itemsBudget deficit (before grants) 68,431 8.9Budget deficit (after grants) 59,931 7.8
a Provisional.
Source: Central Bank of Sri Lanka, Annual Report 1996.
A tight monetary policy— In recent years, monetary policy has focused principally on controlling infla-tion, with the Central Bank of Sri Lanka relying on indirect policy instruments,including open market operations, to influence the growth of money supply. In1992-93 monetary growth was fuelled by a large increase in foreign capitalinflows and an expansion in private-sector credit; this led to the operation of atight monetary policy. In 1993-95 an even stronger emphasis on controllinginflation led to a tightening of monetary policy to compensate for a wideningfiscal deficit caused by high defence spending. This stance precipitated a severeliquidity crisis at the end of 1995 and led to a brief relaxation of monetary policyin the first half of 1996. By the end of 1996 a sharp decline in the growth ofprivate-sector credit, as investment and economic growth slowed perceptibly,led to a significant deceleration in the growth of the broad money supply; thisfell from 19.2% in December 1995 to 10.8% in December 1996.
—has now been relaxed tostimulate growth
Following a difficult year in 1996 the Central Bank is now attempting to usemonetary policy to stimulate economic growth. By mid-1997 several measuresaimed at increasing liquidity and reducing interest rates had been introduced.The reserve ratio on rupee deposits was cut from 15% to 12%, and that onforeign currency deposits was waived. Two- and four-year Treasury bonds wereintroduced, marking the first step towards developing a market for longer-termdebt securities while simultaneously establishing a benchmark for the directionof long-term interest rates. Heavy intervention by the Central Bank in theshort-term Treasury-bill market also led to a reduction in short-term rates.(Reference table 2 includes monetary aggregates, and Reference table 3 showsinterest rates.)
Economic performance
Manufacturing is themain engine of growth—
Real annual GDP growth averaged 5.2% in 1992-96. The manufacturing sectoremerged as the main engine of growth, expanding at an annual average rate of8.8% per year in 1992-96, offsetting a lacklustre agriculture performance. In1992-96 agricultural growth averaged a mere 1%. In 1996 agricultural outputdeclined by 4.6% (the worst performance since 1987), but a 6.5% expansion inmanufacturing helped GDP growth to reach 3.8%. (Reference tables 4-7 pro-vide various measures of GDP.)
14 Sri Lanka: Economic performance
EIU Country Profile 1997-98 © The Economist Intelligence Unit Limited 1997
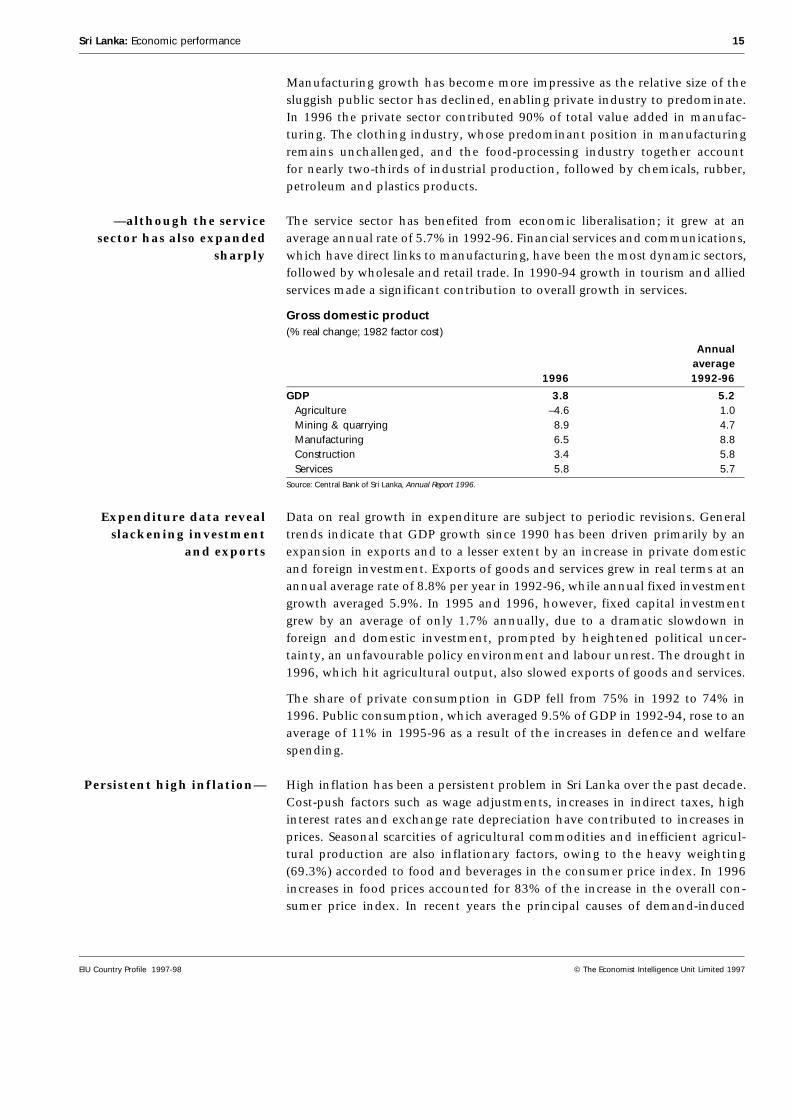
Manufacturing growth has become more impressive as the relative size of thesluggish public sector has declined, enabling private industry to predominate.In 1996 the private sector contributed 90% of total value added in manufac-turing. The clothing industry, whose predominant position in manufacturingremains unchallenged, and the food-processing industry together accountfor nearly two-thirds of industrial production, followed by chemicals, rubber,petroleum and plastics products.
—although the servicesector has also expanded
sharply
The service sector has benefited from economic liberalisation; it grew at anaverage annual rate of 5.7% in 1992-96. Financial services and communications,which have direct links to manufacturing, have been the most dynamic sectors,followed by wholesale and retail trade. In 1990-94 growth in tourism and alliedservices made a significant contribution to overall growth in services.
Gross domestic product(% real change; 1982 factor cost)
Annualaverage
1996 1992-96
GDP 3.8 5.2 Agriculture –4.6 1.0 Mining & quarrying 8.9 4.7 Manufacturing 6.5 8.8 Construction 3.4 5.8 Services 5.8 5.7Source: Central Bank of Sri Lanka, Annual Report 1996.
Expenditure data revealslackening investment
and exports
Data on real growth in expenditure are subject to periodic revisions. Generaltrends indicate that GDP growth since 1990 has been driven primarily by anexpansion in exports and to a lesser extent by an increase in private domesticand foreign investment. Exports of goods and services grew in real terms at anannual average rate of 8.8% per year in 1992-96, while annual fixed investmentgrowth averaged 5.9%. In 1995 and 1996, however, fixed capital investmentgrew by an average of only 1.7% annually, due to a dramatic slowdown inforeign and domestic investment, prompted by heightened political uncer-tainty, an unfavourable policy environment and labour unrest. The drought in1996, which hit agricultural output, also slowed exports of goods and services.
The share of private consumption in GDP fell from 75% in 1992 to 74% in1996. Public consumption, which averaged 9.5% of GDP in 1992-94, rose to anaverage of 11% in 1995-96 as a result of the increases in defence and welfarespending.
Persistent high inflation— High inflation has been a persistent problem in Sri Lanka over the past decade.Cost-push factors such as wage adjustments, increases in indirect taxes, highinterest rates and exchange rate depreciation have contributed to increases inprices. Seasonal scarcities of agricultural commodities and inefficient agricul-tural production are also inflationary factors, owing to the heavy weighting(69.3%) accorded to food and beverages in the consumer price index. In 1996increases in food prices accounted for 83% of the increase in the overall con-sumer price index. In recent years the principal causes of demand-induced
Sri Lanka: Economic performance 15
EIU Country Profile 1997-98 © The Economist Intelligence Unit Limited 1997
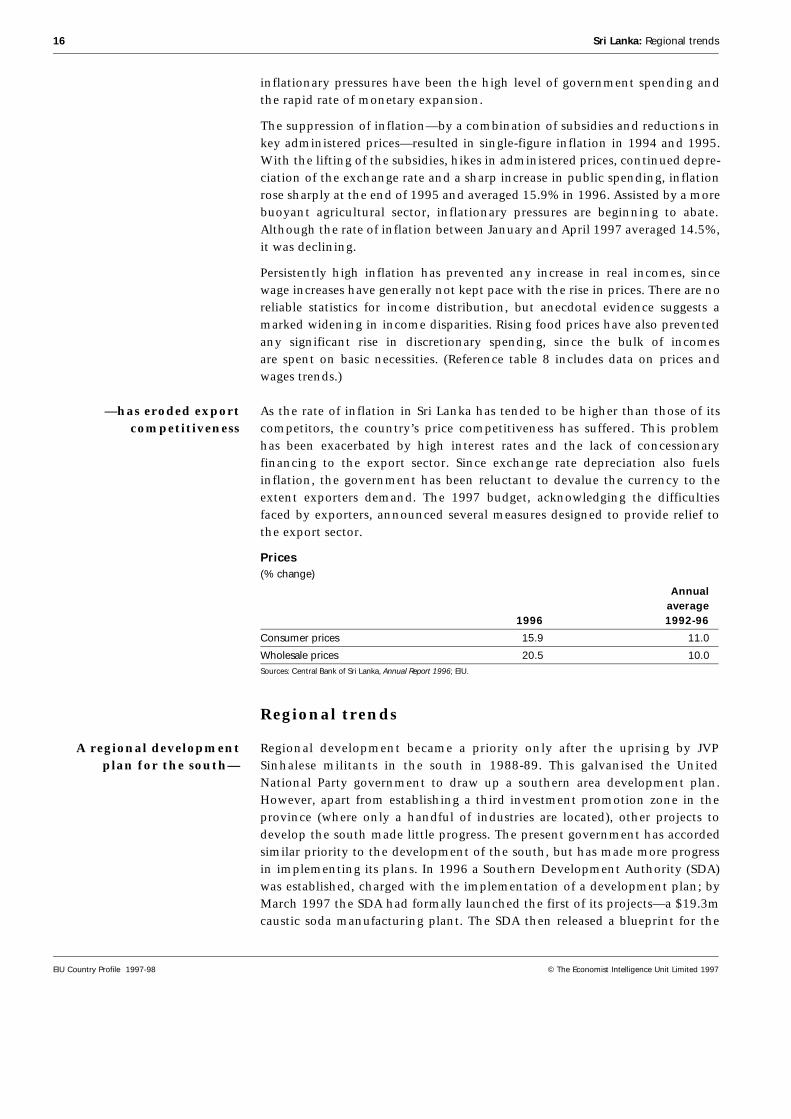
inflationary pressures have been the high level of government spending andthe rapid rate of monetary expansion.
The suppression of inflation—by a combination of subsidies and reductions inkey administered prices—resulted in single-figure inflation in 1994 and 1995.With the lifting of the subsidies, hikes in administered prices, continued depre-ciation of the exchange rate and a sharp increase in public spending, inflationrose sharply at the end of 1995 and averaged 15.9% in 1996. Assisted by a morebuoyant agricultural sector, inflationary pressures are beginning to abate.Although the rate of inflation between January and April 1997 averaged 14.5%,it was declining.
Persistently high inflation has prevented any increase in real incomes, sincewage increases have generally not kept pace with the rise in prices. There are noreliable statistics for income distribution, but anecdotal evidence suggests amarked widening in income disparities. Rising food prices have also preventedany significant rise in discretionary spending, since the bulk of incomesare spent on basic necessities. (Reference table 8 includes data on prices andwages trends.)
—has eroded exportcompetitiveness
As the rate of inflation in Sri Lanka has tended to be higher than those of itscompetitors, the country’s price competitiveness has suffered. This problemhas been exacerbated by high interest rates and the lack of concessionaryfinancing to the export sector. Since exchange rate depreciation also fuelsinflation, the government has been reluctant to devalue the currency to theextent exporters demand. The 1997 budget, acknowledging the difficultiesfaced by exporters, announced several measures designed to provide relief tothe export sector.
Prices(% change)
Annualaverage
1996 1992-96
Consumer prices 15.9 11.0
Wholesale prices 20.5 10.0Sources: Central Bank of Sri Lanka, Annual Report 1996; EIU.
Regional trends
A regional developmentplan for the south—
Regional development became a priority only after the uprising by JVPSinhalese militants in the south in 1988-89. This galvanised the UnitedNational Party government to draw up a southern area development plan.However, apart from establishing a third investment promotion zone in theprovince (where only a handful of industries are located), other projects todevelop the south made little progress. The present government has accordedsimilar priority to the development of the south, but has made more progressin implementing its plans. In 1996 a Southern Development Authority (SDA)was established, charged with the implementation of a development plan; byMarch 1997 the SDA had formally launched the first of its projects—a $19.3mcaustic soda manufacturing plant. The SDA then released a blueprint for the
16 Sri Lanka: Regional trends
EIU Country Profile 1997-98 © The Economist Intelligence Unit Limited 1997
development of the Southern province into the next century. The $3.4bnproject envisages the creation of a new city, Ruhunapura, with a port, inter-national airport and high speed highway connecting it to Colombo.
—and others are suggested The Asian Development Bank (ADB) has provided technical assistance for thepreparation of a development master plan for the North-Central province.While projects to develop the Northern and Eastern provinces have been inexistence since the late 1980s the civil war has prevented their implementation.
Integrated RuralDevelopment Programmes
Regional development has been primarily effected, albeit on a small scale,through Integrated Rural Development Programmes. These presently cover 17of the island’s 26 districts. These projects, which are primarily foreign-funded(usually by grants) and initially focused on the development of infrastructure,now concentrate on the creation of income-generating projects and the devel-opment of skills in rural areas. Development funds (known as criteria-basedgrants) are released by central government to the provincial councils to allowthem to undertake development projects. The funding that each provincereceives is determined by criteria that take into account the population of eachprovince and selected indicators of social and economic differences betweenprovinces. However, the annual allocation of SLRs1bn ($17.6m) between nineprovinces has not been increased in recent years and is insufficient to make anyreal contribution to development.
Resources
Population
Sri Lanka prides itself on being a multiracial and multifaith society. TheSinhalese, who comprise nearly three-quarters of the population, speak Sinhala,one of the oldest Aryan languages, and are mainly Buddhists.
The population ispredominantly rural
Sri Lanka’s population was estimated at 18.3 million in mid-1996. About 70%of the people live in the island’s south-western area (the so-called wet zone),which accounts for about three-quarters of the cultivated land and most of thecountry’s industry. In 1996 only 22% of the population was urban, a propor-tion little changed from 15 years earlier.
Population growth isbeing controlled—
Sri Lanka’s demographic achievements are commendable for a low-incomecountry. Declining fertility rates, a consequence of improved education amongwomen and the relatively high use of contraceptives, have enabled the countryto move to an advanced stage of demographic transition, with populationgrowth expected to approach replacement level before the turn of the century.(See Reference table 9 for data on population growth rates.) Falling birth ratesand increased life expectancy are also changing the age profile of the popul-ation. The number of old people is expected to rise by the turn of the century,exerting more pressure on tertiary health facilities.
Sri Lanka: Population 17
EIU Country Profile 1997-98 © The Economist Intelligence Unit Limited 1997
—but unemploymentremains high
Unemployment has become a pressing political and social issue. The unemploy-ment rate was 11.6% in 1996, little changed from 12.1% in 1994 and 12.0%in 1995. It has been estimated that the economy needs to generate at least158,000 new jobs annually if the unemployment rate is to be halved by 2001.
The profile of the unemployed is also of concern. About two-thirds are 24 yearsof age or under, and are relatively well-educated. While the high proportion ofeducated youth among the unemployed is partly explained by the historicaltendency of many young people to remain unemployed for long periods of timein expectation of government jobs, it is also due to a mismatch between theskills imparted by the education system and those demanded in the job market.(Reference table 10 includes data on the labour force and unemployment.)
The role of the Tamils The Sri Lankan Tamils account for 12.7% of the population (1981 census). Themajority are Hindu, but there is a substantial Christian minority. The Tamils aretraditionally concentrated in the north and east of the island. Before inde-pendence the Tamils played an important role in political life and accounted fora disproportionately large share of government employees and of the educatedpopulation; this fuelled resentment among the Sinhalese community.
So-called upcountry, or “Indian”, Tamils form 5-6% of the population. Descen-dants of people brought from India by the British to work on tea plantations,many were denied citizenship after independence. Some returned to India inthe late 1960s under an agreement with the Indian government. However,many remained and all who did so were granted citizenship in 1988.
Muslims and others Muslims constitute around 7% of the population and are concentrated in theEastern province and in Colombo. They are largely traders and, althoughTamil-speaking, remain apart from the Tamil community. Finally, there aresmall groups of “Burghers” (Eurasians of mixed descent), Malays and a smallnumber of highly respected Veddas, descendants of the original inhabitants ofthe island before Sinhalese settlement; together, these groups make up about1% of the total population.
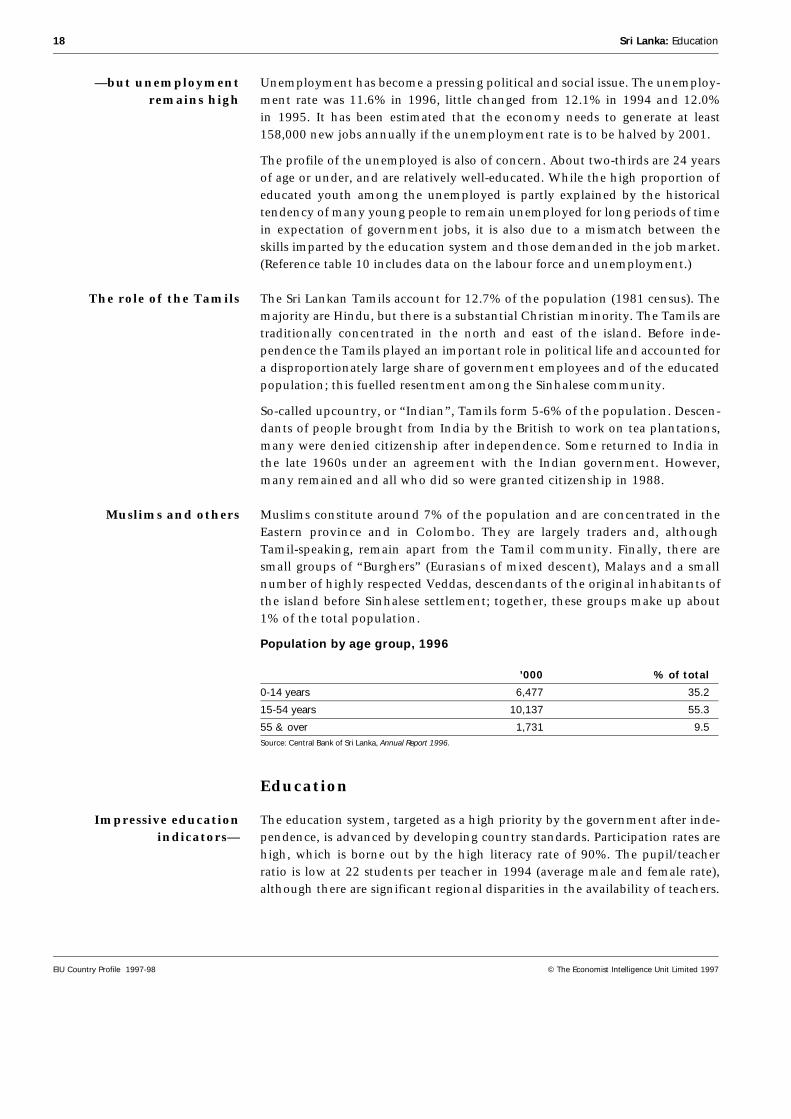
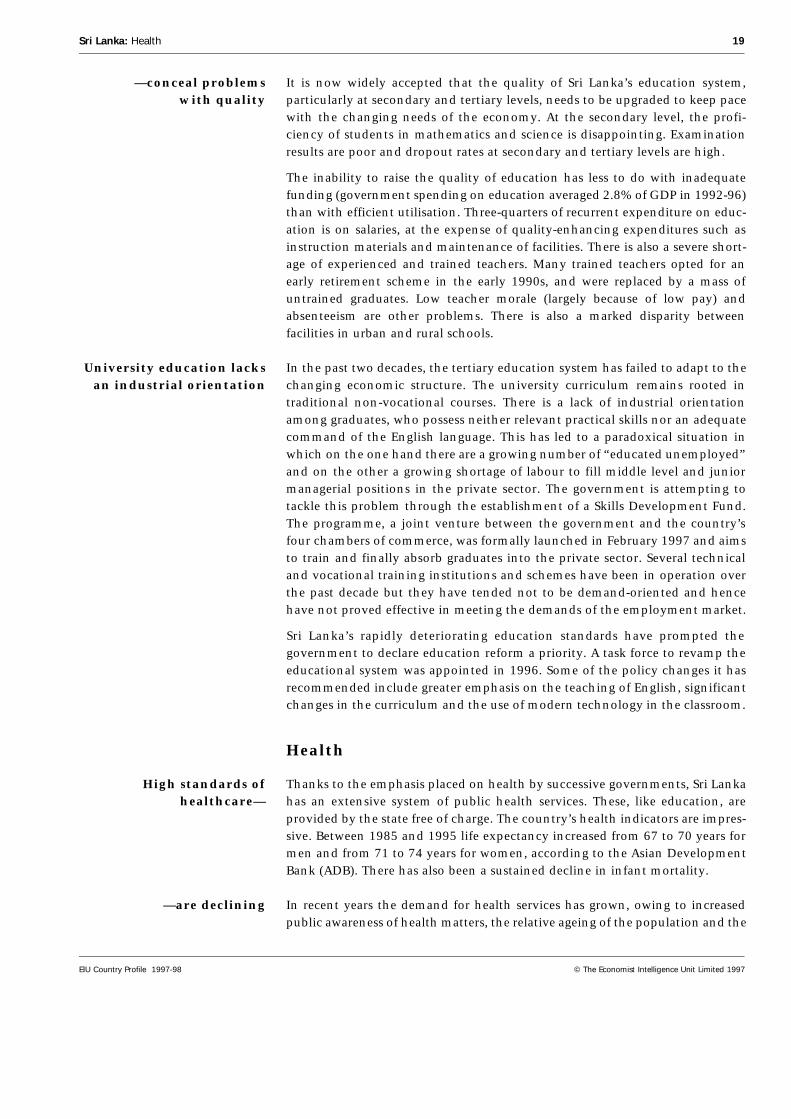
Population by age group, 1996
’000 % of total
0-14 years 6,477 35.2
15-54 years 10,137 55.3
55 & over 1,731 9.5Source: Central Bank of Sri Lanka, Annual Report 1996.
Education
Impressive educationindicators—
The education system, targeted as a high priority by the government after inde-pendence, is advanced by developing country standards. Participation rates arehigh, which is borne out by the high literacy rate of 90%. The pupil/teacherratio is low at 22 students per teacher in 1994 (average male and female rate),although there are significant regional disparities in the availability of teachers.
18 Sri Lanka: Education
EIU Country Profile 1997-98 © The Economist Intelligence Unit Limited 1997
—conceal problemswith quality
It is now widely accepted that the quality of Sri Lanka’s education system,particularly at secondary and tertiary levels, needs to be upgraded to keep pacewith the changing needs of the economy. At the secondary level, the profi-ciency of students in mathematics and science is disappointing. Examinationresults are poor and dropout rates at secondary and tertiary levels are high.
The inability to raise the quality of education has less to do with inadequatefunding (government spending on education averaged 2.8% of GDP in 1992-96)than with efficient utilisation. Three-quarters of recurrent expenditure on educ-ation is on salaries, at the expense of quality-enhancing expenditures such asinstruction materials and maintenance of facilities. There is also a severe short-age of experienced and trained teachers. Many trained teachers opted for anearly retirement scheme in the early 1990s, and were replaced by a mass ofuntrained graduates. Low teacher morale (largely because of low pay) andabsenteeism are other problems. There is also a marked disparity betweenfacilities in urban and rural schools.
University education lacksan industrial orientation
In the past two decades, the tertiary education system has failed to adapt to thechanging economic structure. The university curriculum remains rooted intraditional non-vocational courses. There is a lack of industrial orientationamong graduates, who possess neither relevant practical skills nor an adequatecommand of the English language. This has led to a paradoxical situation inwhich on the one hand there are a growing number of “educated unemployed”and on the other a growing shortage of labour to fill middle level and juniormanagerial positions in the private sector. The government is attempting totackle this problem through the establishment of a Skills Development Fund.The programme, a joint venture between the government and the country’sfour chambers of commerce, was formally launched in February 1997 and aimsto train and finally absorb graduates into the private sector. Several technicaland vocational training institutions and schemes have been in operation overthe past decade but they have tended not to be demand-oriented and hencehave not proved effective in meeting the demands of the employment market.
Sri Lanka’s rapidly deteriorating education standards have prompted thegovernment to declare education reform a priority. A task force to revamp theeducational system was appointed in 1996. Some of the policy changes it hasrecommended include greater emphasis on the teaching of English, significantchanges in the curriculum and the use of modern technology in the classroom.
Health
High standards ofhealthcare—
Thanks to the emphasis placed on health by successive governments, Sri Lankahas an extensive system of public health services. These, like education, areprovided by the state free of charge. The country’s health indicators are impres-sive. Between 1985 and 1995 life expectancy increased from 67 to 70 years formen and from 71 to 74 years for women, according to the Asian DevelopmentBank (ADB). There has also been a sustained decline in infant mortality.
—are declining In recent years the demand for health services has grown, owing to increasedpublic awareness of health matters, the relative ageing of the population and the
Sri Lanka: Health 19
EIU Country Profile 1997-98 © The Economist Intelligence Unit Limited 1997

large number of casualties of the civil war. But limited financial resources haveprevented a similar increase in supply, leading to a progressive deterioration inthe standard of health care. The underuse of health facilities at the rural leveland the overcrowding of health centres and hospitals are also a major problem,compounded by insufficient facilities and a shortage of drugs in rural clinics.
Malaria and infantmalnutrition are
increasing—
An increase in child malnutrition and the resurgence of malaria are two areasof concern. One-third of children under three years old are underweight fortheir age. Malaria, eradicated in the 1960s, reached epidemic proportions in theearly 1990s. A malaria control programme organised by the World HealthOrganisation (WHO) led to a decline in the incidence of malaria in 1994 and1995. But the lack of preventive measures in war-affected areas and refugeecamps led to a resurgence of the disease in 1996, with the number of casesrising from 140,000 in 1995 to 184,000 in 1996.
—but communicablediseases are under control
The shift in emphasis from curative to preventive health in recent years hashelped to control the spread of other communicable diseases, such as AIDS,other sexually transmitted diseases and water-borne diseases. The incidence ofvaccine-preventable diseases has also fallen.
A shift to a private healthsystem is considered
The government’s strategy is to improve peripheral health services, give greateraccess to healthcare to the poor and reduce rural-urban disparities in healthcareprovision. One of the main problems facing policy-makers is finding themoney to meet the rising demand for health services. One option suggested byinternational lending agencies is to introduce user fees in the public sector.
There is a growing consensus that the development of a broader private-sectorhealth system is the most feasible alternative. Since 1990 participation by theprivate sector in the health sector has been expanding. The private sector pro-vides around 50% of primary healthcare, while the bulk of hospital care isstill provided by state-run facilities. As the cost of health facilities providedby the private sector is high, they still remain largely inaccessible to lowerincome groups.
Natural resources and the environment
Natural resources arebeing depleted—
Sri Lanka is richly endowed with forests and water resources. But in recent yearsland degradation has become a major environmental problem. Forest cover hasbeen depleted from an estimated 28% of the total land area in 1975 to 20% in1992 (although estimates vary, and some show an increase in forest coverduring this time); at the present rate of deforestation, forest cover is projectedto shrink to only 10% by 2000. According to the ADB, the rate of deforestationin Sri Lanka is 3.5% of the total forest area per year—the second fastest rate inAsia (beaten only by Nepal).
With a mean rainfall of 2,000 mm per year, Sri Lanka is rich in freshwaterresources, but there has also been a rapid rise in the demand for water forirrigation, power generation, and domestic and industrial use. In the coastalzone, erosion and mining of coral reefs to obtain lime for the constructionindustry has become a major environmental hazard.
20 Sri Lanka: Natural resources and the environment
EIU Country Profile 1997-98 © The Economist Intelligence Unit Limited 1997
—and pollution is onthe rise—
Even though the level of industrialisation in Sri Lanka is relatively low byinternational standards, water pollution is rising. A 1989 survey on industrialpollution revealed that, of 7,610 industrial enterprises, 291 had high pollutingpotential, and 1,900 had medium polluting potential. The major sources of airpollution are the burning of fuel wood, industrial emissions and power plants.Although air pollution in Colombo has not reached the levels in cities such asNew Delhi and Bangkok, the increase in vehicles on the roads has alreadypushed it to unacceptable levels. Solid-waste management is another growingenvironmental problem.
—prompting someenvironmental measures—
In keeping with international trends, Sri Lanka is placing increased emphasis onenvironmental management, and in recent years increased resources have beenallocated by central government to environment protection. Some recent meas-ures include the creation of a cabinet-rank minister for the environment,strengthening the Central Environmental Authority and technical support tocreate environmental awareness in development-oriented ministries and bodies.
—but enforcement needsto be improved
The National Environment Act was introduced in 1980. In 1988 amendmentsto the act introduced environmental standards for industry, and environ-mental impact assessments for development projects were made mandatory.However, in spite of a well-articulated environmental policy, inadequate finan-cial resources and the lack of technical expertise in regulatory and advisoryservices have prevented effective enforcement and monitoring of environ-mental regulations. Little attention has been paid to the development ofeconomic incentives for encouraging environment-friendly technologies inindustry, and virtually no penalties are imposed for pollution.
Economic infrastructure
Transport and communications
Roads are inadequatelymaintained—
Sri Lanka has a road network of approximately 100,000 km, of which 11,079 kmare either A or B class roads, maintained by the Road Development Authority.Over the past decade fiscal constraints have hampered the maintenance,rehabilitation and new construction of roads. The failure to develop the roadnetwork, coupled with the increased demand for movement of passengers andgoods, has resulted in severe traffic congestion on the main national highways.Since 1986 only 1,000 km of national highways have been rehabilitated, withdonor assistance. The lack of a well-developed road network has been one ofthe principal factors inhibiting the regional dispersal of industry. In 1996 pre-paratory work was initiated on the construction of two national highways.Private investment on a build-operate-transfer (BOT) basis is being solicited forthe Colombo-Katunayake Expressway which will link the capital to the airport.The Asian Development Bank (ADB) has shown interest in financing the con-struction of the Colombo-Matara highway, which will link Colombo to theSouthern province.
Sri Lanka: Transport and communications 21
EIU Country Profile 1997-98 © The Economist Intelligence Unit Limited 1997
—bus services areinefficient—
Public passenger road services were provided until recently by the Sri LankaTransport Board (SLTB). In 1990, in view of the SLTB’s losses, the governmentbegan privatising the SLTB; by the end of 1994, 93 privatised companies werein operation.
The number of small-scale private bus operators has grown in recent years, andin 1996 the private bus sector accounted for over 60% of road transport serv-ices. Nearly 95% of private operators are single bus owners. Over the next threeyears the government plans to restrict the issue of licenses to those operatorswith a minimum fleet of 50 buses.
—and investment in theindustry is stifled by
regulated prices
Both public and private services suffer from considerable overcrowding andinefficiency. Although the current bus fleet numbers 21,000 (12,000 in theprivate sector, 9,000 in the privatised sector), around 40% of these are eitherobsolete or in urgent need of repair. The regulation of prices in the transportsector has inhibited investment. Political considerations have resulted in pricesbeing fixed at levels well below the market price, so there is little incentive foroperators to maintain or invest in new buses. In 1996 the government permit-ted a 15% rise in bus fares, but this was well below the 20-40% increase recom-mended by the Transport Fare Committee.
The rail network isrun-down
Sri Lanka Railways (SLR) has 1,982 km of track. For well over a decade therailway has run at a loss and has been a major drain on public resources.Inefficient management and lack of investment in rail infrastructure has re-sulted in a sustained decline in the quality of services, leading to reducedpublic use. In 1995 a project, funded by the Japanese government’s OverseasEconomic Cooperation Fund (OECF), was started to rehabilitate railway tracks,locomotives and workshops. The conversion of Sri Lanka Railways into a profit-oriented venture is probable. Foreign investment to electrify the suburbanrailway network on a BOT basis is being sought.
Telecommunications areexpanding rapidly—
Since 1991, when Sri Lanka Telecom was converted into a commercial corpor-ation and the sector was opened to private operators, the telecommunicationsindustry has displayed lively growth. The number of telephone lines has risenfrom 180,724 in 1994 to an estimated 254,000 in 1996. Telephone density hasrisen from 0.73 per 100 persons in 1994 to 1.4 per 100 persons in 1996.International facilities were augmented with the commissioning of a 2,000-lineexchange and the installation of a digital satellite station. Private-sector invest-ment in the sector grew even faster. By the end of 1996 there were four mobile-phone operators (the number of cellular phone subscribers increased from29,182 to 71,228 between 1994 and 1996), six Internet service providers, fiveprivate paging companies and four privately operated payphone networks.
—and privatisation willimprove service quality
In spite of the expansion in the communications industry, service quality isbelow standard. There exists a huge gap between demand for and supply oftelephone facilities. In 1996 demand for telephones reached 510,500, of which256,000 were officially on the waiting list—but only 50,150 new telephoneconnections were made. In 1996 the government gave up its monopoly, andtwo joint ventures, Lanka Bell (now a joint venture with Korea Telecom)and Suntel (led by Telia of Sweden), were granted approval to set up parallel
22 Sri Lanka: Transport and communications
EIU Country Profile 1997-98 © The Economist Intelligence Unit Limited 1997
networks. These two networks, which became operational at the end of 1996,will provide 200,000 new connections over the next two years. In August 1997a 35% stake and management control of Sri Lanka Telecom was bought byJapan’s Nippon Telegraph and Telephone (NTT) for $225m.
Ports are being expanded Sri Lanka has three ports that can accommodate deep-sea vessels—Colombo,Trincomalee and Galle. The largest of these is Colombo, which has been out-standingly successful in recent years, becoming a major transhipment port andranking in the world’s top 30 in terms of tonnage handled. Colombo’s successhas caused problems of congestion, and tariffs are relatively high. To relievecongestion, the port’s capacity of 1.4m twenty-foot equivalent units (TEUs)was expanded by an additional 700,000 TEUs with the commissioning of twonew terminals in 1995 and 1996. Contracts for the expansion of the main quayand the construction of a new container terminal on a BOT basis have beenawarded to P&O of Australia. Work on the project, which involves investmentof $950m, is expected to begin in 1998 and will expand the port’s handlingcapacity by a further 750,000 TEUs. In 1997 a new oil terminal was commis-sioned at Colombo port.
Plans to develop Galle port may be abandoned in view of the proposal in 1997to develop a port in Hambantota as part of the southern area developmentmaster plan. (Reference table 11 includes data on road, rail and sea transport.)
Energy provision
Overdependence onhydropower—
Some 64% of the island’s total energy demand is met by firewood, most of it forhousehold use. The only other indigenous energy source, hydropower,accounted for 13% of energy use in 1991, according to the Central Bank ofSri Lanka. Imported oil, much of which is refined domestically, is the largestsource of commercial energy. The Ceylon Petroleum Corporation (CPC) is thestate oil company responsible for importing, refining and distributing all petro-leum products except liquefied petroleum gas (LPG); the latter is marketed byShell, which bought the Colombo Gas Company in 1995. The transmission anddistribution of electricity are handled by the Ceylon Electricity Board (CEB).Projects to improve the country’s transmission and distribution network havehad limited success in reducing system losses, which in 1996 were equivalent totwo months of electricity consumption. An attempt in 1996 to privatise thedistribution network had to be abandoned because of stiff union resistance.
—precipitated a powercrisis in 1996—
Sri Lanka’s generation system is predominantly hydro-based, leaving it vulner-able to seasonal rainfall fluctuations. Since 1992 there have been no additionsto the national grid, since projects to augment the country’s thermal generat-ing capacity were subject to bureaucratic delays, political interference and en-vironmental considerations. In early 1996 the rains failed, which precipitateda severe power shortage and forced the government to adopt emergency meas-ures, such as subsidising the import of private generators and buying thermalpower from private operators. These measures imposed a heavy financial bur-den on the CEB.
Sri Lanka: Energy provision 23
EIU Country Profile 1997-98 © The Economist Intelligence Unit Limited 1997
—but thermal generationcapacity is poised to
double in 1997
In a bid to prevent a similar crisis from recurring, the government decided tobring forward several thermal power projects. A 40-mw diesel power plant anda 115-mw gas turbine generator were commissioned in August 1997. Togetherwith 44 mw of private power capacity, this nearly doubled the country’s ther-mal capacity—to 427 mw. A 51-mw diesel power plant is expected to come onstream in 1998 and another 40 mw of capacity will be added to the diesel plantcommissioned in August. Meanwhile, a letter of intent has been issued for a60-mw coal power plant. The CEB is also examining the feasibility of a 300-mwcoal power plant on the southern coast. (Reference table 12 includes a range ofenergy statistics.)
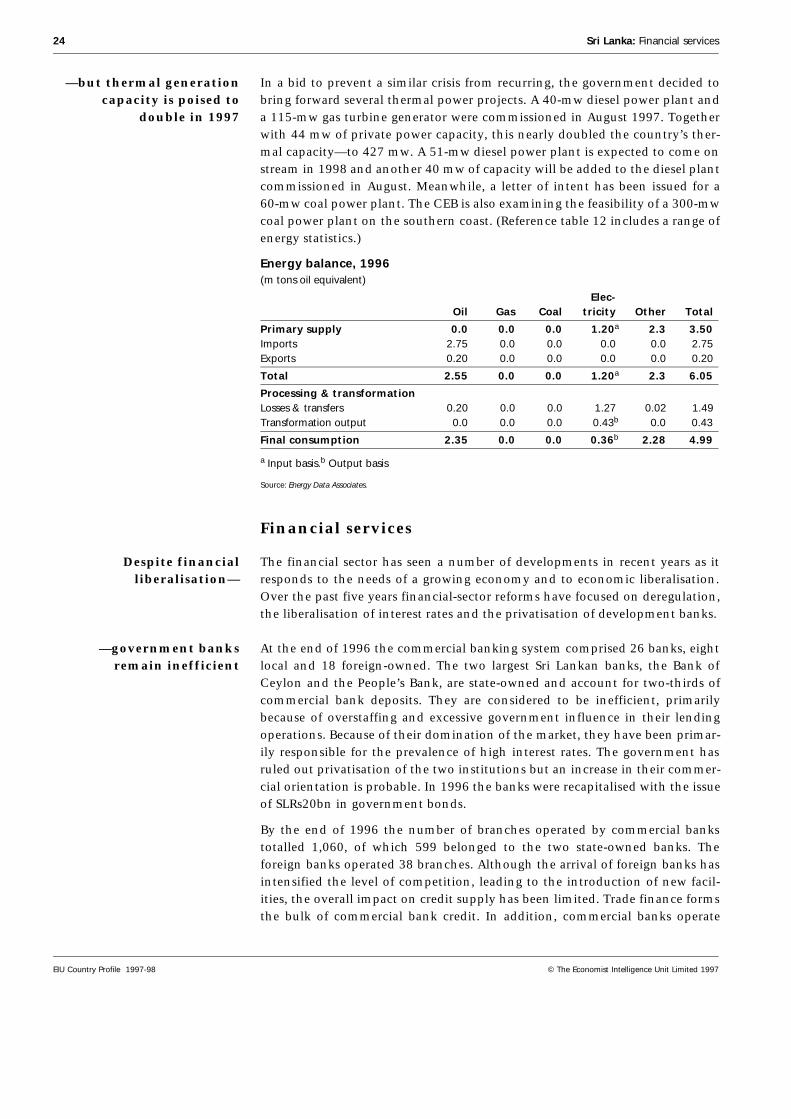
Energy balance, 1996(m tons oil equivalent)
Elec- Oil Gas Coal tricity Other Total
Primary supply 0.0 0.0 0.0 1.20a 2.3 3.50Imports 2.75 0.0 0.0 0.0 0.0 2.75Exports 0.20 0.0 0.0 0.0 0.0 0.20
Total 2.55 0.0 0.0 1.20a 2.3 6.05
Processing & transformationLosses & transfers 0.20 0.0 0.0 1.27 0.02 1.49Transformation output 0.0 0.0 0.0 0.43b 0.0 0.43
Final consumption 2.35 0.0 0.0 0.36b 2.28 4.99
a Input basis.b Output basis
Source: Energy Data Associates.
Financial services
Despite financialliberalisation—
The financial sector has seen a number of developments in recent years as itresponds to the needs of a growing economy and to economic liberalisation.Over the past five years financial-sector reforms have focused on deregulation,the liberalisation of interest rates and the privatisation of development banks.
—government banksremain inefficient
At the end of 1996 the commercial banking system comprised 26 banks, eightlocal and 18 foreign-owned. The two largest Sri Lankan banks, the Bank ofCeylon and the People’s Bank, are state-owned and account for two-thirds ofcommercial bank deposits. They are considered to be inefficient, primarilybecause of overstaffing and excessive government influence in their lendingoperations. Because of their domination of the market, they have been primar-ily responsible for the prevalence of high interest rates. The government hasruled out privatisation of the two institutions but an increase in their commer-cial orientation is probable. In 1996 the banks were recapitalised with the issueof SLRs20bn in government bonds.
By the end of 1996 the number of branches operated by commercial bankstotalled 1,060, of which 599 belonged to the two state-owned banks. Theforeign banks operated 38 branches. Although the arrival of foreign banks hasintensified the level of competition, leading to the introduction of new facil-ities, the overall impact on credit supply has been limited. Trade finance formsthe bulk of commercial bank credit. In addition, commercial banks operate
24 Sri Lanka: Financial services
EIU Country Profile 1997-98 © The Economist Intelligence Unit Limited 1997
Foreign Currency Banking Units (FCBUs), which channel credit primarily tocompanies operating in the export processing zones. In 1996 the facility wasextended to all exporters. Credit to the rural sector and small firms is chan-nelled mainly through the two state banks and the cooperative institutions.(Reference table 13 includes statistics on commercial banking.)
Other banking andfinancial institutions
Other principal banking and financial institutions include the two main devel-opment banks, the National Development Bank (NDB) and the DevelopmentFinance Corporation of Ceylon (DFCC); they channel long-term funds, primar-ily from international lending agencies, and also provide equity financing,mainly in the industrial, tourism and financial sectors. Other long-term financeinstitutions are the Housing Development Finance Corporation (HDFC), theNational Housing Development Authority (NHDA), the State Mortgage andInvestment Bank (SMIB) and the National Savings Bank (NSB).
There are a number of finance companies. Following some insolvencies andpoor administration, supervision of these was tightened at the end of the1980s. The number of companies shrank from 60 at the end of 1989 to 25 atend-1996.
Sri Lanka also has seven merchant banks, whose activities are concentrated ondiscounting trade bills, lease financing and investment in Treasury bills andthe stock market. At the end of 1996 there were six venture capital companies,providing start-up financing to small and medium-sized companies, and threeregistered leasing companies.
Six insurance companies, two of which are state-owned, together with the NSBand two pension funds, the Employee’s Provident Fund and the Employee’sTrust Fund, predominate in the mobilisation of long-term resources. The fundsof the NSB and pension funds are almost entirely pre-empted by the govern-ment to finance its deficit.
A volatile stock market The fortunes of the Colombo Stock Exchange (CSE) have moved in tandemwith economic and political developments in the country. The stock marketunderwent an unprecedented boom in 1990-91 largely as a result of the open-ing up of the stock market to foreign investors. In 1992 there was a reaction—while turnover was high, prices fell back—but 1993 was another boom year,partly fuelled by an influx of foreign money. The boom continued into theearly months of 1994; the Colombo all-share index (1985=100) peaked at1,378.8 on March 1, 1994. Then political uncertainties, allied to doubt over theoutcome of the election, caused a bear market and the index had fallen to 983by the end of June 1994. The renewed ethnic conflict in early 1995 and theupsurge in labour unrest aggravated the decline in the market, causing theindex to fall to 664 by the end of December. The market remained depressed in1996 despite attempts by the government to revive it through the privatisationprogramme, and the index had fallen to 603 by the end of December. In thesecond quarter of 1997 perceptions of an improved economic and politicalclimate spurred a recovery in investor confidence and by the end of Septemberthe all-share price index had risen to 780. (See Reference table 14 for stock-market indicators.)
Sri Lanka: Financial services 25
EIU Country Profile 1997-98 © The Economist Intelligence Unit Limited 1997
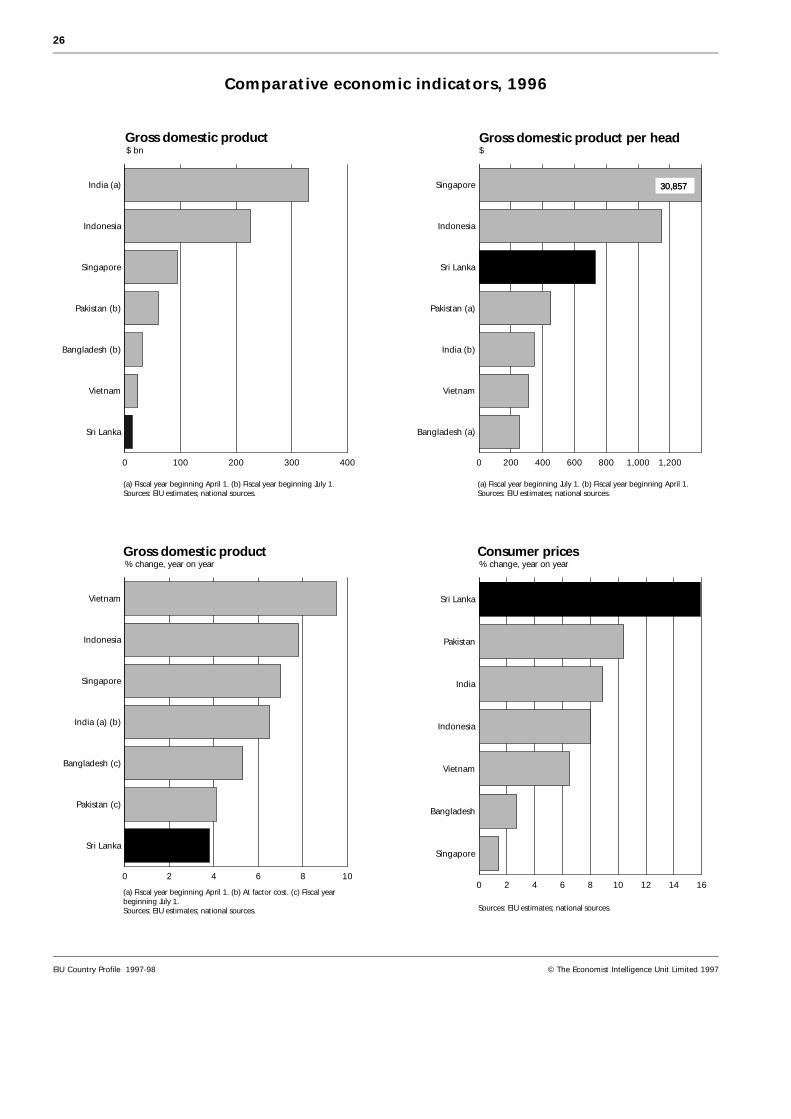
Comparative economic indicators, 1996
0 100 200 300 400
India (a)
Indonesia
Singapore
Pakistan (b)
Bangladesh (b)
Vietnam
Sri Lanka
Gross domestic product$ bn
(a) Fiscal year beginning April 1. (b) Fiscal year beginning July 1.Sources: EIU estimates; national sources.
0 200 400 600 800 1,000 1,200
Singapore
Indonesia
Sri Lanka
Pakistan (a)
India (b)
Vietnam
Bangladesh (a)
Gross domestic product per head$
(a) Fiscal year beginning July 1. (b) Fiscal year beginning April 1.Sources: EIU estimates; national sources.
30,85730,85730,85730,85730,85730,85730,85730,85730,85730,85730,85730,85730,857
0 2 4 6 8 10
Vietnam
Indonesia
Singapore
India (a) (b)
Bangladesh (c)
Pakistan (c)
Sri Lanka
Gross domestic product% change, year on year
(a) Fiscal year beginning April 1. (b) At factor cost. (c) Fiscal yearbeginning July 1.Sources: EIU estimates; national sources.
0 2 4 6 8 10 12 14 16
Sri Lanka
Pakistan
India
Indonesia
Vietnam
Bangladesh
Singapore
Consumer prices% change, year on year
Sources: EIU estimates; national sources.
26
EIU Country Profile 1997-98 © The Economist Intelligence Unit Limited 1997

In a technical sense, the CSE is superior to its counterparts in India and Pakistan.Since 1992 it has had a functioning central depository system and screen-basedtrading was introduced in May 1997. In December 1996 a three-tiered listingstructure was introduced. Companies that cannot meet capital adequacy andother requirements over the next two years will be shifted to the second board.The second board, which has less stringent disclosure requirements, shouldencourage smaller companies to go public. A third over-the-counter board catersfor the trading of shares issued by companies on private placement.
Other services
Tourism has been badlyhit by the civil war—
With its tropical climate, long beaches and historic sites, Sri Lanka is well-placed for the long-haul tourism industry. Between 1976 and 1982, the numberof tourist arrivals expanded at an annual rate of just under 24%, peaking at407,230 in 1982. However, the outbreak of ethnic conflict in 1983 brought asharp reversal and the number of tourists fell to a trough of 182,620 in 1987,less than half the 1982 record. From 1990 onwards, perceptions of a calmerpolitical scene caused tourist numbers to rise again and in 1994 arrivals reacheda new record of 407,511. The intensification of the conflict and the spread ofterrorist activities to Colombo in 1995 began to affect the tourist industry andarrivals that year fell to 403,101. The bombing of the Central Bank in January1996 damaged tourism even further and arrivals plummeted to 302,265. An18% increase in tourist arrivals in the first four months of 1997, compared withthe same period in 1996, brought some cheer to the industry, with the possibil-ity of total arrivals exceeding the 400,000 mark in 1997. However, the bombingof the financial district in Colombo in mid-October will have again batteredthe tourist sector. (See Reference table 15 for tourism statistics.)
The setback to the tourism industry has negative implications for Sri Lanka’sexternal sector as well as for growth in the services sector. The tourism industryhas a direct impact on growth in the hotels sector, the airline industry, dom-estic transport services, the handicrafts industry and on the demand for agri-cultural commodities. Direct employment provided by the tourism sector fellfrom 36,260 in 1995 to 33,131 in 1996, and indirect employment declinedfrom 51,100 to 49,697.
—with the hotel industrythe main casualty
Sri Lanka’s hotel industry has been the main casualty of the decline in tourism.Occupancy rates dropped from 56.6% in 1994 to 52.6% in 1995, and then felleven more sharply to 40.3% in 1996, undermining the profitability of theindustry and creating excess capacity. Current investment means that roomcapacity is expected to rise to 16,900, far in excess of present demand.
28 Sri Lanka: Other services
EIU Country Profile 1997-98 © The Economist Intelligence Unit Limited 1997
Production
Manufacturing
The private sectoraccounts for 90% of
output
Until a few years ago the dynamism of private industry was largely offset by abureaucratic and sluggish public sector, which until the late 1980s accounted forover a half of manufacturing value added. In recent years the privatisation ofseveral state-owned enterprises has reinforced the private sector’s faster growth,enabling it to dominate the industrial sector; by 1995 the private sector ac-counted for over 90% of manufacturing output. Liberalisation, deregulation andgrowing foreign investment have encouraged an already lively sector. However,a number of factors, including labour unrest and the severe power crisis whichled to an interruption in production in the May-July period, slowed outputgrowth in private-sector manufacturing, from 11.6% in 1995 to 6.8% in 1996.(See Reference table 16 for a breakdown of manufacturing output.)
The public sector is dominated by the Ceylon Petroleum Corporation (CPC),whose output fluctuates sharply from year to year as a result of changes incapacity and whether or not maintenance shutdowns occur.
Output is dominated byfood and clothing—
Despite its recent boom, the manufacturing sector’s composition has changedlittle; food, beverages and tobacco, and textiles and clothing together accountfor two-thirds of total output at current prices. The development of the cloth-ing sector has been the country’s main success. The gross output of the textile,clothing and leather industries combined exceeds that of any other sector.However, efforts to encourage domestic textile production have met with onlylimited success. The domestic textile industry provided less than 10% of therequirements of the clothing sector in 1996.
—despite encouraginggrowth in some new
industries
Liberalisation and increased foreign investment have stimulated growth inother sectors of manufacturing. One fast-growing sector with great potential isdiamond cutting. Low labour costs and Sri Lanka’s tradition of working withgems have attracted several international diamond companies to invest in jointventures with local companies. The rubber products industry is also developing.Other industries, notably chemicals, electronic components, footwear, ceram-ics, plastics and soft toys, have also expanded in recent years.
Foreign investment hasbeen encouraged—
Foreign investment has played a major part in the recent development of themanufacturing sector. Foreign direct investment (FDI) accounts for 95% of totalinvestment approved by the Board of Investment (BOI) in 1996, and 80% ofemployment in the export-manufacturing sector is in foreign-funded com-panies. However, since 1994 foreign investment inflows have been decliningbecause of the uncertain political and economic climate and the upsurge inlabour unrest. FDI declined sharply between 1993 and 1995 (see The externalsector). Another trend which may threaten the growth potential of the manu-facturing sector is that, although foreign investment picked up substantially in1996, a large part of the investment went into the telecommunications industry.
Sri Lanka: Manufacturing 29
EIU Country Profile 1997-98 © The Economist Intelligence Unit Limited 1997
Foreign investment is coordinated by the BOI, which functions as a “one-stop”service centre. Attractive fiscal incentives, including tax holidays, concession-ary rates of tax for between 15 and 20 years and duty free imports of inputs, areoffered to foreign investors. (See Reference table 17 for a summary of BOIinvestments.) Sri Lanka has the most open regime in South Asia for foreigninvestment. Apart from a short restricted list, foreign investment is permittedin almost all sectors of the economy.
—but counterbalancingincentives are given to
domestic industry
The bias of the incentive structure in favour of foreign firms has generateddissatisfaction among domestic firms, who complain that high rates of tax-ation and inadequate access to concessionary finance place them at a disadvan-tage. Over the past two years the government has made an effort to meet thesecomplaints by making available more incentives to local industry, including arelaxation of the eligibility criteria for tax concessions.
The industrial sector, 1996
SLRs m % of total
Total output 260,247 100.0 of which: textiles, clothing & leather 101,627 39.1 food, beverages & tobacco 68,209 26.2 chemicals, rubber & plastics products 46,936 18.0
Total manufacturing exports 166,543 100.0 of which: textiles & clothing 96,677 58.1Source: Central Bank of Sri Lanka, Annual Report 1996.
Mining
Liberalisation haspromoted the gem
industry—
Sri Lanka has one of the highest concentrations of gem-bearing rocks andsediments in the world. The country produces a wide range of precious andsemi-precious stones, including diamonds, sapphires, rubies, topaz, garnetsand moonstones. Official foreign exchange earnings from this source used tobe negligible because most of the output was smuggled out of the country. Theestablishment of a Gem Corporation in 1971, and the provision of attractiveexport incentives for those exporting through lawful channels, brought amarked improvement. Gem exports rose from SLRs2.5bn in 1992 to SLRs4.8bnin 1996. (Reference table 18 gives data on mining and quarrying exports.)
—and exports of otherminerals
Graphite deposits are of commercial significance. Almost the entire output isexported as crude graphite (plumbago); exports in 1996 amounted toSLRs151m. Exports of ilmenite fluctuate; they more than doubled to SLRs171min 1994 but slumped again to SLRs127m in 1995 and SLRs64m in 1996. Thegovernment is seeking foreign investment to exploit the country’s mineralresources, and it is likely that the state-owned Lanka Mineral Sands will be soldto the Australia-based RGC Corporation. RGC, a world leader in mineral sandsexploration and processing, plans to set up an ilmenite processing plant inthe country.
30 Sri Lanka: Mining
EIU Country Profile 1997-98 © The Economist Intelligence Unit Limited 1997

Phosphate and goldprojects
Significant deposits of rock phosphate have been discovered in the Eppawelaarea. A joint venture between the US-based Freeport-McMoran and TomenCorporation of Japan, to set up a $400m phosphate mining and fertilisermanufacturing plant, was approved in 1996. Construction of a phosphate-processing factory, to be located in Trincomalee, and related infrastructuralfacilities is expected to be completed in three years. Apart from holding equityin the venture, the government will receive royalties on each ton of phosphatemined. Two foreign companies have been issued with licences for the explor-ation of gold deposits.
Agriculture
Around 29% of the total land area is cultivated. Only the south-west quarter ofthe island—the “wet zone”—attracts sufficient rainfall to support agriculturewithout irrigation. The major export crops of tea, rubber and coconut aregrown in this area. Elsewhere, in the “dry zone”, prolonged and severe droughtlimits agricultural production to irrigable areas. (Reference table 19 gives valueand volume figures for the main agricultural crops.)
Low yields andproductivity—
Over the last decade the government has paid a great deal of attention toagricultural development, providing fertiliser subsidies, making cheap creditavailable to farmers and guaranteeing prices. However, despite this, agriculturalperformance has been weak. The sector remains vulnerable to drought and isafflicted by low yields and productivity.
—result from inefficientmanagement—
The plantation sector has a history of inefficient management by state corpor-ations. In 1992 the two giant state corporations which managed the plant-ations were split into 23 companies, 19 of which were slated for sale. By the endof 1997, all 19 were to be divested or placed under the management of privatecompanies.
—and inappropriatepolicies
The growth potential of the non-plantation agricultural sector—which ac-counts for around 70% of total value added in the agricultural sector—has beenstifled by inappropriate policies, such as restrictions on cropping and land useand inconsistent trade and pricing policies. The sector also suffers from inade-quate agricultural research and extension, poor marketing facilities, primitivefarming methods and the absence of a formal market for land. In January 1997the government appointed a task force to tackle the issue of stagnation in thenon-plantation agricultural sector. One of the aims of the new agriculturalpolicy is to draw in greater private-sector participation in areas such as seedproduction, agricultural extension, trade and marketing. The task force willalso look at land utilisation, irrigation, marketing and trade.
Tea In 1996 tea production increased for the third year running, reaching a newrecord of 258m kg, surpassing the 1995 peak of 246m kg. Output from high-grown and medium-grown teas has fallen since the mid-1970s, while low-grownproduction has soared and now accounts for more than half of total output.Over 55% of low-grown teas are grown by private smallholders who have provedto be more efficient and technologically advanced producers than the
Sri Lanka: Agriculture 31
EIU Country Profile 1997-98 © The Economist Intelligence Unit Limited 1997
plantations. Smallholder yields per ha are about 85% higher than those of thelarge plantations (including the newly privatised plantations).
Until 1996, when it was displaced by Kenya, Sri Lanka was the world’s leadingtea exporter and second only to India in the production of black tea. Cut, tornand curled (CTC) teas, which are preferred in Western markets, account for asmall percentage of Sri Lanka’s production. However, in recent years the shareof CTC teas has been rising slowly, and in 1996 accounted for 7.1% of totalproduction, up from 5% in 1994. But in 1996 the boom in orthodox tea pricesresulted in a 15% reduction in CTC output. According to the Sri Lanka TeaBoard, the country reached a temporary saturation point in CTC production.Middle Eastern countries have formed the main market for Sri Lankan tea,though in recent years output has been stimulated by strong demand from thecountries of the former Soviet Union.
Tea yields are low. Sri Lanka’s average yield of 1,372 kg/ha (1996) lags farbehind Kenya’s 2,000 kg/ha. Part of the reason is poor soil in many plantations,coupled with often inadequate fertiliser use and elderly stock. (In the past,nationalisation contributed to poor organisation and inefficiency, while lowproducer prices reduced incentives for replanting.) Although government in-centives and international aid have recently improved the situation, the num-ber of bushes replanted has been below the optimum level. Production costsare also the highest of all the major tea producers. In recent years politicallymotivated wage increases, unrelated to productivity, have further raised costs.
Rubber After stagnating at an annual average output of 105m kg since 1991, rubberproduction rose to 112m kg in 1996, because of better weather conditions andalso attractive prices which encouraged increased use of fertiliser. The long-term declining trend in rubber production is the result of a reduction in thearea devoted to rubber and a low level of replanting. Two-thirds of rubberplantations are owned by smallholders and suffer from old age and neglect.Yields are low and costs of production high. A World Bank-funded project,aimed at encouraging replanting and improving maintenance procedures, wasin operation from 1988 to 1996 but achieved only half of its 30,000 ha replant-ing target. Domestic consumption of rubber has been increasing since 1985, asrubber-based manufacturing has grown, notably following the establishmentof a major plant by Ansell International Ltd, a subsidiary of Pacific Dunlop.Exports of natural rubber have therefore declined—Sri Lanka accounts for only2% of total world production—while exports of rubber products such as crêperubber and tyres have risen.
Coconuts One-fifth of the country’s agricultural land is devoted to coconut production.In 1996 poor weather conditions helped cut coconut production by 7.4%, to2.6bn nuts. However, in 1996 the coconut sector still accounted for 1.8% ofGDP and 11% of agricultural export earnings. Smallholders account for over90% of coconut cultivation. Production fluctuates sharply, dependingon weather conditions, fertiliser application and producer prices. Over three-quarters of production is consumed domestically and the surplus is exported.
32 Sri Lanka: Agriculture
EIU Country Profile 1997-98 © The Economist Intelligence Unit Limited 1997
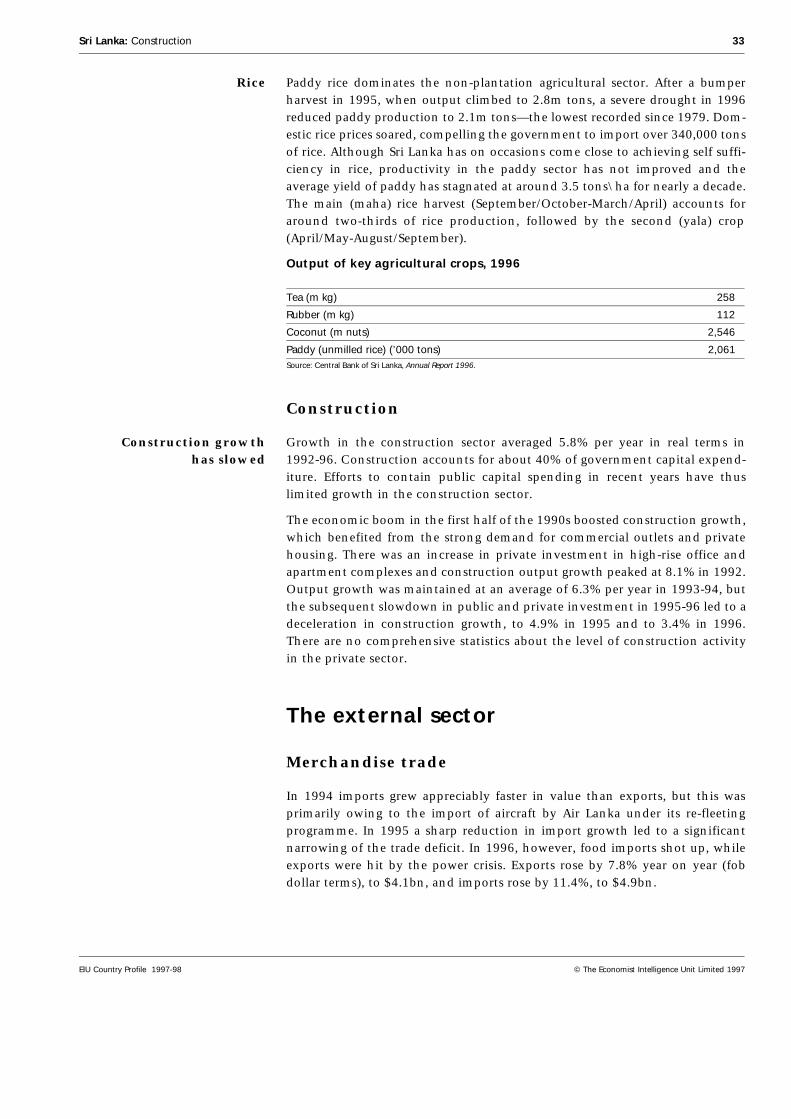
Rice Paddy rice dominates the non-plantation agricultural sector. After a bumperharvest in 1995, when output climbed to 2.8m tons, a severe drought in 1996reduced paddy production to 2.1m tons—the lowest recorded since 1979. Dom-estic rice prices soared, compelling the government to import over 340,000 tonsof rice. Although Sri Lanka has on occasions come close to achieving self suffi-ciency in rice, productivity in the paddy sector has not improved and theaverage yield of paddy has stagnated at around 3.5 tons\ha for nearly a decade.The main (maha) rice harvest (September/October-March/April) accounts foraround two-thirds of rice production, followed by the second (yala) crop(April/May-August/September).
Output of key agricultural crops, 1996
Tea (m kg) 258
Rubber (m kg) 112
Coconut (m nuts) 2,546
Paddy (unmilled rice) (’000 tons) 2,061Source: Central Bank of Sri Lanka, Annual Report 1996.
Construction
Construction growthhas slowed
Growth in the construction sector averaged 5.8% per year in real terms in1992-96. Construction accounts for about 40% of government capital expend-iture. Efforts to contain public capital spending in recent years have thuslimited growth in the construction sector.
The economic boom in the first half of the 1990s boosted construction growth,which benefited from the strong demand for commercial outlets and privatehousing. There was an increase in private investment in high-rise office andapartment complexes and construction output growth peaked at 8.1% in 1992.Output growth was maintained at an average of 6.3% per year in 1993-94, butthe subsequent slowdown in public and private investment in 1995-96 led to adeceleration in construction growth, to 4.9% in 1995 and to 3.4% in 1996.There are no comprehensive statistics about the level of construction activityin the private sector.
The external sector
Merchandise trade
In 1994 imports grew appreciably faster in value than exports, but this wasprimarily owing to the import of aircraft by Air Lanka under its re-fleetingprogramme. In 1995 a sharp reduction in import growth led to a significantnarrowing of the trade deficit. In 1996, however, food imports shot up, whileexports were hit by the power crisis. Exports rose by 7.8% year on year (fobdollar terms), to $4.1bn, and imports rose by 11.4%, to $4.9bn.
Sri Lanka: Construction 33
EIU Country Profile 1997-98 © The Economist Intelligence Unit Limited 1997
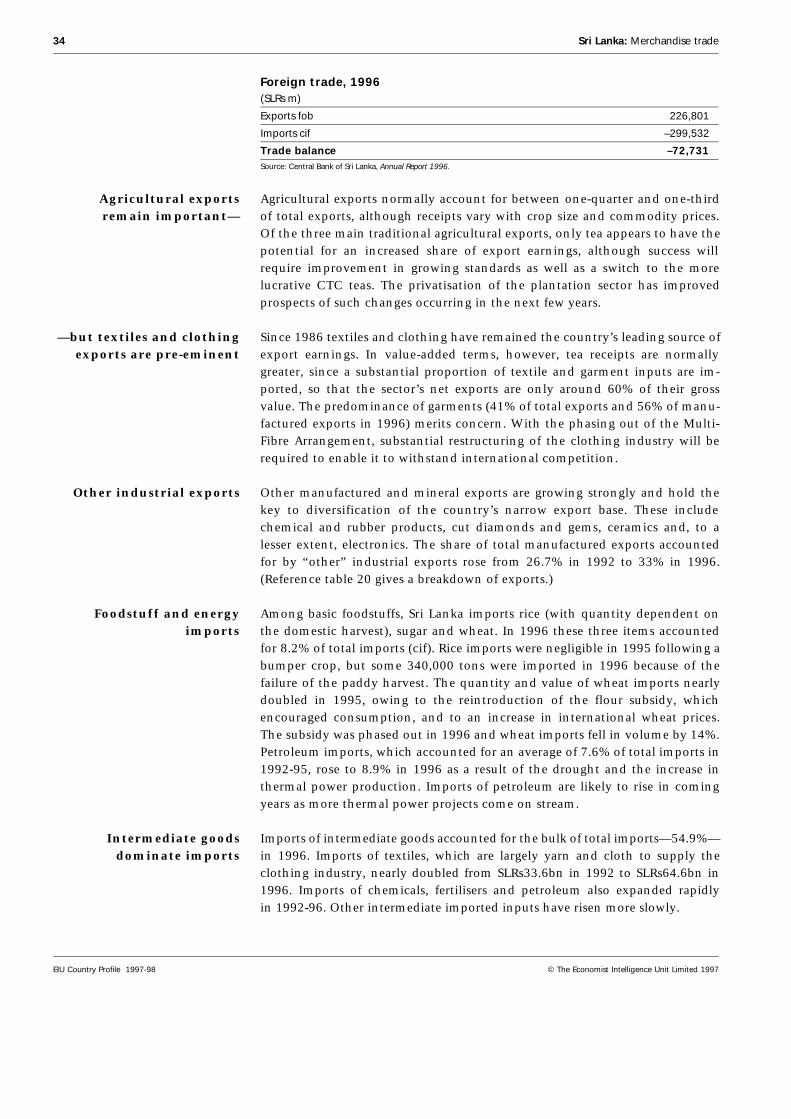
Foreign trade, 1996(SLRs m)
Exports fob 226,801
Imports cif –299,532
Trade balance –72,731Source: Central Bank of Sri Lanka, Annual Report 1996.
Agricultural exportsremain important—
Agricultural exports normally account for between one-quarter and one-thirdof total exports, although receipts vary with crop size and commodity prices.Of the three main traditional agricultural exports, only tea appears to have thepotential for an increased share of export earnings, although success willrequire improvement in growing standards as well as a switch to the morelucrative CTC teas. The privatisation of the plantation sector has improvedprospects of such changes occurring in the next few years.
—but textiles and clothingexports are pre-eminent
Since 1986 textiles and clothing have remained the country’s leading source ofexport earnings. In value-added terms, however, tea receipts are normallygreater, since a substantial proportion of textile and garment inputs are im-ported, so that the sector’s net exports are only around 60% of their grossvalue. The predominance of garments (41% of total exports and 56% of manu-factured exports in 1996) merits concern. With the phasing out of the Multi-Fibre Arrangement, substantial restructuring of the clothing industry will berequired to enable it to withstand international competition.
Other industrial exports Other manufactured and mineral exports are growing strongly and hold thekey to diversification of the country’s narrow export base. These includechemical and rubber products, cut diamonds and gems, ceramics and, to alesser extent, electronics. The share of total manufactured exports accountedfor by “other” industrial exports rose from 26.7% in 1992 to 33% in 1996.(Reference table 20 gives a breakdown of exports.)
Foodstuff and energyimports
Among basic foodstuffs, Sri Lanka imports rice (with quantity dependent onthe domestic harvest), sugar and wheat. In 1996 these three items accountedfor 8.2% of total imports (cif). Rice imports were negligible in 1995 following abumper crop, but some 340,000 tons were imported in 1996 because of thefailure of the paddy harvest. The quantity and value of wheat imports nearlydoubled in 1995, owing to the reintroduction of the flour subsidy, whichencouraged consumption, and to an increase in international wheat prices.The subsidy was phased out in 1996 and wheat imports fell in volume by 14%.Petroleum imports, which accounted for an average of 7.6% of total imports in1992-95, rose to 8.9% in 1996 as a result of the drought and the increase inthermal power production. Imports of petroleum are likely to rise in comingyears as more thermal power projects come on stream.
Intermediate goodsdominate imports
Imports of intermediate goods accounted for the bulk of total imports—54.9%—in 1996. Imports of textiles, which are largely yarn and cloth to supply theclothing industry, nearly doubled from SLRs33.6bn in 1992 to SLRs64.6bn in1996. Imports of chemicals, fertilisers and petroleum also expanded rapidlyin 1992-96. Other intermediate imported inputs have risen more slowly.
34 Sri Lanka: Merchandise trade
EIU Country Profile 1997-98 © The Economist Intelligence Unit Limited 1997
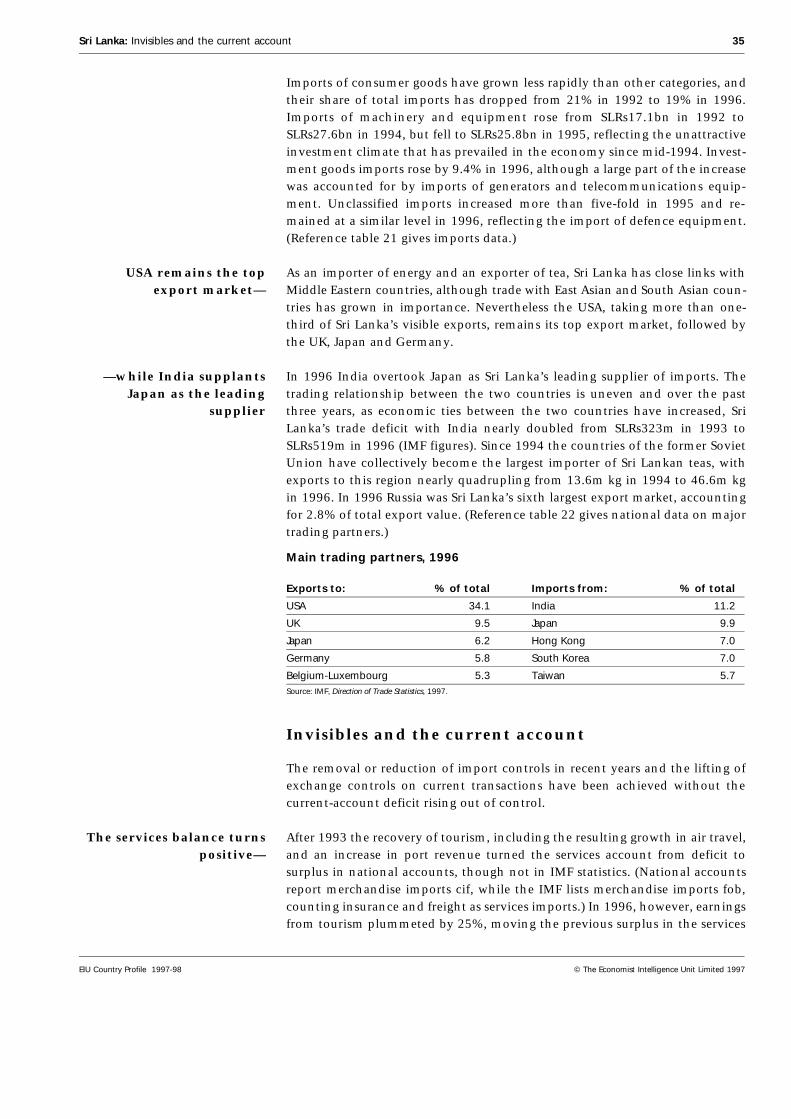
Imports of consumer goods have grown less rapidly than other categories, andtheir share of total imports has dropped from 21% in 1992 to 19% in 1996.Imports of machinery and equipment rose from SLRs17.1bn in 1992 toSLRs27.6bn in 1994, but fell to SLRs25.8bn in 1995, reflecting the unattractiveinvestment climate that has prevailed in the economy since mid-1994. Invest-ment goods imports rose by 9.4% in 1996, although a large part of the increasewas accounted for by imports of generators and telecommunications equip-ment. Unclassified imports increased more than five-fold in 1995 and re-mained at a similar level in 1996, reflecting the import of defence equipment.(Reference table 21 gives imports data.)
USA remains the topexport market—
As an importer of energy and an exporter of tea, Sri Lanka has close links withMiddle Eastern countries, although trade with East Asian and South Asian coun-tries has grown in importance. Nevertheless the USA, taking more than one-third of Sri Lanka’s visible exports, remains its top export market, followed bythe UK, Japan and Germany.
—while India supplantsJapan as the leading
supplier
In 1996 India overtook Japan as Sri Lanka’s leading supplier of imports. Thetrading relationship between the two countries is uneven and over the pastthree years, as economic ties between the two countries have increased, SriLanka’s trade deficit with India nearly doubled from SLRs323m in 1993 toSLRs519m in 1996 (IMF figures). Since 1994 the countries of the former SovietUnion have collectively become the largest importer of Sri Lankan teas, withexports to this region nearly quadrupling from 13.6m kg in 1994 to 46.6m kgin 1996. In 1996 Russia was Sri Lanka’s sixth largest export market, accountingfor 2.8% of total export value. (Reference table 22 gives national data on majortrading partners.)
Main trading partners, 1996
Exports to: % of total Imports from: % of total
USA 34.1 India 11.2
UK 9.5 Japan 9.9
Japan 6.2 Hong Kong 7.0
Germany 5.8 South Korea 7.0
Belgium-Luxembourg 5.3 Taiwan 5.7Source: IMF, Direction of Trade Statistics, 1997.
Invisibles and the current account
The removal or reduction of import controls in recent years and the lifting ofexchange controls on current transactions have been achieved without thecurrent-account deficit rising out of control.
The services balance turnspositive—
After 1993 the recovery of tourism, including the resulting growth in air travel,and an increase in port revenue turned the services account from deficit tosurplus in national accounts, though not in IMF statistics. (National accountsreport merchandise imports cif, while the IMF lists merchandise imports fob,counting insurance and freight as services imports.) In 1996, however, earningsfrom tourism plummeted by 25%, moving the previous surplus in the services
Sri Lanka: Invisibles and the current account 35
EIU Country Profile 1997-98 © The Economist Intelligence Unit Limited 1997
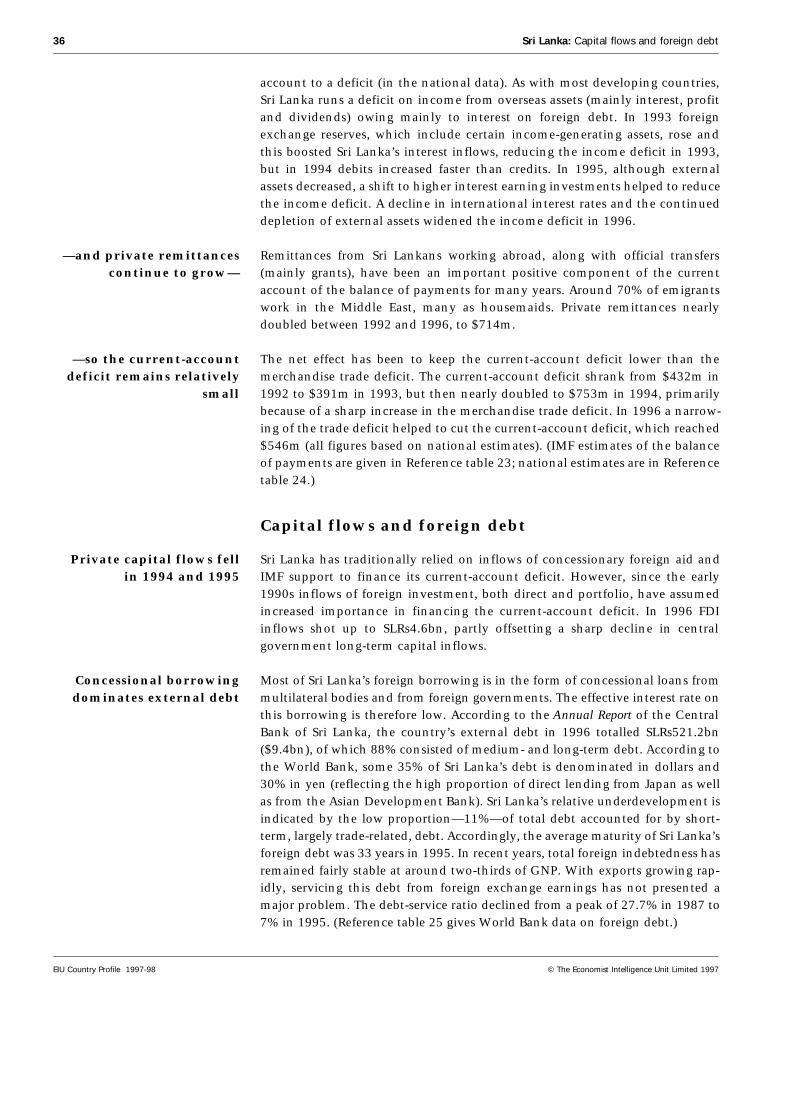
account to a deficit (in the national data). As with most developing countries,Sri Lanka runs a deficit on income from overseas assets (mainly interest, profitand dividends) owing mainly to interest on foreign debt. In 1993 foreignexchange reserves, which include certain income-generating assets, rose andthis boosted Sri Lanka’s interest inflows, reducing the income deficit in 1993,but in 1994 debits increased faster than credits. In 1995, although externalassets decreased, a shift to higher interest earning investments helped to reducethe income deficit. A decline in international interest rates and the continueddepletion of external assets widened the income deficit in 1996.
—and private remittancescontinue to grow—
Remittances from Sri Lankans working abroad, along with official transfers(mainly grants), have been an important positive component of the currentaccount of the balance of payments for many years. Around 70% of emigrantswork in the Middle East, many as housemaids. Private remittances nearlydoubled between 1992 and 1996, to $714m.
—so the current-accountdeficit remains relatively
small
The net effect has been to keep the current-account deficit lower than themerchandise trade deficit. The current-account deficit shrank from $432m in1992 to $391m in 1993, but then nearly doubled to $753m in 1994, primarilybecause of a sharp increase in the merchandise trade deficit. In 1996 a narrow-ing of the trade deficit helped to cut the current-account deficit, which reached$546m (all figures based on national estimates). (IMF estimates of the balanceof payments are given in Reference table 23; national estimates are in Referencetable 24.)
Capital flows and foreign debt
Private capital flows fellin 1994 and 1995
Sri Lanka has traditionally relied on inflows of concessionary foreign aid andIMF support to finance its current-account deficit. However, since the early1990s inflows of foreign investment, both direct and portfolio, have assumedincreased importance in financing the current-account deficit. In 1996 FDIinflows shot up to SLRs4.6bn, partly offsetting a sharp decline in centralgovernment long-term capital inflows.
Concessional borrowingdominates external debt
Most of Sri Lanka’s foreign borrowing is in the form of concessional loans frommultilateral bodies and from foreign governments. The effective interest rate onthis borrowing is therefore low. According to the Annual Report of the CentralBank of Sri Lanka, the country’s external debt in 1996 totalled SLRs521.2bn($9.4bn), of which 88% consisted of medium- and long-term debt. According tothe World Bank, some 35% of Sri Lanka’s debt is denominated in dollars and30% in yen (reflecting the high proportion of direct lending from Japan as wellas from the Asian Development Bank). Sri Lanka’s relative underdevelopment isindicated by the low proportion—11%—of total debt accounted for by short-term, largely trade-related, debt. Accordingly, the average maturity of Sri Lanka’sforeign debt was 33 years in 1995. In recent years, total foreign indebtedness hasremained fairly stable at around two-thirds of GNP. With exports growing rap-idly, servicing this debt from foreign exchange earnings has not presented amajor problem. The debt-service ratio declined from a peak of 27.7% in 1987 to7% in 1995. (Reference table 25 gives World Bank data on foreign debt.)
36 Sri Lanka: Capital flows and foreign debt
EIU Country Profile 1997-98 © The Economist Intelligence Unit Limited 1997
Foreign reserves and the exchange rate
The level of reserves iscomfortable
From a low point in 1988-89, when they were equivalent to around just onemonth’s worth of imports, foreign exchange reserves have grown steadily inrecent years. At the end of 1994 reserves were equivalent to over four months’import cover. They remained at approximately the same level in 1995, but theoverall balance-of-payments deficit in 1996 necessitated a running down ofreserves; they had declined to an estimated 3.9 months’ import cover by theend of the year. (Reference table 26 shows data on external reserves.)
Foreign reserves comparisons, end-1996
Total Per head ($ bn) ($)
Sri Lanka 1.97 107.5
Pakistan 1.24 9.4a
India 23.78 24.9
a 1995/96 population
Sources: National estimates; EIU.
The rupee continues todepreciate—
The rupee is allowed to float against a basket of currencies weighted towards theUS dollar. The Central Bank maintains a 2% margin between daily buying andselling rates, to guide commercial banks in quoting their rates.
Since 1978 the overall trend of the Sri Lankan rupee has been downwards,reflecting the persistent current-account deficit and relatively high inflationrates. From mid-1993 to mid-1994 the rupee barely moved, fluctuating be-tween SLRs49:$1 and SLRs49.7:$1; it then dipped below the SLRs50:$1 barrierin February 1995. It had moved down to SLRs54.05:$1 by the end of 1995, anddeclined further to stand at $56.71:$1 in December 1996. By mid-May 1997 therupee had fallen to SLRs59.25:$1—the 4.5% rate of depreciation being onlyhalf a percentage point below the 5% depreciation of the rupee for the wholeof 1996. By the end of September the rupee had slid to SLRs59.7:$1, a 4.9%depreciation since the start of the year. (Reference table 27 gives exchange ratesagainst several currencies.)
—but exporters say it isstill overvalued
Exchange rate depreciation has become a controversial issue. Exporters com-plain that the rupee is overvalued and that inadequate depreciation vis-à-vis thecurrencies of their major trading competitors has harmed Sri Lanka’s exports.However, a sharp devaluation of the rupee would increase inflation, given SriLanka’s heavy dependence on imports of food, industrial inputs and capitalgoods. The government has tried to compensate exporters by extending otherincentives, such as lower taxes and concessionary finance, aimed at reducingproduction costs in the export industries. However, in the first few months of1997 the Central Bank allowed the rupee to depreciate at a significantly fasterrate, in part owing to the strengthening of the dollar in international markets.
Sri Lanka: Foreign reserves and the exchange rate 37
EIU Country Profile 1997-98 © The Economist Intelligence Unit Limited 1997
Appendices
Sources of information
National statistical sources Central Bank of Sri Lanka, Annual Report
Central Bank of Sri Lanka, Monthly Bulletin
Central Bank of Sri Lanka, Selected Economic Indicators (fortnightly)
Central Bank of Sri Lanka, Sri Lanka Socio-Economic Data 1996 (annual)
Department of Census and Statistics, Sri Lanka Labour Force Survey (quarterly)
Department of Census and Statistics, Statistical Abstract (annual)
Department of National Planning, Public Investment Programme 1996-2000
Sri Lanka Customs, External Trade Statistics (annual)
International statisticalsources
IMF, International Financial Statistics (monthly)
World Bank, World Development Report (annual)
Select bibliography Economist Intelligence Unit, Sri Lanka Country Forecast (quarterly)
Economist Intelligence Unit, Sri Lanka Country Report (quarterly)
Economist Intelligence Unit, Sri Lanka Country Risk Service (quarterly)
Centre for Regional Development Studies, Sri Lanka 2000: Towards the 21st century
Selected Internet sites • Board of Investment: http://www.boisrilanka.org
• General information and news: http://www.lk
• Government Departments: http://www.lk/national/ministry/htm
• Public Enterprises Reform Commission: http://www. lanka.net/lisl2/yellow/perc/
38 Sri Lanka: Sources of information
EIU Country Profile 1997-98 © The Economist Intelligence Unit Limited 1997

Reference tables
Reference table 1
Government finances(SLRs m unless otherwise indicated)
1992 1993 1994 1995 1996a
Budget deficit (before grants) 31,193 42,121 57,730 64,224 68,432 % of GDP 7.3 8.4 10.0 9.6 8.9
Total revenue & grants 94,061 106,364 118,295 145,286 154,779 Tax revenue 76,353 85,891 99,417 118,543 130,202 Non-tax revenue 9,428 12,448 10,621 17,715 16,077 Grants 8,280 8,025 8,257 9,028 8,500
Current expenditure 89,639 102,288 127,084 154,159 170,629
Capital expenditure & lending 27,335 38,172 40,684 46,323 44,081
a Provisional.
Source: Central Bank of Sri Lanka, Annual Report 1996.
Reference table 2
Money supply and credit(SLRs m; year-end)
1992 1993 1994 1995 1996
M1 50,057 59,355 70,461 75,217 78,203
M2 129,798 160,136 191,670 228,536 253,201
Domestic credit 144,003 150,697 173,795 223,799 252,317Source: Central Bank of Sri Lanka, Annual Report 1996.
Reference table 3
Interest rates(%; year-end)
1992 1993 1994 1995 1996
Interbank call loan rate (range) 13.0-27.0 16.5-28.0 14.0-28.0 16.0-102.0 13.0-31.0
Prime lending rate (weighted average) 20.2 20.4 17.8 19.9 18.4
Treasury-bill rate3-month 17.7 18.1 18.7 19.3 17.512-month 19.0 19.4 19.4 19.0 17.4Source: Central Bank of Sri Lanka, Annual Report 1996.
Sri Lanka: Reference tables 39
EIU Country Profile 1997-98 © The Economist Intelligence Unit Limited 1997
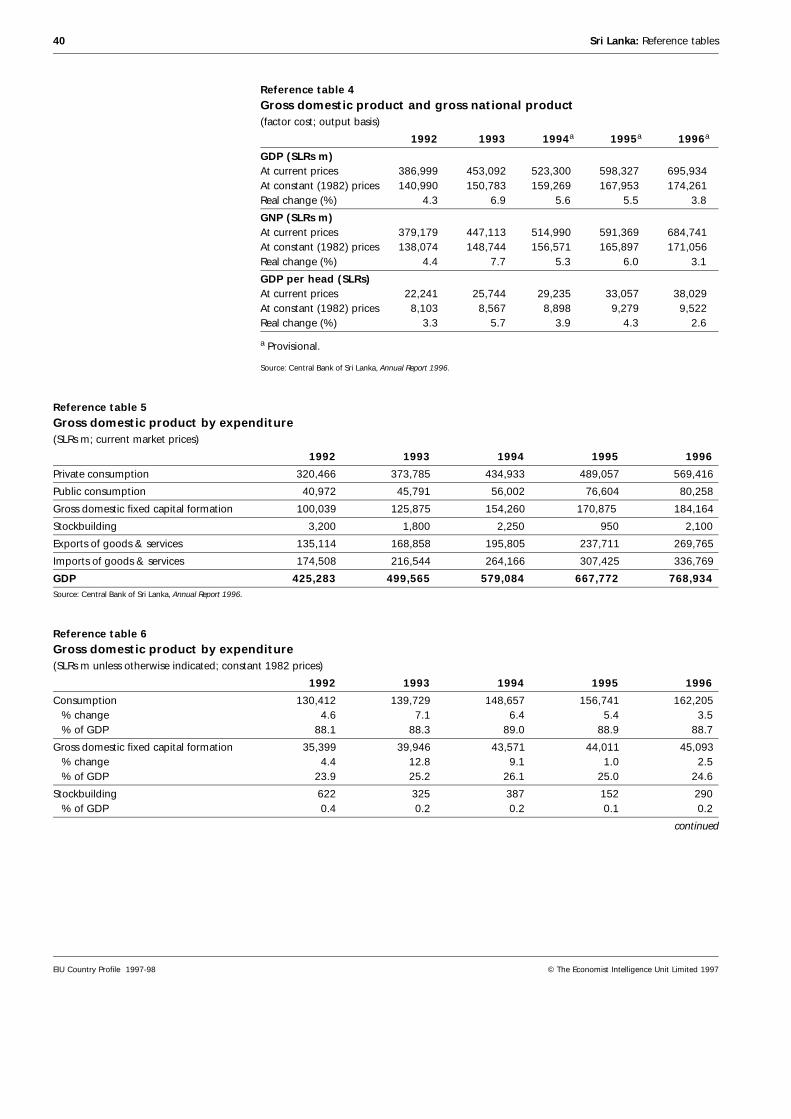
Reference table 4
Gross domestic product and gross national product(factor cost; output basis)
1992 1993 1994a 1995a 1996a
GDP (SLRs m)At current prices 386,999 453,092 523,300 598,327 695,934 At constant (1982) prices 140,990 150,783 159,269 167,953 174,261 Real change (%) 4.3 6.9 5.6 5.5 3.8
GNP (SLRs m)At current prices 379,179 447,113 514,990 591,369 684,741 At constant (1982) prices 138,074 148,744 156,571 165,897 171,056 Real change (%) 4.4 7.7 5.3 6.0 3.1
GDP per head (SLRs)At current prices 22,241 25,744 29,235 33,057 38,029 At constant (1982) prices 8,103 8,567 8,898 9,279 9,522 Real change (%) 3.3 5.7 3.9 4.3 2.6
a Provisional.
Source: Central Bank of Sri Lanka, Annual Report 1996.
Reference table 5
Gross domestic product by expenditure(SLRs m; current market prices)
1992 1993 1994 1995 1996
Private consumption 320,466 373,785 434,933 489,057 569,416
Public consumption 40,972 45,791 56,002 76,604 80,258
Gross domestic fixed capital formation 100,039 125,875 154,260 170,875 184,164
Stockbuilding 3,200 1,800 2,250 950 2,100
Exports of goods & services 135,114 168,858 195,805 237,711 269,765
Imports of goods & services 174,508 216,544 264,166 307,425 336,769
GDP 425,283 499,565 579,084 667,772 768,934Source: Central Bank of Sri Lanka, Annual Report 1996.
Reference table 6
Gross domestic product by expenditure(SLRs m unless otherwise indicated; constant 1982 prices)
1992 1993 1994 1995 1996
Consumption 130,412 139,729 148,657 156,741 162,205 % change 4.6 7.1 6.4 5.4 3.5 % of GDP 88.1 88.3 89.0 88.9 88.7
Gross domestic fixed capital formation 35,399 39,946 43,571 44,011 45,093 % change 4.4 12.8 9.1 1.0 2.5 % of GDP 23.9 25.2 26.1 25.0 24.6
Stockbuilding 622 325 387 152 290 % of GDP 0.4 0.2 0.2 0.1 0.2
continued
40 Sri Lanka: Reference tables
EIU Country Profile 1997-98 © The Economist Intelligence Unit Limited 1997
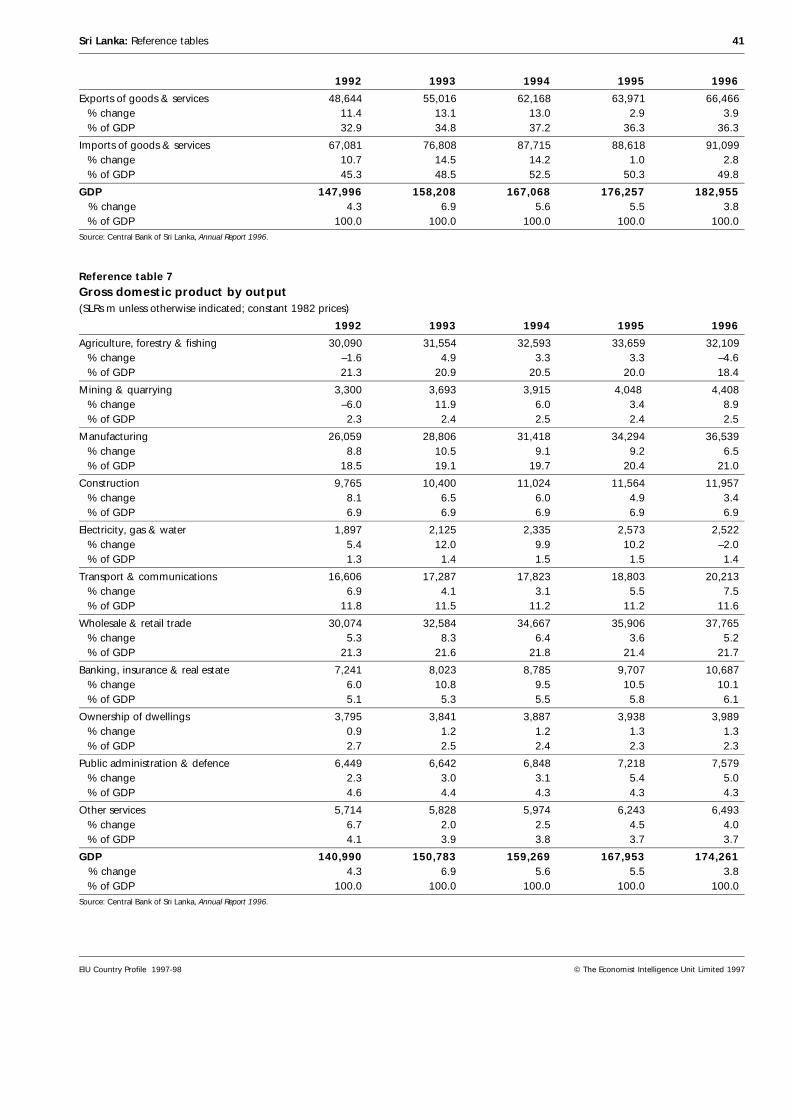
1992 1993 1994 1995 1996
Exports of goods & services 48,644 55,016 62,168 63,971 66,466 % change 11.4 13.1 13.0 2.9 3.9 % of GDP 32.9 34.8 37.2 36.3 36.3
Imports of goods & services 67,081 76,808 87,715 88,618 91,099 % change 10.7 14.5 14.2 1.0 2.8 % of GDP 45.3 48.5 52.5 50.3 49.8
GDP 147,996 158,208 167,068 176,257 182,955 % change 4.3 6.9 5.6 5.5 3.8 % of GDP 100.0 100.0 100.0 100.0 100.0Source: Central Bank of Sri Lanka, Annual Report 1996.
Reference table 7
Gross domestic product by output(SLRs m unless otherwise indicated; constant 1982 prices)
1992 1993 1994 1995 1996
Agriculture, forestry & fishing 30,090 31,554 32,593 33,659 32,109 % change –1.6 4.9 3.3 3.3 –4.6 % of GDP 21.3 20.9 20.5 20.0 18.4
Mining & quarrying 3,300 3,693 3,915 4,048 4,408 % change –6.0 11.9 6.0 3.4 8.9 % of GDP 2.3 2.4 2.5 2.4 2.5
Manufacturing 26,059 28,806 31,418 34,294 36,539 % change 8.8 10.5 9.1 9.2 6.5 % of GDP 18.5 19.1 19.7 20.4 21.0
Construction 9,765 10,400 11,024 11,564 11,957 % change 8.1 6.5 6.0 4.9 3.4 % of GDP 6.9 6.9 6.9 6.9 6.9
Electricity, gas & water 1,897 2,125 2,335 2,573 2,522 % change 5.4 12.0 9.9 10.2 –2.0 % of GDP 1.3 1.4 1.5 1.5 1.4
Transport & communications 16,606 17,287 17,823 18,803 20,213 % change 6.9 4.1 3.1 5.5 7.5 % of GDP 11.8 11.5 11.2 11.2 11.6
Wholesale & retail trade 30,074 32,584 34,667 35,906 37,765 % change 5.3 8.3 6.4 3.6 5.2 % of GDP 21.3 21.6 21.8 21.4 21.7
Banking, insurance & real estate 7,241 8,023 8,785 9,707 10,687 % change 6.0 10.8 9.5 10.5 10.1 % of GDP 5.1 5.3 5.5 5.8 6.1
Ownership of dwellings 3,795 3,841 3,887 3,938 3,989 % change 0.9 1.2 1.2 1.3 1.3 % of GDP 2.7 2.5 2.4 2.3 2.3
Public administration & defence 6,449 6,642 6,848 7,218 7,579 % change 2.3 3.0 3.1 5.4 5.0 % of GDP 4.6 4.4 4.3 4.3 4.3
Other services 5,714 5,828 5,974 6,243 6,493 % change 6.7 2.0 2.5 4.5 4.0 % of GDP 4.1 3.9 3.8 3.7 3.7
GDP 140,990 150,783 159,269 167,953 174,261 % change 4.3 6.9 5.6 5.5 3.8 % of GDP 100.0 100.0 100.0 100.0 100.0Source: Central Bank of Sri Lanka, Annual Report 1996.
Sri Lanka: Reference tables 41
EIU Country Profile 1997-98 © The Economist Intelligence Unit Limited 1997
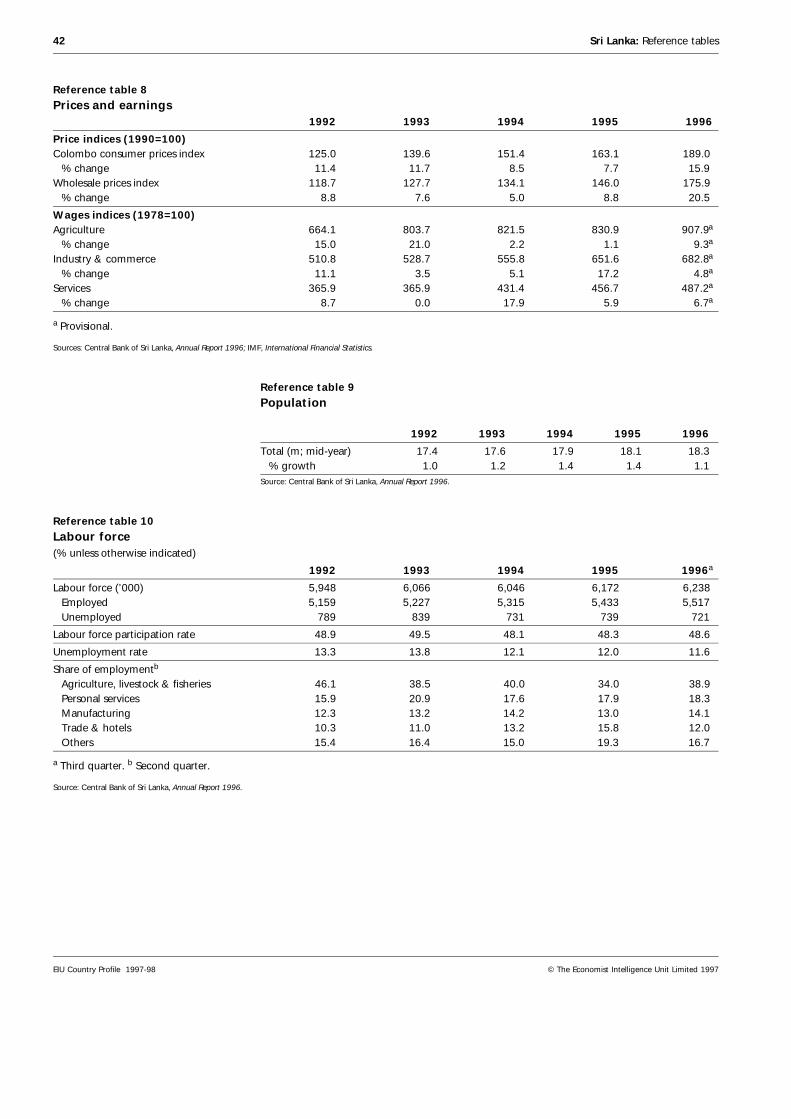
Reference table 8
Prices and earnings1992 1993 1994 1995 1996
Price indices (1990=100)Colombo consumer prices index 125.0 139.6 151.4 163.1 189.0 % change 11.4 11.7 8.5 7.7 15.9 Wholesale prices index 118.7 127.7 134.1 146.0 175.9 % change 8.8 7.6 5.0 8.8 20.5
Wages indices (1978=100)Agriculture 664.1 803.7 821.5 830.9 907.9a
% change 15.0 21.0 2.2 1.1 9.3a
Industry & commerce 510.8 528.7 555.8 651.6 682.8a
% change 11.1 3.5 5.1 17.2 4.8a
Services 365.9 365.9 431.4 456.7 487.2a
% change 8.7 0.0 17.9 5.9 6.7a
a Provisional.
Sources: Central Bank of Sri Lanka, Annual Report 1996; IMF, International Financial Statistics.
Reference table 9
Population
1992 1993 1994 1995 1996
Total (m; mid-year) 17.4 17.6 17.9 18.1 18.3 % growth 1.0 1.2 1.4 1.4 1.1Source: Central Bank of Sri Lanka, Annual Report 1996.
Reference table 10
Labour force(% unless otherwise indicated)
1992 1993 1994 1995 1996a
Labour force (’000) 5,948 6,066 6,046 6,172 6,238 Employed 5,159 5,227 5,315 5,433 5,517 Unemployed 789 839 731 739 721
Labour force participation rate 48.9 49.5 48.1 48.3 48.6
Unemployment rate 13.3 13.8 12.1 12.0 11.6
Share of employmentb
Agriculture, livestock & fisheries 46.1 38.5 40.0 34.0 38.9 Personal services 15.9 20.9 17.6 17.9 18.3 Manufacturing 12.3 13.2 14.2 13.0 14.1 Trade & hotels 10.3 11.0 13.2 15.8 12.0 Others 15.4 16.4 15.0 19.3 16.7
a Third quarter. b Second quarter.
Source: Central Bank of Sri Lanka, Annual Report 1996.
42 Sri Lanka: Reference tables
EIU Country Profile 1997-98 © The Economist Intelligence Unit Limited 1997
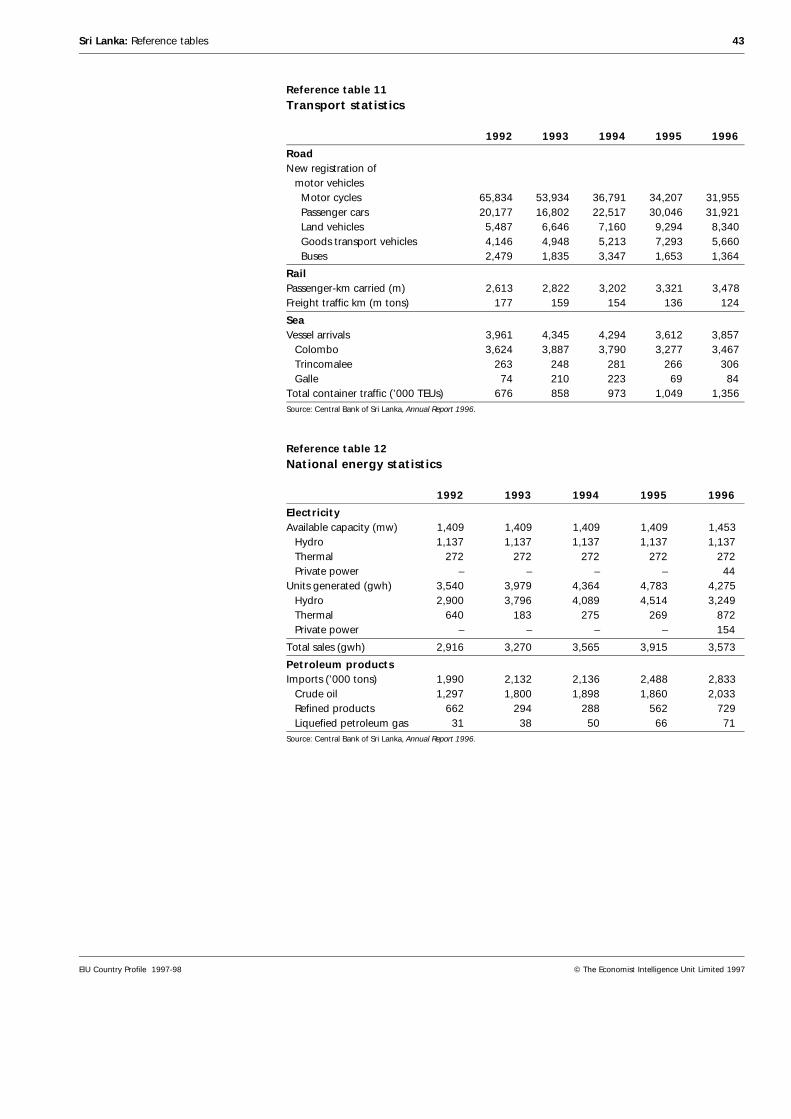
Reference table 11
Transport statistics
1992 1993 1994 1995 1996
RoadNew registration of motor vehicles Motor cycles 65,834 53,934 36,791 34,207 31,955 Passenger cars 20,177 16,802 22,517 30,046 31,921 Land vehicles 5,487 6,646 7,160 9,294 8,340 Goods transport vehicles 4,146 4,948 5,213 7,293 5,660 Buses 2,479 1,835 3,347 1,653 1,364
RailPassenger-km carried (m) 2,613 2,822 3,202 3,321 3,478Freight traffic km (m tons) 177 159 154 136 124
SeaVessel arrivals 3,961 4,345 4,294 3,612 3,857 Colombo 3,624 3,887 3,790 3,277 3,467 Trincomalee 263 248 281 266 306 Galle 74 210 223 69 84Total container traffic (’000 TEUs) 676 858 973 1,049 1,356Source: Central Bank of Sri Lanka, Annual Report 1996.
Reference table 12
National energy statistics
1992 1993 1994 1995 1996
ElectricityAvailable capacity (mw) 1,409 1,409 1,409 1,409 1,453 Hydro 1,137 1,137 1,137 1,137 1,137 Thermal 272 272 272 272 272 Private power – – – – 44Units generated (gwh) 3,540 3,979 4,364 4,783 4,275 Hydro 2,900 3,796 4,089 4,514 3,249 Thermal 640 183 275 269 872 Private power – – – – 154
Total sales (gwh) 2,916 3,270 3,565 3,915 3,573
Petroleum productsImports (’000 tons) 1,990 2,132 2,136 2,488 2,833 Crude oil 1,297 1,800 1,898 1,860 2,033 Refined products 662 294 288 562 729 Liquefied petroleum gas 31 38 50 66 71Source: Central Bank of Sri Lanka, Annual Report 1996.
Sri Lanka: Reference tables 43
EIU Country Profile 1997-98 © The Economist Intelligence Unit Limited 1997
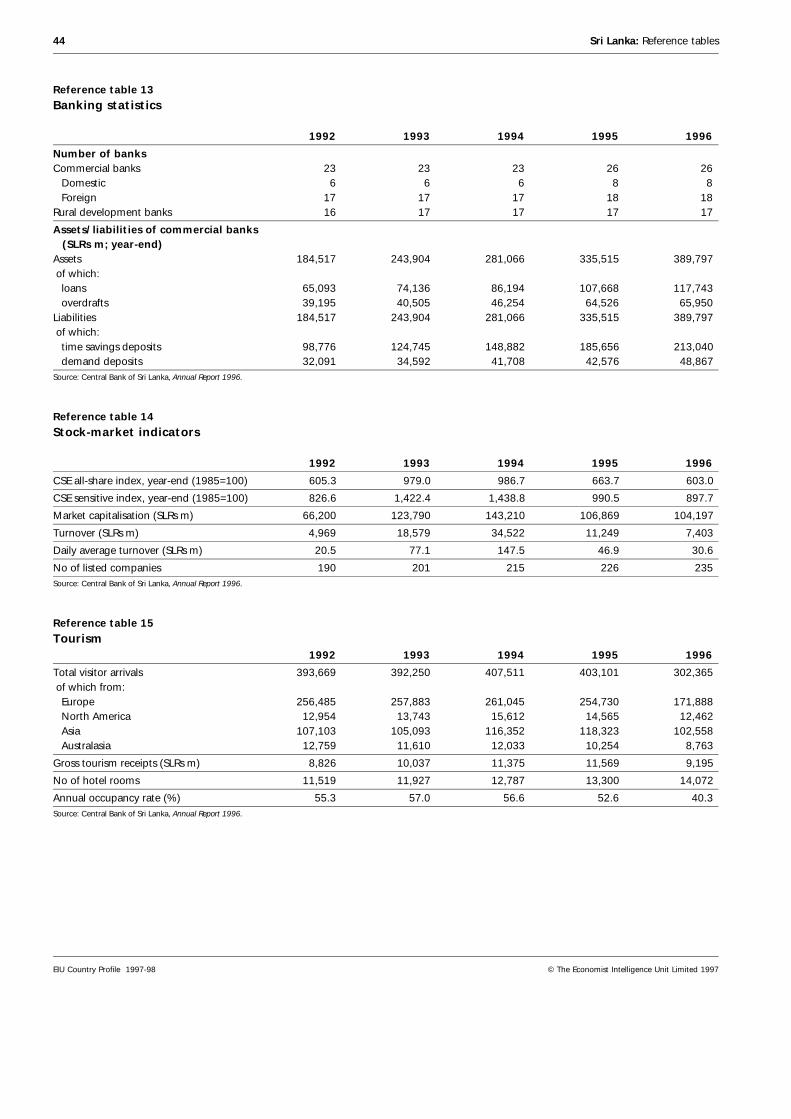
Reference table 13
Banking statistics
1992 1993 1994 1995 1996
Number of banksCommercial banks 23 23 23 26 26 Domestic 6 6 6 8 8 Foreign 17 17 17 18 18Rural development banks 16 17 17 17 17
Assets/liabilities of commercial banks (SLRs m; year-end)Assets 184,517 243,904 281,066 335,515 389,797 of which: loans 65,093 74,136 86,194 107,668 117,743 overdrafts 39,195 40,505 46,254 64,526 65,950Liabilities 184,517 243,904 281,066 335,515 389,797 of which: time savings deposits 98,776 124,745 148,882 185,656 213,040 demand deposits 32,091 34,592 41,708 42,576 48,867Source: Central Bank of Sri Lanka, Annual Report 1996.
Reference table 14
Stock-market indicators
1992 1993 1994 1995 1996
CSE all-share index, year-end (1985=100) 605.3 979.0 986.7 663.7 603.0
CSE sensitive index, year-end (1985=100) 826.6 1,422.4 1,438.8 990.5 897.7
Market capitalisation (SLRs m) 66,200 123,790 143,210 106,869 104,197
Turnover (SLRs m) 4,969 18,579 34,522 11,249 7,403
Daily average turnover (SLRs m) 20.5 77.1 147.5 46.9 30.6
No of listed companies 190 201 215 226 235Source: Central Bank of Sri Lanka, Annual Report 1996.
Reference table 15
Tourism1992 1993 1994 1995 1996
Total visitor arrivals 393,669 392,250 407,511 403,101 302,365 of which from: Europe 256,485 257,883 261,045 254,730 171,888 North America 12,954 13,743 15,612 14,565 12,462 Asia 107,103 105,093 116,352 118,323 102,558 Australasia 12,759 11,610 12,033 10,254 8,763
Gross tourism receipts (SLRs m) 8,826 10,037 11,375 11,569 9,195
No of hotel rooms 11,519 11,927 12,787 13,300 14,072
Annual occupancy rate (%) 55.3 57.0 56.6 52.6 40.3Source: Central Bank of Sri Lanka, Annual Report 1996.
44 Sri Lanka: Reference tables
EIU Country Profile 1997-98 © The Economist Intelligence Unit Limited 1997
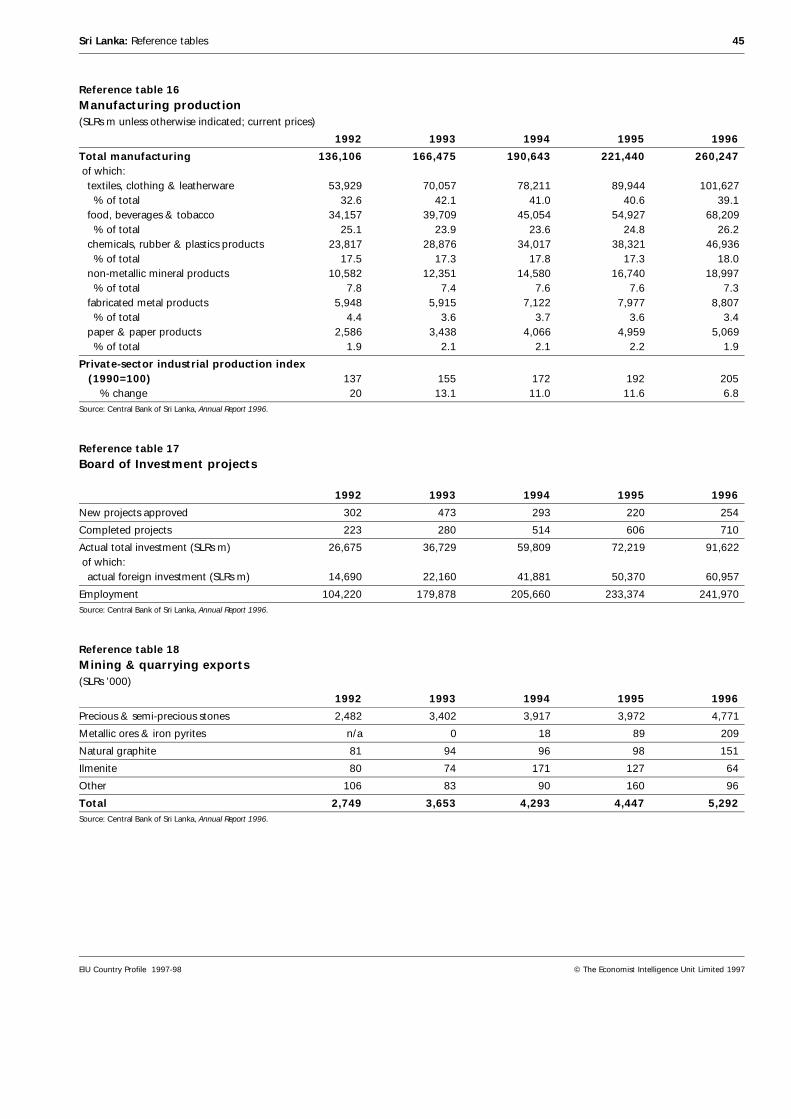
Reference table 16
Manufacturing production(SLRs m unless otherwise indicated; current prices)
1992 1993 1994 1995 1996
Total manufacturing 136,106 166,475 190,643 221,440 260,247 of which: textiles, clothing & leatherware 53,929 70,057 78,211 89,944 101,627 % of total 32.6 42.1 41.0 40.6 39.1 food, beverages & tobacco 34,157 39,709 45,054 54,927 68,209 % of total 25.1 23.9 23.6 24.8 26.2 chemicals, rubber & plastics products 23,817 28,876 34,017 38,321 46,936 % of total 17.5 17.3 17.8 17.3 18.0 non-metallic mineral products 10,582 12,351 14,580 16,740 18,997 % of total 7.8 7.4 7.6 7.6 7.3 fabricated metal products 5,948 5,915 7,122 7,977 8,807 % of total 4.4 3.6 3.7 3.6 3.4 paper & paper products 2,586 3,438 4,066 4,959 5,069 % of total 1.9 2.1 2.1 2.2 1.9
Private-sector industrial production index (1990=100) 137 155 172 192 205 % change 20 13.1 11.0 11.6 6.8Source: Central Bank of Sri Lanka, Annual Report 1996.
Reference table 17
Board of Investment projects
1992 1993 1994 1995 1996
New projects approved 302 473 293 220 254
Completed projects 223 280 514 606 710
Actual total investment (SLRs m) 26,675 36,729 59,809 72,219 91,622 of which: actual foreign investment (SLRs m) 14,690 22,160 41,881 50,370 60,957
Employment 104,220 179,878 205,660 233,374 241,970Source: Central Bank of Sri Lanka, Annual Report 1996.
Reference table 18
Mining & quarrying exports(SLRs ’000)
1992 1993 1994 1995 1996
Precious & semi-precious stones 2,482 3,402 3,917 3,972 4,771
Metallic ores & iron pyrites n/a 0 18 89 209
Natural graphite 81 94 96 98 151
Ilmenite 80 74 171 127 64
Other 106 83 90 160 96
Total 2,749 3,653 4,293 4,447 5,292Source: Central Bank of Sri Lanka, Annual Report 1996.
Sri Lanka: Reference tables 45
EIU Country Profile 1997-98 © The Economist Intelligence Unit Limited 1997
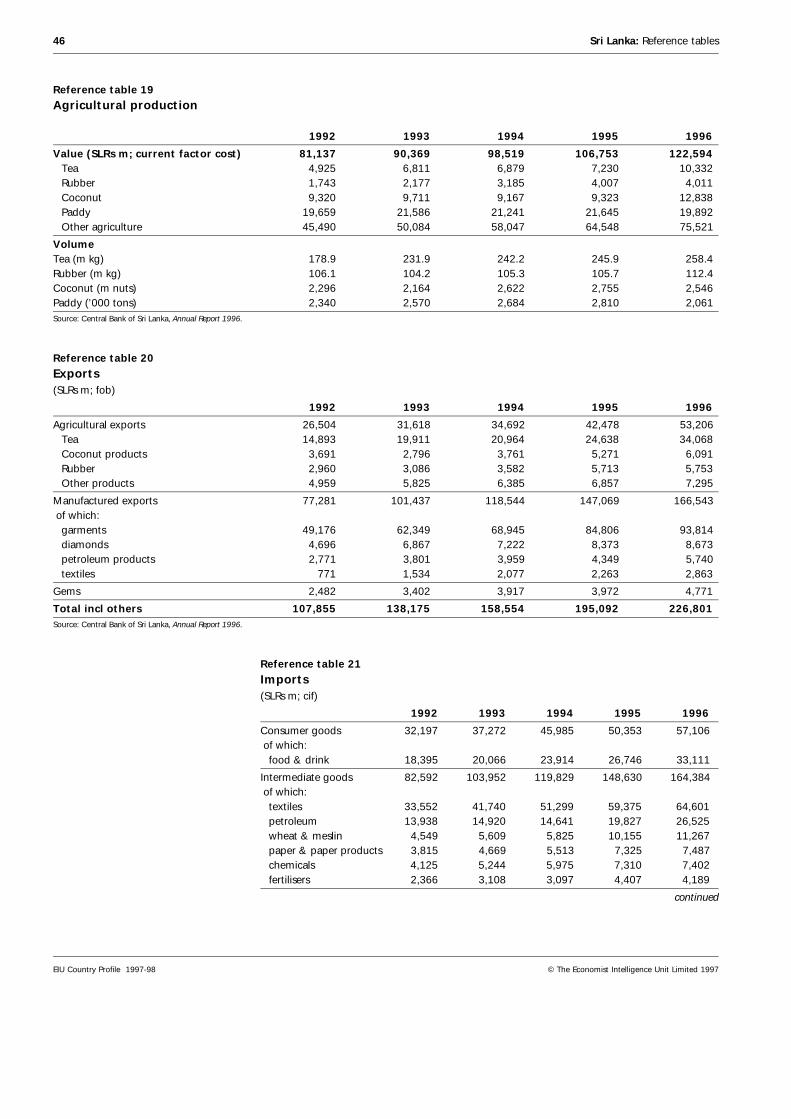
Reference table 19
Agricultural production
1992 1993 1994 1995 1996
Value (SLRs m; current factor cost) 81,137 90,369 98,519 106,753 122,594 Tea 4,925 6,811 6,879 7,230 10,332 Rubber 1,743 2,177 3,185 4,007 4,011 Coconut 9,320 9,711 9,167 9,323 12,838 Paddy 19,659 21,586 21,241 21,645 19,892 Other agriculture 45,490 50,084 58,047 64,548 75,521
VolumeTea (m kg) 178.9 231.9 242.2 245.9 258.4Rubber (m kg) 106.1 104.2 105.3 105.7 112.4Coconut (m nuts) 2,296 2,164 2,622 2,755 2,546Paddy (’000 tons) 2,340 2,570 2,684 2,810 2,061Source: Central Bank of Sri Lanka, Annual Report 1996.
Reference table 20
Exports(SLRs m; fob)
1992 1993 1994 1995 1996
Agricultural exports 26,504 31,618 34,692 42,478 53,206 Tea 14,893 19,911 20,964 24,638 34,068 Coconut products 3,691 2,796 3,761 5,271 6,091 Rubber 2,960 3,086 3,582 5,713 5,753 Other products 4,959 5,825 6,385 6,857 7,295
Manufactured exports 77,281 101,437 118,544 147,069 166,543 of which: garments 49,176 62,349 68,945 84,806 93,814 diamonds 4,696 6,867 7,222 8,373 8,673 petroleum products 2,771 3,801 3,959 4,349 5,740 textiles 771 1,534 2,077 2,263 2,863
Gems 2,482 3,402 3,917 3,972 4,771
Total incl others 107,855 138,175 158,554 195,092 226,801Source: Central Bank of Sri Lanka, Annual Report 1996.
Reference table 21
Imports(SLRs m; cif)
1992 1993 1994 1995 1996
Consumer goods 32,197 37,272 45,985 50,353 57,106 of which: food & drink 18,395 20,066 23,914 26,746 33,111
Intermediate goods 82,592 103,952 119,829 148,630 164,384 of which: textiles 33,552 41,740 51,299 59,375 64,601 petroleum 13,938 14,920 14,641 19,827 26,525 wheat & meslin 4,549 5,609 5,825 10,155 11,267 paper & paper products 3,815 4,669 5,513 7,325 7,487 chemicals 4,125 5,244 5,975 7,310 7,402 fertilisers 2,366 3,108 3,097 4,407 4,189
continued
46 Sri Lanka: Reference tables
EIU Country Profile 1997-98 © The Economist Intelligence Unit Limited 1997
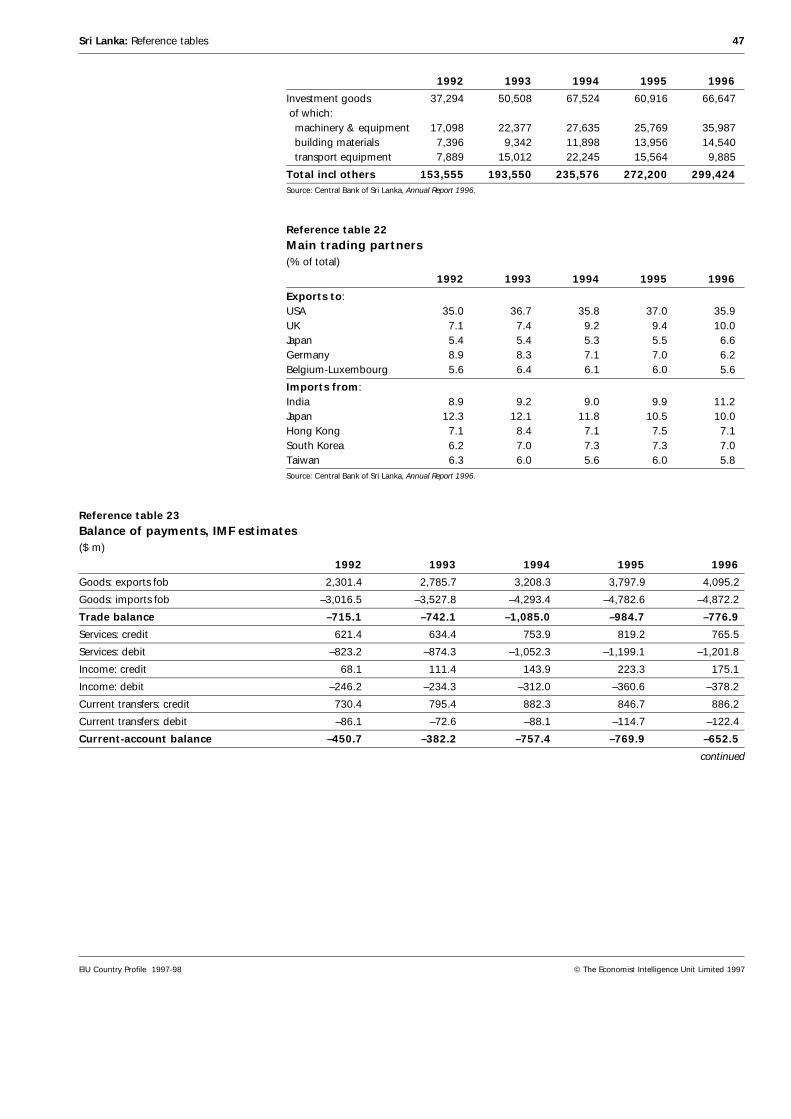
1992 1993 1994 1995 1996
Investment goods 37,294 50,508 67,524 60,916 66,647 of which: machinery & equipment 17,098 22,377 27,635 25,769 35,987 building materials 7,396 9,342 11,898 13,956 14,540 transport equipment 7,889 15,012 22,245 15,564 9,885
Total incl others 153,555 193,550 235,576 272,200 299,424Source: Central Bank of Sri Lanka, Annual Report 1996.
Reference table 22
Main trading partners(% of total)
1992 1993 1994 1995 1996
Exports to:USA 35.0 36.7 35.8 37.0 35.9UK 7.1 7.4 9.2 9.4 10.0Japan 5.4 5.4 5.3 5.5 6.6Germany 8.9 8.3 7.1 7.0 6.2Belgium-Luxembourg 5.6 6.4 6.1 6.0 5.6
Imports from:India 8.9 9.2 9.0 9.9 11.2Japan 12.3 12.1 11.8 10.5 10.0Hong Kong 7.1 8.4 7.1 7.5 7.1South Korea 6.2 7.0 7.3 7.3 7.0Taiwan 6.3 6.0 5.6 6.0 5.8Source: Central Bank of Sri Lanka, Annual Report 1996.
Reference table 23
Balance of payments, IMF estimates($ m)
1992 1993 1994 1995 1996
Goods: exports fob 2,301.4 2,785.7 3,208.3 3,797.9 4,095.2
Goods: imports fob –3,016.5 –3,527.8 –4,293.4 –4,782.6 –4,872.2
Trade balance –715.1 –742.1 –1,085.0 –984.7 –776.9
Services: credit 621.4 634.4 753.9 819.2 765.5
Services: debit –823.2 –874.3 –1,052.3 –1,199.1 –1,201.8
Income: credit 68.1 111.4 143.9 223.3 175.1
Income: debit –246.2 –234.3 –312.0 –360.6 –378.2
Current transfers: credit 730.4 795.4 882.3 846.7 886.2
Current transfers: debit –86.1 –72.6 –88.1 –114.7 –122.4
Current-account balance –450.7 –382.2 –757.4 –769.9 –652.5
continued
Sri Lanka: Reference tables 47
EIU Country Profile 1997-98 © The Economist Intelligence Unit Limited 1997
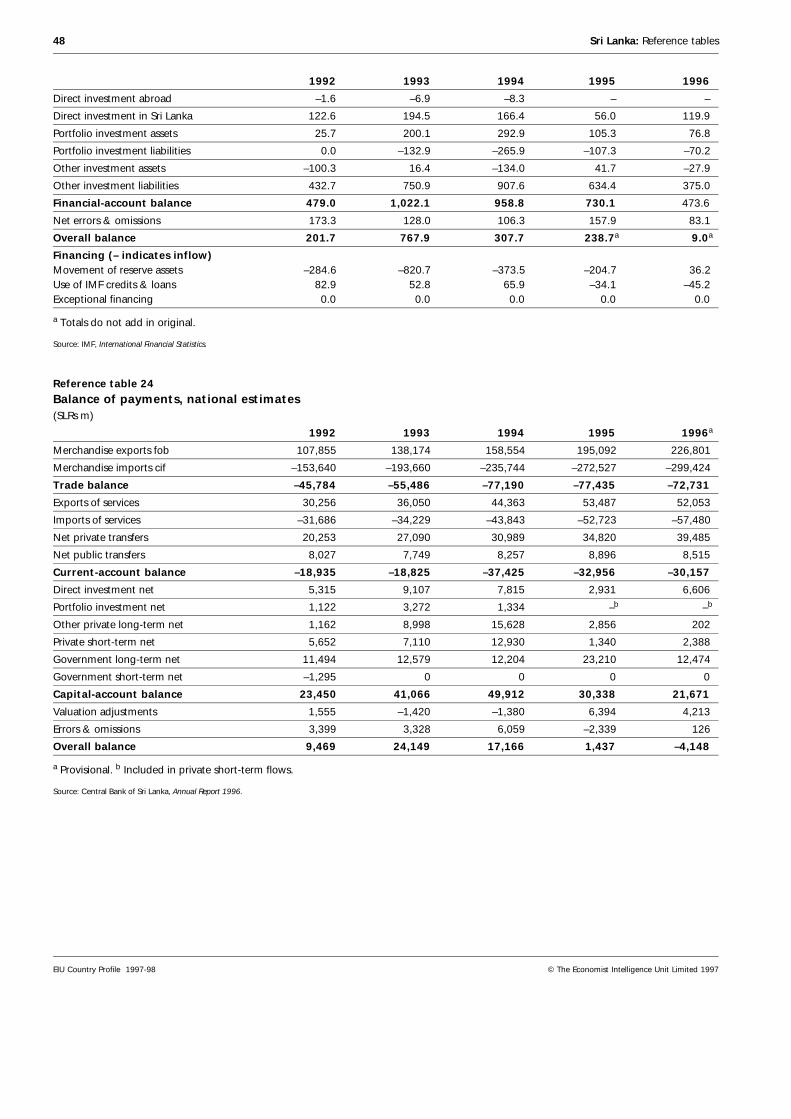
1992 1993 1994 1995 1996
Direct investment abroad –1.6 –6.9 –8.3 – –
Direct investment in Sri Lanka 122.6 194.5 166.4 56.0 119.9
Portfolio investment assets 25.7 200.1 292.9 105.3 76.8
Portfolio investment liabilities 0.0 –132.9 –265.9 –107.3 –70.2
Other investment assets –100.3 16.4 –134.0 41.7 –27.9
Other investment liabilities 432.7 750.9 907.6 634.4 375.0
Financial-account balance 479.0 1,022.1 958.8 730.1 473.6
Net errors & omissions 173.3 128.0 106.3 157.9 83.1
Overall balance 201.7 767.9 307.7 238.7a 9.0a
Financing (– indicates inflow)Movement of reserve assets –284.6 –820.7 –373.5 –204.7 36.2 Use of IMF credits & loans 82.9 52.8 65.9 –34.1 –45.2 Exceptional financing 0.0 0.0 0.0 0.0 0.0
a Totals do not add in original.
Source: IMF, International Financial Statistics.
Reference table 24
Balance of payments, national estimates(SLRs m)
1992 1993 1994 1995 1996a
Merchandise exports fob 107,855 138,174 158,554 195,092 226,801
Merchandise imports cif –153,640 –193,660 –235,744 –272,527 –299,424
Trade balance –45,784 –55,486 –77,190 –77,435 –72,731
Exports of services 30,256 36,050 44,363 53,487 52,053
Imports of services –31,686 –34,229 –43,843 –52,723 –57,480
Net private transfers 20,253 27,090 30,989 34,820 39,485
Net public transfers 8,027 7,749 8,257 8,896 8,515
Current-account balance –18,935 –18,825 –37,425 –32,956 –30,157
Direct investment net 5,315 9,107 7,815 2,931 6,606
Portfolio investment net 1,122 3,272 1,334 –b –b
Other private long-term net 1,162 8,998 15,628 2,856 202
Private short-term net 5,652 7,110 12,930 1,340 2,388
Government long-term net 11,494 12,579 12,204 23,210 12,474
Government short-term net –1,295 0 0 0 0
Capital-account balance 23,450 41,066 49,912 30,338 21,671
Valuation adjustments 1,555 –1,420 –1,380 6,394 4,213
Errors & omissions 3,399 3,328 6,059 –2,339 126
Overall balance 9,469 24,149 17,166 1,437 –4,148
a Provisional. b Included in private short-term flows.
Source: Central Bank of Sri Lanka, Annual Report 1996.
48 Sri Lanka: Reference tables
EIU Country Profile 1997-98 © The Economist Intelligence Unit Limited 1997
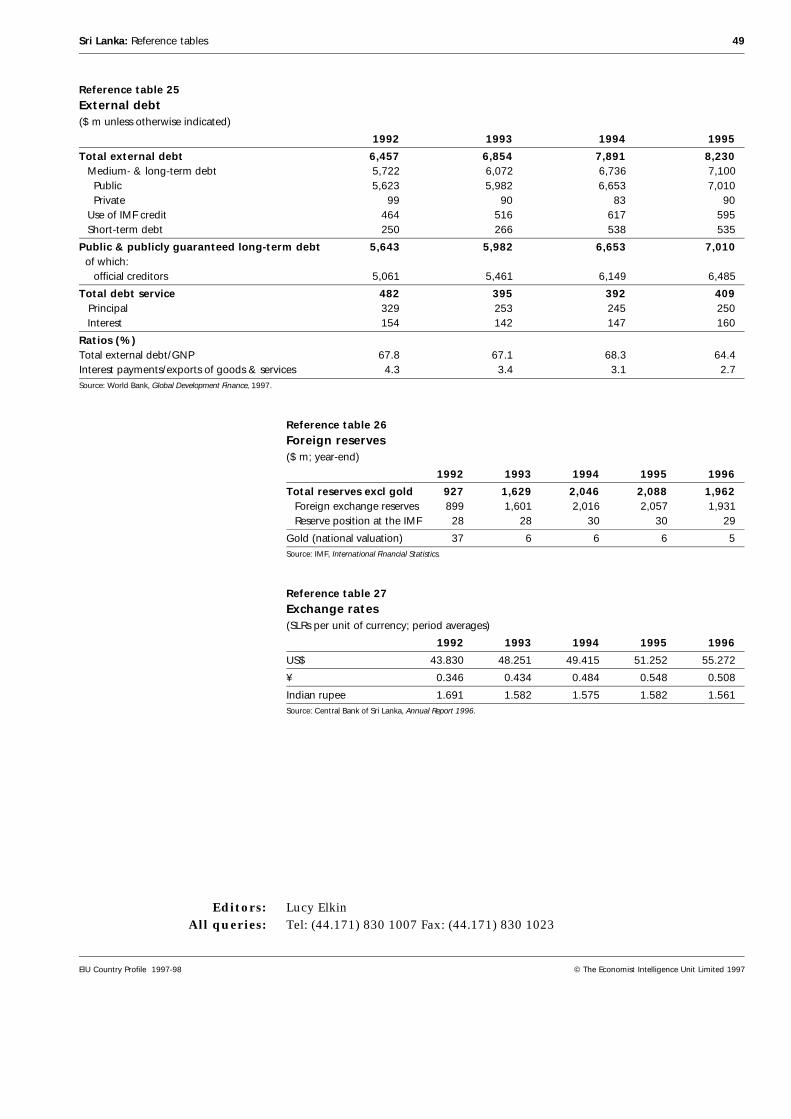
Reference table 25
External debt($ m unless otherwise indicated)
1992 1993 1994 1995
Total external debt 6,457 6,854 7,891 8,230 Medium- & long-term debt 5,722 6,072 6,736 7,100 Public 5,623 5,982 6,653 7,010 Private 99 90 83 90 Use of IMF credit 464 516 617 595 Short-term debt 250 266 538 535
Public & publicly guaranteed long-term debt 5,643 5,982 6,653 7,010 of which: official creditors 5,061 5,461 6,149 6,485
Total debt service 482 395 392 409 Principal 329 253 245 250 Interest 154 142 147 160
Ratios (%)Total external debt/GNP 67.8 67.1 68.3 64.4Interest payments/exports of goods & services 4.3 3.4 3.1 2.7Source: World Bank, Global Development Finance, 1997.
Reference table 26
Foreign reserves($ m; year-end)
1992 1993 1994 1995 1996
Total reserves excl gold 927 1,629 2,046 2,088 1,962 Foreign exchange reserves 899 1,601 2,016 2,057 1,931 Reserve position at the IMF 28 28 30 30 29
Gold (national valuation) 37 6 6 6 5Source: IMF, International Financial Statistics.
Reference table 27
Exchange rates(SLRs per unit of currency; period averages)
1992 1993 1994 1995 1996
US$ 43.830 48.251 49.415 51.252 55.272
¥ 0.346 0.434 0.484 0.548 0.508
Indian rupee 1.691 1.582 1.575 1.582 1.561Source: Central Bank of Sri Lanka, Annual Report 1996.
Editors:All queries:
Lucy ElkinTel: (44.171) 830 1007 Fax: (44.171) 830 1023
Sri Lanka: Reference tables 49
EIU Country Profile 1997-98 © The Economist Intelligence Unit Limited 1997
Related Documents