Get More Out Of Your Data Visualizations Koen Verbeeck

SQL Track: Get more out of your data visualizations
Jan 27, 2015
With data you can tell important and compelling stories, if done right. In this session, we will review a few guidelines on how to create communicative visualizations and how this can be implemented in Excel and Reporting Services.
Because SSRS is often underestimated, we'll finish off with some eye-catchers.
Because SSRS is often underestimated, we'll finish off with some eye-catchers.
Welcome message from author
This document is posted to help you gain knowledge. Please leave a comment to let me know what you think about it! Share it to your friends and learn new things together.
Transcript

Get More Out Of Your
Data VisualizationsKoen Verbeeck
WHO AM I?
AGENDA
• guidelines on data visualization
• showing off with SSRS

AGENDA
• guidelines on data visualization
• showing off with SSRS
GUIDELINES ON DATA VISUALIZATION
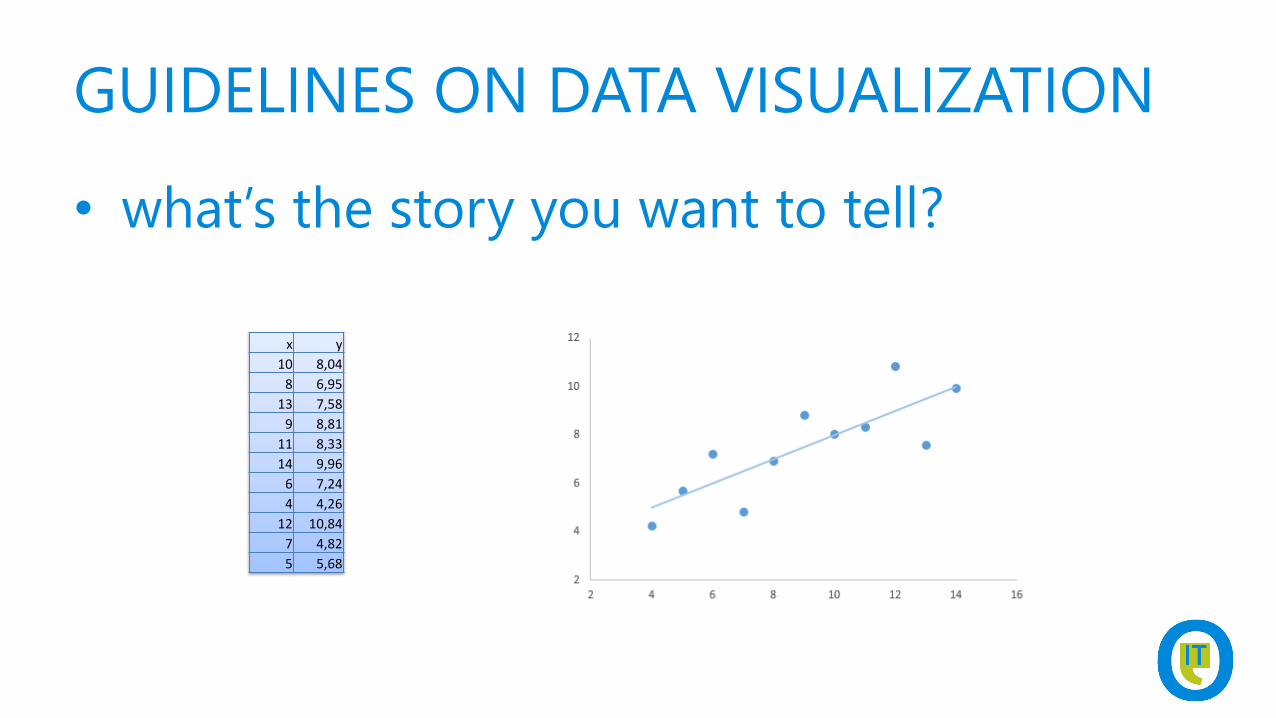
• what’s the story you want to tell?
• choose the correct chart type
• use visual perception wisely
• reduce data/ink ratio
GUIDELINES ON DATA VISUALIZATION
• what’s the story you want to tell?
x y
10 8,04
8 6,95
13 7,58
9 8,81
11 8,33
14 9,96
6 7,24
4 4,26
12 10,84
7 4,82
5 5,68
GUIDELINES ON DATA VISUALIZATION
• different kind of stories
– explanatory: (static) reports / dashboards
• strategic – high level overview
• operational – detail level
– analytical: pivot tables / interactive
visualizations
– exhibition: usually pretty visualizations
GUIDELINES ON DATA VISUALIZATION
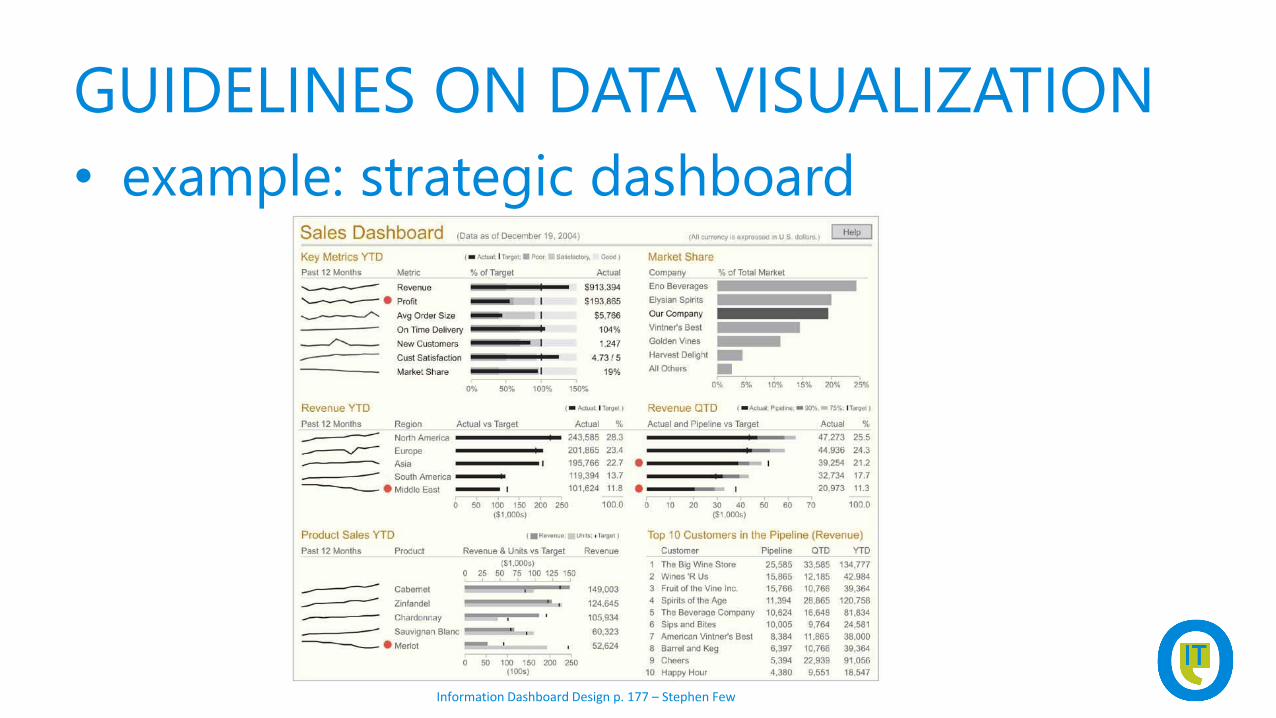
• example: strategic dashboard
Information Dashboard Design p. 177 – Stephen Few

GUIDELINES ON DATA VISUALIZATION
• example: operational dashboard
Information Dashboard Design p. 199 – Stephen Few
GUIDELINES ON DATA VISUALIZATION
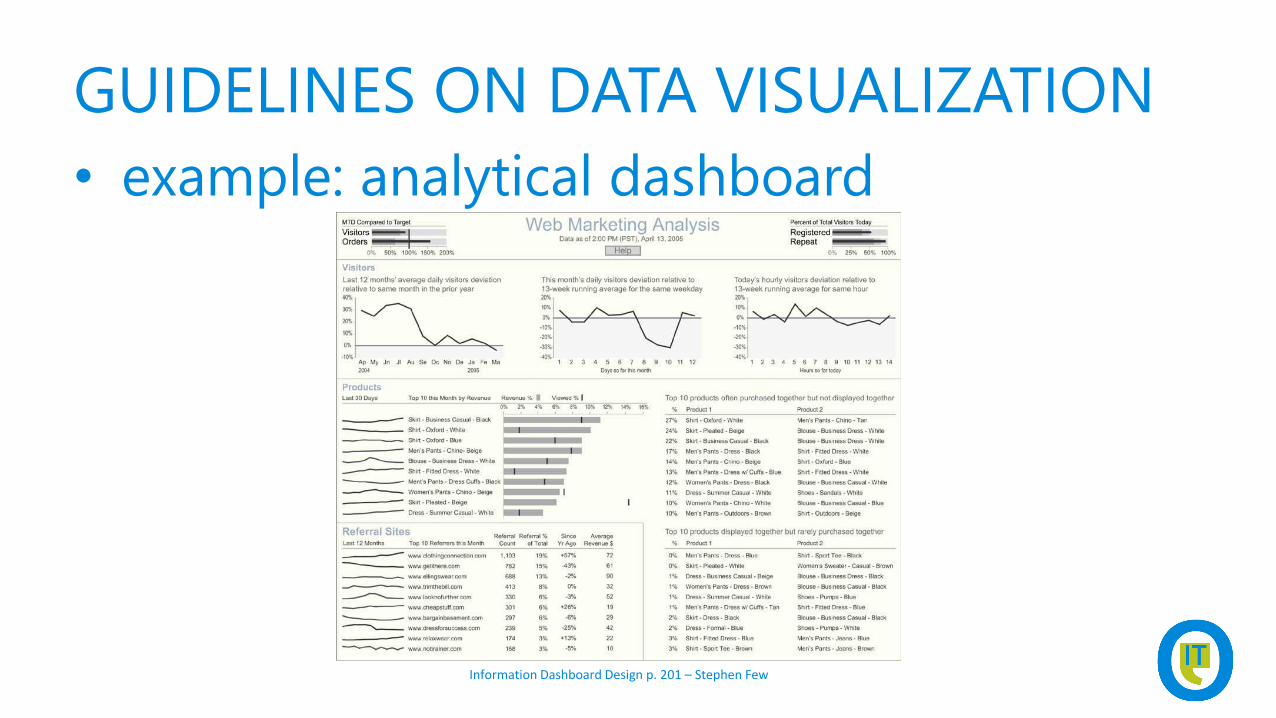
• example: analytical dashboard
Information Dashboard Design p. 201 – Stephen Few
GUIDELINES ON DATA VISUALIZATION
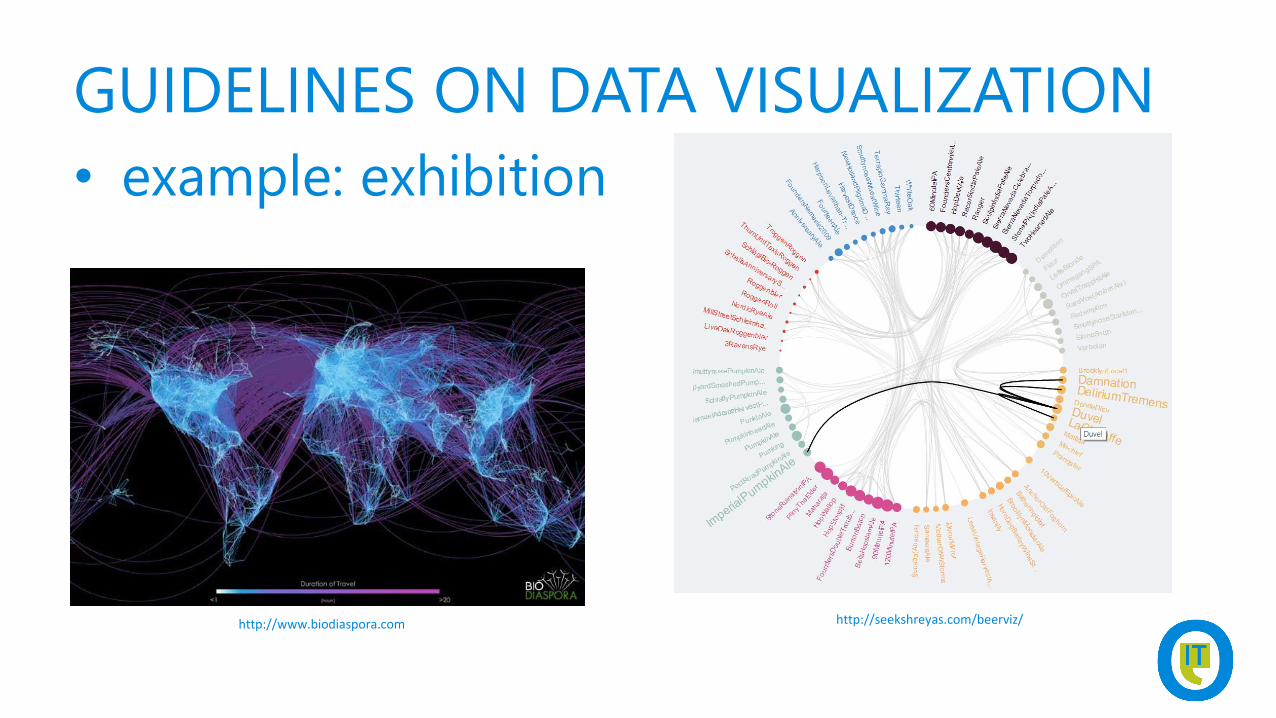
• example: exhibition
http://www.biodiaspora.com http://seekshreyas.com/beerviz/

GUIDELINES ON DATA VISUALIZATION
• choose the correct chart type
– comparing categories
– bar/column chart, dot plot, Gantt, histogram, …

GUIDELINES ON DATA VISUALIZATION
• choose the correct chart type
– showing changes over time
– line chart, sparklines, area chart, candlestick chart, barcode chart…
DEMOCREATE SPARKLINES AND DATA
BARS IN EXCEL

GUIDELINES ON DATA VISUALIZATION
• choose the correct chart type
– hierarchies and part-to-whole relationships
– pie chart, waffle chart, stacked bars, tree map, …
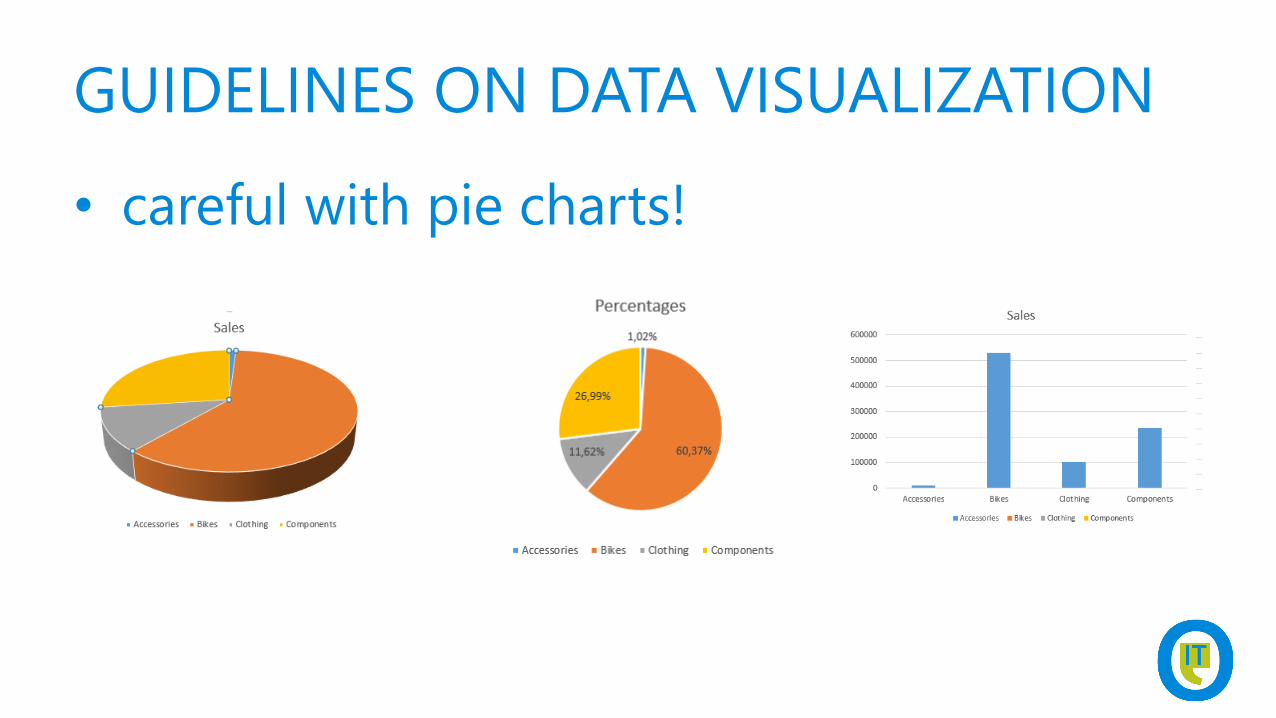
GUIDELINES ON DATA VISUALIZATION
• careful with pie charts!

DEMOCREATE A DECENT PIE CHART IN
SSRS
GUIDELINES ON DATA VISUALIZATION
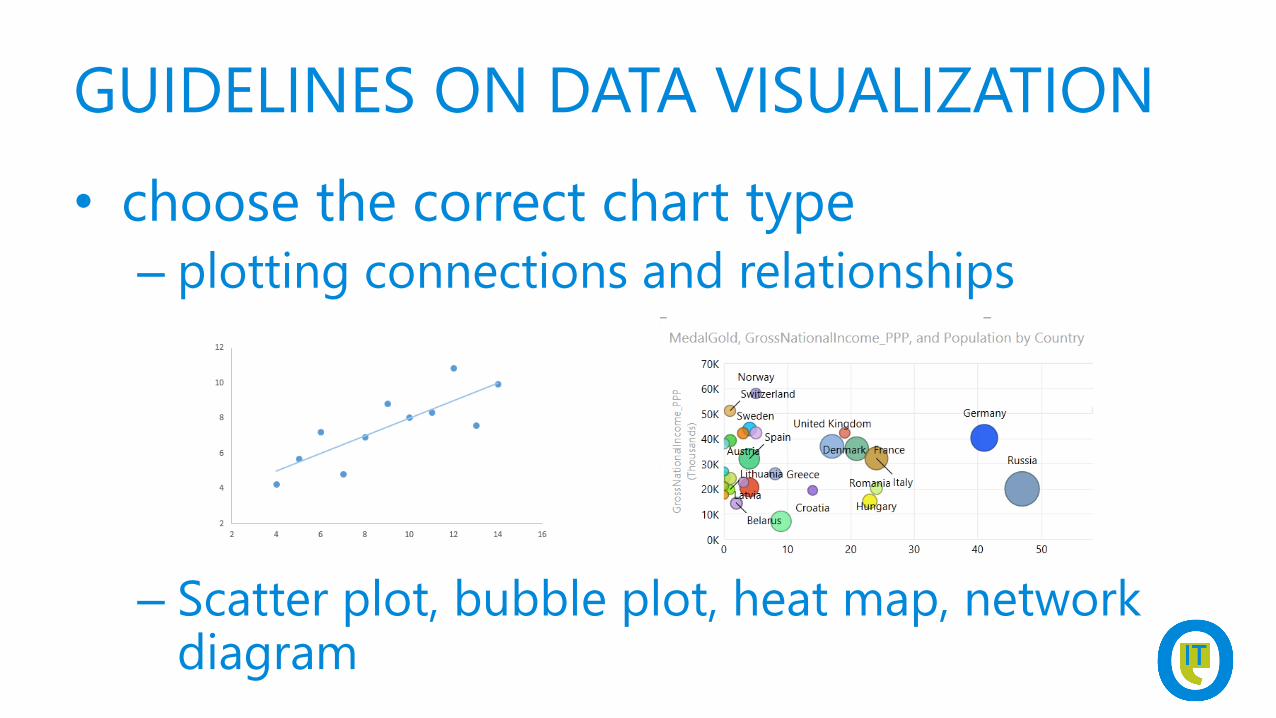
• choose the correct chart type
– plotting connections and relationships
– Scatter plot, bubble plot, heat map, network diagram

GUIDELINES ON DATA VISUALIZATION
• choose the correct chart type
– plotting geo-spatial data
GUIDELINES ON DATA VISUALIZATION
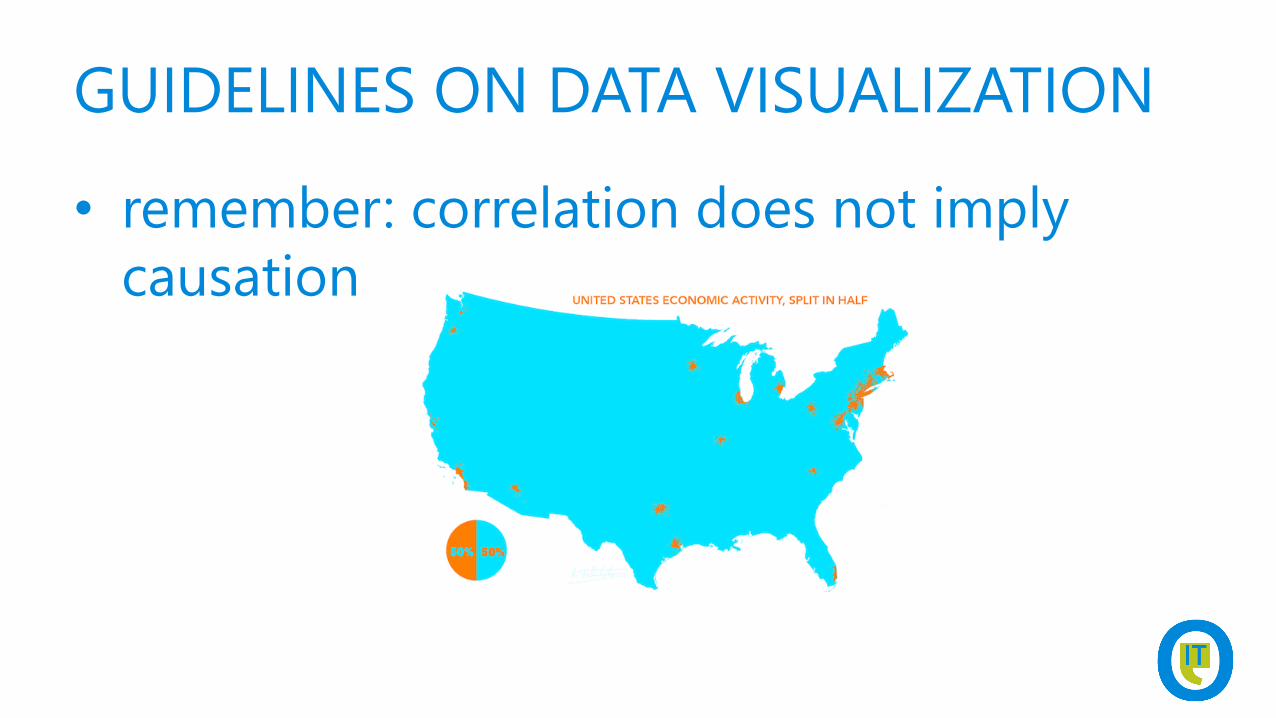
• remember: correlation does not imply
causation
GUIDELINES ON DATA VISUALIZATION
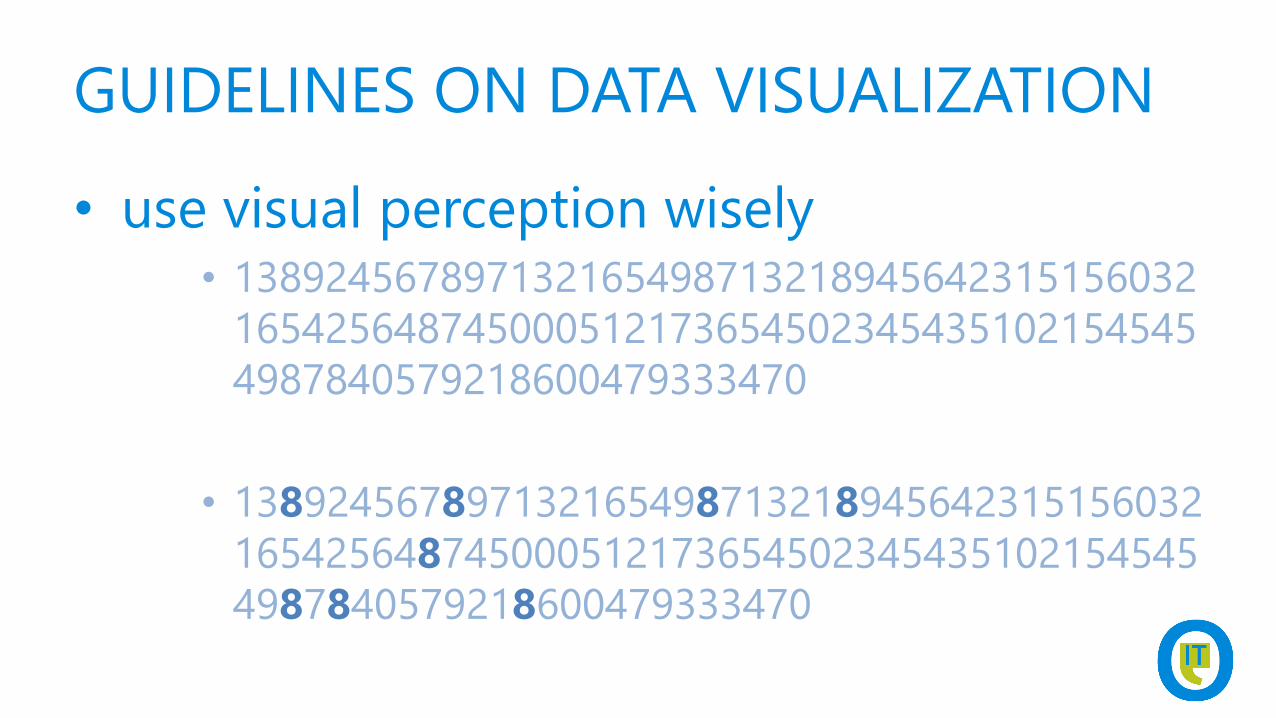
• use visual perception wisely• 138924567897132165498713218945642315156032
165425648745000512173654502345435102154545
4987840579218600479333470
• 138924567897132165498713218945642315156032
165425648745000512173654502345435102154545
4987840579218600479333470
GUIDELINES ON DATA VISUALIZATION
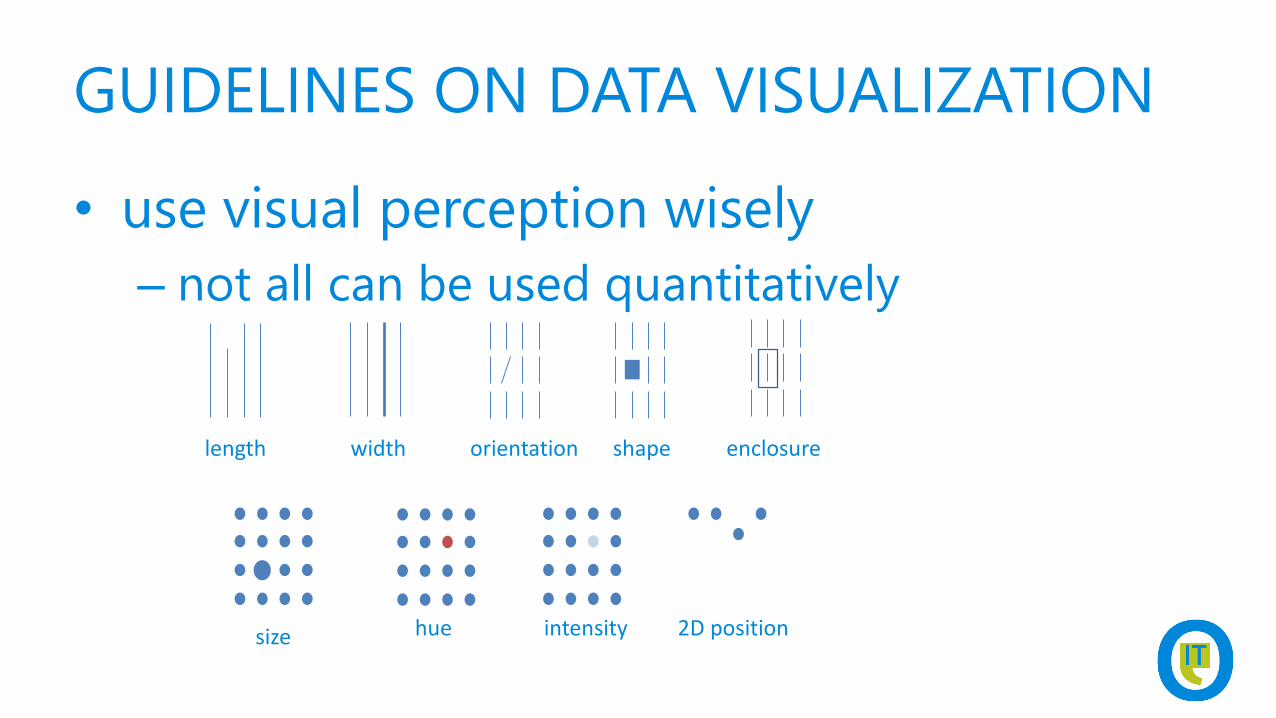
• use visual perception wisely
– not all can be used quantitatively
length width orientation shape enclosure
size hue intensity 2D position

GUIDELINES ON DATA VISUALIZATION
• use visual perception wisely
– an example
http://en.wikipedia.org/wiki/File:FrancePopulationDensity1968.png
http://www.theusrus.de/blog/the-good-the-bad-22012/
GUIDELINES ON DATA VISUALIZATION
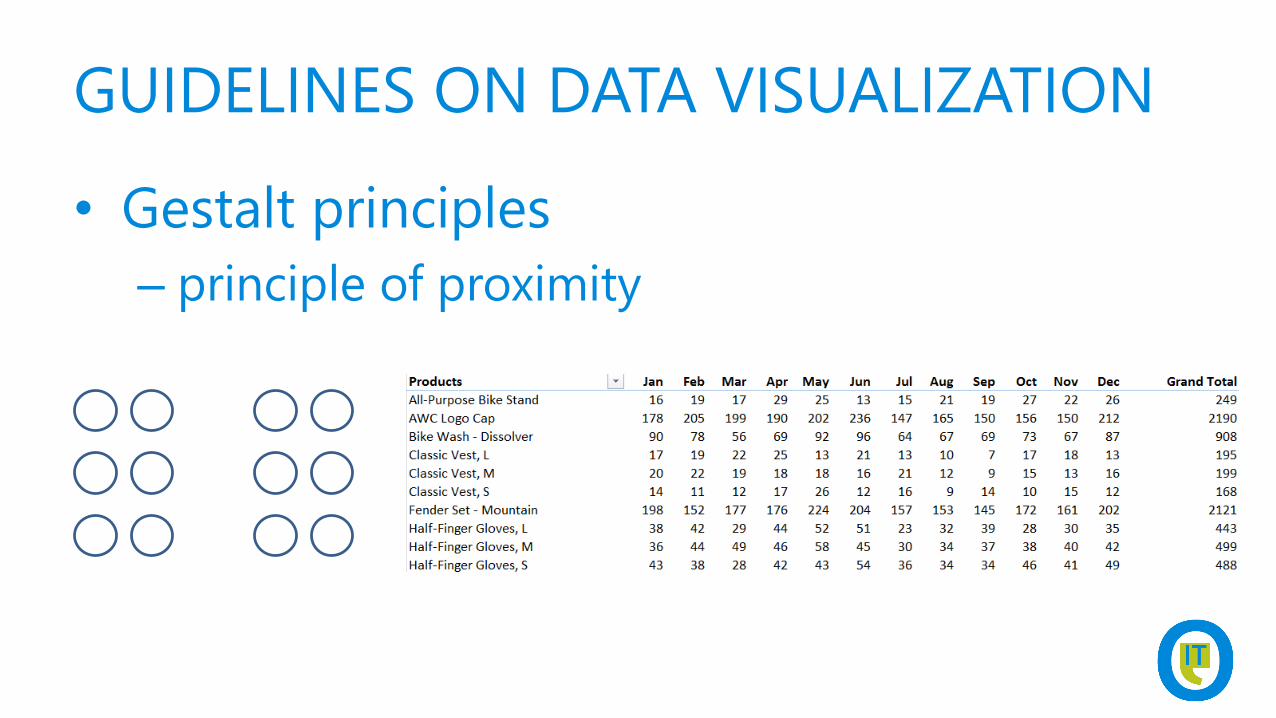
• Gestalt principles
– principle of proximity
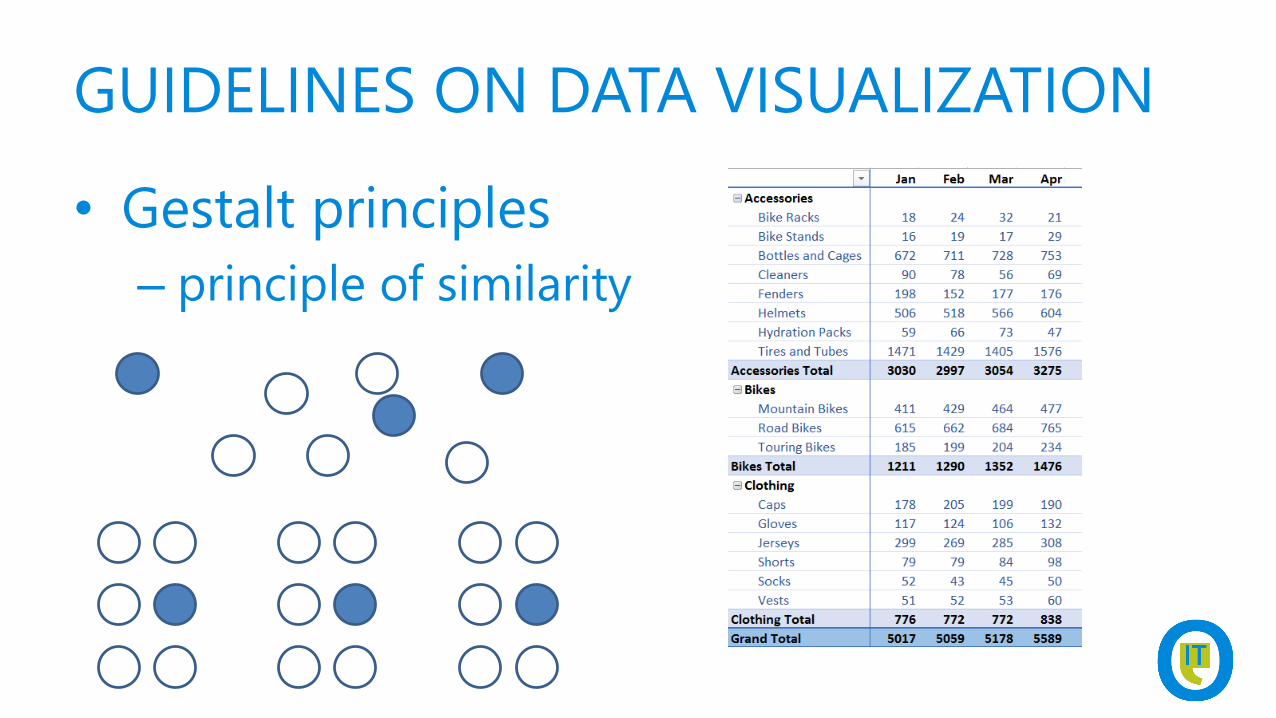
GUIDELINES ON DATA VISUALIZATION
• Gestalt principles
– principle of similarity

GUIDELINES ON DATA VISUALIZATION
• Gestalt principles
– principle of enclosure

GUIDELINES ON DATA VISUALIZATION
• Gestalt principles
– principle of closure/continuity
GUIDELINES ON DATA VISUALIZATION
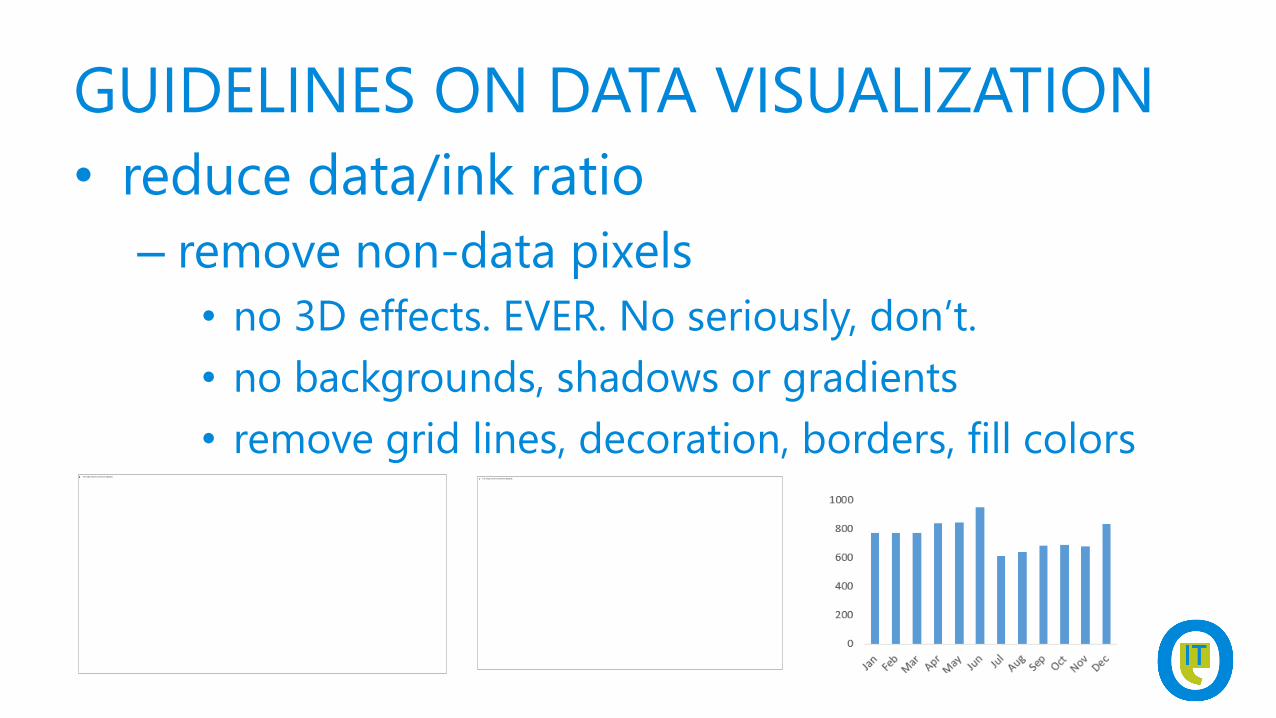
• reduce data/ink ratio
– remove non-data pixels
• no 3D effects. EVER. No seriously, don’t.
• no backgrounds, shadows or gradients
• remove grid lines, decoration, borders, fill colors
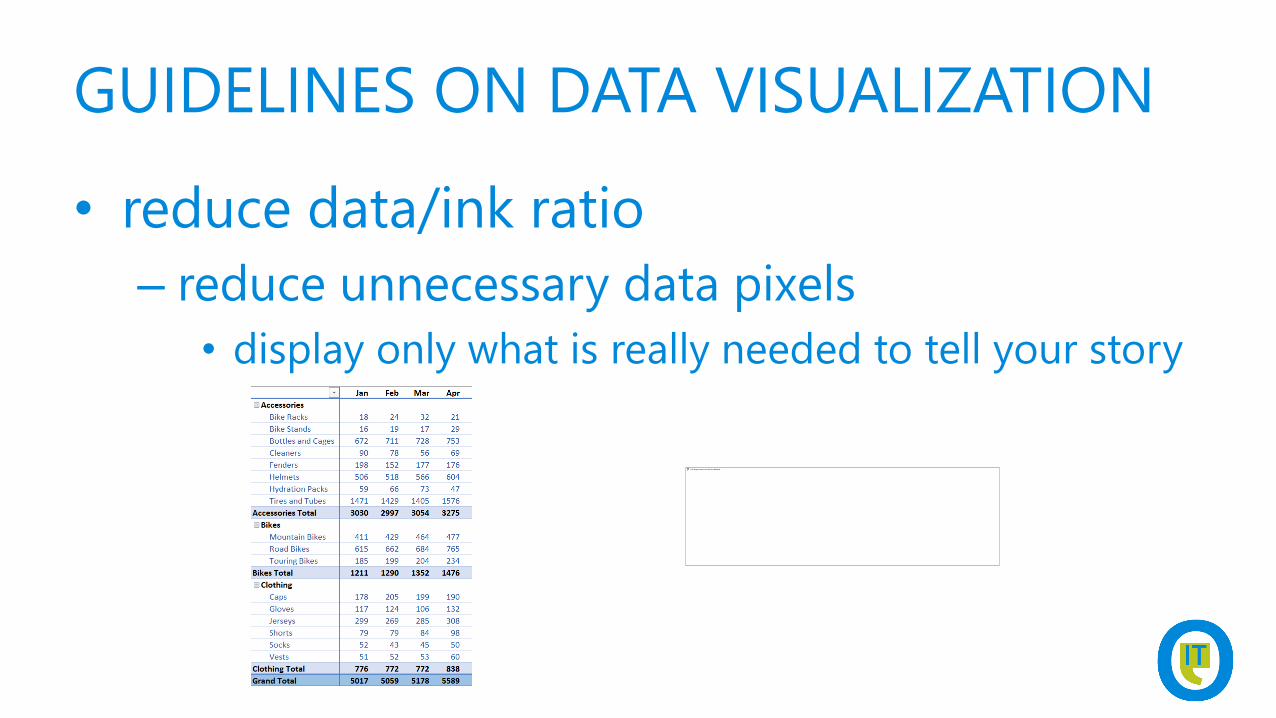
GUIDELINES ON DATA VISUALIZATION
• reduce data/ink ratio
– reduce unnecessary data pixels
• display only what is really needed to tell your story

GUIDELINES ON DATA VISUALIZATION
• reduce data/ink ratio
– highlight most import pixels
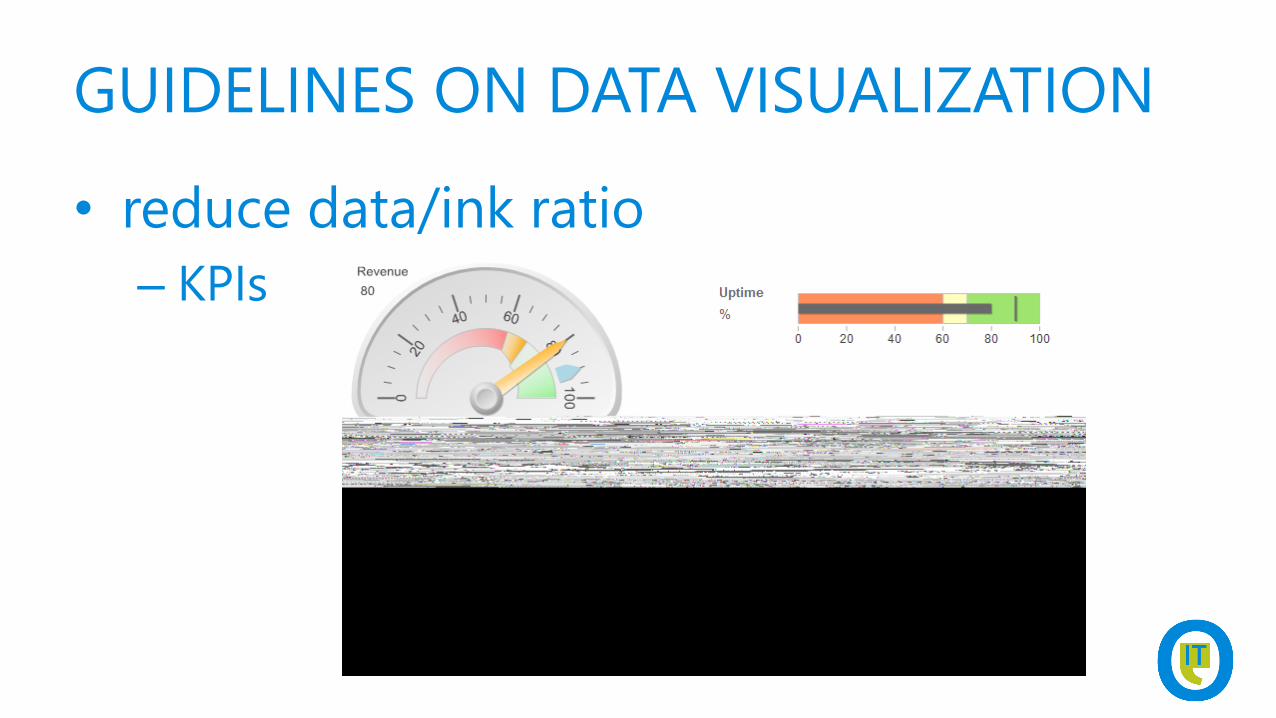
GUIDELINES ON DATA VISUALIZATION
• reduce data/ink ratio
– KPIs

DEMOCREATE BULLET GRAPH IN SSRS

GUIDELINES ON DATA VISUALIZATION
• don’t forget the 10%

GUIDELINES ON DATA VISUALIZATION
• what’s the story you want to tell?
• choose the correct chart type
• use visual perception wisely
• reduce data/ink ratio

GUIDELINES ON DATA VISUALIZATION
• resources
AGENDA
• guidelines on Data Visualization
• showing off with SSRS

SHOWING OFF WITH SSRS
• to watch: Dataviz you thought you could
not do with SSRS by Jason Thomas
• 24 hours of PASS business analytics edition
• http://www.sqlpass.org/bac/2014/Sessions/
SneakPeeks/Details.aspx?sid=5907

SHOWING OFF WITH SSRS
DEMOSHOW SOME FUN STUFF IN SSRS


Follow Technet Belgium
@technetbelux
Subscribe to the TechNet newsletter
aka.ms/benews
Be the first to know

THANKS FOR LISTENING

Belgium’s biggest IT PRO Conference
Related Documents