Page 1 JCM02379-14, Revision 1 1 Sputum volume predicts sputum mycobacterial load during the first two weeks of 2 anti-tuberculosis treatment 3 4 Running title: Sputum volume predicts bacterial load 5 6 Miriam N. Karinja 1, 2 , Tonya M. Esterhuizen 1 , Sven O. Friedrich 2, 3 , Andreas H. Diacon 2, 3 7 8 1: Centre for Evidence Based Health Care, Faculty of Medicine and Health Sciences, 9 Stellenbosch University 10 2: Division of Medical Physiology, Department of Biomedical Sciences, Faculty of Medicine 11 and Health Sciences, Stellenbosch University 12 3: Task Applied Science, Bellville, Cape Town 13 14 Corresponding author: 15 Andreas Diacon 16 Department of Biomedical Sciences 17 Faculty of Medicine and Health Sciences 18 PO Box 19063, Tygerberg 7505, South Africa 19 Email: [email protected] 20 Phone: +27 21 938 9392 21 Fax: +27 21 938 9476 22 23 Abstract: 243 words 24 Text: 1837 words 25 26 JCM Accepts, published online ahead of print on 31 December 2014 J. Clin. Microbiol. doi:10.1128/JCM.02379-14 Copyright © 2014, American Society for Microbiology. All Rights Reserved. on July 10, 2016 by guest http://jcm.asm.org/ Downloaded from

Welcome message from author
This document is posted to help you gain knowledge. Please leave a comment to let me know what you think about it! Share it to your friends and learn new things together.
Transcript

Page 1
JCM02379-14, Revision 1 1
Sputum volume predicts sputum mycobacterial load during the first two weeks of 2
anti-tuberculosis treatment 3
4
Running title: Sputum volume predicts bacterial load 5
6
Miriam N. Karinja1, 2, Tonya M. Esterhuizen1, Sven O. Friedrich2, 3, Andreas H. Diacon2, 3 7
8
1: Centre for Evidence Based Health Care, Faculty of Medicine and Health Sciences, 9
Stellenbosch University 10
2: Division of Medical Physiology, Department of Biomedical Sciences, Faculty of Medicine 11
and Health Sciences, Stellenbosch University 12
3: Task Applied Science, Bellville, Cape Town 13
14
Corresponding author: 15
Andreas Diacon 16
Department of Biomedical Sciences 17
Faculty of Medicine and Health Sciences 18
PO Box 19063, Tygerberg 7505, South Africa 19
Email: [email protected] 20
Phone: +27 21 938 9392 21
Fax: +27 21 938 9476 22
23
Abstract: 243 words 24
Text: 1837 words 25
26
JCM Accepts, published online ahead of print on 31 December 2014J. Clin. Microbiol. doi:10.1128/JCM.02379-14Copyright © 2014, American Society for Microbiology. All Rights Reserved.
on July 10, 2016 by guesthttp://jcm
.asm.org/
Dow
nloaded from

Page 2
Abstract 27
Disease severity in patients with pulmonary tuberculosis is associated with mycobacterial 28
sputum load. To ascertain whether reduced sputum production under treatment is a useful 29
clinical sign of improvement we analyzed the mycobacterial load of 5552 sputum samples 30
collected from 439 newly diagnosed, sputum-smear positive tuberculosis patients who 31
participated in six 14-day studies of antituberculosis treatment. Sputum volume was 32
categorized as low (<6ml), medium (6-10ml) and large (>10ml), and mycobacterial load 33
measured as time to liquid culture positivity and colony-forming unit counts on solid 34
culture. The association of sputum volume with mycobacterial load was estimated with 35
multiple linear regression models adjusted for repeated measures. Predictor variables 36
were sputum volume category, treatment day, study participated, and the interaction of 37
sputum volume category and treatment day. Mycobacterial load was significantly 38
associated only with day on treatment and sputum volume, which tended to decrease with 39
ongoing treatment. Volume held constant, each day on treatment decreased logCFU by 40
0.082 (P <0.001) and increased TTP by 1.04 hours (P <0.001). From low to medium and 41
from medium to large sputum volumes logCFU/ml increased by 0.265 (P <0.003) and 42
0.490 (P <0.001), and TTP decreased by 1.17 hours (P <0.001) and 1.30 hours 43
(P <0.001), respectively, for a given day of treatment. Variability of sputum load 44
measurements increased with day of treatment and with lower sputum volumes. The 45
significant association of sputum volume and mycobacterial load validates decreasing 46
sputum production as a clinical sign of improvement during early antituberculosis 47
treatment. 48
49
Keywords: Time to positivity, colony forming units, sputum volume, early bactericidal 50
activity, tuberculosis 51
52
on July 10, 2016 by guesthttp://jcm
.asm.org/
Dow
nloaded from

Page 3
Introduction 53
Tuberculosis (TB) remains a major cause of morbidity and mortality worldwide. In 2012, 54
the World Health Organization (WHO) estimated 8.5 million new TB cases and 1.3 million 55
TB deaths globally (1). In 2008 the incidence of TB in South Africa was 960 cases per 56
100,000 people with an annual increase of 6.4% from 1998 to 2008 (2). TB is most 57
commonly diagnosed by the identification of M. tuberculosis in expectorated spot sputum 58
specimens either by sputum smear microscopy or by identification of mycobacterial 59
antigens with PCR (3). The viable sputum mycobacterial load can be measured by colony 60
forming unit (CFU) counting on agar plates or by time to culture positivity (TTP) in liquid 61
media (4-6). Greater initial spot sputum mycobacterial burden has been linked with more 62
extensive radiological lung involvement, worse treatment outcomes and a higher risk of 63
relapse (7-9), and more recently greater sputum volume has been linked to worse 64
treatment outcomes in HIV-infected TB patients (10). 65
The decrease of the sputum mycobacterial burden in pooled 16-hour sputum samples 66
collected over night is an established measure of early anti-tuberculosis drug effects over 67
the first 2 weeks of treatment (11), but few studies have assessed the association of 68
sputum volumes with measurements of mycobacterial load. In a trial reported in 1950, 69
before effective treatments became available, it was documented that hospitalized patients 70
treated with placebo had stable sputum volumes and percentages of positive smears over 71
14 weeks, whereas para-amino salicylic acid treated patients experienced reductions in 72
both (12). Yoon et al found that purulent or blood-tinged as well as larger volume of early 73
morning and spot sputum samples predicted smear positivity (13). 74
TB patients frequently report prompt reduction of productive cough upon initiation of 75
treatment. This is commonly accepted as a clinical sign of improvement. The purpose of 76
this study was to substantiate this association by investigating whether decreased sputum 77
on July 10, 2016 by guesthttp://jcm
.asm.org/
Dow
nloaded from

Page 4
volume is associated with a reduced sputum mycobacterial load in early antituberculosis 78
treatment. 79
80
Methods and materials 81
Study population and specimens 82
We studied sputum samples from 6 consecutive 14-day early bactericidal activity (EBA) 83
studies conducted between 2008 and 2012. Locations, procedures and relevant 84
participation criteria were identical for all these studies. Subjects were recruited from 85
outpatient clinics in Cape Town and enrolled if they were aged 18 to 65 years, at least 1+ 86
sputum smear-positive on auramine microscopy (IUATLD/WHO scale) (14) and without 87
major underlying medical conditions. Spontaneously expectorated sputum samples were 88
collected over a period of 16 hours overnight, refrigerated and sent to a single laboratory in 89
Cape Town under controlled conditions. 90
Laboratory methods 91
During the entire study period the laboratory supplied identical, transparent, wide-mouthed 92
collection containers of 125ml volume and with a screw top to the clinical sites (Scientific 93
Group, Vorna Valley, South Africa). Upon submission to the laboratory two technologists 94
trained on sample reception were in charge of estimating sputum volumes by comparing 95
the containers to reference containers filled with standard volumes of water. Sputum 96
volume was categorized arbitrarily as < 6 ml, 6 to 10 ml or > 10 ml. Discrepancies were 97
resolved by consensus between the two technologists. All studies employed the same 98
standardized laboratory methodology for processing. Sputum was homogenized using 99
magnetic stirring and addition of 0.1% dithiothreitol (Sputasol; Oxoid, Cambridge, United 100
Kingdom) for digestion. All samples were assessed for mycobacterial load by both CFU 101
and TTP. 102
on July 10, 2016 by guesthttp://jcm
.asm.org/
Dow
nloaded from
Page 5
For CFU quantification, 10-fold serial dilutions were inoculated onto two halves of two 103
7H11 agar biplates. The plates were then incubated at 37°C for a period of 3 weeks and 104
CFUs were counted using the dilution with counts between 20 and 200. After calculating 105
an average of the duplicate CFU counts and correcting for the dilution factor, the results 106
were reported as CFU per ml sputum. 107
For TTP determination digested sputum was decontaminated for 15 minutes at room 108
temperature by using sodium hydroxide at final concentration of 1% (Mycoprep; Becton 109
Dickinson, Sparks, MD). The specimen was then neutralized using phosphate buffered 110
saline (pH 6.8; Becton Dickinson) and concentrated through centrifugation (15 minutes at 111
3,000 X g and 4°C). The supernatant was then decanted and the pellet re-suspended to a 112
volume of 2 ml using phosphate buffered saline. The re-suspended pellet was then used to 113
inoculate duplicate Mycobacteria Growth Indicator Tubes (MGITs; Becton Dickinson) that 114
were enriched with OADC (Oleic acid, albumin, dextrose and catalase; Becton Dickinson) 115
and PANTA (Polymyxin B, amphotericin B, nalidixic acid, trimethoprim and azlocillin; 116
Becton Dickinson). The MGITs were then incubated at 37°C in the Bactec MGIT 960 117
instrument (Becton Dickinson) which monitors the cultures and automatically records the 118
TTP once the culture is flagged positive. 119
Data collection 120
Data obtained included individual patient, study participated, sputum volume, treatment 121
day, TTP and CFU. Negative cultures for CFU counts were excluded. Negative cultures for 122
TTP were censored at 42 days (the maximum length of culture incubation) and this value 123
was used for analysis. 124
Statistical methods 125
Data from all six studies were combined for statistical analysis. Due to the similar inclusion 126
and exclusion criteria, identical source population and the single laboratory that processed 127
all samples with identical methods we considered the population not to be clinically 128
on July 10, 2016 by guesthttp://jcm
.asm.org/
Dow
nloaded from
Page 6
heterogeneous. Because the studies were conducted in sequence and generally groups 129
within a study were given variations of the same treatment we adjusted for study but not 130
for individual treatment groups. Neither CFU nor TTP were normally distributed and were 131
both log10 transformed. Means, standard deviations and coefficients of variation of logTTP 132
and logCFU were reported by volume category. Simple linear regression analysis was 133
used to determine the effect of time on logTTP and logCFU within the different volume 134
categories. 135
Two multiple linear regression models were used to estimate the association between 136
sputum volume and logTTP and logCFU. In order to take into account the correlation of 137
observations within a single participant (cluster) we adjusted the models for the effect of 138
repeated measures per patient by using robust standard errors based on patient number 139
as the cluster variable. Predictor variables included in the initial models were the same for 140
both logTTP and logCFU. They included volume, duration on treatment (time in days), 141
study code (A-F) and the interaction between volume and time. The final adjusted models 142
were obtained using a backward stepwise approach and variables with P-values less than 143
0.1 were retained. All statistical analyses were performed using the Stata software (version 144
12). 145
Ethical approval 146
The protocol for this study was reviewed and approved by the University of Stellenbosch 147
ethics committee (reference S12/11/310). The study was carried out between June 2013 148
and December 2013. 149
150
Results 151
Studies, participants and specimens 152
In 6 EBA studies (59 to 90 participants per study) and 30 treatment groups (8 to 25 153
participants per group) all 439 participants produced a total of 5552 sputum samples (4 to 154
on July 10, 2016 by guesthttp://jcm
.asm.org/
Dow
nloaded from
Page 7
16 per participant; 470 to 1421 per study). Table 1 shows distribution, means and standard 155
deviations of 5237 valid CFU and 5372 valid TTP. We excluded 8.7% and 3.7% of CFU 156
and TTP, respectively, for contamination (4.6% and 1.7%) and negative or missing results 157
(4.1% and 2.0%). 158
Sputum volumes 159
Specimen volume categories with distribution over time, mean values, standard deviations 160
and coefficients of variation are shown in Table 2. Sputum volumes tended to decrease 161
over time and the variability of both measurements increased as sample volumes 162
decreased. In all volume categories considerably less variability was observed with TTP, 163
which had a 3 to 4-fold smaller coefficient of variation than CFU. A statistically significant 164
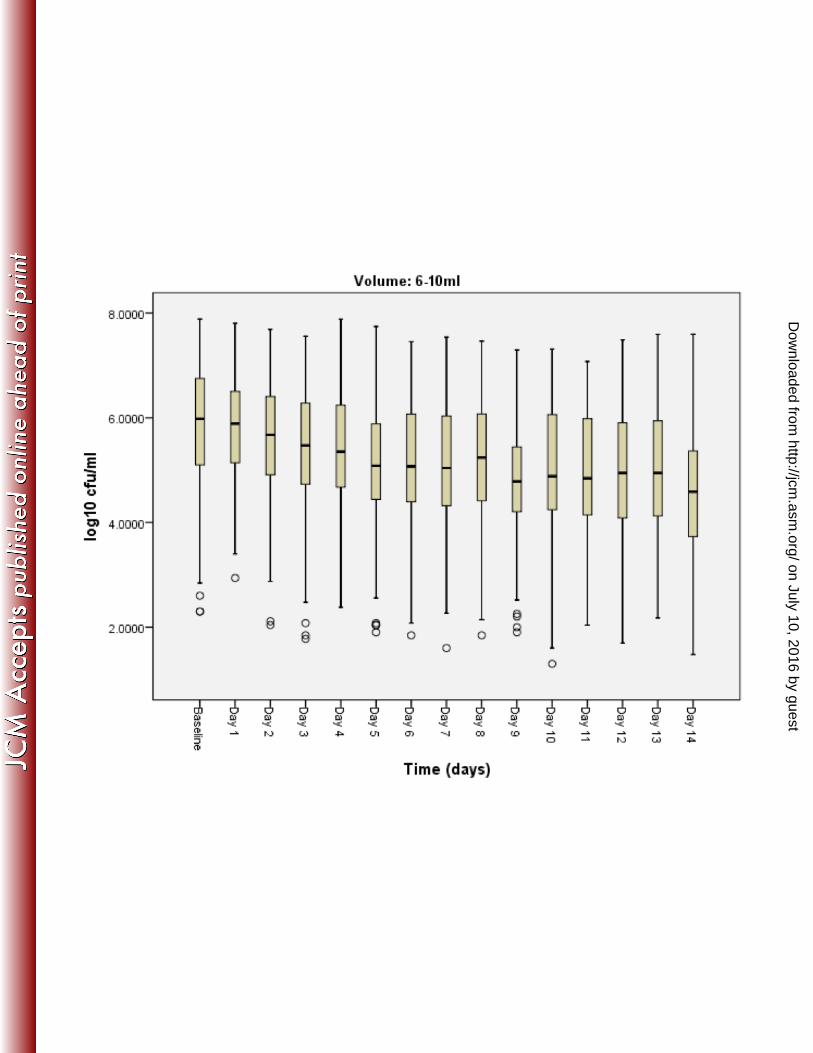
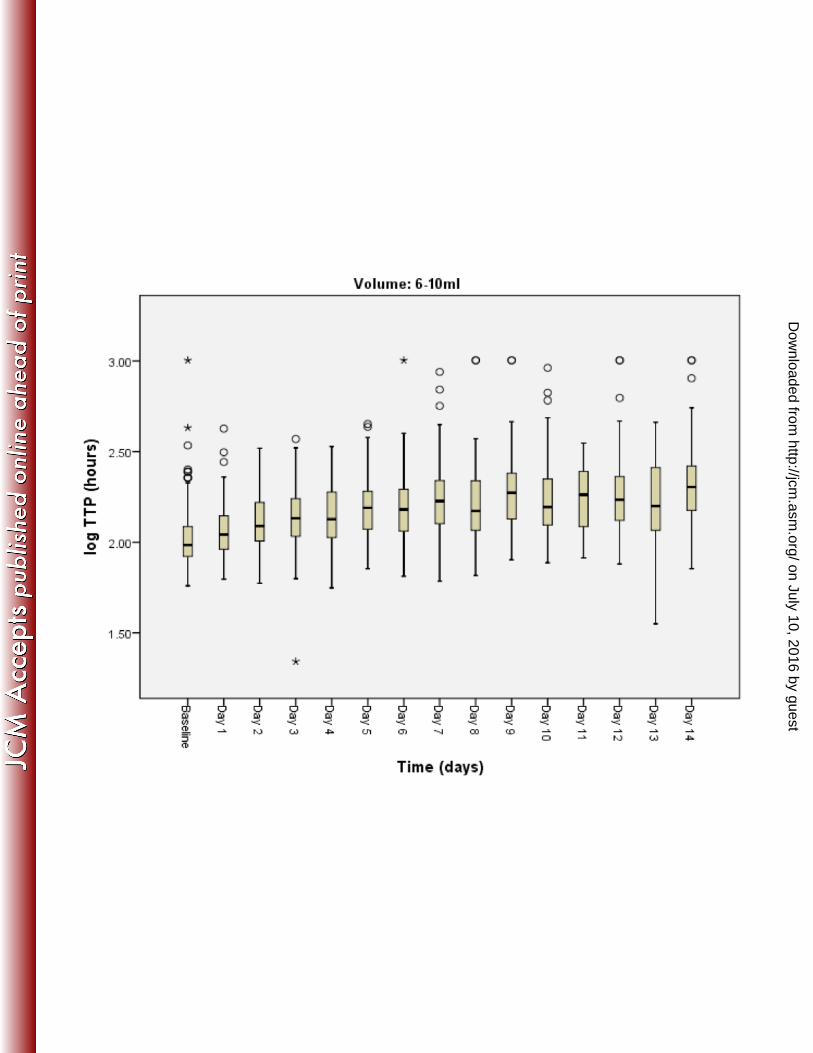
decrease in logCFU and increase in logTTP (figure 1A and figure 1B) was observed in all 165
volume categories over time (P < 0.001). 166
Statistical modelling 167
Among all the outcomes tested only volume and days on treatment showed significant 168
associations with logCFU and logTTP (table 3 and table 4). All outcomes were highly 169
significant. Mean logCFU decreased on average by 0.082 logCFU for each day on 170
treatment, volume being held constant (P < 0.001). From < 6 ml to between 6 - 10 ml and 171
to ≥ 10 ml sputum volume logCFU increased by 0.265 and by 0.490, respectively. 172
Correspondingly, TTP increased by 1.04 hours per day on treatment volume held constant 173
(P < 0.001). As specimen volumes increased from < 6 ml to between 6 - 10 ml and to 174
≥ 10 ml, TTP decreased by -1.172 hours and -1.297 hours, respectively. 175
176
Discussion 177
We found that the volume of sputum expectorated overnight by pulmonary TB patients 178
was positively associated with the mycobacterial sputum load. Sputum volumes became 179
smaller over the first 14 days of treatment and exhibited increased TTP and decreased 180
on July 10, 2016 by guesthttp://jcm
.asm.org/
Dow
nloaded from

Page 8
CFU. This validates the clinical observation that patients reporting dimishing sputum 181
production are responding to treatment as evidenced by a decrease in mycobacterial 182
sputum load. 183
The decrease in mycobacterial load depicted in prolongation of TTP and decreased CFU 184
is an expected response to treatment, as is the reduction of productive cough. This study 185
exemplifies a well known dilemma in clinical trials of antituberculosis treatments. Sputum 186
as the substrate of the trials' main endpoint measuments becomes smaller in volume over 187
time and the variation of its mycobacterial laod measurements increases. This makes 188
significant differences between treatments harder to detect with ongoing treatment 189
duration, particularly when measured with CFU for which we found much larger variation 190
than for TTP. It has been observed before that a longer collection period increases sputum 191
volume and leads to an increase in precision of CFU (15), and that EBAs obtained from 192
pooled sputum specimens which usually have higher volumes (≥ 10 ml), have a lower 193
standard error compared to estimates obtained from spot sputum samples with volumes of 194
less than 5 ml (5). 195
The strength of this study is the large number of aggregated observations from large EBA 196
studies which increases the precision due to large sample size. The studies were 197
combined on the basis that all participants are from the same source population and that 198
each of the studies have comparable eligibility criteria. Furthermore, all samples were 199
analysed by the same laboratory using standardized protocols. However, the studies 200
differed in their treatment groups. The authors were blinded as to what treatment arm was 201
receiving what type and dosage of treatment but the diversity in treatments and the small 202
sample size in each treatment arm might be a limitation of this study. Also, only a minority 203
of patients were on treatments as efficacious as the currently used combination therapy. 204
Standard treatment (body weight adjusted isoniazid, rifampicin, pyrazinamide, ethambutol) 205
increased TTP by approximately 13 hours per day and decreased CFU by 0.177 logCFU 206
on July 10, 2016 by guesthttp://jcm
.asm.org/
Dow
nloaded from
Page 9
over the first 14 days of treatment (16). The overall mean change in mycobacterial load 207
was only about half that in our analysis (for CFU: 46%; for non log-transformed TTP: 52%). 208
Our data might thus still underestimate the drop in sputum volumes and the increases in 209
load measurement variation that might be observed if fully effective treatments are studied. 210
In conclusion, reduced sputum volume predicts a decrease in mycobacterial sputum load 211
in patients with pulmonary TB. Clinicians can interpret reduced productive cough in the 212
first 14 days of therapy as a valid clinical sign of effective treatment. 213
214
Conflict of interest 215
All authors have no conflict of interest to declare. 216
217
Acknowledgment 218
The authors are grateful towards all patients for participation. 219
220
Figure legend 221
Box plots of logCFU (Fig 1A) and TTP (Fig 1B) over treatment days 0 to 14. Volume 222
categories < 6 ml (top), 6 – 10 ml (middle), and > 10 ml (bottom). In each volume category 223
there was a statistically significant decrease in logCFU and increase in TTP over time 224
(both P < 0.001). 225
226
227
on July 10, 2016 by guesthttp://jcm
.asm.org/
Dow
nloaded from
Page 10
References 228
1. World Health Organization. 2013. Global Tuberculosis Report 2013. Available at: 229
http://www.who.int/tb/publications/global_report/en/. 230
2. Claassens M, van Schalkwyk C, den Haan L, Floyd S, Dunbar R, van Helden P, 231
Godfrey-Faussett P, Ayles H, Borgdorff M, Enarson D, Beyers N. 2013. High prevalence of 232
tuberculosis and insufficient case detection in two communities in the Western Cape, 233
South Africa. PLoS One 8:e58689. 234
3. Wilson ML. 2013. Rapid diagnosis of Mycobacterium tuberculosis infection and drug 235
susceptibility testing. Arch Pathol Lab Med 137:812-819. 236
4. Bark CM, Gitta P, Ogwang S, Nsereko M, Thiel BA, Boom WH, Eisenach KD, 237
Joloba ML, Johnson JL. 2013. Comparison of time to positive and colony counting in an 238
early bactericidal activity study of anti-tuberculosis treatment. Int J Tuberc Lung Dis 239
17:1448-1451. 240
5. Donald PR, Diacon AH. 2008. The early bactericidal activity of anti-tuberculosis 241
drugs: a literature review. Tuberculosis (Edinb) 88 Suppl 1:S75-83. 242
6. Diacon AH, Maritz JS, Venter A, van Helden PD, Dawson R, Donald PR. 2012. 243
Time to liquid culture positivity can substitute for colony counting on agar plates in early 244
bactericidal activity studies of antituberculosis agents. Clin Microbiol Infect 18:711-717. 245
7. Hesseling AC, Walzl G, Enarson DA, Carroll NM, Duncan K, Lukey PT, Lombard C, 246
Donald PR, Lawrence KA, Gie RP, van Helden PD, Beyers N. 2010. Baseline sputum time 247
to detection predicts month two culture conversion and relapse in non-HIV-infected 248
patients. Int J Tuberc Lung Dis 14:560-570. 249
8. Weiner M, Prihoda TJ, Burman W, Johnson JL, Goldberg S, Padayatchi N, Duran 250
P, Engle M, Muzanye G, Mugerwa RD, Sturm AW. 2010. Evaluation of time to detection of 251
Mycobacterium tuberculosis in broth culture as a determinant for end points in treatment 252
trials. J Clin Microbiol 48:4370-4376. 253
9. Epstein MD, Schluger NW, Davidow AL, Bonk S, Rom WN, Hanna B. 1998. Time to 254
detection of Mycobacterium tuberculosis in sputum culture correlates with outcome in 255
patients receiving treatment for pulmonary tuberculosis. Chest 113:379-386. 256
10. Pierre C, Jones-Lopez E, Cabral H, Horsburgh CR. 2013. Sputum volume 257
production predicts clinical outcome in HIV-infected tuberculosis patients in Kampala, 258
on July 10, 2016 by guesthttp://jcm
.asm.org/
Dow
nloaded from

Page 11
Uganda. Abstract at ID Week 2012. 259
https://idsa.confex.com/idsa/2013/webprogram/Paper40943.html. 260
11. Diacon A, Maritz JS, Donald P. 2011. Early bactericidal activity of antituberculosis 261
agents, p. 213-219. In Donald PR, Van Helden PD (ed.), Antituberculosis Chemotherapy, 262
vol. 40. Karger, Basel. 263
12. The Therapeutic Trials Committee of the Swedish National Association against 264
Tuberculosis. 1950. Para-Aminosalicylic acid treatment in pulmonary tuberculosis. Am Rev 265
Tuberc 61:597-612. 266
13. Yoon SH, Lee NK, Yim JJ. 2012. Impact of sputum gross appearance and volume 267
on smear positivity of pulmonary tuberculosis: a prospective cohort study. BMC Infect Dis 268
12:172. 269
14. International Union Against Tuberculosis and Lung Disease. 2013. Laboratory 270
Diagnosis of Tuberculosis by Sputum Microscopy: The Handbook. Available at: 271
http://www.theunion.org/what-we-do/publications/technical/laboratory-diagnosis-of-272
tuberculosis-by-sputum-microscopy-the-handbook. 273
15. Hafner R, Cohn JA, Wright DJ, Dunlap NE, Egorin MJ, Enama ME, Muth K, 274
Peloquin CA, Mor N, Heifets LB. 1997. Early bactericidal activity of isoniazid in pulmonary 275
tuberculosis. Optimization of methodology. The DATRI 008 Study Group. Am J Respir Crit 276
Care Med 156:918-923. 277
16. Diacon AH, Dawson R, du Bois J, Narunsky K, Venter A, Donald PR, van Niekerk 278
C, Erondu N, Ginsberg AM, Becker P, Spigelman MK. 2012. Phase II dose-ranging trial of 279
the early bactericidal activity of PA-824. Antimicrob Agents Chemother 56:3027-3031. 280
281
on July 10, 2016 by guesthttp://jcm
.asm.org/
Dow
nloaded from
Page 12
Table 1: Specimens and mycobacterial load measurements 282
Study Patients Samples Samples per patient logCFU/ml sputum logTTP
n n n (SD) Valid n (%) Mean SD Valid n (%) Mean SD
A 68 745 11 (0.3) 646 (86.7) 4.5 1.8 716 (96.1) 2.2 0.2
B 85 1310 15 (2.2) 1209 (92.3) 5.1 1.5 1283 (97.9) 2.2 0.2
C 69 752 11 (0.8) 714 (94.9) 5.3 1.3 735 (97.7) 2.1 0.1
D 59 470 8 (0.2) 426 (90.6) 5.1 1.4 456 (97.0) 2.2 0.2
E 68 854 12 (1.7) 825 (96.6) 5.8 1.1 771 (90.3) 2.1 0.2
F 90 1421 15 (1.5) 1247 (87.8) 5.3 1.5 1383 (97.3) 2.1 0.2
Total 439 5552 13 (3.1) 5067 (91.3) 5.2 1.5 5344 (96.3) 2.2 0.2
SD=standard deviation. CFU=colony forming units. TTP=time to culture positivity
283
284
on July 10, 2016 by guesthttp://jcm
.asm.org/
Dow
nloaded from
Page 13
Table 2: Sputum volume and mycobacterial load measurements 285
Volu
me
All Day 0 Day 6 Day 14 LogCFU/ml sputum LogTTP (hours) TTP (hours)
ml n (%) n (%) n (%) n (%) Mean SD CV Mean SD CV Median IQR
< 6 655
(12.2)
75
(8.6)
56
(13.0)
66
(15.7)
4.7 1.7 0.359 2.2 0.2 0.094 166 127-232
6 - 10 2325
(43.3)
363
(41.8)
196
(45.5)
190
(45.1)
5.1 1.5 0.301 2.2 0.2 0.089 140 105-197
> 10 2392
(44.5)
431
(49.6)
179
(41.5)
165
(39.2)
5.4 1.4 0.253 2.1 0.2 0.077 123 100-161
Total 5372
(100)
869
(100)
431
(100)
421
(100)
5.0 1.5 0.301 2.2 0.2 0.080 134 104-186
Day 0 (baseline), day 6 and day 14 are given as examples. CFU=colony forming units. CV=coefficient of variation.
IQR=interquartile range. SD=standard deviation. TTP=time to culture positivity
286
287
on July 10, 2016 by guesthttp://jcm
.asm.org/
Dow
nloaded from
Page 14
Table 3: Linear regression model for logCFU adjusting for clustering of repeated measures 288
in a single participant using robust standard errors (n = 5067, clusters = 435) 289
LogCFU Coefficient SE P 95% CI
Constant 5.560 0.099 < 0.001 5.366 to 5.754
Day on treatment - 0.082 0.005 < 0.001 -0.091 to -0.072
Volume
6 - 10 ml 0.265 0.090 0.003 0.088 to 0.442
> 10 ml 0.490 0.108 < 0.001 0.278 to 0.701
F (3.434) = 113.38, P < 0.001, R-squared = 0.1235, Root MSE = 1.1028.
The constant represents the expected logCFU in the smallest volume category (< 6 ml) when duration on treatment is zero.
Each day of increase in treatment duration decreases logCFU by 0.082.
For the expected logCFU when sputum volume changes from < 6 ml to a higher volume category add the corresponding volume coefficient.
CFU=colony forming units. SE=standard error. CI=confidence interval
290
291
on July 10, 2016 by guesthttp://jcm
.asm.org/
Dow
nloaded from

Page 15
Table 4: Linear regression model for log TTP adjusting for clustering of repeated measures 292
using robust standard errors (n = 5372, clusters = 439) 293
LogTTP Coefficient SE P 95% CI
Constant 2.120 0.016 < 0.001 2.089 to 2.151
Day on treatment 0.017 0.001 < 0.001 0.015 to 0.018
Volume
6 - 10 ml - 0.069 0.015 < 0.001 - 0.098 to - 0.040
> 10 ml - 0.113 0.017 < 0.001 - 0.148 to - 0.079
F (3.438) = 191.52, P < 0.001, R-squared = 0.2174, Root MSE = 0.1655
The constant represents the expected logTTP in the smallest volume category (< 6 ml) when duration on treatment is zero.
Each day of increase in treatment duration increases logTTP by 0.017.
For the expected logTPP when sputum volume changes from < 6 ml to a higher volume category add the corresponding volume coefficient.
TTP=time to positivity. SE=standard error. CI=confidence interval
294
295
on July 10, 2016 by guesthttp://jcm
.asm.org/
Dow
nloaded from

Page 16
Figure 1A: Box plots of logCFU grouped by volume category over time 296
297
on July 10, 2016 by guesthttp://jcm
.asm.org/
Dow
nloaded from

Page 17
Figure 1B: Box plots of TTP grouped by volume category over time 298
299
on July 10, 2016 by guesthttp://jcm
.asm.org/
Dow
nloaded from


Related Documents