1 High Temperature Microstructure and Microhardness Evolution in Dense NiCrAlY Bulk Material Fabricated by Spark Plasma Sintering Jianrong Song a, b , Kaka Ma a , Ying Li a , Lianmeng Zhang b , Julie M. Schoenung a * *Corresponding author: [email protected] a Department of Chemical Engineering and Materials Science, University of California-Davis; One Shields Avenue; Davis, CA 95616, USA b Department of Materials Science and Engineering, Wuhan University of Technology, 122 Luoshi Rd.; Wuhan, Hubei 430070, China Abstract NiCrAlY is commonly used as the bond coat material in thermal barrier coatings (TBCs). Detailed investigation into the microstructural evolution at high temperatures and the consequent changes in microhardness in NiCrAlY bond coats is challenging due to the complexity in microstructure and composition caused by thermal spray processes and the presence of a superalloy substrate and a ceramic top coat in the TBC. In an effort to simplify the system, fully dense NiCrAlY bulk samples were prepared by spark plasma sintering (SPS) at 1000 °C. The microstructure, phase composition and microhardness of the samples, in the as-sintered condition and select heat-treated-in-argon-and-quenched conditions (1000 °C, 10 h & 50 h; 1050 °C, 10 h & 50 h; 1100 °C, 10 h & 50 h), were studied by means of SEM, EDAX, HR-TEM and microhardness testing. It was found that

Welcome message from author
This document is posted to help you gain knowledge. Please leave a comment to let me know what you think about it! Share it to your friends and learn new things together.
Transcript
1
High Temperature Microstructure and Microhardness Evolution in Dense NiCrAlY
Bulk Material Fabricated by Spark Plasma Sintering
Jianrong Song a, b, Kaka Ma a, Ying Li a, Lianmeng Zhang b, Julie M. Schoenung a*
*Corresponding author: [email protected]
a Department of Chemical Engineering and Materials Science,
University of California-Davis;
One Shields Avenue; Davis, CA 95616, USA
b Department of Materials Science and Engineering, Wuhan University of Technology,
122 Luoshi Rd.; Wuhan, Hubei 430070, China
Abstract
NiCrAlY is commonly used as the bond coat material in thermal barrier coatings (TBCs).
Detailed investigation into the microstructural evolution at high temperatures and the
consequent changes in microhardness in NiCrAlY bond coats is challenging due to the
complexity in microstructure and composition caused by thermal spray processes and the
presence of a superalloy substrate and a ceramic top coat in the TBC. In an effort to
simplify the system, fully dense NiCrAlY bulk samples were prepared by spark plasma
sintering (SPS) at 1000 °C. The microstructure, phase composition and microhardness of
the samples, in the as-sintered condition and select heat-treated-in-argon-and-quenched
conditions (1000 °C, 10 h & 50 h; 1050 °C, 10 h & 50 h; 1100 °C, 10 h & 50 h), were
studied by means of SEM, EDAX, HR-TEM and microhardness testing. It was found that
2
the microstructure and phase compositions changed significantly after heat treatment.
Additionally, the average microhardness of the samples decreased as the heat-treatment
temperature and time increased, except for in the samples heat treated at 1000 °C for 50 h,
1050 °C for 10 h and 1050 °C for 50 h. To clarify this anomalous behavior,
microhardness was carefully measured within select grains. Results indicate that a
Cr,O-rich phase (specifically, Cr3O, as determined by HR-TEM), which appeared within
the β-NiAl grains after these three heat-treatment conditions but subsequently
disappeared from the β-NiAl grains after heat treatment at 1100 °C, strengthened the
overall microstructure.
Key words: thermal barrier coating, NiCrAlY, spark plasma sintering, phase
transformation, microhardness,
3
1. Introduction
The degradation of turbine blades during service is one of the major concerns in material
science research within the field of energy production. Applying thermal barrier coatings
(TBCs) on the surfaces of blades is an effective method for protecting the materials from
hot corrosion and high temperature oxidation. It is well established that the performance
of TBCs is influenced by the properties of the bond coat layer, which lies between the top
coat and the substrate [1]. NiCrAlY alloys are one of the most important bond coat
materials used for protecting the substrates [2, 3]. Besides exhibiting high hardness, good
adhesion and good oxidation resistance, NiCrAlY bond coat materials can be tailor-made
in a wide range of compositions that correspond to the demands of the working
conditions and substrate materials [4]. The microstructure in NiCrAlY bond coats
consists mainly of two phases, the β-NiAl intermetallic and the γ-Ni(Cr) solid solution. In
some particular compositions, α-Cr and γ’-Ni3Al precipitates are also present within the
β-NiAl and γ-Ni(Cr) grains [5]. After thermal spray, Cr can also be present as a Cr-oxide
phase [6 - 8]. The Y generally separates out into Ni,Y-rich intermetallics [9].
During high temperature applications, the microstructure, phase composition, and
mechanical properties of NiCrAlY bond coats play a significant role in the durability of
the TBCs [10]. The relationship between structure and properties in these coatings has
been studied to some extent through the application of micro-tensile sample preparation
and testing, even at elevated temperatures [11-14]. The method is challenging, however,
because the bond coat layer is only on the order of ~150-200 µm thick [15] and it is
sandwiched between the ceramic top coat and the superalloy substrate. Moreover, this
method does not provide the opportunity to lock-in the high temperature microstructure
4
for further characterization. In addition to these challenges, the bond coat microstructure
is inherently complex because of the thermal spray process by which it is usually applied
(such as air plasma spray, APS, or high-velocity oxy-fuel, HVOF), which can result in
the formation of splat boundaries, internal oxidation and other microstructural
inhomogeneities [16]. In order to overcome these challenges associated with
characterizing the bond coat layer itself, equivalent bulk materials are produced in the
current study through the application of spark plasma sintering (SPS).
SPS is a novel sintering technique characterized by its higher heating rate, lower sintering
temperature and shorter dwell time than conventional pressure-assisted sintering [17, 18].
The powder is heated by a direct-pulsed current, which flows through punches, die and
the processed material. The Joule heat due to the electric current rapidly leads to the
consolidation of the powder particles under pressure [19]. The SPS technique was first
applied to the NiCrAlY system in an effort to study the creep behavior of this system [20].
In recent years, SPS has been further applied to fabricate NiCrAlY coatings directly on a
substrate, resulting in coatings that exhibit better adhesion and antioxygenic properties
[21-23]. The relationships between microstructure and mechanical behavior of
SPS-processed NiCrAlY, specifically after exposure to elevated temperatures, has not,
however, been previously studied. Thus, the objectives of the current study are to
characterize the microstructural changes that occur in this material at elevated
temperatures and to quantify the consequential changes in mechanical behavior.
2. Experimental procedures
2.1 Materials
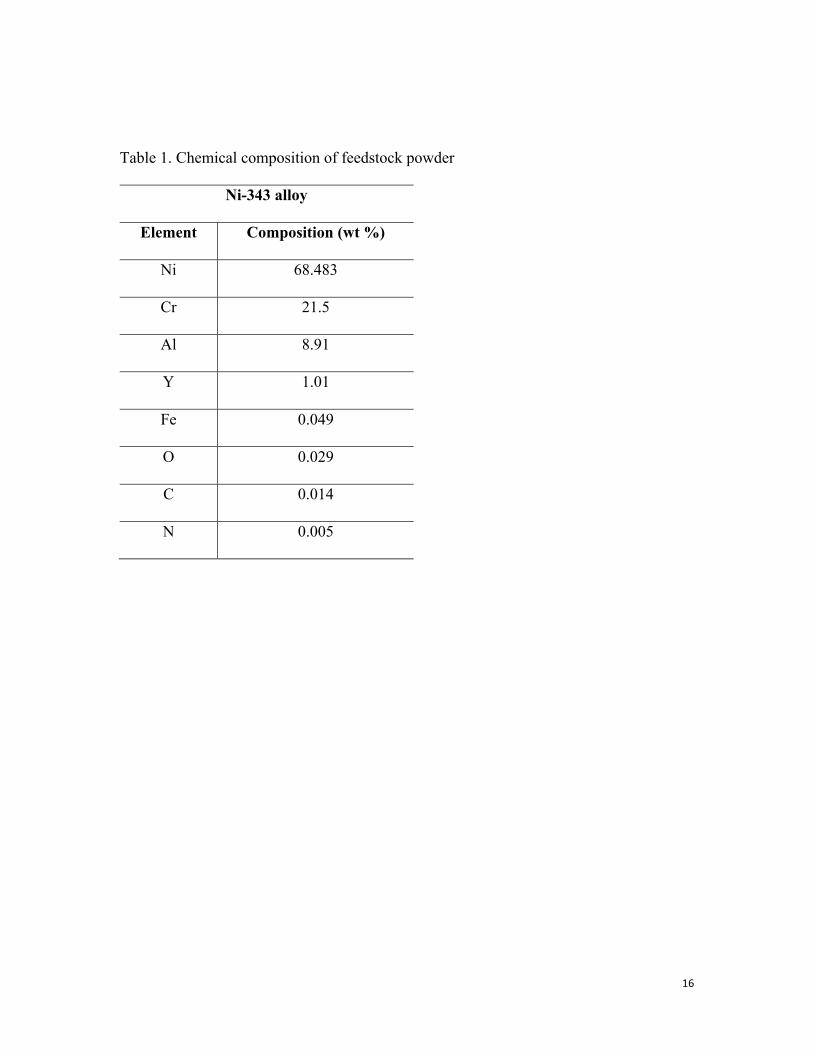
Commercially available, gas atomized NiCrAlY powder (Ni-343 alloy) with an average
5
particle size of 12 µm and an average grain size of 1 µm was used as the feedstock
material. The chemical composition of the material was tested by chemical analysis, the
results of which are provided in Table 1.
2.2 Spark plasma sintering (SPS) process
The feedstock powder was loaded into a graphite die with a 20 mm inside diameter, and
pre-pressed under 25 MPa of uniaxial pressure using a hydrostatic press, to increase the
green density prior to sintering. In order to minimize the diffusion of carbon from the
graphite die into the sample, the inner wall of the die and inside faces of the plungers
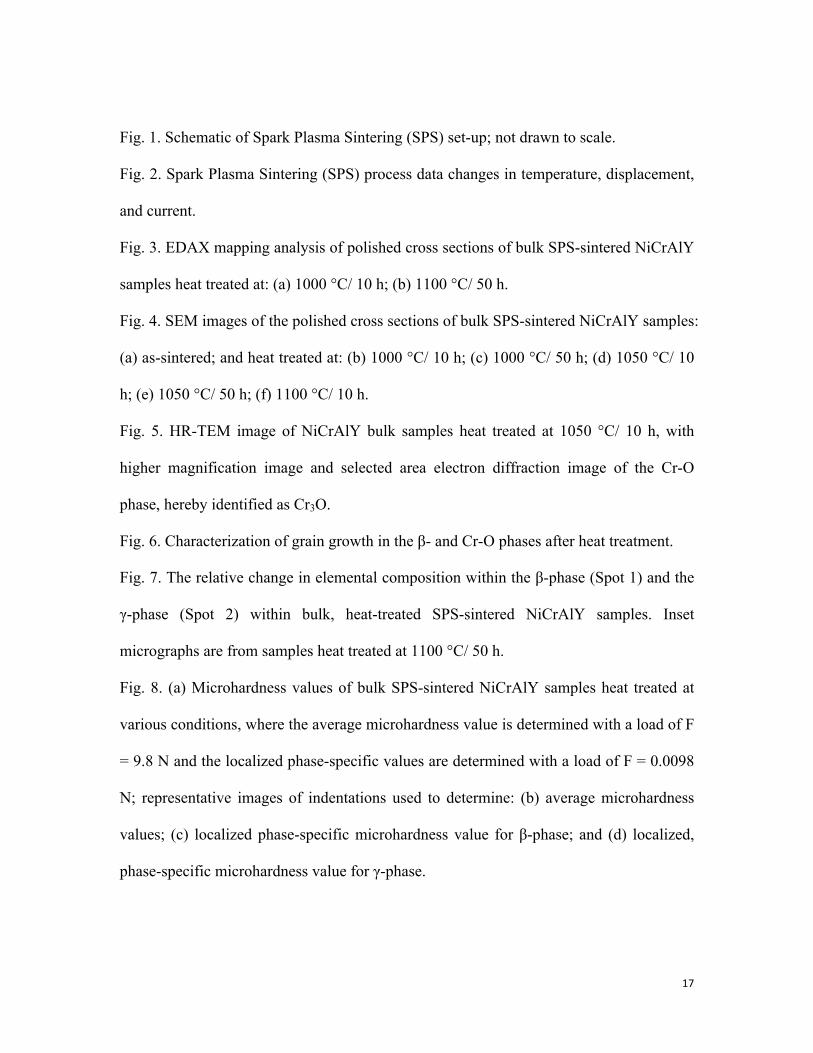
were coated with a ~50-70 µm thick layer of BN prior to loading the NiCrAlY powder. A
schematic of the graphite die is shown in Fig. 1. Temperature 1 (at the die) and
Temperature 2 (at the top plunger) were measured by infrared pyrometers to obtain a true
value of temperature during the sintering process. The pre-assembled graphite die was
put into the chamber of the SPS device (SPS 825S system fabricated by DR. Sinter Inc.)
and pressed with 30 MPa of uniaxial pressure. This load and a vacuum of 4 Pa in the
chamber were applied throughout the sintering process. The details of the heating cycle
are as follows.
Room temperature 600 °C 1000 °C 1000 °C
room temperature
2.3 Heat treatment
The as-sintered samples were polished with SiC abrasive paper before heat treatment in
order to remove the carburized layer and BN layer on the surfaces of the sample. The
heat treatment process was performed in a muffle furnace, which has a maximum
6
operating temperature of 1200 °C. The temperature control was performed using a
thermocouple in the middle of the furnace. Throughout the heat-treatment process, the
samples were sealed in stainless steel tubes filled with argon to avoid oxidation reactions.
The heat treatments were carried out at 1000 °C for 10 h, 1000 °C for 50 h, 1050 °C for
10 h, 1050 °C for 50 h, 1100 °C for 10 h and 1100 °C for 50 h. The temperatures studied
here were chosen according to the extreme service temperatures of NiCrAlY bond coats
in TBCs [24]. After heat treatment, the samples were quenched in water so that the high
temperature microstructure could be locked in.
2.4 Microhardness tests
The surfaces of the samples were polished with diamond polishing fluid (6 µm, 3 µm, and
1 µm) before conducting the microhardness tests. The hardness measurements were
performed using a microhardness tester (Micromet-2004 fabricated by Buehler Inc.). The
Micromet-2004 is a force-driven static measuring device for micro-indentation, and
equipped with a Vickers diamond pyramid indenter. The indenter is driven into, and
withdrawn from, the surface under a preset load. In this study, a load of 10 g was applied
for what we refer to as the average microhardness tests. The diagonal lengths of the
indentations under this test parameter were approximately 60-80 µm, which covers
enough area to get the average microhardness of material derived from the multiple
phases present in the microstructure. A minimal load of 0.01 g was applied for what we
call the localized phase-specific microhardness tests, which were conducted on individual
grains of the γ-Ni(Cr) phase and β-NiAl phase, respectively, on samples that had been
heat-treated. Instead of using the raw data generated from the microhardness tester, we
carefully measured the length of the indentation diagonals with scanning electron
7
microscopy (SEM) so as to achieve higher accuracy. Five indentations were measured in
each sample to calculate the average values and standard deviation. The corresponding
microhardness values were calculated according to the equation below [25]:
HV=1.854F/D12
where HV is the Vickers hardness, F is the applied load, and D1 is the average diagonal
length of the indentations.
2.5 Characterization techniques
The microstructure and phase composition of the samples was investigated by using
micrographic examination and microprobe analysis performed with a Phillips FEI
XL30-SFEG scanning electron microscope (SEM), an Energy Dispersive X-ray
spectroscopy (EDAX) – ZAF Quantification (Standardless) system, and a JEOL
JEM-2500 high-resolution transmission microscope (HR-TEM). The average grain sizes
of select phases within the microstructure were calculated from SEM images through the
application of the image analysis software Image-Pro® 5.0.
3. Results
3.1 Spark Plasma Sintering (SPS) stages
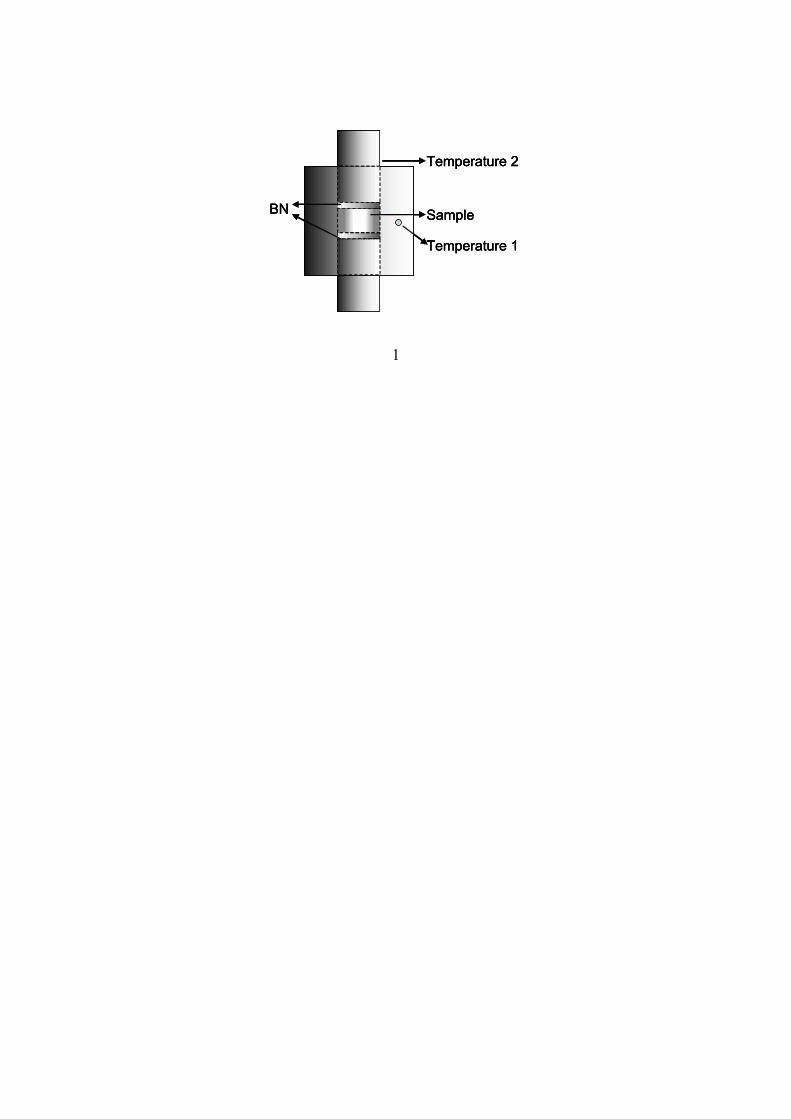
Fully dense NiCrAlY bulk samples were successfully sintered by SPS at 1000 °C for 3
minutes under 30 MPa axial pressure. Fig. 2 shows the changes in electric current,
temperature and displacement that occur during the SPS process. Because temperatures
below 567 °C are not detectable by infrared pyrometry, only the temperature range above
567 °C is shown in Fig. 2. According to the displacement curve (noting that positive
displacement represents shrinkage), the SPS process can be divided into three stages,
consisting of: (A) preheating (room temperature-593 °C), (B) shrinkage (593-980 °C),
8
and (C) thermal expansion (980-1001 °C).
3.2 Phase transformation and microstructure
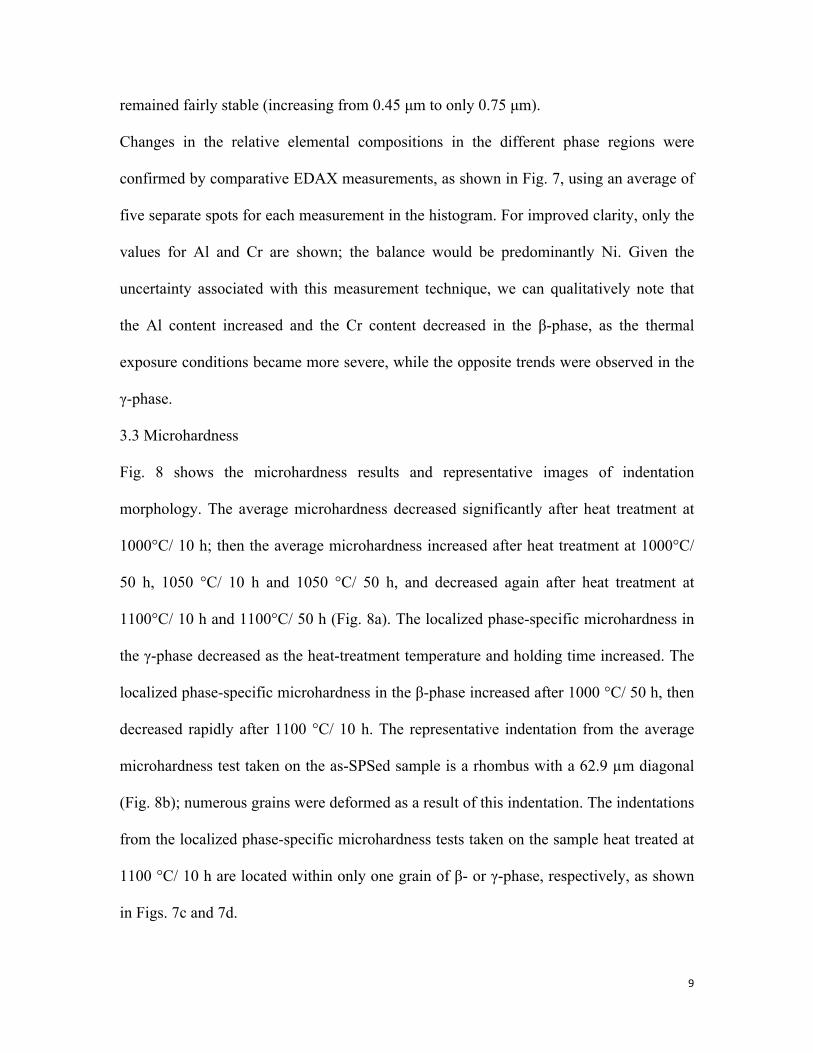
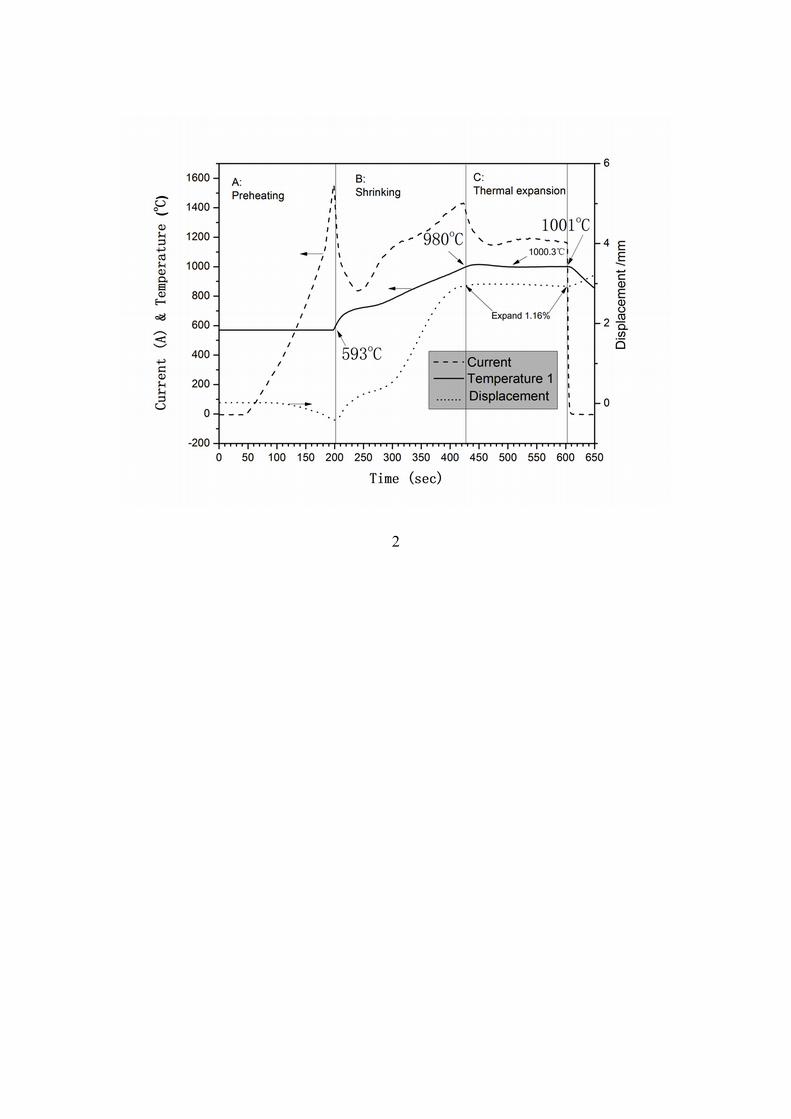
The phases associated with the different microconstituents were identified by EDAX
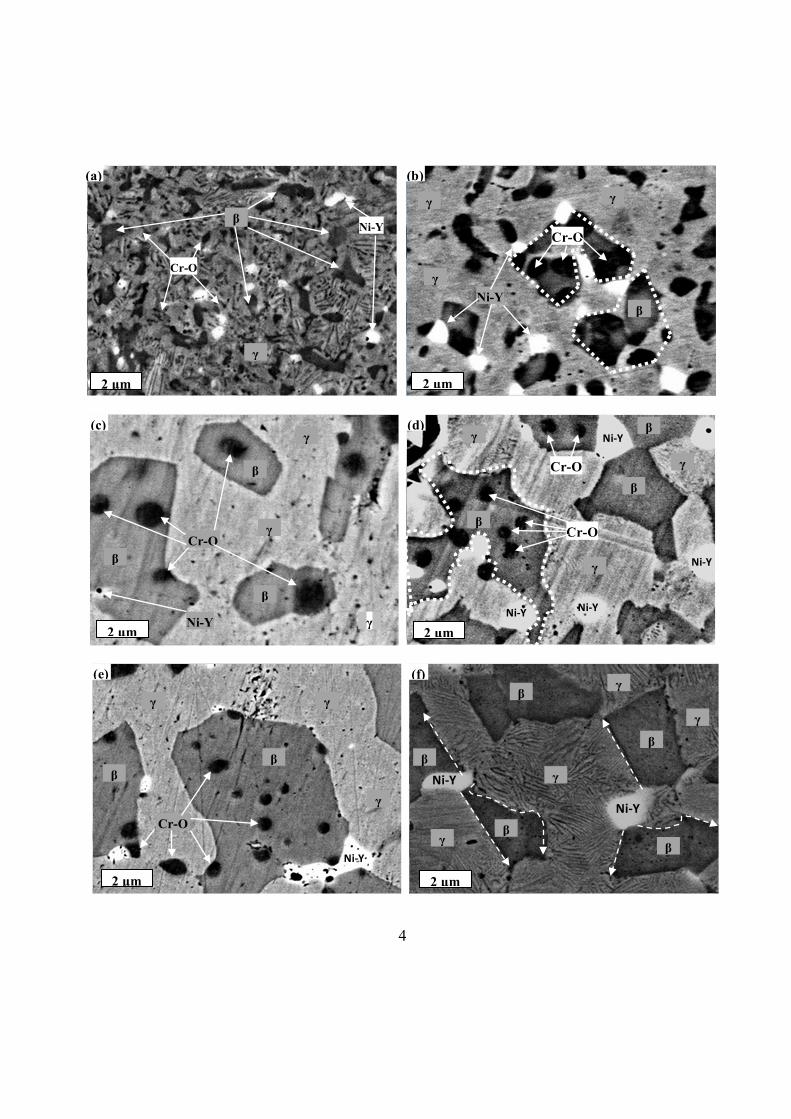
mapping analysis (shown in Fig. 3): γ-Ni(Cr) (light gray), β-NiAl (dark gray), a Ni,Y-rich
phase (white, labeled as Ni-Y), and a Cr,O-rich phase (black spots, labeled as Cr-O).
These phases are consistent with conventional, thermal-sprayed NiCrAlY alloys, as
described in the Introduction. Although previously observed in our recent studies [6, 8],
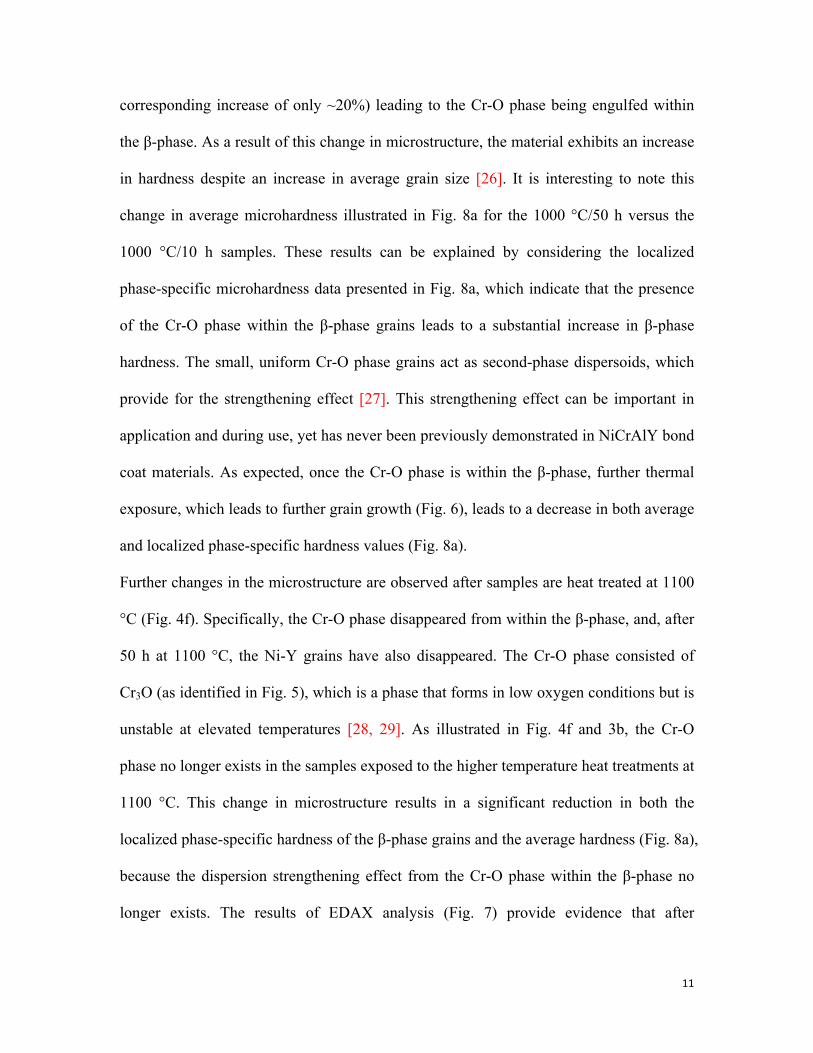
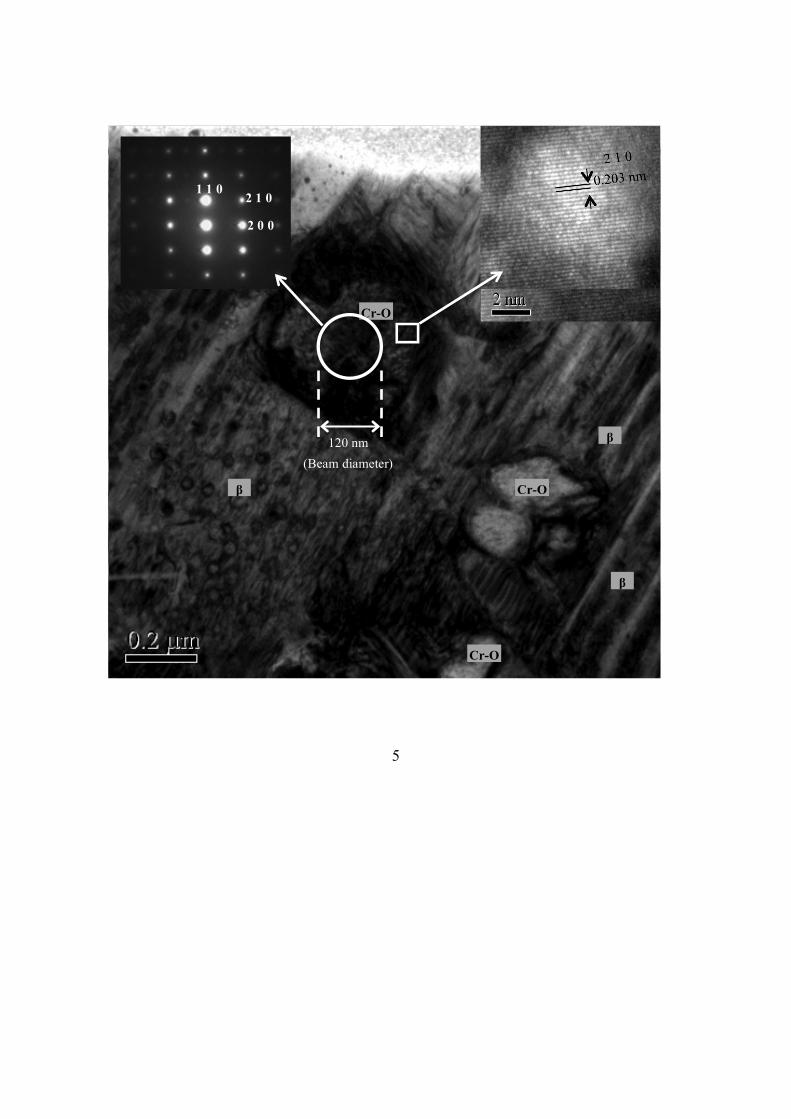
the Cr-O phase has not previously been well characterized. Therefore, HR-TEM is
applied here to clarify the phase present in these regions. A representative HR-TEM
bright field (BF) image with the corresponding selected area electron diffraction pattern
is shown in Fig. 5. The Cr-O phase is thus identified as the cubic Cr3O phase. The higher
magnification image highlights the [2 1 0] crystal plane of a Cr3O grain.
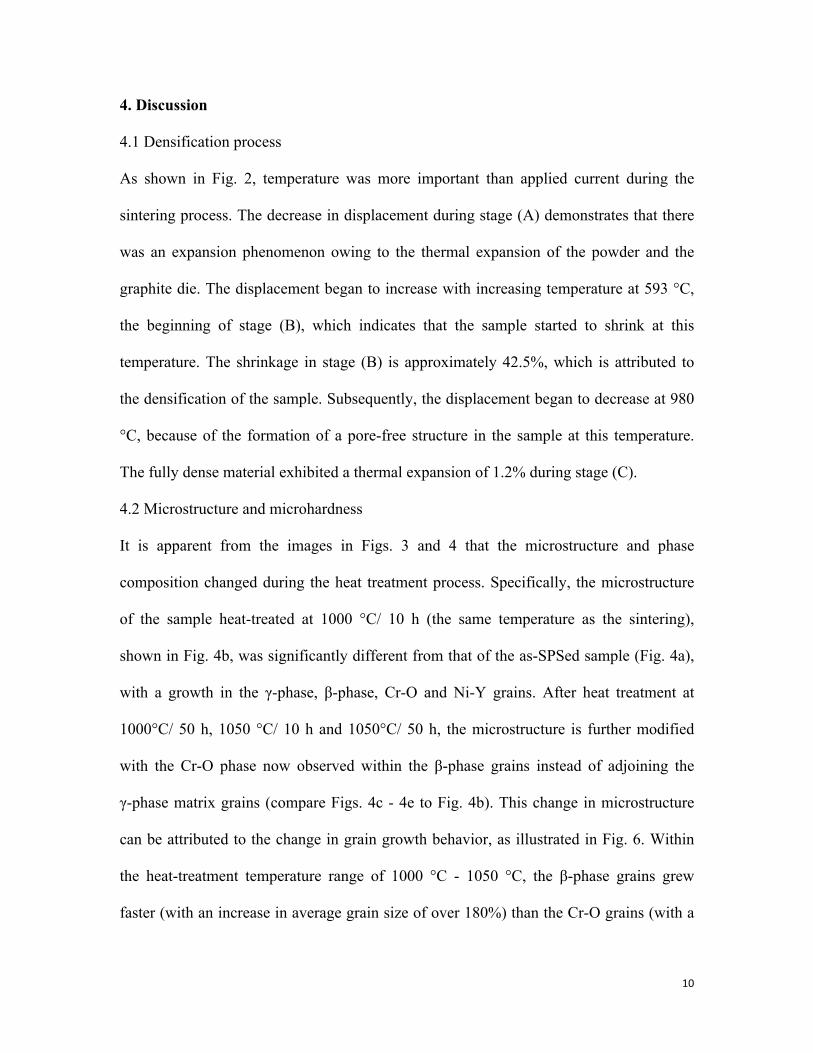
Representative microstructures of the bulk NiCrAlY samples in the as-sintered condition
and after select heat-treatment conditions are provided in Figs. 3 and 4. Neither pores nor
cracks are observed in these samples. Significant grain growth and microstructure
evolution are observed after heat treatment. After heat treatment at 1000 °C/ 50 h, 1050
°C/ 10 h and 1050 °C/ 50 h, the β-phase grains have grown preferentially and have
engulfed the Cr-O phase and some of the Ni-Y phase. After heat treatment at 1100 °C/ 10
h, the Cr-O phase has disappeared from the microstructure. Longer exposure at 1100 °C
resulted in the apparent disappearance of the Ni-Y phase and further grain growth (Fig.
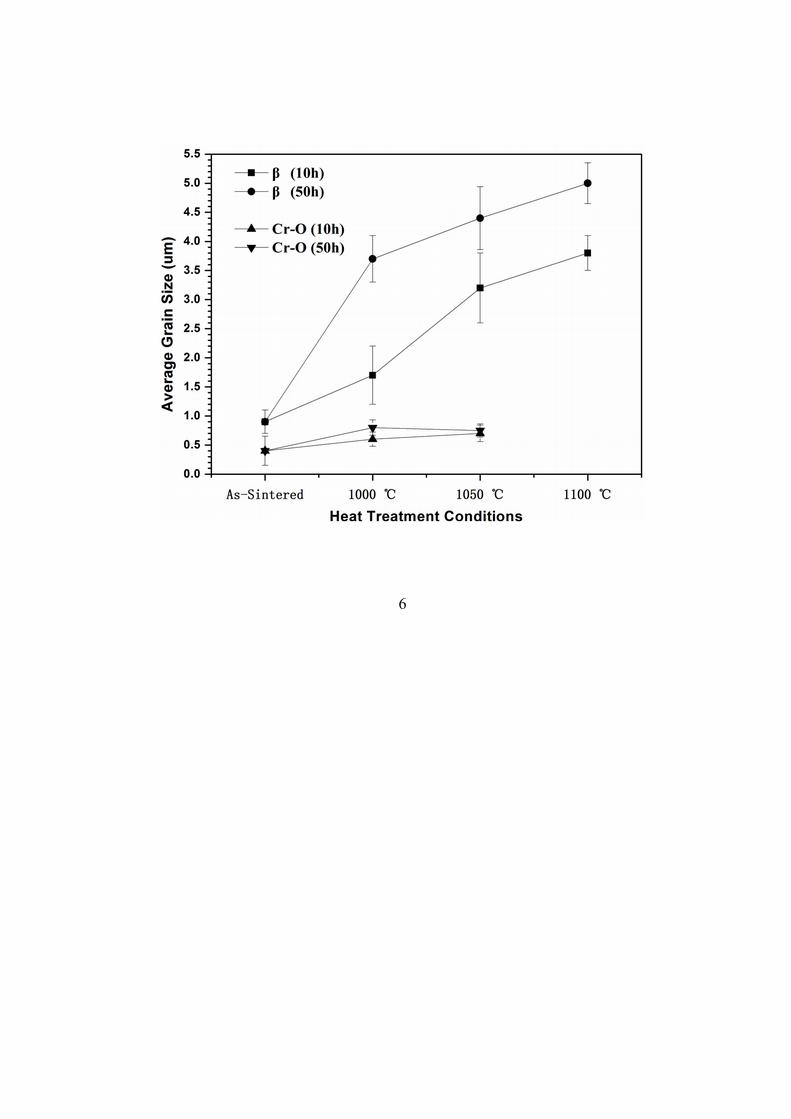
3b). Results from the image analysis on the β-phase and Cr-O grains after select heat
treatments (Fig. 6) indicate that, whereas the β-phase grains exhibited noticeable growth
with increased thermal exposure (increasing from 0.9 µm to 4.5 µm), the Cr-O grains
9
remained fairly stable (increasing from 0.45 µm to only 0.75 µm).
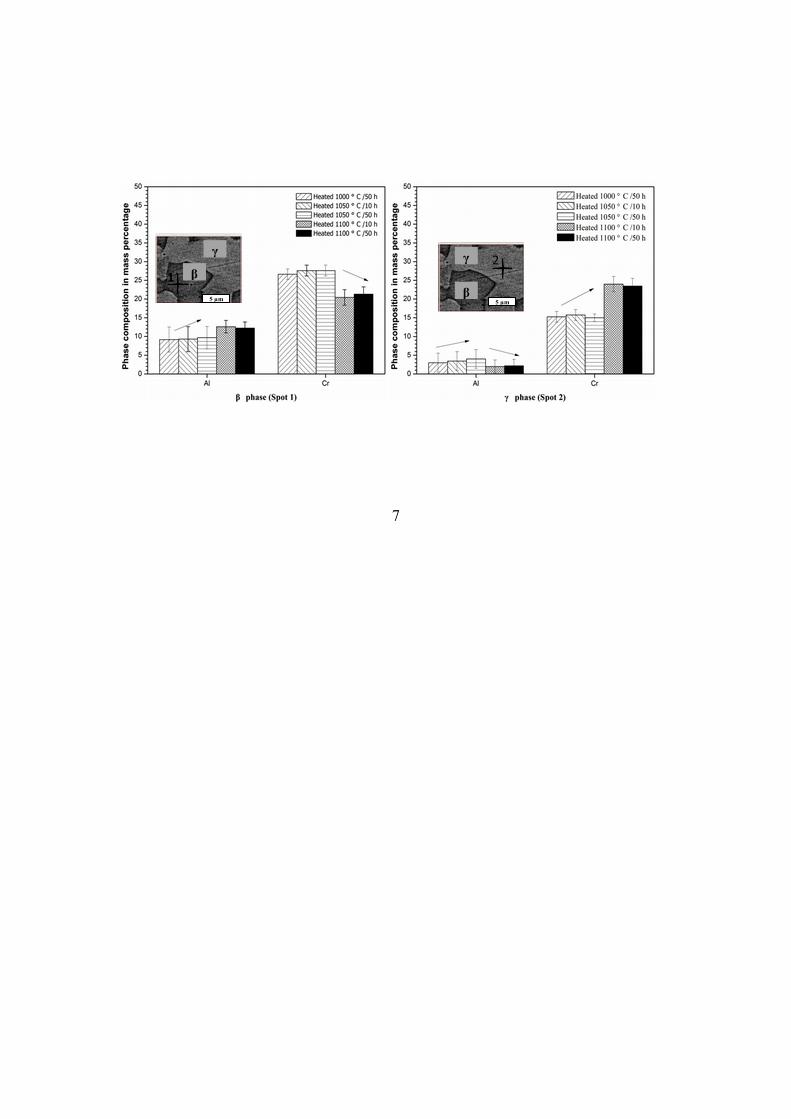
Changes in the relative elemental compositions in the different phase regions were
confirmed by comparative EDAX measurements, as shown in Fig. 7, using an average of
five separate spots for each measurement in the histogram. For improved clarity, only the
values for Al and Cr are shown; the balance would be predominantly Ni. Given the
uncertainty associated with this measurement technique, we can qualitatively note that
the Al content increased and the Cr content decreased in the β-phase, as the thermal
exposure conditions became more severe, while the opposite trends were observed in the
γ-phase.
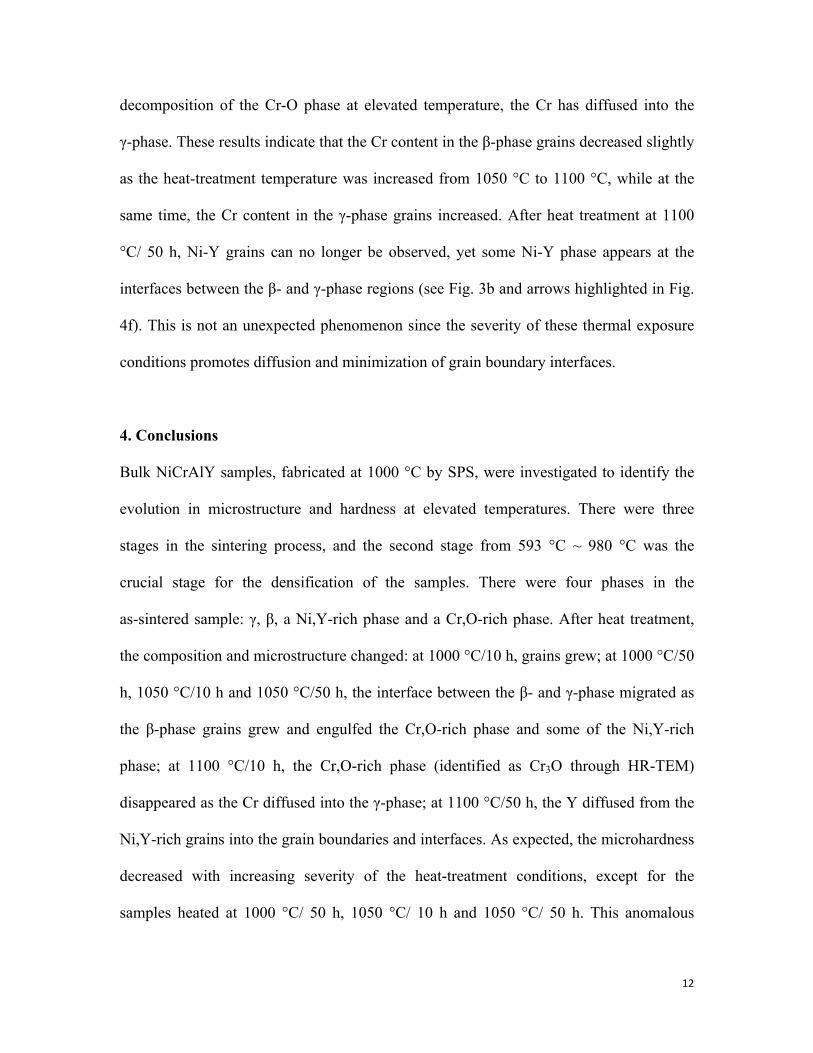
3.3 Microhardness
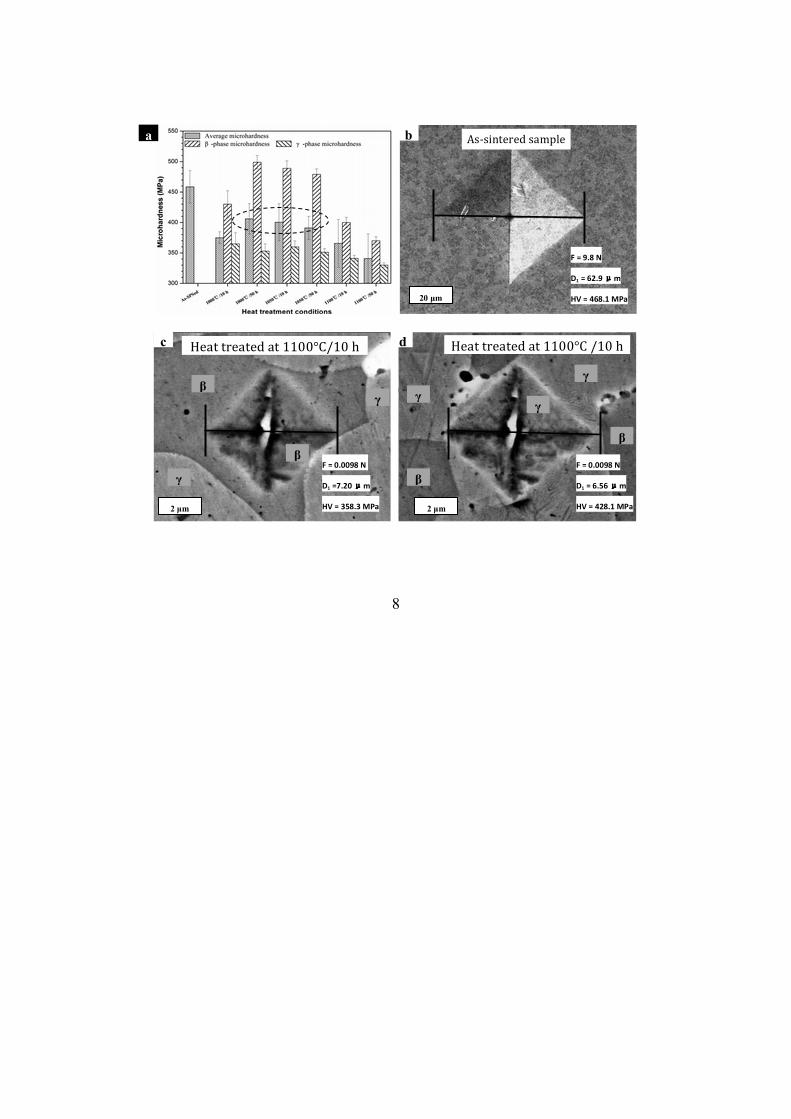
Fig. 8 shows the microhardness results and representative images of indentation
morphology. The average microhardness decreased significantly after heat treatment at
1000°C/ 10 h; then the average microhardness increased after heat treatment at 1000°C/
50 h, 1050 °C/ 10 h and 1050 °C/ 50 h, and decreased again after heat treatment at
1100°C/ 10 h and 1100°C/ 50 h (Fig. 8a). The localized phase-specific microhardness in
the γ-phase decreased as the heat-treatment temperature and holding time increased. The
localized phase-specific microhardness in the β-phase increased after 1000 °C/ 50 h, then
decreased rapidly after 1100 °C/ 10 h. The representative indentation from the average
microhardness test taken on the as-SPSed sample is a rhombus with a 62.9 µm diagonal
(Fig. 8b); numerous grains were deformed as a result of this indentation. The indentations
from the localized phase-specific microhardness tests taken on the sample heat treated at
1100 °C/ 10 h are located within only one grain of β- or γ-phase, respectively, as shown
in Figs. 7c and 7d.
10
4. Discussion
4.1 Densification process
As shown in Fig. 2, temperature was more important than applied current during the
sintering process. The decrease in displacement during stage (A) demonstrates that there
was an expansion phenomenon owing to the thermal expansion of the powder and the
graphite die. The displacement began to increase with increasing temperature at 593 °C,
the beginning of stage (B), which indicates that the sample started to shrink at this
temperature. The shrinkage in stage (B) is approximately 42.5%, which is attributed to
the densification of the sample. Subsequently, the displacement began to decrease at 980
°C, because of the formation of a pore-free structure in the sample at this temperature.
The fully dense material exhibited a thermal expansion of 1.2% during stage (C).
4.2 Microstructure and microhardness
It is apparent from the images in Figs. 3 and 4 that the microstructure and phase
composition changed during the heat treatment process. Specifically, the microstructure
of the sample heat-treated at 1000 °C/ 10 h (the same temperature as the sintering),
shown in Fig. 4b, was significantly different from that of the as-SPSed sample (Fig. 4a),
with a growth in the γ-phase, β-phase, Cr-O and Ni-Y grains. After heat treatment at
1000°C/ 50 h, 1050 °C/ 10 h and 1050°C/ 50 h, the microstructure is further modified
with the Cr-O phase now observed within the β-phase grains instead of adjoining the
γ-phase matrix grains (compare Figs. 4c - 4e to Fig. 4b). This change in microstructure
can be attributed to the change in grain growth behavior, as illustrated in Fig. 6. Within
the heat-treatment temperature range of 1000 °C - 1050 °C, the β-phase grains grew
faster (with an increase in average grain size of over 180%) than the Cr-O grains (with a
11
corresponding increase of only ~20%) leading to the Cr-O phase being engulfed within
the β-phase. As a result of this change in microstructure, the material exhibits an increase
in hardness despite an increase in average grain size [26]. It is interesting to note this
change in average microhardness illustrated in Fig. 8a for the 1000 °C/50 h versus the
1000 °C/10 h samples. These results can be explained by considering the localized
phase-specific microhardness data presented in Fig. 8a, which indicate that the presence
of the Cr-O phase within the β-phase grains leads to a substantial increase in β-phase
hardness. The small, uniform Cr-O phase grains act as second-phase dispersoids, which
provide for the strengthening effect [27]. This strengthening effect can be important in
application and during use, yet has never been previously demonstrated in NiCrAlY bond
coat materials. As expected, once the Cr-O phase is within the β-phase, further thermal
exposure, which leads to further grain growth (Fig. 6), leads to a decrease in both average
and localized phase-specific hardness values (Fig. 8a).
Further changes in the microstructure are observed after samples are heat treated at 1100
°C (Fig. 4f). Specifically, the Cr-O phase disappeared from within the β-phase, and, after
50 h at 1100 °C, the Ni-Y grains have also disappeared. The Cr-O phase consisted of
Cr3O (as identified in Fig. 5), which is a phase that forms in low oxygen conditions but is
unstable at elevated temperatures [28, 29]. As illustrated in Fig. 4f and 3b, the Cr-O
phase no longer exists in the samples exposed to the higher temperature heat treatments at
1100 °C. This change in microstructure results in a significant reduction in both the
localized phase-specific hardness of the β-phase grains and the average hardness (Fig. 8a),
because the dispersion strengthening effect from the Cr-O phase within the β-phase no
longer exists. The results of EDAX analysis (Fig. 7) provide evidence that after
12
decomposition of the Cr-O phase at elevated temperature, the Cr has diffused into the
γ-phase. These results indicate that the Cr content in the β-phase grains decreased slightly
as the heat-treatment temperature was increased from 1050 °C to 1100 °C, while at the
same time, the Cr content in the γ-phase grains increased. After heat treatment at 1100
°C/ 50 h, Ni-Y grains can no longer be observed, yet some Ni-Y phase appears at the
interfaces between the β- and γ-phase regions (see Fig. 3b and arrows highlighted in Fig.
4f). This is not an unexpected phenomenon since the severity of these thermal exposure
conditions promotes diffusion and minimization of grain boundary interfaces.
4. Conclusions
Bulk NiCrAlY samples, fabricated at 1000 °C by SPS, were investigated to identify the
evolution in microstructure and hardness at elevated temperatures. There were three
stages in the sintering process, and the second stage from 593 °C ~ 980 °C was the
crucial stage for the densification of the samples. There were four phases in the
as-sintered sample: γ, β, a Ni,Y-rich phase and a Cr,O-rich phase. After heat treatment,
the composition and microstructure changed: at 1000 °C/10 h, grains grew; at 1000 °C/50
h, 1050 °C/10 h and 1050 °C/50 h, the interface between the β- and γ-phase migrated as
the β-phase grains grew and engulfed the Cr,O-rich phase and some of the Ni,Y-rich
phase; at 1100 °C/10 h, the Cr,O-rich phase (identified as Cr3O through HR-TEM)
disappeared as the Cr diffused into the γ-phase; at 1100 °C/50 h, the Y diffused from the
Ni,Y-rich grains into the grain boundaries and interfaces. As expected, the microhardness
decreased with increasing severity of the heat-treatment conditions, except for the
samples heated at 1000 °C/ 50 h, 1050 °C/ 10 h and 1050 °C/ 50 h. This anomalous
13
behavior was explained on the basis of the dispersoid strengthening capability of the
Cr,O-rich grains that are located within the β-phase grains after these heat-treatment
conditions.
Acknowledgements
Financial support was provided by the U.S. Office of Naval Research (ONR) through
Grant N00014-06-1-0506 and the China Scholarship Council (CSC) through the
Government-sponsored Overseas Study Program.
14
References
[1] M.C. Mayoral, J.M. Andrés, M.T. Bona, V. Higuera, F.J. Belzunce, Surf. Coat. Technol. 202 (2008) 1816-1824.
[2] D. Toma, W. Brandl, U. Koster, Surf. Coat. Technol. 120-121 (1999) 8-15.
[3] L. Ajdelsztajn, J.A. Picas, G.E. Kim, F.L. Bastian, J.M. Schoenung, V. Provenzanoa, Mater. Sci. Eng. A 338 (2002) 33-43.
[4] E. Lugscheider , C. Herbst, L. Zhao, Surf. Coat. Technol. 108-109 (1998) 16-23.
[5] T. Taylor, A. Ashary, A. Bolcavage, A. Feuerstein, J. Knapp, N. Hitchman, J. Therm, Spray Technol. 17 (2008) 199-213.
[6] K. Ma, J.M. Schoenung, Philos. Mag. Lett. 90 (2010) 739–751.
[7] F. Tang, L, Ajdelsztajn, J.M. Schoenung, Scr. Mater. 51 (2004) 25-29.
[8] K. Ma, X, Tang, J.M. Schoenung, Acta Mater. submitted.
[9] B. Baufeld, M. Bartscha, P. BroImage, M. Schmückera, Mater. Sci. Eng. A 384 (2004) 162-171.
[10] B. Saeedi, A. Sabour, A. Ebadi, A.M. Khoddami, J. Mater. Sci. Technol. 25 (2009) 499-507.
[11] K.J. Hemker, B.G. Mendis, C. Eberl, Mater. Sci. Eng. A 483-484 (2008) 727-730.
[12] C. Eberl, D. S. Gianola, K.J. Hemker, Exp. Mech. 50 (2010) 85–97.
[13] D.S. Gianola, S. Van Petegem, M. Legros, S. Brandstetter, H. Van Swygenhoven K.J. Hemker, 54 (2006) 2253-2263.
[14] M. Funk , K. Ma , J.M. Schoenung , M. Goeken , K.J. Hemker, Metall. Mater. Trans. A, submitted
[15] B.S. Sidhu, D. Puri, S. Prakash, Mater. Sci. Eng. A 368 (2004) 149-158.
[16] B.G. Mendis, B. Tryon, T.M. Pollock, K.J. Hemker, Surf. Coat. Technol. 201 (2006) 3918-3925.
[17] W. Li, L. Gao, Biomater. 24 (2003) 937-940.
[18] R. Licheri, R. Orrù, C. Musa, G. Cao, Mater. Lett. 62 (2008) 432-435.
[19] M. Cabibbo, C. Paternoster, R. Cecchini, A. Fabrizi, A. Molinari, S. Libardi, Mater. Sci. Eng. A 496 (2008) 121-132.
15
[20] L. Ajdelsztajn, D. Hulbert, A. Mukherjee, J.M. Schoenung, Surf. Coat. Technol. 201 (2007) 9462-9467.
[21] D. Monceau, D. Oquab, C. Estournes, M. Boidot, S. Selezneff, Y. Thebault, Y. Cadoret, Surf. Coat. Technol. 204 (2009) 771-778.
[22] D. Oquab, C. Estournes, D. Monceau, Adv. Eng. Mater. 5 (2007) 413-417.
[23] D. Oquab, D. Monceau, Y. Thebault C. Estournes, Mater. Sci. Forum 595-598 (2008) 143-150.
[24] U. Martin, M. Jerenz, U. Mühle, H. Oettel, Mater. Sci. Eng. A 319-321 (2001) 388-392.
[25] N. P. Slavina, Meas. Tech. 5 (1962) 830-832.
[26] H. Conrad, J. Narayan, Scr. Mater. 42 (2000) 1025-1030
[27] F. Sun, S. Kim, C. Cao, Y. Lee, M. Yan, Mater. Sci. Eng. A 329-331 (2002) 661-667.
[28] N. Schonberg, Acta Chemica Scandinavica, 8 (1954) 221.
[29] P.V. Kiryukhantsev-Korneev, J.F. Pierson, J.P Baur, E.A. Levashov, D.V. Shtansky, 3rd France-Russia Seminar, (2007) 11-14.
16
Table 1. Chemical composition of feedstock powder
Ni-343 alloy
Element Composition (wt %)
Ni 68.483
Cr 21.5
Al 8.91
Y 1.01
Fe 0.049
O 0.029
C 0.014
N 0.005
17
Fig. 1. Schematic of Spark Plasma Sintering (SPS) set-up; not drawn to scale.
Fig. 2. Spark Plasma Sintering (SPS) process data changes in temperature, displacement,
and current.
Fig. 3. EDAX mapping analysis of polished cross sections of bulk SPS-sintered NiCrAlY
samples heat treated at: (a) 1000 °C/ 10 h; (b) 1100 °C/ 50 h.
Fig. 4. SEM images of the polished cross sections of bulk SPS-sintered NiCrAlY samples:
(a) as-sintered; and heat treated at: (b) 1000 °C/ 10 h; (c) 1000 °C/ 50 h; (d) 1050 °C/ 10
h; (e) 1050 °C/ 50 h; (f) 1100 °C/ 10 h.
Fig. 5. HR-TEM image of NiCrAlY bulk samples heat treated at 1050 °C/ 10 h, with
higher magnification image and selected area electron diffraction image of the Cr-O
phase, hereby identified as Cr3O.
Fig. 6. Characterization of grain growth in the β- and Cr-O phases after heat treatment.
Fig. 7. The relative change in elemental composition within the β-phase (Spot 1) and the
γ-phase (Spot 2) within bulk, heat-treated SPS-sintered NiCrAlY samples. Inset
micrographs are from samples heat treated at 1100 °C/ 50 h.
Fig. 8. (a) Microhardness values of bulk SPS-sintered NiCrAlY samples heat treated at
various conditions, where the average microhardness value is determined with a load of F
= 9.8 N and the localized phase-specific values are determined with a load of F = 0.0098
N; representative images of indentations used to determine: (b) average microhardness
values; (c) localized phase-specific microhardness value for β-phase; and (d) localized,
phase-specific microhardness value for γ-phase.
1
2
3
(b)
2 µm
β
γ
β
γ
γ
NiL Crk
YL Ok Alk
NiL Crk
YL Ok Alk
(a)
2 µm
β Cr-‐O
Ni-‐Y
γ
4
(a)
Cr-O
Ni-Y
2 µm
β
γ
Cr-O
(b)
2 µm
γ γ
γ
β Ni-Y
(c)
2 µm
β
β
β
γ
γ
γ
Cr-O
Ni-Y
Cr-O
γ
β
γ
γ
Ni-‐Y (d)
2 µm Ni-‐Y
Cr-O
Ni-‐Y
Ni-‐Y
β
β
(e)
2 µm
γ
β
γ
γ
Ni-‐Y
β
Cr-O
2 µm
(f)
Ni-‐Y
Ni-‐Y
β
β
β
β β
γ
γ
γ
γ
5
Cr-O
Cr-O
Cr-O
β
β
β
1 1 0 2 1 0
2 0 0
120 nm (Beam diameter)
6
7
2
5 µm
1 5 µm
γ γ
β β
8
a
d
2 µm
F = 0.0098 N
D1 = 6.56 μm
HV = 428.1 MPa
Heat treated at 1100°C /10 h
b As-‐sintered sample
F = 9.8 N
D1 = 62.9 μm
HV = 468.1 MPa 20 µm
c
2 µm
F = 0.0098 N
D1 =7.20 μm
HV = 358.3 MPa
Heat treated at 1100°C/10 h
γ
γ
γ γ
γ
β
β
β
β
Related Documents