no. 05/2004 Climate Spring and summer temperatures in Trøndelag 1701 - 2003 P.Ø. Nordli 9 10 11 12 13 14 15 16 1700 1725 1750 1775 1800 1825 1850 1875 1900 1925 1950 1975 2000 2025 Temperature (deg) Values Filt.3 Filt.9

Spring and summer temperatures in Trøndelag 1701 - 2003 · e-mail: [email protected] Internet: met.no Bank account 7694 05 00628 Swift code DNBANOKK report Title Spring and summer temperatures
May 12, 2020
Welcome message from author
This document is posted to help you gain knowledge. Please leave a comment to let me know what you think about it! Share it to your friends and learn new things together.
Transcript

no. 05/2004 Climate
Spring and summer temperatures in Trøndelag 1701 - 2003
P.Ø. Nordli
9
10
11
12
13
14
15
16
1700 1725 1750 1775 1800 1825 1850 1875 1900 1925 1950 1975 2000 2025
Tem
pera
ture
(deg
)
Values Filt.3 Filt.9


Postal address P.O.Box 43, Blindern NO-0313 OSLO Norway
Office Niels Henrik Abelsvei 40
Telephone +47 22 96 30 00
Telefax +47 22 96 30 50
e-mail: [email protected] Internet: met.no
Bank account 7694 05 00628
Swift code DNBANOKK
report
Title Spring and summer temperatures in Trøndelag 1701 - 2003
Date 2004.03.11
Section Section for climate research
Report no. 5 Classification
Free Restricted ISSN 1503-8025
Author(s) P. Ø. Nordli
e-ISSN <nummer> Client(s) Norpast-2, Norwegian Research Council
Client’s reference 155971/720
Abstract The time evolution of spring-summer temperature for the Trøndelag region was reconstructed by use of one particular proxy source: the first day of grain harvest taken from farmers’ diaries. As the growing conditions are different in the region, the shorter series had to be adjusted before they were nested together to form a composite series for Trøndelag, 1701 – 2003. The adjustments were based on overlapping periods. Generally the series overlap well, but a crucial point in the reconstruction, is the overlapping between the 19th and 18th centuries where the overlapping consists of only six years. A significant, linear trend for the whole series of +0.6 °C (+0.2 °C per century) was detected. The trends within individual centuries differ much from each others. During the 18th century the trend is negative (-0.4 °C), whereas the trends are positive during the 19th and 20th centuries, +0.3 °C and +0.5 °C respectively. By using a Gausian, decadal, low pass filter the Trøndelag series and an earlier derived western Norwegian series were compared. The maxima and minima of the two series were located in the same decades. Historically severe climatic decades described in narrative sources like the early 1740s, the first decade of the 19th century, the late 1830s, and the 1860s, also show low summer temperatures in the reconstructed series. The 1860s seem to have been much more severe in Trøndelag than in western Norway whereas the late 1830s seem to have been less severe. The study show that the summer AD 2002 in the Trøndelag region is the warmest ever since the beginning of the series 300 yeasrs ago. Keywords temperature; farmers' diaries; grain harvest; Little Ice Age; Trøndelag; Trondheim; regression analysis
Disiplinary signature
Responsible signature


Spring and summer temperatures in Trøndelag, 1701 - 2003
3
1 IntroductionThe national network of weather stations can be traced back to the 1860s with the introductionof five observation stations along the Norwegian coast, Sandøysund, Kristiansand, Mandal,Skudeneshavn and Ålesund, and one station inland, Dombås. The stations were run by thetelegraph authorities, and situated on telegraph stations. After the foundation of TheNorwegian Meteorological institute in 1866, the network grew denser, and what we may calla national weather observation network was well established before the end of the decennium.
Long before the network was established, sporadic temperature measurements were carriedout, for instance in Trondheim since 1762; the oldest observations in Norway. These wereperformed by private persons and were subject to frequent relocations (Birkeland 1949).Thus, both the quality of the observations and homogeneity through the relocations should bequestioned.
However, a supplement to the instrumental series exists. In historical documents temperatureproxies have been detected that can be used for temperature reconstructions. Examples are thevintage in southern and central Europe (Le Roy Ladurie and Baulant 1980) and the ryeharvest in Estonia and Finland (Tarand and Kuiv 1994; Tarand and Nordli 2001). In Norwaythe first day of barley harvest at the farm Kjellen has been used for quality control of theTrondheim series. In spite of an attempt of homogenisation by (Birkeland 1949) many largeinhomogeneities remain in the Trondheim series (Nordli 2001a).
In the Dovre mountain area the Kjøremsgrende series was extended back to 1813 (Nordli1997a, 2001a) by use of barley harvest at the Synstbø farm, the Ålesund series in Møre wasreconstructed back to 1843 (1997b, 2001a) by the Frøystad farm, the Hvam series inAustlandet, back to 1853 (Nordli 2001b) by the Hverven farm. Harvest data from severalfarms located within the same temperature region have also been used for reconstruction ofregional series, like the Austlandet series back to 1749 (Nordli 2001b) and the Vestlandetseries back to 1734 (Nordli et al. 2003).
Trøndelag, Central Norway, is an area in which the same pattern of temporal temperaturevariations is seen. The area is therefore defined as one climate region (Hanssen-Bauer andNordli 1998). Thus, it makes sense to base the reconstruction entirely on diaries within thisregion. There exists, however, harvest data from the neighbouring Swedish county Jämtlandback to 1701, starting more than 30 years earlier than the first Trøndelag data. For this reasonalso the Jämtland data are incorporating in the Trøndelag temperature reconstruction.
Spring and summer temperatures in Trøndelag, 1701 - 2003
4
2 Data series and data homogeneity
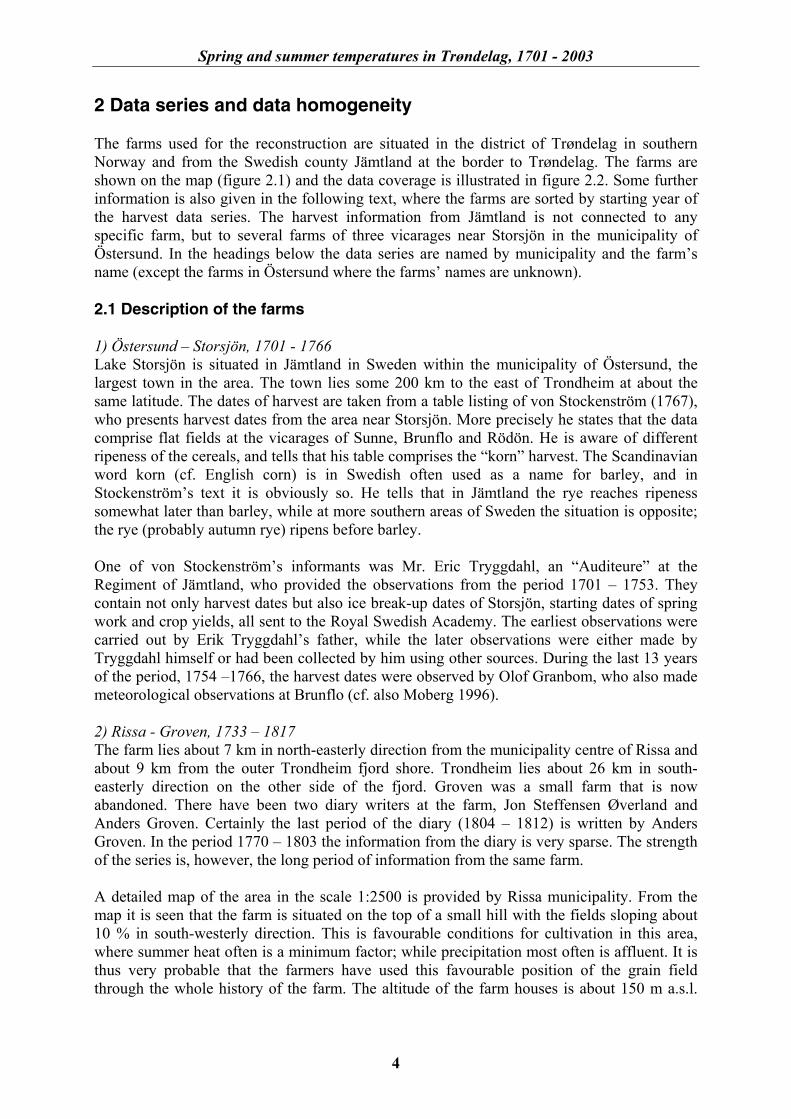
The farms used for the reconstruction are situated in the district of Trøndelag in southernNorway and from the Swedish county Jämtland at the border to Trøndelag. The farms areshown on the map (figure 2.1) and the data coverage is illustrated in figure 2.2. Some furtherinformation is also given in the following text, where the farms are sorted by starting year ofthe harvest data series. The harvest information from Jämtland is not connected to anyspecific farm, but to several farms of three vicarages near Storsjön in the municipality ofÖstersund. In the headings below the data series are named by municipality and the farm’sname (except the farms in Östersund where the farms’ names are unknown).
2.1 Description of the farms
1) Östersund – Storsjön, 1701 - 1766Lake Storsjön is situated in Jämtland in Sweden within the municipality of Östersund, thelargest town in the area. The town lies some 200 km to the east of Trondheim at about thesame latitude. The dates of harvest are taken from a table listing of von Stockenström (1767),who presents harvest dates from the area near Storsjön. More precisely he states that the datacomprise flat fields at the vicarages of Sunne, Brunflo and Rödön. He is aware of differentripeness of the cereals, and tells that his table comprises the “korn” harvest. The Scandinavianword korn (cf. English corn) is in Swedish often used as a name for barley, and inStockenström’s text it is obviously so. He tells that in Jämtland the rye reaches ripenesssomewhat later than barley, while at more southern areas of Sweden the situation is opposite;the rye (probably autumn rye) ripens before barley.
One of von Stockenström’s informants was Mr. Eric Tryggdahl, an “Auditeure” at theRegiment of Jämtland, who provided the observations from the period 1701 – 1753. Theycontain not only harvest dates but also ice break-up dates of Storsjön, starting dates of springwork and crop yields, all sent to the Royal Swedish Academy. The earliest observations werecarried out by Erik Tryggdahl’s father, while the later observations were either made byTryggdahl himself or had been collected by him using other sources. During the last 13 yearsof the period, 1754 –1766, the harvest dates were observed by Olof Granbom, who also mademeteorological observations at Brunflo (cf. also Moberg 1996).
2) Rissa - Groven, 1733 – 1817The farm lies about 7 km in north-easterly direction from the municipality centre of Rissa andabout 9 km from the outer Trondheim fjord shore. Trondheim lies about 26 km in south-easterly direction on the other side of the fjord. Groven was a small farm that is nowabandoned. There have been two diary writers at the farm, Jon Steffensen Øverland andAnders Groven. Certainly the last period of the diary (1804 – 1812) is written by AndersGroven. In the period 1770 – 1803 the information from the diary is very sparse. The strengthof the series is, however, the long period of information from the same farm.
A detailed map of the area in the scale 1:2500 is provided by Rissa municipality. From themap it is seen that the farm is situated on the top of a small hill with the fields sloping about10 % in south-westerly direction. This is favourable conditions for cultivation in this area,where summer heat often is a minimum factor; while precipitation most often is affluent. It isthus very probable that the farmers have used this favourable position of the grain fieldthrough the whole history of the farm. The altitude of the farm houses is about 150 m a.s.l.
Spring and summer temperatures in Trøndelag, 1701 - 2003
5
The harvested cereals at the farm are unspecified in the diary. It can be expected that theharvest starts with barley (se remarks from Jämtland).
Figure 2.1 Map of the Trøndelag and Jämtland regions. The farmers’ diaries are marked with redcolour on the map, those used in the reconstruction with sand-flowers, the others with red dots.
2) Holtålen - Langland, 1762 – 1804The farm is situated in Gauldalen Valley on the south-western bank of River Gaula, 75 km insouth-eastern direction from Trondheim (figure 2.1). The historical grain fields of Langlandare almost flat, situated between 380 and 385 m a.s.l. The valley has a continental climate,which does not allow other cereals than barley to be cultivated on the farm. The diary iswritten by only one person, Bør Langland (1732 – 1821).
Spring and summer temperatures in Trøndelag, 1701 - 2003
6
The farm is split up into many farms, but this was done later than 1804, when this diary stops.Today the site of the main farm is called Western Langland, farm No. 92/1.
012345678
1700 1725 1750 1775 1800 1825 1850 1875 1900
Farm
No.
1) Storsjön 2) Groven 3) Langland 4) Mo 5) Kjellen 6) Vognill 7 Øyrønningen
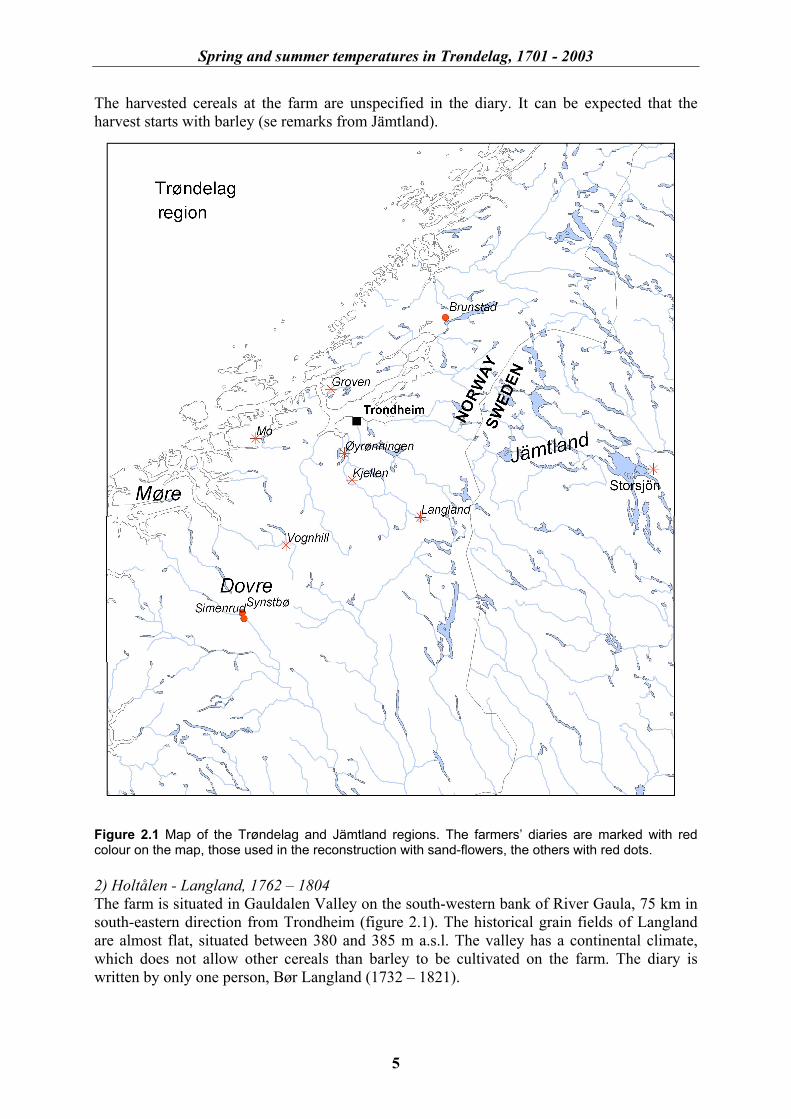
Figure 2.2 Available diaries in which the starting date of harvest is recorded. The figure comprisesdiaries in the districts of Trøndelag and Jämtland.
4) Hemne - Mo, 1790 - 1843The farm (No. 107/1) is situated at the western shore of Lake Rovatnet in Hemne municipalityin south-western Trøndelag (figure 2.1). The distance from the local centre Kyrksæterøra isabout 5 km in south-easterly direction, while Trondheim lies about 72 km to the east. Thegrain field is sloping in westerly direction towards the lake. The altitude of the field near thefarmhouses is about 100 m a.s.l.
The harvested cereals at the farm are mostly unspecified in the diary but in one case, it isclearly stated that it was barley. Barley is in Trøndelag probably the cereal that ripens earliest(see remarks from Jämtland) and all harvest dates much probably refer to barley. However, in1794 it is documented that rye was cultivated at the farm together with barley and oats, andeven potatoes. The possibility that the start of harvesting in some years refer to rye can not beexcluded.
5) Gauldal - Kjellen, 1805 - 1876The farm is situated at the flat banks of the river Gaula 115 m a.s.l. about 50 km to the southof Trondheim. The harvested cereals at the farm are unspecified in the diary but in one case;then it is said to be barley.
6) Oppdal - Vognill, 1834 - 1894The farm (No. 234/1 Uppigard Vognill) is situated at the mountain village near Vognillan 6km in west-north-westerly direction from the Oppdal railway station in the municipalitycentre of the same name. Today the field of the farm is divided by the neighbouring farms andonly the old farmhouse is preserved. The grain field slopes very gently to the south(inclination less than 1 %).
Spring and summer temperatures in Trøndelag, 1701 - 2003
7
The grain harvest is unspecified in the diary, but at Vognill, situated 605 m a.s.l., barley is theonly cereal that can be cultivated.
7) Melhus - Øyrønningen, 1855 – 1918The farm is situated at Melhus, a neighbouring municipality to Trondheim to the south of thecity. It is clearly stated in the diary that the harvesting is started in the field of barley.
2.2 Testing of homogeneity
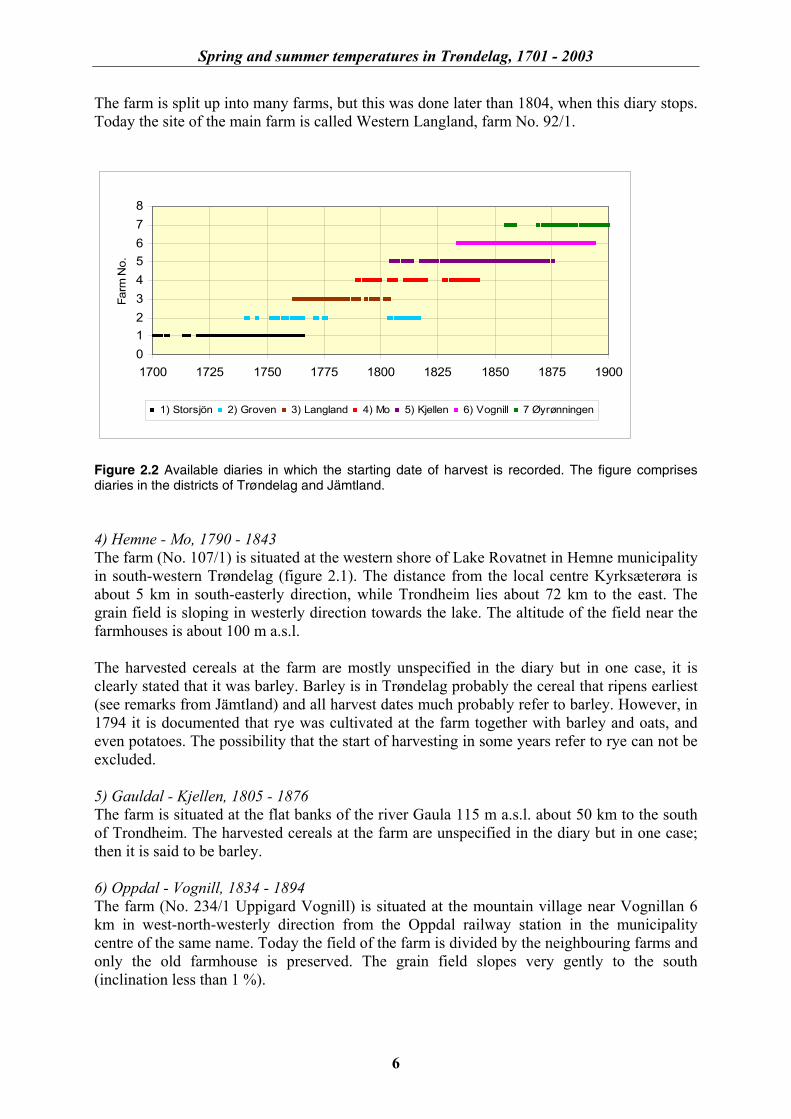
The series of starting dates of the grain harvest were tested for inhomogeneities by thefollowing procedure: For two series having at least 10 years overlapping, a series ofdifferences was established. It is assumed that the series of differences is not auto correlated,and the significance of possible trends can be tested by the non-parametric Mann-Kendall’strend test; see for example Sneyers (1990). It is a rank test, and as such robust for outliers.The testing was performed stepwise by adding one by one year to the series of differences andcalculating the Mann-Kendall test statistics for each step, like in figure 2.3.
Mann-Kendall test
-3
-2
-1
0
1
2
3
1720 1740 1760 1780 1800 1820 1840 1860 1880 1900
Man
n-Ke
ndal
l tes
t sta
tistic
Groven/Storsjön Kjellen/Mo Vognill/Kjellen Øyrønningen/Vognill Level 0.05
Figure 2.3 The time evolution of the Mann-Kendall test statistics for the series of differences. Thetesting is performed by adding one by one year of data to the series and applying the test for eachyear added. The level of significance of 0.05 is marked by the brown straight line.
Storsjön - Groven. There exist 19 overlapping years for Storsjön and Groven and nosignificant trend in the series of differences is detected.
Kjellen – Mo. There exist 24 overlapping years for Kjellen and Mo. The series of differencesshows a significant decrease at the 0.05 level. This means that the latest harvests at Kjellenoccur earlier compared to Mo. A tendency towards earlier harvests at Kjellen, however,during the period 1834 – 1844 is not confirmed when Kjellen is compared with Vognill, seefigure 2.3 for Kjellen – Mo and Vognill – Kjellen. Therefore the inhomogeneity is most likelypresent in the series of Mo.
The series of differences was further examined by the Pettitt test (not shown) that pointed outthe year 1815 as the most likely year for the inhomogeneity. The Mo series was treated asbeing two series, hereafter named Mo 1 (1816 – 1843) and Mo 2 (1790 – 1815). There aremissing years in the series so that Mo 1 consists of 17 years and Mo 2 of only 7 years.
Spring and summer temperatures in Trøndelag, 1701 - 2003
8
Vognill – Kjellen. There exist 38 overlapping observations for Vognill and Kjellen. From thestart of the series and to the last years of the 1840s there are some significant values indicatinga decrease in the differences (i.e. a tendency towards earlier harvests at Vognill comparedwith Kjellen), but this tendency is not confirmed when values for the following years areadded to the series.
Øyrønningen – Vognill. There exist 27 overlapping observations for Øyrønningen andKjellen, and no significant trend in the differences is detected.
The Groven series is the only link between the 18th century and 19th century. The trend of thereconstruction between those centuries has to be based on this data series. It is therefore ofcrucial importance for the reconstruction that the Groven series is homogenous. Withoutoverlapping with other series, it is not possible to have the homogeneity tested during thisperiod. The Groven farm was in the 18th century run by another person than in the 19th
century. The agricultural methods did not change much in this period, and most probably theharvest dates of the early user of the farm are directly comparable to those of the later user, sothat the series is homogenous.
2.3 The instrumental series
Unfortunately a homogenous, long-term instrumental series from Trøndelag does not exist.The regional capital Trondheim has long traditions for meteorological observations, but theclassical Trondheim series (Birkeland 1949) is nested together from many different seriesbrought forward of private persons. However, in 1870 met.no also started meteorologicalobservations in the inner town. Nowadays no observations are made in the centre ofTrondheim.
The classical Trondheim series has been adjusted to be valid for the Trondheim AirportVærnes, 26 km to the east of Trondheim, where observations continue. Although valid forVærnes, the series will in this paper for simplicity also be called the Trondheim (Værnes)series. The series has been homogenised by Nordli (1997c) starting the homogenisation withmet.no’s observations from 1870.
The Trondheim series starts in 1762, but there is a gap from 1803 - 1817 that was interpolatedby Birkeland (1949), using the series from Stockholm and Edinburgh. Since 1818 the series isbased on measurements from several places in the inner town. The observers of the principalseries were: Vibe (1818-34, before 1828 only one observation a day), Møllerup (1835-51),Balsløw (1852-54), Rosenvinge (18551-69). According to Birkeland (1949) Rosenvinge’sobservations "convey a very reliable impression" and the Rosenvinge/DNMI series (18581-1875) has been used for the establishing of a regression with the Kjellen proxy series (Nordli2001a). In the next chapter the possibility of using the Rosenvinge’s observation forregression analysis will be discussed.
1 There has been some doubt about what Birkeland used as the principal series in 1855-57. Therefore these years wereomitted as a basis for the regression.

Spring and summer temperatures in Trøndelag, 1701 - 2003
9
3 Method for climate reconstructions
It has been shown that there is a good correlation between spring-summer temperature and thefirst day of grain harvest at sites near to the instrumental series. If there exist an overlappingperiod between the two data types, linear regression analysis may be used to derive spring-summer temperature by the harvest data (Nordli 2001a). Furthermore, if the harvest data startsearlier than the modern instrumental series, the harvest data might be used to reconstruct theseries beyond the modern instrumental period. In Norway the modern instrumental periodstarts in the 1860s so diaries from earlier decades might be used for temperaturereconstruction, see the introduction.
As dependant variable in the regressions the mean spring-summer temperature for the periodthat gave the best correlation was used. In the Trøndelag, Møre and Dovre mountain areas,this was the period May – August, whereas in Austlandet and Vestlandet the period was April– August. The most common cereals were barley and oats, but at Austlandet rye was alsocultivated. In the Dovre mountain area only barley was cultivated because of too shortgrowing seasons for the other cereals.
As an example of regression analysis is shown (figure 3.1) of the Trondheim (Værnes)instrumental series (predictand) and the Kjellen farm (predictor). This regression analysis wasused for the control of the old Trondheim (Værnes) series, quoted from Nordli (2001a). Thecorrelation coefficient is -0.87 between the variables.
First day of harvest at Kjellen (Day No.)
270260250240230220210
Mea
n te
mpe
ratu
re (M
ay -
Aug.
) at V
ærn
es (
C) 14
13
12
11
10
9
Figure 3.1 A spread diagram for spring/summer temperature (May – August) for the Trondheim(Værnes) series and the first day of harvest at the farm Kjellen during the period 1858 - 1876. R is theregression correlation.
Generally the regression equations take the form
TDT ∆+=α(
(3.1)
where Ť is the predicted temperature, D is the first day of grain harvest (day No.) and α and∆T are constants. The regression coefficient, α, will hereafter be called the temperatureresponse factor and ∆T the temperature level. The response factor for harvest data series inTrøndelag and neighbouring districts is shown in table 3.1.
R=0.87
Spring and summer temperatures in Trøndelag, 1701 - 2003
10
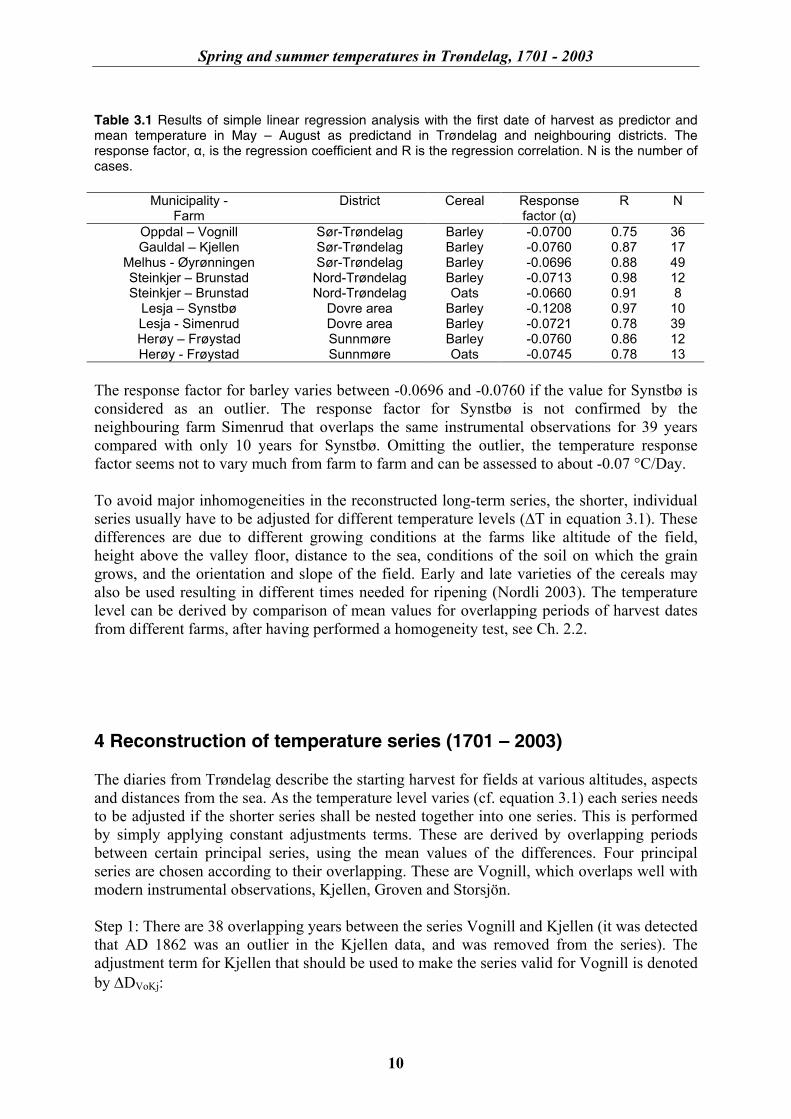
Table 3.1 Results of simple linear regression analysis with the first date of harvest as predictor andmean temperature in May – August as predictand in Trøndelag and neighbouring districts. Theresponse factor, α, is the regression coefficient and R is the regression correlation. N is the number ofcases.
Municipality -Farm
District Cereal Responsefactor (α)
R N
Oppdal – Vognill Sør-Trøndelag Barley -0.0700 0.75 36Gauldal – Kjellen Sør-Trøndelag Barley -0.0760 0.87 17
Melhus - Øyrønningen Sør-Trøndelag Barley -0.0696 0.88 49Steinkjer – Brunstad Nord-Trøndelag Barley -0.0713 0.98 12Steinkjer – Brunstad Nord-Trøndelag Oats -0.0660 0.91 8
Lesja – Synstbø Dovre area Barley -0.1208 0.97 10Lesja - Simenrud Dovre area Barley -0.0721 0.78 39Herøy – Frøystad Sunnmøre Barley -0.0760 0.86 12Herøy - Frøystad Sunnmøre Oats -0.0745 0.78 13
The response factor for barley varies between -0.0696 and -0.0760 if the value for Synstbø isconsidered as an outlier. The response factor for Synstbø is not confirmed by theneighbouring farm Simenrud that overlaps the same instrumental observations for 39 yearscompared with only 10 years for Synstbø. Omitting the outlier, the temperature responsefactor seems not to vary much from farm to farm and can be assessed to about -0.07 °C/Day.
To avoid major inhomogeneities in the reconstructed long-term series, the shorter, individualseries usually have to be adjusted for different temperature levels (∆T in equation 3.1). Thesedifferences are due to different growing conditions at the farms like altitude of the field,height above the valley floor, distance to the sea, conditions of the soil on which the graingrows, and the orientation and slope of the field. Early and late varieties of the cereals mayalso be used resulting in different times needed for ripening (Nordli 2003). The temperaturelevel can be derived by comparison of mean values for overlapping periods of harvest datesfrom different farms, after having performed a homogeneity test, see Ch. 2.2.
4 Reconstruction of temperature series (1701 – 2003)
The diaries from Trøndelag describe the starting harvest for fields at various altitudes, aspectsand distances from the sea. As the temperature level varies (cf. equation 3.1) each series needsto be adjusted if the shorter series shall be nested together into one series. This is performedby simply applying constant adjustments terms. These are derived by overlapping periodsbetween certain principal series, using the mean values of the differences. Four principalseries are chosen according to their overlapping. These are Vognill, which overlaps well withmodern instrumental observations, Kjellen, Groven and Storsjön.
Step 1: There are 38 overlapping years between the series Vognill and Kjellen (it was detectedthat AD 1862 was an outlier in the Kjellen data, and was removed from the series). Theadjustment term for Kjellen that should be used to make the series valid for Vognill is denotedby ∆DVoKj:
Spring and summer temperatures in Trøndelag, 1701 - 2003
11
KjellenVognillVoKj DDD −=∆ , VoKjKjellenVognill DDD ∆+= (4.1)
where DVognill and DKjellen are the mean start of the grain harvest during their commonoverlapping period. The adjustment turns out to be -5.4 days (table 4.1) and a homogenousseries can be established back to AD 1805, the starting year of the Kjellen series.
Step 2: The Kjellen series has 6 overlapping years with the Groven series and 7 years with theMo2 series, similarly as equation (4.1) the adjustment terms can be written:
22 MoKjellenKjMo DDD −=∆ 22 KjMoMoKjellen DDD ∆+= (4.2a)
GrovenKjellenKjGr DDD −=∆ KjGrGrovenKjellen DDD ∆+= (4.2b)
By inserting (4.2a) and (4.2b) in (4.1) also the series from Groven and Mo2 can be adjusted tobe valid for Vognill:
VoKjKjMoMoVognill DDDD ∆+∆+= 22 (4.3a)
VoKjKjGrGrovenVognill DDDD ∆+∆+= (4.3b)
The adjustment terms are given in table 4.1. By using (4.3b) the series of harvest dates can bereconstructed back to 1733, whereas many gaps in the Groven series are filled by data fromMo using (4.3a) during the period 1790 to 1800. Only in AD 1804 both Mo and Groven haddata.
Step 3: Data from Groven overlaps the Storsjön series from Jämtland by 19 years.
StorsjøenGrovenGrSt DDD −=∆ GrStStorsjøenGroven DDD ∆+= (4.4)
By inserting (4.4) in (4.3b) the data for Storsjön are adjusted to be valid for Vognill:
VoKjKjGrGrStStorsjönVognill DDDDD ∆+∆+∆+= (4.5)
The harvest dates for Storsjön have to be adjusted by -1.6 day to be valid for Groven (Table4.1), and the total adjustment for Storsjön to be valid for Vognill is -8.8 days.
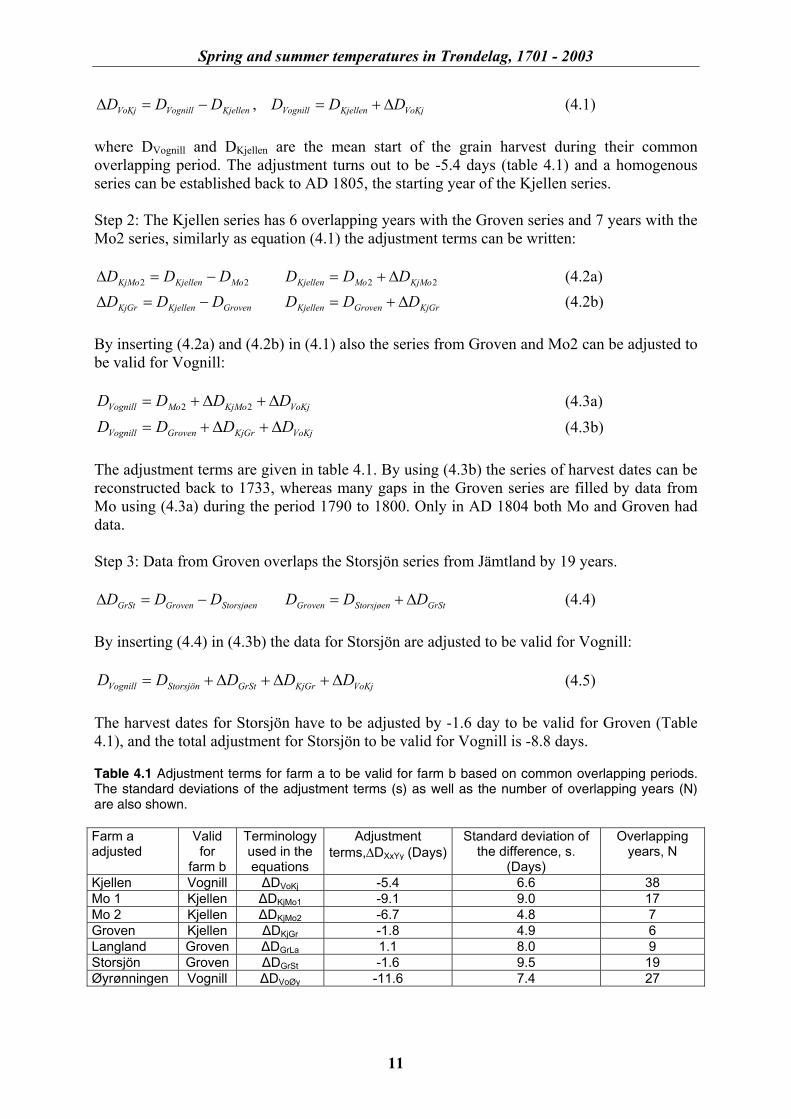
Table 4.1 Adjustment terms for farm a to be valid for farm b based on common overlapping periods.The standard deviations of the adjustment terms (s) as well as the number of overlapping years (N)are also shown.
Farm aadjusted
Validfor
farm b
Terminologyused in theequations
Adjustmentterms,∆DXxYy (Days)
Standard deviation ofthe difference, s.
(Days)
Overlappingyears, N
Kjellen Vognill ∆DVoKj -5.4 6.6 38Mo 1 Kjellen ∆DKjMo1 -9.1 9.0 17Mo 2 Kjellen ∆DKjMo2 -6.7 4.8 7Groven Kjellen ∆DKjGr -1.8 4.9 6Langland Groven ∆DGrLa 1.1 8.0 9Storsjön Groven ∆DGrSt -1.6 9.5 19Øyrønningen Vognill ∆DVoØy -11.6 7.4 27
Spring and summer temperatures in Trøndelag, 1701 - 2003
12
Step 4:During the years 1816 – 1817 and the years 1767 – 1770 none of the principle series havedata, but these gaps may be interpolated by the series Mo1 and Langland respectively by theequations (4.7) and (4.9).
11 MiKjellenKjMo DDD −=∆ 11 KjMoMoKjellen DDD ∆+= (4.6)
VoKjKjMoMoVognill DDDD ∆+∆+= 11 (4.7)
LangelandGrovenGrLa DDD −=∆ GrLaLangelandGroven DDD ∆+= (4.8)
VoKjKjGrGrLaLangelandVognill DDDDD ∆+∆+∆+= (4.9)
The adjustments for the series from Mo1 and Langland to make them valid for Groven andKjellen are -9.1 days and +1.1 days respectively (table 4.1). To be valid for Vognill the Mo1series has to be adjusted -14.5 days (equation 4.7), and Langland has to be adjusted -6.1 days(equation 4.9).
By using the adjustment terms above a composite series of homogenised first day of harvestdates is established back to 1701 with only a few missing years. When there are more thanone data source for the same year, the priority among the farms are: 1) Vognill 2) Kjellen 3)Groven 4) Mo1 5) Storsjön 6) Mo2 7) Langeland. The farm Øyrønningen was not used.
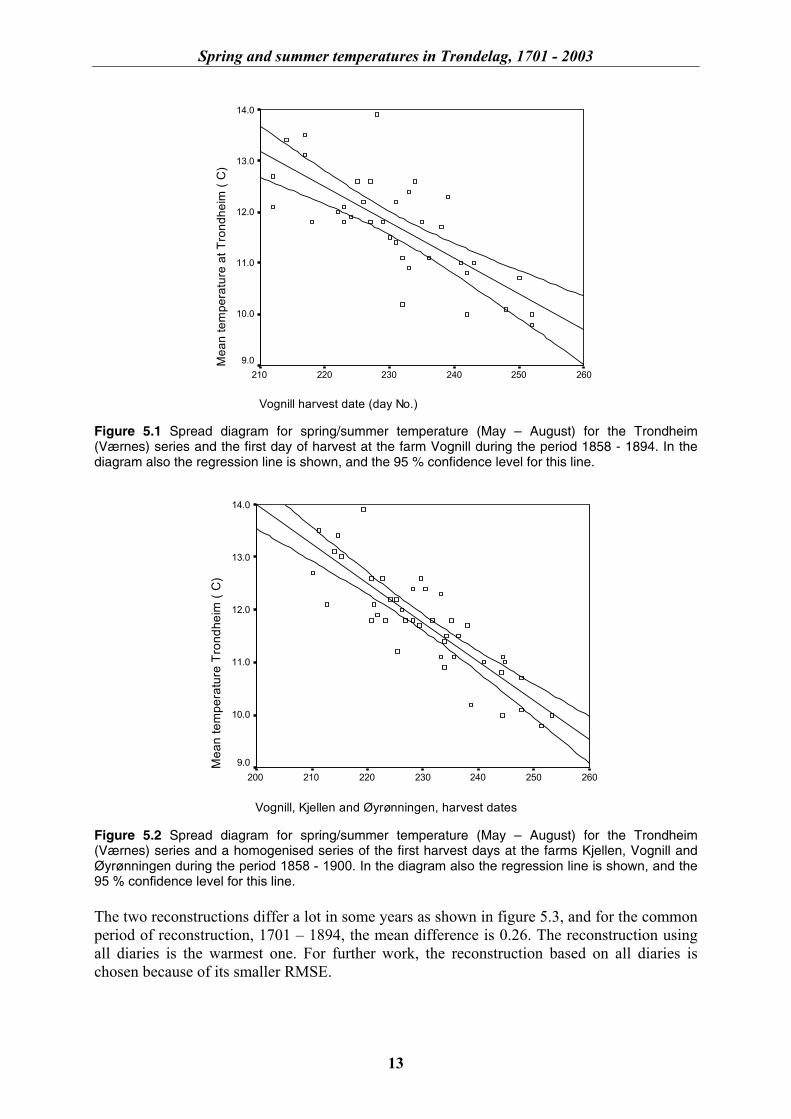
The farm Vognill has 24 overlapping years with modern instrumental observations inTrondheim in the period 1870 – 1894. However, Rosenvinge’s observations starting in 1858have shown to be much reliable and have been used also in earlier works (Nordli 2001a). Byadding them to observations carried out by the Meteorological Institute, the overlappingbetween instrumental and proxy data consists of 36 years in the period 1858 – 1894. Thespread diagram and regression line is shown in figure 5.1. The regression correlation was 0.75and the RMSE was 0.71 °C derived by “leaving one out” cross-validation. The temperatureresponse factor was -0.070 ±0.011.
Alternatively there is also a possibility to use all available data for the reconstruction. Afterhaving adjusted all series to be valid for Vognill, the mean value of all adjusted harvest datesis used to establish a series of homogenised harvest dates. In this case also Øyrønningen isused and the overlapping with the Trondheim (Værnes) series comprises 42 years during theperiod 1858 – 1900. The harvest dates used in the regression originate from the farms Kjellen,Vognill and Øyrønningen (figure 5.2). At about AD 1900 research on the cereals was startedthat might have changed the times of ripening of the cereals in use (Nordli 2003). Laterharvest dates than AD 1900 are therefore omitted from the regression analysis.
By using all harvest dates the regression correlation increased from 0.75 when Vognill wasused as the only farm, to 0.86 when all available data were used. The main reason is notdifferent overlapping intervals (not shown), but the fact that Kjellen and Øyrønningencorrelate better with Trondheim than Vognill. This should also be expected according to thedistance to the city, and also according to the topographical position of Vognill. Vognill liesin the Oppdal mountain valley, while Kjellen and Øyrønningen are both situated at loweraltitudes than Vognill. The RMSE of the residuals was 0.52 °C derived by leaving one outcross-validation, which is appreciably less than when only Vognill was used. The temperatureresponse factor was -0.074 ±0.007 (p = 0.05).
Spring and summer temperatures in Trøndelag, 1701 - 2003
13
Vognill harvest date (day No.)
260250240230220210
Mea
n te
mpe
ratu
re a
t Tro
ndhe
im (
C)
14.0
13.0
12.0
11.0
10.0
9.0
Figure 5.1 Spread diagram for spring/summer temperature (May – August) for the Trondheim(Værnes) series and the first day of harvest at the farm Vognill during the period 1858 - 1894. In thediagram also the regression line is shown, and the 95 % confidence level for this line.
Vognill, Kjellen and Øyrønningen, harvest dates
260250240230220210200
Mea
n te
mpe
ratu
re T
rond
heim
( C
)
14.0
13.0
12.0
11.0
10.0
9.0
Figure 5.2 Spread diagram for spring/summer temperature (May – August) for the Trondheim(Værnes) series and a homogenised series of the first harvest days at the farms Kjellen, Vognill andØyrønningen during the period 1858 - 1900. In the diagram also the regression line is shown, and the95 % confidence level for this line.
The two reconstructions differ a lot in some years as shown in figure 5.3, and for the commonperiod of reconstruction, 1701 – 1894, the mean difference is 0.26. The reconstruction usingall diaries is the warmest one. For further work, the reconstruction based on all diaries ischosen because of its smaller RMSE.

Spring and summer temperatures in Trøndelag, 1701 - 2003
14
9.0
10.0
11.0
12.0
13.0
14.0
15.0
1700 1720 1740 1760 1780 1800 1820 1840 1860
Tem
pera
ture
( C
)
Reconstruction II Trondheim Reconstruction I Trondheim
Figure 5.3 Reconstruction of Trondheim temperature series. Reconstruction II: Based on all availablegrain harvest data each year. Reconstruction I: based on one series each year, see text.
After having used all available diaries, there are still some missing years:1705, 1708 – 1713, 1717 – 1719. Before 1722 neither instrumental observations noradditional farmers’ diaries exist in Scandinavia, and these 10 missing years are notinterpolated. The other missing years are interpolated by instrumental data, using only alimited number of years on each side of the missing value, not letting the interpolated valuesinfluence the long-term trends of the proxy series.
1727: Interpolation by Uppsala, 1722 – 17371761: Interpolation by Uppsala, 1751 - 17711787, 1792, and 1801: Interpolations by Fester’s series at Trondheim, 1780 - 18021826: Interpolations by Vibe’s first series at Trondheim, 1818 - 1827
By inserting the six interpolated values, the series is complete since AD 1720. In the period1701 – 1719 half of the values are missing. The reconstruction indicates high temperatures forthis period, but the lacking years should be kept in mind. If the lacking years are colder thanthose present the series is biased too warm. According to the reconstruction the warmestsummer has occurred very recently, AD 2002. This summer can now be seen in the context ofthe 293 previous summers. It is remarkably warm, being 0.9 °C warmer than the secondwarmest (1937). The next ones on the list of warm summers are those in 1703 and 1930. Thefirst one is based on proxy data and its estimate is less reliable than those based oninstrumental observations.
The coldest summers seem to be those in 1864 and 1923, but some reconstructed summertemperatures are very near to be as cold as the two mentioned, and taking the errors of thereconstruction into account, they might in reality be colder.
Looking at decadal variations (red curve in figure 5.4), warm spells occur in the end of theseries and in the 1930s, and maybe also at the beginning of the series. Cold spells are presentparticularly in the early 1740s and in the 1860s. These periods are well known to historiansalso as years of famine (Pontoppidan 1752; Jantunen and Rostenoja 2000). During the earlyyears of the Dalton solar spots minimum (1795 – 1830) the Trøndelag temperatures were verylow, but within this period there was also a local maximum, around 1815. The eight yearsfrom the late Maunder minimum period (1675 – 1715) represented in the reconstruction wasalso warm.
Spring and summer temperatures in Trøndelag, 1701 - 2003
15
9
10
11
12
13
14
15
16
1700 1725 1750 1775 1800 1825 1850 1875 1900 1925 1950 1975 2000 2025
Tem
pera
ture
(deg
)
Values Filt.3 Filt.9
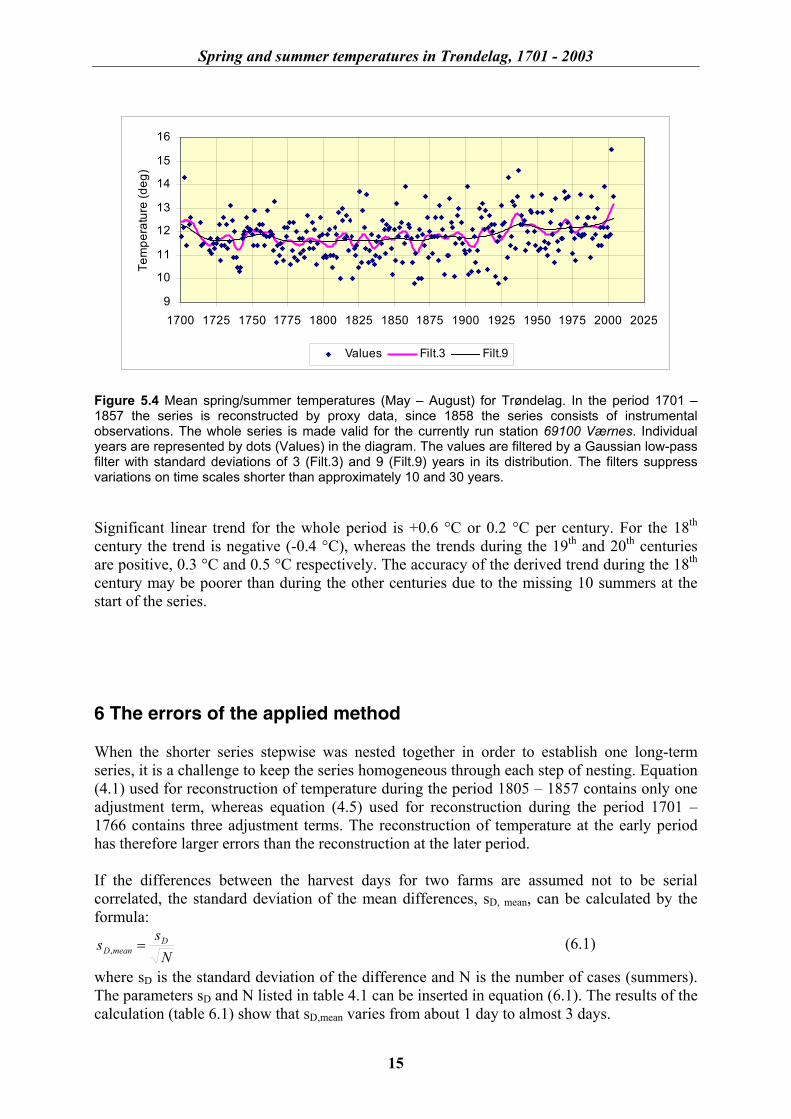
Figure 5.4 Mean spring/summer temperatures (May – August) for Trøndelag. In the period 1701 –1857 the series is reconstructed by proxy data, since 1858 the series consists of instrumentalobservations. The whole series is made valid for the currently run station 69100 Værnes. Individualyears are represented by dots (Values) in the diagram. The values are filtered by a Gaussian low-passfilter with standard deviations of 3 (Filt.3) and 9 (Filt.9) years in its distribution. The filters suppressvariations on time scales shorter than approximately 10 and 30 years.
Significant linear trend for the whole period is +0.6 °C or 0.2 °C per century. For the 18th
century the trend is negative (-0.4 °C), whereas the trends during the 19th and 20th centuriesare positive, 0.3 °C and 0.5 °C respectively. The accuracy of the derived trend during the 18th
century may be poorer than during the other centuries due to the missing 10 summers at thestart of the series.
6 The errors of the applied method
When the shorter series stepwise was nested together in order to establish one long-termseries, it is a challenge to keep the series homogeneous through each step of nesting. Equation(4.1) used for reconstruction of temperature during the period 1805 – 1857 contains only oneadjustment term, whereas equation (4.5) used for reconstruction during the period 1701 –1766 contains three adjustment terms. The reconstruction of temperature at the early periodhas therefore larger errors than the reconstruction at the later period.
If the differences between the harvest days for two farms are assumed not to be serialcorrelated, the standard deviation of the mean differences, sD, mean, can be calculated by theformula:
Nss D
meanD =, (6.1)
where sD is the standard deviation of the difference and N is the number of cases (summers).The parameters sD and N listed in table 4.1 can be inserted in equation (6.1). The results of thecalculation (table 6.1) show that sD,mean varies from about 1 day to almost 3 days.
Spring and summer temperatures in Trøndelag, 1701 - 2003
16
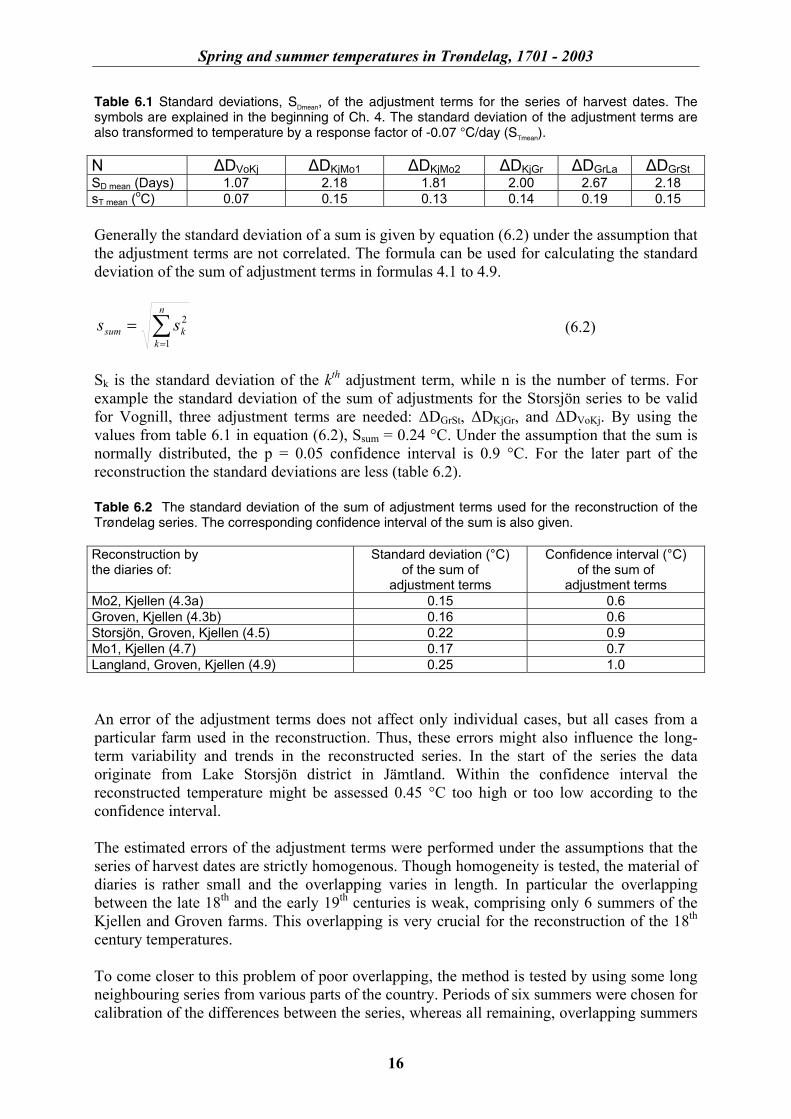
Table 6.1 Standard deviations, SDmean, of the adjustment terms for the series of harvest dates. Thesymbols are explained in the beginning of Ch. 4. The standard deviation of the adjustment terms arealso transformed to temperature by a response factor of -0.07 °C/day (STmean).
N ∆DVoKj ∆DKjMo1 ∆DKjMo2 ∆DKjGr ∆DGrLa ∆DGrStSD mean (Days) 1.07 2.18 1.81 2.00 2.67 2.18sT mean (oC) 0.07 0.15 0.13 0.14 0.19 0.15
Generally the standard deviation of a sum is given by equation (6.2) under the assumption thatthe adjustment terms are not correlated. The formula can be used for calculating the standarddeviation of the sum of adjustment terms in formulas 4.1 to 4.9.
∑=
=n
kksum ss
1
2 (6.2)
Sk is the standard deviation of the kth adjustment term, while n is the number of terms. Forexample the standard deviation of the sum of adjustments for the Storsjön series to be validfor Vognill, three adjustment terms are needed: ∆DGrSt, ∆DKjGr, and ∆DVoKj. By using thevalues from table 6.1 in equation (6.2), Ssum = 0.24 °C. Under the assumption that the sum isnormally distributed, the p = 0.05 confidence interval is 0.9 °C. For the later part of thereconstruction the standard deviations are less (table 6.2).
Table 6.2 The standard deviation of the sum of adjustment terms used for the reconstruction of theTrøndelag series. The corresponding confidence interval of the sum is also given.
An error of the adjustment terms does not affect only individual cases, but all cases from aparticular farm used in the reconstruction. Thus, these errors might also influence the long-term variability and trends in the reconstructed series. In the start of the series the dataoriginate from Lake Storsjön district in Jämtland. Within the confidence interval thereconstructed temperature might be assessed 0.45 °C too high or too low according to theconfidence interval.
The estimated errors of the adjustment terms were performed under the assumptions that theseries of harvest dates are strictly homogenous. Though homogeneity is tested, the material ofdiaries is rather small and the overlapping varies in length. In particular the overlappingbetween the late 18th and the early 19th centuries is weak, comprising only 6 summers of theKjellen and Groven farms. This overlapping is very crucial for the reconstruction of the 18th
century temperatures.
To come closer to this problem of poor overlapping, the method is tested by using some longneighbouring series from various parts of the country. Periods of six summers were chosen forcalibration of the differences between the series, whereas all remaining, overlapping summers
Reconstruction bythe diaries of:
Standard deviation (°C)of the sum of
adjustment terms
Confidence interval (°C)of the sum of
adjustment termsMo2, Kjellen (4.3a) 0.15 0.6Groven, Kjellen (4.3b) 0.16 0.6Storsjön, Groven, Kjellen (4.5) 0.22 0.9Mo1, Kjellen (4.7) 0.17 0.7Langland, Groven, Kjellen (4.9) 0.25 1.0

Spring and summer temperatures in Trøndelag, 1701 - 2003
17
were chosen as validation periods. For example the harvest dates from Vognill andØyrønningen overlap during the period 1855 – 1894 by 27 summers. Among these 27differences it is possible to select 4 periods of 6 consecutive summers, and derive 4adjustment terms. The validation is performed on the remaining 21 summers. The positive,mean difference between observed and calculated harvest data is called the bias of themethod. Altogether 44 calibration periods of 6 summers were available for testing.
The biases are shown in the histogram (figure 6.1). The mean bias is 2.5 days and the standarddeviation is 2 days. This is quite acceptable as 2.5 days transformed into May – Augusttemperature gives a bias of about 0.2 °C. It is, however, 3 cases (7 %) with biases of 0.5 °C ormore, and if errors of this magnitude are present in the reconstruction, the real long-termtemperature trend of the series will be jeopardized by the artificial trend. The largest bias (9.5days or about 0.7 °C) is present when the harvest dates from Kjellen and Synstbø arecompared, with the summers 1820 – 1825 as the calibration period. The distance betweenKjellen and Synstbø is less than 150 km but the two farms are situated in different climateregimes, Dovre mountain areas and Trøndelag respectively. Real climate differences might bethe reason for this large bias, which means that for this particular pair of farms the methodshould not be applied.
Bias of the adjustments of harvest dates (Days)
10.09.08.07.06.05.04.03.02.01.00.0
Num
ber o
f cas
es
12
10
8
6
4
2
0
Figure 6.1 Biases of the adjustment terms based on overlapping periods of 6 summers. Furtherexplanations are to be found in the text.
7 Discussion
The composite spring-summer temperature series of Trøndelag (proxy data 1701 – 1857,instrumental data 1858 – 2003) might be compared to the composite series of Vestlandet(proxy data 1734 – 1867, instrumental data 1868 – 2003) published by Nordli et al (2003).The Trøndelag series shows increased temperature during the data period, which comprises allyears but 10 since AD 1701. But during the first century of the reconstruction (1701 – 1800),the temperature has decreased. Similar qualitative results can be seen for the Vestlandet
Spring and summer temperatures in Trøndelag, 1701 - 2003
18
series, which is based on diaries and historical, frontal glacial moraines, but this series is notavailable further back than AD 1734.
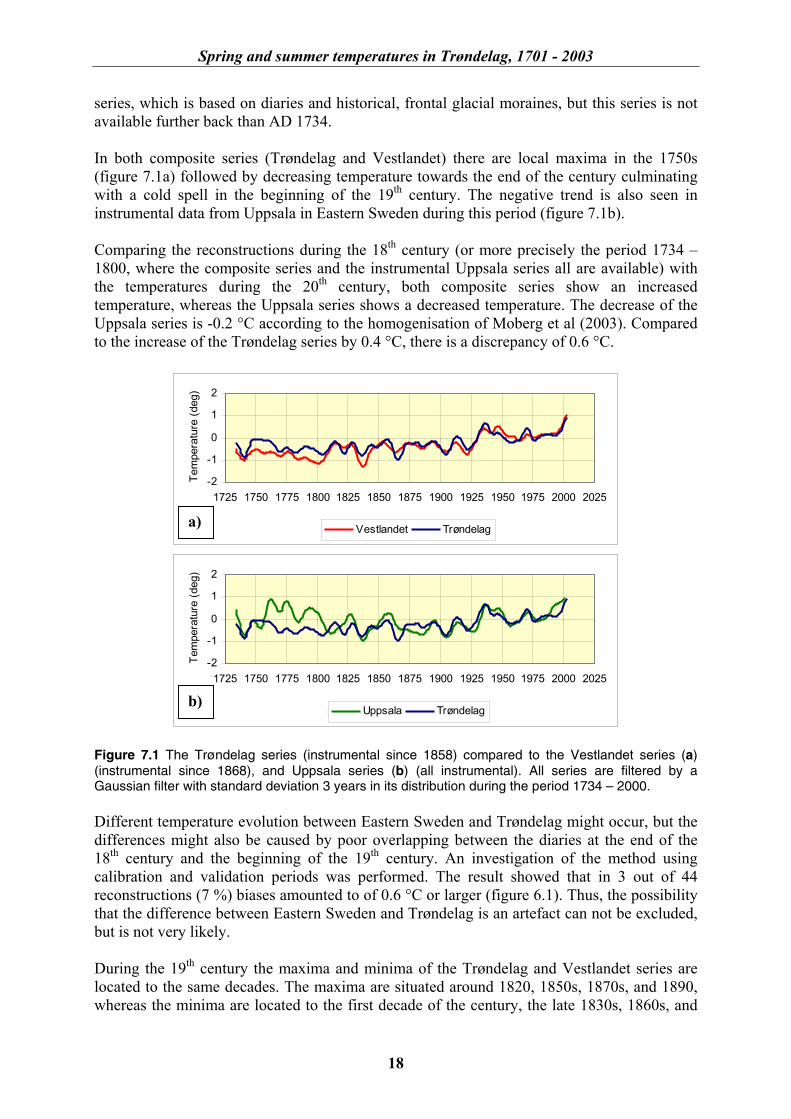
In both composite series (Trøndelag and Vestlandet) there are local maxima in the 1750s(figure 7.1a) followed by decreasing temperature towards the end of the century culminatingwith a cold spell in the beginning of the 19th century. The negative trend is also seen ininstrumental data from Uppsala in Eastern Sweden during this period (figure 7.1b).
Comparing the reconstructions during the 18th century (or more precisely the period 1734 –1800, where the composite series and the instrumental Uppsala series all are available) withthe temperatures during the 20th century, both composite series show an increasedtemperature, whereas the Uppsala series shows a decreased temperature. The decrease of theUppsala series is -0.2 °C according to the homogenisation of Moberg et al (2003). Comparedto the increase of the Trøndelag series by 0.4 °C, there is a discrepancy of 0.6 °C.
-2
-1
0
1
2
1725 1750 1775 1800 1825 1850 1875 1900 1925 1950 1975 2000 2025
Tem
pera
ture
(deg
)
Vestlandet Trøndelag
-2
-1
0
1
2
1725 1750 1775 1800 1825 1850 1875 1900 1925 1950 1975 2000 2025
Tem
pera
ture
(deg
)
Uppsala Trøndelag
Figure 7.1 The Trøndelag series (instrumental since 1858) compared to the Vestlandet series (a)(instrumental since 1868), and Uppsala series (b) (all instrumental). All series are filtered by aGaussian filter with standard deviation 3 years in its distribution during the period 1734 – 2000.
Different temperature evolution between Eastern Sweden and Trøndelag might occur, but thedifferences might also be caused by poor overlapping between the diaries at the end of the18th century and the beginning of the 19th century. An investigation of the method usingcalibration and validation periods was performed. The result showed that in 3 out of 44reconstructions (7 %) biases amounted to of 0.6 °C or larger (figure 6.1). Thus, the possibilitythat the difference between Eastern Sweden and Trøndelag is an artefact can not be excluded,but is not very likely.
During the 19th century the maxima and minima of the Trøndelag and Vestlandet series arelocated to the same decades. The maxima are situated around 1820, 1850s, 1870s, and 1890,whereas the minima are located to the first decade of the century, the late 1830s, 1860s, and
b)
a)

Spring and summer temperatures in Trøndelag, 1701 - 2003
19
1880s. This correspondence, which previously only has been studied during the moderninstrumental period, is also seen in the period of reconstruction, and seems to be stationary.However, the 1860s seem to have been much more severe in Trøndelag than in westernNorway, whereas the late 1830s seem to have been less severe.
There exists also a tree ring series from the Femunden area, south eastern Trøndelagestablished by Brundin (1999). As the trees in the investigation were taken near the tree limit,their growth is strongly temperature dependant. Comparing the tree ring series to theTrøndelag series one should have in mind that the tree rings reflect July or perhaps alsoAugust temperatures only, whereas the Trøndelag series comprises the May – August period.However, the tree ring curve shows much of the same temporal variations as the grain harvestcurve, with cold spells in the 1740s, first decade of 1800, and in the late 1830s. The cold spellof the 1860s is less pronounced in the tree ring data than in the harvest data.
The extraordinary warm summer of AD 1703 is confirmed also by the tree ring data, but nolocal maximum is seen in the filtered three ring curve during the first decade of the 18th
century. The maximum of the Trøndelag series during those years might therefore be anartefact due to many missing harvest data. However, a maximum of the 1730s of theTrøndelag series is present also in the tree ring curve.
The Little Ice Age (LIA) was introduced as a period of far advanced glaciers compared withnowadays and earlier positions (Grove 1988). Temperature has been variable during theperiod, but mainly lower than at present (Jones and Bradley 1992). The Trøndelag series startswithin the LIA, and shows mainly low temperatures during the 18th and 19th centuries andalso in the first two decades of the 20th century. Thus, the LIA seems to be terminated in the1920s by the so called “early 20th century warming”. Exactly when the LIA ends has beendisputed, but ending in the 1920s is rather late compared to the most common use of the term,i.e. AD 1800 - 1850 (Ogilvie and Jónsson 2001).
8 Conclusions
By use of a linear model, spring-summer temperature could be reconstructed for Jämtland andTrøndelag back to AD 1701, and the reconstruction was fitted together with the instrumentalTrondheim (Værnes) series. The composite series was called the Trøndelag series due to theorigin of the diaries from many sites mostly in Trøndelag. During the 19th century the methodgave an RMSE error of 0.5 °C for the reconstructed, individual summers by “leaving one outcross-validation”.
A significant, linear trend of the whole series was estimated to +0.6 °C (+0.2 °C per century).However, long-term trend estimation is hampered by poor overlapping between individualharvest series in between the 18th and the 19th centuries. A study of the method using allavailable diaries was performed. Errors of 0.5 °C or larger occurred in 3 out of 44 cases.Thus, there is a risk that this kind of errors can bias the long-term inter-centennial trendsinvolving the 18th century.

Spring and summer temperatures in Trøndelag, 1701 - 2003
20
The trends within individual centuries differ much from each others. During the 18th centurythe trend was negative (-0.4 °C), whereas the trends were positive during the 19th and 20th
century, +0.3 °C and +0.5 °C respectively.
By using a Gaussian, decadal, low pass filter the Trøndelag series and an earlier derivedVestlandet series were compared. The maxima and minima in the two series were located inthe same decades. Historically severe climatic decades described in narrative sources like theearly 1740s, the first decade of the 19th century, the late 1830s, and the 1860s, also show lowtemperatures in the reconstructed series. The 1860s seem to have been much more severe inTrøndelag than in western Norway whereas the late 1830s seem to have been less severe.
Even if errors of the temperature reconstruction are taken into account, it might be concludedthat the summer AD 2002 is the warmest ever since the start of the series 300 years ago.
References
Birkeland, B.J. 1949: Old meteorological observations at Trondheim. Atmospheric Pressureand Temperature. Geofysiske Publikasjoner, XV, 38 pp.
Brundin, M. 1999: Climate information from tree-rings of Pinus sylvestris L. and areconstruction of summer temperatures back to AD 1500 in Femundsmarka, easternNorway, using partial least squares regression (PLS) analysis. Holocene, 9, No. 1, 59 -77.
Hanssen-Bauer, I, P.Ø. Nordli. 1998: Annual and seasonal temperature variations in Norway1876 – 1997. DNMI-report, 25/98, 29 pp.
Grove, J.M. 1988: The Little Ice Age. Routedge, London and New York.Jantunen, J. and Ruosteenoja, K. 2000: Weather Conditions in Northern Europe in the
Exceptionally Cold Spring Season of the Famine Year 1867. Geophysica, 36, (1-2), 69– 84.
Jones, P.D., Bradley R.S. 1992: Climatic variations over the last 500 years. In: Climate sinceA.D. 1500. Bradley R.S. and Jones P.D. (eds.): Climate since AD 1500, 649 – 665.Routledge, London.
Le Roy Ladurie, E and M. Baulant, 1980: Grape Harvests from the Fifteenth trough theNineteenth Centuries. Journal of Interdisciplinary History, 10, 839 - 849.
Moberg, A. 1996: Temperature variations in Sweden since the 18th century. Dissertation No.5, the Department of Physical Geography, Stockholm University.
Moberg A., H. Alexandersson, H. Bergström and P.D. Jones. 2003: Were the southernSwidish summer temperatures before 1860 as warm as measured? InternationalJournal of Climatology, 23, 1495 – 1521.
Nordli, P.Ø. 1997a: The Kjøremsgrendi series. A composite series of summer temperatures(1813 - 1997). DNMI-report, 27/97klima, 22 pp.
Nordli, P.Ø. 1997b: The Ålesund series. A composite series of summer temperatures (1843-1903). DNMI-report, 26/97klima, 9 pp.
Nordli, P.Ø. 1997c: Adjustments of Norwegian monthly means of daily minimumtemperature. DNMI-report, No. 06/97klima, 24 pp.
Nordli, P.Ø. 2001a: Reconstruction of Nineteenth Century summer temperatures in Norwayby proxy data from farmers' diaries. Climatic Change, 48, 201 – 218.
Spring and summer temperatures in Trøndelag, 1701 - 2003
21
Nordli, P.Ø. 2001b: Spring and summer temperatures in south eastern Norway (1749 – 2000),DNMI-report, No. 01/01klima, 32 pp.
Nordli, P.Ø. 2003: Methods of climate reconstruction by grain harvest data. Pages 63-68 In:Dealing with Diversity. 2nd International Conference of the European Society forEnvironmental History (ESEH). Charles University Prague 2003, Procedings, 355 pp.
Nordli, P.Ø., Ø. Lie, A. Nesje, S.O. Dahl. 2003: Spring-Summer Temperature Reconstructionin western Norway 1734 – 2003: a data-synthesis approach. International Journal ofClimatology, 23, 1821-1841.
Ogilvie, A. and T. Jónsson: "Little Ice Age" Research: A Perspective from Iceland. ClimateChange, 48, 219 – 241.
Pontoppidan. E. 1752: Norges naturlige historie (in Danish). The natural history of Norway.1. Copenhagen.
Sneyers, R. 1990: On statistical analysis of series of observation. WMO. Technical note No.143, WMO No. 415, Geneva, Switzerland, 192 pp.
Tarand A., Kuiv P. 1994: The beginning of the rye harvest - a proxy indicator of summerclimate in the Baltic Area. Paleoclimatic Research. 13 (Special issue ESF project«European Palaeoclimate and man» 8 1994.), 61-72.
Tarand A., Nordli P.Ø. 2001: The Tallinn temperature series reconstructed back half amillennium by use of proxy data. Climatic Change, 48, 189 – 199.
von Stockenström, E. 1767: Meteorologiska och Oeconomiska Anmärkningar gjorde iJämtland.(in Swedish): Meteorological and Oeconomical Notes from Jämtland).Kongl. Vetenskapsacademiens Handlingar, 11 pp.
Related Documents