Spring 2016 – Alaska Salmon Industry Analysis Salmon market conditions have been tumultuous in recent years, leading to questions about why Alaska salmon prices have dipped so low. This bulletin addresses this issue by examining the following: • Decline in Value of Alaska Salmon • Ex-Vessel and First Wholesale Cash Flow Analyses • Composition of Alaska’s Salmon Industry (Species, Products, and Markets) • Historical First Wholesale and Ex-Vessel Pricing Trends • ASMI’s Role in Supporting Alaska Salmon Values Alaska Salmon Market Outlook There are several reasons to be cautiously optimistic that prices for most key products/species will at least stabilize and likely rise somewhat in both ex-vessel and wholesale markets. However, even if prices do increase somewhat, the smaller expected harvest in 2016 will probably result in a lower overall resource value. Based on current market conditions and harvest expectations, it appears probable that prices will begin improving in 2016 and there is an excellent chance total ex-vessel value will rebound in 2017 with a normal odd-year harvest volume. So long as there are no other substantial external shocks (e.g. a further strengthening of the U.S. dollar, etc.), the industry will likely recover from the recent downturn much faster than the crisis experienced in the early 2000s. Readers interested in future prospects for Alaska’s salmon market are also encouraged to read other salmon bulletins in this series dealing with harvest projections and salmon market news. Decline in Value of Alaska Salmon Ex-vessel value fell by approximately 41 percent between 2013 and 2015 - years which produced the two largest Alaska salmon harvest volumes on record. Ex-vessel prices fell for all five salmon species during this time: sockeye (-61 percent), pinks (-51 percent), coho (-45 percent), Chinook (-19 percent), and chum (-17 percent). The Seafood Market Information Service is funded by a portion of the seafood marketing assessment paid by Alaska seafood producers. McDowell Group provides the service as a research contractor for the Alaska Seafood Marketing Institute (ASMI). Seafood Market Bulletins are typically published twice a year and are available to permit holders, processors, and other industry participants free of charge. Email [email protected] if you would like to receive new bulletins via email.

Welcome message from author
This document is posted to help you gain knowledge. Please leave a comment to let me know what you think about it! Share it to your friends and learn new things together.
Transcript

Spring 2016 – Alaska Salmon Industry Analysis
Salmon market conditions have been tumultuous in recent years, leading to questions about why Alaska salmon
prices have dipped so low. This bulletin addresses this issue by examining the following:
• Decline in Value of Alaska Salmon
• Ex-Vessel and First Wholesale Cash Flow Analyses
• Composition of Alaska’s Salmon Industry (Species, Products, and Markets)
• Historical First Wholesale and Ex-Vessel Pricing Trends
• ASMI’s Role in Supporting Alaska Salmon Values
Alaska Salmon Market Outlook
There are several reasons to be cautiously optimistic that prices for most key products/species will at least
stabilize and likely rise somewhat in both ex-vessel and wholesale markets. However, even if prices do increase
somewhat, the smaller expected harvest in 2016 will probably result in a lower overall resource value. Based
on current market conditions and harvest expectations, it appears probable that prices will begin improving in
2016 and there is an excellent chance total ex-vessel value will rebound in 2017 with a normal odd-year harvest
volume. So long as there are no other substantial external shocks (e.g. a further strengthening of the U.S. dollar,
etc.), the industry will likely recover from the recent downturn much faster than the crisis experienced in the
early 2000s.
Readers interested in future prospects for Alaska’s salmon market are also encouraged to read other salmon
bulletins in this series dealing with harvest projections and salmon market news.
Decline in Value of Alaska Salmon
Ex-vessel value fell by approximately 41 percent between 2013 and 2015 - years which produced the two
largest Alaska salmon harvest volumes on record. Ex-vessel prices fell for all five salmon species during this time:
sockeye (-61 percent), pinks (-51 percent), coho (-45 percent), Chinook (-19 percent), and chum (-17 percent).
The Seafood Market Information Service is funded by a portion of the
seafood marketing assessment paid by Alaska seafood producers.
McDowell Group provides the service as a research contractor for the
Alaska Seafood Marketing Institute (ASMI). Seafood Market Bulletins
are typically published twice a year and are available to permit
holders, processors, and other industry participants free of charge.
Email [email protected] if you would like to receive new bulletins
via email.

SPRING 2016 ALASKA SALMON INDUSTRY ANALYSIS ALASKA SEAFOOD MARKETING INSTITUTE PAGE 2
The 2013 season represented a near-term peak and it is not surprising that prices retreated in the wake of that
extraordinary year, but the decline has been swift and deep.
Inflation-Adjusted Ex-Vessel Value of Alaska Salmon, 1994-2015
Note: 2015 value is estimated based on preliminary data. Inflation adjustments based on Anchorage CPI. Source: ADF&G (COAR) and McDowell Group estimates.
The size of the decline in ex-vessel value between 2013 and 2015 is due to the following factors:
LARGER PINK AND SOCKEYE HARVESTS IN RECENT YEARS
Pink salmon harvests reached record levels in 2013 and 2015. Sockeye harvests were much larger than expected
in 2014 and the 2015 season produced the largest sockeye harvest since 1995, despite falling slightly short of
the forecast. These large harvests put far more supply into the market, and this eventually led to lower prices
in 2015.
A STRONGER U.S. DOLLAR
A strong (i.e. more valuable) U.S. dollar is bad for Alaska salmon processors, who rely on export markets for the
majority of their sales. A stronger U.S. dollar makes Alaska exports more expensive from a foreigner’s
perspective. It also makes competing, imported salmon less expensive in the domestic market.
Currencies of major buyers lost approximately 15-20 percent of their value versus the U.S. dollar between 2013
and 2015. Currencies of competing suppliers lost roughly 20-50 percent (see the Spring 2016 - Alaska Seafood
Export Market Analysis bulletin for more details). These are extraordinary exchange rate shifts which have
severely damaged foreign buyers’ purchasing power (in dollar terms) and made competing salmon products
relatively less expensive. Wholesale prices for Alaska salmon products have declined as result.
THE RUSSIAN EMBARGO
Russia had developed into a key market for pink salmon roe until August 2014 when an embargo was placed
on seafood (and other food products) from the U.S., Norway, Canada, and several other countries. With Russian
pink roe markets closed, Japan is again the only primary market for pink salmon roe. The embargo is a major
$0
$100
$200
$300
$400
$500
$600
$700
$80019
94
1995
1996
1997
1998
1999
2000
2001
2002
2003
2004
2005
2006
2007
2008
2009
2010
2011
2012
2013
2014
2015
Ex-V
esse
l Val
ue (
$Mill
ion
s)

SPRING 2016 ALASKA SALMON INDUSTRY ANALYSIS ALASKA SEAFOOD MARKETING INSTITUTE PAGE 3
reason why the average first wholesale price of pink roe fell 58 percent between September-December 2013
and the same period in 2015 (the primary salmon roe sales season following large pink harvests).
In addition, the embargo redirected a lot of Norwegian salmon to U.S. and European markets. Prior to the
embargo, Russia was the largest importer of Norwegian salmon (Norway is the largest salmon producer in the
world) – now all that salmon is competing for sales in other markets and contributing to lower prices for all
Alaska salmon species, but sockeye, coho, and keta in particular.
LESS NET OPERATING REVENUE IN ALASKA’S SALMON PROCESSING SECTOR
Several key external factors worked against the industry between 2013 and 2015, but as the next section
describes in more detail – internal issues also played a role. In short, Alaska salmon processors had relatively
poor years in 2013 and 2014. Processors generally entered 2015 with more inventory (or expectations about
adding to already elevated inventory positions), less operating capital, and declining wholesale prices. This
caused processors to minimize risk by offering lower ex-vessel prices.
Ex-Vessel and First Wholesale Cash Flow Analyses
Notes about the data and analysis: Ex-vessel data comes from the Alaska Department of Fish & Game, and includes all supplementary payments (e.g. bonuses, etc.) in addition to base ex-vessel prices. First wholesale sales and production data comes from the Alaska Department of Revenue, which compiles data from all Alaska salmon processors who sold more than 1 million pounds of product in the prior year – a volume which covers over 98 percent of total first wholesale production. The following analyses compare sales of salmon products made between May of the harvest year through April of the following year, which we refer as the “sales cycle”, to the ex-vessel value for the year in which fish were caught. However, sometimes product produced in one year is not sold until well into the next sales cycle or even later. In these cases, first wholesale revenue would be attributed to a later year as the data does not indicate exactly when the product was produced. Even though holding inventory longer than normal, the sales do eventually show up in first wholesale value. Arranging the data in this customized manner provides a better basis for comparison than a calendar year basis. Data for the final four months of the 2015 sales cycle is not available at this
time.
This section uses publicly available data on ex-vessel and first wholesale sales to 1) analyze the allocation of
resource value between the fishing and processing sectors over time and 2) quantify net processing revenue
collectively earned by processors. The allocation of salmon resource value is a primary concern for commercial
fishermen in Alaska, as ex-vessel values/prices are generally well known but first wholesale totals are not widely
reported. Net processing revenue is a reasonable proxy for the sector’s overall working capital, which has
important implications for the health of the salmon processing sector and the outlook for ex-vessel pricing.
The following are important findings for stakeholders in Alaska’s salmon industry:
1. Fishing revenue is much more variable than (net) processing revenue (after subtracting payments
to fishermen). When wholesale value/price increases, ex-vessel value/price tends to increase by a
larger amount, and vice versa when wholesale value declines. This pattern is not unique to salmon;
it is a common pattern for most commodities. The higher the value/price for finished products, the
more valuable the raw materials used to make those products becomes.

SPRING 2016 ALASKA SALMON INDUSTRY ANALYSIS ALASKA SEAFOOD MARKETING INSTITUTE PAGE 4
2. Fishermen and processors typically earn higher revenues when wholesale prices increase, but
fishermen received a larger share of first wholesale value as wholesale prices increased over the past
decade. This suggests that in the long run, the ex-vessel market for Alaska salmon is competitive
as processors bid up the price of raw material when wholesale prices increase. Therefore, the efforts
of ASMI to increase salmon values at the wholesale level do have an impact on ex-vessel value.
3. Net processing revenue is the feedstock for future ex-vessel payments. As processors earn larger
net revenues, there is more capital available to expand operations and eventually bid up salmon
prices.
SALMON RESOURCE VALUE ALLOCATION
First wholesale salmon prices generally increased between 2003 and 2013 (the decline during 2013 in the chart
below had more to do with a record pink harvest dragging the average price down). During that time, the
percentage of first wholesale value paid to fishermen in the form of ex-vessel payments increased from 37
percent of 51 percent. So, as first wholesale prices increased the share of resource value received by fishermen
also increased, which is a normal progression in a competitive market.
However, first wholesale prices have been in decline since 2013. Lower wholesale prices have reversed the trend
of rising market share for raw material producers. The takeaway from these data is that maximizing first
wholesale prices generally results in even larger increases in ex-vessel prices (in percentage terms). Data for
2015 is not yet complete, but will likely represent a substantial decline based on the first eight months of first
wholesale sales.
Average First Wholesale Salmon Prices vs. Fishermen’s Share of First Wholesale Value, 2003-2014
Note: First wholesale figures are based on a May-April sales year cycle, not a calendar year basis. 2015 Source: McDowell Group estimates based on ADF&G (COAR) and ADOR (ASPR).
30%
35%
40%
45%
50%
55%
$1.00
$1.50
$2.00
$2.50
$3.00
$3.50
2003
2004
2005
2006
2007
2008
2009
2010
2011
2012
2013
2014
Ex-V
esse
l Val
ue a
s Pc
t. o
f FW
Val
ue
Infl
atio
n-A
dju
sted
Fir
st W
ho
lesa
le V
alue
/lb
.
Inflation-Adjusted First Wholesale Value/lb. Ex-Vessel Value as Pct. of FW Value

SPRING 2016 ALASKA SALMON INDUSTRY ANALYSIS ALASKA SEAFOOD MARKETING INSTITUTE PAGE 5
CASH FLOW ANALYSIS: NET PROCESSING REVENUE AND EX-VESSEL VALUE
During the 2003 to 2013 period, Alaska salmon fishermen and processors generally realized increasing inflation-
adjusted revenues. The 2010-2012 period is especially instructive in explaining events of recent years. During
those years, net processing revenue (first wholesale sales during the sales cycle less ex-vessel payments)
averaged $771 million and the net revenue realized per pound of production sold increased from $1.62 to
$1.83, after adjusting for inflation. Expanding net processing revenues and increasing wholesale prices
generally provided the capital and incentive for processors to pay higher ex-vessel prices in 2013 and 2014,
resulting in fishermen receiving a larger share of the resource value.
However, net processing revenue averaged $706 million in 2013 and 2014 (about 10 percent below the
previous three-year average), and net processing revenue per pound dropped 21 percent (inflation-adjusted
basis), for reasons explained elsewhere in this bulletin. This left many processors in a relatively poor financial
position heading into 2015. With less working capital, a large 2015 salmon forecast, mounting canned
inventories, and a declining wholesale market, processors were far more conservative with ex-vessel price
commitments in 2015.
Although the difference in net processing revenue between the 2010-2012 period and the 2013-2015 period
is significant, the actual difference in profitability was probably greater. The large 2013 and 2015 harvests led
to an increase in processing costs (due to more volume), financing/storage costs (due to holding inventory),
and sales costs (due to the need to offer more discounts or spend more promotional dollars).
Alaska Salmon Resource Value Allocation, in $Millions (Inflation-Adjusted), 2002-2014
Harvest Year/Cycle
First Wholesale Sales Value
Ex-Vessel Value as Pct. of FW Sales
Net Processing Revenue1
Net Processing Revenue per Processed lb. Sold
2002 $730 30% $510 $1.34
2003 $730 37% $463 $1.16
2004 $880 39% $537 $1.23
2005 $955 43% $541 $1.16
2006 $1,015 41% $603 $1.34
2007 $1,162 42% $679 $1.33
2008 $1,133 44% $635 $1.63
2009 $1,171 38% $722 $1.67
2010 $1,442 45% $791 $1.62
2011 $1,473 46% $794 $1.70
2012 $1,335 45% $729 $1.83
2013 $1,478 51% $721 $1.46
2014 $1,295 47% $690 $1.44 1 Net processing revenue is equal to first wholesale sales value less the ex-vessel value of payments to fishermen. It is not a measure of actual profitability as it does not account for any other costs. Note: Complete data is not yet available for the 2015 sales cycle. Sources: ADOR (Alaska Salmon Price Report) and ADF&G (COAR), compiled by McDowell Group (SMIS).
Sales data for the complete 2015 sales cycle is not yet available, however, data for the first eight months of
sales (which account for the majority of annual first wholesale revenue) have been released. The final four
months tend to add another $180 to $235 million in first wholesale sales revenue, or about 15 to 20 percent
of the annual total.

SPRING 2016 ALASKA SALMON INDUSTRY ANALYSIS ALASKA SEAFOOD MARKETING INSTITUTE PAGE 6
Comparing the first eight months of first wholesale sales data can provide insight about cash flows in the
processing sector heading into the 2016 season. The data shown in the chart below suggest that more net
processing revenue was generated in the most recent (2015) sales cycle compared to prior years (back to 2002,
at least). The amount of net revenue realized per pound of product sold also increased. This is an encouraging
signal for fishermen and processors.
Sales of inventoried product explains part of the recent increase in net processing revenue. Not all revenue
earned during the 2015 cycle comes from fish caught and bought in 2015. Lower ex-vessel payments certainly
improved net processing revenue in 2015, but selling canned and frozen inventory from previous years also
boosted net processing revenue this past year.
Alaska Salmon Resource Value Allocation through First 8 Months of Sales Cycle, in $Millions (Inflation-Adjusted), 2010-2015
Harvest Year/Cycle
First Wholesale Sales Value
Net Processing Revenue1
Net Processing Revenue per Processed lb. Sold
Ex-Vessel Value
2010 $1,190 $539 $1.33 $651
2011 $1,263 $584 $1.44 $679
2012 $1,150 $545 $1.60 $606
2013 $1,244 $487 $1.24 $757
2014 $1,063 $459 $1.15 $605
2015 $1,112 $677 $1.40 $414* 1 Net processing revenue is equal to first wholesale sales value less the ex-vessel value of payments to fishermen. It is not a measure of actual profitability as it does not account for any other costs. *2015 ex-vessel value is preliminary, and does not includes bonuses or other supplementary payments. Sources: ADOR (Alaska Salmon Price Report) and ADF&G (COAR), compiled by McDowell Group (SMIS).
Not surprisingly, there is a strong relationship between the trend in net processing revenue and ex-vessel
price/value – particularly for sockeye and pink salmon (species which generally make up 75 to 80 percent of
Alaska’s total salmon ex-vessel value, see table below).
Net Processing Revenue versus Sockeye and Pink Salmon Ex-Vessel Price/Value, Inflation-Adjusted, 2009-2015
Harvest Year/Cycle
Net Processing Revenue1 ($M)
Sockeye Ex-Vessel Price/lb.
Sockeye Ex-Vessel
Value ($M)
Pinks Ex-Vessel Price/lb.
Pinks Ex-Vessel
Value ($M) 2009 $722 $0.90 $234 $0.25 $77
2010 $791 $1.33 $324 $0.46 $181
2011 $794 $1.41 $350 $0.50 $196
2012 $729 $1.38 $295 $0.51 $128
2013 $721 $1.63 $291 $0.41 $283
2014 $690 $1.38 $351 $0.30 $98
2015* Incomplete $0.71 $198 $0.20 $132 1 Net processing revenue is equal to first wholesale sales value less the ex-vessel value of payments to fishermen. It is not a measure of actual profitability as it does not account for any other costs. *2015 ex-vessel value is preliminary, and does not includes bonuses or other supplementary payments. Sources: ADOR (Alaska Salmon Price Report) and ADF&G (COAR), compiled by McDowell Group (SMIS).

SPRING 2016 ALASKA SALMON INDUSTRY ANALYSIS ALASKA SEAFOOD MARKETING INSTITUTE PAGE 7
Total net processing revenue increased substantially from 2009 to 2012. Ex-vessel sockeye salmon prices
increased by 52 percent, when comparing inflation-adjusted prices for 2009 and 2014. Ex-vessel pink salmon
prices increased 64 percent between 2009 and 2013, after adjusting for inflation.
The expansion in net processing revenue is an encouraging signal and could lead to better prices in future
seasons, if the trend in higher net processing revenue continues. However, it is unlikely that ex-vessel values
will quickly return to levels reached during the 2010 to 2014 period because the U.S. dollar is substantially
stronger, canned inventories are higher, and the Russian embargo limits roe market potential. High prices
witnessed during the 2010 period were the result of favorable market conditions and an increase in working
capital for processors.
Processors are in a better financial position heading into 2016, compared to 2015 and 2014. Further,
investments made during the last dozen years have left the industry in a much more responsive position
compared to the early 2000s. The industry produces a wider range of products, has a more recognizable brand,
is active in more markets, and has a healthier processing sector than it did during the last salmon value
downturn. For these reasons, it is likely that this downturn will be shallower with a faster turnaround with a
caveat. This assertion assumes no collection of unforeseen events or external pressures have a substantial
negative impact on the market for Alaska salmon during the next few years (e.g. a stronger U.S. dollar and
Russian embargo).
Composition of Alaska’s Salmon Industry
This section provides context about which species, product types, and markets drive value in Alaska’s salmon
industry. Comparisons represent an average of 2014 and 2015 because pink salmon harvests in odd and even
years tend to fluctuate substantially, leading to skewed percentages based on single calendar years.
EX-VESSEL VALUE BY SPECIES
Harvest Volume and Ex-Vessel Value by Salmon Species, 2014-2015
Note: 2015 data is preliminary. Figures may not sum to 100 percent due to rounding. Source: ADF&G (website, accessed 04/12/2016).
Sockeye29%
Pinks55%
Keta11%
Coho4%
Chinook1%
Sockeye55%
Pinks23%
Keta11%
Coho7%
Chinook4%
Harvest Volume (lbs.) Ex-Vessel Value

SPRING 2016 ALASKA SALMON INDUSTRY ANALYSIS ALASKA SEAFOOD MARKETING INSTITUTE PAGE 8
Sockeye and pink salmon account for the largest share of harvest volume and ex-vessel value - a combined 84
and 78 percent, respectively, over the past two years. Keta (i.e. chum), coho, and Chinook salmon accounted
for the other 16 percent of harvest volume and 22 percent of the fishery’s ex-vessel value.
FIRST WHOLESALE SALES VOLUME AND VALUE BY PRODUCT TYPE
Frozen H&G and canned product forms account for the vast majority of Alaska salmon production, but other
key product forms still provide a major share of production (i.e. first wholesale) value. Over the last two years,
frozen H&G and canned production accounted for 61 percent of first wholesale value while all other product
forms combined accounted for 39 percent.
Some Alaska salmon processors produce a wider range of salmon products beyond those listed below, such as
fish meal/oil, strips, and frames. However, the value of these ancillary products is relatively small compared to
total sales. In 2014, ancillary salmon products were valued at $34.4 million according to ADF&G’s Commercial
Operators Annual Report, or 2.7 percent of the first wholesale value of product sold in 2014. In addition, the
unit value of ancillary production (as a whole) tends to be lower than those of traditional product lines. In 2014,
the average first wholesale unit value of ancillary products was $0.88 per pound of product produced.
First Wholesale Sales Volume and Value of Key Salmon Products, 2014-2015
Source: ADOR (Alaska Salmon Price Report, accessed 04/12/2016).
ALASKA SALMON MARKET COMPOSITION
It is estimated that the U.S. is the largest market for Alaska salmon products, but export markets as a whole
account for approximately three-quarters of first wholesale sales. China is the largest export destination, but
the vast majority of product exported to China undergoes additional processing and is re-exported (primarily
to Europe, the U.S., and Japan). Canada and South Korea are also major markets. While each consumes
substantial volumes of Alaska salmon, the countries also re-export much product. In terms of final consumption,
the U.S., Europe, and Japan are Alaska’s biggest salmon markets, but China, South Korea, and Thailand also
import a lot of intermediate products for further processing or storage.
Canned21%
Frozen H&G40%
Fresh H&G9%
Fillets16%
Roe14%
Canned21%
Frozen H&G60%
Fresh H&G6%
Fillets8%
Roe5%
Volume Sold (lbs.) First Wholesale Value

SPRING 2016 ALASKA SALMON INDUSTRY ANALYSIS ALASKA SEAFOOD MARKETING INSTITUTE PAGE 9
Estimated Market Share of Total First Wholesale Sales Value, 2014-2015 Average
Market Pct. of FW Sales Value
Key Products
United States (Est.) 27% Fillets/H&G (fresh & frozen), canned pink salmon
China 18% Frozen H&G pink/keta
Europe 15% Frozen H&G sockeye and canned salmon
Canada 14% Canned salmon, fillets/H&G (fresh & frozen)
Japan 11% Roe and frozen H&G sockeye
South Korea 4% Frozen H&G sockeye
Others 10% Canned salmon, frozen H&G pink/sockeye
Note: Some countries, such as China, South Korea, and Canada re-export substantial quantities of Alaska salmon products. These data should not be regarded as market share of final consumption, but rather an estimate of market share in terms of first wholesale sales. Sources: ADOR (Alaska Salmon Price Report), ASMI Alaska Seafood Export Database, and McDowell Group estimates.
Historical First Wholesale and Ex-Vessel Pricing Trends
This section analyzes historical pricing trends for key products in the first wholesale market. First wholesale (FW)
pricing data is shown by trimester and comes from the Alaska Department of Revenue’s Alaska Salmon Price
Report. Available FW pricing data runs through the September-December 2015 trimester. FW pricing data
shown in this section represents the average first wholesale price of Alaska salmon products when Alaska salmon
processors sell product to non-affiliated buyers.
Data listed in this section represents the weighted average price of sold product categorized into broader
groups. In addition to price movements of underlying products, the average pricing of the group can be
impacted by numerous variables. For example, if sales of smaller, less valuable frozen H&G sockeye increase
more than other frozen H&G sizes, the weighted average frozen H&G sockeye price will be lower even if the
price for each size (under 4-lb., 4-6lb., and 6+ lb.) remained the same. Average price is also called the unit
value of a product. While unit values are useful in tracking the value of key product types over time, it is
important to understand that short-term changes in unit value may be driven by factors other than pricing
trends for more specific product types.
For more information, visit the Alaska Department of Revenue’s Alaska Salmon Price Report website at:
http://www.tax.alaska.gov/programs/programs/reports/index.aspx?60624.
See tables on following pages.

SPRING 2016 ALASKA SALMON INDUSTRY ANALYSIS ALASKA SEAFOOD MARKETING INSTITUTE PAGE 10
Sockeye Salmon Products
Average First Wholesale Price for Key Alaska Sockeye Salmon Products, 2006-2015
Year Trimester Frozen H&G
Frozen Fillets
Canned Halves
Fresh H&G
Roe Avg. Ex-Vessel
Price/lb. 2006 1 $1.80 $4.66 $2.78 N/A N/A
2006 2 $1.86 $4.32 $2.73 $3.13 $2.79 $0.76
2006 3 $2.07 $4.30 $2.62 $1.70 $3.88
2007 1 $2.09 $4.35 $2.81 N/A $3.04
2007 2 $2.01 $4.11 $2.79 $3.15 $3.48 $0.80
2007 3 $2.06 $3.97 $2.74 $2.97 $4.40
2008 1 $2.16 $4.42 $2.74 N/A N/A
2008 2 $2.22 $4.45 $2.76 $3.57 $6.27 $0.84
2008 3 $2.52 $4.98 $3.10 $2.80 $8.18
2009 1 $2.70 $4.72 $3.23 N/A $4.40
2009 2 $2.39 $3.86 $3.17 $3.67 $4.96 $0.80
2009 3 $2.74 $5.23 $2.90 $3.29 $5.73
2010 1 $2.83 $5.18 $2.98 N/A $2.07
2010 2 $2.99 $5.06 $3.10 $4.03 $4.53 $1.20
2010 3 $3.02 $5.96 $3.45 $3.21 $6.35
2011 1 $3.00 $6.29 $3.50 N/A $7.01
2011 2 $3.17 $5.66 $3.83 $3.77 $5.34 $1.31
2011 3 $3.27 $5.87 $4.38 $3.32 $7.32
2012 1 $3.29 $6.25 $4.08 N/A $5.25
2012 2 $2.81 $5.88 $4.73 $3.67 $6.31 $1.31
2012 3 $2.96 $5.72 $4.55 N/A $8.97
2013 1 $2.98 $6.25 $4.59 N/A N/A
2013 2 $4.12 $7.10 $4.89 $5.09 $6.89 $1.60
2013 3 $4.12 $7.64 $5.33 $4.49 $8.49
2014 1 $3.91 $7.12 $5.45 N/A $5.90
2014 2 $3.14 $7.09 $5.14 $4.43 $5.72 $1.37
2014 3 $3.13 $6.19 $4.42 $2.34 $6.54
2015 1 $2.84 $6.25 $3.97 N/A N/A
2015 2 $2.23 $5.47 $3.63 $3.53 $3.59 $0.71
2015 3 $2.40 $5.73 $3.07 $3.30 $4.02
Pct. of CY2015 FW Sales Value 39.2% 19.1% 14.4% 10.5% 3.9%
Note: 2015 ex-vessel price is preliminary as it does not include bonuses or other supplementary payments. Source: ADOR (Alaska Salmon Price Report), compiled by McDowell Group (SMIS).
SPRING 2016 ALASKA SALMON INDUSTRY ANALYSIS ALASKA SEAFOOD MARKETING INSTITUTE PAGE 11
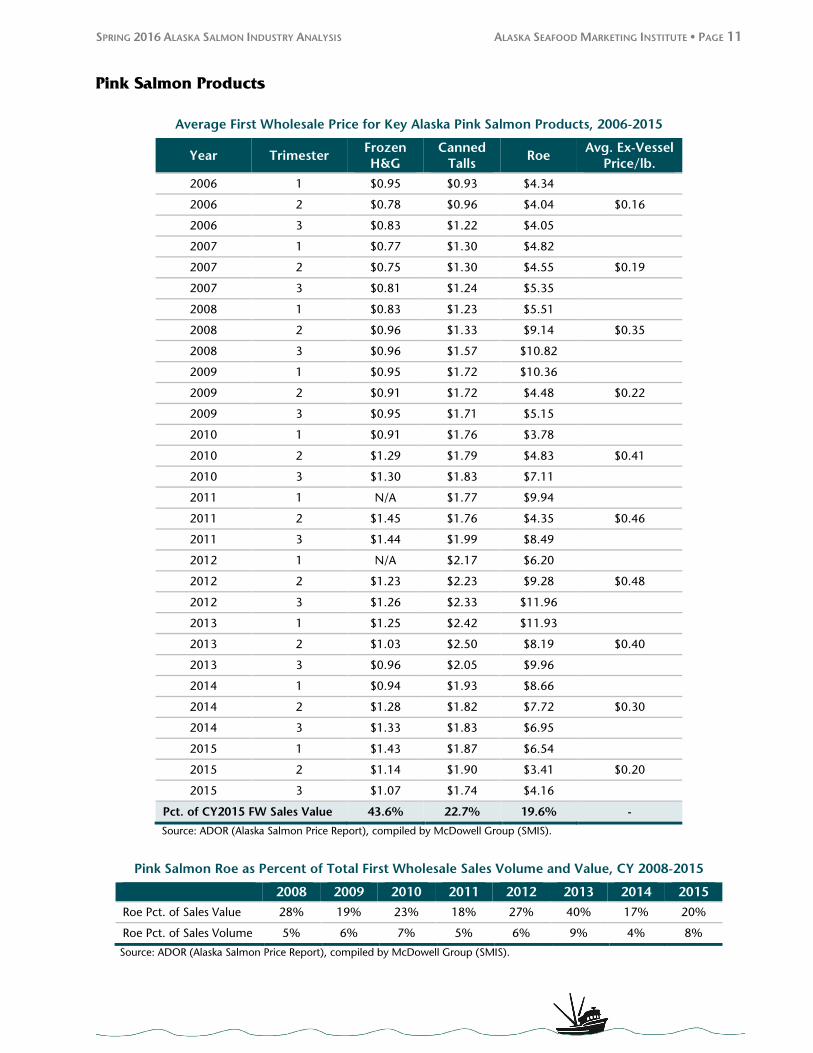
Pink Salmon Products
Average First Wholesale Price for Key Alaska Pink Salmon Products, 2006-2015
Year Trimester Frozen H&G
Canned Talls
Roe Avg. Ex-Vessel
Price/lb. 2006 1 $0.95 $0.93 $4.34
2006 2 $0.78 $0.96 $4.04 $0.16
2006 3 $0.83 $1.22 $4.05
2007 1 $0.77 $1.30 $4.82
2007 2 $0.75 $1.30 $4.55 $0.19
2007 3 $0.81 $1.24 $5.35
2008 1 $0.83 $1.23 $5.51
2008 2 $0.96 $1.33 $9.14 $0.35
2008 3 $0.96 $1.57 $10.82
2009 1 $0.95 $1.72 $10.36
2009 2 $0.91 $1.72 $4.48 $0.22
2009 3 $0.95 $1.71 $5.15
2010 1 $0.91 $1.76 $3.78
2010 2 $1.29 $1.79 $4.83 $0.41
2010 3 $1.30 $1.83 $7.11
2011 1 N/A $1.77 $9.94
2011 2 $1.45 $1.76 $4.35 $0.46
2011 3 $1.44 $1.99 $8.49
2012 1 N/A $2.17 $6.20
2012 2 $1.23 $2.23 $9.28 $0.48
2012 3 $1.26 $2.33 $11.96
2013 1 $1.25 $2.42 $11.93
2013 2 $1.03 $2.50 $8.19 $0.40
2013 3 $0.96 $2.05 $9.96
2014 1 $0.94 $1.93 $8.66
2014 2 $1.28 $1.82 $7.72 $0.30
2014 3 $1.33 $1.83 $6.95
2015 1 $1.43 $1.87 $6.54
2015 2 $1.14 $1.90 $3.41 $0.20
2015 3 $1.07 $1.74 $4.16
Pct. of CY2015 FW Sales Value 43.6% 22.7% 19.6% -
Source: ADOR (Alaska Salmon Price Report), compiled by McDowell Group (SMIS).
Pink Salmon Roe as Percent of Total First Wholesale Sales Volume and Value, CY 2008-2015
2008 2009 2010 2011 2012 2013 2014 2015 Roe Pct. of Sales Value 28% 19% 23% 18% 27% 40% 17% 20%
Roe Pct. of Sales Volume 5% 6% 7% 5% 6% 9% 4% 8%
Source: ADOR (Alaska Salmon Price Report), compiled by McDowell Group (SMIS).

SPRING 2016 ALASKA SALMON INDUSTRY ANALYSIS ALASKA SEAFOOD MARKETING INSTITUTE PAGE 12
Keta Salmon Products
Average First Wholesale Price for Key Alaska Keta Salmon Products, 2006-2015
Year Trimester Frozen H&G
Roe Frozen Fillets
Avg. Ex-Vessel Price/lb.
2006 1 $0.90 $5.87 $1.37
2006 2 $0.95 $6.11 $2.00 $0.32
2006 3 $0.97 $7.87 $2.01
2007 1 $1.09 $7.81 $1.73
2007 2 $0.89 $6.89 $1.91 $0.34
2007 3 $0.91 $9.56 $2.04
2008 1 $1.04 $11.72 $1.56
2008 2 $1.10 $13.45 $2.09 $0.59
2008 3 $1.17 $17.17 $2.46
2009 1 $1.30 $14.05 $1.89
2009 2 $1.17 $7.60 $2.15 $0.44
2009 3 $1.28 $10.97 $2.59
2010 1 $1.37 $10.50 $2.43
2010 2 $1.60 $8.46 $3.29 $0.70
2010 3 $1.63 $9.65 $4.21
2011 1 $1.78 $13.52 $3.34
2011 2 $1.87 $12.17 $3.05 $0.84
2011 3 $1.78 $13.78 $3.84
2012 1 $2.01 $15.44 $4.37
2012 2 $1.40 $15.00 $2.98 $0.76
2012 3 $1.18 $18.76 $3.01
2013 1 $1.00 $20.03 $4.37
2013 2 $1.09 $13.40 $2.80 $0.52
2013 3 $1.18 $15.30 $2.41
2014 1 $1.02 $16.54 $3.70
2014 2 $1.54 $12.07 $3.17 $0.60
2014 3 $1.48 $12.79 $3.37
2015 1 $1.40 $11.20 $4.06
2015 2 $1.47 $9.68 $3.36 $0.48
2015 3 $1.25 $10.30 $3.82
Pct. of CY2015 FW Sales Value 41.6% 39.5% 13.3% -
Source: ADOR (Alaska Salmon Price Report), compiled by McDowell Group (SMIS).
Keta Salmon Roe as Percent of Total First Wholesale Sales Volume and Value, 2008-2015
2008 2009 2010 2011 2012 2013 2014 2015 Roe Pct. of Sales Value 48% 33% 30% 34% 51% 49% 30% 37%
Roe Pct. of Sales Volume 7% 7% 7% 7% 8% 8% 5% 9%
Source: ADOR (Alaska Salmon Price Report), compiled by McDowell Group (SMIS).

SPRING 2016 ALASKA SALMON INDUSTRY ANALYSIS ALASKA SEAFOOD MARKETING INSTITUTE PAGE 13
Coho and Chinook Salmon Products
Average First Wholesale Price for Key Alaska Keta Salmon Products, 2006-2015
--------- Coho --------- ------- Chinook -------
Year Trimester Frozen H&G
Fresh H&G
Frozen H&G
Fresh H&G
2006 1 $1.85 N/A $2.39 $7.31
2006 2 $1.83 $2.36 $3.14 $5.56
2006 3 $2.74 $2.37 $3.78 $6.58
2007 1 $2.32 N/A $3.89 $7.54
2007 2 $2.39 $2.51 $3.18 $6.23
2007 3 $2.40 $2.93 $3.75 $7.47
2008 1 $2.45 N/A $3.92 $11.48
2008 2 $2.72 $3.29 $5.21 $7.81
2008 3 $2.83 $3.11 $4.35 $9.24
2009 1 $2.30 N/A $4.13 $9.23
2009 2 $2.09 $2.90 $2.83 $5.99
2009 3 $2.43 $2.96 $3.16 $7.65
2010 1 $2.49 N/A $3.31 $10.11
2010 2 $2.68 $3.02 $3.88 $6.94
2010 3 $2.79 $3.03 $3.43 $7.45
2011 1 $2.37 N/A $4.12 $9.23
2011 2 $2.66 $3.40 $4.10 $6.67
2011 3 $2.77 $3.74 $4.16 $8.43
2012 1 $2.25 N/A $3.10 $10.60
2012 2 $2.58 $3.42 $3.16 $7.49
2012 3 $2.92 $3.72 $4.52 $8.09
2013 1 $2.54 N/A $3.96 $12.38
2013 2 $3.60 $4.10 $4.51 $6.72
2013 3 $3.44 $3.90 $3.81 $9.88
2014 1 $2.64 N/A $3.84 $11.45
2014 2 $2.91 $3.07 $3.95 $6.72
2014 3 $2.53 $2.86 $4.28 $7.62
2015 1 $1.96 N/A $3.95 $12.02
2015 2 $1.75 $2.85 $3.07 $6.84
2015 3 $2.20 $3.37 $3.85 $9.04
Pct. of CY2015 FW Sales Value 42.4% 20.1% 30.2% 37.7%
Source: ADOR (Alaska Salmon Price Report), compiled by McDowell Group (SMIS).

SPRING 2016 ALASKA SALMON INDUSTRY ANALYSIS ALASKA SEAFOOD MARKETING INSTITUTE PAGE 14
ASMI’s Role in Supporting Alaska Salmon Markets
The mission of the Alaska Seafood Marketing Institute (ASMI) is to increase the economic value of the Alaska
seafood resource. ASMI has no direct influence on ex-vessel prices. Its focus is on increasing domestic and
international demand for Alaska seafood. By increasing demand, ASMI’s enhances resource values and
economic opportunity for everyone participating in Alaska’s seafood industry.
Recently, ASMI’s salmon-related efforts have focused on addressing growing inventories of key products,
expanding consumption, and generally trying to make the price decline “landing” as soft/short as possible –
as larger pink/sockeye harvests and poor exchange rate conditions have had an overwhelming impact on prices
for all salmon species. It has done this by expanding salmon promotions, primarily focusing on those which
move higher volumes of product (including thousands of in-store demonstrations), and coordinating $72
million worth of canned salmon purchases by the USDA during 2014 and 2015.
ASMI’s ability to influence consumer demand only extends so far, but the organization’s ability to quickly ramp
up promotions and collectively coordinate sales to food aid programs helps expand consumption faster and
manage inventory positions when harvests increase significantly - as was the case during the 2013 to 2015
period. Essentially, as bad as the situation has been for salmon fishermen and processors over the past year or
two, it would have been much worse without aggressive marketing and market development efforts by ASMI
and the industry.
Related Documents