Spreadsheets and Business Graphics: Facts and Figures Chapter 13

Spreadsheets and Business Graphics: Facts and Figures Chapter 13.
Dec 22, 2015
Welcome message from author
This document is posted to help you gain knowledge. Please leave a comment to let me know what you think about it! Share it to your friends and learn new things together.
Transcript

Spreadsheetsand
Business Graphics:
Facts and Figures
Chapter 13
Objectives• Describe the advantages of spreadsheets
• List several applications for spreadsheets
• Explain the underlying principles of electronic spreadsheet use
• Describe how to set up and modify a spreadsheet
• Describe the advantages of business graphics
• Differentiate between analytical and presentation graphics
• Name the elements of standard charts and graphs
Contents
• Why Use Spreadsheets?
• Working with Spreadsheets
• Business Graphics
• Analytical Graphics
• Presentation Graphics

Why Use Spreadsheets?
• Plan ahead (What if)
• Make the computer do the work
• See the results of change

The Nature of Spreadsheets
• Use numbers to track performance
• Manual– Tedious– Time-consuming– Error-prone
• Electronic spreadsheets– Automate– Increase ability to track performance

Electronic Spreadsheets
VisiCalc
• First electronic spreadsheet program
• 1979
• Apple II microcomputer
• Computer becomes an indispensable tool for financial analysis
Electronic SpreadsheetsLabor Saving
Automatic recalculation
• Change one value
• All dependent values are recalculated
• A single change can affect many calculations

Electronic SpreadsheetsLabor Saving
“What If” AnalysisThe process of changing one or more spreadsheet values and observing the resulting calculated effect
What if we reduce the price by 5%?
What if we buy a home and the mortgage rate increases by .5%?
Working with Spreadsheets
• Plan
• Create
• Edit and proofread
• Format
• Add graphics
• Provide data security – password, protect
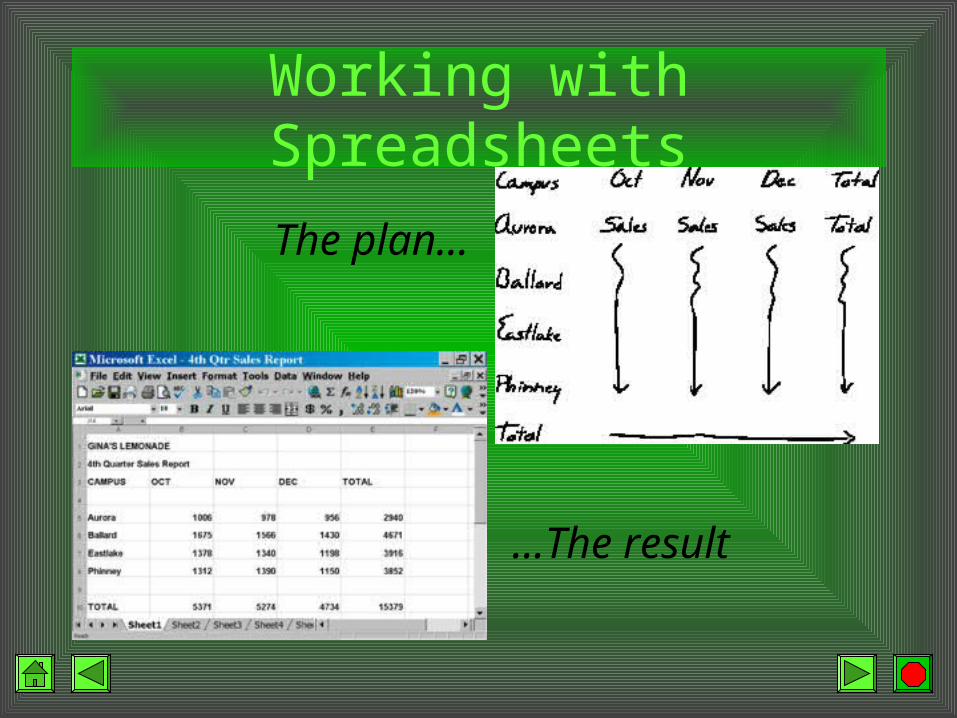
Working with Spreadsheets
The plan…
…The result
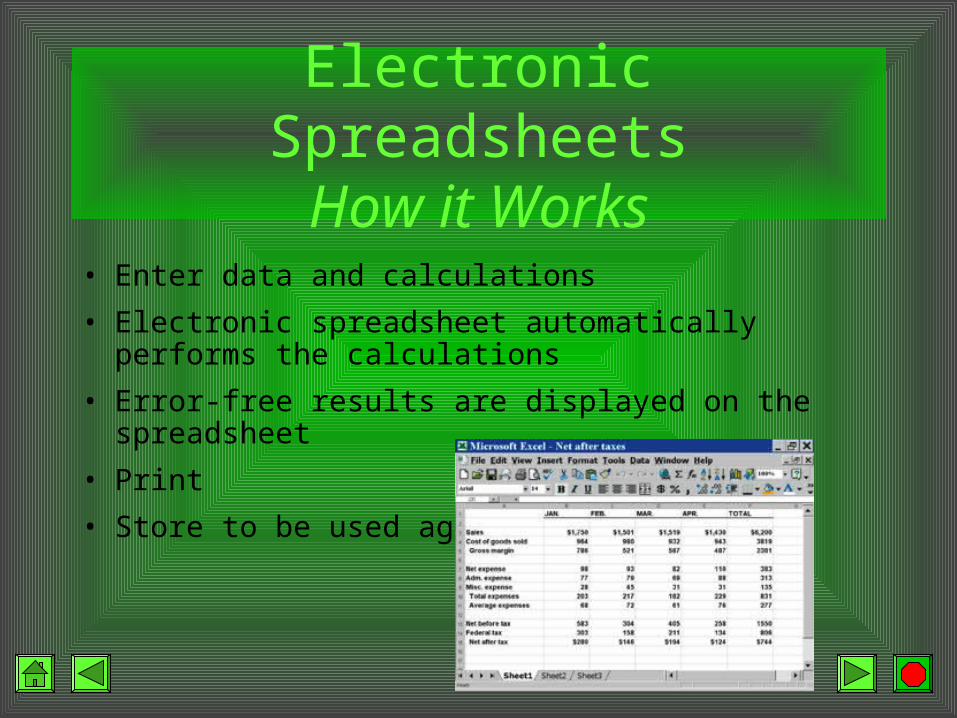
Electronic SpreadsheetsHow it Works
• Enter data and calculations
• Electronic spreadsheet automatically performs the calculations
• Error-free results are displayed on the spreadsheet
• Store to be used again
Electronic SpreadsheetsFundamentals
• Screen– Window into the spreadsheet– Scroll using mouse or cursor-movement
keys
• Rows and columns– Row – number– Column – letters
Electronic SpreadsheetsFundamentals
• Cell– Junction of a row and column– Cell address (cell reference) – letter and
number
• Active cell (current cell)– Highlighted with border or reverse video– Can enter or edit data in active cell only

Cell Contents
• Label– Descriptive text
about entries– Not used for
calculations
• Value– Number– May be used in
calculations
Cell ContentsFormula
• Calculation instruction
• Contains– Cell address– One or more arithmetic operators– Functions
• Result appears in the cell containing the formula
• Calculation appears in the formula bar
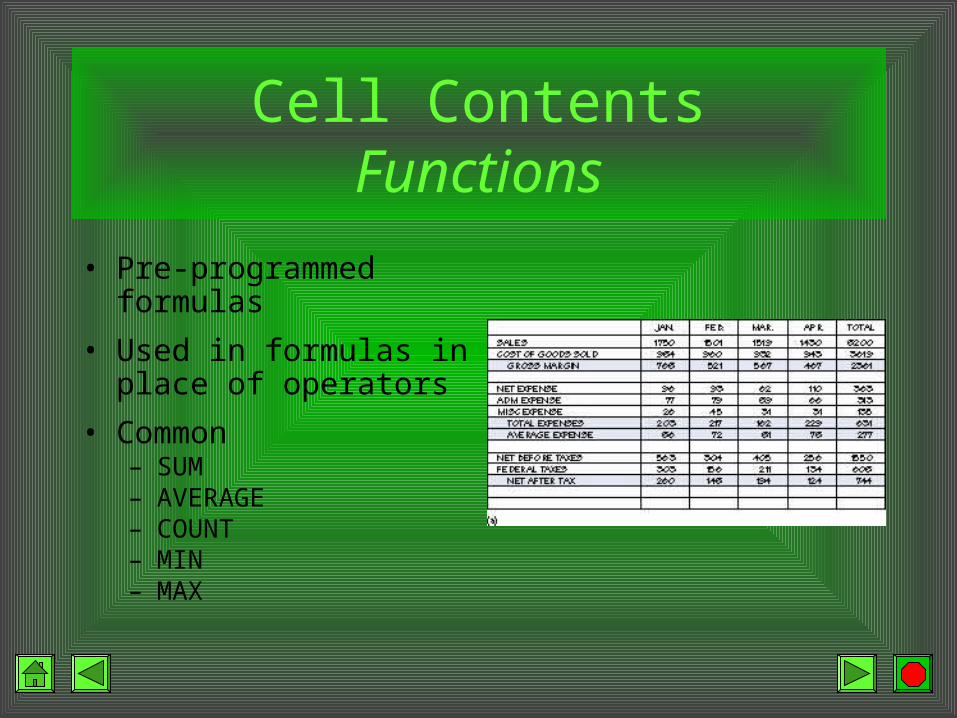
Cell ContentsFunctions
• Pre-programmed formulas
• Used in formulas in place of operators
• Common– SUM– AVERAGE– COUNT– MIN– MAX
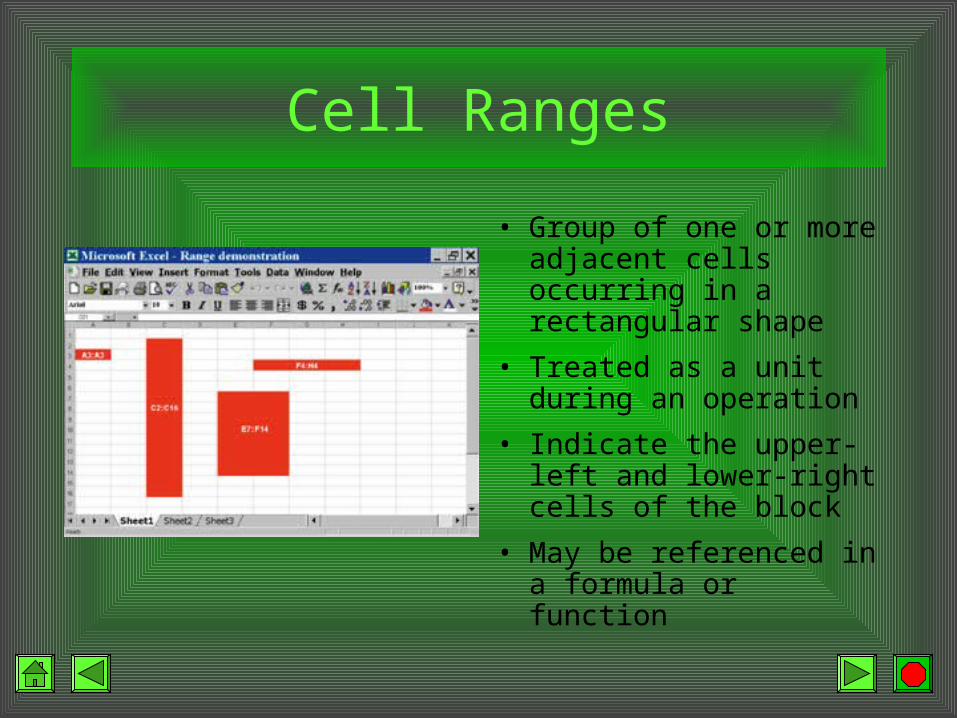
Cell Ranges
• Group of one or more adjacent cells occurring in a rectangular shape
• Treated as a unit during an operation
• Indicate the upper-left and lower-right cells of the block
• May be referenced in a formula or function
Formatting Features
• Column width
• Row height
• Headings
• Number styles – commas, number of decimals, dollar and percent signs
• Appearance of data– Justification– Text font and style
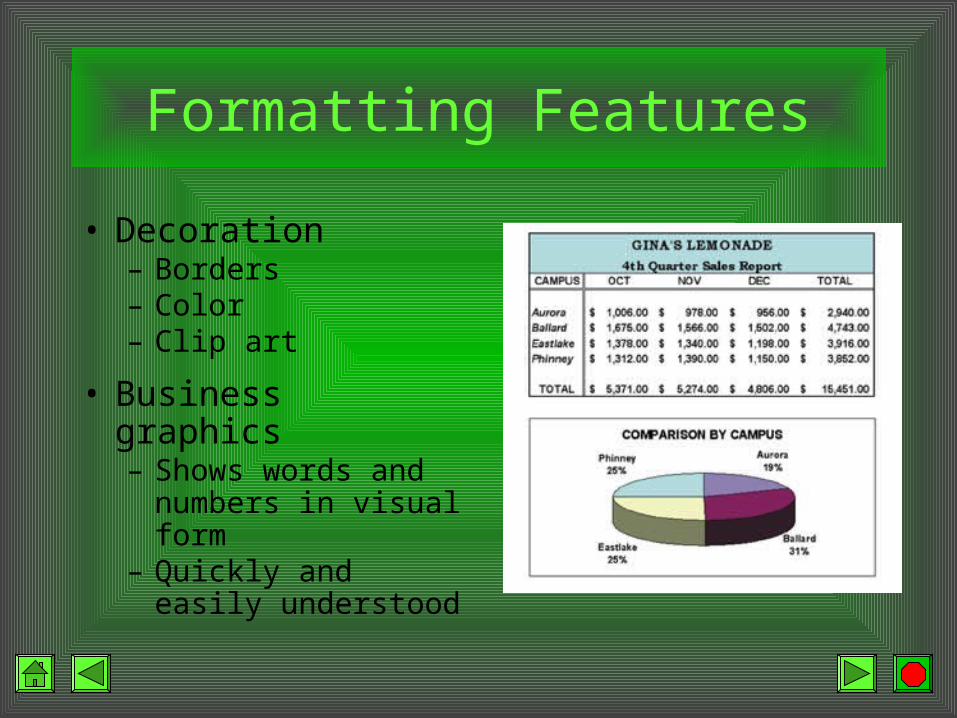
Formatting Features
• Decoration– Borders– Color– Clip art
• Business graphics– Shows words and
numbers in visual form
– Quickly and easily understood
Business Graphics
• Generate and sustain the interest of an audience
• Make a lesson, report, or business document more attractive
• Help get a point across
• Can reveal a trend that is lost in a column of numbers
• Presenter appears more prepared and organized
Business Graphics
Analytical graphicsView and analyze data
Presentation graphicsMake a positive impression during a presentation
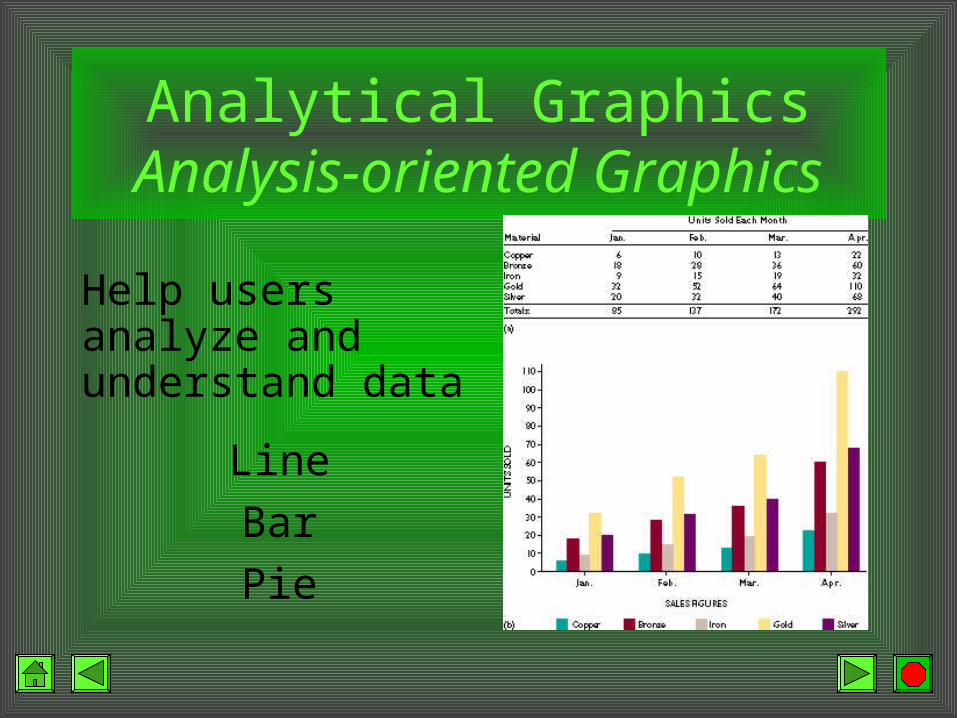
Analytical GraphicsAnalysis-oriented Graphics
Help users analyze and understand data
Line
Bar
Pie

Line Graphs
Shows trends or cycles over time
• Axis
• Plot area
• Data point
• Labels
• Titles

Bar Graphs
• Comparisons
• Rectangular area up to the height of the point being plotted
• Easy to absorb

Pie Charts
• ProportionsRelationship between parts and whole
• One time period
• Exploded pie chartOne wedge pulled slightly away from the pie
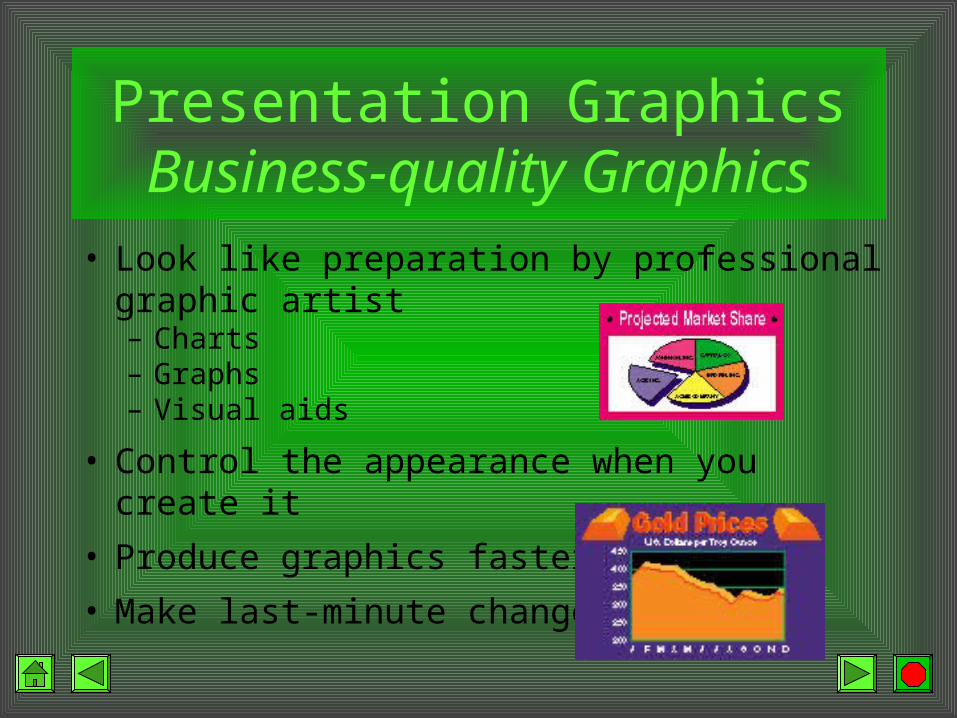
Presentation Graphics Business-quality Graphics
• Look like preparation by professional graphic artist– Charts– Graphs– Visual aids
• Control the appearance when you create it
• Produce graphics faster
• Make last-minute changes
Presentation Graphics Business-quality Graphics
• Edit and enhance charts created by other programs
• Create charts, diagrams, drawing, and text slides
• Use clip art
• Support animated effects
• Add sounds
Presentation Graphics Business-quality Graphics
Hardware
• High-resolution color monitor
• Color printer
• Ability to project computer slides on a screen

Related Documents