Spray Simulation Modeling and Numerical Simulation of Sprayforming Metals
Dec 01, 2015
Welcome message from author
This document is posted to help you gain knowledge. Please leave a comment to let me know what you think about it! Share it to your friends and learn new things together.
Transcript


This page intentionally left blank
Spray Simulation
Spray forming combines the metallurgical processes of metal casting and powder metallurgyto fabricate metal products with enhanced properties. This book provides an instruction tothe various modelling and simulation techniques employed in spray forming, and showshow they are applied in process analysis and development.
The author begins by deriving and describing the main models. He then presents theirapplication in the simulation of the key features of spray forming. Wherever possible hediscusses theoretical results with reference to experimental data. Building on the featuresof metal spray forming, he also derives common characteristic modelling features that maybe useful in the simulation of related spray processes.
The book is aimed at researchers and engineers working in process technology, chemicalengineering and materials science.
Udo Fritsching received his Ph.D. from the University of Bremen, Germany, and is currentlyhead of the Research Group at the Institute for Materials Science and apl. Professor at theUniversity of Bremen. He is the author or coauthor of 160 scientific papers and has fivepatent applications pending.


Spray SimulationModelling and Numerical Simulation ofSprayforming Metals
Udo FritschingUniversitat Bremen

Cambridge, New York, Melbourne, Madrid, Cape Town, Singapore, São Paulo
Cambridge University PressThe Edinburgh Building, Cambridge , UK
First published in print format
- ----
- ----
© Cambridge University Press 2004
2004
Information on this title: www.cambridge.org/9780521820981
This publication is in copyright. Subject to statutory exception and to the provision ofrelevant collective licensing agreements, no reproduction of any part may take placewithout the written permission of Cambridge University Press.
- ---
- ---
Cambridge University Press has no responsibility for the persistence or accuracy of sfor external or third-party internet websites referred to in this publication, and does notguarantee that any content on such websites is, or will remain, accurate or appropriate.
Published in the United States of America by Cambridge University Press, New York
www.cambridge.org
hardback
eBook (EBL)
eBook (EBL)
hardback

Contents
Preface page viiNomenclature x
1 Introduction 1
2 Spray forming of metals 6
2.1 The spray forming process 62.2 Division of spray forming into subprocesses 10
3 Modelling within chemical and process technologies 21
4 Fluid disintegration 26
4.1 Melt flow in tundish and nozzle 284.2 The gas flow field near the nozzle 434.3 Jet disintegration 67
5 Spray 94
5.1 Particle movement and cooling 975.2 Internal spray flow field 1215.3 Spray-chamber flow 1445.4 Droplet and particle collisions 147
v

vi Contents
6 Compaction 161
6.1 Droplet impact and compaction 1616.2 Geometric modelling 1766.3 Billet cooling 1876.4 Material properties 218
7 An integral modelling approach 233
8 Summary and outlook 243
Bibliography 245Useful web pages 269Index 271

Preface
This book describes the fundamentals and potentials of modelling and simulation of complexengineering processes, based on, as an example, simulation of the spray forming process ofmetals. The spray forming process, in this context, is a typical example of a complex tech-nical spray process. Spray forming, basically, is a metallurgical process whereby near-netshaped preforms with outstanding material properties may be produced direct from a metalmelt via atomization and consolidation of droplets. For proper analysis of this process, firstsuccessive physical submodels are derived and are then implemented into an integrated cou-pled process model. The theoretical effects predicted by each submodel are then discussedand are compared to experimental findings, where available, and are summarized underthe heading ‘spray simulation’. The book should give engineering students and practisingengineers in industry and universities a detailed introduction to this rapidly growing areaof research and development.
In order to develop an integral model for such technically complex processes as the sprayforming of metals, it is essential that the model is broken down into a number of smallersteps. For spray forming, the key subprocesses are:
� atomization of the metal melt,� dispersed multiphase flow in the spray,� compaction of the spray and formation of the deposit.
These subprocesses may be further divided until a sequential (or parallel) series of unitoperational tasks is derived. For these tasks, individual balances of momentum, heat andmass are to be performed to derive a fundamental model for each. In addition, someadditional submodels need to be derived or applied. The general description of this mod-elling approach to the spray forming process is the fundamental aim of this book, whichtherefore:
� introduces a general modelling and simulation strategy for complex spray processes,� reviews relevant technical contributions on spray form modelling and simulation, and� analyses and discusses the physical behaviour of each subprocesses and materials in the
spray forming process.
This work is based on a number of investigations of spray forming carried out byresearchers all over the world. Major contributions have been given from research projects
vii

viii Preface
conducted by the author’s research group on ‘multiphase flow, heat and mass transfer’ atthe University of Bremen, the Foundation Institute for Material Science (IWT), as wellas the Special Research Cooperation Project on spray forming SFB 372 at the Universityof Bremen. These projects have been funded, for example, by the Deutsche Forschungs-gemeinschaft DFG, whose support is gratefully acknowledged. Several graduate and PhDstudents contributed to this project. I would like to thank all of them for their valuable contri-butions, especially Dr.-Ing. O. Ahrens, Dr.-Ing. D. Bergmann, Dr.-Ing. I. Gillandt, Dr.-Ing.U. Heck, Dipl.-Ing. M. Krauss, Dipl.-Ing. S. Markus, Dipl.-Ing. O. Meyer and Dr.-Ing.H. Zhang. Also, I would like to thank those guests whom I had the pleasure of hosting atthe University of Bremen and who contributed to the development of this book, namelyProfessor Dr.-Ing. C. T. Crowe and Professor Dr. C. Cui. I acknowledge Professor Dr.-Ing.

ix Preface
K. Bauckhage for initiating research in this field and thank him for his continuous supportof research in spray forming at the University of Bremen.
I would like to thank my family, Karin and Anna, for their understanding and support.
In order to keep the price of this book affordable, it has been decided to reproduce all figuresin black/white. All coloured plots and pictures can be found and downloaded by interestedreaders from the author’s homepage. Some of the spray simulation programs used in thisbook may also be downloaded from this web page. The URL is:www.iwt-bremen.de/vt/MPS/
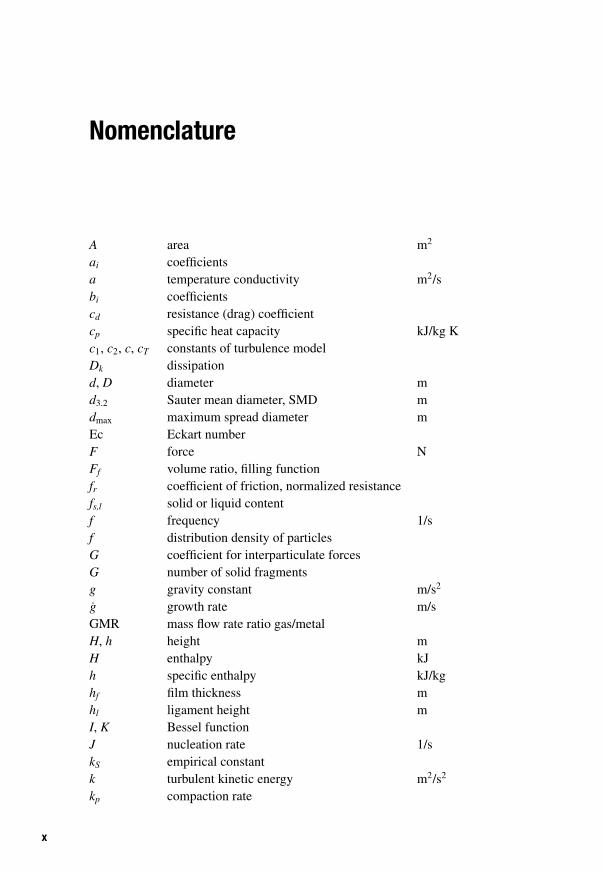
Nomenclature
A area m2
ai coefficientsa temperature conductivity m2/sbi coefficientscd resistance (drag) coefficientcp specific heat capacity kJ/kg Kc1, c2, c, cT constants of turbulence modelDk dissipationd, D diameter md3.2 Sauter mean diameter, SMD mdmax maximum spread diameter mEc Eckart numberF force NFf volume ratio, filling functionfr coefficient of friction, normalized resistancefs,l solid or liquid contentf frequency 1/sf distribution density of particlesG coefficient for interparticulate forcesG number of solid fragmentsg gravity constant m/s2
g growth rate m/sGMR mass flow rate ratio gas/metalH, h height mH enthalpy kJh specific enthalpy kJ/kghf film thickness mhl ligament height mI, K Bessel functionJ nucleation rate 1/skS empirical constantk turbulent kinetic energy m2/s2
kp compaction rate
x
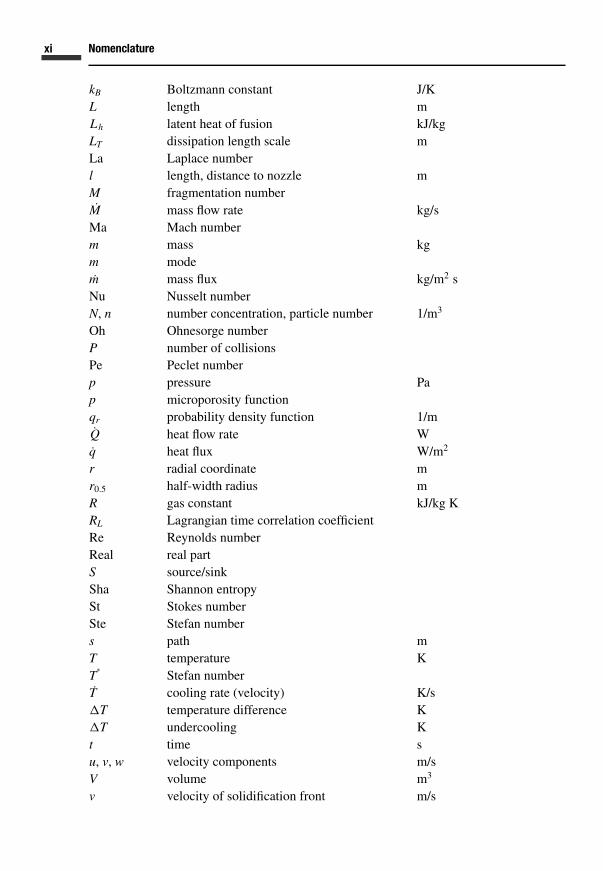
xi Nomenclature
kB Boltzmann constant J/KL length mLh latent heat of fusion kJ/kgLT dissipation length scale mLa Laplace numberl length, distance to nozzle mM fragmentation numberM mass flow rate kg/sMa Mach numberm mass kgm modem mass flux kg/m2 sNu Nusselt numberN, n number concentration, particle number 1/m3
Oh Ohnesorge numberP number of collisionsPe Peclet numberp pressure Pap microporosity functionqr probability density function 1/mQ heat flow rate Wq heat flux W/m2
r radial coordinate mr0.5 half-width radius mR gas constant kJ/kg KRL Lagrangian time correlation coefficientRe Reynolds numberReal real partS source/sinkSha Shannon entropySt Stokes numberSte Stefan numbers path mT temperature KT
∗Stefan number
T cooling rate (velocity) K/s�T temperature difference K�T undercooling Kt time su, v, w velocity components m/sV volume m3
v velocity of solidification front m/s

xii Nomenclature
W, F, G, Q matrixWe Weber numberx, y, z plane Cartesian coordinates mxK length of supersonic core mxs mean distance between solid fragments mZ∗ splashing numberz distance atomizer – substrate mz, r, θ cylindrical coordinates m, m, o
αG gas nozzle inclination angle o
αf, αg volumetric content of gas, liquidαspray spray inclination angle ◦
α heat transfer coefficient W/m2 K� diffusivity�S Gamma functionγ solid–liquid surface tension N/mδ excitation wavelength mδ width of gas jets mε dissipation rate of turbulent kinetic energy m2/s3
εS radiation emissivityηS amplitude function of perturbationηab, ηB amplitude of surface wavescol impact angle ◦
θ contact angle ◦
θ modified temperature Kκ isentropic exponentκ0 surface curvature 1/m2
λ heat conductivity W/m Kλ0 reference heat conductivity W/m Kλd wavelength mλe solidification coefficientµ dynamic viscosity kg/m sν kinematic viscosity m2/sνm molar volume m3/molξ g boundary layer coefficientξ , η dimensionless coordinatesρ density kg/m3
σ l surface tension N/mσ d logarithmic standard deviationσ h, σ ε
x , σ k constants of turbulence modelσ S Stefan–Boltzmann constant W/m2 K4
σ t relative turbulence intensityτ shear stress N/m2
τ p relaxation time s

xiii Nomenclature
τ T eddy lifetime sτ u passing time through eddy sτ v interaction time s� transport variable� velocity potential� impact angle ◦
ϕ velocity numberχ impact parameter m� stream functionψ f function of fluid density� collision functionω growth rate 1/s
IndicesA nozzle exit areaa lifta outer sideabs total valueb Bassetc centre-linec, crit criticalct contact layercyl cylindricald dispersed phase (droplet)eff effective valueener energyf filmf fluidg gas phaseg gravityh hydrostatichet heterogeneoushom homogeneousi imaginary parti inner sidei, j numbering, grid indexideal ideal statein inflowjacket side region of billetk nucleationk compactionLub Lubanskal liquid

xiv Nomenclature
l liquidusm massm mean valuemin, max minimum value, maximum valuemom momentn normal directionout melt exitpor porosityp particlep pressurep projectedr real partrel relative values soliduss spraySh shadowsin sinusS meltt turbulencet inertiat tangential directiontop top side of billettor torusu environmentv velocityw wallw resistancezu addition0 stagnation value1 primary gas2 secondary (atomization) gas∗ critical condition

1 Introduction
Modelling of technical production facilities, plants and processes is an integral part ofengineering and process technology development, planning and construction. The success-ful implementation of modelling tools is strongly related to one’s understanding of thephysical processes involved. Most important in the context of chemical and process tech-nologies are momentum, heat and mass transfer during production. Projection, or scaling,of the unit operations of a complex production plant or process, from laboratory-scaleor pilot-plant-scale to production-scale, based on operational models (in connection withwell-known scaling-up problems) as well as abstract planning models, is a traditional butimportant development tool in process technology and chemical engineering. In a propermodelling approach, important features and the complex coupled behaviour of engineeringprocesses and plants may be simulated from process and safety aspects viewpoints, as wellas from economic and ecologic aspects. Model applications, in addition, allow subdivisionof complex processes into single steps and enable definition of their interfaces, as well assequential investigation of the interaction between these processes in a complex plant. Fromhere, realization conditions and optimization potentials of a complex process or facility maybe evaluated and tested. These days, in addition to classical modelling methods, increasedinput from mathematical models and numerical simulations based on computer tools andprograms is to be found in engineering practice. The increasing importance of these tech-niques is reflected by their incorporation into educational programmes at universities withinmechanical and chemical engineering courses.
The importance of numerical models and simulation tools is increasing dramatically.The underlying physical models are based on several input sources, ranging from empiricalmodels to conservation equations for momentum, heat and mass transport in the form ofpartial differential or integro differential equations. Substantial development of modellingand simulation methods has been observed recently in academic research and development,as well as within industrial construction and optimization of processes and techniques. Forthe process or chemical industries, some recent examples of the successful inclusion ofmodelling and simulation practice in research and development may be found, for example,in Birtigh et al. (2000). This increasing importance of numerical simulation tools is directlyrelated to three different developments, which are individually important, as is the interactionbetween them:
� First, the potential of numerical calculation tools has increased due to the exploding powerof the computer hardware currently available. Not only have individual single processor
1
2 Introduction
computers increased their power by orders of magnitude in short time scales, but alsointeraction between multiple processors in parallel machines, computer clusters or vectorcomputers has recently raised the hardware potential dramatically.
� Next, and equally important, the development of suitable sophisticated mathematicalmodels for complex physical problems has grown tremendously. In the context of theprocesses to be described within this book, a variety of new complex mathematical modelsfor the description of exchange and transport processes in single- and multiphase flows(based on experimental investigations or detailed simulations) has recently been derived.
� Last, but not least, developments in efficient numerical analysis tools and numeric math-ematical methods for handling and solving the huge resulting system of equations havecontributed to the increasing efficiency of simulated calculations.
Based on state-of-the-art modelling and simulation tools, a successful and realistic descrip-tion of relevant technical and physical processes is possible. This story of success hasincreased the acceptance of numerical simulation tools in almost all technical disciplines.Closely connected to traditional and modern theoretical and experimental methods, numeri-cal simulation has become a fundamental tool for the analysis and optimization of technicalprocesses.
The process of spray forming, which will be discussed here in terms of modelling andsimulation, is basically a metallurgical process, but will be mainly described from a funda-mental process technology point of view. Metal spray forming and the production of metalpowders by atomization, i.e. the technical processes evaluated in this book, are fundamen-tally related to the disintegration of a continuous molten metal stream into a dispersedsystem of droplets and particles. Atomization of melts and liquids is a classical process orchemical engineering operation, whereby a liquid continuum is transformed into a spray ofdispersed droplets by intrinsic (e.g. potential) or extrinsic (e.g. kinetic) energy. The mainpurpose of technical atomization processes is the production of an increased liquid surfaceand phase boundary or interfacial area between liquid and gas. All transfer processes acrossphase boundaries directly depend on the exchange potential, which drives the process, andthe size of the exchange surface. In a dispersed system, this gas/liquid contact area is equalto the total sum of surfaces of all individual drops, i.e. of all droplets within the spray. Byincreasing the relative size of the phase boundary in a dispersed system, the momentum,heat and mass transfer processes are intensified between the gas and the liquid. The totalexchange flux within spray systems may thereby be increased by some orders of magnitude.
Atomization techniques in process technology or chemical engineering processes/plantscan be applied to:
� impact-related processes, and� spray-structure-related processes.
Some examples of spray process applications in engineering following this subdivision arelisted below.
� Impact-related spray applications requiring a continuous fine spatial distribution of aliquid continuum, e.g. in the field of coating applications:

3 Introduction
– for protection of metallic surfaces from corrosion in mechanical engineering throughpaint application;
– for coating of technical specimens/parts for use in private or industrial applications,including surface protection and colour (paint) application;
– for thermal plasma- or flame-spraying of particles to provide protective ceramic ormetallic coatings in the metal industry;
– for spray granulation or coating of particles (for example in pelletizers or in fluidizedbeds), e.g. for pharmaceutical or food industry applications;
– for spray cooling in steel manufacturing or in spray heat treatment of metallic speci-mens.
� Spray-structure-related applications whereby the structure or properties of liquids orparticulate solids are altered by gas/dispersed phase exchange processes, within:– thermal exchange processes, e.g. for rapid cooling and solidification of fluid metal
melts in metal powder generation;– coupled mass and thermal transfer processes, e.g. spray drying (or spray crystallization)
in food or dairy industries or in chemical mass products production;– particle separation from exhaust gases, e.g. from conventional power plants (wet scrub-
bing);– reaction processes within fuel applications in energy conversion, automotive, or aero-
plane or aerospace engine or fuel jet applications.� Combination of impact- and spray-structure-related spray process applications:
– within droplet-based manufacturing technologies, e.g. for rapid prototyping;– for the generation of specimens and preforms by spray forming of metals.
In spray forming, a combination of nearly all the features, subprocesses and examples ofatomization processes listed, may be found. Spray forming is, in its unique composition, anideal and typical example of a complex technical atomization process. The numerical mod-elling and simulation techniques derived for analysis and description of the spray formingprocess may be easily transferred to other atomization and spray process applications.
In a first analysis approach, the complex coupled technical process is subdivided intosingle steps for further study. In the context of spray forming, subdivision of the technicalatomization process into modular subprocesses can be done. This is illustrated in Figure 1.1,where the three main subprocesses discussed below are shown:
� atomization: the process of fluid disintegration or fragmentation, starting with the con-tinuous delivery of the fluid or melt, and necessary supporting materials (such as gasesor additives), to the resulting spray structure and droplet spectrum from the atomizationprocess;
� spray: the establishing and spreading of the spray, to be described by a dispersed multi-phase flow process with momentum, heat and mass transfer in all phases, and the exchangebetween the phases, as well as a possible secondary disintegration process of fluid liga-ments or coalescence of droplets;

4 Introduction
atomization
spray
impact
Fig. 1.1 Subdivision of an atomization process into subprocesses
� impact: the impact of spray droplets onto a solid or liquid surface and the compactionand growth of the impacting fluid or melt mass, as well as the building of the remaininglayer or preform.
Central, integrative and common to all spray-related subprocesses is the fluids engineer-ing and process or chemical engineering discipline of fluid dynamics in multiphase flowsinvolving integral heat and mass transfer. The fundamental properties and applications ofthis discipline are central to the theme of this book.
Based on this method of analysis, modelling and numerical simulation are introducedas scientific tools for engineering process development, as applied to metal spray forming.Then, the individual physical processes that affect spray forming are introduced and imple-mented into an integral numerical model for spray forming as a whole. Recent modelling andsimulation results for each subprocess involved during metal spray forming are discussedand summarized. Where possible, simulated results are compared to experimental resultsduring spray forming, to promote physical understanding of the relevant subprocesses, andare discussed under the heading ‘spray simulation’.

5 Introduction
Numerical modelling and simulation of the individual steps involved in spray formingare presently of interest to several research groups in universities and industry worldwide.In this book, the current status of this rapidly expanding research area will be documented.But despite the emphasis given to metal spray forming processes, it is a major concern ofthis book to describe common analysis tools and to explain general principles that the readermay then apply to other spray modelling strategies and to other complex atomization andspray processes.
To enhance the general integral spray forming model further, additional physical sub-models need to be developed and boundary conditions determined. It is hoped that thecombination of experimental, theoretical and numerical analyses presented here will con-tribute to the derivation and formulation of such additional subprocess models. Integrationof these models into a general operational model of the spray forming process will then bepossible.
In conclusion, the main aims of this book are:
� to introduce a general strategy for modelling and simulation of complex atomization andspray processes,
� to review relevant contributions on spray form modelling and simulation, and� to analyse and discuss the physical behaviour of the spray forming process.
2 Spray forming of metals
In this chapter, fundamental features of the metal spray forming process are introduced interms of their science and applications. Chapter 1 saw the division of the process into threemain steps:
(1) disintegration (or atomization),(2) spray establishment, and(3) compaction.
Now, a more detailed introduction to those subprocesses that are especially important forapplication within the spray forming process, will be given.
2.1 The spray forming process
Spray forming is a metallurgical process that combines the main advantages of the twoclassical approaches to base manufacturing of sophisticated materials and preforms, i.e.:
� metal casting: involving high-volume production and near-net shape forming,� powder metallurgy: involving near-net shape forming (at small volumes) to yield a
homogeneous, fine-grained microstructure.
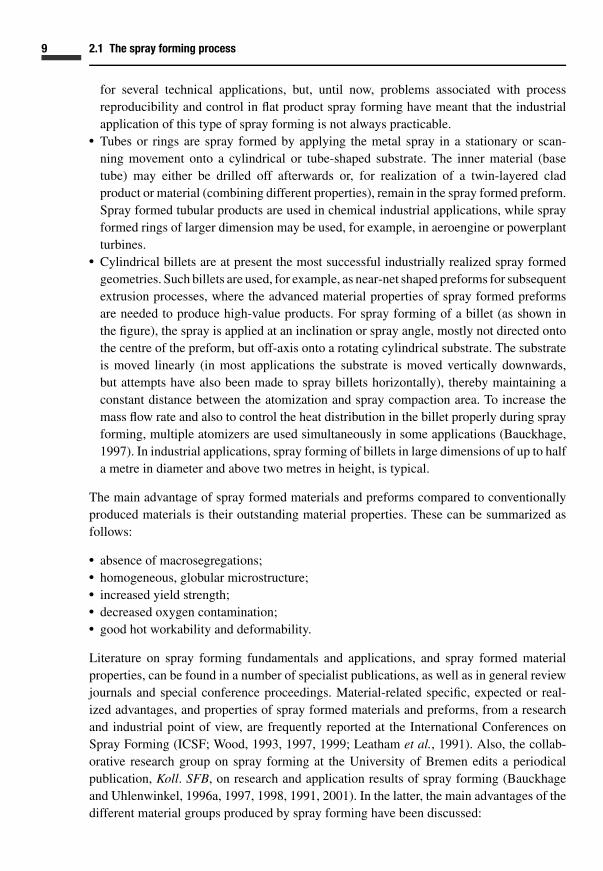
The spray forming process essentially combines atomization and spraying of a metal meltwith the consolidation and compaction of the sprayed mass on a substrate. A typical technicalplant sketch and systematic scheme of the spray forming process (as realized within severaltechnical facilities and within the pilot-plant-scale facilities at the University of Bremen,which will be mainly referenced here) is illustrated in Figure 2.1. In the context of sprayforming, a metallurgically prepared and premixed metal melt is distributed from the meltingcrucible via a tundish into the atomization area. Here, in most applications, inert gas jets withhigh kinetic energy impinge onto the metal stream and cause melt disintegration (twin-fluidatomization). In the resulting spray, the droplets are accelerated towards the substrate andthereby cool down and partly solidify due to intensive heat transfer to the cold atomizationgas. The droplets and particles in the spray impinge onto the substrate thereby consolidatingand depositing the desired product.
The basic concept of metal spray forming was established in the late 1960s in Swansea,Wales, by Singer (1970; 1972a,b) and coworkers. In the 1970s, the spray forming processwas further developed as an alternative route for the production of thin preforms directly
6

7 2.1 The spray forming process
crucible
tundish
atomizer
spray
deposit
substrate
Fig. 2.1 Principle sketch and plant design of a spray forming process facility
from the melt. The spray forming process developed as a substitute for the conventionalproduction processes of casting and subsequent hot and cold rolling of slabs (often in com-bination with an additional thermal energy source). The spray forming process was first usedcommercially by a number of Singer’s young researchers (Leatham et al., 1991; Leathamand Lawley, 1993; Leatham, 1999), who founded the company Osprey Metals in Neath,Wales. For this reason, the spray forming process is sometimes referred to as the Ospreyprocess. Since then, worldwide interest in the physical basics and application potential ofthe spray forming process has spawned several research and development programmes atuniversities and within industries. An overview of the resulting industrial applications andthe aims of industrial spray forming are given, for example, in Reichelt (1996) or Leatham
8 Spray forming of metals
flat product
tube
billet
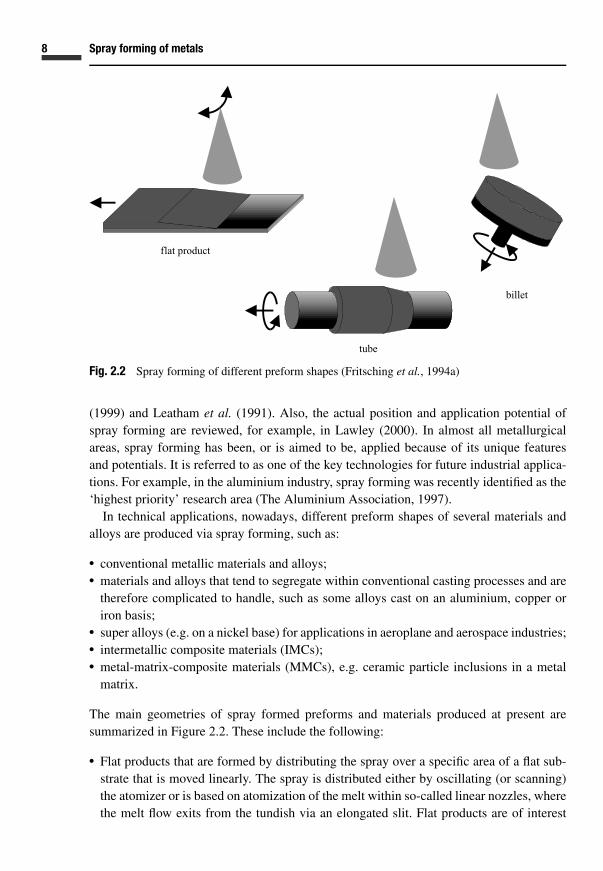
Fig. 2.2 Spray forming of different preform shapes (Fritsching et al., 1994a)
(1999) and Leatham et al. (1991). Also, the actual position and application potential ofspray forming are reviewed, for example, in Lawley (2000). In almost all metallurgicalareas, spray forming has been, or is aimed to be, applied because of its unique featuresand potentials. It is referred to as one of the key technologies for future industrial applica-tions. For example, in the aluminium industry, spray forming was recently identified as the‘highest priority’ research area (The Aluminium Association, 1997).
In technical applications, nowadays, different preform shapes of several materials andalloys are produced via spray forming, such as:
� conventional metallic materials and alloys;� materials and alloys that tend to segregate within conventional casting processes and are
therefore complicated to handle, such as some alloys cast on an aluminium, copper oriron basis;
� super alloys (e.g. on a nickel base) for applications in aeroplane and aerospace industries;� intermetallic composite materials (IMCs);� metal-matrix-composite materials (MMCs), e.g. ceramic particle inclusions in a metal
matrix.
The main geometries of spray formed preforms and materials produced at present aresummarized in Figure 2.2. These include the following:
� Flat products that are formed by distributing the spray over a specific area of a flat sub-strate that is moved linearly. The spray is distributed either by oscillating (or scanning)the atomizer or is based on atomization of the melt within so-called linear nozzles, wherethe melt flow exits from the tundish via an elongated slit. Flat products are of interest
9 2.1 The spray forming process
for several technical applications, but, until now, problems associated with processreproducibility and control in flat product spray forming have meant that the industrialapplication of this type of spray forming is not always practicable.
� Tubes or rings are spray formed by applying the metal spray in a stationary or scan-ning movement onto a cylindrical or tube-shaped substrate. The inner material (basetube) may either be drilled off afterwards or, for realization of a twin-layered cladproduct or material (combining different properties), remain in the spray formed preform.Spray formed tubular products are used in chemical industrial applications, while sprayformed rings of larger dimension may be used, for example, in aeroengine or powerplantturbines.
� Cylindrical billets are at present the most successful industrially realized spray formedgeometries. Such billets are used, for example, as near-net shaped preforms for subsequentextrusion processes, where the advanced material properties of spray formed preformsare needed to produce high-value products. For spray forming of a billet (as shown inthe figure), the spray is applied at an inclination or spray angle, mostly not directed ontothe centre of the preform, but off-axis onto a rotating cylindrical substrate. The substrateis moved linearly (in most applications the substrate is moved vertically downwards,but attempts have also been made to spray billets horizontally), thereby maintaining aconstant distance between the atomization and spray compaction area. To increase themass flow rate and also to control the heat distribution in the billet properly during sprayforming, multiple atomizers are used simultaneously in some applications (Bauckhage,1997). In industrial applications, spray forming of billets in large dimensions of up to halfa metre in diameter and above two metres in height, is typical.
The main advantage of spray formed materials and preforms compared to conventionallyproduced materials is their outstanding material properties. These can be summarized asfollows:
� absence of macrosegregations;� homogeneous, globular microstructure;� increased yield strength;� decreased oxygen contamination;� good hot workability and deformability.
Literature on spray forming fundamentals and applications, and spray formed materialproperties, can be found in a number of specialist publications, as well as in general reviewjournals and special conference proceedings. Material-related specific, expected or real-ized advantages, and properties of spray formed materials and preforms, from a researchand industrial point of view, are frequently reported at the International Conferences onSpray Forming (ICSF; Wood, 1993, 1997, 1999; Leatham et al., 1991). Also, the collab-orative research group on spray forming at the University of Bremen edits a periodicalpublication, Koll. SFB, on research and application results of spray forming (Bauckhageand Uhlenwinkel, 1996a, 1997, 1998, 1991, 2001). In the latter, the main advantages of thedifferent material groups produced by spray forming have been discussed:

10 Spray forming of metals
� for copper-based alloys see Muller (1996), Hansmann and Muller (1999), as well asJordan and Harig (1998) and Lee et al. (1999);
� for aluminium materials see Hummert (1996, 1999), Ruckert and Stocker (1999) andKozarek et al. (1996);
� for iron-based alloys and steels see Wunnenberg (1996), Spiegelhauer and coworkers(1996, 1998) and Tsao and Grant (1999), as well as Tinscher et al. (1999);
� for titanium and ceramic-free super alloys see Muller et al. (1996) and Gerling et al.(1999, 2002);
� for composite materials and metal-matrix-composites (MMCs) see Lavernia (1996); and� for lightweight materials (e.g. magnesium) see Ebert et al. (1997, 1998).
Presentation and exchange of scientific ideas and results of the spray forming process andthe related process of thermal spraying was combined for the first time at the InternationalConferences on Spray Deposition and Melt atomization (SDMA), which took place inBremen in 2000 and 2003 (Bauckhage et al., 2000, 2003). Besides review papers, severalpapers looking specifically at microstructure and material properties, melt atomization,technical synergies from thermal spraying, process diagnostics and process analysis, newprocess developments, and modelling and simulation of spray forming, were presented.Select papers from these conferences have also been published in special volumes of theInternational Journal of Materials Science and Engineering A (Fritsching et al., 2002).
2.2 Division of spray forming into subprocesses
From a chemical engineering and process technology viewpoint spray forming needs to bedivided into a number of subprocesses. The first step is the division into the three maincategories described in Chapter 1, each of which can, in turn, be further disseminated toderive requisite individual processes and process steps. A possible subdivision of the wholespray forming process is illustrated in Figure 2.3.
These subprocesses and their tasks and descriptions, as well as the aims of their modellingand numerical simulation in the frame of the integral spray forming process are describedbelow.
(1) Melt delivery in a conventional spray forming process plant is realized either directlyfrom the melting crucible (by a bottom pouring device, e.g. by control with a stopperrod) or more frequently by pouring the melt from the melting crucible into a tundishand from this through the melt nozzle towards the atomization area. Process instabilitiescaused by possible freezing of the melt in the narrow passage through the melt nozzletip, especially in the transient starting phase of the process, are well known and fearedby all industrial users of spray forming. Several attempts to improve the stability of themelt exiting from the nozzle have been made. Description and analysis of the transientmelt, in terms of its temperature distribution within the tundish and its velocity profilewithin the nozzle help to develop suitable process operation strategies and thereby toprevent nozzle clogging.

11 2.2 Division of spray forming into subprocesses
1 melt delivery
2 gas flow field3 atomization4 particle behaviour
5 spray behaviour
6 chamber flow field7 particle collisions
8 compaction9 deposit geometry10 product temperature11 product properties
Fig. 2.3 Subdivision of the spray forming process into subprocesses
The subsequent atomization process is mainly influenced by the temperature distri-bution within the melt and the dependency of its material properties upon temperature(which may change along the flow path from the crucible via the tundish until theatomization nozzle is reached). Also the metal mass flow rate may change during oper-ation of the spray forming process due to varying temperatures and thermal conditions(or chemical reactions) in the nozzle. In addition, the local velocity distribution ofthe melt and the geometric dimensions of the exiting jet stream will severely influ-ence the atomization process and the resulting melt in terms of spray properties (e.g.drop-size spectrum). Simulation of the behaviour of the melt jet stream with respect tomelt/gas phase interface boundary conditions will give valuable information about thissubprocess.
(2) Modelling and description of the behaviour of the gas during flow in the vicinity of thetwin-fluid atomizer is needed in order to analyse melt/gas interaction properly duringatomization. In spray forming, the metal melt, in most cases, is atomized by means oftwin-fluid atomizers with inert gases. The main reason for using this particular type ofatomizer is that these nozzles deliver high kinetic energies for fluid disintegration, incombination with high heat transfer and droplet acceleration rates in the spray by theatomization gas. In the typical range of gas pressures and gas nozzle geometries usedin spray forming, gas flow in the vicinity of the atomizer is a complex dynamic processinvolving compressible, transonic and turbulent behaviour of the gas in the atomizationarea. Modelling and description of gas flow behaviour in the vicinity of the atomizernozzle by numerical simulation is a necessary boundary condition for derivation of amelt disintegration model and is the main aim of this simulation step.

12 Spray forming of metals
(3) A key step in the derivation of an integral spray forming process is modelling of metalmelt disintegration (primary atomization). Disintegration is caused by processes thatlead to instability in the fluid (melt) stream and at the interfacial phase boundary.Ongoing models take into account local interaction of the melt stream and the gasflow field and successive liquid stream disintegration (which needs to be subdividedinto primary and secondary atomization, as these are governed by different physicalprocesses). From this analysis one can derive the primary structure of the spray in itsinitial constellation with respect to the drop-size and drop-momentum spectrum in thespray and the overall spray geometry and spray angle as well as the droplet mass fluxdistribution within the initial spray.
(4) The spray structure within the spray forming process consists of in-flight accelerated,thereby cooled and partly solidified, melt droplets on the one hand and a rapidly heated(by the hot particles) and decelerated gas flow on the other. Analysis of individualdroplet behaviour in the spray is a necessary precondition for derivation of droplet in-flight movement and cooling models. From here, adequate modelling and descriptionof the droplet solidification process in the spray is achieved.
(5) Complete spray analysis and spray structure description is based on dispersedmultiphase flow modelling and simulation, involving complex transport, exchange andcoupling processes (for momentum and thermal energy) between the gas and the dropletphases. Such spray simulations may reveal the distribution of mass, kinetic and thermalproperties of the spray at the point of impingement onto the substrate/deposit. Theseproperties have to be derived for individual particles in the spray, as well as for theoverall (integral) spray, by averaging and integration. Knowledge of spray properties isan important process variable for: prediction of the quality of the material and porosityof the sprayed product; necessary minimization of the amount of particle overspray;derivation of the shape and geometry of the sprayed product; and, finally, determinationof the properties of the spray formed preform.
(6) Modelling and description of the two-phase flow inside the spray chamber allows, forexample, the analysis of powder recirculation flows and possible hazardous powder pre-cipitation in the spray chamber. Fine overspray powder, which has not been compacted,swirls around the spray chamber during the spray forming process. Such powders in-fluence process control devices and measurements, and may result in the deposition ofpowder at hot spray-chamber walls. These recirculating powders contribute to processproblems and may result in cost-intensive cleaning of the spray chamber.
Possibilities for reducing powder recirculation and overspray need to be developed.The amount by which the melt mass flow is oversprayed depends on a number of atom-ization and process conditions. Derivation, for example, of a suitable spray-chamberdesign based on fluid mechanical simulation and analysis, as well as adaptation ofthe spray-chamber geometry to the specific application and material, is a reason-able way of minimizing the overspray and preventing powder deposition at chamberwalls.
(7) For high particle or droplet concentrations (dense conditions) in dispersed multiphaseflow (as within the dense spray region close to the atomization area), the relevance of

13 2.2 Division of spray forming into subprocesses
particle/particle interactions, such as spray droplet collisions, increases. Binary dropletcollisions in a spray may result in droplet coalescence or droplet disintegration. In bothcases, the spray structure will change significantly. In spray forming applications, thedifferent morphologies of melt droplets and particles in the spray (as there are fluid,semi-solid and solid particles in the spray) need to be taken into account, as these mayexhibit very different phenomena during droplet collision. In the case of MMC sprayforming, interaction of melt droplets with solid (e.g. ceramic) particles in the sprayduring collision needs to be analysed, e.g. to increase the incorporation efficiency of theprocess. These solid/liquid collision processes may result in solid particle penetrationinto a fluid or semi-solid melt droplet.
(8) Derivation of the fluid dynamic, thermal and metallurgical aspects of the spray formingprocess, as well as of those mechanisms themselves, which yield the various porositiesencountered in spray formed preforms, need to be analysed in terms of droplet impactand deformation behaviour. Furthermore, analysis of fluid and semi-solid melt dropletsduring impact on surfaces of different morphology (these may be fluid, semi-solid orsolid) is essential. Until now, the contribution of back-splashing droplets or particlesthat are disintegrated during impact has been poorly understood, and it is importantto model their effect on the spray forming process (for example, their contribution tooverspray).
(9) Based on modelling and analysis of the impacting spray and the compaction processof spray droplets, the geometry of the sprayed product needs to be derived in relationto spray process properties and deposit conditions during compaction. This will allowstrategies for online process control (e.g. during temporal deviation of the processconditions from optimum) to be derived.
(10) Description of the transient material temperature and distribution of solids in thegrowing and cooling deposit during the spray process, and in the subsequent coolingprocess, may contribute a priori to analysis of the remaining product and its materialproperties. Thus, transient thermal analysis of the combined system, i.e. deposit andsubstrate, with respect to ambient flow conditions, facilitates analysis of this step of theprocess.
(11) Numerical models and simulations are now used in many engineering applications.Several disciplines may contribute to the development of an integral spray formingmodel. Classical materials science and mechanical models based on the main processconditions during spray forming and applied in the context of spray forming will con-tribute a priori to derivation of the remaining material properties and to identificationof possible material deficits.
2.2.1 Subdivision of process steps and interaction of components
The contribution of each individual subprocess, introduced above, to the overall sprayforming model, varies significantly. Several ways of combining the relevant spray formingsubprocesses have already been suggested in the literature. These are introduced in thefollowing discussion (see, for example, Lavernia and Wu (1996)).

14 Spray forming of metals
Lawley et al. (1990) and Mathur et al. (1991) have examined the spray forming process,and have looked at how fundamental knowledge of atomization and the compaction processaffect system construction.
In this sense, proper control of the main process parameters, such as substrate movement,spray oscillation, deposit temperature and so on, is essential, as shown in Figure 2.4. Thisdiagram illustrates the relationship between independent process conditions (i.e. those con-trolled directly by the process operator), shown on the left-hand side of the figure, and theprocess critical conditions (i.e. those that the operator is unable to control directly). Thelatter include:
� the spray condition at impact, and� the surface condition of the substrate/deposit.
The aim of Lawley et al.’s and Mathur et al.’s approaches, is to determine which parametersare process controllable. They found that, typically, the three most important parametersfor characterization of the quality of the sprayed product are:
� the morphology of the deposit (deposit geometry and dimensions),� the mass yield and the undesired metal mass loss due to overspray, and� the microstructure of the product (porosity and grain size).
Alteration of any of these independent process variables will directly result in a change in thenumber of dependent process parameters and will influence the desired output properties.A more detailed diagram describing the interaction between dependent and independentprocess parameters, as defined by Lawley et al. (1990), is shown in Figure 2.5. In thisdiagram, five successive stages have been derived for subdivision of the spray formingprocess.
A number of models are required to explain the individual process steps within sprayforming in order to account for the numerous cause–reaction relations exhibited at differ-ent stages, as illustrated in Figure 2.5. Lawley et al. (1990) have divided these into twocategories:
� high-resolution models (HRM), and� low-resolution models (LRM).
Based on the definition of these authors, high-resolution models describe the dependentvariables of the process (such as temperature, velocity and solid contents of sprayed particlesin the spray) that are based precisely on fundamental relations and physical conditions,and models of fluid mechanics, heat transfer and phase change during solidification withrespect to the independent process variables. The low-resolution models are needed forthose subprocesses and relationships where quantitative models are not available. Also, thelow-resolution models may be used to average results of high-resolution models, e.g. inthe form of simulation correlations. Examples of process variables and processes wherehigh-resolution models are not available at present include: prescription of the droplet-sizedistribution in the spray or the problem of overspray generation. Low-resolution models are

15 2.2 Division of spray forming into subprocesses
superheat
flow rate
gasflow rate
gas type atomization
gaspressure
stand-offdistance
state of thespray at impact
state ofthe surface
consolidation
substratematerial,
quality andtemperature
substratemotion and
configuration
preformcooling and
solidification
transfer ofdroplets (spray)
metaldelivery
stage ofthe process
independentprocessparameter
criticaldependentparameter
surface
Fig. 2.4 Modelling of dependent and independent process parameters as a flow diagram (Lawleyet al., 1990)

16 Spray forming of metals
gastype
gaspressure
gasflow rate
droplet sizes initial droplettemp., velocity
gasvelocityprofile
sprayshapeprofile
solid/liquid ratioin spray at impact
surface temp.& roughness
stickingefficiency
substratemotion
microstructure(grain size,porosity)
shape
yield
heat extractionthrough substrate
temperatureprofile in preform
targetefficiency
flightdistance
dropletvelocityprofile
droplet temp.and solidification
materialproperties
metalflow rate
meltsuperheat
metal deliveryand gas delivery
atomization
transfer of droplets(metal spray)
consolidation
preform coolingand solidification
independent process parameter(directly controlled)
critical dependentparameter
final output ofthe process
high-resolutionmodels not available
high-resolutionmodels available
Fig. 2.5 Modelling within five successive process stages (Lawley et al., 1990)

17 2.2 Division of spray forming into subprocesses
of major importance, for example, for online process control and regulation. In principle,three possible sources for derivation of low-resolution models exist:
(1) averaged results of high-resolution models, e.g. for the droplet-size distribution in thespray, or the mean temperature and the spatially averaged solidification content of theimpacting spray;
(2) empirical correlations, e.g. for determining principal independent process variables(e.g. melt properties such as surface tension and melt viscosity) in relation to themean droplet-size spectrum (of the overall spray), or the principal relation betweenmicrostructure, grain size and cooling rate of the material;
(3) empirical rules and simple logic correlations.
The present application of Lawley et al.’s (1990) high- and low-resolution models is alsoillustrated in Figure 2.5.
Through application of several low-resolution models, as defined by Lawley et al. (1990),the first attempt to establish an integral spray forming process model was made by Ottosen(1993). Ottosen divides the spray forming process into three main subprocesses:
(1) atomization and disintegration of the fluid (melt);(2) interaction of gas and droplet/particles in the spray; and(3) droplet impingement, compaction and interaction of the particles with an underlying
surface.
In his work, Ottosen (1993) defines modelling and simulation of spray development, andthe complex momentum and heat transfer and exchange processes within the spray, as keyto the analysis of an integral spray forming model. He also describes structure formationduring the deposit growth and modelling of the temperature distribution in the deposit andthe substrate, located below the deposit, as an important subprocess that dominates theoverall performance of the spray forming process. Based on Ottosen’s modelling approach,Pedersen (2003) derived a coupled integral process model for spray forming based on:
� an atomization model,� a shape model, and� a deposition model.
The main emphases of this coupled approach are analysis of the surface temperature of thespray preform and derivation of an empirical correlation to be used, for example, in processcontrol (see Chapter 7).
Modelling of physical subprocesses is also a necessary condition for optimum in-situ andonline control and regulation of the spray forming process.
Bauckhage and Uhlenwinkel (1996b) describe the possibilities of an automated andoptimized spray forming process, based on the division of spray forming into three subpro-cesses:
(1) melting and atomization,(2) particle transport in the spray, and(3) compaction.

18 Spray forming of metals
All visually observable, measurable and controllable material properties, the preform geom-etry and the process conditions are then related to these three subprocesses. In their analysis,the qualitative influence of changing process conditions during spray forming within each ofthese individual subprocesses, and the effect that this has on the overall process and result-ing properties, are discussed. The analysis shows that control of the particle size spectrumin the spray is the most important parameter during spray forming, and that this, in turn,can be readily influenced by regulation of the mass flow rate of the atomizer gas (via theatomization gas pressure, at constant thermal conditions). The aim of process control is tobe able to influence atomization and, immediately connected with atomization, to controlthe multiphase transport processes in the spray, which build the adjustable parameters of thespray forming process. Fluctuation of the process conditions, e.g. melt properties may alterdue to temperature variations or melt delivery fluctuations, may disturb the process para-meters. Also, melt mass flow rate variations from the tundish during the process, related tochemical reactions or thermal variations, need to be controlled. Continuous measurement ofthe melt mass flow rate and online comparison of actual and rated values during the processare therefore essential. In order to compare actual and rated melt mass flow values steadily,when the measured value deviates from the rated value, one has to regulate the process bychanging the gas pressure (as it is impossible to alter the melt flow rate directly). Therefore,in order to maintain a constant gas-to-melt ratio (GMR), the gas pressure, and thus the gasflow ratio, needs to be changed. The GMR directly influences the particle size distributionin the spray. Thus to keep it constant during the process (or to change it in a prescribedway) the gas pressure needs to be changed, especially when the melt flow rate is altered byother process instabilities.
An empirical spray forming process model, describing the relationship between processparameters and the resulting product quality, has been introduced by Payne et al. (1993).As a suitable base for process control, modern sensors and neural networks have beenintroduced for monitoring purposes. Based on a small number of test runs, a neural networkhas been trained for analysis and control of the spray forming process for production oftubular elements. The main measurement parameters are: the exhaust gas temperature;estimation of the surface roughness; and porosity of the sprayed product during the process.Control parameters to be measured and controlled are: the GMR, which is dependent on theatomizer gas pressure; the melt flow diameter; and the external spray-chamber pressure. Inaddition, the withdrawal rate and the rotational speed of the tube, the spray height and themelt temperature are also measured. For suitable process control, Payne et al. (1993) haveidentified:
� directly controllable process parameters: e.g. spray time, melt temperature and GMR;� indirectly controllable process parameters: e.g. exhaust gas temperature, deposit surface
roughness and porosity.
Rebis et al. (1997) introduced a simulation program aimed at the development of aproduction rule and control strategy for manufacturing of spray formed products whosegeometries are based on computer-aided design (CAD) and upon the material properties ofthe alloy used. Therefore, four modelling segments are introduced:
19 2.2 Division of spray forming into subprocesses
(1) a planning system based on neural networks that connects the input parameters toresulting product quality;
(2) a generation program based on step (1) that derives, based on the plant parameters(including robot data and spray parameters), the operational parameters of the process;
(3) a module for process simulation based on the work on process modelling at DrexelUniversity (Cai, 1995), which aims to prescribe the three-dimensional geometry of thespray formed product (based on spatial and temporal averaged-distribution of the massflux of the particles in the spray, the compaction efficiency and spatial movement of thespray and substrate);
(4) a graphical tool for model and process visualization.
Evaluation of a relatively simple process modelling experiment for development of a morecomplex process simulation model, describing the spray conditions within the spray formingprocess in relation to the remaining porosity inside the sprayed deposit, has been describedby Kozarek et al. (1998). These experimental models, their derivation and describing processparameters, have been chosen based on simulations of the mean solidification ratio ofimpinging spray droplets. Process parameters which have been taken into account are:
� the atomizer gas pressure;� the GMR;� the spray distance between atomizer and substrate;� the mean droplet velocity, and the mean droplet size; as well as� melt superheating.
The operation window for minimization of the porosity has been derived from the model,based on a transient particle tracking within the spray. Based on the results of the model,proposals for scaling-up spray forming process into larger dimensions have been made.These authors identify the thickness of the mushy layer (semi-solid area) at the top of thedeposit as a key process control mechanism. A model-based algorithm is proposed for thiscontrol process.
Bergmann et al. (1999a,b, 2000) use numerical modelling and simulation to determine theoperational mechanisms of individual process and operational parameters affecting thermalbehaviour within pure copper (Cu) and steel (C30 and C105) spray forming processes. Theydivide the spray forming process of metallic preforms into:
� melt flow in the tundish,� spray flow, and� compaction and cooling of the deposit.
Bergmann and coworkers combine these subprocesses to defined an integral model. Byvarying model parameters, common properties and their relationships during the thermalbehaviour of the material are obtained. The starting point for the investigations is thehypothesis that, especially during spray forming of high-volume products such as billets,residence time variations of material elements at different temperature levels within thespray formed product (and the related distribution of the solidification velocity of different

20 Spray forming of metals
material elements) result in an inhomogeneous distribution of properties in the material.For example, if the cooling velocity is too low, recrystallization processes may occur andthereby grain coarsening will result, which is an undesired quality of spray formed products(Jordan and Harig, 1998). In addition, spatial distribution of the cooling behaviour of billetsmay cause thermal and residual stresses that may result in hot cracks inside the deposit.Commercial fabricators of spray formed billets are aware of such problems. A straightfor-ward control mechanism to improve the spray forming process has not been identified yet. Acommon phenomenon during spray forming of copper is the establishment of high-volumeareas within the product of increased porosity, and are called ‘cauliflowers’ from visualobservation of their macrostructure (Jordan and Harig, 1998). For description and analysisof the transient behaviour of the thermal history of spray formed products, Bergmann (2000)derived (based on the work of Zhang (1994)) an integral thermal model of the spray form-ing process. This model describes the thermal history of a melt element. This analysis ofthermal history begins with the temperature level in the tundish, via the flow in the tundish,to the atomizer nozzle; and, next, look at the solidification behaviour of melt droplets inthe spray down, at the impact onto the deposit and at subsequent consolidation and coolingwithin the sprayed product. Results from each preceding process step are transferred to themodel of the next process step as a boundary condition (see Chapter 7).
Chapter 2 illustrates that it is possible to derive a general model for spray forming, whichmost researchers have subdivided into three main subprocesses. A more detailed divisioninto eleven steps, as examined in Section 2.2, is possible and provides a somewhat moregeneral and individual assessment from a process technology viewpoint. This subdivision isbased on the specific research areas where most of the work has been conducted. A somewhatdifferent subdivision is possible and, in other spray applications, sometimes even stronglydesired (based on the aim of the model and the expected precision of the results). Despitethe different viewpoints, recognition of the common characteristics of all spray formingprocesses is the main reason for modelling the multiphase flow properties correctly. This isthe main focus of this book.

3 Modelling within chemical and processtechnologies
The successive steps involved in spray modelling and simulation within chemical andprocess technologies may be characterized by a single common scheme, which is illustratedin Figure 3.1.
Physical modelHaving divided the process or system into modular subprocesses (see Section 2.2), thestarting point for any modelling procedure is the identification and derivation of the mainphysical mechanisms of each individual process step. For this derivation, balances of phys-ical properties are to be performed which, for example, yield conservation equations forthe main physical transport and exchange parameters (normally in terms of ordinary andpartial differential equations) involved. For analysis of the main multiphase flow propertiesinvolving heat transfer and phase change within atomization and spray processes, the gen-eral continuum mechanics conservation and transport equation formulation can be writtenas:
∂
∂t(ρ�) + ∂
∂x(ρug�) + 1
rγ
∂
∂r(ρrγ νg�) − ∂
∂x
(�
∂�
∂x
)− 1
rγ
∂
∂r
(rγ �
∂�
∂r
)= S� − S�p , (3.1)
where � is the general transport variable, � is the diffusivity of the transport value and Sis a synonym for the related source or sink terms . This conservation equation reflects theinfluence of transient behaviour, convective and diffusive transport, as well as productionand dissipation of the transported variable �. The source terms in the present contextcan be referred to as follows. The source S� identifies the inner phase sources or sinks(e.g. pressure) and the term S�p identifies those sources that result from coupling of thecontinuous phase to the dispersed phase in two-phase flow. This general transport equationis valid within a two-dimensional plane (x–y) or cylindrical (x–r) coordinate system. Forcylindrical coordinates, γ = 1; and for Cartesian plane coordinates, γ = 0.
In addition, for common flow simulations an appropriate turbulence model is used. Inthis book, mainly two-dimensional processes are studied. Extension of the proposed meth-ods into three dimensions is possible, but because of the great computational power that isneeded, extension in most cases is not desirable. Therefore, for analysis of two-dimensional,single or multiphase turbulent continuum flows with heat transfer, the well-establishedk–ε model for turbulence behaviour (Launder and Spalding, 1974) is mostly used.
21

22 Modelling within chemical and process technologies
Table 3.1 Terms used in the general conservation equation (3.2)
� S� S�P �
1 — — —
ug∂
∂x
(�
∂ug
∂x
)+ 1
r γ
∂
∂r
(�r γ ∂vg
∂x
)− ∂p
∂x+ ρgx Sp,x µeff
vg∂
∂x
(�
∂ug
∂r
)+ 1
r γ
∂
∂r
(�r γ ∂vg
∂r
)− ∂p
∂r− 2�γ vg
r 2Sp,r µeff
hg — Shµeff
σh
k Gk − ρε —µeff
σk
εε
k(c1Gk − c2ρε) —
µeff
σc
......
boundaryconditions
sub models
......
boundaryconditions
sub models
physicalmodel
basic equations
......
discretisation
gridstructure
......
discretization
grid structure
numericalmodel
transformation
......
parallelisation
programming
......
parallelization
programming
algebraicsolution
solution
......
animation
presentation
......
animation
presentation
visualization
evaluation
Fig. 3.1 Flow diagram of modelling of chemical engineering processes
Therefore, in summary, the terms in the general conservation equation (3.2), are defined inTable 3.1.
In this context, the transport variables are: � = 1 for mass conservation, ug and vg arethe velocity components for momentum conservation, hg is the conservation of specificenthalpy of the liquid for thermal energy conservation, k is the turbulent kinetic energy andε is the dissipation rate of the turbulent kinetic energy. The source term Gk in the turbulenceconservation equation of k is formulated as:
Gk = µeff
{2
[(∂ug
∂x
)2
+(
∂vg
∂r
)2
+(
γ vg
r
)2]
+(
∂ug
∂r+ ∂vg
∂x
)2}
. (3.2)

23 Modelling within chemical and process technologies
The effective viscosity µeff (total turbulent viscosity based on a Boussinesq approximation)is described in the k–ε model by the sum of the (material dependent) viscosity µ and the(flow-field-dependent) turbulent viscosity µt:
µeff = µ + µt = cµρk2
ε. (3.3)
The standard coefficients of the k–ε model are:
cµ c1 c2 σk σε σh
0.09 1.44 1.92 1.0 1.3 0.9,
where the first five coefficients are within the turbulent kinetic energy and dissipation rateequations and σh is the turbulent Prandtl number, relating the turbulent diffusive transportof thermal energy to viscous diffusive transport.
The classical, well-known conservation equations found in textbooks (see e.g. Bird,Stewart and Lightfoot, 1960) sometimes need to be completed by specific submodels fordescription of specific flow conditions or physical subprocesses. In the present context, forexample, the source terms for phase change during solidification of the metal melt need tobe adequately formulated and added. For proper transfer of the modelling approach to otherprocesses, these submodels need to be derived and formulated in the most general way. Inmost cases, such submodels are derived from theoretical approaches in connection with theresults of well-defined experimental investigations; and, more recently have been derivedfrom detailed (direct) numerical simulations.
Another very important part of a physical process model is the formulation of suitableinitial (starting) and boundary conditions for the specific conservation variables, which needto be properly fitted to the process under investigation.
Numerical modelWithin simulations, transfer of the fundamental conservation equations describing the pro-cess into a system of algebraic equations that can be solved by mathematical methods isthe task of numerical mathematics. Efficient algorithms and solution strategies need to beapplied, which keep in mind the subsequent computer-based algebraic solution of the set ofequations. Most popular and well-distributed discretization processes in the frame of single-or multiphase continuum flows are based on discretization of the differential equations infinite differences, finite volumes or finite elements. Several possibilities exist to discretizeconservation equations properly in order to conserve their contents and guarantee numer-ical accuracy and stability. The different methods of discretization and implementation ofnumerical models will not be introduced in detail here. Introduction and comparison ofnumerical models in the context of the physical modelling to be done here is documentedin fundamental literature:
� for example, with respect to the fundamentals of fluid dynamics simulation (or computa-tional fluid dynamics, CFD) in the contributions of Fletcher (1991) or Ferziger and Peric(1996);

24 Modelling within chemical and process technologies
� for application of numerical methods for computing fluid flow in boundary fitted coordi-nate systems see Schonung (1990);
� for simulation of heat and momentum transport processes see the fundamental work ofPatankar (1981);
� in the area of dispersed multiphase flow see Crowe et al. (1998), as well as Sommerfeld(1996);
� for some applications of simulation within atomization modelling of metal melts see Yuleand Dunkley (1994) and Dunkley (1998).
In the area of numerical simulation and the solution of fundamental conservation equa-tions, the role of commercial, or freeware and shareware programs (to be distributed, forexample, via the internet), has tremendously increased in recent years. Relevant informa-tion on fundamentals, literature, simulation programs and other information on simulationof fluid flow (CFD) can be found, for example, at the excellent and informative home-page of Chalmers University at: www.cfd.chalmers.se/CFD-Online/ (see Useful web pages,p. 269).
The main advantages of using so-called multipurpose or specifically designed commer-cial programs are the rapid access and (mostly) easy usage of these programs. Hereby,several technical processes may be analysed with quick success. The development of suchprogram systems is based on a great amount of knowledge and experience as well as man-power. Such commercial programs are suitable for a number of applications and boundaryconditions where the amount of calculations necessary is discouraging. However, the dis-advantage of most commercial simulation programs is their ‘black-box character’. Often,the modelling fundamentals, solution strategies and algorithms are not well described anddocumented. Missing, or difficult to derive, extensions of such programs to one’s own sub-models, make application for specific boundary conditions and purposes hard to achieveand limits the application of such codes. The term general-purpose code also often meansthat commercial programs are not up-to-date within specific applications, processes anddevelopments. Sometimes it is even recommended that program developers do not adopteach proposed trend, as new model developments need to be tested carefully, based on anumber of reference cases, before being introduced into a general code. However, programsfor specific processes are mostly developed in universities and research institutes, and there-fore have better application. The pros and cons of application of commercial software forsimulation purposes is fundamental, but needs to be evaluated from application to applica-tion. Some guidance by experienced modellers, simulation program users and developersis needed in the decision process to find a suitable simulation program. It needs to be saidthat commercial program systems in no way lead to better or worse results than specificin-house codes developed on one’s own. Both approaches are, generally, based on identicalconservation laws and numerical methods. The accuracy of results is mostly influenced bytaking account of all necessary physical preconditions and boundary conditions of suit-able submodels. Often, relevant physical subtasks are simplified or neglected or not takeninto account, simply because of lack of data, or no models are available, or the specificmodels do not sufficiently represent the physical behaviour to be described. The numerical

25 Modelling within chemical and process technologies
and computational efficiency of commercial programs is, in most cases, better than that ofspecifically developed in-house codes.
In this book, several kinds of computer codes and programs will be described and havebeen used for simulation. Commercial programs for analysis of multiphase flow behaviourare used, such as PHOENICS (Rosten and Spalding, 1987), FLOW3D (now called CFX;Computational Fluid Dynamics Services, 1995), RAMPANT (Rampant, 1996), FLUENT(creare.x Inc, 1990), STAR-CD (Computational Dynamics Ltd, 1999), FLOW-3D (FlowScience, 1998) and others in different versions. Also, specifically developed and pro-grammed in-house codes from the author’s research group for simulation of dispersedmultiphase flow and heat transfer problems have been used (see Useful web pages, p. 269).The transition between both types of codes and simulation approaches is floating.
Algebraic solutionThe result of the numerical model is a set of (in most cases linear) algebraic equations. Thishuge set of equations needs to be approached and solved by efficient numerical equationsolvers (see e.g. Barrett et al., 1994). The resources necessary to handle such equationsystems are increasingly given by computer power, but can also be determined by distribut-ing the algebraic solution onto several processors within a parallel or cluster machine. Inorder to apply parallel solution strategies, suitable numerical discretization schemes needto be applied in the foregoing numerical modelling step. In addition to classical parallelmachines, concepts of workstation or PC clustering come into focus nowadays, e.g. basedon the Beowulf concept (Sterling et al., 1999).
VisualizationThe enormous amount of data derived as a result of the algebraic solution represents thedistribution of all relevant variables at discrete grid points within the numerical grid system.These huge data sets need to be filtered and properly condensed in order to derive user-dependent and relevant properties of the simulated physical process. This simulation stepis called post-processing. Here, two- or three-dimensional methods and transient animationand data visualization may be used. Without sophisticated visualization tools, adequate eval-uation of the huge data sets cannot be realized (see Baum, 1996) for engineering purposes.Commercial tools are available in this area also, which have been especially developed forvisualization of numerical simulation data (see Useful web pages, p. 269).

4 Fluid disintegration
Having divided the atomization and spray process modelling procedure into three mainareas:
(1) atomization (disintegration),(2) spray, and(3) compaction,
in this chapter we look specifically at the disintegration process as it applies to the caseof molten metal atomization for spray forming. We begin by breaking down disintegrationinto a number of steps:
� the melt flow field inside the tundish and the tundish melt nozzle,� the melt flow field in the emerging and excited fluid jet,� the gas flow field in the vicinity of the twin-atomizer,� interaction of gas and melt flow fields, and� resulting primary and secondary disintegration processes of the liquid melt.
Several principal atomization mechanisms and devices exist for disintegration of moltenmetals. An overview of molten metal atomization techniques and devices is given, forexample, in Lawley (1992), Bauckhage (1992), Yule and Dunkley (1994) and Nasr et al.(2002). In the area of metal powder production by atomization of molten metals, or in thearea of spray forming of metals, especially, twin-fluid atomization by means of inert gasesis used. The main reasons for using this specific atomization technique are:
� the possibility of high throughputs and disintegration of high mass flow rates;� a greater amount of heat transfer between gas and particles allows rapid, partial cooling
of particles;� direct delivery of kinetic energy to accelerate the particles towards the substrate/deposit
for compaction;� minimization of oxidation risks to the atomized materials within the spray process by use
of inert gases.
A common characteristic of the various types of twin-fluid atomizers used for molten metalatomization is the gravitational, vertical exit of the melt jet from the tundish via the (oftencylindrical) melt nozzle. Also, in most cases, the central melt jet stream is surrounded bygas flow from a single (slit) jet configuration or a set of discrete gas jets, which flow in adirection parallel to the melt flow or at an inclined angle to the melt stream. The coaxial
26
27 Fluid disintegration
Freifall Zerst ube r "close coupled" Zerst uber
Schmelze
Schmelze
Gas
Gas
liquidgas
close-coupled atomizer free-fall atomizer
liquid
aaav
Freifall Zerst ube r "close coupled" Zerst uber
Schmelze
Schmelze
Gas
Gas
liquidgas
close-coupled atomizer free-fall atomizer
liquid
gas
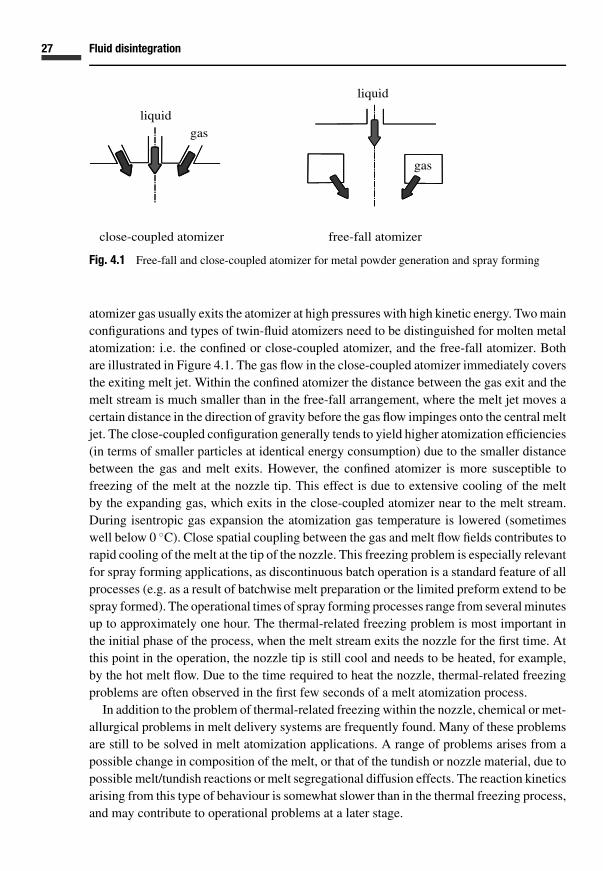
Fig. 4.1 Free-fall and close-coupled atomizer for metal powder generation and spray forming
atomizer gas usually exits the atomizer at high pressures with high kinetic energy. Two mainconfigurations and types of twin-fluid atomizers need to be distinguished for molten metalatomization: i.e. the confined or close-coupled atomizer, and the free-fall atomizer. Bothare illustrated in Figure 4.1. The gas flow in the close-coupled atomizer immediately coversthe exiting melt jet. Within the confined atomizer the distance between the gas exit and themelt stream is much smaller than in the free-fall arrangement, where the melt jet moves acertain distance in the direction of gravity before the gas flow impinges onto the central meltjet. The close-coupled configuration generally tends to yield higher atomization efficiencies(in terms of smaller particles at identical energy consumption) due to the smaller distancebetween the gas and melt exits. However, the confined atomizer is more susceptible tofreezing of the melt at the nozzle tip. This effect is due to extensive cooling of the meltby the expanding gas, which exits in the close-coupled atomizer near to the melt stream.During isentropic gas expansion the atomization gas temperature is lowered (sometimeswell below 0 ◦C). Close spatial coupling between the gas and melt flow fields contributes torapid cooling of the melt at the tip of the nozzle. This freezing problem is especially relevantfor spray forming applications, as discontinuous batch operation is a standard feature of allprocesses (e.g. as a result of batchwise melt preparation or the limited preform extend to bespray formed). The operational times of spray forming processes range from several minutesup to approximately one hour. The thermal-related freezing problem is most important inthe initial phase of the process, when the melt stream exits the nozzle for the first time. Atthis point in the operation, the nozzle tip is still cool and needs to be heated, for example,by the hot melt flow. Due to the time required to heat the nozzle, thermal-related freezingproblems are often observed in the first few seconds of a melt atomization process.
In addition to the problem of thermal-related freezing within the nozzle, chemical or met-allurgical problems in melt delivery systems are frequently found. Many of these problemsare still to be solved in melt atomization applications. A range of problems arises from apossible change in composition of the melt, or that of the tundish or nozzle material, due topossible melt/tundish reactions or melt segregational diffusion effects. The reaction kineticsarising from this type of behaviour is somewhat slower than in the thermal freezing process,and may contribute to operational problems at a later stage.

28 Fluid disintegration
Free-fall atomizers are much less problematic than close-coupled atomizers in terms ofthermal freezing processes, as the melt jet stream and gas stream are well separated at theexit of the melt from the delivery system (tundish exit). Therefore, cooling of the melt dueto cold gas occurs at a later point in the system than within close-coupled atomizers. Anadditional advantage of the use of a free-fall atomizer in spray forming, is that controlledmechanical or pneumatic scanning is possible and, therefore, the gas atomizer oscillateswith respect to one axis. Also, the spatial distribution of gas jets within the nozzle canbe modified during atomization. By doing so, the free-fall atomizer provides an additionaldegree of freedom with respect to control and regulation of the mass flux distribution ofdroplets in the spray. In other atomizer nozzle systems, this important physical property ofthe spray can (within a running process) only be influenced by changing the atomizer gaspressure. By controlled scanning of the nozzle, the mass flux can also be distributed over acertain area (necessary, for example, for flat product spray forming).
4.1 Melt flow in tundish and nozzle
q
m1
•
•
q
In spray forming, the melt is delivered continuously to the tundish and the melt nozzle.The exit velocity of the metal melt depends on the pressure in the tundish (mostly ambient)and therefore on the metallostatic height of the melt in the tundish only (for a predefinedmaterial density). Therefore, the melt mass flow rate depends on the size of the nozzleexit, the density of the melt and the exit velocity of the melt. The metallostatic height isgoverned and kept constant within the process by automatic control procedures or manualobservation and regulation. Analysis of the liquid flow field inside an atomization nozzleis an important condition for derivation and assessment of the disintegration model duringatomization (see Loffler-Mang, 1992). Within spray forming, investigation of the exit flowcondition of the melt also derives information about:
� conditions that may lead to thermal-related freezing of the melt within the nozzle,� the geometry of the melt stream and its kinetic and thermal state during flow from the
melt nozzle tip downstream into the atomization zone below the atomizer.

29 4.1 Melt flow in tundish and nozzle
4.1.1 Melt flow inside the nozzle
Besides nozzle geometry, the most important input parameters required to model tundishflow are the mass flow rate and the temperature of the melt. The mass flow rate, related tothe metallostatic height of the melt within the tundish, is given as:
ml = ϕ Aoutρl
√2gh, (4.1)
where ϕ is the friction or velocity number of the nozzle, describing losses due to frictionand vortex formation. In experimental investigations of the flow behaviour in spray formingapplications, for typical tundish and nozzle systems with model fluids, Bergmann (2000)found that the velocity number depends on the Reynolds number only:
ϕ = 1 − 7.96√Re
. (4.2)
From this correlation, it can be deduced that, during spray forming and atomization, themass flow rate of a steel melt passing through a typical tundish, e.g. at a typical Reynoldsnumber of Re = 10 000, can deviate by as much as −10% from the ideal (frictionless)value. Deviations from inviscid theory of that order are typically found during experimentalinvestigations on spray forming processes (Bergmann, 2000).
Besides mass flow rate and mean velocity, the local flow structure of the melt in the tundishand at the melt exit from the tundish, as well as during free-fall flow into the atomizationarea, is of importance, as it controls some of the main features of the atomization processand its results (e.g. the drop-size distribution in the spray). During flow of the melt intothe atomization area, an important parameter is the changing geometrical dimension ofthe melt jet or sheet (the latter, for example, also applies to swirl pressure atomizers, seeLampe, 1994). In addition, the velocity distribution and turbulence structure within the meltjet stream contribute to wavelength interactions between the melt and gas that initiate thedisintegration process.
In spray forming, knowledge of the temperature and velocity distribution at the exitnozzle of the melt is of special interest, as discussed previously. This is the region wherethermal freezing may occur. In order to prevent freezing, superheating in the crucible, priorto pouring of the melt into the tundish, can be considered. The temperature to which themelt must be heated is evaluated from the heat loss of the melt inside the tundish and at themelt nozzle. To calculate the fluid and heat flow dynamics of the melt, simultaneously withthe heat conduction process within the solid material of the tundish and the nozzle wall, theso-called conjugate heat transfer problem needs to be solved. In this way, the transition fromheat conduction in the solid material to heat transport in the adjacent liquid is not coupledto a predetermined heat transfer coefficient. The derivation of the heat transfer value acrossthe wall is part of the numerical solution of the coupled problem. As boundary conditions,only the continuous temperature distribution (no jump) and matching of the heat fluxes onboth sides, within the inner side (fluid) and the outer side (wall), need to be prescribed. In

30 Fluid disintegration
the case of laminar flow behaviour, this can be done by:
qi = λidT
dn
∣∣∣∣i
= λadT
dn
∣∣∣∣a
= qa . (4.3)
For calculation of the conjugate heat transfer problem in turbulent flows, appropriate bound-ary conditions (wall functions) dependent on the turbulence model used need to be appliedto the fluid side. These are normally prescribed in terms of logarithmic wall functions.
Exact fulfilment of all physical boundary conditions cannot often be realized during mod-elling and simulation. For successful calculation, simplifying approximations and boundaryconditions need to be derived and applied. The influence of inexact representation of bound-ary conditions on the result of the calculation must be negligible or small, or should beunimportant for the aim of the investigation. At the very least, the influence of simplificationshas to be carefully evaluated, as exactly as possible. In the present case, such simplifyingassumptions and boundary conditions for the tundish simulation are:
� Only steady-state cases of fluid flow and heat transport and transfer will be regarded.� Material properties are assumed to be constant within the range of varying temperatures.
A steel is taken as the standard melt material, and its temperature at the free surface(upper boundary of the tundish model) is assumed to be constant at a superheating of50 ◦C above the specific melting temperature. At the upper geometric boundary (tundishtop), a constant temperature profile of the inflowing melt, not varying with radius, isassumed.
� Possible solidification effects of the melt by cooling below the solidus temperature (e.g.on melt viscosity) are not taken into account; only the amount of subcooling will beanalysed; and the melt is always regarded as fluid.
� Flow is assumed to be in a laminar state. Highest local Reynolds numbers of the meltflow are achieved at the tip of the tundish exit (at the point of the smallest flow area). Heremaximum Reynolds numbers of up to Re = 10 000 may be achieved, but only at a verysmall length scale, where laminar/turbulent transition of the flow is not realistic.
In an investigation by van de Sande and Smith (1973) on the influence of nozzlegeometry on the critical intake length of fluid jets during pressure atomization, the criticalReynolds number for transition from laminar to turbulent flow is:
Recrit = 12 000
(l
d
)−0.3
. (4.4)
This critical Reynolds number is not reached in all flow situations and materials withinspray forming.
� In the example of tundish modelling presented here, simplified tundish geometry is used,derived from approximated tundish geometries in the Bremen trial spray forming plants.The main geometrical parameters of this model are illustrated in Figure 4.2 and listed inTable 4.1.
� The influence of the cooling effect due to primary gas flow on the melt stream in theconical part of the tundish exit is taken into account in an integral approach. Therefore, at

31 4.1 Melt flow in tundish and nozzle
Table 4.1 Geometry of the tundish
d1 [mm] d2 [mm] h1 [mm] h2 [mm]
4 28 5 90
d
h1
h
2
primary
uin
d
d1
2
2
λ1
λ2λ3
T = const.
primary gas
α = α1
α = α2
Fig. 4.2 Boundary conditions for modelling the flow in the tundish
the lower radial circumference of the tundish (upper cylindrical area), adiabatic boundaryconditions are assumed.
� The gas flow is rapidly cooled due to its expansion from the high prepressure in the plenumto the exit pressure within the primary gas flow nozzles. Based on the assumptions thatthe gas has ambient temperature in the primary gas plenum prior to expansion and thatthe expansion process is described by an isentropic change of state of the gas:
Tg = Tu
(p0
pu
) κ−1κ
, (4.5)
the temperature of the gas may achieve levels well below 0 ◦C. It is assumed that thespecific section of the wall directly at the primary gas exit will have the same temperatureas the gas flow in that region.
� At the free tip of the tundish, constant heat transfer coefficients to the gas are assumed asα1 = 500 W/m2 K and α2 = 100 W/m2 K.
� The materials comprising the conical exit tube of the tundish and the tundish itself areidentical, and are made from the same ceramics (e.g. Al2O3), having a heat conductioncoefficient of λ1 = λ2 = 2.3 W/m K. The tundish is embedded into an isolation layermade of graphite–hard felt with a heat conduction coefficient of λ3 = 0.25 W/m K.

32 Fluid disintegration
1.8035E+031.5262E+031.4489E+031.2716E+031.0943E+039.1698E+027.3967E+02
Primary gas
melt
Re = 1000
velocity [m/s]
2.5098E−012.0913E−011.6731E−011.2548E−018.3653E−024.1827E−020.0000E+00
temperature [K]
Fig. 4.3 Temperature and velocity distribution in the tundish
� At the free tip of the tundish, convective heat transfer to the gas is much greater thanheat loss due to radiation (for an assessment see Andersen (1991)). Therefore, radiationis neglected at the free boundary.
An example of the results calculated from the above tundish model is shown in Figure 4.3.Here only a magnified view of the conical part of the tundish tip is to be seen. On theleft-hand side of the figure the temperature distribution is shown as isolines inside the fluidand the solid material. The right-hand side of Figure 4.3 illustrates the calculated velocitydistribution of the melt in vector format. This calculation has been done for Re = 1000(with respect to the state at the tundish tip Re = ua(dl/ν l), where the mean exit velocity ua
is averaged from the flow rate). It can be seen that the primary gas flow acts as the mainthermal energy sink in that system and that great temperature gradients may result at thetip of the tundish.
Normalized velocity profiles of the melt flow at the tundish exit for different Reynoldsnumbers are illustrated in Figure 4.4. Normalization of the velocity profiles is done throughthe volumetric-averaged velocity for each Reynolds number. The influence of wall frictionand the establishment of boundary-layer-type flow in the vicinity of the wall are small inthe spray forming range of interest for Re > 5000. Here the velocity profile is almost flatin the main region in the centre of the tundish exit tube. The theoretical length over whicha fully developed parabolic velocity profile is achieved during tubular flow is:
l/d = A ReB, (4.6)
where the coefficients are A = 9.06 and B = 1 (Truckenbrodt, 1989). From the length/diameter aspect ratio of the melt tube exit in the present case (l/d = 1.25), it can be statedthat fully developed velocity profiles may be achieved for small Reynolds numbers only(Re < 20).

33 4.1 Melt flow in tundish and nozzle
0 0.2 0.4 0.6 0.8 1
radius r/R [-]
0
0.5
1
1.5
2ve
loci
tyu
/U [
-]
Reynolds number50 000 10 000 5000 1000 500 100
Fig. 4.4 Velocity distribution in the tundish tip
0 0.2 0.4 0.6 0.8 1
radius r/R [-]
0
50
−50
−100
−300
−250
−200
−150
tem
pera
ture
(T−
T0 )
[K
]
Reynolds number50 000 10 000 5000 1000 500 100
Fig. 4.5 Temperature distribution in the tundish tip
Figure 4.5 shows the calculated temperature distribution of the melt at the tundish exittogether with the calculated wall temperatures for different Reynolds numbers. Obviously,the thermal energy content of the melt is so high that remarkable cooling effects can bedetermined only for very small Reynolds numbers.
With respect to the spray forming process it needs to be mentioned that the discontinuousbatch process in which spray forming is operated, especially in the transient phases (whichfrequently occur in the beginning of each spray run before a steady-state temperature levelis achieved and in the end phase of each spray run when the pouring crucible is emptied),leads to small exit velocities of the melt and therefore small Reynolds numbers. In sprayforming practice, the starting phase of each spray forming run is typically initiated withoutany atomizer gas flow in order to achieve sufficient heating of the tundish walls from thepoured melt. Before the atomization process begins, by adding gas to the process and thereby

34 Fluid disintegration
10 100 1000 10 000 100 000
Reynolds number [-]
0
50
100
150
200av
erag
e te
mpe
ratu
re d
ecre
ase
[K]
conductivity [W/m K]2.3 10 50
λ
Fig. 4.6 Mean temperature in the tundish for different melt materials
causing an intense cooling in the vicinity of the nozzle, a sufficiently high Reynolds numberis reached.
The dependence of the averaged melt cooling rate, between the inflow into the tundish andthe exit from the bottom of the tundish (averaged over the flow area), on Reynolds numberis shown in Figure 4.6. Here, heat conductivity of the tundish material λ1 is chosen as thevariable parameter under investigation. Using tundish materials with higher conductivity,the assumed superheating of the melt is sufficient for Reynolds numbers Re > 200, whichresult in melt temperatures at the tundish exit which still exceed the solidus temperature ofthe melt. Because of flat temperature profiles and small radial temperature gradients withinthe flowing melt (due to the high conductivity of the melt), the averaged temperature acrossa cross-section of the melt is a suitable measure for estimation of the freezing potential ofthe melt.
Comparison of simulated results with experimental values is often necessary for valida-tion and to check the accuracy of the modelling approach. In addition, comparison withclassical analytical solutions may be helpful for the interpretation of model simulationresults. In the aforementioned problem of melt flow cooling in the tundish, the modellingresults in the tundish tip can be compared to fully developed thermal flow in an idealhydrodynamic tube, within a cylindrical segment 5 mm in length (the end of the tundish).It is assumed that cooling occurs over the outer tube walls. Thermal balancing results in adifferential equation for the temperature distribution (Anderson, 1991):
− mcp
2πra
dT
dx= αa
[T + mcp
ln(ra/ri )
2πλ
dT
dx− Tu
]. (4.7)
Analytical solution of Eq. (4.7) gives:
T (x) = (Tin − Tu) exp
⎡⎣ −2πx
mcp
(1
αara+ ln(ra/ri )
λ
)⎤⎦ + Tu . (4.8)

35 4.1 Melt flow in tundish and nozzle
1 10 100 1000
heat conductivity [W/m K]
0
10
20
30
40av
erag
e te
mpe
ratu
re d
ecre
ase
[K] Reynolds number
500 1000 ==> tundish flow
500 1000 ==> ideal tube
Fig. 4.7 Mean temperature in the tundish: comparison to theoretical solution
Comparison of analytical and numerical solutions is done in Figure 4.7 for two differentReynolds numbers. It can be seen that the simulated averaged cooling rate of the melt forthe whole tundish segment is twice as high as the cooling rate calculated from the analyticalsolution, which is valid within the short cylindrical tip element of the pouring tube only,while the simulation covers the whole tundish area.
4.1.2 Fluid jet
Analysis of the two-fluid flow field before atomization of the melt (coaxial flow of gas andmelt) illustrates a flow situation with a relatively small phase boundary (interface) betweengas and melt (in comparison to the large phase boundary in the dispersed two-phase flowwithin the spray after atomization). This area is of special interest for those atomizersthat transport and deform the fluid jet or sheet before disintegration occurs (prefilmingatomizers). In this continuum flow situation, the fluid is often accelerated and the jet or filmthickness is thereby decreased. The instability that finally leads to disintegration of the meltis enhanced in this way (see e.g. Gerking, 1993; Schulz, 1996). In metal melt atomization forspray forming application, besides twin-fluid atomization with inert gases, rotary atomizersare sometimes also used (involving centrifugal spray deposition, CSD). Zhao et al. (1996a)have described the behaviour of a melt film on a rotating disc with respect to film thicknessand velocity distribution. The potential of CSD is limited to ring and tubular deposits and,therefore, suitable only for some specific spray forming applications.
Calculation of two-fluid flows with a continuous phase boundary is possible in severalarrangements based on different modelling concepts for the solution of conservation equa-tions. In addition, as essential submodels, suitable methods for transient calculation of themovement and geometry of the phase boundary and inclusion of surface tension effectsneed to be derived.

36 Fluid disintegration
Marker and cell method (MAC)Within the marker and cell (MAC) method, the computational domain where the two-phaseflow is to be described is at first divided into spatially fixed discrete elements or volumes.These grid cells reflect the numerical solution of conservation equations. Each grid cell ischaracterized by its volumetric fluid content (as the ratio of volume of fluid to volume ofgas within a cell):
� f (full cell) or αf = 1, for totally fluid filled grid cells;� b (boundary cell) or 0 < αf < 1, for partially filled grid cells on the phase boundary;� e (empty cell) or αf = 0, for empty grid cells (totally gas filled).
Dependent on the local volumetric fluid content, the conservation equations for mass andmomentum of the fluid are numerically solved in the totally filled grid cells (α f = 1). Withinthe partially filled grid cells, boundary conditions are applied that are based, for example,on vanishing tangential stresses at the phase boundary:
∂ut
∂xt= 0. (4.9)
When surface tension effects are neglected, the normal stress at the phase boundary isrelated to the local pressure only:
p = pu . (4.10)
The gas flow field and its exchange with the fluid flow, and also its effect on the phaseboundary distribution, are not taken into account within this model (see Reich and Rathjen,1990).
Transient calculation of the phase boundary geometry, within the MAC method, is basedon a simple interface tracking of marker particles. These marker particles are initiallypositioned continuously on the phase boundary and are tracked as passive tracers whosepositions are determined by the calculated velocity distribution within the liquid whenthe flow field evolves. The local velocity value at the position of the marker particle isderived from neighbouring grid cells by interpolation (see Welch et al., 1966; Hirt et al.,1975). The MAC method, in general, is complicated to handle, as it needs proper adding orrearrangement of the marker particles in strain interface flows, which conventionally needsto be done manually.
Volume of fluid (VOF) methodBy far the most popular method of modelling two-fluid situations with continuous phaseboundaries is based on a full representation of both fluids in a Euler/Euler model. Here theconservation equations (mass, momentum and thermal energy or mass balances, as wellas turbulent kinetic energy and dissipation rate) are derived and solved for both phasesseparately. In the derivation of this modelling approach, the conservation equations (seeEq. (3.1)) are multiplied by the corresponding volumetric contents αg and αf, respectively,of both phases and the additional algebraic constraint is:
αg + α f = 1. (4.11)

37 4.1 Melt flow in tundish and nozzle
Exchange of momentum, thermal energy or mass (transfer rates) is achieved by suitableapproaches, which are incorporated as source or sink terms into the conservation equations(Spalding, 1976).
The volume of fluid (VOF) method (see Nichols et al. (1980), Torrey et al. (1985, 1987))characterizes the state of the phase at each point in the flow field by introducing the localvolume ratio of liquid and gas F as a characteristic scalar function. With respect to its state:
� Ff = 0, for empty cells;� 0 < Ff < 1, for partially filled cells at the phase boundary; and� Ff = 1, for entirely liquid filled cells.
Conservation of the volumetric gas/liquid ratio and the geometry of the phase boundary aredescribed by the convection equation:
∂ Ff
∂t= −∇(uFf ). (4.12)
Minimization of numerical diffusion effects is necessary in this method and is done, forexample, by reconstruction algorithms especially developed for taking surface tensioneffects into account (Karl, 1996).
Simplification: homogeneous two-phase modelA simplification of the Euler/Euler model for analysis of multiphase flows is based on ahomogenization approach. In this approach, a common field distribution (for example, acommon velocity distribution in the case of a laminar flow without heat and mass transfer)is defined for both phases. In cases where the coupling and the transfer rates between bothphases are important, the velocity and temperature distribution of such a two-phase flowis in thermal equilibrium and can be compared to a single-phase fluid. In this case, onlya single set of conservation equations for variable density (gas or fluid) and diffusivityis to be solved. The volumetric fluid content of each cell is calculated separately by twoindividual continuity equations. The geometry of the phase boundary is derived from thefilling function F, as in the VOF method.
Such a homogeneous two-phase model will be used here for analysis of the melt jetprior to atomization. It is a numerically easier to handle alternative than the fully coupledapproaches mentioned above for flow situations with two participating fluids and a clearlydetermined phase boundary.
Mathematical formulation of surface tension effects on the phase boundary may be basedon the continuum surface force model (CSF) of Brackbill et al. (1992) and Kothe andMjolsness (1992). This model describes the surface tension force as a continuous three-dimensional effect on the phase boundary, where the filling function has values between0 and 1. The force on the phase boundary due to surface tension σ is:
Fσ (x) = σκ0(x)∇Ff , (4.13)
where κ0(x, y, z) is the local surface curvature depending on the normal vector on the phaseboundary and ∇Ff is the gradient of the filling function.

38 Fluid disintegration
Other modelling approachesAnother modelling approach for continuous two-phase flows is based on the descriptionof fluid dynamics by the Boltzmann equation. Boltzmann models represent the fluids bya number of discrete particles that have their individual position and velocity marked onseveral grid layers (lattices). Following Shan and Chen’s (1994) approach, a two-fluidflow field is described by its potential and interaction of the particles with their individualneighbours through the resulting force:
F(x, t) = − G
δtψ f (x, t)
∑j
∑i
ψ f (x + e j iδt, t) e j i , (4.14)
for j grid lines with i velocities at each grid point (x, y, z) with respect to time. The parameterG is a measure of the strength of the interparticle forces and the function � f (x, y, z, t) isa function that needs to be chosen based on the fluid density with respect to the equationof state of the gas phase. On a small-scale base, the behaviour of the fluid is described bythe distribution density of the particles f ji (x, y, z, t). This distribution is derived from thediscrete form of the Boltzmann equation as:
f ji (x + e j iδt, t + δt) − f ji (x, t) = � j i , (4.15)
for discrete particle velocities at a collision rate �ji of particles. Comparison of modellingand simulations of a two-phase flow with a continuous free surface based on Navier–Stokesand Boltzmann equations has been performed, for example, by Schelkle et al. (1996).Several sample calculations of droplet flow may be found in the book by Frohn and Roth(2000).
Results for the fluid jetThe undisturbed free flow of a fluid jet from a circular aperture in the direction of gravity (atfirst, only for small or moderate fluid exit velocities) results in an acceleration of the fluid.The diameter of the jet will decrease with increasing nozzle distance while the mean velocityincreases (see principle sketch in Figure 4.8). At some distance from the nozzle, external orinternal perturbations may lead to instabilities on the phase boundary, which will result, atfirst, in a characteristic wave motion of the phase boundary before disintegration of the fluidjet occurs. Several classical investigations have analysed the characteristic length of such jetsbefore atomization (see e.g. Beretta et al., 1984). For a jet which is finally disintegrated bymeans of symmetrical surface waves on the phase boundary, the normalized disintegrationlength is connected to the Weber number We as:
Lc
d0= ln
(d0
2δ
)We0.5. (4.16)
The parameter ln(d0/2δ) describes the ratio of the fluid jet diameter d0 to an initial per-turbation wavelength δ of small axial-symmetric perturbations, which needs to be derivedfrom experiments dependent on fluid flow state of the emerging fluid jet from the nozzle.

39 4.1 Melt flow in tundish and nozzle
d(x)
g
ml
x
Fig. 4.8 Fluid stream (jet) in gravity field
For a laminar jet one can define (Bayvel and Orzechowski, 1993):
ln
(d0
2δ
)∼ 24, (4.17)
but the ratio depends on the experimental boundary conditions of the flow field and is verysensitive to internal perturbations of the flow field. For a turbulent jet, internal perturbationsare not important and the length and geometry of the nozzle where the jet exits are also notimportant. In this turbulent case, the parameter (Bayvel and Orzechowski, 1993) is:
ln
(d0
2δ
)∼ 4. (4.18)
The resulting disintegration length derived from these correlation equations is an orderof magnitude above the free-fall height of the metal melt from the tundish exit to theatomization area for a typical spray forming nozzle.
The result of calculation of fluid jet behaviour by means of a homogeneous twin-fluidmodel for a cylindrical melt jet of 4 mm diameter (which is a typical scale for spray formingapplications) for different Reynolds numbers is illustrated in Figures 4.9 and 4.10. Here, jetdiameter versus nozzle distance is shown in Figure 4.9, and the cross-section-averaged meltvelocity versus nozzle distance is shown in Figure 4.10. The nozzle distance is normalizedby means of the initial melt jet diameter d0.
The distance between the melt jet exit from the tundish to the point where the melt isatomized by the gas jets for a typical free-fall atomizer within spray forming applicationsis approximately 100 mm. This is a typical normalized distance of x/d0 = 25. In the caseof Re = 10 000, decrease of the melt jet diameter prior to reaching the atomization area isapproximately 10% of its initial exit diameter. Based on these results, the following analysisof the disintegration process itself, must take this decrease in melt jet dimension into accountbefore atomization.

40 Fluid disintegration
0 5 10 15 20 250.7
0.8
0.9
1
1.1
Reynolds number 5000 10 000 15 000
jet d
iam
eter
d/d
0 [-
]
nozzle distance x/d [-]
Fig. 4.9 Liquid jet diameter as a function of height
0 5 10 15 20 250.9
1.1
1.3
1.5
1.7
1.9 Reynolds number 5000 10 000 15 000
velo
city
u/u 0
[-]
nozzle distance x/d [-]
Fig. 4.10 Variation of mean liquid jet velocity with height
In comparison to the two-dimensional results of the numerical model described above,results of a classical one-dimensional analysis based on first principles may be done.Neglecting surface tension and frictional effects on the melt jet behaviour in a first approach,the velocity distribution of the falling jet is:
u =√
u20 + 2gx, (4.19)
and, therefore, the jet diameter can be calculated from continuity as:
d
d0=
(1 + 2gx
u20
)−0.25
. (4.20)

41 4.1 Melt flow in tundish and nozzle
0 5 10 15 20 25
nozzle distance x/d [-]
0
0.2
0.4
1je
t dia
met
er d
/d0
[-]
surface tension0 0,0725 1,83 Re = 100000 0,0725 1,83 Re = 1000
0 5 10 15 20 250
0.6
0.8
1
surface tension0 0.0725 1.83 Re = 10 0000 0.0725 1.83 Re = 1000
Fig. 4.11 Liquid jet diameter as a function of height for different surface tension values
By adding surface tension effects into this one-dimensional analysis (see Anno, 1997;Schneider and Walzel, 1998; Schroder, 1997), the following fourth-order non-linear equa-tion may be derived describing the contour behaviour of the fluid jet in a gravity field as afunction of nozzle distance:
d
d0=
[1 + 2gx
u20
+ 4σl(d − d0)
ρu20 dd0
]−0.25
. (4.21)
Numerical evaluation of this equation is shown in Figure 4.11 for the jet contour of a meltjet (here a steel melt has been taken) for different values of surface tension: σ1 = 0, withoutsurface tension effects; σ1 = 0.0725, surface tension value of water; and σ1 = 1.83, surfacetension value of a steel melt. Two different Reynolds numbers are plotted. In spray forming,typically high Reynolds numbers, e.g. Re = 10 000, are achieved at the tundish tip whereonly negligible influence of the surface tension on the melt jet behaviour for steel meltcan be observed. The different graphs in Figure 4.11 are more or less identical. In thisone-dimensional analysis, the effect of surface tension slows down the decrease in melt jetdiameter. The diameter at a certain distance from the nozzle of the melt jet increases withincreasing surface tension values.
If the results of the two-dimensional numerical analysis of the melt jet behaviour areplotted together with the analytical result of the one-dimensional approach on the samediagram, as in Figures 4.10 and 4.11, no visible deviations (actual deviations are below0.5%) may be observed. This result shows that the influence of surface tension, as well asthat of fluid viscosity, on melt jet behaviour in this application (in terms of the jet contour)may be neglected in the first instance. The radial velocity distribution in the melt jet isequally distributed; no significant velocity profile is found.
The aforementioned results have been derived for a stagnant gas surrounding the melt jet.Figure 4.12 shows the result of a homogeneous simulation, where the melt jet is surroundedby coaxial gas flow at different velocity levels (from 0 to 100 m/s), and for a single meltReynolds number of Re = 10 000. The velocity value on the melt jet centre-line is plotted.

42 Fluid disintegration
0 5 10 15 20 25
nozzle distance x/d [-]
0.9
1
1.1
1.2
1.3
1.4ve
loci
tyu/
u 0 [
-]
0 20 40 60 80 100gas velocity [m/s]
0 20 40 60 80 100
Fig. 4.12 Liquid jet velocity for coaxial gas flow (Re = 10 000)
The coaxial gas flow field has only a slight influence on the melt jet behaviour prior toatomization. The centre-line velocity increases only slightly with increasing gas velocities.In the numerical calculation already presented, jet oscillations at large wavelengths andfluctuations of the melt velocity can be found at increasing gas velocities, which must beregarded as numerical instabilities of the model.
As shown in the discussion on exit profiles of the melt jet from the tundish model, a moreor less developed fluid velocity profile may be found at the tundish exit. In the case of a fullydeveloped parabolic (laminar) velocity profile of the melt jet at the tundish exit, Middleman(1995) derived an approximate solution of the decreasing jet diameter (neglecting surfacetension effects) as:
d
d0=
(4
3+ 2gx
u20
)−0.25
. (4.22)
A numerical calculation of an exiting fluid jet having a velocity profile, taking into accountfriction, gravity and surface tension, has been performed by Duda and Vrentas (1967). In thiscase, boundary layer approximations of the momentum conservation equations in boundaryfitted coordinates have been done for Re > 200. Their results indicate that flattening of thevelocity profile developed in the jet due to low tangential stresses on the jet surface is veryslow.
The result of the numerical calculation of this problem, with a velocity profile developedin the initial jet at the tundish exit is shown in Figure 4.13. The velocity distribution is shownin the melt jet as well as in the surrounding gas phase, which is initially at rest. The melt jetdiameter at the tundish exit is d0 = 4 mm. The velocity at the phase boundary between themelt and the gas increases much faster than in the inner area of the melt flow. In summary, amelt jet diameter with initial velocity distribution, decreases slower than that with constantinitial velocity within the melt jet at identical melt flow rates.

43 4.2 The gas flow field near the nozzle
0 0.5 1.0 1.5 2.0 2.5 3.0
radius r [-] (1E-3)
0
1
2
3
4
5ve
loci
tyu
[m/s
]nozzle
0 5 10 15 20 25nozzle distance x/d0 [-]
0 5 10 15 20 25
Fig. 4.13 Velocity profile within the melt jet (Re = 10 000)
The use of inline measurement devices during melt atomization offers many technicaladvantages, such as indirect measurement of the melt flow rate by detection of the melt jetdiameter (by optical methods) and melt surface velocity (by laser Doppler anemometry,LDA). These allow derivation of the actual mass flow rate, which is an important processparameter to be controlled. As the above results indicate, not only the (measurable) surfacevelocity of the melt jet, but the velocity distribution inside the melt jet as well as thedevelopment of the jet geometry increasing nozzle distance must be taken into account inorder to determine the average mass flow rate.
4.2 The gas flow field near the nozzle
ug
up
The gas flow field in the vicinity of the atomizer nozzle contributes to melt stream instability,by introducing normal or tangential stresses and momentum transfer, which finally causedisintegration of the melt. In addition, the flow of gas may guide or shield droplets duringinitial spreading of the resulting spray. Thus, back-splashing droplets (which may result

44 Fluid disintegration
from earlier fragmentation stages of the melt or turbulent dispersion effects) are guided inthe main flow direction downwards with the spray. Thereby, nozzle wetting or cloggingfrom recirculating particles is prevented (see below). This shared action of the gas flowfield has already been demonstrated in Figure 4.1 in the free-fall atomizer configurationshown. While upper flow of the atomization gas in the primary gas nozzle is responsiblefor the shielding action, the lower gas stream from the secondary gas nozzle in the atomizercauses the main disintegration process of the melt stream. Both tasks and processes will beanalysed later in the chapter.
Due to the angle of inclination of the atomizer gas jets (secondary gas flow) and theopen configuration of the free-fall atomizer under investigation here, during atomizationlocalized recirculating gas flow regions may occur. Particles entering these recirculationareas may back-splash towards the atomizer. Thus, metal droplets are transported againstthe main flow direction of gas, and spray towards the melt stream exit at the tundish tipfrom below. These particles may stick at the lower edge of the tundish during impact andmay cause the growth of a solid layer in this area, resulting in severe process problems. Inextreme cases, these metal particles may cause continuous reduction of the free-stream areaof the melt flow, and lead to complete clogging of the melt flow and nozzle. In such cases,the entire atomization process comes to an undesired end.
4.2.1 Subsonic flow field
Figure 4.14 shows the main flow directions of the melt and gas (atomizer gas mass flow Mgg,primary gas mass flow Mg1, melt mass flow Ms) in the vicinity of the atomizer. A photographof liquid fragmentation in the vicinity of the nozzle during the atomization of water in afree-fall atomizer under certain (critical) operation conditions, is superimposed in the figure.At the theoretical atomization point, the existence and movement of individual droplets
atomizer gas
primary gas
atomizer gas
primary gas ( p1)
( p1)( pg)
Mg1Mgg
•
•
Ms
αg
•
Fig. 4.14 Principle of particle recirculation in the flow field of a free-fall atomizer

45 4.2 The gas flow field near the nozzle
above the main disintegration area can be seen. This is the point at which individual inclinedgas jets (angle αg) intersect with the centre-line of the nozzle and melt stream. Obviously,in reality, the disintegration process is initiated well above this theoretical atomization point(as will be discussed below). The droplets shown move within a concentric vortex, upwardsin the inner region close to the melt stream surface and downwards in the outer vortex regionin the area of the downward pointing jet flow.
This kind of particle recirculation is well known within free-fall atomizer applicationsand within other twin-fluid atomizer configurations under certain operating conditions. Inorder to investigate the conditions of particle recirculation and, in particular, the operationalconditions necessary to prevent recirculation, two kinds of models are presented:
(1) atomization in a water/air system, and(2) numerical simulation of a pure gas flow in the vicinity of the atomizer nozzle.
Both investigations use geometric nozzle configurations identical to those used for meltatomization during spray forming. Qualitative results are extracted from photographicevidence of water atomization and from experiments based on injected tracer-particle move-ments within the gas flow field of the atomizer. Here the pure gas flow field is observedwithout any liquid flow and liquid atomization (i.e. a gas-only flow).
For numerical modelling of the gas flow field in the vicinity of the atomizer, the discretearrangement of individual gas jets on a circumference around the melt stream is replacedwith a slit nozzle configuration having one circular slit for the primary gas and anothercircular slit for the atomizer (secondary) gas. The total exit area of both gas flow streams isidentical to those of the sum of the respective individual gas jets in reality. By this geometricapproximation, the computational power needed for the simulation is drastically reduced, asin the slit configuration one can assume circumferential symmetry of the gas flow and therebyreduce the problem from a three-dimensional to a two-dimensional configuration. Thedifference between two- and three-dimensional atomizer gas flow fields will be discussedlater.
Based on the aforementioned assumption, the description of the gas flow field in thevicinity of the atomizer is based on the stationary (in a first attempt) subsonic and turbulentapproach described by the compressible conservation equation, Eq. (3.1), in its non-transient(steady-state) form. Boundary conditions for the state of the gas at the nozzle exit need tobe described in terms of gas prepressure and exit Mach number, Ma. In the region of smallexit Mach numbers (Ma < 0.3), the flow of gas can be assumed to be incompressible andthe exiting mass flow rate can be derived from:
Mg = ρgua A. (4.23)
In the area of compressible, but subsonic, gas flow (0.3 < Ma < 1.0), the mass flow rateexiting from the atomizer is:
Mg = µ f Ap0
√√√√ 2κ
(κ − 1)RT0
[(pu
p0
) 2κ
−(
pu
p0
) κ+1κ
], (4.24)
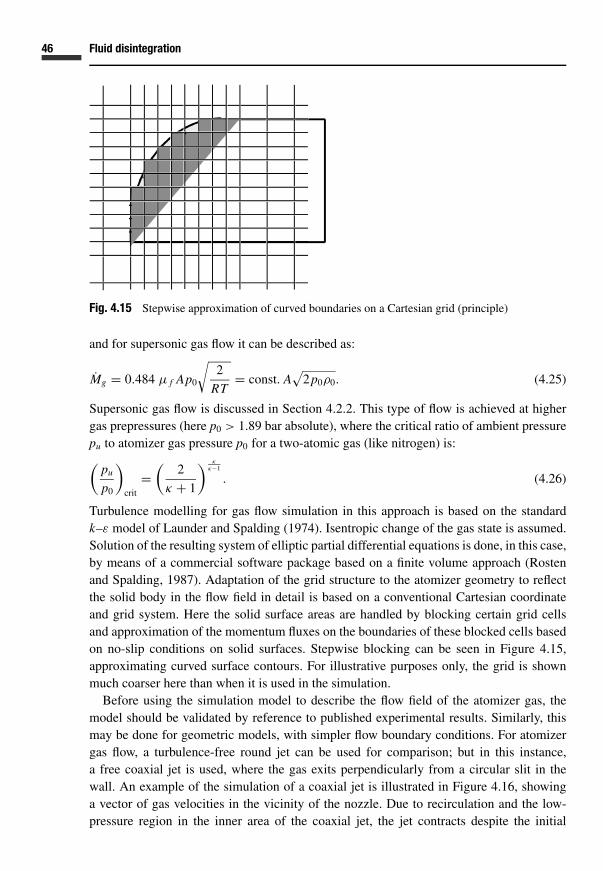
46 Fluid disintegration
Fig. 4.15 Stepwise approximation of curved boundaries on a Cartesian grid (principle)
and for supersonic gas flow it can be described as:
Mg = 0.484 µ f Ap0
√2
RT= const. A
√2p0ρ0. (4.25)
Supersonic gas flow is discussed in Section 4.2.2. This type of flow is achieved at highergas prepressures (here p0 > 1.89 bar absolute), where the critical ratio of ambient pressurepu to atomizer gas pressure p0 for a two-atomic gas (like nitrogen) is:(
pu
p0
)crit
=(
2
κ + 1
) κκ−1
. (4.26)
Turbulence modelling for gas flow simulation in this approach is based on the standardk–ε model of Launder and Spalding (1974). Isentropic change of the gas state is assumed.Solution of the resulting system of elliptic partial differential equations is done, in this case,by means of a commercial software package based on a finite volume approach (Rostenand Spalding, 1987). Adaptation of the grid structure to the atomizer geometry to reflectthe solid body in the flow field in detail is based on a conventional Cartesian coordinateand grid system. Here the solid surface areas are handled by blocking certain grid cellsand approximation of the momentum fluxes on the boundaries of these blocked cells basedon no-slip conditions on solid surfaces. Stepwise blocking can be seen in Figure 4.15,approximating curved surface contours. For illustrative purposes only, the grid is shownmuch coarser here than when it is used in the simulation.
Before using the simulation model to describe the flow field of the atomizer gas, themodel should be validated by reference to published experimental results. Similarly, thismay be done for geometric models, with simpler flow boundary conditions. For atomizergas flow, a turbulence-free round jet can be used for comparison; but in this instance,a free coaxial jet is used, where the gas exits perpendicularly from a circular slit in thewall. An example of the simulation of a coaxial jet is illustrated in Figure 4.16, showinga vector of gas velocities in the vicinity of the nozzle. Due to recirculation and the low-pressure region in the inner area of the coaxial jet, the jet contracts despite the initial
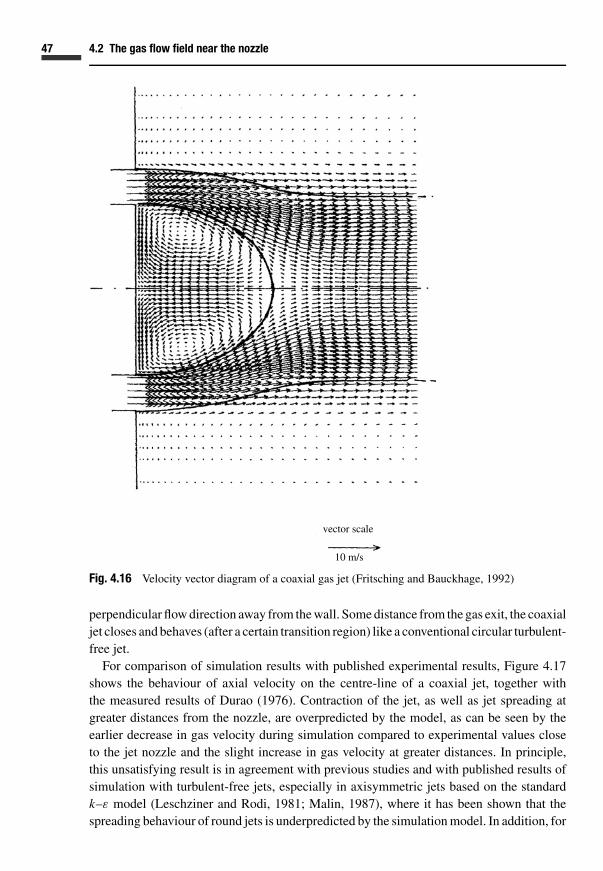
47 4.2 The gas flow field near the nozzle
vector scalevector scale
10 m/s
Fig. 4.16 Velocity vector diagram of a coaxial gas jet (Fritsching and Bauckhage, 1992)
perpendicular flow direction away from the wall. Some distance from the gas exit, the coaxialjet closes and behaves (after a certain transition region) like a conventional circular turbulent-free jet.
For comparison of simulation results with published experimental results, Figure 4.17shows the behaviour of axial velocity on the centre-line of a coaxial jet, together withthe measured results of Durao (1976). Contraction of the jet, as well as jet spreading atgreater distances from the nozzle, are overpredicted by the model, as can be seen by theearlier decrease in gas velocity during simulation compared to experimental values closeto the jet nozzle and the slight increase in gas velocity at greater distances. In principle,this unsatisfying result is in agreement with previous studies and with published results ofsimulation with turbulent-free jets, especially in axisymmetric jets based on the standardk–ε model (Leschziner and Rodi, 1981; Malin, 1987), where it has been shown that thespreading behaviour of round jets is underpredicted by the simulation model. In addition, for

48 Fluid disintegration
measurement Dura[dur-76]simulationRe = 9.8 10 3
nozzle distance z/d 0
velo
city
u/u
0
measured results(Durao, 1976)
simulationRe = 9.8 × 10³
nozzle distance z/d0
velo
city
u/u 0
0.0 0.1 0.2 0.3 0.4 0.5 0.6 0.7 0.8 0.9 1.0 1.1 1.2 1.3 1.4 1.5
−0.8
−0.4
−0.2
0.0
0.2
0.4
0.6
0.8
1.0
Fig. 4.17 Velocity at the centre-line of a coaxial gas jet (Fritsching and Bauckhage, 1992)
the case of a coaxial jet, contraction of the jet in the vicinity of the nozzle is overpredicted,as can be seen from Figure 4.17 where the free stagnation point is found to be much closerto the nozzle in the simulated rather than experimental results. Based on this evidence,deviations of the same order of magnitude may be expected in the prediction of atomizergas flow fields. In principle, these deviations in atomization behaviour are unacceptablefor proper analysis of the system. However, the principal physical parameters of the gasflow field boundary conditions can still be determined accurately, as these deviations occursteadily where, for example, measures to prevent recirculation can still be derived fromsimulation results.
Figure 4.18 compares a simulated vector plot of gas velocities in the vicinity of theatomizer for a free-fall configuration with a picture of the actual atomization of water insuch a nozzle. The absolute atomization gas prepressure of p2 = 1.89 bar used in this case,causes critical sonic outflow of the atomization gas (here nitrogen) at the gas exit, wherethe gas exit velocity equals the local velocity of sound at Ma = 1. In this first example, theflow field is calculated (and in the corresponding experiment has been used too) without anyprimary gas application, i.e. p1 = 0 and Mg1 = 0. The atomization gas exits the nozzle bodyat an inclination of 10◦. It can be seen from the figure that the atomized gas stream contractsmore intensely than indicated by that inclination angle. Here the same effect, as has beenobserved for a simple coaxial jet, occurs; the gas stream contracts towards the centre-line ofthe jet. The point where the gas hits the melt stream is somewhat closer to the atomizer thanindicated by the geometric point of jet impingement (theoretical atomization point). Due togas entrainment from the edge of the circular jet, external gas is accelerated into the innerflow area. Most of the entrainment gas flows through the gap between the atomizer gas ringand the main body of the nozzle. In this gap, a maximum gas velocity of approximately10 m/s is achieved. In the inner region of the gas flow field, a huge recirculation area can

49 4.2 The gas flow field near the nozzle
Re chnung p2 = 1,89 ba r Z er stäube rg asdruc k E xperiment p2 = 2,0 ba
Pr imä rg as druc k p 1 = 0,0 ba r
simulation p 2 = 1.89 bar secondary gas pressure experiment p 2 = 2.0 b
primary gas pressure p 1 = 0.0 bar
Re chnung p2 = 1,89 ba r Z er stäube rg asdruc k E xperiment p2 = 2,0 ba
Pr imä rg as druc k p 1 = 0,0 ba r
simulation p2 = 1.89 bar secondary gas pressure experiment p2 = 2.0 bar
primary gas pressure p1 = 0.0 bar
Fig. 4.18 Comparison of simulated and experimental results for p1 = 0 bar (Fritsching and Bauck-hage, 1992)
be observed. A solid line within the vector plot marks the stream-line boundary of thisrecirculation area. Within the vortex the maximum velocity of the upward-directed gas is45 m/s. Individual particles entering this vortex, will be accelerated upwards in the directionof melt exit within the main body of the atomizer. These recirculating particles may hit themain body of the nozzle close to the melt exit. This result is validated by visual observationof water atomization under almost identical process conditions as in the simulation shownin the right-hand side of Figure 4.18. Individual droplets can be seen above the atomizationarea in this figure, which are transported upwards against the main gas flow direction andtowards the main body of the atomizer and tundish.
When adding a primary gas flow to this configuration at a low gas prepressure of onlyp1 = 1.1 bar absolute (0.1 bar above ambient pressure), the gas flow field illustrated inFigure 4.19 results. The primary gas flow that exits the main body of the atomizer close tothe melt exit is also in the form of a coaxial jet, which contracts in the manner indicatedabove. Therefore, in the inner area of the primary gas jet, first a recirculation area can beseen where, due to jet contraction, the flow of gas is deflected radially inwards towards themelt stream, and, afterwards, flows for a certain distance when observed from the melt exit,the gas flows tangentially to the melt jet. With increasing distance from the atomizer, theprimary flow of gas is influenced by the much faster rate of flow of the atomizer (secondary)gas. Due to this influence the initial flow of gas again detaches from the central melt streamand is sucked into the faster atomization gas flow. By doing so, a second recirculation area

50 Fluid disintegration
Re chnung p2 = 1,89 ba r Z er stäube rg asdruc k E xperiment p2 = 2,0simulation p 2 = 1.89 bar secondary gas pressure experiment p 2 = 2.0 baRe chnung p2 = 1,89 ba r Z er stäube rg asdruc k E xperiment p2 = 2,0simulation p2 = 1.89 bar secondary gas pressure experiment p2 = 2.0 bar
primary gas pressure p1 = 1.1 bar
Fig. 4.19 Comparison of simulated and experimental effects for p1 = 1.1 bar (Fritsching and Bauck-hage, 1992)
within the gas flow field occurs from the point of detachment of the primary gas to the pointof impingement of the atomization gas. A third area of recirculating gas can be seen in thissimulation at the inside of the atomizer gas ring. This detachment is due to the sharp upperedge of the atomizer gas ring where entrainment through the gap releases the gas fromthe atomizer ring, while allowing flow around the corner. For comparison with simulationresults, the actual tracer flow trajectories through a gas flow field are shown on the right-hand side of Figure 4.19. In this photograph, sand particles have been introduced into theflow of gas at a certain position using a hollow cylinder, i.e. the particles are introducedinto the centre of the configuration (Uhlenwinkel et al., 1990). After entering the flow field,these tracer particles are immediately accelerated upwards due to the rising flow of gas inthe inner part of the main vortex. Within a few centimetres, the flow direction of these tracerparticles is reversed. At this point, the gas velocity is directed downwards, the tracers aretransported somewhat radially outwards, and these tracers are then accelerated downwardsin the direction of flow of the main atomization gas. The behaviour of these tracers validatesthe simulation results of a locally bounded recirculation area within the gas flow field forthese specific operational conditions of the atomizer. This recirculation zone is surroundedby the main atomizer gas, which is directed downwards.
By increasing the primary gas pressure further, its detachment point is pushed downwardsand, finally, the lower recirculation area vanishes and the entire flow in the atomization-relevant flow area is directed downwards. Due to the increased kinetic energy of the primarygas, this part of the flow stays attached to the central melt stream without being sucked intothe atomization process. Both of the other vortexes in the flow field remain, but the velocity

51 4.2 The gas flow field near the nozzle
Rechnung p2 = 1,89 ba r Z erstäube rg asdr uc k E xper iment p2 = 2,0 ba r
Primä rg asdruc k p 1 = 1,4 ba r
simulation p 2 = 1.89 bar secondary gas pressure experiment p 2 = 2.0 bar
primary gas pressure p 1 = 1.4 bar
Rechnung p2 = 1,89 ba r Z erstäube rg asdr uc k E xper iment p2 = 2,0 ba r
Primä rg asdruc k p 1 = 1,4 ba r
simulation p2 = 1.89 bar secondary gas pressure experiment p2 = 2.0 bar
primary gas pressure p1 = 1.4 bar
Fig. 4.20 Comparison of simulated and experimental results for p1 = 1.4 bar (Fritsching and Bauck-hage, 1992)
in the upper vortex, close to the melt flow exit, increases strongly (Fritsching and Bauckhage,1992).
Based on the above conditions for varying gas mass flow rates and prepressures, theoptimum conditions for nozzle configuration and geometry may be derived. The mainoptimization criteria are:
� the construction of a smooth nozzle contour that follows the natural streamline curvatureof the flow field to prevent detachment of flow at edges of the atomizer,
� placement of the primary gas exit (gas nozzle) as close as possible to the melt stream exitto suppress recirculation of the primary gas flow in this area,
� increase in the distance between atomizer gas ring and the main body of the atomizer inorder to allow maximum gas entrainment through this gap from the spray chamber.
The simulated and experimental effects of an optimized nozzle contour design based onthe above criteria is illustrated in Figure 4.20. Here, the operation conditions are chosenfor a primary gas pressure of p1 = 1.4 bar absolute at an atomization gas pressure of p2 =1.89 bar (critical gas flow exit condition). The simulation result shows a gas flow fieldwithout any recirculating vortex in the vicinity of the nozzle. But from the right-hand side ofFigure 4.20, it is apparent that primary excitation of the atomized fluid is increased becauseof the proximity of the gas nozzles to the liquid jet, and thus the gas velocity values in theboundary layer between the fluid/gas interface are increased. Here again, water is used as

52 Fluid disintegration
the atomization fluid for the optimized nozzle configuration shown, and only that part ofthe flow above of the main atomization area is to be seen.
In summary, in order to achieve a recirculation-free gas flow field in the vicinity of a free-fall atomizer, application of a minimum amount of primary gas is needed. The prepressureand flow configuration of the gas must fit the operational parameters of the nozzle tip andare determined by the gas pressure during atomization and by the actual geometry of theatomizer.
This analysis of the subsonic flow field has shown the importance of the primary gasin achieving a stable and recirculation-free situation. The principal interaction of primaryand secondary gas flows has been clarified. In the next section, supersonic flow of atomizergas jets in the vicinity of the atomizer will be discussed, as this type of behaviour is morerelevant in practice. Specifically, the role of the atomization gas in achieving optimum meltdisintegration will be derived and discussed.
4.2.2 Supersonic flow
In most spray forming applications, the gas prepressures used are beyond the critical pressurelevel, and are in the range of approximately 3 to 8 bar absolute. Therefore, depending onthe contour of the gas nozzle, the flow in the vicinity of the nozzle may exceed the sonicvelocity, achieving supersonic conditions. In this range, additional flow field features, suchas expansion and compression zones (shocks), occur. Shock structures do not feature inthe simulation model discussed in the previous section. But it is important to account forcompressibility effects, as the flow of gas from the secondary gas nozzle mainly determinesthe disintegration efficiency and atomization behaviour of the atomizer system.
One aim of investigating the gas flow field in the vicinity of the atomizer at relevantoperational conditions is the description of gas velocity and pressure distribution (includingexpansion and compression zones) for various atomizer geometries and operational condi-tions for secondary gas flow. In connection with this aim, the interaction of individualgas jets in a discrete gas jet arrangement (two-dimensional versus three-dimensionalbehaviour) should be described in terms of its impact on the resulting gas flow situation inthe atomization zone.
By modelling gas flow behaviour and investigating the main flow field in the atomizer,the optimum flow conditions may be determined, which may be aimed at specific sprayforming operations:
(1) minimization of total gas consumption during atomization and thereby minimization ofoperational costs throughout the process,
(2) shifting and/or influencing of the resulting droplet-size distribution in the spray (meanand width),
(3) increasing process safety with respect to such problems as particle recirculation andnozzle clogging,
(4) manipulation and variation of the resulting mass flux of droplets in the spray for flexiblevariation of the product geometry within spray forming.

53 4.2 The gas flow field near the nozzle
Point 1 is of minor importance for industrial applications, as the cost of gas consumptionis low in relation to other process costs (based on the use of nitrogen as an atomizationgas; for other gases, like argon, this needs to be reviewed). Points 2 to 4 are therefore themain focus of optimization efforts within industrial spray forming applications. Point 3,especially, is important for safe operation of the spray forming process. As discussed pre-viously, during atomization individual melt droplets may be back-splashed towards theatomizer instead of being transported downwards in the direction of the spray. From suchback-splashing particles, process problems will arise as these materials will influence thefree-fall behaviour of the melt stream. Prevention of droplet back-splashing is, therefore, avery important feature of atomizer construction and the choice of suitable atomizer processconditions. The prevention of gas recirculation in the nozzle hinders the back-splashing ofdroplets, and is achieved through the selection of a suitably low mass flow rate through theprimary nozzle (see Section 4.2.1). In summary, Points 2 and 4 are the main optimizationpotentials to achieve. These are determined by the behaviour of the spray during separation,and are a direct reflection of the construction and arrangement of the atomizer.
The compressible gas flow field in the vicinity of the nozzle is described by comparisonwith free gas jets from unbounded and bounded flow configurations. Next, the interactionbetween individual jets needs to be derived, as the flow of gas in an external mixing atomizeris mainly produced by a discrete jet arrangement.
Principle of underexpanded jetsThe flow through conventional straight bore holes or apertures during expansion of gasfrom an atomizer nozzle at super critical pressure is that of an underexpanded jet. Thisconfiguration is described by the remaining overpressure of the gas while exiting from thenozzle. Thereby, the gas is not fully expanded in the exit area and expands in front ofthe nozzle. The main parameters affecting this behaviour are the driving pressure ratio andthe geometric arrangement of the nozzle. Up to a pressure ratio of p0/pu = 1.89 (for air ornitrogen as atomizer gas, where p0 is the stagnation pressure in the plenum and pu is theambient pressure), the pressure in a straight or simple converging nozzle is monotonicallylowered until the ambient pressure is reached. If the pressure ratio exceeds the criticalpressure ratio, further expansion outside of the nozzle occurs, and the gas pressure in theexit is above ambient. The gas exits the nozzle in this case at a Mach number Ma = 1.The remaining pressure potentials in the gas are decomposed by expansion waves that startat the edges of the nozzle exit (so called Prandtl–Meyer expansion fans). Such expansionwaves are reflected from the free-jet boundaries as compression waves (see the theoreticalsketch in Figure 4.21) and combine in front of the nozzle to form oblique or straight shocks(at higher pressure ratios).
Such shock waves cause energy losses in relation to their intensity. At even higher pressureratios, a Mach disc (straight shock front in the centre of the jet) with specifically high lossesis formed. Such highly underexpanded flows will form at pressure ratios p0/pu > 3.85 (seeFigure 4.22). Behind the Mach disc the local flow velocity is subsonic. For moderatelyunderexpanded jets at pressure ratios 1.89 < p0/pu < 3.85, the compression waves from

54 Fluid disintegration
xk
Mischbereich
Stoflzellen mit
schr‰gen Stˆflen
p0pu
pa > pu cells withoblique shocks
mixing area
Fig. 4.21 Theoretical sketch of a moderately underexpanded jet
jet boundary layer
jet sonic line
Ma < 1
Ma > 1
shock sonic linev
Ma < 1
Ma = 1
expansion wavestriple point
normal shock(Mach disc)
oblique shocks
boundary layer behindthe Mach disc
Fig. 4.22 Theoretical sketch of a highly underexpanded jet
the jet boundary coalesce to form oblique shocks. Behind the oblique shocks, supersonicflow conditions still exist (Ma > 1).
Figure 4.21 shows a sketch of a moderately underexpanded single jet flow exiting from astraight or converging nozzle. Inside the shock ‘diamonds’, strong fluctuation of all flow andgas properties occurs. For an ideal gas, density is proportional to pressure and, therefore, inexpansion zones, the density decreases. From continuity, the gas velocity in these areas mustincrease. After equilibration to ambient pressure (p = pu), which is marked by a supersonic

55 4.2 The gas flow field near the nozzle
jet core length of xk, the velocity of the gas further downstream decreases monotonicallyand its behaviour can be described as that of a turbulent free jet.
The principal flow field of a highly underexpanded jet flow is shown in Figure 4.22. Theexpansion fan is illustrated, at the edges of the nozzle. The expansion waves are reflectedat free jet boundaries as compression waves and coalesce at the triple point to a commonstraight shock front, which is called the Mach disc (in the case of round jets) or Machshock. Behind the Mach disc, an area of subsonic velocities exists (Ma < 1); while behindthe oblique shocks, the flow field is still supersonic. Therefore, in highly underexpandedjets, even in the area close to the nozzle exit, subsonic flow zones exist, which are coveredby supersonic flow areas. The boundaries between supersonic and subsonic flow areas inthis region are called sonic lines. These sonic lines, as well as the outer boundaries of thejet, are strongly sheared boundary layer flows, where turbulence is primarily produced. Theinner boundary layers inside the shock cell structure, have a high impact on the overall flowfield and spreading behaviour of highly underexpanded jet flows, as discussed by Dash andWolf (1984). Therefore, for modelling and simulation, frictional effects in the vicinity ofthe nozzle must be taken into account even, or especially, for highly underexpanded gasjets. The set of conservation equations and the solution algorithm for this case must reflectthis specific task.
Principle of underexpanded interacting gas jet systemsWithin a typical spray forming atomizer a set or system of individual gas jets is located on acommon circumferential diameter around the melt flow or atomizer centre-line. Therefore,individual flow and shock structures from neighbouring jet systems may interact and thecommon shock and flow structure may change. Figure 4.23 shows, as an example, the shockscheme resulting from two interacting jets. If the distance or spacing between the individualjets is decreased, the shock structures may merge to form a single combined Mach disc, ashas been shown by Sizov (1991). Also the strength of jet interaction is increased when thepressure is increased, as is the intensity of individual compression and expansion waves.
Fig. 4.23 Shock interaction between two adjacent jets

56 Fluid disintegration
Masuda and Moriyama (1994) have found that during the interaction of neighbouring gasjets: (1) the Mach disc shifts downstream, and (2) the diameter of the common Mach disc islower than that of individual Mach discs from each single jet. Reduction of the Mach discsize thereby decreases losses by that shock.
Numerical simulation of underexpanded jetsNumerical simulation of underexpanded jet flow is also based on the conservation equationsfor mass, momentum and energy (Eq. (3.1)). Because of the compressible nature of the gasflow field in this case, an additional relation for density is needed, i.e. (at moderate gasprepressures) the ideal gas law.
Of special interest in modelling gas jet behaviour is the momentum balance; this willenable determination of which kind of forces are mainly responsible for the spreadingbehaviour of the jet. In the area close to the nozzle, exchange between pressure andmomentum forces predominates. Therefore, modelling and simulation in this area is basedon inviscid Euler equations without frictional effects (only pressure and inertia). A modifiedEuler solution code has been used, for example, by Ahrens (1995). Based on a flux-splittingalgorithm, the conservation equations are solved on a structured orthogonal grid system.Numerical resolution of the high gradients in shock areas is performed by means of a shockcapturing method. By comparing the results of this simulation with experimental data, theimportant role of viscous forces in the case of underexpanded jets, becomes obvious. Withina few shock cells, a boundary layer at the limits of the jet occurs, which cannot be accountedfor by an inviscid code, but is important for the overall behaviour of the underexpandedjet. Therefore, for a closed solution to the spreading behaviour of underexpanded jets alsowithin the far field, a suitable turbulence model has to be incorporated that takes into accountthe influence of viscous and Reynolds’ stresses. Such an extended model has been used byHeck (1998).
In this book, analysis of a viscous, turbulent and compressible gas flow within free jetsand atomizers is based on the standard k–ε model (Launder and Spalding, 1974) or, alterna-tively, on the renormalization group (RNG) model of Yakhot and Orszag. In both models,additional conservation equations for the turbulent kinetic energy (k) and the dissipation rateof turbulent kinetic energy (ε) are derived and solved (two-equation models). For compress-ible flow simulations, the conservation equation for turbulent kinetic energy is extended bya modified dissipation term. By taking into account the additional dissipation of turbulentkinetic energy in compressible flow fields an extended dissipation term Dk in the k-equation,as derived by Sarkar (1990), is required:
Dk = ρε(1 + 2Ma2
t
), (4.27)
where the turbulent Mach number Mat is defined as:
Mat =√
k
c2, (4.28)
with c the local speed of sound at the related point.

57 4.2 The gas flow field near the nozzle
A major problem with the numerical solution of Navier–Stokes equations for transonicflow fields is the coupling of conservation equations through material properties, espe-cially gas density. By preconditioning of the solution matrix, this problem can be overcome(see Weiss and Smith [wei-95]). This technique is based on transformation of the conser-vation property into a simple variable, which is only related to these variables. A modelconservation equation may be formally derived as:
∂W∂t
+ ∂F∂x
= ∂G∂x
, (4.29)
where
W =
⎡⎢⎢⎢⎢⎢⎣
ρ
ρvx
ρvy
ρvz
ρE
⎤⎥⎥⎥⎥⎥⎦ , F =
⎡⎢⎢⎢⎢⎢⎣
ρvρvvx + piρvvy + p jρvvz + pkρvE + pv
⎤⎥⎥⎥⎥⎥⎦ , G =
⎡⎢⎢⎢⎢⎢⎣
0�xi
�yi
�zi
�i jv j + q
⎤⎥⎥⎥⎥⎥⎦ . (4.30)
A simple, related variable Q = f(p, vx, vy, vz, T) is introduced whereby the conservationequation my be written as:
∂W∂Q
∂Q∂t
+ ∂F∂x
= ∂G∂x
. (4.31)
The Jacobi matrix dW/dQ in this case is:
∂W∂Q
=
⎡⎢⎢⎢⎢⎢⎣
ρp 0 0 0 ρT
ρpvx ρ 0 0 ρT vx
ρpvy 0 ρ 0 ρT vy
ρpvz 0 0 ρ ρT vz
ρp H − 1 ρvx ρvy ρvz ρT H + ρcp
⎤⎥⎥⎥⎥⎥⎦ , (4.32)
containing the partial derivatives of the gas density as
ρp = ∂ρ
∂p
∣∣∣∣∣T
, ρT = ∂ρ
∂T
∣∣∣∣∣p
. (4.33)
By means of this preconditioning, better resolution of the velocity and temperature distri-bution in viscous transonic flow fields is achieved. Based on Venekateswaren et al. (1992),even in inviscid fluids the pressure gradients will be determined more exactly. In addition,the mechanical and thermodynamic properties of the fluid are better resolved and solu-tion of this system of equations is simplified for transonic flow fields. In the case of anuncompressible fluid:
ρ = const, → ρp = 0, ρT = 0; (4.34)
for a weakly compressible fluid:
ρ = f (T ), → ρp = 0, ρT �= 0; (4.35)

58 Fluid disintegration
while for a compressible fluid:
ρ = f (p, T ), → ρp �= 0, ρT �= 0. (4.36)
Special treatment of the preconditioned matrix is achieved by the so-called flux-splittingalgorithm (Roe, 1986). In this algorithm, the operator F in the modified Navier–Stokesequation, containing the convective transport and pressure terms, is discretized in twoseparate, direction-dependent terms.
An additional difficulty for numerical modelling of transonic flow fields occurs due to thegeometric resolution of shock fronts and their numerical representation. Laterally, shockfronts are comparable in dimension to the free path length of the molecules. Therefore,geometrical resolution of shocks on a fixed-structured grid (which should capture the integralflow domain in the same way) is somewhat problematic. In such cases, an unstructuredadaptive grid system is preferred. In this way, the grid will be successively adapted duringthe numerical iteration process. It will be refined in areas where high gradients occur andshocks may be expected. Suitable program modules (such as Rampant, 1996) may be used,which are specifically developed for simulation of compressible hypersonic or transonic,but turbulent, flow fields.
Numerical simulation of individual jets and jet systemsFirst, results based on numerical simulation with an Eulerian code (Ahrens, 1995; usinginviscid assumptions) will be discussed. Figure 4.24 shows a contour plot of the isolinesof the time-averaged gas density (isochors) distribution in the nozzle vicinity at a certainpressure ratio of p0/pu = 5. Gas from the jet flows from left to right. Based on the symmetryof the problem, in this figure only the upper half of the flow domain is illustrated. The loweredge of the figure marks the centre-line of the jet. As the jet configuration is underexpandedat this prepressure, after emerging from the nozzle the jet expands. A normal shock frontin the form of a central Mach disc is to be seen in front of the nozzle, which is located at a
radi
usr/
d 0
nozzle distance z/d0
1.25 2.5 x /c 5.0
1
Fig. 4.24 Density distributionof an inviscidly calculated un-derexpanded jet at p0/pu = 5(Ahrens, 1995).

59 4.2 The gas flow field near the nozzle
0
100
200
300
400
500
600u
[m/s
]
0 20 40 60 80 100 120 140 160x [mm]
experimental valuesnumerical simulation k- -modelnumerical simulation RNG-model
nozzle distanc e z [mm]
velo
city
u[
m/s
]
0
100
200
300
400
500
600u
[m/s
]
0 20 40 60 80 100 120 140 160x [mm]
0
100
200
300
400
500
600u
[m/s
]
0 20 40 60 80 100 120 140 160x [mm]
experimental valuesnumerical simulation k–ε modelnumerical simulation RNG model
nozzle distance z [mm]
velo
city
u [m
/s]
Fig. 4.25 Velocity distribution at the centre-line of an underexpanded jet, comparison betweensimulation and experiment (p0/pu = 5) for a single jet configuration (Heck, 1998)
distance of 1.3 nozzle diameters (x/d = 1.3) downstream from the exit. Comparison of thelocation of this first shock front to the experimental results of underexpanded jets of Loveet al. (1959), shows good agreement (Ahrens, 1995). As the axial distance to the nozzle exitincreases, the agreement between simulation and experiment becomes worse, as in this flowarea viscous forces become more important but have not been taken into account during thesimulation.
Taking into account viscous effects, by solution of the Navier–Stokes equations plusanalysis of the turbulence model within the Rampant program, the simulation yieldsthe following results. The velocity distribution at the centre-line of the jet is shown inFigure 4.25, where comparison between simulation and experimental data is achieved bylaser Doppler anemometry (LDA). The shock structure is seen in the vicinity of the nozzle.The numerical simulation results are shown to be in good agreement with experimental data:the location and number of shock cells are almost identical. Also the calculated length of thesupersonic core of the jet only deviates slightly from experimental findings. Only the decayrate of the gas velocity in the subsonic region is more pronounced in the experiments thanin the simulation. Also the amplitudes of the velocity fluctuation differ between experimentand simulation: the peak in velocity values behind the shock front is more intense thanhas been found experimentally. However, the behaviour of the tracer particles, used for theLDA measurements might cause this experimental deviation. These small, but still inertial,tracer particles cannot follow the steep velocity gradients across a shock exactly.
Comparison of results from simulation and experiments for transonic underexpanded jetsshows that, for both approaches, problems may arise which will lead to incorrect results.Some numerical modelling problems that can be applied to this case are now given. A

60 Fluid disintegration
p u = 1.0 barpu = 1.0 bar
p0 = 5.0 bar
Fig. 4.26 Density contours of an underexpanded jet bundle, three-jet configuration, d = 2.5 mm,t = 0.25, p0/pu = 5 (central plane) (Heck, 1998)
pronounced reason for simulation problems is the lag in information regarding initial jetconditions at the nozzle exit. Generally, ideal isentropic behaviour from the plenum intothe exit is assumed, characterizing the gas properties in the nozzle exit. Pressure lossesdue to friction or possible detachment of the jet stream from the wall inside the nozzleare normally neglected. Turbulence properties inside the nozzle are not generally known.Isotropic turbulence models (like the k–ε model) may cause errors in the calculation of freejet flows (as has been previously described). In addition, the calculation for the jet is basedon a two-dimensional approach assuming axisymmetric flow. This assumption may be notvalid in (underexpanded) jet flows, as transient three-dimensional flow structures, causedby instabilities (Kelvin–Helmholtz instability) at the outer edge of the jet, are important insome regions of the jet. How all these deficits will influence the accuracy of the results ofnumerical jet calculation is not quite clear and needs further investigation.
As an example of jet interaction, that within a system of three individual circular jets in arow is seen in Figure 4.26. This simulation is done for a fully three-dimensional domain inthis case. Plotted are the density contours during the expansion of a three-jet configurationhaving a spatial spacing of t/d = 0.25 at a stagnation pressure of p0 = 5 bar in the plenum.For symmetry reasons, only one-half of the flow field has been modelled. Therefore, only1.5 jets are reflected in the numerical grid system. The expansion fans are to be seen closeto the nozzle exit on the left-hand side of the figure. The compression waves, which arereflected from the jet boundary, combine at the centre-line of the jet system to form asingle central shock structure. The coalescence of compression waves from neighbouringjets can be observed. In this three-jet configuration, the shock structure propagates furtherdownstream within the central jet. Here equilibration of pressure occurs more slowly.
Comparison of different jet configurationsDuring construction of an atomizer system containing a discrete jet configuration, for suit-able application of the atomization gas, the geometric configuration and arrangement of thewhole jet system (e.g. spacing), as well as the geometry or contour of the individual jets, may

61 4.2 The gas flow field near the nozzle
0
100
200
300
400
500
600
700ve
loci
tyu
[m/s
]
0 10 20 30 40
nozzle distance z/d 0
ideal expanded p a = 1.013 barunderexpanded p a = 2.904 baroverexpanded p a = 0.348 bar
0
100
200
300
400
500
600
700
0 10 20 30 40
nozzle distance z/d0
ideal expanded pa = 1.013 bar
underexpanded pa = 2.904 bar
overexpanded pa = 0.348 bar
Fig. 4.27 Velocity distribution at the centre-line of under-, ideal-, and overexpanded free jets atp0 = 5.5 bar and m = const. (Heck, 1998)
be adapted. Dependent on the individual jet nozzle contour, underexpansion, overexpansionor ideal expansion within a Laval nozzle contour may be achieved. This exit condition hasa major influence on the behaviour of the jet. Therefore, overexpanded and ideal expandedjets will now be included in the discussion.
Overexpanded jets, in principle, contain the highest exit momentum at a constant massflow rate within the three cases mentioned. With the aim of achieving maximum kineticenergy in the atomization area (in order to achieve the maximum slip velocity between gasand fluid) this jet configuration is of special interest. Therefore, the momentum transferfrom the nozzle exit to the atomization area where the fluid disintegration occurs needs tobe observed.
Comparison of the results of simulation data for overexpanded, underexpanded and idealexpanded gas jets is illustrated in Figure 4.27. The velocities at the jet centre-line for thesethree cases are plotted versus the nozzle distance for constant prepressures (p0 = 5.5 barabsolute) and mass flow rates. Therefore, the nozzle exit areas of the three jets are different.Their individual values are calculated from the isentropic flow conditions. Therefore, the exitarea is highest for the overexpanded jet at identical conditions. Because the overexpandedjet also delivers the highest exit gas velocity, the resulting exit momentum in this case ishighest (at constant mass flow rates). The parameters used in the numerical simulation arelisted in Table 4.2.
Though the overexpanded jet has the highest exit momentum, this effect starts to vanishin the first shock cell, and one can see that in the transonic region, or at least in the areaimmediately behind the shock fronts, the underexpanded jet has the highest velocity value.For analysis of the atomization potential of the three individual flow configurations within

62 Fluid disintegration
Table 4.2 Numerical simulation parameters for over-, ideal- and underexpanded singlegas jets at constant pressure and mass flow rates
p0 [bar] pa [bar] A/A∗
[-] Ma [-] T/T0 [-] νa [m/s] I/Iideal [-]
underexp. 5.5 2.904 1 1 0.833 310.5 0.657ideal exp. 5.5 1.013 1.407 1.77 0.615 472.1 1overexp. 5.5 0.348 2.57 2.45 0.4544 564.8 1.19
a free-fall atomizer configuration, the behaviour in the far field is especially important. Inthis subsonic free-jet region, the ideal expanded jet shows the highest velocity values atthe centre-line. Though the exit momentum of the overexpanded configuration exhibits thehighest value, in the far field it yields the lowest velocity readings of all three configurations.For ideal expanded jet behaviour without any shock structures between the jet exit and theatomization area, the highest potential for atomization purposes is achieved in the far field.Therefore, Laval nozzles are to be used for this configuration in a free-fall atomizer foroptimum performance.
Numerical simulation of gas flow near the nozzle of a free-fall atomizer(two-dimensional)
Numerical calculation of the transonic flow of gas in the nozzle of a free-fall atomizer isbased on the grid structure illustrated in Figure 4.28. An unstructured adaptive grid hasbeen used: the left-hand side of the figure shows the initial grid, marking the contour of thefree-fall atomizer under investigation; while the right-hand side of the figure shows the finalgrid structure and illustrates local grid refinement in the shock cell zones. Adaptation of thegrid structure is based on local pressure gradients. In regions where the pressure gradientexceeds a previously given value, the grid has been refined.
Figure 4.29 shows the calculated flow field, which is based on the grid system afore-mentioned. The numerical calculation is performed on a two-dimensional grid, thereforeassuming circumferential symmetry of the atomizer configuration. This means that for sim-plicity and to keep the numerical effort small, the gas exit has been assumed to have a ringslit configuration where the gas emerges from a ring slit nozzle. The overall nozzle contouris a typical example of a free-fall atomizer as it is used in spray forming applications. Theleft-hand side of Figure 4.29 shows an underexpanded gas flow and the right-hand sideshows the ideal expanded case. Both cases are calculated at constant mass flow rates. In theunderexpanded case, the shock cell structure is to be seen in the jet in front of the nozzle: atthe listed pressure ratio, no shock occurs at the central plane. The reason is that the ring slitconfiguration is the extreme case of a discrete jet configuration with zero spacing betweenthe jets. Therefore, the minimum pressure necessary for central plane shock is somewhatabove that for a single discrete jet and is not achieved in this example.
The use of ideal expanded gas jets from individual converging/diverging nozzle contoursincreases the velocity potential in the far field region of the nozzle of interest. Comparison

63 4.2 The gas flow field near the nozzle
Ga sa us tr it t d er
Zers tä ub er dü se
M ittel lin ie de r D üs e
fa ng sg itt er En dg
Ga sa us tr itt de r
Pr im är dü se
secondary gas nozzle exit centre line
atomizer nozzle
nitial grid primary gas exit final grid
Ga sa us tr it t d er
Zers tä ub er dü se
M ittel lin ie de r D üs e
fa ng sg itt er En dg
Ga sa us tr itt de r
Pr im är se
secondary gas nozzle exit
atomizer nozzle
initial grid primary gas exit final grid
centre-line
Fig. 4.28 Grid structure for the simulation of transonic flow in the atomizer nozzle (Heck, 1998)
of gas velocities at the atomizer centre-line in Figure 4.30 illustrates that in the assumedliquid disintegration area somewhat below the nozzle (approximately 50–100 mm belowthe nozzle in this configuration) where primary disintegration of the liquid/melt happens, anincrease of the gas velocity approximately 10–20% is achieved in this way. In Figure 4.30,the centre of the nozzle (x = 0 mm) lies at the lower edge of the separate secondary gasflow nozzle ring.
By using convergent/divergent gas nozzle systems, atomization efficiency is raised andthe resulting droplet-size distribution of the process shifts towards smaller diameters (whichhas been proved experimentally; Heck, 1998). The convergent/divergent nozzle system ismore effective than the simple converging one. In addition, the resulting width of the droplet-size distribution during atomization is influenced in this way by changing the individual jetarrangement and geometry. As shown in Figure 4.31, the span of the droplet-size distribution,defined as
Span = d90.3 − d10.3
d50.3(4.37)
(here measured using water as the atomization model fluid), is lowered, and by usingconverging/diverging nozzles, the particle size distribution becomes narrower (Fritsching

64 Fluid disintegration
Geschwindigkeit[m/s]
velocity[m/s]
velocity[m/s]
5.50e+02
4.95e+02
4.40e+02
3.85e+02
3.30e+02
2.75e+02
2.20e+02
1.65e+02
1.10e+02
5.50e+01
0.00e+00
Fig. 4.29 Numerical simulation of the flow field near the nozzle for underexpanded (left side) andideal expanded (right side) jets. Ring slit nozzle configuration, p0/pu = 5 (Heck, 1998)
et al., 1999; Heck, 1998). The main reason for this behaviour is the increased productionof turbulent kinetic energy within the simple converging nozzle system. As can be seen onthe right-hand side of Figure 4.31, where the distribution of turbulent kinetic energy k inthe area in front of a converging and a converging/diverging single nozzle is illustrated,within the underexpanded jet issuing from the converging nozzle, in the inner part of thejet additional turbulence due to shear is produced (i.e. in subsonic boundary layer behindthe shock front). Therefore, the level of turbulence in an atomizer using discrete simpleconverging gas nozzles is increased, resulting in broader droplet-size distribution in thespray (increased span).

65 4.2 The gas flow field near the nozzle
−100
0
100
200
300
−50 0 50 100 150 200 250
nozzle distance z [mm]
ideal expanded
underexpanded
gas
velo
city
u [
m/s
]
ideal expanded
underexpanded
Fig. 4.30 Gas velocity distribution at the centre-line of a nozzle system
outer jet boundary layer
boundary layer at central shock
idealexpanded
underexpanded
A
1.40
1.60
1.80
span
[-]
3 4 5 6 7 8
stagnation/ambient pressure [-]
expanded nozzle (p = 5 bar)convergent nozzle
velocity[m/s]
dA
outer jet boundary layer
idealexpanded
underexpanded
d
velocity [m/s]
4.01e+00
4.42e+00
3.93e+03
3.44e+03
2.95e+03
2.46e+03
1.96e+03
1.47e+00
0.02e+02
2.91e+02
2.07e+07
Fig. 4.31 Left: particle-size distribution width for atomization of water in a purely converging gasnozzle system or by means of converging/diverging (expanded) gas nozzles. Right: turbulent kineticenergy distribution in an ideal expanded and underexpanded free jet (Heck, 1998)
Numerical simulation of gas flow near the nozzle of a twin-fluid atomizer(three-dimensional)
The arrangement of gas nozzles in an external mixing twin-fluid atomizer usually corre-sponds to a number of discrete jets in annular configuration. In a two-dimensional arrange-ment, the gas exit is described as a slit nozzle configuration. Figure 4.32 simulates the truethree-dimensional flow field in an atomizer: this is depicted as velocity isocontour plots at

66 Fluid disintegration
x = 0.0411 (vd = 0)
x = 0.06 (vd = 5)
x = 0.18 (vd = 35)
x = 0.10 (vd = 15)
x = 0.14 (vd = 25)
Fig. 4.32 Gas flow field in the vicinity of an atomizer: number of jets = 24, gas jet diameter = 4 mm
distinct distances from the atomizer. The velocity distribution at five different locations isillustrated. The simulation uses the circumferential symmetry of the flow field to calculatethe flow as a three-dimensional slice through the atomizer. The plot shows the total flowfield, which has been achieved by mirroring the result of the simulation. The colour scalingin each plane is normalized by means of a maximum velocity value in a particular distancefrom the atomizer. In the upper-most plane (l/d = 0), the 24 individual jets that comprise

67 4.3 Jet disintegration
that particular nozzle arrangement are to be seen at the gas jet exit. In the middle plane at adistance l/d = 15 (which is 60 mm below the atomizer in that configuration), the individualjets combine together to form a coaxial jet having maximum velocity at a radial distanceoutside the centre-line of the configuration. With increasing distance, the local maximumin the velocity distribution moves towards the centre-line of the atomizer. At a distance ofl/d = 35 (which is 135 mm below the gas jet exit), the maximum velocity value is locatedalmost at the middle of the atomizer configuration and the configuration is comparable tothat of a free circular turbulent jet.
In concluding this investigation of the gas flow field near a free-fall atomizer arrangementfor spray forming applications, several potential improvements of the configuration can bederived. These optimizations can be achieved by applying suitable process conditions andby suitable configuration of the nozzle, such as:
� improving and adapting the nozzle configuration and regulating the amount of primarygas flowing through the atomizer to prevent back-splashing of melt droplets near theatomizer;
� controlling the kinetic energy during atomization through to increase atomizer efficiencysuitable gas nozzle configuration
� configuring the jets to influence droplet-size distribution in the spray, with respect to meandrop size as well as with respect to the width of the drop-size distribution.
The optimum process conditions necessary for construction of a free-fall atomizer, basedon those measures aforementioned (i.e. numerical and experimental investigation of atom-ization models using water), have been validated for molten steel atomization (Heck, 1998;Heck et al., 2000). In these investigations the result of changes in the nozzle arrangementon drop- and particle-size distributions has been analysed, and are in agreement with theresults of numerical simulations.
4.3 Jet disintegration
The starting points for all classical investigations of liquid jet disintegration in a gaseousmedium are: (1) analysis of the linear stability of the coupled gas/liquid flow field, and

68 Fluid disintegration
(2) calculation of the capillary instability of cylindrical or plane liquid jets and sheets.Description of fundamental phase boundary behaviour is critical to our understanding offluid disintegration and atomization, and is key to the development of simple, as well asmore sophisticated, atomizer arrangements. The latter involve the production of sprays withmonomodal drop-size distribution or single drop production for specific devices, such asink-jet printers.
Key elements of a liquid disintegration model within atomization are:
� description of the initiation and growth of surface waves on the liquid phase boundary,� analysis of primary separation of liquid ligaments from the main liquid jet,� description of successive ligament disintegration into the resulting droplet-size distribu-
tion.
A descriptive model for liquid disintegration must provide a general formula for the totalinitial spectrum of droplet sizes and velocities encountered in the spray, as well as explainthe mass flux distribution and spray angle resulting from the fragmentation process. Oncethese parameters are known, the conditions of the spray at its origin may be derived as astarting requirement for the modelling and simulation of the dispersed spray.
4.3.1 Stability analysis
A cylindrical fluid element in a quiescent gaseous atmosphere is inherently unstable. Smallperturbations of the surface (at wavelengths l > πdl) will always tend to grow. Initiation ofliquid jet disintegration in atomization is described by the initial perturbation and the growthof surface waves at the liquid/gas interface. Instability itself, for example, is due to the estab-lishment of surface tension, leading to a local pressure distribution on the phase boundarydependent on the surface of curvature of the liquid. The first quantitative description of thisprocess was made by Rayleigh (1878), who derived, and solved, the fundamental system ofequations describing energy conservation (by neglecting viscous contributions). Rayleigh’sanalysis is limited to initial sinusoidal perturbations of small amplitude. Weber (1931), incontinuation of this work, investigated the viscous system. He neglected inertial effects, andhis solution also is only valid for small initial perturbations. Both discovered an exponentialgrowth of small perturbations at unstable wavelengths. Due to the range of process andliquid properties in real atomization processes, viscous effects in the gas flow analysis mustbe included. The limit up to which an inviscid assumption of the instability process can bemade with tolerable error, has been derived by Cousin and Dumouchel (1996) for the caseof a planar liquid sheet, and is summarized in terms of a limiting dimensionless number.The influence of viscous forces on jet disintegration can be neglected if the dimensionlessnumber M is:
M = µlρ2gu3
relh f
ρlσ2l
< 10−3, (4.38)
where the properties of the gas (g) and the liquid (l), and the relative velocity between thegas and liquid urel and hf, the liquid film thickness, need to be introduced.
69 4.3 Jet disintegration
From the pioneering work of Rayleigh and Weber, the following analytical linear stabilityanalyses are all generally limited by one or more basic simplifying assumptions, i.e. neglectof viscosity contributions from either the gas and/or the liquid, partial neglect of inertialeffects, or limitation of the analysis to small initial perturbation amplitudes.
Jet instability at small perturbation wavelengths (aerodynamic interaction and liquiddisintegration), based on linearized conservation equations and partially neglecting inertialeffects and gas viscosity (neglecting the gas boundary layer), was first investigated byTaylor (1940). If, in addition, liquid viscosity is neglected, this results in the classical caseof aerodynamic-fluid disintegration based on Kelvin–Helmholtz instability.
A stability analysis that is independent of the ratio of wavelength to jet diameter λd/dhas been derived by Mayer (1993), based on the contributions of Taylor (1940) and Reitz(1978). The reference system in this analysis is moved with fluid velocity ul and the resultsare related to the relative velocity between the gas and liquid urel = ug − ul . The complexformulation is based on a perturbation of basic flow in the form of a surface wave withamplitude
ηS = Real(η0eikx+imθ+ωt ), (4.39)
where k = 2π/λd is the wave number, m is the mode of the perturbation and ω = ωr +iωi . The parameter ω is the complex growth rate of the perturbation. The real part of thecomplex growth rate Re (ω) = ωr describes the reaction function of the liquid jet by externalexcitation and the behaviour of the perturbation. For negative growth rates, i.e. ωr < 0, theperturbation will be damped out; positive growth rates, ωr > 0, will lead to an exponentialgrowth of the initial wave. In this derivation, the linearized conservation equations for flowof gas and liquid are solved based on the introduction of a stream function ψ , the velocitypotential φ and the related perturbation formulations. Hereby the velocity of the gas isneglected, resulting in a velocity jump at the phase boundary between liquid and gas. Thesolution of the equation system is:
ω2 + 2µl
ρlk2ω
I ′1(kr0)
I0(kr0)
[1 − 2kl
k2 + l2
I1(kr0)
I0(kr0)
]
= l2 − k2
l2 + k2
I1(kr0)
I0(kr0)
{σl k
ρlr20
[1 − (kr0)2
]+ ρg
ρl
(urel − iω
k
)K0(kr0)
K1(kr0)
}, (4.40)
and contains the modified Bessel functions In and Kn of nth order and their derivatives I′,as well as I 2 = k2 + ω/νl . From the general solution in Eq. (4.40) some specific cases canbe derived, which will be discussed in the following.
Large-wavelength areaWhen aerodynamic effects are neglected, as well as fluid viscosity, gas density and relativevelocity between the fluid jet and gas flow field, the classical solution of Rayleigh (1878)is derived:
ω2 − σl
ρlr20
k[1 − (kr0)2
] I1(kr0)
I0(kr0)= 0. (4.41)

70 Fluid disintegration
In this equation, I0 and I1 are the Bessel functions of zero and first order. As already men-tioned, perturbations with wavelengths λ > πdi are inherently unstable, resulting alwaysin positive growth rates. If, in the total unstable wave spectrum, only the particular wave-length with maximum growth rate is considered (the fastest growing wave of all unstablewaves, representing the maximum instability function), the analysis finally leads to classicalRayleigh disintegration of a liquid jet. This may be achieved by controlled excitation of theliquid jet. In this case, the ligaments from disintegration of the liquid jet form monodispersedspherical droplets at a resulting drop size directly related to the jet diameter by dp ∼ 1.89di .This effect is used in monodispersed droplet generators.
Small-wavelength areaIn the case of an inviscid flow this is the classical Kelvin–Helmholtz instability derived byBradley (1973a, b) for stimulation of the primary disintegration process at small wavelengthsfor coaxial atomization of liquids.
In the limiting case of very small wavelengths (λ << di ), the solution above leads to:
(ω + 2νl k2)
2 + σ
ρlk3 − 4ν2
l k3
√k2 + ω
νl+ ξg(ω + iurelk)2 ρg
ρl= 0. (4.42)
Introduced in this solution is the assumption that the viscosity of the gas causes instability ofthe jet, which has been derived by Sterling and Schleicher (1975). These authors found thatby accounting for boundary layer effects of the gas flow field, wave growth is stabilized.This can be regarded as a damping effect of the perturbation pressure on the liquid jetsurface. The boundary layer coefficient ξ g is related to this effect, where:
� ξ g = 1, is the case of an inviscid gas flow;� ξ g = 0.8, takes into account the profile of the turbulent boundary layer of the gas flow
field at the liquid/gas phase boundary.
In a similar way, Miles (1957) took into account the turbulent character of the gas flow fieldat the phase boundary. By neglecting gas viscosity, the logarithmic velocity profile in thefully turbulent region is expressed in terms of a suitable pressure distribution on a wavyliquid surface (Burger et al., 1989, 1992).
Generally, analyses of aerodynamic disintegration have found that surface tension hasa stabilizing effect (shifts maximum unstable wavelength towards lower values) and fluidviscosity a damping effect (lowers the amplitude of the growth rate while keeping themaximum growth rate constant). Increasing the relative velocity between gas and liquidphases always has a destabilizing effect.
The instability of the liquid/gas phase boundary of a jet/sheet is divided into severalmodes, which can be described by their specific spatial growth functions. Besides thesymmetric mode (m = 0) of wave growth of phase boundaries, the liquid jet may tend tolong oscillatory movement (asymmetric jet oscillations, see Figure 4.33). By neglectinggas and liquid viscosities and the region of high relative velocities between the gas and the

71 4.3 Jet disintegration
(a)
(b)
y
y
x
x
b
aλ
λ
Fig. 4.33 Asymmetrical (a) and symmetrical (b) instability modes of liquid jet disintegration
liquid, Levich (1962) analysed the stability of the first asymmetric mode (m = 1) of a liquidjet as:
ω2 + ρgk4r20 u2
rel
(ln kr0
2
)2ρl
− σl k2
2ρlr0
(1 − m2 − k2r2
0
) = 0. (4.43)
In the case of a planar liquid sheet, Hagerty and Shea (1955) have shown that an inviscidfluid has higher growth rate values in the asymmetric mode than in the symmetric mode.Here the asymmetric mode is always dominant.
Despite the relatively crude assumptions and simplifications which have to be made toapply linear stability analyses, the use of this linear theory has a number of advantagesin the development of a disintegration model for fluid atomization: first, linear stabilityanalysis is based on simple assumptions and, second, mathematical efforts for its solutionare quite low. This makes the handling of this method easy. Linear stability analyses delivergeneral stability criteria for the liquid/gas system under investigation and allow calculationof wavelengths and growth rates that mainly cover the disintegration process. An overviewof classical solutions to the system of ordinary linear differential equations in stabilityanalyses has been given by Markus et al. (2000).
Non-linear stability analyses, taking into account some of those previously necessarysimplifications, which have to be performed within linear theory, have been calculated forsome geometric boundary conditions and for certain cases. In the sense of stability analyses,the resulting system of conservation equations is solved using a perturbations approach orby numerical analysis with discrete perturbations (see, for example, Dumouchel, 1989;Panchagnula et al., 1998; Rangel and Sirignano, 1991; Shokoohi and Elrod, 1987).
In the following, the results of a linear stability analysis based on the above assumptionsfor a coaxial twin-fluid atomizer with external mixing and a reference water/air systemwith a liquid jet diameter of di = 2 mm will be discussed. Results in terms of growthrates for symmetric (m = 0, short wavelength perturbations) and asymmetric cases (m = 1,long wavelength perturbations) are shown in Figures 4.34 and 4.35 for variable relativevelocity between the coaxial atomizer gas and central liquid. From these results, the principal

72 Fluid disintegration
grow
th r
ate
ω [1
/s]
0.000 01 0.0001 0.001 0.01 0.1 1 10 100
wavelength λ [m]
0.1
1
10
100
1000
10 000
100 000
1000 000
20 m/s 40 m/s 60 m/s
80 m/s 100 m/s
gas velocity
+
Fig. 4.34 Growth rates of the symmetric mode, m = 0, system H2O/air
wavelength λ [m]
grow
th r
ate
ω [1
/s]
20 m/s 40 m/s80 m/s 100 m/s
60 m/s
10 000
1000
100
10
1
0.1
0.01
0.0010.001 0.01 0.1 1 10
gas velocity
Fig. 4.35 Growth rates of the asymmetric mode, m = 1, system H2O/air
influence of process parameters on phase boundary excitation can be shown. The relativemaximum of each growth rate curve illustrates the fastest growing wavelength.
Comparison of symmetric and asymmetric modes in this example shows that symmetricperturbations always yield higher growth rates than asymmetric ones. Therefore, sym-metric jet behaviour should finally lead to disintegration in this case. This result has notbeen confirmed by experimental studies for these boundary conditions so far (Farago andChigier, 1992; Hardalupas et al., 1997). For an atomizer of similar type to the one discussedhere, Hardalupas et al. (1997) found that only a small amount or number of droplets were

73 4.3 Jet disintegration
Sn
Cu
steel C35
−0.1 20 0.5 1 2 5 10 200.5 1 5 102
wavelength λ [mm]wavelength λ [mm]
Sngr
owth
rat
eω
re[1
/s]
grow
th r
ate
ωre
[1/s
]
10000
8000
6000
4000
2000 500
500
2000
2500
000 m = 3
m = 1
m = 0
Fig. 4.36 Stability analysis of a liquid metal jet, ul = 2 m/s, ug = 100 m/s, dl = 4 mm (Markuset al., 2000). Left: different melt types. Right: different instability modes for steel melt
immediately sheared off the liquid phase boundary at low wavelengths. These dropletsmake only a small contribution to the resulting spray; therefore the results of the stabilityanalysis need to be scrutinized or extended to more realistic boundary conditions. In addi-tion, linear evaluation of Figure 4.35 indicates that the wavelengths with maximum growthrate show only a slight dependence on the relative velocity between fluid and gas. Thisresult is, indeed, confirmed by experimental atomization investigations in Hardalupas et al.(1997).
Comparison of different modes of stability for a jet of molten metal in a coaxial gasflow has been discussed by Markus et al. (2000), based on solution of the stability problemdelivered by Li (1995). Results for growth rates of different metal melts are shown on theleft-hand side and results for the three basic modes of instability (m = 0, 1 and 3) for a steelmelt jet are illustrated on the right-hand side of Figure 4.36. The results have been calculatedfor a jet diameter di = 4 mm moving at a velocity vi = 2 m/s in a coaxial gas flow at constantvelocity vg = 100 m/s. The influence of material properties on melt jet stability is to beseen in the left-hand figure. Here, mainly the effect of the surface tension, increasing fromtin (σ = 0.544 N/m) via copper (σ = 1.31 N/m) to steel (σ = 1.83 N/m), can be observed.Increasing values for surface tension result in decreasing Weber numbers, which finally alsoresult in smaller amplitudes of the growth rate. In the same way, the dominant wavelengthof jet disintegration increases. In comparison to water jets, for molten metal jets the growthrates are much lower. Here somewhat higher energies (relative gas velocities) are used inorder to achieve similar atomization characteristics to those for water. But at higher relativevelocities, the significance of higher instability modes increases. Maximum growth ratesfor the steel melt jet are observed for the symmetric mode m = 0, but the asymmetric modem = 1 has almost identical growth rates, while higher modes show maximum growth ratesat much smaller values (see the right-hand side of Figure 4.36).

74 Fluid disintegration
Fig. 4.37 Liquid jet analysis. Left: experiment (steel). Right: theory – superposition of the threebasic instability modes (Markus et al., 2000)
A comparison of calculated growth rates and wavelengths from high-speed video pic-tures for primary perturbation of tin and steel melt jets in Markus et al. (2000) have shownthat theoretical wavelengths are smaller than those seen experimentally, by one order ofmagnitude. This has also been found in comparison of experiments, direct numerical simu-lations and results from linear theory for atomization of liquid sheets by Klein et al. (2002).However, superposition of different modes with adapted growth rates (which do not matchthose in Figure 4.36) results in quite a good picture of the processes involved in primaryperturbations of the liquid tin melt jet just in front of the exit from the atomizer nozzle.Figure 4.37 compares the primary excitation of a tin melt jet within a free-fall atomizernozzle, on the left-hand side, to the three main instability modes on the right-hand side.

75 4.3 Jet disintegration
growth of waves on sheet
fragmentation and breakdown of ligaments
formation of ligaments into drops
Fig. 4.38 Aerodynamic fluid fragmentation of a plane liquid sheet (Dombrowski and Johns, 1963)
4.3.2 Jet disintegration model
Free-fall atomizerIn the initial models for phase boundary behaviour introduced above, the stability analysesdiscussed focus on the excitation and initial growth of surface perturbations on the liquidjet. The next step in the disintegration model is to define the point at which the growingliquid element is separated from the main excited jet. Here additional models for liquidseparation are needed. First attempts for derivation of a jet disintegration model based onthe spray structure and a correlation equation for the resulting droplet-size distribution are tobe found in Dombrowski and Johns (1963). Their model for the aerodynamic disintegrationof a plane liquid jet emerging from a planar slit nozzle is illustrated in Figure 4.38. Startingfrom the growth of an instability at the interface, at first plane liquid elements, or ligaments,are separated from the jet in a longitudinal direction, which are deformed to cylindricalelements further downstream. Next, due to capillary instabilities these cylindrical ligamentsdisintegrate into fragments that build, by the action of surface tension, the resulting dropletstructure in the jet. From this initial model, further attempts to describe the continuumdisintegration, especially for metal melts within twin-fluid atomization by gases or liquids,are documented in Antipas et al. (1993), Burger et al. (1989, 1992) and von Berg et al.(1995). The starting point for their models of liquid disintegration is the hypothesis thatthe unstable wave, having maximum excitation and growth rate ωr, will prevail againstthe entire unstable wavelength spectrum and therefore will grow fastest. This wave at thecritical wavelength λmax will finally lead to the primary break-up of the liquid jet.
A model for primary liquid disintegration for a cylindrical fluid jet in a coaxial gas flowfield will be discussed next, as outlined in Figure 4.39. The primary fragmentation processrelating to shear flow instabilities for a cylindrical jet can be described by separation of

76 Fluid disintegration
Rp
up
ug
dp
hp
dtor
Fig. 4.39 Model of fragmentation and the drop-formation mechanism within coaxial twin fluidatomization
a fluid ligament, which has been formed from sinusoidal surface waves of the liquid jet.The initial ligament volume of this separated liquid element is Vsin. This detached liquidelement is deformed due to surface tension effects to form a toroidal (ring-shaped) liquidelement having identical volume Vtor:
Vsin = 2(Rl + πhl/8)λmaxhl = 2π2 R2tor(Rl + πhl/8) = Vtor. (4.44)
This toroidal element is inherently unstable and will fragment, due to capillary instabilityfrom surface tension effects, into individual droplets. From the derivation mentioned above

77 4.3 Jet disintegration
2 3 4 5 6
atomization gas pressure p [bar abs.]
0
100
200
300
400m
ean
part
icle
siz
e dp
[µm
]num. 1 num. 2 num. 3
Lubanska (1970) exp.
Fig. 4.40 Resulting drop size of the fragmentation model
for high wavelengths at maximum growth rates (Taylor-instability), the resulting droplet-size diameter in the spray can be derived as:
dp = 1.89, dtor = 3.78
√λmaxhl
π2. (4.45)
For evaluation of the separating liquid volume, in addition to description of the criticalwavelength λmax with maximum growth rate from linear instability analysis, the criticalheight of the surface wave at the time of separation from the main jet is necessary. A simplemodel for the critical ligament height, dependent on the wavelength, has been formulatedby Bradley (1973) with the correlation:
hcrit = λmax/4. (4.46)
The final fragmentation model for a round molten metal jet in a coaxial gas flow field withina free-fall atomizer consists of the steps:
� analysis of jet instability,� derivation of maximum unstable wavelength,� calculation of primary ligament volume (ring),� derivation of resulting droplet size.
The model determines the mean drop-size diameter of the spray. This model has been usedfor the analysis of atomization of a steel melt within a free-fall atomizer, and is shown inFigure 4.40. Here the dependency of the mean value of the droplet-size distribution in thespray on atomizer gas pressure p is illustrated.
For stability analysis and derivation of maximum growth rates within the fragmentationmodel, an estimation of relevant gas velocities has been performed dependent on gas pres-sure. Here the measurement results of Heck’s (1998) investigation have been used for themaximum gas velocities in the atomizer. This maximum gas velocity at the centre-line of

78 Fluid disintegration
the jet, is dependent on gas pressure, and this in turn is dependent on the gas mass flow rate,correlated by:
umax = 645.25m0.585g . (4.47)
The mass flow rate of the atomizer gas is related to the absolute gas pressure in the plenumof the atomizer by:
mg = 0.685µ f Ap0√RT0
, (4.48)
which is dependent on the total gas nozzle exit area A. The frictional coefficient for thegas flow emerging from the atomizer has been taken as µf = 0.8, in good representationof measurements. From this gas flow description, the principal mass flow rate correlationalready described in (4.25) can be derived. Three different relations for droplet sizes in thespray, based on three variations of the critical ligament height prior to stripping from thejet, have been calculated based on the different boundary conditions:
� Number 1: critical ligament height hcrit = λmax/2, boundary layer factor ξ g = 1;� Number 2: critical ligament height hcrit = λmax/4, boundary layer factor ξ g = 1;� Number 3: critical ligament height hcrit = λmax/4, boundary layer factor ξ g = 0.8.
Drop-size correlationFor comparison with model results, the data for a representative spray droplet size calculatedfrom Lubanska’s (1970) correlation are also plotted in Figure 4.40. This empirical correl-ation of particle sizes within molten metal atomization is successfully used in a numberof investigations for comparison, as it reflects the most relevant influences of physical andprocess conditions on atomization in terms of median droplet sizes and standard deviations:
dp = dl KLub
[νl
νg
1
We
(1 + ml
mg
)]0.5
. (4.49)
In this correlation, the liquid/gas viscosity ratio ν l/νg is used, as well as the liquid Webernumber We = ρlu2
maxdl/σl and the inverse of the mass flow rate ratio (1/GMR; GMR =gas/metal mass flow ratio). The empirical constant KLub in (4.49) should mainly reflectdifferent atomizer geometries. Lubanska (1970) has given its value to be between 40 and80, but several other investigations have found much greater values. Several investiga-tions have attempted to verify Lubanska’s formula for metal particle-size distribution frommelt atomization. Rao and Mehrotra (1980) investigated the influence of nozzle diameterand atomization angle on particle sizes, finding that the mean droplet size decreases withdecreasing nozzle diameter and increasing atomization angle. They found a different valuefor the exponential factor as well as for the atomizer-dependent constant in Lubanska’scorrelation. Another modification has been proposed by Rai et al. (1985), who studiedmelt atomization within ultrasonic gas atomizers, and proposed modification of Lubanska’sformula.
A discussion and evaluation of the relevance of Lubanska’s formula for the atomizationof metal melts is to be found in Bauckhage and Fritsching (2000). A broad overview

79 4.3 Jet disintegration
relative flow
liquid metal
ηab2πR SηB
s
F
*
Fig. 4.41 Stripping and drop formation mechanisms (Burger et al., 1989, 1992)
of a number of empirical correlations for mean and median droplet sizes dependent onoperational conditions and nozzle types and geometries for melt atomization within differentatomizer configurations can be found in Liu’s (2000a) work.
As can be seen from Figure 4.40, taking into account the boundary layer behaviour ofthe gas at the gas/liquid interface results in larger particle sizes from calculation duringatomization. Despite some important quantitative deviations from measurement results, thetheoretical approaches described above for a disintegration model obtain useful qualitativeassessments of the resulting mean or median droplet sizes during atomization of melts. Also,the effect of changing operational or process parameters and gas or liquid melt propertieson the droplet-size spectrum are quite easily assessed by model approaches.
Additional refinements of such fundamental models for primary disintegration withintwin-fluid atomization are based on a more detailed analysis of the liquid stripping mecha-nism from the liquid surface and a description of the most relevant wavelengths at highestgrowth rates. Here the work of von Berg et al. (1995) and Burger et al. (1989; 1992) pro-vides some useful and detailed correlations. In agreement with the earlier investigations ofJeffreys (1924), these authors observed that the gas flow field attacking the wave, undercritical conditions, will result in stripping of the wave crest and not of the whole wavevolume, while the mean height of the wave remains practically unchanged. A principalsketch of this modelling assumption is shown in Figure 4.41, which also lists the relevantparameters of the model. The turbulent boundary layer character of the gas is taken intoaccount during linear stability analysis of the liquid jet, as in the model of Miles (1957,

80 Fluid disintegration
1958, 1960, 1961). Starting with an energy balance at the wave crest, where the work doneby the gas on the wave crest is related to the free surface energy which is created by thenewly generated liquid surface, the critical wave height for stripping �h = ηab − ηB is:
�h ≥ 4σl
cdρgu2rel
. (4.50)
In this model a resistance coefficient cd is introduced for the gas flow at the wave crest. Thiscoefficient takes either a constant value (Burger et al., 1984) or, alternatively, is derivedfrom the local pressure distribution at the wave form (Burger et al., 1992). In the latter, theresistance coefficient depends on the local height of the wave. The basic height of the waveηB is taken as constant with a value of half the wavelength (length to height ratio of thewave is l/d = 2). From this value the variable diameter of the stripped liquid elements (inthe case of a cylindrical element) dcyl is derived.
In a further refinement of this model, Schatz (1994) linked the primary liquid fragmen-tation process directly into a simulation of two-phase flow in the disintegration area. Herethe behaviour of both phases is simultaneously analysed by conservation equations. First,stepwise stripping of fluid elements from the central jet, as in the above model, is calcu-lated. Then, the resulting decrease of the liquid mass within the remaining liquid jet isderived. The contribution of the stripped fluid ligament to the successive fragmentationprocess and the resulting drop-size distribution are calculated. Next, development of thenow reduced liquid jet diameter is observed and directly related to the local gas flow fieldat that particular location. The stripped fluid drops and ligaments are introduced as sourceterms for mass and momentum in the calculation of the multiphase flow field. Continuationof the fragmentation process leads to successive stripping and, therefore, lowering of thejet diameter. The coupling and interaction between the phases is regarded for in this way.The calculated local drop-size contributions of the discrete stripping events are combined toachieve the final droplet-size distribution of the spray. The initial configuration of the sprayafter atomization is derived in this way. Ongoing further fragmentation of these droplets dueto secondary atomization processes is not taken into account. Therefore, the finest dropletsin the calculated droplet-size distribution are underrepresented. From these results of modelcalculation, concepts for optimized nozzle configurations for liquid and melt atomizationhave been derived (Schatz, 1994).
Close-coupled atomizerClose-coupled atomizers are particularly common in metal powder production processes.The advantage of this type of atomizer is that it forms a prefilm at its lower edge, whichafterwards is disintegrated. The basic concept for modelling the fragmentation process ofmetal melts within a close-coupled atomizer arrangement has been derived by Antipaset al. (1993). This concept deviates from the aforementioned models for free-fall atomizersin terms of the basic fragmentation process and the contribution of the stripped fluid ring(for a cylindrical jet). Instead of using Taylor fragmentation to describe disintegration ofthe liquid ring, an analysis based on the Kelvin–Helmholtz instability theory is performedfor this fluid element. The droplet stripping mechanism begins with the cylindrical shape

81 4.3 Jet disintegration
radius
nozzle distan
radius
nozzle distance
Fig. 4.42 Calculation of the gas flow field in the vicinity of a close-coupled atomizer (Liu, 1997)
of the primary ligament. Not only the fastest growing wave, but the total unstable wavespectrum, contribute to the liquid jet disintegration process (expressed in terms of a lowerand an upper bound to the excitation spectrum). The atomizer in this study is operatedunder supercritical conditions, but the gas velocity used in Antipas et al.’s (1993) calcu-lations has been taken as constant, with a value of the local speed of sound. Comparisonbetween calculated and experimental data for atomization of some different aluminiumalloys in close-coupled atomizers and to Lubanska’s correlation for mean drop sizes,yields heavily scattered results: a reasonable explanation for this behaviour has not beengiven.
A two-stage approach to describe primary and secondary fragmentation processes in aclose-coupled atomizer has been derived by Liu (1997). First, a single phase, transonicand turbulent gas flow field is simulated in the atomizer. As a result, the gas velocitydistribution and the location of recirculation areas are introduced as boundary conditionsfor the fragmentation model. The Reynolds-averaged Navier–Stokes (RANS) equations,Eq. (3.1), are solved using a conventional k–ε turbulence model. The grid system usesnon-equidistant resolutions of the grid cells, especially in the area close to gas outlets.Figure 4.42 illustrates the resulting streamlines (left side) and the velocity vector distributionof the gas flow (right side). The effect of feedback of the moving fluid on gas flow behaviour isnot taken into account (neglecting coupling effects between phases). Based on experimental

82 Fluid disintegration
observations of fragmentation processes in close-coupled atomizers (Unal, 1987, 1988), itis assumed that the emerging fluid exits the tundish as a radial film, at the lower side ofthe nozzle tip, and is directed towards the gas jet delivery area. This effect is due to theso-called aspiration pressure of this type of atomizer. The surface velocity of the liquid filmv f and the film thickness τ f in this area are derived from a Couette flow analogy:
τ f =[
µl
µg
ml
πρlr
(dvg
dz
)−1]0.5
, (4.51)
v f =[µg
µl
ml
πρlr
(dvg
dz
)]0.5
. (4.52)
At the outer edge of the wetted nozzle tip, the liquid film is attacked by the gas flow fieldand is reflected into the main gas flow direction. The liquid, from this point on, moves asa free concentric ring in the direction of the gas streamlines. After a certain distance, theliquid film fragments into droplets. The characteristic distance from the atomizer to thefragmentation point is derived from empirical data:
L f = 1.23 τ 0.5f We−0.5
f Re0.6f . (4.53)
The Weber number Wef and Reynolds number Ref of the film are derived using the localfilm thickness τ f and relative film velocity u f as: We = τ f ρgurel/2σl ; Re = τ f ρlu f /µl . Asa result of the basic fragmentation process, droplets are produced at a characteristic dropsize (here: Sauter mean diameter, SMD d3.2) based on fitting to a semi-empirical model:
d3.2 = 12σl
ρlu2rel
/[1 + 1
/(ε
mg
ml
)]+ 4 σl
τ f
(4.54)
and
ε = 1.62
u1.3g
(mg
ml
)0.63µ0.3
l
. (4.55)
The droplets from this primary fragmentation process may be further disintegrated intosmaller droplets depending on the local relative flow conditions. For this secondary disinte-gration model, the results of investigations from Hsiang and Faeth (1992; see Section 4.3.3)are used.
The empirical input of this model within close-coupled atomizers (Liu, 1997) is rel-atively high. However, comparison of Liu’s simulated results with experimental datagives reasonable agreement for the mean droplet size. This comparison is illustrated inFigure 4.43. The cumulative drop-size distribution shows that at the upper end of the spec-trum, that a significant amount of big droplets is missing in the calculation. This may bedue to the neglected two-way coupling effect between the movement of the droplets andthat of the gas phase. Here, due to neglect of the gas momentum sink for acceleration ofdroplets, the gas flow velocity in the fragmentation area has possibly been overestimated.

83 4.3 Jet disintegration
1.0
0.9
0.8
0.7
0.6
0.5
0.4
0.3
0.2
0.1
0.00 50 100 150 200 250
droplet size (µm)
cum
ulat
ive
wei
ght p
er c
ent (
wt.
%)
simulation(MMD/SMD = 1.2)simulation(MMD/SMD = 1.5)experiment
Fig. 4.43 Comparison of calculated and measured particle-size distributions (Liu, 1997) SMD, Sautermean diameter; MMD, mass median diameter
Another model for fragmentation of a metal melt in a close-coupled atomizer has beenintroduced by Ting et al. (2000). This evaluates the effect of aspiration pressure on the flow ofgas and liquid. In this way, flow in the atomization gas results in varying pressure distributionat the melt outlet. Based on dynamic assumptions for the gas flow field near the nozzle, forincreasing gas pressures, Ting et al. conclude that with increased gas pressures an oscillatinggas flow field may occur. This effect will result in the temporal occurrence of centralorthogonal shock structures near the nozzle. Based on this observation, a fragmentationmodel is derived which predicts, for gas pressures exceeding a configuration-dependentthreshold value, a pulsating melt flow field at the nozzle tip: a pulsating atomization processis, therefore, predicted.
General fragmentation modelling approachesSeveral contributions attempt to derive a more general description of drop-size distributionsresulting from atomization processes. These are based, for example, on statistical approachesand on tools which derive a probability density function in relation to the process to beanalysed. The maximum entropy formalism (MEF) is such a statistical tool that deliverspartial information for a specific process (based on a number of compulsatory conditions)by transformation into a suitable distribution function. It is a statistical tool and does notcontribute any physical aspects to the analysis of fragmentation processes. Fundamentaldevelopments in the application of MEF to the analysis of liquid fragmentation processesand derivation of the resulting droplet-size distributions in sprays have been done, forexample, by Sellens and Brzustowski (1985) and Li and Tankin (1987). Their approacheshave been further developed by Ahmadi and Sellens (1993) and Cousin and Dumouchel(1997). The fundamental basis of these works is the description of a probability density

84 Fluid disintegration
function of the particle-size distribution qr (d) from the Shannon entropy (uncertainty) (seeShannon and Weaver, 1949):
Sha = −kS
∞∫0
qr (d) ln(qr (d)) dd, (4.56)
where kS is a constant, to be determined by the dimensionality of the specific process underinvestigation.
The MEF allows anticipation of the probability density function depending on a numberof mathematical constraints. These constraints are based on a number of known conservationproperties of the process and their distribution, and are equivalent to moments of differentorders of the distribution. Without further limitations, a number of different probabilitydensity functions will fulfil a given set of constraints. The MEF describes the best-fitsolution as a function of the point at which entropy reaches a maximum value.
For description of the particle-size distribution in a spray in terms of the density distribu-tion, the set of constraints can be described by the normalization criteria and the conservationcondition (Cousin and Dumouchel, 1997):
dmax∫dmin
q0(d) dd = 1, (4.57)
dmax∫dmin
q0(d) d pdd = d pp0, (4.58)
where dmin and dmax represent the minimum and maximum droplet diameter in the spray andp and dp0 (characteristic droplet diameter of the distribution, pth moment of the droplet-size distribution) are predefinable input parameters. Without further information on theprocess to be characterized, a constant density number of the droplet-size distribution forall particle-size classes is achieved. Maximization of the Shannon entropy based on theabove constraints leads to the required particle-size distribution in the spray:
q0(d) = e(−a0−a1d p), (4.59)
containing the Lagrangian multiplication factors a0 and a1. Cousin et al. (1996) describe theresulting density number based on the particle-size distribution of a pressure-swirl atomizerin this formalism as:
q0(d) = p(p−1)/p
�S
(1
p
)dp0
e( −d p
pdpp0
), (4.60)
containing the Gamma function �S. The determination of input parameters like p and dp0
is either based on specific singular measurements (Ahmadi and Sellens, 1993) of momentsof a measured spray particle-size distribution or by linear stability analysis of the frag-mentation process (Cousin and Dumouchel, 1997). For an atomization process where the

85 4.3 Jet disintegration
principal disintegration mode is constant (i.e. a constant fragmentation mode), the mean orcharacteristic particle size and the particle-size distribution width can be determined.
Further developments of MEF for spray and atomization processes are to be found inMalot and Dumouchel (1999) or Prud’homme and Ordonneau (1999), and for applicationin ultrasonic liquid atomization see Dobre and Bolle (1998).
Application of MEF to the atomization of liquid metals or spray forming applicationshas not been performed so far. Despite the empirical input required, use of this approach ispromising.
Direct numerical analysis and simulation of phase boundary dynamicsBased on the discussion in Section 4.1.2 of the contour of the emerging liquid jet from anatomizer nozzle, direct numerical simulation of the dynamics of cylindrical fluid jets andphase boundaries may be performed. For physical modelling of this process, two importantaspects have to be taken into account:
� the surface tension at the liquid/gas phase boundary has to be regarded as a boundarycondition and
� localization of the transient phase boundary and its movement.
In addition to these two constraints, the excitation and deformation of a liquid jet in a coaxialgas flow needs to be discussed first. The calculations for this model are based on a two-dimensional approach. Therefore, only symmetrical perturbations of the liquid surface areanalysed. Higher instability modes of the movement of the liquid surface are not analysedin this way. Therefore, the calculation is simplified and does not reflect all the deformationfeatures encountered in reality in liquid jet. The surface tension model of Brackbill et al.(1992) is used in these calculations.
Figure 4.44 simulates the actual fluid jet contour at an external excitation wavelengthof (2di ) and for the case of a coaxial gas velocity of 100 m/s. Movement and initiation ofsurface perturbations on the jet interface can be described in this way. Wave growth mustbe initiated by external excitation of the fluid jet at the entrance into the calculation area.Without external excitation, numerical instabilities overlay the solution. The reason for thisis that the grid system used for this application is too coarse.
Recent investigations (Klein et al., 2002; Lafaurie et al., 1994; Lozano et al., 1994;Mayer, 1993; Zaleski et al., 1995) describe the complex phase boundary behaviour betweengas and fluid, including the primary fragmentation process in atomization, based on a directmultiphase flow simulation. Rapid developments in the area of computer hardware, as well asin physical and numerical development of multiphase fluid models, allow completely three-dimensional numerical analyses, from initial liquid jet deformation to primary fragmentationof the liquid jet within the atomization process (Zaleski and Li, 1997). Based on the methodsintroduced in Section 4.1.2, such as the volume of fluid (VOF) method (Nichols et al., 1980),in combination with surface reconstruction methods like the piecewise linear interfacecalculation (PLIC; Li, 1996), sufficient grid resolution of these calculations can be realized.Fragmentation and the simultaneous coalescence of fluid elements are described by these
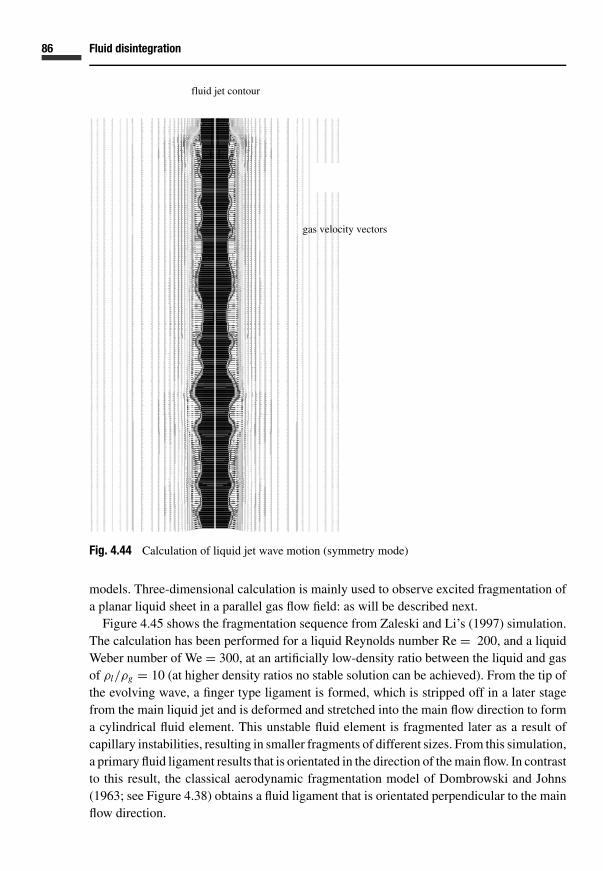
86 Fluid disintegration
fluid jet contour
gas gas velocity vectors
Fig. 4.44 Calculation of liquid jet wave motion (symmetry mode)
models. Three-dimensional calculation is mainly used to observe excited fragmentation ofa planar liquid sheet in a parallel gas flow field: as will be described next.
Figure 4.45 shows the fragmentation sequence from Zaleski and Li’s (1997) simulation.The calculation has been performed for a liquid Reynolds number Re = 200, and a liquidWeber number of We = 300, at an artificially low-density ratio between the liquid and gasof ρl/ρg = 10 (at higher density ratios no stable solution can be achieved). From the tip ofthe evolving wave, a finger type ligament is formed, which is stripped off in a later stagefrom the main liquid jet and is deformed and stretched into the main flow direction to forma cylindrical fluid element. This unstable fluid element is fragmented later as a result ofcapillary instabilities, resulting in smaller fragments of different sizes. From this simulation,a primary fluid ligament results that is orientated in the direction of the main flow. In contrastto this result, the classical aerodynamic fragmentation model of Dombrowski and Johns(1963; see Figure 4.38) obtains a fluid ligament that is orientated perpendicular to the mainflow direction.

87 4.3 Jet disintegration
T = 13.0 T = 16.5
T = 9.50T = 7.50
Fig. 4.45 Fragmentation simulation of a plane liquid sheet (Zaleski and Li, 1997)
Direct numerical calculation (only in two dimensions) of the dynamics of phase bound-aries of a planar liquid sheet is performed by Lafaurie et al. (1998) and Klein et al. (2002).They discuss some of the main effects of liquid parameters, like the density ratio, theviscosity ratio and capillary effects, on the primary fragmentation mechanism, based onsimulation results and comparisons with experimental results.
Despite the limited capabilities of direct numerical simulations in terms of the possi-ble spectra of process parameters (stable solutions are to be achieved only with simplifiedparameters for a small range of liquid conditions), discussion of such simulation results willgive a much deeper insight into the physics of fragmentation processes in the near future.This approach enables derivation of some important fragmentation process parameters, andthe possibility of calculating a great number of parameter sets will help to optimize atom-ization processes (for example, advanced atomizer configurations or atomization assistedby external or internal excitation of the liquid jet).
4.3.3 Secondary atomization
Following the primary fragmentation process of a liquid jet into droplets and/or fluid liga-ments, further break-up of these liquid elements depending on the local flow structure may

88 Fluid disintegration
Low We
High We
Fig. 4.46 Secondary droplet atomizations: bag- and stripping-type break-up of a droplet (Bayveland Orzechowski, 1993)
occur. This fragmentation process is called secondary atomization. A general discussionof the principal mechanisms and results of secondary liquid atomization processes is to befound in Faeth (1990), Hsiang and Faeth (1992, 1993), Bayvel and Orzechowski (1993), aswell as Sadhal et al. (1997). In this context, secondary fragmentation due to aerodynamiceffects is described here; other effects like fragmentation of droplets during collision or thecollision of droplets and solid surfaces will be discussed in separate chapters.
For the description of secondary atomization of liquid elements, fragmentation modelsare used which are different from those discussed earlier. These models are divided intotwo main modes. Both are initiated by perpendicular flattening of the element due to theasymmetric pressure distribution acting on the surface of the liquid in the gas flow field at arelative velocity between the gas and the droplet. Another principal mode of disintegrationis valid for asymmetric flow fields, as in shear flows, and will not be referred to here. First,one needs to distinguish between two basic modes of fragmentation: bag-type break-up andstripping-type break-up. In the former, the flattened fluid element forms an inner membranewhich is drawn out from inside the liquid element. In a subsequent stage, this membranebreaks up into a series of relatively small droplets. This model is illustrated in Figure 4.46(Bayvel and Orzechowski, 1993), which is valid for:
We = ρgu2reldp
σ> 12. (4.61)
In the case of stripping-type break-up, droplets are produced by stripping from the edge ofthe fluid element. This behaviour is observed for
We√Re
> 1, (4.62)
and is also illustrated in principle in Figure 4.46.A third mode of secondary atomization may be introduced by elongation of the fluid ele-
ment in an external flow field with velocity gradients. Here, the elongated particle fragments

89 4.3 Jet disintegration
Stripping/Shear mode
Catastrophicmode/Taylor
Bag/Umbrellamode
V ibration/Distortion
10 5
10 4
10 3
10 2
10 1
10 0
We
~10
~0.5 — 0.8
0.1
We/Re**0.5stripping/shear mode
catastrophic mode/Taylor
bag/umbrella mode
vibration/distortion
Fig. 4.47 Modes of secondary break-up of droplets, Reynolds number Re, aerodynamic Webernumber We (Delplanque and Sirignano, 1994)
into small droplets due to Rayleigh instabilities in the liquid fibre. A number of subdivi-sions to these main modes of secondary atomization have been described (Bayvel andOrzechowski, 1993; Sadhal et al., 1997). No general models valid for the entire range ofprocesses and liquid parameters are available: additional research is needed in this area.
The dependence of the main modes of secondary droplet break-up Weber and Reynoldsnumbers, is illustrated in Figure 4.47.
Secondary drop fragmentation models in spray analysis have been successfully usedby O’Rourke and Amsden (1987; the Taylor analogy break-up (TAB) model), which isfrequently cited, and by Reitz and Diwarkar (1987) for analysis and simulation of Dieselinjection spray drop break-up.
An important criterion for droplet break-up is (besides the critical Weber number limit,as a steady limit) the dynamic behaviour of the liquid. Therefore, minimum interactionand deformation times, as well as a minimum fragmentation time, need to be determined.Without regard to such dynamic effects, the real fragmentation rate will be overestimatedin static models. The fragmentation delay has been formulated by Nigmatulin (1990) andhas been used, for example, in the work of Berthomieu et al. (1998) as:
tfragmentation
t∗ = 6(1 + 1.2La−0.37)(log We)−0.25. (4.63)
The dynamic scale of fragmentation is derived in terms of a dimensionless time t∗ and theLaplace number La:
t∗ = dp
urel
√ρl
ρg, La = ρlσdp
µ2l
. (4.64)
Secondary processes during the atomization of molten metals are important, though in thiscase the droplet Weber number is usually very low because of the high surface tension ofmolten metals.
Secondary break-up in spray forming applicationsA secondary melt atomization break-up model for spray forming applications has beenderived and applied by Markus and Fritsching (2003). From an initial classification of dropletbreak-up mechanisms, several investigations describe the resulting droplet diameters. The

90 Fluid disintegration
TAB model of O’Rourke and Amsden (1987) derives the resulting Sauter mean diameter(SMD) d3.2 for very low,
d3.2 = 3
7dp for We → Wecrit, (4.65)
and high Weber numbers:
d3.2 = 12dp
ρgu2rel
for We → ∞. (4.66)
The initial droplet diameter is dp.Hsiang and Faeth (1992) derived an empirical correlation between the SMD and the
Ohnesorge (Oh) and Weber numbers for conventional liquids at various viscosities
d3.2
dp= 1.5Oh0.2 We−0.25
g (4.67)
in the range Oh0.2 Weg−0.25 = 0.05 . . . 0.4. In the case of shear break-up, the resulting
droplets, with diameter d, have been found to follow a normal distribution path:
f (d) =√
d/d50
2√
2πσde− 1
2
(√d/d50 − µ
σ
)2
, µ = 1, σ = 0.238. (4.68)
The normal particle-size distribution has been taken by Schmehl (2000) to indicate bag-and multimode-type break-up mechanisms.
The dynamics of secondary droplet break-up depend on the aerodynamic Weber number.At critical conditions, at first the droplet deforms to a disc and then breaks up into smallerdroplets, as illustrated in Figure 4.48. The characteristic break-up time is t∗ and the defor-mation time is tdef = 1.6t∗ (Hsiang and Faeth, 1992). The data of Samenfink et al. (1994)may be used for the total break up time scale tb as:
tb = kt∗, (4.69)
where k is an empirical constant. Compared with the break-up time, the spheroidizationtime ts of a droplet after break-up is small and may be neglected in a model (Nichiporenkoand Naida, 1968):
ts = 0.88µl dp
σ. (4.70)
As an example, the spheroidization time of a molten steel droplet of 100 �m size is ts = 250ns and therefore ts << tb.
The computational approach described here for the secondary break-up process in moltenmetal atomization and spray forming is based on a two-dimensional representation of thefragmentation zone. The description of the secondary break-up process for complex nozzlegeometries accounts for the total bulk of all molten particles. Every particle in the break-up zone of the spray is tracked and calculated. Therefore, within the overall model of thebreak-up process, the following have been taken into account:

91 4.3 Jet disintegration
new particles, d3,2
tbtdef
Fig. 4.48 Sequential deformation and break-up of a droplet
� the probability of drop break-up;� the outcome of drop fragmentation;� a model for droplet acceleration and simultaneous solidification/cooling of all particles;
and, eventually,� a model for possible drop collisions (coalescence or fragmentation).
For each particle, instantaneous thermal and kinetic situations are analysed, and a decisionis made as to whether the break-up procedure is initialized or not. The break-up modelterminates when:
� either the critical Weber number is not achieved,� or the droplet has been cooled down to the point at which nucleation (including an appro-
priate undercooling model, see Section 5.1.2) first occurs (see solidification modelling inSection 5.1.2). Here it is assumed that the viscosity of the droplet rapidly increases andprevents the droplet from breaking up further.
The computational approach is one-way coupled (i.e. the particles have no effect on thebehaviour of the gas phase) and drop collisional effects have been ignored. The prescribedgas field variables are: the mean gas velocity in axial and radial directions ug , vg; theturbulent kinetic energy k of the gas, and from there the turbulent velocity componentsu′
g , v′g , and the gas temperature Tg . The distribution of gas parameters near the atomizer
nozzle is taken from experimental investigations or gas flow simulations (see Section 4.2).The derivation of models for description of droplet kinetics and thermal behaviour along adroplet trajectory (plus a suitable solidification model) will be described in Chapter 5.
Results for the atomization of a nickel-based superalloy are shown here for secondarybreak-up in a standard free-fall atomization nozzle arrangement for an atomization pressureof pg = 0.4 MPa, a gas, metal mass flow ratio (GMR) of = 0.68, and a molten metal jetdiameter of d0 = 4 mm. Starting with the analysis of linear metal jet stability prior to breakup (see Section 4.1.2), the initial ligament/particle diameter and the initial variance of thedistribution have been estimated as the first input parameters for the secondary break-upmodel.

92 Fluid disintegration
25 50 75 100 125 150 175 200
10
20
30
40
50
Fig. 4.49 Result of secondary break-up simulation accounting for all particles (shading is used torepresent the thermal state of the droplets; Markus and Fritsching, 2003)
0
10
20
30
40
50
60
70
80
90
100
0 100 200 300 400 500 600
50 mm
60 mm
70 mm
80 mm
90 mm
100 mm
150 mm
200 mm
50 mm
60 mm
70 mm
80 mm
90 mm
100 mm
150 mm
200 mm
particle diameter [µm]
cum
ulat
ive
mas
s [%
]
Fig. 4.50 Cumulative particle-size distribution as a function of secondary droplet break-up withrespect to distance from the primary break-up point (Markus and Fritsching, 2003)
Figure 4.49 shows the simulation results of secondary droplet break-up in the atomizer atdistances between 0 and 200 mm from the nozzle: the instantaneous spatial distribution ofdroplets in a two-dimensional slice through the spray is shown. Shading of the droplets isused to depict individual particle temperatures. The continuous intake length of the metal jetprior to break-up is assumed to be L = 30 mm. Most particles are produced in a secondaryfragmentation zone, a short distance (�x ∼ 50 mm) from the region of primary break-up. Once break-up is terminated (due to undercritical kinetic conditions or achievement ofdroplet solidification), the droplets are only further accelerated slightly, before being spreadout due to turbulence.
The resulting cumulative particle-size distribution does not in the initial spray shiftstowards smaller particles with increasing distance from the nozzle. At the start of thedisintegration process, especially, only a few large particles contain most of the melt mass(see Figure 4.50). The secondary break-up process is almost complete at a nozzle distance

93 4.3 Jet disintegration
of 80 mm, as the droplet-size distribution does not change further at increasing nozzledistance. Therefore, in this case, the break-up region is located within 50 mm of the spray.
The results of the break-up simulation at this point may be used as input parametersfor two-phase simulation of spray behaviour (e.g. including coupling effects and othersubmodels, see Chapter 5). From the break-up model, the initial droplet-size distribution,the spray angle and the mass flux distribution after fragmentation, may be used to derivethe spray model following.

5 Spray
Analysis of turbulent multiphase flow in a spray is of major concern during numericalmodelling and simulation, as the turbulence is responsible for a number of subprocessesthat affect spray forming applications. These result from coupled transport between dropand gaseous phases, and from extensive transfer of momentum, heat and mass betweenphases due to the huge exchange area of the combined droplet surface. Physical modellingand description of these exchange and transport processes is key to the understanding ofspray processes.
In spray forming, especially, the thermal and kinetic states of melt particles at the point ofimpingement onto the substrate, or the already deposited melt layer, are of importance. Thisis the main boundary condition for analysis of growth, solidification and cooling processesin spray formed deposits. These process conditions finally determine the product quality ofspray deposited preforms. By impinging and partly compacting particles from the spray, asource for heat (enthalpy), momentum and mass for the growing deposit is generated. Themain parameters influencing successful spray simulation in this context are:
� the local temperature distribution and local distribution ratio between the particles andthe surface of the deposit,
� particle velocities at the point of impingement, and� the mass and enthalpy fluxes (integrated rates per unit area and time) of the compacting
particles.
Distribution of these properties at the point of impingement is determined mainly by thefragmentation process and by the transport and exchange mechanisms in the spray.
An important point for further process developments within spray forming is the appli-cation of suitable measurement and in-process control equipment for in-situ detectionof spray particle properties. However, due to the harsh environment within metal sprayapplications and the extreme process parameters to be covered, the determination of particlethermal properties in spray forming relies mainly on numerical data. Modelling approachescan only derive the thermal state of the particles in terms of temperature, plus the stateof solidification of the particles. Here multiphase flow simulation at different degrees ofcomplexity may be applied. The term complexity in this context stands for:
� increasing effort needed for simulation and numerical calculations,� the possibility of simultaneously analysing a higher degree of interactions between phys-
ical processes and providing significantly greater description of subprocesses.
94

95 Spray
Therefore, the term complexity is directly coupled to the demand for process parameterdetails and the properties to be derived.
Different stages of complexity of spray analysis can be reflected in the number of physicaldimensions (in space and time) taken into account in the modelling approach and, in addition,by the number of coupling parameters (see, for example, Crowe (1980)):
(1) One-dimensional spray calculations analyse the behaviour of particles at the centre-lineof the spray only. The behaviour of these representative particles at the spray centre-lineis defined to be characteristic for the spray as a whole. Coupling between phases in thismodelling approach is not regarded.
(2) One-dimensional and quasi-two-dimensional approaches extrapolate the behaviourfrom the centre-line of the spray towards the spray in its entirety, based on suitablemodels or known empirical correlations.
(3) Full two-dimensional or three-dimensional models analyse and describe the multi-dimensional multicoupled spray behaviour directly.
Within one-dimensional and quasi-two-dimensional models for spray analysis, the effectof the gas phase (i.e. the gas velocity distribution – and in the case of metal atomization thegas temperature distribution) on the centre-line of the spray is prescribed, and is based on:
� measurement results and experimental investigations of the multiphase flow field in thespray,
� simplified analytical solutions or measurements of the single-phase flow (without atom-ization),
� numerical simulation results derived for comparable processes and transferred to thespecific application.
Adopting this approach, the behaviour of individual droplets in the spray can be determinedby tracking droplets of different size and properties through the spray. The effect of particlebehaviour on the state of the continuous gas phase is not regarded: this analysis feature isonly one-way coupled.
A quasi-two-dimensional model at first analyses the behaviour of the particle on thecentre-line of the spray (or on another characteristic particle trajectory) without coupling.By extrapolation (weighted or unweighted) of the results from the centre-line, based ona given local distribution of, for example, drop sizes and/or drop-mass fluxes, the radialdistribution of individual thermal and kinetic particles is derived, which is finally integratedand correlated with the state of the spray at impingement (Pedersen, 2003; Zhang, 1994).
Full two-dimensional or three-dimensional coupling determines the interaction andexchange of, for example, momentum, mass and thermal energy in the conservation balancefor both liquid and gaseous phases. For example, local acceleration of particles in a gasflow field results in a momentum sink for the gas phase, which is described by sink termsin the relevant momentum conservation equations of the gas phase (Grant et al., 1993a, b ).
The multicoupled simulation of turbulent dispersed multiphase flow, containing a con-tinuous phase (i.e. gas) and a dispersed phase (i.e. droplets or particles), is based on twodifferent modelling concepts:

96 Spray
� the Eulerian/Lagrangian approach, and� the Eulerian/Eulerian approach.
In common, both concepts use conservation equations for mass, momentum and energy,plus a suitable turbulence model within a Eulerian reference frame, to analyse the behaviourof the gaseous phase. The types of models mainly used in this context describe the stresstensor of additional turbulent stresses of the continuous phase, based on a Boussinesqapproximation with a turbulent viscosity vt. This turbulent viscosity is described by thelocal flow field configuration, and is based on conservation equations for the turbulentkinetic energy k and its dissipation rate ε.
More recent models for turbulent transport behaviour of the continuous phase dissolvethe wave structure anisotropically into different scale wavelengths, for example in:
� direct numerical simulation, DNS (see, for example, Albrecht et al., 1999);� large eddy simulation, LES (see, for example, Edwards, 1998; Bergstrom et al., 1999);� approaches based on probability density functions (pdf) of gaseous properties (see, for
example, Rumberg and Rogg, 1999);� discrete vortex methods (see, for example, Crowe et al., 1996).
These modelling approaches for continuous phases within a dispersed multiphase flow simu-lation provide extremely useful basic data on physical transport mechanisms and properties,but have been limited up to now to simple base geometries and boundary conditions.
The main differences between dispersed multiphase flow simulations are due to properdescription of the particulate phase. Here, either a particle tracking approach for individualparticles or for particle clusters is used (Lagrangian approach) or the dispersed phase istreated as a quasi-second fluid with spatially averaged properties (Eulerian approach). Theadvantages and disadvantages of both modelling approaches for dispersed multiphase flowproblems are discussed in a number of conferences and publications (see, for example,Crowe et al., 1996; Durst et al., 1984; Sommerfeld, 1996).
Eulerian/Lagrangian approachThe Eulerian/Lagrangian approach is closely related to the direct intuitive approach whichone would make to analyse the behaviour of dispersed multiphase flow. Individual particlesare tracked through the flow field and their local interaction with their specific surrounding isanalysed on the scale of the droplet size (point source assumption). In this context, a numberof significant physical effects may be incorporated, such as microscopic effects of the flowaround individual particles, interaction between neighbouring particles and the interactionof particles with surfaces. These effects may be important under specific circumstancesfor some types of multiphase flows. Some disadvantages of this approach may result fromthe necessary averaging of individual particle properties to derive the intermediate spraystructure at a specific position. Here a great number of particles need to be tracked in orderto obtain a statistically meaningful average. Coupling is achieved by including the localsources/sinks from the particles as point sources in the continuous equations. The mainmethod for coupled analysis of dispersed multiphase flow is the particle-source-in-cell

97 5.1 Particle movement and cooling
(PSI) algorithm of Crowe et al. (1977). Several models within spray forming applicationsbased on the Eulerian/Lagrangian approach have been published (see, for example, Grantet al., 1993a, b; Bergmann et al., 1995; Fritsching, 1995; Fritsching and Bauckhage, 1994a).
Eulerian/Eulerian approachIn the Eulerian approach, the dispersed phase is treated as a quasi-second fluid with spa-tially averaged properties. Integration of microscopic effects on the droplet-size scale, forexample, for interaction of droplets with each other, is much more complicated withinEulerian/Eulerian models than within the Lagrangian/Eulerian approach. Here, for exam-ple, analysis of dispersed phase turbulent properties and structures, as well as interactionsbased on stress tensor derivations of the dispersed phase, develop modelling problems.Such Eulerian/Eulerian modelling for two-phase jets has been discussed by Elghobashiet al. (1984). One advantage of this approach is the possibility of using almost identicalnumerical solvers and algorithms, as the basic equations for continuous and dispersed phaseshave identical structures. The drastically increasing effort of Eulerian particle models todescribe dispersed multiphase flows containing polydispersed particle-size distributions (asin this case each individual drop-size class needs to be treated with a separate set of conser-vation equations) limits the wider use of this approach in technical simulation applications.
Derivation of the spray structure within a spray forming process based on an Eulerian/Eulerian simulation approach has been done by Liu (1990) and by Fritsching et al. (1991).In this model the turbulent properties of the dispersed phase have been directly coupledalgebraically to the turbulence properties of the continuous phase, based on the turbulentviscosity concept. The particle-size distribution in the spray has been neglected, the particlesizes have been represented by the mean particle size of the spray only. Spray generation andspray development within molten metal atomization for a free-fall atomizer configurationhas also been documented by Dielewicz et al. (1999). Here, the coupling of a transonic gasflow field and a two-dimensional spray is discussed.
5.1 Particle movement and cooling
In this section some models, and their results, for particle movement and cooling alongthe in-flight particle trajectory during spray forming will be introduced. A fundamental
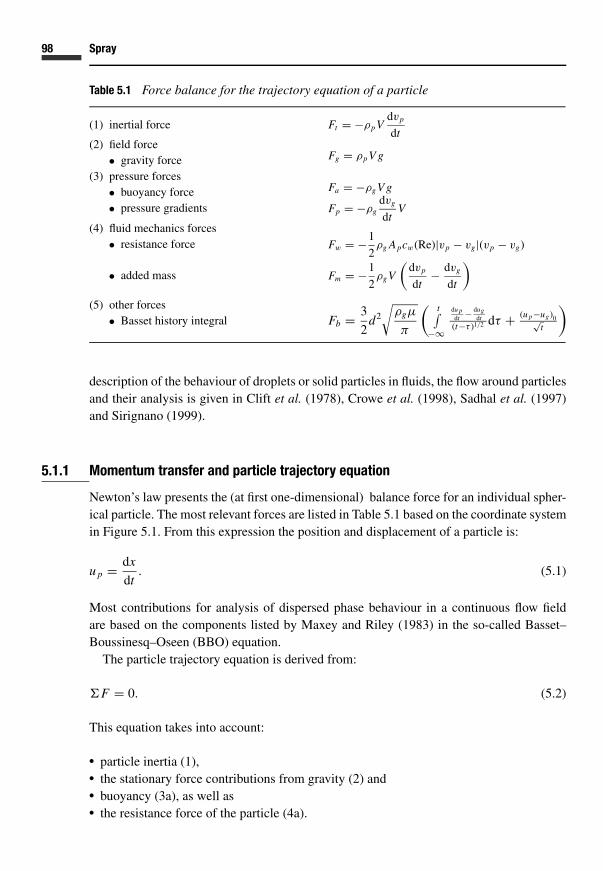
98 Spray
Table 5.1 Force balance for the trajectory equation of a particle
(1) inertial force Ft = −ρp Vdvp
dt(2) field force
• gravity force Fg = ρp V g
(3) pressure forces• buoyancy force• pressure gradients
Fa = −ρg V g
Fp = −ρgdvg
dtV
(4) fluid mechanics forces• resistance force
• added mass
Fw = −1
2ρg Apcw(Re)|vp − vg|(vp − vg)
Fm = −1
2ρg V
(dvp
dt− dvg
dt
)
(5) other forces• Basset history integral Fb = 3
2d2
√ρgµ
π
(t∫
−∞
du pdt − dug
dt(t−τ )1/2 dτ + (u p−ug)0√
t
)
description of the behaviour of droplets or solid particles in fluids, the flow around particlesand their analysis is given in Clift et al. (1978), Crowe et al. (1998), Sadhal et al. (1997)and Sirignano (1999).
5.1.1 Momentum transfer and particle trajectory equation
Newton’s law presents the (at first one-dimensional) balance force for an individual spher-ical particle. The most relevant forces are listed in Table 5.1 based on the coordinate systemin Figure 5.1. From this expression the position and displacement of a particle is:
u p = dx
dt. (5.1)
Most contributions for analysis of dispersed phase behaviour in a continuous flow fieldare based on the components listed by Maxey and Riley (1983) in the so-called Basset–Boussinesq–Oseen (BBO) equation.
The particle trajectory equation is derived from:
�F = 0. (5.2)
This equation takes into account:
� particle inertia (1),� the stationary force contributions from gravity (2) and� buoyancy (3a), as well as� the resistance force of the particle (4a).

99 5.1 Particle movement and cooling
Fw
ugup
Ft
g
Fg
Fig. 5.1 Coordinate system for force-balancing for an individual particle
The other contributions listed describe:
� the force from the asymmetric pressure distribution around the particle due to the accel-erated outer fluid (3b),
� the transient forces of added mass (4b), and� the Basset history integral (5).
The added-mass term describes the contribution of the surrounding fluid, which needs tobe accelerated together with the particle in the boundary layer of the particle. The Bassethistory integral takes into account the delayed development and establishment of the particleboundary layer in a transient flow field. Determination of this contribution takes into accountthe whole history of the particle trajectory from the starting point to its actual final position.This contribution is important in strongly transient or turbulent flow fields. The last term inthe Basset history integral has been introduced by Reeks and McKee (1984) for the case ofa finite particle starting velocity.
Dependent on the application and on the boundary conditions, further particulate forcecontributions and influences need to be included in the particle force balance, such as:
� forces in electrical or rotational fields (e.g. for analysis of particle separation inelectrofilters or cyclones),
� turbulence effects (turbulent particle dispersion behaviour),� particle/particle interactions in clusters or swarms of particles at higher concentrations,� compressibility effects in transonic and supersonic flows,� particle rotations (in shear flow or resulting from inclined drop impacts) resulting in lift
forces,� lift forces normal to the flow direction in shear flow fields, and� other influences.

100 Spray
In the analysis of fluidic drops or solid particles in a gaseous atmosphere, the density ratiobetween gas and particles is typically sufficiently small (ρg/ρp < 10−3). For molten metaldroplets and solid metal particles this density ratio is even smaller. In this special case, theparticle trajectory equation can be simplified with only a small loss of accuracy to:
m pdup
dt= m pg + 1
2ρg|ug − up|(ug − up)cd Ap. (5.3)
This remaining force balance equation only takes into account particle inertia, gravity andresistance. The resistance (drag) coefficient cd in most cases is taken from the analysis ofa single spherical solid particle, which can be described in the range of Reynolds numbersRe < 800 by:
cd = 24
Re(1 + 0.15Re0.687), Re < 800. (5.4)
Liquid droplets deviate from solid particles during interaction with gases due to the freemobility of the drop surface, leading to droplet deformation as well as to movement of thedrop surface (and the correlated inner circulation of the droplet). In addition, the drop mayoscillate. This transient behaviour of the drop surface may be correlated with surface tensionforces. In the area of Stokes flow (Re < 1), the resistance coefficient of a fluidic dropletwith mobile phase boundary and inner circulation may be expressed (see, for example, Cliftet al., 1978) as:
cd = 24
Re
⎛⎜⎝1 + 2
3µ
1 + µ
⎞⎟⎠ , Re < 1. (5.5)
In this correlation µ is the viscosity ratio of the inner fluid in the droplet to the surroundingfluid (µd/µg). A correlation for approximation of the resistance coefficient of a droplet withrespect to ideal inner circulation and without boundary layer separation at the surface of thedroplet has been derived by Chao (1962) and Winnikow and Chao (1965). This expression isvalid for the limiting case of an ideal stationary, rising or sinking droplet based on boundarylayer theory and is:
cd = 16
Re
(1 + 0.814
Re0.5
){2 + 3µTr/µl
1 + [(ρTr/ρl)(µTr/µl)]0.5
}, 80 < Re < 400. (5.6)
An overview of a number of other correlation functions for resistance coefficients for liquiddroplets is given in Brander and Brauer (1993).
A number of approaches are to be found in the literature which analyse the flow fieldaround a droplet simultaneously with the mass transfer behaviour of particles and droplets:determination is by experiment as well as by direct numerical calculation. For example,Brander and Brauer (1993) solved the problem of a stationary flow around a spherical non-deformable fluidic particle, which is moving in an unbounded fluid of infinite dimensions.For the theoretical investigation, the calculation is based on the coupled velocity and pressuredistribution within and around the droplet. These distributions are derived from a finiteelement analysis of the momentum, mass and concentration conservation equations. The
101 5.1 Particle movement and cooling
conservation equations are formulated for each phase (inner and outer) separately and arecoupled by suitable coupling and transfer functions at the droplet boundary and free surface(see Section 4.3.2). In that contribution, especially, the onset and development of flowseparations and vortices within the droplet and at the outer side of the droplet are discussedand related to local details of the flow field.
In the case of molten metal droplets one has to account for high surface tension valuesnormally assigned to molten metals. These will result in small values of the Weber numberof melt droplets within the spray. Therefore, considerations of droplet oscillations anddeformations are of minor importance in this case within the spray, despite the occurrenceof an area close to the fragmentation of the melt stream, where deformed droplets may befound frequently.
Analysis of droplet behaviour on the centre-line of the spray (one-dimensional)Based on a one-dimensional analysis of the particle trajectory equation with only one-sidedcoupling (see Point 1 in Table 5.1), investigation of particle behaviour in sprays (e.g. foridentification of different atomizer nozzle characteristics) is possible. In Fritsching andBauckhage’s (1987) analysis of interaction of particles and the surrounding gas phase withdistance in the spray from single (pressure) and twin-fluid (gas) atomizers, the behaviour ofdroplets within a model fluid spray (water) has been investigated. Droplet velocities and sizesat the centre-line of the spray have been measured by phase-Doppler-anemometry (PDA) forcomparison with the one-dimensional model. The nozzle types under investigation (as thereare pressure and twin-fluid atomizers) and their respective dimensions have been chosen soas to yield comparable droplet sizes and velocity spectra within the spray.
For solution of the droplet trajectory using a one-dimensional non-coupled modelapproach, assumption of a prescribed velocity distribution in the gas phase is necessary, andneeds to be prescribed for the centre-line of the spray. This important boundary conditionfor model evaluation has been determined from PDA measurements of droplet velocitiesof the smallest detected droplets in the spray, based on the assumption that the local gasvelocity equals the measured droplet velocity for the smallest detected droplet-size class.This is the ideal case for drop movement, i.e. when the slip velocity between the gas andthe droplets vanishes for smaller droplets at low gas acceleration rates because of their lowinertia. As another necessary boundary condition, the initial (starting) velocity value ofthe droplet needs to be prescribed. For the twin-fluid nozzle it is assumed that the startingvelocity of the droplets is equal to the liquid exit velocity from the nozzle. Therefore, itsvalue has been determined by measuring the mass flow rate and the nozzle exit diameter.For the pressure atomizer it is more difficult to define a specific starting velocity for thedroplets as here more pronounced multistage ligament fragmentation process of the liquidoccurs. In an approximation, a constant starting velocity for all droplet-size classes has beenassumed. This value has been achieved by extrapolating the measured droplet velocities ofthe biggest detected drop-size classes, from the first measurement location in front of thenozzle, backwards to the common starting position of the droplets near the nozzle.
In Figure 5.2 comparison between experimental and measured results, averaged over acertain drop-size class for the pressure atomizer used, are illustrated. The dashed/dotted

102 Spray
measured
calculated
particle diameter dpnozzle distance
z [mm]
velo
city
[m/s
]measured
calculated
particle diameter dp [µm]nozzle distance
z [mm]
velo
city
[m
/s]
100200
300400 500 25 45
65 85105
125145
0
7
14
21
vl(z)
Fig. 5.2 Velocity distribution at the centre-line of a pressure atomizer (single fluid nozzle; Fritschingand Bauckhage, 1987)
line in the figure indicates the derived gas velocity distribution as a function of nozzledistance vl(z). The figure shows that the smaller droplets in the spray immediately losetheir initial momentum once carried from the liquid delivery system. This initial momentumis immediately lost and transferred to the slow moving (entrained) gas. Further downstream,these smaller droplets move at almost the same velocity as the gas. The bigger dropletsdecelerate somewhat more slowly. Therefore, a continuous transfer of momentum from thedroplets to the slower moving gas occurs. The velocity distribution exhibits strong gradientsdependent on droplet size in the vicinity of the nozzle, while at increased nozzle distancesthe velocity distribution for all droplet sizes is equalized.
In the spray of the twin-fluid atomizer, a change in sign of the direction of momentumtransfer occurs. This can be seen in Figure 5.3. Close to the atomizer, the faster movingatomizer gas accelerates all droplet sizes. This is the direction of momentum transfer fromthe gas to the slower particles. Therefore the gas looses a significant amount of kineticenergy within a small distance from the atomizer. At a certain distance from the atomizer, thedirection of momentum transfer is reversed. At greater nozzle distances, all droplets movefaster than the gas; therefore the direction of momentum transfer is now from the dropletsto the gas. The droplets in this area accelerate the gas. The point where the momentumtransfer changes direction depends on droplet size. While smaller droplets already exhibitthis change of momentum transfer closer to the atomizer, due to their smaller inertia, biggerparticles experience a change in their direction of momentum transfer at somewhat greaterdistances from the nozzle.
By comparing the characteristics of both nozzle types under investigation, from thissimple one-dimensional model evaluation, one can already observe remarkable differencesin the technical development of spray forming processes. The aim of the application isto achieve almost identical droplet velocities at a specific distance from the atomizer

103 5.1 Particle movement and cooling
measured
calculated
particle diameter dpnozzle distance
z[ mm]
velo
city
[m/s
]
measured
calculated
particle diameter dp [µm]nozzle distance
z [mm]
velo
city
[m/s
]
50100
200300 15
3555
7595
115135
0.00
5.72
11.45
17.17
vl(z)
Fig. 5.3 Velocity distribution at the centre-line of a twin-fluid atomizer (Fritsching and Bauckhage,1987)
(e.g. for coating applications): for the twin-fluid atomizer under investigation, this con-dition is achieved much nearer to the apparatus. In addition, reversal of the direction ofmomentum transfer has to be recognized as an important feature of twin-fluid atomizers.
In the field of spray forming simulations, quasi-two-dimensional model calculations havebeen performed, for example, by Zhang (1994). Here, the velocity behaviour of the dropletswill be illustrated first. The gas velocity distribution has been assumed from measurements ofgas velocities at the centre-line of the free gas jet flow (produced by an atomizer but withoutatomization) by Uhlenwinkel (1992). For the measurement, the original atomizer nozzlesystem of a spray forming device has been used. The area under investigation is locatedwithin 100 < z < 800 mm of the nozzle. As discussed in Chapter 4, for a typical free-fallatomizer, disintegration of the liquid occurs approximately 100 mm below the atomizer.Therefore, the investigated area covers the entire spray region, i.e. from atomization tospray impingement onto the substrate. Based on comparable flow field configurations of aturbulent free single-phase jet, the velocity distribution in the atomizer gas flow field hasbeen divided into two regions. Near the nozzle, a plug flow profile of gas velocities hasbeen assumed, with constant velocity:
ug = ug0 = const, 100 < z < 300 mm. (5.7)
At greater distances from the atomizer, the decrease in gas velocity at the centre-line hasbeen assumed to occur in an exponential manner:
ug = Al(p∗g)A2
(z
dg
)−A3
, z > 300 mm. (5.8)

104 Spray
Table 5.2 Velocity correlation parameters
dg [mm] A1 A2 A3
20.4 0.0123 0.53 0.95
160150
140130
120110
100
90
80
7060
50
40
30
20
10
100 200 300 400 500 600 700 8000
d = 50 µmd = 100 µmd = 200 µmd = 400 µm
gas
nozzle distance z [mm]
velo
city
[m
/s]
Fig. 5.4 Gas and particle velocity distribution at vg0 = 150 m/s (Zhang, 1994)
The gas velocity depends on the relative gas prepressure p∗g , where p∗
g = pg,abs – pu/pu, thecharacteristic nozzle dimension of the free-fall atomizer dg and the correlation coefficientsfrom Table 5.2.
The calculated particle velocities, at the centre-line of a spray of different-sized metalparticles, during atomization of a steel melt is shown in Figures 5.4 and 5.5. The exampleshave been calculated for different gas pressure levels during atomization, therefore assum-ing different gas velocities near the atomizer. As previously mentioned, in this examplethe gas velocity is taken as constant near the nozzle. The particles start at a distance of100 mm below the atomizer, all particles have almost zero starting velocity at the fragmen-tation point, respectively their starting location. Dependent on droplet inertia, the particlesof different size show different acceleration behaviour in the gas. The typical reversal ofmomentum transfer direction within gas atomization, mentioned earlier, can only beobserved for particles with sizes dp < 100 �m. For bigger particles the flight distanceis too small for them to experience a change in their momentum transfer direction. Theseparticles always exhibit smaller velocities than the gas velocity until the point of dropletimpingement onto the substrate.

105 5.1 Particle movement and cooling
160
180
200
220
240
260
140
120
100
80
60
40
20
100 200 300 400 500 600 700 8000
d = 50 µmd = 100 µmd = 200 µmd = 400 µm
gas
nozzle distance z [mm]
velo
city
[m/s
]
Fig. 5.5 Gas and particle velocity distribution at vg0 = 250 m/s (Zhang, 1994)
Turbulent dispersion of particles in the sprayDue to the turbulent structure of the gas flow field, the particles may deviate from thedeterministic trajectory, which is governed by the mean gas flow properties. This effectis called turbulent particle dispersion. The way in which this problem may be tackled hasbeen outlined, for example, in Sommerfeld (1996). The model is based on the estimationof instantaneous gas velocity u from Reynolds’ decomposition:
ug = ug + u′g, (5.9)
with u the mean (temporal average) velocity and u′ the turbulent velocity fluctuation.Assuming isotropic turbulence, the value of the fluctuating component is distributed normalto the mean fluctuation u = 0 m/s and the standard deviation σT = √
2k/3, where k isthe turbulent kinetic energy. By applying a random number generator, an instantaneous,turbulent kinetic-energy-related value of the fluctuating gas velocity component is calculatedand added to the mean gas velocity value. The modified gas velocity still holds until theparticle is within a single turbulent vortex. Figure 5.6 shows, schematically, the movementof a particle through a plane flow field characterized by a series of turbulent eddies. Theinteraction time τv between particle and eddy is characterized by the minimum particlepassing time through the eddy τ u and the eddy lifetime τ T:
τv = min(τu, τT ). (5.10)
The eddy lifetime (dissipation time scale) is derived from:
τT = cTk
ε, (5.11)

106 Spray
Fig. 5.6 Movement of a particle through a turbulent flow field, idealized as a series of turbulenteddies (Bergmann, 2000)
where the constant cT has a value of 0.3 (Sommerfeld, 1996). The passing time of a particlethrough an eddy is calculated from the dissipation length scale LT and the mean relativevelocity:
τu = LT
|ug − up| , (5.12)
where LT is calculated from the turbulent kinetic energy distribution as:
LT = τT
√2
3k. (5.13)
Within an isotropic turbulent flow field, the three root mean square (RMS) components ofgas velocity fluctuations are equal in all three space dimensions
√u′2
g =√
v′2g =
√w′2
g . Foraxisymmetric (two-dimensional) flow calculation in cylindrical coordinates, fluctuation ofthe circumferential gas velocity w′
g will always result in an increase of the radial velocitycomponent v′
g by the value of v′g,w, as can be seen in Figure 5.7. Therefore, the third velocity
component within a two-dimensional spray calculation must be handled separately. Thecorrected fluctuation value of the gas velocity in a radial direction v′
g,res may be calculatedfrom:
v′g,res = v′
g + v′g,w = v′
g +[√( r
�t
)2+ w′
g2 − r
�t
], (5.14)
with r the radial position and �t the time step for iterative calculation of the particletrajectory.

107 5.1 Particle movement and cooling
u v
w
v'g t
w'g t
v'g,w t
v'g,res t
r
r
r
∇
∇
∇
∇Fig. 5.7 Correction of fluctuating velocity component for calculation in cylindrical coordinatesystems (Bergmann, 2000)
As has been pointed out, for example, by Sommerfeld (1996) this model does not accountfor the effects of crossing trajectories. The turbulent velocity fluctuations, which a gaselement along its way and a particle along the particle trajectory within a time step �t willsee, may differ due to particle inertia and external forces acting on the particle, as illustratedin Figure 5.8. The temporal correlation that a fluid element will see may be described attwo successive increments by the Lagrangian time correlation coefficient:
RL (�t) = u′(t)u′(t + �t)√u′2(t)
√u′2(t + �t)
, (5.15)
which may be approximated in different modelling ways (Sommerfeld, 1996).
5.1.2 Heat transfer and particle cooling
The heat transfer process across the surface of a moving spherical particle in a gas flow fieldis determined by convection and radiation. Radiation may occur between the particle underinvestigation and the surrounding spray chamber walls as well as between the particles.

108 Spray
0
Fluid
Particle
∆r
Fig. 5.8 Different flow paths of a particle and a fluid element initially at identical positions(Bergmann, 2000)
The latter is usually neglected. Therefore, the heat balance for an individual particle can beexpressed as:
m pcpdTp
dt= Nuλgπdp(Tg − Tp) − σSεS
(T 4
p − T 4w
)πd2
d . (5.16)
Within a typical spray forming application with twin-fluid atomization of the melt, com-parison of the heat fluxes resulting from convection and radiation obtains a heat loss dueto convection which is two orders of magnitude higher than the heat loss due to radiation.This effect is due to the huge velocity gradients between gas and droplets and the resultinghigh heat transfer coefficients. Therefore, in some spray forming investigations, the heatloss due to radiation from the particle has been totally neglected. In the above heat balanceequation, the Nusselt number Nu for convective heat transfer is typically taken from theconventional Ranz and Marshall (1952) correlation:
Nu = 2 + 0.6Re0.5Pr0.33. (5.17)
An extension of this correlation that takes into account gas turbulence effects during heatand mass transfer from droplets has been derived by Yearling and Gould (1995):
Nu = 2 + 0.584Re0.5Pr0.33(1 + 0.34σ 0.843
t
). (5.18)
These correlations depend on the local Reynolds number Re, the Prandtl number Pr and thelater correlation with the relative turbulence intensity σt . The multiplication factor in thebrackets of (5.18) therefore extends the conventional Ranz–Marshall correlation.

109 5.1 Particle movement and cooling
Solidification modellingFor evaluation of the temporal temperature distribution of particles that (partly) solidifyduring the flight phase in the spray, specific solidification and phase change models tailoredto the material and the process under investigation need to be developed. These modelsdescribe the phase change behaviour of a material element from the molten state to the fullysolidified state (from the superheating temperature of the melt to the room temperature ofthe solid particle).
The solidification behaviour of a metal melt is conventionally described by the processesof nucleation and crystal growth. In a first attempt, the solidification process is described bya homogeneous nucleation model without undercooling (equilibrium solidification), whichis valid for pure metals at low cooling rates. Here it is assumed that the superheated meltdroplet first cools to the phase change temperature (solidification temperature). During thephase change, the latent heat from the droplet is spontaneously released and simultaneouslytransferred across the surface of the droplet. After solidification has finished, the particlemass cools down further. Within the heterogeneous nucleation model it is assumed thatthe crystallization process initiates at foreign nuclei. In this model, it is assumed that uponreaching the solidification temperature, a balance occurs between the released latent heatand the heat convectively transferred across the surface of the droplets. The temperature ofthe droplet remains constant during solidification. These solidification models have beenused in spray forming, for example, by Zhang (1994) and Liu (1990).
A more realistic solidification model for metal melts is more complicated to describe.These models may be derived from equilibrium phase diagrams for slow solidifications andtime-transfer phase change diagrams and/or from experimental solidification investigationof some realistic cooling rates found in spray processes.
Solidification model in spray formingThe solidification model described here (Bergmann, 2000) has been developed for low-carbon steel C30 (0.3 wt. % C), but may be easily adapted to other material compositions.Figure 5.9 shows part of the iron–carbon phase diagram, where the area for C30 is high-lighted. For low cooling rates in equilibrium, the temperature versus time curve shown canbe derived directly from this phase diagram. In fact, in spray processes the cooling rateof droplets immediately after atomization may be very high. Therefore, the possibility ofundercooling prior to nucleation and the onset of solidification has to be considered. InFigure 5.10 the typical qualitative temperature distribution for a single droplet in a metaldroplet spray is shown. Starting with the initial melt temperature (superheated) Tm , thedroplet cools down to liquidus temperature Tl . Depending on the actual cooling rate, thedroplet may undercool until it reaches the nucleation temperature Tn before solidificationstarts. Due to the rapid release of latent heat of fusion during recalescence, the droplettemperature increases until it reaches a local maximum in the cooling curve at Tr . Duringthe following segregated solidification, the droplet temperature decreases continuously.At temperature Tper, peritectic transformation takes place at constant droplet temperature.After termination of the peritectic transformation, again segregated solidification occursuntil the droplet is completely solidified at Ts . From here on, cooling of the droplet

110 Spray
time
1809
1766
1665
0.16 0.53
C-content [wt. %]
+ M
+ M
M
0.3
tem
pera
ture
tem
pera
ture
[K
]
γγ
δ
Fig. 5.9 Part of the iron–carbon equilibrium phase diagram (C30 composition is highlighted)
1
1.1
2
3
45
6
tem
pera
ture
[K
]
time
Tm
1
1.1
2
3
45
6
Tp
Tr
Tper
Ts
Tn
Fig. 5.10 Temperature behaviour for rapid cooling of a droplet in a spray
occurs in the fully solidified particle. In the following, the different states of in-flight dropletcooling and solidification, shown in Figure 5.10, will be analysed separately.
� Cooling in the liquid state (1)For a spherical droplet, the change in internal heat content due to convective and radiativeheat transfer can be expressed by:
cd,ldTd
dt= − 6h
ρddd(Td − Tg) − 6εσ
ρddd
(T 4
d − T 4w
), (5.19)
where Td is the droplet temperature, Tg the gas temperature and Tw the temperature ofthe surrounding walls. The specific heat capacity of the liquid droplet material is cd,l , h is

111 5.1 Particle movement and cooling
the heat transfer coefficient, ε and σ are the emissivity and Stefan–Boltzmann constant,ρd and dd are the droplet’s density and diameter, respectively. A temperature gradientinside the droplet is neglectable, because of the high thermal conductivity of metals, andtherefore very low Biot numbers (Bi << 1) for all metal droplets can be considered.
� Undercooling (1.1)When the droplet temperature reaches the liquidus of the material, the solidificationprocess does not immediately start. Depending on cooling rate and droplet size, the tem-perature Tn where nucleation occurs can be much lower than the liquidus temperature Tl .The nucleation temperature for continuous cooling is defined as the certain temperature,where the number of nuclei Nn in the droplet volume Vd is identical to one:
Nn = Vd
Tn∫Tl
J (T )
TdT = 1. (5.20)
Here, J(T) is the nucleation rate and T the cooling rate (Lavernia, 1996; Lavernia et al.,1996; Pryds and Hattel, 1997). Hirth (1978) has shown that (5.20) may be simplified to:
0.01J (Tn)Vd�Thom
T≈ 1, (5.21)
where �Thom is the undercooling temperature difference for homogeneous nucleation.The nucleation rate may be expressed (Hirth, 1978; Libera et al., 1991) as:
J (Tn) = K exp
(− 16πσ 2
sl V2
m T 2l
3kTn�h2fm�T 2
hom
), (5.22)
with σs,l the solid–liquid interfacial energy and �hfm the molar latent heat of fusion.From measurements, the pre-exponential factor K is derived as 1041 m3/s2 (Hirth, 1978;Libera, 1991). In the work of Turnbull (1950) and Woodruff (1973), correlation betweenthe solid–liquid interfacial energy, the latent heat of fusion per atom �h f,a and the atomicvolume Va is given by:
σs,l = 0.45�h f,a V −2/3a . (5.23)
It is well known that in technical processes, heterogeneous nucleation rather thanhomogeneous nucleation mechanisms limit the degree of undercooling. Only in verysmall droplets does homogeneous nucleation play an important role during solidification.Based on experimental results for different alloys, Mathur et al. (1989a) derived thefollowing exponential correlation between actual undercooling �T and the amount ofundercooling necessary for homogeneous nucleation, which can be formulated (Liberaet al., 1991) as:
�T = �Thome(−2.21012Vd). (5.24)
Once the actual undercooling is calculated based on the previous set of equations, theactual nucleation temperature for a droplet is determined by:
Tn = Tl − �T . (5.25)
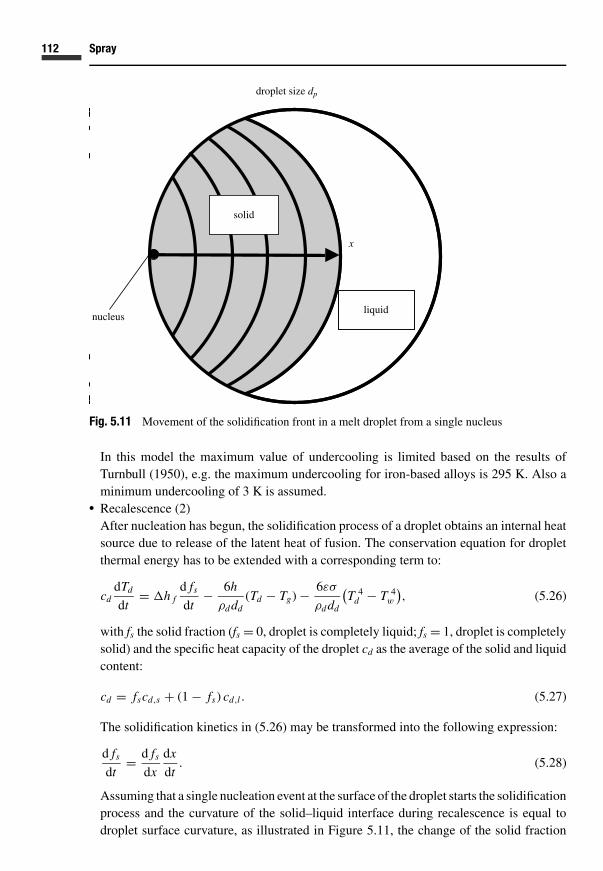
112 Spray
solid
droplet size dp
solid
liquidnucleus
x
Fig. 5.11 Movement of the solidification front in a melt droplet from a single nucleus
In this model the maximum value of undercooling is limited based on the results ofTurnbull (1950), e.g. the maximum undercooling for iron-based alloys is 295 K. Also aminimum undercooling of 3 K is assumed.
� Recalescence (2)After nucleation has begun, the solidification process of a droplet obtains an internal heatsource due to release of the latent heat of fusion. The conservation equation for dropletthermal energy has to be extended with a corresponding term to:
cddTd
dt= �h f
d fs
dt− 6h
ρddd(Td − Tg) − 6εσ
ρddd
(T 4
d − T 4w
), (5.26)
with fs the solid fraction (fs = 0, droplet is completely liquid; fs = 1, droplet is completelysolid) and the specific heat capacity of the droplet cd as the average of the solid and liquidcontent:
cd = fscd,s + (1 − fs) cd,l . (5.27)
The solidification kinetics in (5.26) may be transformed into the following expression:
d fs
dt= d fs
dx
dx
dt. (5.28)
Assuming that a single nucleation event at the surface of the droplet starts the solidificationprocess and the curvature of the solid–liquid interface during recalescence is equal todroplet surface curvature, as illustrated in Figure 5.11, the change of the solid fraction

113 5.1 Particle movement and cooling
along the growth axis is given (Lee and Ahn, 1994) by:
d fs
dx=
[3
2
(x
dp
)2
− 1
2
(x
dp
)3]′
= 1
dp
[3
(x
dp
)− 3
2
(x
dp
)2]
. (5.29)
The velocity of the solid–liquid interface movement is approximated to the linear crystalgrowth rate function of undercooling:
dx
dt= Ks,l[T ( fs) − Tp] = Ks,l�T . (5.30)
In this equation, Ks,l is the solid–liquid interfacial mobility, having a magnitude of0.01 m/s/K (Lavernia, 1996; Lavernia et al., 1996; Lee and Ahn, 1994; Wang and Matthys,1992). The phase of recalescence ends when the rate of internal heat production equalsthe heat transfer from the droplet surface. Here, the cooling curve of a droplet reaches alocal maximum (Figure 5.10) and the droplet temperature equals Tr:
�h fd fs
dt= 6h
ρddd(Tr − Tg) + 6εσ
ρddd
(T 4
r − T 4w
). (5.31)
� Segregated solidification 1 (3)Further solidification after recalescence again takes place with a decrease in droplettemperature. The heat conservation equation in this stage is described by:
dTd
dt
(cd + �h f
d fs
dTd
)= − 6h
ρddd(Td − Tg) − 6εσ
ρddd
(T 4
d − T 4w
). (5.32)
The increase of solid fraction with droplet temperature is assumed according to Scheil’sequation (Brody and Flemings, 1966):
c∗s = ke c0(1 − fs)ke−1 with c∗
s = ke cl , (5.33)
where c∗s is the composition of solid at the solid–liquid interface, c0 is the initial com-
position of the material and ke is the equilibrium partition ratio. This relation can betransformed into:
fs = 1 − (1 − fs,r )
(cl
c0
) 1ke−1
= 1 − (1 − fs,r )
(TFe − Td
TFe − Tl
) 1ke−1
(5.34)
and
d fs
dTp= 1 − fs,r
(ke − 1)(TFe − Tp,r )
(TFe − Tp
TFe − Tp,r
) 2+keke−1
, (5.35)
with TFe the liquidus temperature of the pure iron base material, and Td,r and fs,r the solidfraction and temperature of the droplet after recalescence, respectively.
� Peritectic transformation (4)When the droplet temperature reaches the peritectic temperature, it remains at a constantvalue until this phase transformation is completely terminated. The change in solid fractionduring peritectic solidification is described by:
�h fd fs
dt= − 6h
ρddd(Td − Tg) − 6εσ
ρddd
(T 4
d − T 4w
). (5.36)

114 Spray
Peritectic solidification ends when the composition of the remaining liquid reaches theappropriate concentration. Based on phase diagrams, it is possible to calculate the solidfraction fs,pe according to this concentration:
fs,pe = 0.53 − c0
0.53 − 0.16= 0.622 (for c0 = 0.3 wt. %) . (5.37)
� Segregated solidification 2 (5)Further segregated solidification takes place in the droplet after peritectic transformationand can be described by the assumptions shown in Phase (3).
� Cooling in the solid state (6)After the droplet is completely solidified, it cools down further in the solid state. Thisprocess can be evaluated from:
cd,sdTd
dt= − 6h
ρddd(Td − Tg) − 6εσ
ρddd
(T 4
d − T 4w
), (5.38)
with cd,s the specific heat capacity of the solid material. Cooling in the solid state isinterpreted as a submodel of the numerical simulation model of the spray behaviour,taking into account the two-way coupling of momentum and heat.
Model resultsBased on the above discussion of quasi-two-dimensional model (Zhang, 1994) calculations(for particle velocity at the spray centre-line during atomization of a steel melt), the resultsfor particle temperatures in flight will now be discussed. These are first based on a het-erogeneous phase change model without undercooling. For the boundary condition of gastemperature distribution at the spray centre-line, it is assumed that the gas temperatureincreases linearly with nozzle distance. This assumption is somewhat arbitrary due to thelimited (experimental or numerical) values available here. The final value of the gas temper-ature distribution has been assumed from measurement of typical exhaust gas temperaturesduring spray forming processes. A heterogeneous phase change model is assumed for meltdroplets without undercooling.
Figure 5.12 illustrates the calculated starting velocity of the gas, i.e. 150 m/s (correspond-ing to an atomizer gas pressure of 0.15 MPa); and in Figure 5.13 the result for an initial gasvelocity of 250 m/s (corresponding to a gas prepressure of 0.4 MPa) is shown. For a lowerinitial gas velocity value and gas prepressure all particles with sizes dp < 200 �m are cal-culated to impinge onto the substrate in a fully solidified (solid) state. The remaining liquidfor successful compaction during spraying and building of the preform is delivered frombigger droplets. At increased pressure, the diameter limit for solidification shifts towardssmaller values. All droplets with dp < 100 �m impinge within 800 mm of the nozzle ina fully solidified state. The remaining thermal energy content of droplets of identical sizeincreases for increasing gas pressure as a result of the decreased flight time in the spray(assuming identical gas temperature and density distributions as in this uncoupled simula-tion). All bigger particles are in a state of phase change at the point of impingement, andcontain the remaining liquid content. Superheating is stopped, in all cases, a short distance
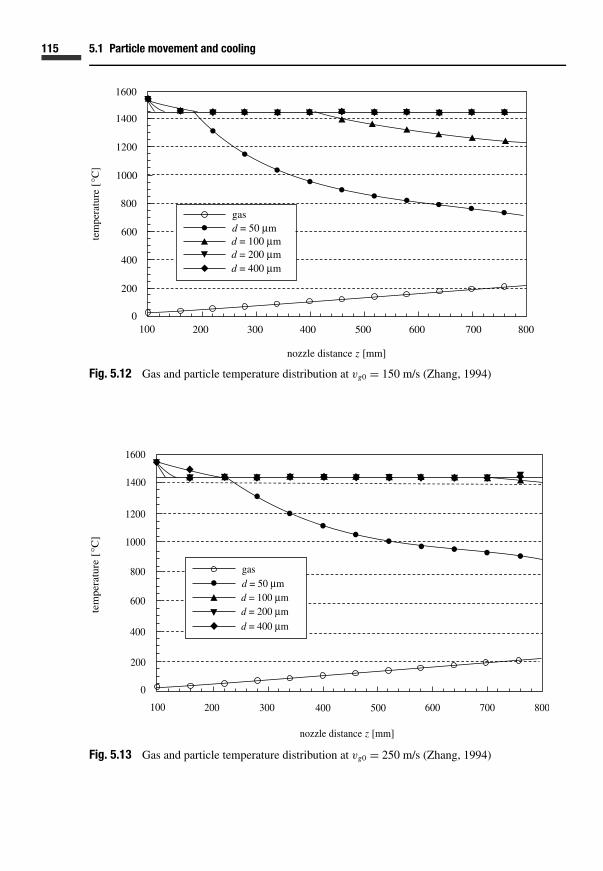
115 5.1 Particle movement and cooling
100 200
200
0300 400
400
600
800
1000
1200
1400
1600
500 600 700 800
d = 50 µmgas
d = 100 µmd = 200 µmd = 400 µm
tem
pera
ture
[°C
]
nozzle distance z [mm]
Fig. 5.12 Gas and particle temperature distribution at vg0 = 150 m/s (Zhang, 1994)
100 200
200
0
300 400
400
600
800
1000
1200
1400
1600
500 600 700 800
d = 50 µmgas
d = 100 µmd = 200 µmd = 400 µm
tem
pera
ture
[°C
]
nozzle distance z [mm]
Fig. 5.13 Gas and particle temperature distribution at vg0 = 250 m/s (Zhang, 1994)

116 Spray
of approximately 100 mm from the atomization area, and this is where the droplets start tochange phase. In the main part of the spray, the droplets are in a phase of liquid to solidchange.
Up to this point, only the behaviour of the droplets at the centre-line of the spray hasbeen derived. In order to extend these one-dimensional results to a quasi-two-dimensional,the results of the former need to be extrapolated in the radial direction of the spray. Theunderlying assumption for this extrapolation is based on the local particle size distributionand its measured radial behaviour (i.e. by collecting particles from the spray at relevantpositions). Therefore, a log-normal particle size distribution has been assumed and its meanmass value can be calculated from:
d50.3(r ) = dr=050.3
(1 − 0.3
r
R0
), (5.39)
where R0 is the maximum radius of the spray at the point of impingement (here 10 cm) anddr=0
50.3 is the mass median particle size at the centre-line of the spray. The median particlesize decreases linearly from the centre of the spray to its edge, where the value at the sprayedge is 70% of the maximum value within the centre of the spray. In this way, the localvalue of the integral thermal state of the spray mass at the point of impact is determined.The local-averaged total enthalpy H is calculated from the individual droplet enthalpy:
H =∑
i
q3(d)Hi�di , (5.40)
assuming a finite number of drop-size classes in the total size distribution with particle-sizewidth �d. The volume (or mass for assumed constant material densities) density distributionof particle sizes is q3(d) and the summation is performed locally for all particle size classes.The local total enthalpy of each particle-size class is:
H = cpT − Ts,l
Lh+ fl , (5.41)
where Lh is the melt enthalpy and fl is the liquid content of each particle size. From thisdefinition of total enthalpy, the solidification state of a droplet is calculated:
� solid (solidified), if H ≤ 0;� in the state of phase change (partly solidified), when 0 < H < 1;� fluid (fully molten), if H ≥ 1.
The liquid content of a particle is described by fl = 0 for a fully solidified particle, and byfl = 1 for a fully molten droplet. The corresponding solid content of a particle is fs = 1 – fl.
The local enthalpy flux entering the top of the sprayed deposit, as a necessary boundarycondition for the following calculations, must reflect the local mass flux distribution in thespray as well. It is calculated from:
H (r ) = Hm. (5.42)
The mass flux distribution in the spray to be prescribed here has been derived from

117 5.1 Particle movement and cooling
Table 5.3 Parameters for calculation of one-dimensionalparticle cooling behaviour
Tp0 [oC] σ d [-] dr=050.3 [�m] Tg,max [oC] ug0 [m/s]
1 1540 0.6 200 300 1502 1540 0.4 200 300 1503 1580 0.4 200 300 1504 1540 0.4 200 500 1505 1540 0.4 250 300 1506 1580 0.4 250 300 1507 1540 0.4 200 300 250
00
5
10
15
20
25
30
35
40
45
50
10 20 30 40 50 60 70 80 90 100
1
2 4 3
5
7 6
radius [mm]
flui
d co
nten
t fl[
%]
Fig. 5.14 Locally averaged liquid contents in the spray at the spray impact point (Zhang, 1994)
multidimensional simulation of a spray and from experimental measurements (as in Uhlen-winkel (1992)). This will be discussed in the next section.
Below, the mean enthalpy H of the total liquid contents of the impinging spray mass isdiscussed. The radial distribution at the point of impingement is illustrated in Figure 5.14.The basic parameters used for the simulation runs, for the particle start temperature Tp0,the standard deviation of the particle size distribution in the spray σd , the mass medianparticle size dr=0
50.3 at the spray centre, the maximum gas temperature Tg,max and the initialgas velocity in the atomization area ug0, are listed in Table 5.3.
The basic parameters and boundary conditions for the simulation are shown by Case 2 inthe list. The other cases are variations of this basic case. For all, the remaining liquid contentof the spray droplets at the impingement distance z = 800 mm decreases with increasingradius. In some cases one can observe local liquid contents of 0% at the outer edge ofthe spray: these results are due to averaging the enthalpy at each location over the whole

118 Spray
droplet-size spectrum. This result does not mean that all particles are fully solidified (whichwill prevent the droplet mass from compaction on the subrate/deposit). The bigger dropletswill still contain some liquid (see above section), which will contribute to sticking of thedroplets on the surface and to homogeneous preform production. But due to the greateramount of small cold particles, the liquid contribution of large particles to the integratedspray property is not reflected in the averaged quantity (see Section 5.2 on different averagingmethods).
In comparison to Case 2, the local liquid content in the spray fl decreases when the drop-size distribution in the spray becomes narrower, i.e. the standard deviation of the drop-sizedistribution decreases. This can be seen in Region 1 of Figure 5.10. This scattering parameterof the drop-size distribution cannot be controlled directly within the spray forming process.Here, a change in process operational parameters will result in a simultaneous change inseveral spray parameters and also in the drop-size distribution. Therefore, changing thestandard deviation of the drop-size distribution is a somewhat artificial action. But here amajor advantage of simulation models can also be seen. In a simulation run, the resultsof specific parameter variations may be observed, where some individual parameters arechanged, which cannot be independently realized in experiments. Here the potential andbehaviour of all physical parameters, boundary conditions and process variables, may beanalysed. Decreasing liquid content in the spray is, in this case, attributed to non-linearcorrelation between the thermal state of individual impinging droplets and the dropletdiameter or size. While for bigger droplets the gradient of the correlation is relativelysmooth (because bigger particles change their thermal state more slowly due to their largermass), for smaller droplets a steeper gradient is seen due to a severer dependency. Therefore,when changing the relative width of the particle-size distribution, changes at the lower end ofthe particle-size distribution for smaller droplets will significantly alter the integral thermalstate of the spray.
The liquid content fl at the point of spray impingement reacts sensibly, especially tochanges in the mean drop size of the drop-size distribution in the spray (Case 5 versusCase 2). The content of the remaining liquid increases significantly with increasing meandrop size because less heat is transferred via the drop surface when the total surfacedecreases due to increasing mean drop sizes, although the resistance, or flight time, ofeach particle in the spray increases from fragmentation to impingement because of overalllower particle velocities at increasing particle sizes. Also, the initial droplet velocity (orvice versa, the atomization gas pressure) has a significant influence on the remaining liquidcontent of the spray (Case 7 versus Case 2). For increasing initial gas velocities and gas pres-sures, from calculation, the liquid content is also expected to increase. This result does notreflect experimental observations within spray forming processes. During experimentationthe enthalpy content of the spray decreases with increasing gas pressure, and the spraybecomes colder. This computational mismatch reflects a major problem of the uncoupledsimulations presented in this chapter. An increase of atomization gas pressure will result inincreasing gas velocities and in decreasing droplet sizes in the spray. Therefore, the differentprocess conditions experienced with variable atomizer gas pressure are best evaluated bycomparing Case 6 (for lower atomizer gas pressure) and Case 7 (for increased atomizer gaspressure). This comparison shows that the remaining liquid content in the impinging spray,

119 5.1 Particle movement and cooling
in agreement with experimental results, decreases. But in this case, the assumed values forgas velocity and mean drop size in the spray cannot be directly correlated with a specificgas pressure. Therefore, the comparison only verifies the trend.
Somewhat more disturbing with respect to the mismatch between simulated results andexperimental findings are the lack of coupling of the particulate phase to gas phase behaviourand neglect of the resulting momentum sink within the gas phase. Kramer et al. (1997)also found this effect in their two-dimensional calculations of particle behaviour in thespray during spray forming without taking into account coupling effects. They assumed anempirical correlation for gas velocity distribution and gas temperature distribution. Theirresults also indicate a slightly increasing liquid content in the spray for increasing gas massflow rates (and therefore increasing gas pressures).
Solidification behaviour inside the melt particleThe temperature distribution inside a single spherical particle during solidification has beenstudied numerically by Kallien (1988) and Hartmann (1990). The simulation program usedhas been developed from an original code for simulation of solidification during metal cast-ing. It calculates the three-dimensional temperature distribution in spherical particles, andincludes possible undercooling. The model is based on solution of the Fourier differentialequation for transient heat conduction in three-plane (Cartesian) coordinates as:
ρcp∂T
∂t= ∂
∂x
(λ
∂T
∂x
)+ ∂
∂y
(λ
∂T
∂y
)+ ∂
∂z
(λ
∂T
∂z
), (5.43)
where the thermophysical properties: conductivity λ, density ρ and heat capacity cp, dependon location and temperature. A modified temperature is introduced:
= 1
λ0
T∫0
λ dT (5.44)
to achieve a linear differential equation:
ρcp
λ0
∂T
∂t= ∂2
∂x2 + ∂2
∂y2 + ∂2
∂z2 . (5.45)
This equation is solved by means of a finite difference method on an orthogonal-planethree-dimensional grid. The geometry of the spherical particle is reflected by a stepwisearrangement of cubical cells. A number of 24 000 grid cells has been used for the calculation.The assumed boundary conditions are:
� the surrounding gas atmosphere is assumed to be at constant temperature,� the heat transfer coefficient is taken as constant across the whole surface of the particle,� the onset of solidification is initiated at a preselected nucleation temperature – nucleation
may be assumed to start either at a single point (specified grid cell), or at a number ofgrid cells for heterogeneous nucleation modelling, or simultaneously within all grid cellsfor homogeneous nucleation modelling.
The derived calculation model for particle solidification behaviour assumes a six-stageapproach:

120 Spray
Fig. 5.15 Solidification behaviour inside an aluminium droplet of dp = 50 �m, starting from a singlenucleus (in the back of the particle), at 50 K undercooling (Kallien, 1988)
(1) cooling of the melt from superheating until the nucleation temperature is reached,(2) attaining the highest undercooling,(3) onset of solidification and recalescence,(4) cooling and solidification in the melt temperature range between solidus and liquidus,(5) end of solidification,(6) cooling of the solidified particle.
For the recalescence phase, it is assumed that the velocity of latent heat release for analuminium particle under investigation depends on undercooling �T:
v = K� T . (5.46)

121 5.2 Internal spray flow field
The kinetic factor K for aluminium takes values between 2 cm/K s and 2 m/K s. Thesolidification rate of a grid cell of volume V is:
dV
dt= v∗s2. (5.47)
When a grid cell is completely solidified the neighbouring grid cells begin to release theirlatent heat. If the temperature of these grid cells has already been raised by latent heatconduction from the first solidified element, these grid cells will solidify somewhat slower,as described above. The velocity of the solidification front therefore changes, dependingupon the undercooling rate of the elements during solidification.
The result of calculation for an aluminium particle of 50 �m diameter is shown inFigure 5.15. The heat transfer coefficient is assumed to be α = 20 000 W/m2 K and theundercooling prior to nucleation is taken as 50 K. The solidification process initiates at asingle point on the surface of the particle in a plane inside the particle. By release of latentheat, the interior of the particle is heated up. For a 10% solidification rate, movement ofthe solidification front is visible, which raises the temperature of the surrounding grid cellsclose to the liquidus temperature.
Due to the low Biot numbers typically achieved in melt particles in gaseous atmospheres(high heat conductivities of metals) the thermal behaviour inside a particle is typically nottaken into account during proper thermal particle simulation. Without loss of accuracy, thetemperature gradient inside the melt particle may be neglected, and a mean constant particletemperature assumed.
This inspection of the thermal behaviour of particles in a spray underline the necessity forrefined modelling of spray behaviour in order to obtain realistic spray forming simulationresults. Such refinement within a multidimensional, multicoupled spray simulation will beintroduced in Section 5.2.
5.2 Internal spray flow field

122 Spray
Multicoupled models of spray processes are necessary in order to derive realistic and usefulsimulation results. Based on such models, investigation of exchange and transfer processesin two-phase spray flows is possible.
In the following, a multidimensional, multicoupled simulation model for spray processesbased on a Eulerian/Lagrangian approach will be introduced. First, conservation equationsfor mass, momentum and thermal energy, in combination with a turbulence model for thegaseous phase, will be used to investigate the pure gas flow field in a two-dimensionaldomain, i.e. gas flow in the atomizer and spray chamber. The discretized equations havebeen solved by means of a finite volume algorithm.
The fundamental conservation and transport equation is given in (3.1). In the case of two-dimensional flow, this equation simplifies for time-invariant flow of a continuous phase to:
∂
∂x(ρug�) + 1
r
∂
∂r(ρrvg�) − ∂
∂x
(�
∂�
∂x
)− 1
r
∂
∂r
(r�
∂�
∂r
)= S� − S�p . (5.48)
Once again, in this equation � is the transport variable and � is the effective viscosity. Thesource terms are defined as S (the index � is for internal sources/sinks and the index �p isfor sources/sinks from the phase coupling).
Second, the trajectories or flight paths of a great number (several 1000 up to several10 000, dependent on the flow type) of individual particles (respectively parcels of particlesdisplaying identical properties) are calculated. Interaction of these parcels with the gasphase will be stored at the control volume locations of the solution domain. The sourceterms in the conservation equations, describing coupling of the dispersed phase to thecontinuous phase, for phase coupling of momentum and thermal energy, are derived fromthe particle-source-in-cell approach (Crowe et at., 1977):
Smom = 3πµgdp fr (u p − ug)N , (5.49)
Sener = Nuπλgdp(Tp − Tg)N . (5.50)
In these source terms, f is the normalized friction coefficient as a ratio of particle resistance(for solid particles expressed by means of Eq. (5.4)) to Stokes resistance (cd = 24/Re forRe << 1):
fr = 1 + 0.15Re0.687. (5.51)
The thermal energy source term contains the Nusselt number Nu for convective heat transferfrom the particle to the gas (from Eq. (5.16)) as well as the instantaneous local Reynoldsnumber Re, which is expressed in terms of the local relative velocity between phases. Thenumber N is the number of particles in a discrete volume of the solution domain.
The momentum and thermal energy exchange values between particulate and continuousphases will be summed up locally at all grid volumes over all included particle parcels toobtain the source terms for the continuous phase conservation equations.
The third step in the coupled solution is renewed calculation of the continuous phaseconservation equations, which now include the source or sink terms for the momentum andenergy equation at all control volumes. By doing so, coupled simulation of a multiphaseflow problem (two-way coupling) is achieved. Steps 2 and 3 will be iteratively solved until

123 5.2 Internal spray flow field
a prescribed convergence criterion is reached and a final solution for the steady state of thespray process has been achieved.
Description of the thermal state of particles in the spray during solidification is based onthe appropriate models for nucleation and crystal growth, as discussed above. The modelsare material dependent and include the thermal cooling condition (cooling rate) as the mainboundary condition.
Boundary conditions for the coupled approachThe calculation is performed for the cylindrical spray forming chamber illustrated inFigure 5.16. The chamber diameter is 1.0 m and the chamber height is 0.8 m. Inflowboundary conditions for the gas consist of two separate inflow ports. The central gas jet
Fig. 5.16 Calculation area for the spray simulation: two-dimensional representation of the spraychamber (Bergmann et al., 1995)

124 Spray
models the primary gas inlet of the free-fall atomizer and is directed vertically downwards.The coaxial slit nozzle represents the secondary flow of the free-fall atomizer in the two-dimensional representation, where the atomization gas exits at a certain inclination angletowards the centre-line. The mass flow rates of the primary and secondary gas are calcu-lated from Eqs. (4.24) and (4.25) for prescribed gas pressures. The gas velocity is equal tothe local velocity of sound, thereby the gas flow is assumed to flow in an underexpandedstate out of the nozzles. Change of mass flow rates for varying gas pressures is thereforeperformed by alteration of the gas exit area. The gas exhaust is located, for simplicity, atthe outer edge of the lower wall of the spray chamber (slit configuration).
The most important boundary condition for the dispersed phase in the simulation is thestarting condition of the droplets at the fragmentation point of the melt. Because the featuresof the disintegration and atomization processes may not be simulated in detail down to thedrop-size scale, physically realistic assumptions of the starting conditions are made. Theseare based either on simplified fragmentation models, as described in Section 4.3.2, or onempirical input data from experiments. The polydispersed state of particles of differentsizes within the spray may, especially, lead to analysis problems. But proper description ofthis behaviour is important for calculation of the thermal state of the compacting mass ofparticles. The following assumptions are made in the multicoupled simulation below.
� The starting area for droplets is located a distance 100 mm below the gas exit, reflectingthe principal geometry of a free-fall atomizer.
� The particle-size distribution is assumed to be log-normal. The mass median value of theparticle-size distribution is calculated from Lubanska’s empirical correlation (Eq. (4.49)),and a constant logarithmic standard deviation of σln = 0.7 is assumed.
� The starting velocity of the droplets equals the calculated melt jet velocity at the frag-mentation point (see Section 4.1.2).
� The temperature of the droplets at their starting point is equal to the melt exit temperatureat the tundish (see Section 4.1.1); therefore, temperature loss from the melt jet betweenthe exit from the tundish and the disintegration area is neglected.
Single-phase gas flow fieldFirst, proof needs to be obtained as to whether the simulation results of the single-phase gasflow field of the combined atomizer and the primary gas jets in the spray chamber agree withexperimental gas velocity measurements in the spray chamber. Figure 5.17 shows measured(Uhlenwinkel, 1992) gas velocity distributions in a spray chamber without atomization fordifferent pure gas pressures. Bergmann et al.’s (1995) simulated results are plotted forcomparison at an atomizer gas flow of 2.0 bar. It was not possible to record measurementsnear the nozzle exit due to geometric restrictions in positioning the measurement probehere. The calculations in this area indicate negative velocity values for an upward pointinggas flow at the centre-line of the jet directly below the primary gas exit. In this region,slowly moving gas from the central nozzle is sucked into the faster moving atomization gasstream. Therefore, recirculation of gas in this area results (see Section 4.2.1). Especiallyat greater distances from the atomizer, agreement between calculation and measurement is

125 5.2 Internal spray flow field
0 400 600 800 1000
0
50
100
150
200
−5
−100
p = 1,5 bar
p = 2,0 bar
p = 2,5 bar
sim 2,0 bar
200
nozzle distance [mm]
0
p = 1.5 bar
p = 2.0 bar
p = 2.5 bar
sim 2.0 bar
gas
velo
city
[m
/s]
Fig. 5.17 Single-phase gas velocities at the centre-line (Bergmann et al., 1995). Measured data fromUhlenwinkel (1992)
good. Close to the nozzle, the maximum gas velocity achieved is recorded somewhat closerto the atomizer exit area than in the experiment. Also, the simulation overpredicts the valueof the maximum gas velocity.
Figures 5.18 and 5.19 illustrate the measured and simulated radial profiles of axial velocitycomponents of the gas flow field in the spray chamber at certain distances from the nozzle.In both descriptions, a local minimum at the centre-line is found, reflecting the geometryof the free-fall atomizer used here (see Section 4.2). At somewhat greater distances fromthe atomizer, the gas flow field shows a configuration comparable to that of a free turbulentgas jet. The jet spreads radially while the maximum gas flow velocity at the centre-lineof the spray decreases. Figure 5.20, showing the distribution of gas velocity and pressure(normalized to the local maximum value within each profile) at the centre-line of the flowfield, near the nozzle, exemplifies that a maximum pressure distribution occurs well abovethe fragmentation area of the liquid. Meanwhile, the maximum velocity distribution at thecentre-line is located below the atomization area of the liquid melt in twin-fluid atomization.The pressure maximum is due to reflection of the impinging atomizer gas (stagnationpressure). The role of the pressure distribution in the fragmentation processes in liquidatomization applications is still not clear.
Two-phase flow fieldThe coupled simulation results of the spray behaviour in spray forming applications nowpresented are taken from Bergmann et al. (1995). These simulations have been performedfor spray forming applications of low-alloyed steel materials. The basic parameters and

126 Spray
500 100 150−50−100−150
radius [mm]
0
20
40
60
80
100
120
140
160z = 100 mm
z = 200 mm
z = 400 mm
z = 600 mm
gas
velo
city
[m
/s]
z = 100 mm
z = 200 mm
z = 400 mm
z = 600 mm
Fig. 5.18 Radial distribution of axial gas velocities (Bergmann et al., 1995)
0 0.02 0.04 0.06 0.08 0.1 0.12 0.14
radius [m]
0
50
100
150 z = 100 mm
z = 200 mm
z = 400 mm
z = 600 mm
z = 800 mm
gas
velo
city
[m
/s]
50
z = 100 mm
z = 200 mm
z = 400 mm
z = 600 mm
z = 800 mm
Fig. 5.19 Calculated radial distribution of axial velocities (Bergmann et al., 1995)

127 5.2 Internal spray flow field
Table 5.4 Parameters for two-phase spray simulation
pg [MPa] Mg [kg/h] Ml [kg/h] 1/GMR [-] ρp [kg/m3] d50.3 [�m]
0.2 465 558 1.2 6900 2040.3 695 417 0.6 6900 1260.3 695 558 0.8 6900 1330.3 695 834 1.2 6900 1470.4 925 558 0.6 6900 1040.5 1155 558 0.6 6900 88
0 0.02 0.04 0.06 0.08 0.1
nozzle distance [m]
0
0.5
1.0
1.5
− 0.5
−1.0velocity pressure
pres
sure
,vel
ocity
[-]
velocity pressure
Fig. 5.20 Velocity and pressure distribution at the centre-line of the spray near the atomizer vicinity(Bergmann et al., 1995)
boundary conditions assumed throughout the calculations are listed in Table 5.4. The basiccase is shaded; the other five cases are variations from that basic process condition.
The distribution of axial gas velocities and some preselected drop-size classes at thecentre-line of the spray is shown in Figure 5.21 for the basic parameter set at an atomiza-tion pressure value of 0.3 MPa. The gas flow field above the fragmentation area remainsunchanged compared to single-phase flow. In the fragmentation area, a drastic decrease inthe velocity of the gas flow is to be seen, which is due to momentum transfer from the gas tothe droplets resulting from the drop in acceleration. At somewhat greater distance from thefragmentation area, the gas velocity recovers and increases once again. Here, local expan-sion of gas due to the rise in temperature associated with release of heat from the dropletsoccurs (see Figure 5.22), which results in local acceleration of the gas flow. Another reason

128 Spray
0 0.2 0.4 0.6 0.8
nozzle distance [m]
0
50
100
150
200
−50
−100
−150
gas 33 µm 83 µm 133 µm 183 µm
233 µm 283 µm 333 µm 383 µm 433 µm
velo
city
[m
/s]
gas 33 µm 83 µm 133 µm 183 µm
233 µm 283 µm 333 µm 383 µm 433 µm
Fig. 5.21 Gas and particle velocities on the spray centre-line (Bergmann et al., 1995)
0 0.2 0.4 0.6 0.8
nozzle distance [m]
0
500
1000
1500
2000
gas 33 µm 83 µm 133 µm 183 µm
233 µm 283 µm 333 µm 383 µm 433 µm
tem
pera
tur
e[
K]
gas 33 µm 83 µm 133 µm 183 µm
233 µm 283 µm 333 µm 383 µm 433 µm
tem
pera
ture
[K]
Fig. 5.22 Gas and particle temperatures at the spray centre-line (Bergmann et al., 1995)

129 5.2 Internal spray flow field
for this behaviour is the ongoing entrainment of external gas from the spray chamber acrossthe outer edge of the spray into the spray cone and the mixing with the principal atomizer gasin the centre of the spray. The maximum gas velocity in the case of a coupled two-phase flowsimulation is reached at a distance of approximately 330 mm below the nozzle. From thispoint onwards the gas velocity decreases constantly. Immediately above the lower substrateat the bottom of the spray chamber, the gas rapidly decelerates and is radially reflectedtowards the exhaust system. The gas velocity in the stagnation point by definition is zero.Reflecting the overall gas velocity distribution in the main part of the spray system (at leastwithin the region at the spray centre-line discussed here) the gas velocity value is almostconstant, the change in gas velocity and its decrease at somewhat greater nozzle distancesis, by far, less pronounced compared to the case of single-phase gas flow. The distribution ofparticle velocities at the centre-line of the spray in Figure 5.21 illustrates acceleration valuesthat are much lower compared with values calculated in the uncoupled simulation (seep. 124). The main reason is the low gas density due to rapid heating in the atomization areathat is accounted for in the coupled simulation by increased gas temperature. Thereby, theparticle resistance force, for acceleration of the droplets, is decreased. The impingementvelocities of the particles on the deposit/substrate are calculated well below those valuesobtained in the simulation for the case without coupling effects taken into account.
The distribution of gas and particle temperatures at the centre-line of the spray for a0.3 MPa atomization gas pressure is illustrated in Figure 5.22. In this approach, for analysisof the solidification process, a simple heterogeneous nucleation model has been used todescribe the phase change of the melt droplets. From the gas temperature distribution, onecan see a very rapid rise in the fragmentation area up to values of 1200 K. The maximumgas temperature is reached a few centimetres below the atomization area. During furtherdevelopment of the gas plume, the temperature decreases, mainly because of radial mixingwith the entrained colder gas from the outer spray chamber. Because the gas in the total sprayarea under investigation (at least for that part of the spray discussed here) is somewhat colderthan for all calculated droplet classes, the direction of heat transfer is always from the hotdroplets to the colder gas. Particle superheating at the point of droplet formation is assumedto be 125 K in this case. After losing their superheat, in a very narrow region, temperatureof the droplets immediately remains constant throughout the solidification process in thefragmentation area. This area of droplet phase change covers most of the spray developmentin this example. From this simulation run, it may be deduced that for the assumed gas massflow rate (respectively, gas pressure), all particles less than 210 �m in diameter are alreadyfully solidified (solid particles) when they impinge onto the substrate. All bigger particlesare in a state of solidification, no particles can be seen which are still fully liquid uponimpact.
From analysis of the radial distribution of gas temperatures at specific distances from theatomizer, which are shown in Figure 5.23, three distinct areas in the spray may be identified.The first is the entire ‘core region’ of the spray. Here the maximum gas temperatures are to beseen. Due to the relatively high particle concentration in this area, the total heat transfer rates(summing up all individual contributions from calculated particles) between the particlesand the gas are highest here. At the outer edge of the spray (r < 0.1 m), drastically lower

130 Spray
0 0.1 0 .2 0.3 0.4 0.5
radius [m]
300
500
700
900
1100
1300z = 100 mm
z = 200 mm
z = 400 mm
z = 600 mm
gas
tem
pera
tur
e[
K]
1
z = 100 mm
z = 200 mm
z = 400 mm
z = 600 mm
gas
tem
pera
ture
[K]
Fig. 5.23 Radial distribution of gas temperature (Bergmann et al., 1995)
gas temperatures are to be seen: this is because the gas exiting from the atomizer nozzleshas not been sufficiently warmed up due to the low particle concentration in this area. In thethird area, located between the spray and the chamber wall (r > 0.1 m), which covers a largepart of the geometric extent of the spray in this case, the gas temperature is almost constant.This is the area where recirculation of gas from the lower part upwards into the upper partof the spray chamber occurs, and where it is entrained into the spray plume. In this case,heat transfer between the gas and the spray-chamber wall is not taken into account: thechamber walls are assumed to be adiabatic (this assumption may be easily removed fromthe simulation). For steady-state conditions, the gas temperature in the recirculation areais approximately 675 K. This seems to be a realistic value as it is well within typicallymeasured gas exhaust temperature levels for steel melt spray forming processes.
The related radial profiles of axial gas velocities at specific distances to the atomizer areillustrated in Figure 5.24. Drastic heating and expansion of the gas in the disintegration arealeads to intense radial spreading of the spray cone when compared to similar applicationsof sprays with cold liquids/droplets without heat transfer. In the central area of the spray,the gas velocities are somewhat smaller than at the spray edge during early stages of spraydevelopment. Due to the high particle concentration in the centre of the spray, transferenceof momentum from the gas towards the droplets is greatest in this region. Only at greaterdistances from the atomizer will the gas velocity profiles achieve the expected, almost bell-shaped (Gaussian), profile due to radial mixing of the gas. The maximum gas velocity valuehere is to be seen at the core of the spray. Negative velocity values close to the spray-chamberwall indicate the upward movement of gas from the recirculation area. The radial distancefrom the centre-line where upward gas movement begins is almost unchanged in the spray

131 5.2 Internal spray flow field
0 0.1 0.2 0.3 0.4 0.5
radius [m]
0
50
100
150
200
−50
z = 100 mm
z = 200 mm
z = 400 mm
z = 600 mm
gas
velo
city
[m
/s]
Fig. 5.24 Radial distribution of gas velocity (Bergmann et al., 1995)
chamber, therefore indicating that the radial core of the recirculating vortex is constant withrespect to axial distance.
Comparison between two different velocity and temperature trajectories for dropletsexhibiting mass median spray particle size is illustrated in Figures 5.25 and 5.26. Here thetrajectory of a droplet at the centre of the spray is compared with that at the outer edge ofthe spray. The analysis must take into account thermal coupling between the continuousand dispersed phases for proper understanding and description of the spray behaviour inspray forming. Because of the somewhat lower gas temperatures at the edge of the sprayand the related higher gas densities in this area (when compared to the centre of the spray)higher momentum transfer rates due to increased resistance forces are to be found here.Therefore, the particles at the spray edge are more rapidly accelerated than in the core andmove at higher velocities. This behaviour results in shorter flight and residence times forthose particles moving at the spray edge than those moving in the spray core. Though theflight time (and therefore the interaction time between gas and droplets) at the spray edgeis smaller, the droplet temperature for these edge particles at the point of impingementonto the substrate/deposit is lower than for core particles. The reason for this is the smallergas temperature at the spray edge and the resulting increased temperature difference dueto increasing heat transfer rates of individual particles. This, of course, is only valid foridentical particle-size classes: when the integral spray behaviour is calculated in terms ofheat fluxes, one has to keep in mind that the local drop-size distribution and the mean dropsize in the spray, as well as the mass flux, decrease radially.
By changing the operational parameters of the spray forming process as listed inTable 5.4, the simulated results illustrated in Figures 5.27 and 5.28 are obtained. By alteration

132 Spray
0 0.2 0.4 0.6 0.8
nozzle distance [m]
0
10
20
30
40
50
dp = 133 µm
core edge
part
icl
ev
eloc
ity
[m
/s]
dp = 133 µm
core edge
part
icle
velo
city
[m/s
]
Fig. 5.25 Comparison between particle velocity distributions at the centre-line of the spray and atthe spray edge (Bergmann et al., 1995)
0 0.2 0.4 0.6 0.8
nozzle distance [m]
1200
1400
1600
1800
2000
dp = 133 µm
core edge
part
icl
et
empe
ratu
re
[K
]
dp = 133 µm
core edge
part
icle
tem
pera
ture
[K]
Fig. 5.26 Comparison between particle temperature distributions at the centre-line of the spray andat the spray edge (Bergmann et al., 1995)
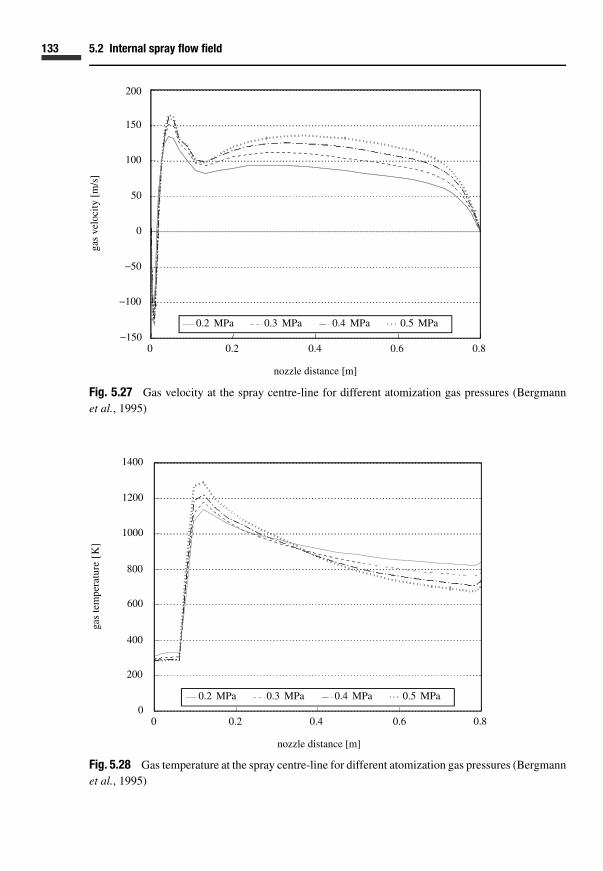
133 5.2 Internal spray flow field
0 0.2 0.4 0.6 0.8
nozzle distance [m]
0
50
100
150
200
−50
−100
−1500.2 MPa 0.3 MPa 0.4 MPa 0.5 MPa
gas
velo
city
[m/s
]
0.2 MPa 0.3 MPa 0.4 MPa 0.5 MPa
gas
velo
city
[m
/s]
Fig. 5.27 Gas velocity at the spray centre-line for different atomization gas pressures (Bergmannet al., 1995)
0 0.2 0.4 0.6 0.8
nozzle distance [m]
0
200
400
600
800
1000
1200
1400
0.2 MPa 0.3 MPa 0.4 MPa 0.5 MPa
gas
tem
pera
tur
e[
K]
0.2 MPa 0.3 MPa 0.4 MPa 0.5 MPa
gas
tem
pera
ture
[K]
Fig. 5.28 Gas temperature at the spray centre-line for different atomization gas pressures (Bergmannet al., 1995)

134 Spray
0 0.2 0.4 0.6 0.8
nozzle distance [m]
0
50
100
150
200
−50
−100
−150417 [kg/h] 558 [kg/h] 834 [kg/h]
gas
velo
city
[m/s
]
417 kg/h 558 kg/h 834 kg/h
gas
velo
city
[m
/s]
Fig. 5.29 Gas velocity at the spray centre-line for different melt mass flow rates (Bergmann et al.,1995)
of the atomization gas pressure:
(a) increase of the gas velocities in the atomization area occurs, and simultaneously(b) a decrease of the mean droplet size in the spray results.
In combination with these effects, the heat and momentum transfer rates of an individualmean-sized particle, as well as for the whole particle collection, is increased. But the overallbehaviour of the spray is still in question, as the particle concentration increases (at constantmass flow rates of the melt) and the residence or flight time of particles in the spray decreases.As shown in Figure 5.27, in the two-phase flow field in the spray, the gas velocity increaseswhen the gas pressure is raised (as has been shown for the spray centre-line). This is mainlybecause of intensified heating of the gas in the atomization area, as can be seen in Figure 5.28.At increased nozzle or atomizer distances, the gas temperature changes with increasingatomization pressure. Here the temperature of the gas in the impingement area of the spraydecreases due to more intense mixing with the overall colder gas in the spray chamber, forincreasing gas pressures.
Gas temperatures and velocities are shown in Figures 5.29 and 5.30 for a changed metalflow rate at a constant atomization gas pressure of 0.3 MPa. By increasing the melt liquidflow rate:
(a) the thermal energy input into the spray is increased, and(b) the resulting droplet sizes in the atomization spray are augmented.
Therefore, the local gas temperature in the spray (here again shown for the conditionsat the spray centre-line only) is, generally, increasing. From analysis and comparison ofFigures 5.27 to 5.30 one can observe that classification of the spray forming process on the

135 5.2 Internal spray flow field
0 0.2 0.4 0.6 0.8
nozzle distance [m]
0
200
400
600
800
1000
1200
1400
417 [kg/h] 558 [kg/h] 834 [kg/h]
gas
tem
pera
tur
e[
K]
417 kg/h 558 kg/h 834 kg/h
gas
tem
pera
ture
[K]
Fig. 5.30 Gas temperature at the spray centre-line for different melt mass flow rates (Bergmannet al., 1995)
basis of the mass flow ratio between gas and melt (GMR) is not sufficient, and, at least, theresulting change in particle-size distribution must be accounted for.
Reliable measurement results for comparison with simulated results, e.g. for dropletvelocity or temperature distributions or observation of gas behaviour in the spray, in sprayforming applications are rare. Some in-flight measured data from PDA measurements aregiven in Bauckhage (1998a,b) and Domnick et al. (1997) and will be discussed later.Development of suitable methods for detection of droplet properties in the spray duringspray forming is an important research topic. For verification of two-phase flow simulationof spray behaviour, often the measured properties of particles collected at the point of sprayimpingement are taken. Figure 5.31 shows calculated and an experimentally determinedresults for the radial behaviour of a mass flux of droplets from the centre of the spray toits edge. The simulated values show some deviations, especially in the spray core. Thisdeviation may be due to deficiencies in the model, where the quite crude assumption ofdroplet starting conditions may be a main factor.
Stochastic contribution to spray structureAn example of results from a fully coupled spray simulation (Bergmann, 2000; Bergmannet al., 2000) is shown in Figure 5.32, where the calculated temperature and solid fractionof individual different size particles at a certain position along the spray centre-line (r =0 m) at a distance s = 0.27 m below the point of atomization are to be seen. The processparameters used in this calculation are those characteristic of spray forming of C30 steel,and are shown in Table 5.5. Due to the turbulent character of the flow field and the stochasticnature of particle trajectories through the spray (turbulent droplet dispersion), at a single

136 Spray
Table 5.5 Parameters for fully coupled spray simulation (Bergmann, 2000)
Gas pressure Gas mass flow Melt mass flow rate Melt superheat
Material pg [MPa] rate Mg [kg/s] Ml [kg/s] GMR [-] �T [K]
Steel C30 0.35 0.21 0.175 1.2 150
0 0.02 0.04 0.06 0.08 0.1 0.120
10
20
30
40
radius [m]
MSD
[kg
/m2
s]
measured
simulated
measured
simulated
Fig. 5.31 Comparison between measured and calculated mass flux distribution at the sprayimpingement area: nozzle distance z = 688 mm, material: steel C30, GMR = 1.1 (Fritschinget al., 1997b)
s=
0.27
m
600
800
1000
1200
1400
1600
1800
2000
0 100 200 300 400 500
particle diameter [µm]
tem
pera
ture
[K
]
0
0.2
0.4
0.6
0.8
1
solid
fra
ctio
n [
-]Tp
fs
T 0
60µm
380
µm
Fig. 5.32 Calculated temperature and solid fraction shown by individual particles at a positions = 0.27 m within the spray (r = 0 m). The solidification interval of C30 steel is indicated in grey(Bergmann, 2000)

137 5.2 Internal spray flow field
point within the spray (as seen here) the temperature and velocity of identical-sized particlesmay vary. The following conclusions for the thermal state of the particle with respect todroplet diameter at the observed position in the spray can be deduced from Figure 5.32:
� dp < 60 �m. All particles are already solidified (fs = 1) at temperatures below the solidustemperature. With decreasing particle size, the mean temperature also decreases, whilethe scattering of individual particle temperatures may vary stochastically from the meanparticle class value. Increased scattering of temperatures is due to decreased particleinertia and mass, and to the turbulence in the gas flow, which results in deviation fromthe deterministic droplet flight path (turbulent dispersion).
� 60 �m < dp < 380 �m. In this droplet-size spectrum, the particles are in the processof solidifying (0 < fs < 1). A scatter may be observed in the thermal state of individualparticles: in the 70 to 80 �m size range some fully solidified particles can be seen, whilein the 270 to 330 �m size range some still fully fluid droplets can be found. Thoseparticles that are in the process of solidification, show temperatures between the solidusand liquidus temperature (this region is indicated by the grey bar in the temperature plot).The fraction of particles solidifying decreases with increasing particle size.
� 380 �m < dp. All particles within this size spectrum are still fully liquid in the region(s = 0.27 m) under consideration. Their temperature is above the liquidus temperature,which means that these droplets still contain some superheat. The amount of superheatincreases with increasing particle size.
This scattering of droplet temperature data and solid fractions in the spray means that thetemperature of the spray at impingement needs to be suitably averaged. These conditionsare due to local droplet-sized distributions and stochastic particle behaviour resulting fromturbulent dispersion of droplets in the gas flow fluid.
Thermal averaging of spray conditionsAn important condition for successful preform evolution is, besides the mass flux distri-bution in the spray, derivation of the distribution of the local thermal state of the spray atimpingement. Here the local (but particle-size averaged) enthalpy flux in the deposit, as amain measure, can be averaged in two different ways, both of which have been described byBergmann (2000) and Bergmann et al. (1999). The total enthalpy of the impinging dropletmass in the spray can be locally over all drop size classes:
h p = 1∑i
m p,i
∑i
[m p,i {[cl(Tp,i − Ts) + �h f ](1 − fs,i ) + cs[(Tp,i − Ts) fs,i + Ts]}(5.52)
Two different cases can be derived:
(1) The first averaging principle calculates the state of solidification and the temperatureof the impinging droplets in thermal equilibrium (caloric averaging) dependent on thelocal state of solidification. Three subcases can be defined:

138 Spray
(1a) The droplet material is already totally solidified (hp ≤ csTs):
f s = 1, (5.53)
T p = h p
cs. (5.54)
(1b) The droplet material is in the stage of solidification or is partly solidified (cs Ts <
cl(Tl − Ts) + �h f ):
f s = cs Ts + cl(T p − Ts) + �h f − h p
(cl − cs)(T p − Ts
) + �h f, (5.55)
Th = h p + (1 − f s)[(cl − cs)Ts − �h f ]
(1 − f s)cp + f scs. (5.56)
The values of fs and Th are based on thermal equilibrium assumptions with the aidof an appropriate phase diagram, for alloys; for pure metals, Th = Ts,l .
(1c) The droplet material is totally liquid (cs Ts + cl(Tl − Ts) + �h f < h p):
f s = 0, (5.57)
Th = h p + (cl − cs)Ts − �h f
cl. (5.58)
(2) The second averaging method is called the separation method. It is based on the as-sumption that the droplets are in an unbalanced state with respect to the solidificationprocess. In this method, energy exchange within the droplet mass is due to its thermalstate and is not a result of the remaining solidification enthalpy which is contained inindividual droplets:
fs = �i (m p,i fs,i )
�i m p,i. (5.59)
Tm = 1
[cs f s + cl(1 − f s)]∑
im p,i
∑i
{m p,i Tp,i [cs f s + cl(1 − f s)]}. (5.60)
These two averaging methods represent two extreme cases. The first method describes thethermal state of the particulate mass in thermal equilibrium. This means that the thermalstate is characterized by means of the specific-enthalpy-related thermal state with respect totemperature and degree of solidification. As discussed earlier, this averaging method maylead to the possible state that the spray material is fully solidified, on average; though inthe total droplet mass, some liquid may still be contained in the bigger droplets. This is thecase where a huge number (or better mass fractions) of small solidified and relatively coldparticles exist in the spray. When averaging by Method 1, the fact that some bigger dropletsmay still contain liquid will not be reflected. Based on the separation method, this deficit

139 5.2 Internal spray flow field
may be avoided. This method yields the amount of liquid, respectively solidified mass, aswell as the amount of remaining solidification enthalpy within the spray.
Results of different thermal averaging methodsFigure 5.33 shows the calculated temperature and solid fraction values of particles fromFigure 5.32. In addition, the figure shows the averaged values above (s = 0.04 m) and below(s = 0.62 m) this position in the spray cone. From these diagrams it is obvious that thelimits for totally solidified and totally liquid particles are shifted towards larger particlesizes with increasing flight distance. Also the size spectrum of the particles in the stateof solidification becomes broader. At larger distances from the point at which particlesstart (s = 0.27 m and s = 0.62 m), no significant differences between the two averagingmethods is observed. But at short particle-flight distances (s = 0.04 m), both averagingmethods differ significantly. This difference occurs because of the solidifying particles.While the enthalpy method calculates a continuously increasing particle temperature forincreasing particle sizes, by the separation method a local minimum is calculated for particlesizes between 50 and 60 �m in diameter. In addition, the solid fraction shows a greatergradient when calculated by the separation method; here the particle size spectrum ofthe solidifying particles is smaller in the separation method. With respect to the thermalstate of the particles, this means that all particles in the size spectrum 50–110 �m are, onaverage, slightly undercooled. This can be seen from the mean particle temperature, whichis lower than the liquidus temperature (upper limit of the solidification interval – grey area)though the mean solid fraction is still zero. The reason for the different results of bothaveraging methods in this particle size spectrum is explained as follows. If a fluid meltdroplet is undercooled, its specific enthalpy is lower than the specific enthalpy at liquidustemperature. Because of this, when averaging with the enthalpy method, this droplet will betaken as a solidifying particle, while in fact this droplet is still fully liquid. In the separationapproach, the solid fraction is calculated separately from temperature and, therefore, themean solid fraction is derived from the particle’s fluid melt content only.
In contrast to the properties exhibited by thermal average of individual particle-sizeclasses at a certain position within the spray, the averaging methods above yield stronglydeviating results when locally averaged over the whole particle-size spectrum in the sprayat a certain (radial) position. This behaviour is shown in Figure 5.34. When averaging overa certain particle-size class (bin), the mass fraction of each individual particle parcel isidentical (as derived from the spray model). But when averaging over the whole particle-size spectrum, the mass distribution of the particle-size distribution is to be considered.When looking at a particle mass where half of the mass consists of small, cold and fullysolidified particles, and the other half consists of a single big, fully fluid and hot particle,then the separation method yields a mean solidification state as a solid fraction of fs,m =0.5 (independent of individual temperatures or the latent heat content of the single hotparticle). For the enthalpy method, the mean properties are calculated in a coupled way.Here, the resulting mean temperature and the mean solid fraction depend on the differencebetween the temperature of the small particles and the solidus temperature compared to theremaining superheat within large particles.
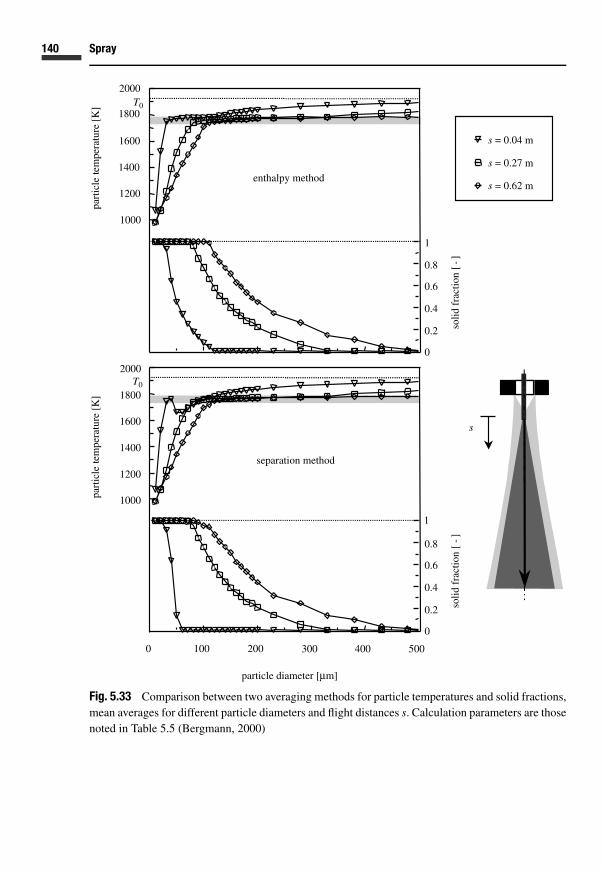
140 Spray
0 100 200 300 400 500
particle diameter [µm]
1000
1200
1400
1600
1800
2000
0
0.2
0.4
0.6
0.8
1
part
icle
tem
pera
ture
[K
]pa
rtic
lete
mpe
ratu
re [
K]
solid
fra
ctio
n [-
]
1000
1200
1400
1600
1800
2000
0
0.2
0.4
0.6
0.8
1
s
s = 0.04 m
s = 0.27 m
s = 0.62 m
T0
T0
enthalpy method
separation methodso
lid f
ract
ion
[-]
Fig. 5.33 Comparison between two averaging methods for particle temperatures and solid fractions,mean averages for different particle diameters and flight distances s. Calculation parameters are thosenoted in Table 5.5 (Bergmann, 2000)

141 5.2 Internal spray flow field
0 0.1 0.2 0.3 0.4 0.5 0.6 0.7 0.8 0.9
1500
1600
1700
1800
1900
2000
0
0.2
0.4
0.6
0.8
1
flight distance s [m]
part
icle
tem
pera
ture
[K]
solid
frac
tion
[-]
Tm
Th
fs,m
fs,h
s
Fig. 5.34 Mean temperature and solid fraction of the particle mass along the flight path (index: m =separation method; h = enthalpy method). Calculation parameters used are shown in Table 5.5(Bergmann, 2000)
The differences between the two averaging methods are visible in Figure 5.34, and canbe interpreted as follows. The enthalpy method represents the thermal equilibrium withrespect to the particle mass in the spray. This is illustrated by bringing together all particlesfrom a specific location (point of impingement) and leaving this mass under adiabaticconditions for inner compensation processes (heat conduction and solidification) to obtainthe equilibrium values of Th and fs,h. In contrast, the separation method describes theinstantaneous local thermal state (Tm and fs,m) of the particle mass in the spray. As canbe seen from Figure 5.34, the instantaneous mean particle temperatures and mean solidi-fication fractions are below the values for the equilibrium state (enthalpy method) for thewhole particle flight distance. With respect to the solidification process, after the depositionthis difference means that the overall particle mass is undercooled and will be reheated (in thedeposit) by means of the latent heat released during solidification.
From comparison of the two different thermal averaging methods with respect to thethermal properties of the particle mass located at the spray centre-line, the spray may bedivided into three different zones:
� Zone 1, overheated spray (Tm > Th; fs,m > fs,h). In this zone, the values from the separationmethod are greater than those from the enthalpy method. For the overall particle mass, thismeans that the particle material tends towards lower solidification fractions at the thermalequilibrium. Thus, if the particle mass is brought together as is done during deposition, theremaining superheat from the bigger, still liquid droplets will remelt parts of the alreadysolidified particle mass.
� Zone 2, slightly undercooled spray (Tm < Th; fs,m < fs,h). In this zone the values from theseparation method are lower than those from the enthalpy method. The averaged particletemperature (with respect to specific enthalpy) is in the range of the solidification interval(Ts < Th < Tl). Therefore, the particle material tends towards higher solid fractions during

142 Spray
s
0 0.1 0.2 0.3 0.4 0.5 0.6 0.7 0.8 0.9flight distance s [m]
0
1500
1700
1900
2100
tem
pera
ture
[K
]
1500
1700
1900
2100te
mpe
ratu
re [
K]
0.20.40.60.81
soli
d fr
acti
on[
- ]
1500
1700
1900
2100
tem
pera
ture
[K
]
00.20.40.60.81
soli
d fr
acti
on[
- ]
00.20.40.60.81
soli
d fr
acti
on[
- ]
Tm
fs,m
Th
fs,h
Tl = 100 K
Tl = 200 K
Tl = 300 K
1
2 3
2 3
1 2 3∇
∇
∇
Fig. 5.35 Comparison of different averaging methods for varying melt superheats, showing meantemperature and solid fraction of the whole particle mass along the flight path at the spray centre-line(dependent on the melt overheat). For other parameters see Table 5.5 (Bergmann, 2000)
thermal equilibrium. The remaining superheat in the bigger liquid drops is not sufficientto remelt parts of the already solidified particle material. The particle mass still containsenough enthalpy that even during thermal equilibration some melted parts will remain(fs,h < 1).
� Zone 3, heavily undercooled spray (Th < Ts; fs,h = 1). In this zone the particle materialat thermal equilibrium is completely solidified (fs,h = 1). The equilibrium temperature islower than the solidus temperature (Th < Ts). In this zone, the deposited material will beimmediately solidified.
Based on adjustment of the melt superheating in the crucible/tundish, the boundariesbetween these three zones can be shifted relative to the flight distance of the particles, asshown in Figure 5.35. For a small amount of melt superheating (�Tl = 100 K), coolingof the particles occurs immediately after solidification. For this case, Zone 1 is not visible.The transition from Zone 2 to Zone 3 is approximately at a flight distance of s = 0.47 m.

143 5.2 Internal spray flow field
0 0.01 0.02 0.03 0.04 0.051400
1500
1600
1700
1800
radial position [m]
Ttem
pera
tur[
K]
surface temperature
T (Method 1)
T (Method 2)
z=
0.75
m
e[K
]
Ts
Ttem
pera
tur[
K]
Ttem
pera
tur[
K]
tem
pera
ture
[K
]
Fig. 5.36 Radial distribution of the averaged temperature at the deposit surface (Bergmann et al.,1999, 2000): Method 1, equilibrium; Method 2, separation. Measurements taken using a pyrometer(Kramer, 1997)
By increasing the melt superheating, the transition is shifted to increase flight distances(s = 0.62 m for �Tl = 200 K and s = 0.77 m for �Tl = 300 K). In these cases of increasedsuperheating, Zone 1 is established.
A comparison of results obtained by these two different averaging methods with respectto the surface temperature of a spray formed steel (C3) deposit is shown in Figure 5.36.In the same figure, a temperature distribution measured by means of a surface pyrometer(Kramer, 1997) is shown. Both methods obtain a monotone, and at higher values of theradial coordinate attain almost linear behaviour of the surface temperature with increasingradius. The values of the surface temperature calculated by the equilibrium method aregreater than those calculated by the separation method. The measured values of surfacetemperatures are located in between both calculated curves.
Coupling effects between phases have to be taken into account during spray simulationwithin thermal spray processes, as can be seen from another result by Bergmann et al. (2000).In Figure 5.37, once again, the calculated mass flux distribution in the spray at the point ofimpingement onto the substrate for three different boundary conditions is illustrated:
(a) without coupling effects;(b) with coupling, taking the standard Ranz–Marshall (1952) correlation of Nusselt numbers
for heat transfer calculation of the droplets (see Eq. (5.16));(c) with coupling, taking the extended Nusselt number correlation from Yearling and Gould
(1995), including the turbulent character of the gas flow field (see Eq. (5.18)) for theheat transfer calculation.
From the shown distribution of mass one can clearly see that coupling effects directlyinfluence the macroscopic spray behaviour in terms of the spray angle. Without coupling,the spray angle is just half of the value with coupling, and the simulated spray will bedistributed in an unrealistically narrow spectrum.

144 Spray
0
20
40
60
80
100
0 0.02 0.04 0.06 0.08 0.1
no coupling[ran-52][yea-95]
measurement
mas
sfl
ux [
kg/m
2s]
radius r [m]
z
r
no coupling
(Ranz and Marshall, 1952)(Yearling and Gould, 1995)
measurement
αα
Fig. 5.37 Mass flux distribution in spray, calculated with and without regard for coupling effects(Bergmann et al., 2000)
5.3 Spray-chamber flow
Within all spray processes that aim to impact a droplet mass onto a substrate, the innerspray flow field within the main spray cannot be analysed properly without recourse to thegeometry of the outer facility that contains the spray and the type of external flow, as wellas the flow field in the surrounding environment. In spray forming applications, this areaof study involves the analysis of the flow conditions in the spray chamber. The influenceof external flow conditions on the primary spreading behaviour of the spray plume is notrelevant in most cases (at least when some principal fluid mechanical rules are recognizedcorrectly). But investigation and optimization of the spray-chamber geometry from a fluidmechanical point of view allow control of some important process conditions and features.In addition, at least one degree of freedom is added for influencing the spray cone behaviourin the process: in spray forming this is, for example, control of the overspray particulatemass, which is transported in the spray chamber and possibly reentrained into the spray.Additional possibilities of process control and manipulation are based on measures of active

145 5.3 Spray-chamber flow
Zerst‰uber
Deposit
obere
untere
Kammer
deposit
atomizer
upper chamber
lower chamber
Fig. 5.38 Spray-chamber flow: stream-line representation of the gas flow field in the lower and upperchamber
flow steering in the spray chamber. Here active elements, such as secondary gas flows (e.g.by some gas jets in the spray chamber not participating in the atomization process, butjust controlling the chamber flow) in the chamber may be applied (without influencing theprincipal atomization and spray development process). Or passive control may be achieved,e.g. by applying flow baffles in the chamber. This flow control feature may be of importancefor spray forming applications as recirculating and swirling gas flows in the spray chambercontain a certain amount of overspray powder. Here process problems may occur due to:
� radial entrainment of solidified powder into the spray (which on the other hand may evenbe, in some cases, advantageous for additional cooling of the spray);
� impairment of optical spray control and measurement devices for process monitoring orcontrol;
� possible sticking of overspray particles in specific areas of the spray chamber that affordcost-intensive and time-consumptive cleaning processes (and may cause hazardous risksdue to increased explosion potential).
Potential for the development of spray forming process by passive and active control of flowin the spray chamber may be based on modelling and numerical simulation of the two-phaseflow; this potential has not been generally realized yet. The possible reason for this is thehuge computer resources needed to calculate the fully three-dimensional flow field in thechamber. The two examples listed next illustrate the status quo in process developments.
The simulated flow field in a cylindrical spray forming chamber, based on a two-dimensional coupled two-phase flow simulation (Fritsching, 1995), is illustrated inFigure 5.38 in terms of gas stream lines and gas velocity vectors at certain positions. The

146 Spray
y
x
z
Fig. 5.39 Spray-chamber flow during spray forming of aluminium: gas flow field (Pien et al., 1996)
chamber under investigation consists of two cylindrical segments. The geometry of the realspray chamber that this has been aimed to reflect was rectangular, but has been simplifiedto that of a cylinder for simplicity of calculation, as the simulation can then be performedin two dimensions. The atomizer is located in the upper segment, at the top of the spraychamber. One can observe marked recirculatory flows of gas, which cause entrainment ofgas and continuous recirculation of finer overspray powder into the spray within the upperpart of the system. This reevaluation of flow from the lower spray chamber back to the upperatomizer chamber needs to be avoided. In a later version of this particular spray chamber,the atomizer is mounted at a lower position directly inside the main spray chamber to avoidsuch problems.
Figure 5.39 shows the simulated gas flow field in a spray chamber from a study by Pienet al. (1997). The coupled two-phase flow simulation has been adapted for a three-dimensional calculation in the spray chamber. The process under investigation aims atthe production of flat products by spray forming. Therefore, the base chamber geometryhas been constructed within a relatively long circular chamber. Figure 5.40 illustrates aninstantaneous picture of the drop distribution in the spray chamber for the same simulationrun, where the actual positions of the calculated parcels from the simulation are to be seen.The investigation has been made during spray forming of aluminium alloys where the meltis atomized by flat slit (linear) nozzle systems. Here the melt exits the tundish in the form ofan elongated flat sheet and is atomized by means of the so-called linear atomizer attackingthe liquid sheet from both sides. The aim of this investigation is to visualize the flow field in

147 5.4 Droplet and particle collisions
y
x
z
Fig. 5.40 Spray chamber flow during spray forming of aluminium: particle movement (Pien et al.,1996)
the chamber and to optimize the positioning of the nozzle and exhaust gas system withinthe spray chamber. The figures show one calculated alternative where the exhaust systemis located on both sides of the spray chamber at half height.
5.4 Droplet and particle collisions
Collisions between particles and solid boundaries (wall impact) or between particles andparticles (collision) have a great impact on the behaviour of dispersed multiphase flowssuch as sprays. These collision processes must be incorporated as a submodel in a completeanalysis of spray modelling.

148 Spray
Fig. 5.41 SEM pictures of overspray powder from a spray forming facility
5.4.1 Collision between droplets/particles and other droplets/particles
Binary collision between droplets and particles in a spray may lead to:
� coalescence of the collision partners;� disintegration of one or both collision partners;� adhesion or sintering of particles to clusters, for particles which have been solidified or
partly solidified before collision.
In all cases, the local spray structure is changed due to collision, by means of the local drop-size distribution, which will change, and also the local drop-vector momentum distribution,which will change. Compared to conventional spray processes, in the special case of moltenmetal sprays and spray forming applications, additional morphologies of spray droplets andparticles have to be included in collision modelling. Here, besides fluid droplets, partlysolidified particles and solid particles may act as collision partners. These pairings maylead to a variety of different phenomena during particle/droplet collision in molten metaldroplet sprays. The SEM photographs in Figure 5.41 show a sample of an overspray powdertaken from a steel spray forming process: the fraction shown is of particles 200 to 250 �m insize, and illustrates binary droplet and particle collisions in the spray. On the left-hand sideof the figure, a small solid particle is illustrated, which has partly penetrated into anotherparticle during impact. This collision partner has obviously been partly solidified at themoment of collision. Another collision event is observed in the right-hand figure. Here apartly solidified droplet has collided with another droplet of similar size. The first dropletwas in a partly solidified state during collision and contained a liquid core that has pouredover the second particle during impact.
The relevance of droplet collision processes to a model of dispersed multiphase flow isdependent on several process parameters. The greatest influence from these collision pro-cesses is expected in highly concentrated flows and within flow fields with large differencesin the velocity spectrum of the dispersed phase. For example, in highly dispersed flows,the velocity spectrum that needs to be evaluated for droplet collision events (assuming thatthe particle density is not too high) is mainly affected by the turbulent fluctuations of theparticle velocities. Here collision effects are most likely. Within spray forming, turbulent

149 5.4 Droplet and particle collisions
effects on the movement of particles are of minor importance as the metal particles nor-mally have high material densities and, therefore, high inertial effects will govern particlemotion (excluding, perhaps, aluminium sprays). Also, the high gas velocity gradient in thespray will contribute to this effect. In spray forming, the resulting velocity spectrum withinthe droplet-size distribution between smaller and bigger particles and their respective slipvelocities to the gas phase mainly determine the relevance of droplet collision events.
A rough estimate of the relevance of particle collision effects to the overall spray behaviourcan be obtained from evaluation of the specific ratio of particle relaxation time (accelerationdominant) τ p and the time scale between individual particle collisions τ k (Crowe, 1980).The particle relaxation time is a measure of the time that a particle takes to accelerate fromvelocity ν1 to ν2. The particle relaxation time may be simply expressed by means of theStokes number:
τp = ρpd2p
18µ f. (5.61)
The time constant between collisions for particles is derived from the collision frequency:
τk = 1
fk. (5.62)
In dispersed multiphase flows at low particle concentrations (dilute flow), particle transportis mainly determined by fluid dynamic interaction of individual particles with the con-tinuous carrier phase (e.g. drag, lift, etc.). At high particle concentrations (dense flow),particle collision mainly affects the movement of individual particles. These two regionsare separated by a characteristic time scale:
dilute:τp
τk< 1, dense:
τp
τk> 1. (5.63)
In a dense dispersed two-phase flow, the time distance between particle collisions is smallerthan the particle relaxation time. Before reaching another steady slip velocity, from dropletgas interaction, another collision will occur. Therefore, particle movement is determinedmainly by collision, and fluid dynamic effects are of less importance. Obviously, in dilutetwo-phase flows particle collisions will also occur, but their probability is small and themain flow and particle behaviour is not strongly influenced by collisional effects.
A suitable binary collision model in a dispersed two-phase flow must be able to describethe following events and properties:
(1) When (or, if a correlation between place and time exists, where) does a particle collisionoccur?
(2) Which particles (collision partners) are employed in the collision process?(3) What happens during collision to the collision partners?(4) What is the outcome of the collision?
The most plausible solution of collision modelling within a two-phase flow simulationis based on direct and simultaneous tracking of all particles in the flow field in terms oftheir individual movements and momentary positions. Here the occurrence of a collisionand the collision partners themselves may be directly identified from simple geometric
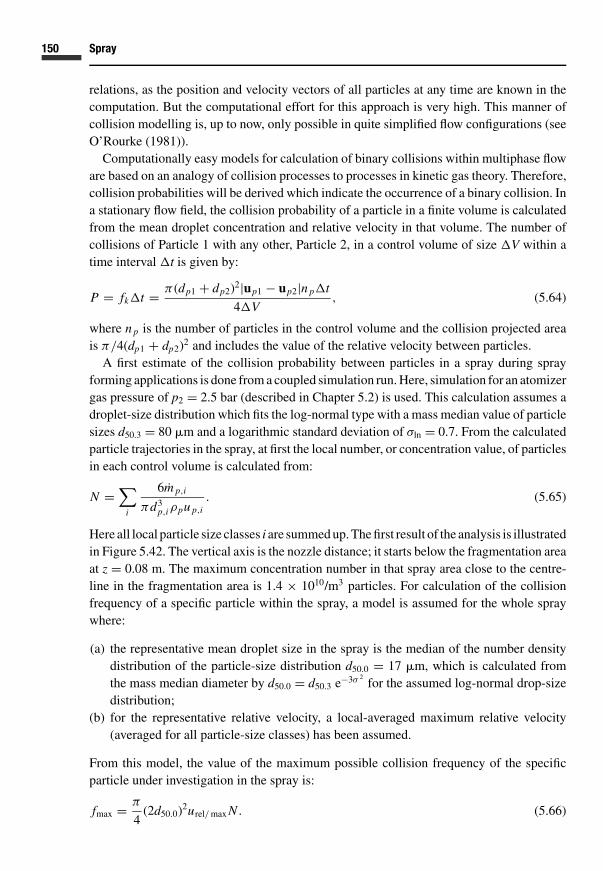
150 Spray
relations, as the position and velocity vectors of all particles at any time are known in thecomputation. But the computational effort for this approach is very high. This manner ofcollision modelling is, up to now, only possible in quite simplified flow configurations (seeO’Rourke (1981)).
Computationally easy models for calculation of binary collisions within multiphase floware based on an analogy of collision processes to processes in kinetic gas theory. Therefore,collision probabilities will be derived which indicate the occurrence of a binary collision. Ina stationary flow field, the collision probability of a particle in a finite volume is calculatedfrom the mean droplet concentration and relative velocity in that volume. The number ofcollisions of Particle 1 with any other, Particle 2, in a control volume of size �V within atime interval �t is given by:
P = fk�t = π (dp1 + dp2)2|up1 − up2|n p�t
4�V, (5.64)
where n p is the number of particles in the control volume and the collision projected areais π/4(dp1 + dp2)2 and includes the value of the relative velocity between particles.
A first estimate of the collision probability between particles in a spray during sprayforming applications is done from a coupled simulation run. Here, simulation for an atomizergas pressure of p2 = 2.5 bar (described in Chapter 5.2) is used. This calculation assumes adroplet-size distribution which fits the log-normal type with a mass median value of particlesizes d50.3 = 80 �m and a logarithmic standard deviation of σln = 0.7. From the calculatedparticle trajectories in the spray, at first the local number, or concentration value, of particlesin each control volume is calculated from:
N =∑
i
6m p,i
πd3p,iρpu p,i
. (5.65)
Here all local particle size classes i are summed up. The first result of the analysis is illustratedin Figure 5.42. The vertical axis is the nozzle distance; it starts below the fragmentation areaat z = 0.08 m. The maximum concentration number in that spray area close to the centre-line in the fragmentation area is 1.4 × 10¹⁰/m3 particles. For calculation of the collisionfrequency of a specific particle within the spray, a model is assumed for the whole spraywhere:
(a) the representative mean droplet size in the spray is the median of the number densitydistribution of the particle-size distribution d50.0 = 17 �m, which is calculated fromthe mass median diameter by d50.0 = d50.3 e−3σ 2
for the assumed log-normal drop-sizedistribution;
(b) for the representative relative velocity, a local-averaged maximum relative velocity(averaged for all particle-size classes) has been assumed.
From this model, the value of the maximum possible collision frequency of the specificparticle under investigation in the spray is:
fmax = π
4(2d50.0)2urel/ max N . (5.66)
151 5.4 Droplet and particle collisions
0 0.01 0.02 0.03 0.04 0.05 0.06 0.07 0.08 0.09
0.1
0.15
0.2
0.25
0.3
0.35
0.4
0.45
0.5
5E+008
2.5E+009
7.5E+0091.25E+010
levels :min: 5.00E+8max: 1.25E+10
radius r [m]n
ozz
le d
ista
nce
z[m
]
Fig. 5.42 Number concentration of metal melt particles in the spray: p2 = 3.5 bar, material, steelC35; metal mass flow rate = 0.192 kg/s; melt super heating = 120 K; d50.0 = 17 �m
The calculated maximum collision frequencies are illustrated in Figure 5.43 as isolines.Maximum collision frequencies in the fragmentation area are of the order of 3000/m3.
Based on collision probability, Eq. (5.62), at each time step of the numerical particletracking algorithm, comparison with a stochastic random process decides whether or nota collision will take place (see Sommerfeld (1995)). As a collision partner for the binarycollision model of the specific particle under investigation, a fictitious partner particle issampled from the local particle-size spectrum, with properties randomly determined froman assessment of all particles in that particular cell volume.
In the last step of the collision model, the result or outcome of the binary collisionevent needs to be predicted. If both collision partners are solid particles, the outcome ofthe collision may be easily described by means of elastic or plastic collision, based onmomentum equations. For fluid droplets, the physics is more complicated as coalescenceor disruption of the droplets may occur. Georjon and Reitz (1999), for example, analysedthe formation of a common cylindrical liquid element as a result of binary collision andcoalescence of two droplets at a sufficiently high Weber number. The liquid cylinder maydisintegrate, due to capillary-induced instabilities, into droplets. The main parameters of abinary droplet collision model are (see Figure 5.44 for relevant values): the relative velocity,the size and properties of both droplets (which are combined within the local Reynolds andWeber numbers) and the impact parameter χ . The impact parameter describes the shortest

152 Spray
0 0.01 0.02 0.03 0.04 0.05 0.06 0.07 0.08 0.09
0.1
0.15
0.2
0.25
0.3
0.35
0.4
0.45
0.5
100
300
500
700900
1500
2500
radius r [m]
levels min: 100max: 3000
nozz
le d
ista
nce
z[m
]
Fig. 5.43 Maximum collision frequency of the mean particle size (parameters as in Figure 5.42)
χ
urel
R1
R2
Fig. 5.44 Binary in-flight collision of droplets: relative velocity urel, impact parameter χ

153 5.4 Droplet and particle collisions
(II)
(III)
(IV)
(V)
(I) (I)
(V)
(IV)
We
χ /dp χ /dp
We
(b)(a)
Fig. 5.45 Event chart of droplet collisions for (a) fuel, and (b) water at ambient pressure (Qian andLaw, 1997)
distance between the tangential trajectories of two equally sized droplets at the moment ofcollision.
A stochastic model for incorporation of particle/particle collisions during simulation ofa dense spray based on Lagrangian tracking of particles has been introduced by O’Rourke(1981).
The basic phenomena of coalescence and separation of droplets during binary collisionhave been experimentally tackled by Ashgriz and Poo (1990) and Qian and Law (1997) forwater and fuel droplets, and Menchaca-Rocha et al. (1997) for mercury droplets.
Qian and Law’s (1997) investigations have led to a collision event chart for water and fueldroplets that is illustrated qualitatively in Figure 5.45. The different boundaries between thecollision modes are described based on the impact Weber number and the impact parameterχ . Qian and Law recognize five distinct regions or collision modes:
� In Area I, the colliding droplets coalesce immediately after only small deformation.� At somewhat increased Weber numbers, in Area II the droplets separate after collision
and are repelled from each other, as the time for drainage of the gas film in betweencolliding droplets is insufficient.
� In Area III, the increased relative collision velocity between the droplets drains the gasfilm out of the gap between the droplets, and the droplets coalesce once again. In thisarea, the coalescing droplets are strongly deformed during collision.
� At lower impact parameters in Area IV, where most central collisions occur, the dropletsfirst coalesce and then separate in a subsequent collision stage.
� For a sliding or non-central collision, in Area V, the collision behaviour is similar to thatin Area IV, but because of the sliding impact the probability of satellite droplet productionby partial fragmentation is higher.
These regimes have been found for fuel droplets: for water droplets in the investigated rangeof impact parameters, only modes I, IV and V have been found.

154 Spray
Fig. 5.46 Comparison of lattice Boltzmann simulation result with experiment for binary liquiddroplet collision: χ = 0.5, Re = 100, We = 106 (Frohn and Roth, 2000)
Direct numerical simulation of the behaviour of two droplets during collision is per-formed, for example, in the work of Nobari and coworkers (1996a,b) and Frohn andcoworkers (see, for example, Frohn and Roth (2000)). Some principal physical details canbe explained by this numerical approach. Figure 5.46 shows a comparison between a latticeBoltzmann simulation and experiment for binary collision of droplets (Frohn and Roth,

155 5.4 Droplet and particle collisions
2000). The parameters used for the simulation are: We = 106, impact parameter χ = 0.5and Re = 100. The colliding droplets have the same size. The results of the numericalsimulation, especially the formation of satellite droplets, are in excellent agreement withexperiment.
In his description of binary collision between droplets, O’Rourke (1981) distinguishedbetween gracing or sliding collisions and a collision proper, which finally leads to permanentcoalescence between participating droplets. The criterion for the difference is the criticalcollision angle �crit, which is given for water droplet collisions as:
sin2�crit = min
[2.4
f (dp,1/dp,2)
We; 1
]. (5.67)
Here the correlation f (dp,1/dp,2) has been derived and adapted from the experimentalinvestigations of Amsden et al. (1989). A polynomial correlation is used and is dependenton the diameter of the droplets participating in the collision. If the actual collision angle issmaller than the critical collision angle �crit, the droplets show a central collision and willcoalesce, otherwise the collision is a sliding one.
The velocity of a droplet after a sliding collision can be deduced from:
u′1 = u1m1 + u2m2 + m2(u1 − u2)[(sin � − sin �crit)/(1 − sin �crit)]
m1 + m2, (5.68)
where the direction of movement of the droplet remains unchanged from the direction ofthe droplets before collision. The velocity of the combined droplet after coalescing dropletcollision is:
u′1 = u1,i m1 + u2,i m2
m1 + m2; i = 1, 2, 3. (5.69)
Here the diameter of the resulting droplet is calculated from addition of the volumes of theindividual collision partners:
dp,new = (d3
p,1 + d3p,2
)1/3. (5.70)
Application of a collision model during simulation of a propane spray is documented byAamir and Watkins (1999). Application of this collision model for analysis of a spray froma pressure swirl nozzle has been performed by Ruger et al. (2000), who compares thesimulation results to detailed measurements. In the area of the dilute spray flow, only aninsignificant influence of collision events on the distribution of the mean number diameterd50.0 in the spray has been detected. But a remarkable effect on the integral Sauter diameterd3.2 in the direction of the developed spray has been found. By taking into account coal-escence events by the collision model, the integral Sauter diameter is increased and theintegral number density flux within the spray is decreased. These numerical results are ingood agreement with experimental findings.
Application of a binary collision model within spray simulation in spray forming applica-tions or powder metal production by melt atomization is an actual research task. In the latter,for example, the formation of satellite droplets (smaller particles sticking at the surface ofbigger particles as a result of drop collisions) is a common problem in powder production

156 Spray
as it increases the amount of non-spherical particles in the product. This particle propertymay cause some problems in subsequent operation processes with the atomized powder(reduced flowability, etc.). But in the area of droplet collision with varying droplet mor-phologies (i.e. solid, semi-solid, liquid), information is not sufficiently available to derivea general collision model within melt atomization and melt spray simulation.
5.4.2 Collision of melt droplets with solid particles (ceramic)
An important advantage of the spray forming process is the possibility of producing metal-matrix-composites (MMCs). For example, by adding ceramic particles (such as SiC, Al2O3,TiB2 or TiC) or non-metallic powders (e.g. graphite) directly in the spray, a homogeneouscombination of a metal matrix plus composite inserts in the deposit can be produced.These spray formed MMC materials exhibit no segregation, as seen in conventionallyproduced MMC material, and have improved material properties when compared with thebase material of the matrix. Thereby volume concentrations of up to 20% solids may beintroduced into spray formed preforms via particles in the spray. These particles may beconveyed into the spray within the atomization gas or via a separate gas-assisted deliverysystem. For analysis and derivation of the expected local distribution of solid contents in thematrix, it is necessary to investigate the way in which the solid particles are incorporated.Here the interaction mechanisms during particle/droplet collision need to be described.
Experimental investigations indicate that different interaction mechanisms effectivelyinfluence the incorporation of ceramic particles into the matrix material. Three possiblemechanisms are illustrated in Figure 5.47 based on the work of Gupta et al. (1991). For lowrelative velocities between the liquid droplet and the solid particle, the kinetic energy forpenetration, needed to overcome the surface tension of the droplet, is not sufficient. Impactmay lead to adhesion of the solid particle onto the drop surface. The adhered particlesmay be completely incorporated into the matrix upon impact of the liquid droplet ontothe deposit if the impact occurs at a sufficient velocity (see Figure 5.47(a)). In the secondmechanism, solid particles are deposited directly on the surface of the preform. These maybe incorporated in the matrix if liquid droplets subsequently impinge at that specific location(see Figure 5.47(b)). In Figure 5.47(c) the solid particle penetrates into the liquid dropletafter collision in flight; this is the third particle inclusion mechanism. Here a minimumkinetic impact energy for particle penetration is needed.
Physical models for description of the particle penetration mechanism during injectionof solid particles into the spray are based on energy and/or force balances (see, for example,Majagi et al. (1992), Wu et al. (1994) and Zhang (1994)). These models have been sum-marized by Lavernia and Wu (1996). Basic assumptions and preconditions for a collisionmodel are that:
� the solid particles are smaller in size than the liquid droplets, by at least one order ofmagnitude;
� within the solidification process of the molten droplet, the morphology (e.g. the viscosity)of the drop material changes and therefore the penetration potential of the particle changes.

157 5.4 Droplet and particle collisions
adhesion penetration
vdvd
vdvp
penetration mechanical entrapment incorporation(c)(b)(a)
Fig. 5.47 Mechanisms for incorporation of ceramic particles (Gupta et al., 1991)
Z0
β
θ
h
φ
r
fluid
Rp
Fig. 5.48 Penetration model (Majagi et al., 1992)
Majagi et al. (1992) derived a force balance for the impact and penetration of a solid particleon a two-dimensional liquid surface in the case of a fully liquid melt droplet. The dropletis moving in the direction of gravity. This model is illustrated in Figure 5.48. Rp is theradius of the solid particle, r is the radius of the meniscus, h is the penetration depth ofthe centre of gravity of the solid particle below the liquid surface of the drop and Z0 is thepenetration depth of the contact line. The angles β, φ and ϕ are the angles of the meniscus,the wetting angle and the angle towards the contact point, respectively. The model is basedon the assumption that the resistance against penetration of the particle is due to surfacetension and hydrostatic pressure. The force from the surface tension using the above termsis formulated as:
Fσ = −πdpσl sin φ sin(φ + θ ). (5.71)
The hydrodynamic pressure due to buoyancy in the submerged part of the particleminus the part of the hydrostatic pressure in the gas environment above the penetrating

158 Spray
particle is:
Fh = − π
24d3
pρl g(1 − cos φ)2(2 + cos φ) + π
4d2
pgsin2φ ρp Z0, (5.72)
and the force due to gravity is:
Fg = π
6d3
pρpg. (5.73)
In this model, the change in velocity of the particle during impact is associated with a forceFv:
Fv = π
12Pdd3
pρp(v2
0 − v21
), (5.74)
where the velocities of the particle before (v0) and after (v1) impact are used. It is assumedthat when the force balance results in a remaining force in the direction of gravity, completepenetration of the particle into the fluid surface occurs.
This model has been used by Majagi et al. (1992) to describe the penetration behaviourof ceramic particles in fluid metal surfaces during melt atomization. These authors derivedas the main influencing parameters: the density of the particle, the contact angle (wettingangle) and the solid particle size that determine the penetration process. An example ofthe results of this investigation is illustrated in Figure 5.49. Here the minimum relativevelocity needed for penetration is plotted versus the wetting angle (a), the particle density(b) and the particle size (c). The primary driving force for penetration is the kinetic energyof the impinging particle. By increasing contact angles, the necessary minimum velocityfor penetration is increased. For prescribed particle velocities, a higher particle density oran increased particle diameter increases the kinetic impact energy. Therefore, the minimumnecessary penetration velocity is lowered in this case.
The model of Majagi et al. (1992) is limited to the analysis of penetration processeswithin fully liquid surfaces. In the area of melt atomization and spray forming, the changein particle material properties (morphology) related to solidification of the droplet in thespray from liquid via semi-solid to solid is of specific interest. As has been demonstratedfrom the results in Chapter 5.2, the main part of the particle mass in the spray, in sprayforming, is in the state of phase change. A model describing the morphology of dropletsdependent on the solidification status has been derived by Wu et al. (1994) and Zhanget al. (1994). These authors introduce, in addition to the penetration resistance due tosurface tension, the fluid dynamic resistance of the particle during penetration into theliquid drop and the movement of the liquid matrix. The latter is described by the resistanceforce as:
Fw = 1
2ρlu
2p Apcd (5.75)
for different solid particle geometries such as a sphere, square and rhomboid, and withthe correlation of the resistance coefficient dependent on the Reynolds number, fromEq. (5.4). For evaluation of the model these authors chose the approximate relations duringimpact of Al2O3, graphite, SiC and TiB2 particles in a fully liquid or semi-solid aluminium

159 5.4 Droplet and particle collisions
Pp = 3.89 g/cm3
Rp = 20 µmRp = 20 µm
θ = 150°
θ = 60°
00
500
1000
min
imum
rel
ativ
e ve
loci
ty(c
m/s
)
1500
2000
40
radius (µm)
80 120
(c)
Pp = 19.3 g/cm3
Pp = 3.89 g/cm3
θ = 150°
θ = 60°
00
400
200
200
400
600
800
1000
600
min
imum
rel
ativ
e ve
loci
ty(c
m/s
)
min
imum
rel
ativ
e ve
loci
ty(c
m/s
)
800
1000
60 9030
θ°120 150 180 0 84
density (g/cm3)
12 16 20
(b)(a)
Fig. 5.49 Results of the penetration model from Majagi et al. (1992): effect of wetting angle (a),particle density (b) and particle size (c)
400
300
200
criti
cal p
enet
ratio
n ve
loci
ty (
m/s
)
100
0
200
150
100
criti
cal p
enet
ratio
n ve
loci
ty (
m/s
)
50
00 5 10
particle size (µm)15 20 25 0 5 10
particulate size (µm)15 20 25
relative velocity = 100 m/s
dp = 80 µmdp = 80 µm fs = 0.1
fs = 0.05fs = 0.025fs = 0.01fs = 0
graphiteSiCAl2O3TiB2
Fig. 5.50 Critical penetration velocity from Wu et al. (1994), aluminium droplet dp = 80 �m,solidification ratio and SiC particles (left), different solid particles (right)

160 Spray
droplet as the boundary condition. The results of this model indicate a small variation ofthe penetration potential with respect to particle form (at constant total volume) for thespherical, quadratic and rhomboid-shaped ceramic particles.
The critical penetration velocity for different boundary conditions from Wu et al. (1994)is summarized in Figure 5.50 for an aluminium droplet having a diameter dp = 80 �m.On the left-hand side of the figure, the results for different droplet solidification ratiosfs between 0 and 10% are illustrated for the impact of a SiC particle. As expected, thecritical penetration velocity is drastically increased with increasing solidification ratio evenat these small degrees of solidification of the droplet. On the right-hand side of the figure,comparison of the critical penetration velocities for different penetrating solid particlematerials is shown. The solidification rate is assumed to be fs = 0.025 in this figure. In theorder of decreasing solid particle densities and increasing contact angles, the penetrationability increases from graphite via SiC, Al2O3 to TiB2.
In summary, for the penetration ability of solid particles (e.g. ceramics) during impactonto melt droplets in the area of melt atomization or spray forming one can state:
� for an unsolidified liquid droplet, the contact angle and the particle density are mostimportant for penetration;
� for a semi-solid droplet, during solidification the flow resistance inside the droplet isimportant and, therefore, the solidification ratio of the droplet and the solid particledensity are the main determining properties of the penetration process.

6 Compaction
Description of the compacting process and the resultant behaviour of the spray depositedlayer, or spray form, are key parameters for all impact-orientated spray processes, as this isthe stage during which all remaining product properties are determined.
For modelling and simulation of the transient growth, the solidification process andthe temperature distribution inside the deposit/substrate, the main boundary conditionsinfluencing this thermal process are prescribed by the process parameters. These boundaryconditions are:
� development of a local impacting droplet mass and the geometric construction of thedeposit;
� analysis of the droplet impact processes, contributing to the deposited mass or the over-spray, or the establishment of porosities in the deposited layer;
� the thermal state of the spray during impact (in terms of solidification ratio and particleenthalpy flux);
� the heat flux from and to the surrounding atmosphere from the deposit and substratesurface, as well as the heat flux from the deposit to the substrate.
Most of the major boundary conditions and submodels of this thermal stage are derivedfrom the numerical simulations presented earlier.
6.1 Droplet impact and compaction
The behaviour of impinging droplets is a key parameter in spray and droplet-based manu-facturing techniques. Here, models for drop impact behaviour, not only in spray forming but
161

162 Compaction
stat
e of
the
depo
sit s
urfa
ce
L
M
S
S M L
L
straining
of
surface material
M
partly rebouncing of
solidified
particles
compaction
+
high compaction efficiency
S
state of the particles
total rejection of
solidified
particles
partly compactedparticles layered structure
(coating)
straining
of
surface material
straining
of
surface material
Fig. 6.1 Probability of impact results with spray forming (Mathur et al. 1989b): L, liquid;M, mushy – partly solidified; S, solid
also for application within single-drop processes, e.g. for rapid prototyping, are of impor-tance. A review of thermo-fluid mechanisms controlling droplet-based materials processeshas been given by Armster et al. (2002).
Only part of the total mass impacting on the substrate or deposit from the spray compactsand contributes to the growth of the deposit during spray forming. Dependent on substantialsubstrate (or deposit, after initial coating of the substrate) process conditions (kinetic andthermal) and the impinging droplets in the spray, these impinging particles may:
� be completely deposited;� be totally reflected from the surface;� extract fragments of the already deposited material, which may be partially leached;� be fragmented during impact and partly reflected.
The influence of the thermal state of the particle substrate on compaction behaviour hasbeen studied by Mathur et al. (1991). A qualitative model has been derived which dividesthe compaction into different regimes, and is shown in Figure 6.1. The state of the dropletsduring impact and the state of the surface of the deposit are divided into different categories:
� liquid or fully liquid (L);� semi-solid or mushy (M);� and solid, fully solidified (S).
Dependent on the pairing of thermal properties from the droplets and the surface, differentcompaction conditions may be observed. The best condition for maximum compactionefficiency is a semi-solid deposit surface impinged by fluid or partly solidified particles.

163 6.1 Droplet impact and compaction
For a detailed analysis, in addition to the thermal state identified in Figure 6.1, the kineticstate of the particles in terms of velocity, impact angle and particle size also needs to beaccounted for.
The amount of non-compacting or reflected material contributes to the overspray of theprocess, which can be quantitatively described by the local ratio between the compactingmass fluxes mk (contributing to the product) and the impinging metal mass flux from thespray. This yields the compaction rate kp:
kp = mk
ms. (6.1)
The locally and temporally changing value of the compaction rate during spray forming isinfluenced by a number of parameters. Those parameters that best influence the formationof Gaussian-shaped deposits by spray forming have been investigated experimentally byKramer et al. (1997) and, more generally, by Buchholz (2002). From these investigationscorrelation equations have been derived for the local compaction rate, and the followinginfluential parameters identified:
� the surface temperature of the deposit/substrate (as a scale for the thermal state of thesurface),
� the impinging momentum of the droplets, and� the droplet solidification ratio (or liquid contents).
Buchholz (2002) found that the compaction rate is not very sensitive to variations in theimpact angle of the particles.
The main behaviour during compaction is the impact of the droplet and the occurrence ofdrop deformation and fragmentation. During impact of fluid droplets normal to solid/liquidsurfaces (without phase change or solidification), three possible regimes (see principlesketch in Figure 6.2) may be identified (see, for example, Armster et al. (2002), Rein(1993)):
(1) partial or complete rebounding or repelling of the droplet,(2) splashing of the droplet,(3) partial fragmentation of the impinging droplet, or the liquid impact surface, with sec-
ondary droplet formation.
Simulation of drop-impact processes increases our understanding of drop-impact physicsand enables the derivation of impact models. The principal numerical methods used toinvestigate drop impingement process are based on the early work of Harlow and Shannon(1967). The numerical analyses increase in complexity from (1) to (3) in the abovelist.
As a first approach, the dependence of spreading behaviour and splashing limit on the maininfluencing parameters needs to be analysed. In this context, the numerical approach dis-cussed in Section 4.1.2, for analysis of the behaviour and movement of free liquid surfaces,

164 Compaction
dmax
d0
splat (partly) rebounce splashing
Fig. 6.2 Liquid droplet impact on a solid surface: different results
may be used, taking into account the surface tension algorithm of Brackbill et al. (1992).In addition, the contact angle or three-phase angle at the liquid (l)/solid (s)/gas (g) contactpoint or line is incorporated. The static contact angle, defined in Figure 6.3, demonstratesthe case of equilibrium between phases, and from Young’s formula is:
cos(α) = cos(180◦ − θ ) = σs,g − σs,l
σl,g. (6.2)
For water-based or organic solutions, which have been much studied in the literature, duringimpact, the contact angle 0◦ < θ < 90◦ determines the hydrophobic behaviour of the fluidat the surface; while for 90◦ < θ < 180◦, the behaviour is hydrophilic. For complete wettingof the solid surface by the liquid, the static contact angle is 180◦.

165 6.1 Droplet impact and compaction
α
Fig. 6.3 Definition of static contact angle
6.1.1 Drop deformation
Figure 6.4 shows a simulated low-speed drop impact sequence and the deformation processfor a liquid (non-solidifying) droplet on a solid surface, based on the boundary conditions,listed in Table 6.1. Two different droplet fluids are studied: water and tin melt (where at firstno heat transfer and no solidification of the droplet material is assumed, the impact processis isotherm).
For the relevant characteristic numbers of the droplet impact process, from the liquidproperties and the impact velocities, the values of Reynolds number Re = 5000 and Webernumber We = 137 for the water droplet, and Re = 13 318 and We = 72 for the tin drop,may be calculated.
From the calculation of the impact process in Figure 6.4 four distinct temporal stages ofdrop deformation can be observed:
(1) t < 3 ms: the droplet splashes and flattens on the solid surface. In this stage, mainly thekinetic energy of the impacting droplet is transformed into surface energy.
(2) 3 < t < 5 ms: a ring-shaped rim at the circumference of the droplet is observed. In thisstage, the rate of growth of the splat diameter decreases. The inner area of the dropletis drawn out to a thin film.
(3) 5 < t < 25 ms: recoiling of the fluid due to the action of surface tension is seen. Thisbehaviour may, in extreme cases, lead to complete detachment of the droplet (rebound)from the surface (see, for example, Ford and Furmidge (1967)).
(4) t > 25 ms: the deformed droplet may oscillate around its steady state until the finalshape of the stationary droplet on the surface is achieved (not shown in the presentsequence).
Figure 6.5 compares the results from the above numerical simulation with the experimentalresults of Berg and Ulrich (1997) for an unsolidified tin droplet impacting at 90◦ to the solidsurface. These experimental results have been achieved for identical process conditions andmelt properties as in the simulation. The figure shows the time-dependent behaviour ofthe maximum splat diameter of the droplet during impact. The measured results indicate amore rapid flattening of the droplet in the first impingement phase. The maximum achieveddroplet diameter in the steady state is of comparable order. In the experiment, the tin dropletsolidifies after splashing. Therefore, the splashing kinetics is far faster than the solidificationkinetics in this case.

166 Compaction
Fig. 6.4 Impact of a water drop: d = 2.5 mm, u = 2 m/s, time scale in ms
A widely used model for estimation of the maximum splat diameter of impinging metaldroplets has been derived by Madejski (1976). Accounting for viscosity and surface tensioneffects, as well as for the solidification behaviour of droplets, theoretical derivation of themodel is based on two-dimensional radial flow. Piecewise fitting of the result obtains, forthe general case (without solidification), in the range of relevant characteristic numbers

167 6.1 Droplet impact and compaction
Table 6.1 Data for droplet impact calculations
densityρ [kg/m3]
dynamicviscosityµ [kg/m s]
surfacetension σ
[N/m]
contactangle[deg.]
velocity u[m/s]
particlediameter d [�m]
H2O 1000 0.001 0.0725 115 2.0 2500Sn 7000 0.001 85 0.544 125 1.6 2200
0 1 2 3 4 5 6 70
1
2
3
4
5
num.exp. (Berg andUlrich, 1997)
time t [ms]
spla
t dia
met
er d
/d0
[-]
Fig. 6.5 Impact of a tin drop: splat diameter, d = 2.2 mm, u = 1.6 m/s
Re > 100 and We > 100:
3dmax/d0
We+ 1
Re
(dmax/d0
1.2941
)5
= 1. (6.3)
From this equation, the case of the splashing tin droplet in Figure 6.3 has been recalculated.The result indicates a value of the maximum splat diameter of dmax/d0 = 4.8, a somewhathigher value than found in either the experiment or the simulation.
In another empirical model, based on the work of Scheller and Bousfield (1995), themaximum splat diameter of impinging droplets for different liquids has been correlated interms of the Reynolds number and the Ohnesorge number as:
dmax
d0= 0.61(Re2 Oh)
0.166. (6.4)
Here the main parameters determining the drop impact are the fluid properties of the imping-ing droplet, the drop size and the drop-impact velocity. Evaluating this correlation togetherwith the measurement results of Berg and Ulrich (1997) for the impact and deformation oftin, water and glycerol droplets, plus the simulation results for the drop impact (numerical),

168 Compaction
10000 100000 10000001
10
tin
water (Berg and Ulrich, 1997)
glycerol
correlation (Scheller andBousfield, 1995)num.
Re2 * Oh [-]
spla
t dia
met
er d
/d0
[-]
Fig. 6.6 Maximum splat diameter (correlation from Scheller and Bousfield, 1995)
1 2 3 4 5 60
1
2
3
4
65 80 100 115 135 15065 80 100 135 150115
spla
t dia
met
er d
/d0
[-]
time t [ms]
0
contact angle [deg.]
Fig. 6.7 Influence of contact angle on droplet spreading during impact
Figure 6.6 indicates the relevance of Eq. (6.4) for model derivations in agreement withexperimental and simulation results.
The influence of static contact angle on the droplet splashing process has been examinedand is illustrated in Figure 6.7 for normal (i.e. 90◦) drop impact and the behaviour of thetime-dependent drop splash diameter. By increasing the static contact angle, the dropletsplashing behaviour is mainly affected in the second stage of the splashing process. Herethe maximum drop splash diameter increases with increasing values of the contact angle.The same behaviour has been identified by Scheller and Bousfield (1995), but at a lowerrelevance level, who found that the maximum splash diameter changed by as much as 10%when the contact angle was in the range of 85 to 145◦. Scheller and Bousfield also found

169 6.1 Droplet impact and compaction
Fig. 6.8 Hysteresis of the contact angle
that for higher Reynolds numbers, the surface roughness of the solid is of minor importanceto the maximum splat diameter.
The role of contact angle in the droplet-impact process still needs further evaluation.Instead of taking just the static contact angle, for rapid wetting problems the more relevantdynamic contact angle needs to be incorporated (when data are available, especially formetal melts). Also hysteresis of the contact angle during droplet spreading and recoiling(see Figure 6.8 for an example of a drop on an inclined surface) is to be used. Once again, itis the lag of physical data and properties for metal melts in the high-temperature range thathas prevented the inclusion of these important effects into numerical models up to now.
At higher impact velocity, the droplet may disintegrate during impact and satellite dropletsmay form. The boundary condition between complete droplet deposition and fragmentationin this splashing regime has been derived by Walzel (1980) and has been tested for moltenmetal droplet impact by Berg and Ulrich (1997): see below.
Direct numerical calculations of this splashing behaviour have been performed, forexample, at the University of Stuttgart. Results and animation of the simulated dropimpact and splashing process on rigid surfaces and liquid films may be found at:www.uni-stuttgart.de/UNIuser/itlr/gallery.html (see Useful web pages, p. 269). Here simu-lated animations of binary drop collision processes are also to be found. Direct numericalsimulations require high computer power due to the fine grids used in transient three-dimensional calculation (see below).
6.1.2 Droplet solidification during impact
Numerical investigations of metal drop-impact processes, together with a simultaneouscalculation of phase change behaviour and the solidification process, have been performedby Delplanque et al. (1996), Fukai et al. (1998), Liu et al. (1993, 1994a), Trapaga et al.(1992) and Waldvogel and Poulikakos (1997).
Starting from methods discussed above for evaluation of the fluid dynamics of dropsand phase boundaries in these contributions, a phase change model has been derived and

170 Compaction
implemented into numerical simulation codes. Initially, one-dimensional solidification mod-elling has been investigated. The models are based on two basic assumptions:
(1) It is assumed that the moving solidification front in the material strictly separates regionsof fully solidified and fully liquid material, and that the distribution of this solidificationfront is described by that particular isotherm that characterizes the temperature of solid-ification (no solidification temperature range, no undercooling prior to solidification).
(2) The main direction of movement of the heat flux is perpendicular to the substrate surface,from the droplet towards the substrate. This allows the assumption of a one-dimensionalheat transport mechanism.
Based on these assumptions, analysis of the phase change process is reduced to a one-dimensional problem of a moving solidification front. The solidification front may onlymove perpendicular to the substrate and only away from it. The thickness of the alreadysolidified layer s in the droplet is described by one-dimensional solution of the Stefansolidification problem (Hill, 1987; Madejski, 1976; San Marchi et al., 1993):
s = 2λe
√as(t − t0). (6.5)
In this equation, t0 is the initial time of origin of the solidification process. The solidificationcoefficient λe is derived from a heat balance at the solidification front as:
λe = 1√π
[T ∗
s
erf(λe) exp(λ2
e
) − T ∗l
√al/as
erf(λe√
as/al) exp(λ2
eas/al)]
. (6.6)
Here the dimensionless temperatures (Stefan numbers) of the liquid material (index s –solid) and the liquid material (index l – liquid) are:
T ∗s = λs(Tm − Ts)
asρs�hsl, T ∗
l = λl(Tl − Tm)
alρl�hsl. (6.7)
Within the numerical realization of this model in a simulation code, the already solidifiedlayers within the droplet are rejected from the solution area where the fluid movement iscalculated. These cells are assumed to be immobile (i.e. wall cells).
Based on this, Delplanque et al. (1996) and Liu et al. (1994a) developed a model for theformation of micropores within thermal spray or spray forming processes. As an example,the normal (i.e. 90◦) drop-impact process of a 30 �m tungsten droplet at an impact velocityof 400 m/s on a rigid surface has been calculated. These impact conditions are related totypical thermal spray process properties. The initial temperature of the droplet is 100 Kabove the melting point of 3650 K, the substrate has an initial temperature of 1500 K. Thesimulated drop deformation process during impact and the establishment of the solidificationarea in the droplet are illustrated in Figure 6.9.
At the start of the deformation process, i.e. at the initial point of impact between the dropand the surface, a thin solid layer is formed. Due to the high radial velocities of the liquidlayer just above the solidified area, shortly after contact (t = 0.045 �s), a radial liquid jet isformed at the outer edge of the tip which overshoots the underlying solid region. Due to thecircumferential symmetry assumed in the calculation, this jet has the geometry of a radially

171 6.1 Droplet impact and compaction
0radial distance [µm]
t = 0.000 µs
heig
ht [
µm]
10 20 30 40 50−10−20−30
0
10
20
30
40
−40−50 0radial distance [µm]
t = 0.015 µs
heig
ht [
µm]
10 20 30 40 50−10−20−30
0
10
20
30
40
−40−50
0radial distance [µm]
t = 0.030 µs
heig
ht [
µm]
10 20 30 40 50−10−20−30
0
10
20
30
40
−40−50
0radial distance [µm]
t = 0.060 µs
heig
ht [
µm]
10 20 30 40 50−10−20−30
0
10
20
30
40
−40−50
0radial distance [µm]
t = 0.045 µs
heig
ht [
µm]
10 20 30 40 50−10−20−30
0
10
20
30
40
−40−50
0radial distance [µm]
t = 0.075 µs
heig
ht [
µm]
10 20 30 40 50−10−20−30
0
10
20
30
40
−40−50
Fig. 6.9 Tungsten droplet: formation of micropores during drop impact (Delplanque et al., 1996)
spreading liquid sheet. This jet detaches from the surface and, due to inertia and gravity,reattaches to the substrate surface some distance from the detachment point of the droplet.A pore remains below the liquid bridge formed by this jet. If the bridging layer solidifiesbefore the pore is filled, a pore is formed in the bottom surface of the spread droplet. If thepore is filled by some liquid from above, a crater at the top surface of the droplet may beformed and remains after solidification. This crater may act as an initial pore source if asubsequent droplet during impact rapidly flows across the crater in a radial direction. Theone-dimensional character of the solidification front model limits the usefulness of suchmicroprocesses to the impact of solidifying melt drops. Multidimensional phase changemodels therefore need to be developed, as has been done, for example, by Delplanqueet al. (1996). This model has also been derived and applied for molten metal drop impactprocesses.
6.1.3 Secondary atomization during impact
Not only during impact on liquid pools or films, but also at specific regions during impacton solid surfaces, a fluid lamella is formed at the rim of the droplet which may be unstable

172 Compaction
Fig. 6.10 Three-dimensional simulation of droplet impact onto a shallow liquid layer: We = 250,Re ∼ 10 000, h/d = 0.12, T = tvp/dp (Frohn and Roth, 2000)

173 6.1 Droplet impact and compaction
and therefore may disintegrate due to capillary effects into smaller (secondary) droplets.Because of the three-dimensional character of this process and the ratio between the maindrop and tiny satellite drops (where very fine grids are needed in the whole solution domain),full simulations of the secondary spray formation mechanism have not been frequentlypublished. The normal drop impingement process on a rigid wall with secondary dropformation has been investigated by Rieber and Frohn (1998). The calculation is based ona VOF method for free surface analysis (see Section 4.1.2). A grid system consisting of7.1 × 106 cells has been used in this computation. To achieve physically realistic results,the liquid lamella formed at the rim of the spreading droplet must be artificially excitedin the simulation. Without excitation the lamella disintegrates too, but due to numericalinstabilities caused by too coarse a grid resolution and not as a result of physical instabilityprocesses.
As an example of the simulation of a three-dimensional droplet splashing into a shallowliquid pool, involving secondary fragmentation, Figure 6.10 illustrates the time sequencefor disintegration of the splashing lamella after impact: We = 250, Re ∼ 10 000 and thedimensionless thickness of the liquid pool h/d = 0.12. A 3203 grid at 2.553 integrationtime steps has been used for the simulation. Only one-quarter of the visualized splash wasreally simulated in the numerical calculations. The drop impact results in splashing, inagreement with experimental observations. The formation of a characteristic crown withfinger-ejecting small droplets is to be seen.
Experimental and numerical investigations of drop impact and splashing phenomena onsolid (dry or wetted) walls have also been investigated by Mundo (1996). Dependent on thedrop impact Reynolds number and the Ohnesorge number of the liquid, based on single-drop impingement experiments, the splashing limit has been identified. In Mundo (1996),the splashing limit has been given by means of a characteristic number K = Oh Re1.25. Inaddition, the droplet-size distribution in the secondary spray from droplet splashing has beeninvestigated by means of a PDA device. From this analysis, a particle impact model is derivedthat can be included in spray impact simulation codes based on a Eulerian/Lagrangianapproach.
An extension of the VOF approach for analysis of the liquid/gas interface has beenintroduced by Bussmann et al. (1999). The model allows the simulation of inherentlythree-dimensional structures during droplet impact, e.g. for inclined impact, impact ontostructured substrates (rough surface) and splashing effects. Figure 6.11 shows the three-dimensional impact of a molten metal (tin) droplet onto a solid surface (Bussmann et al.,2000). The numerical results are in good agreement with the experimental in terms ofspreading and the splashing region. The number of satellite droplets ejecting from the rimof the droplet is captured.
The impact and solidification of tin droplets on a flat steel plate was studied by Pasandideh-Fard et al. (1998) using experimental and numerical simulations. In the experiments, tindroplets (2.1 mm in diameter) were formed and dropped onto a stainless steel surface whosetemperature was varied from 25 to 240 ◦C. The impact process of droplets was photographed,and evolution of droplet spread diameter and liquid–solid contact angle were measured

174 Compaction
Fig. 6.11 Three-dimensional impact of a tin droplet onto a solid surface: comparison between sim-ulation (left) and experiment (right) (Bussmann et al., 2000)
from photographs. The measured values of the liquid–solid contact angle were used as aboundary condition for the numerical VOF model. An example of the simulation resultsis shown in Figure 6.12 for the impact of a tin drop onto a substrate initially at 150 ◦C.The drop shape, and temperature evolution in the drop and the underlying substrate are tobe seen. The heat transfer coefficient at the droplet–substrate interface was estimated bymatching numerical predictions of the variation in substrate temperature with measurements.Comparison of computer-generated images of impacting droplets with photographs showedthat the numerical model correctly predicted droplet shapes during impact for simultaneousspreading and solidification. From these results an empirical correlation with the maximum
175 6.1 Droplet impact and compaction
−3
t = 0.7 ms
3 mm 1 m/s
T [°C]
250
240
232
220
210
200
190
180
170
160
150
−3
t = 1.9 ms
3
−3
t = 4.5 ms
3
−3
t = 6.0 ms
3
−3
t = 8.5 ms
3
−3
t = 15.0 ms
3
Fig. 6.12 Drop impact simulation of tin (dp = 2.1 mm) onto a stainless steel substrate (Pasandideh-Fard et al., 1998)

176 Compaction
spread diameter of a freezing droplet has been derived:
dmax
d0=
√We + 12
3(1 − cos ) + 4(We/√
Re) + We√
(3Ste)/(4Pe). (6.8)
Here the relevant kinetic and thermal numbers for droplet impact are introduced, as theWeber number We, the Reynolds number Re, the Stefan number Ste and the Peclet numberPe, as well as the liquid–solid contact angle . The magnitude of the term
√(3Ste)/(4Pe)
determines whether solidification influences the droplet spreading process or just the kineticimpact energy.
From least square analysis of the observed outcome of molten metal drop impingementexperiments, a splashing number Z∗ has been derived by Berg (1999) as:
Z∗ = 9.48Re0.177 We0.224 Pe0.115
T Pe0.021S Ec0.108 ß0.335
Ste0.116 Nu0.103 (1 − cos )0.08= 825. (6.9)
Droplets impacting at Z∗ < 825 will only spread and completely deposit, droplets at Z∗ >
835 will partly fragment during impact. The correlation has been derived from dropexperiments with tin, lead, copper, aluminium and steel, impinging perpendicularly to astainless steel substrate. The correlation is valid in the investigated range of Reynoldsnumbers 7500 < Re < 135 000 and Weber numbers 50 < We < 3700.
In summary, adequate modelling of particle and drop impact processes is essential fornumerical description of impact-orientated spray processes within coating or spray formingapplications. In the latter, the ratio of back splashing to compacting droplet mass is also ofspecial interest, as it determines the compaction efficiency of the spray forming process.Also the compaction rate or efficiency is an important input parameter for modelling thegeometry of growing preforms during spray forming, which will be introduced in the nextsection.
6.2 Geometric modelling
The possibility of producing near-net shaped preforms is one of the most important advan-tages of the spray forming process. Flat products (sheets), tubular products and rings, andmassive volumetric products such as billets, are the most often produced geometries for

177 6.2 Geometric modelling
industrial application. The spray forming of more complicated preforms and geometriesis the subject of much research and development or testing. A necessary condition for theadaptation of spray forming process to new geometries is the ability to predict resultingpreform geometries from process conditions and material parameters. Also the planning ofoperational parameters in advance and process control during operation of a spray form-ing facility require information on the transient shape of the ideal spray formed preformin order to control the process properly. The geometry of spray formed products dependson the mass flux distribution in the spray, the substrate geometry and movement, and thecompaction rate or efficiency.
Continuous shape modelling of preforms during spray forming, which defines the sprayas a continuous mass flux released from a source, has been developed by Frigaard (1994,1997, 2000). Formal description of the spray is given in terms of its resulting shape duringapplication onto a surface with the source (spray) axis pointing onto the substrate. Thisfunction is of Gaussian type; the corresponding mean and standard deviation need to be ob-tained from experiments. The advantage of this model is its great flexibility in dealingwith more complicated geometric arrangements of substrate and spray. However, twoimportant problems must be solved. First, in every time step, knowledge of the visibil-ity of any points on the surface, as seen from the spray origin, is required. All points withinthe shadow regions will not advance in spray during such a time step until they become vis-ible. The algorithm calculating the visibility function is required for every time step and hasa strong impact on the overall computational time. Second, the position of the surface aftereach discrete time step must be tracked, followed by reconnection of the surface segments todefine the new surface position. This procedure is controlled by a so-called small-distanceparameter and may lead to merging of the closest surface parts, resulting in the formationof macropores (Djuric et al., 1999).
The geometric correlation for estimating the local growth rate g (increase in height pertime unit) is:
g = mspray
ρp
fsh cos β
Eporkp, (6.10)
and is related to growth perpendicular to the surface. The angle β is that between thesurface normal on the deposit contour and the particle impingement vector. If the growthis to be determined in the direction of the spray centre-line, then cos β = 1. The massflux distribution in the spray is related to the theoretical material density and the localcompaction rate (or sticking efficiency) kp. The shadow factor fsh is a visibility factor whichmay have values between fsh = 1 (visible area on the deposit from the viewpoint of the sprayimpact normal, related to the particle trajectory vector before impingement) and fsh = 0 (apoint within the shadow area of another deposit area, related to the particle trajectory vectorbefore impingement). A porosity factor Epor is introduced which describes the differencebetween the local theoretical material density (density of droplets ρp) and the actual resultingmaterial density in the deposit including pore formation (where the definition of the localporosity � is Epor = 1 − �). The compaction rate is either assumed to be constant acrossthe whole compaction area or is a function of the local position on the deposit surface, or

178 Compaction
−50 −40 −30 −20 −10 0 10 20 30 40 50
radial position [mm]
0
10
20
30
40
50
60
70
80
90
100he
ight
[m
m]
t = 4 s
t = 12 s
t = 20 s
Fig. 6.13 Calculated deposit contour (Kramer, 1997), comparison between experimental values(line): constant compaction rate k = 0.8
100
90
80
70
60
50
40
30
20
10
0−50 −40 −30 −20 −10 0 10 20 30 40 50
radial position [mm]
heig
ht [
mm
]
t = 4 s
t = 12 s
t = 20 s
Fig. 6.14 Calculated deposit contour (Kramer, 1997), comparison with experimental values (line):variable compaction rate
is based on other models dependent on position and local properties (such as the surfacetemperature, see Section 6.1 (Buchholz, 2002; Kramer et al., 1997).
In Figures 6.13 and 6.14, comparison between measured transient deposit contours andmodel-based calculated deposit contours is illustrated. In the first figure it is assumed thatthe compaction rate is constant over the entire surface of the deposit (kp = 0.8). In thesecond figure, the compaction rate has been taken from an empirical function based onmeasurement results. In both figures, spray forming by means of a stationary atomizerspraying perpendicular on a cylindrical substrate is assumed. For such operational para-meters, a Gaussian-shaped deposit will result, as can be seen in the figures. The results havebeen taken from an investigation of Kramer (1997). The calculation with a temporal and

179 6.2 Geometric modelling
radius [mm] radius [mm]
heig
ht [
mm
]
heig
ht [
mm
]
380.0
360.0
340.0
320.0
300.0
280.0
260.0
240.0
220.0
200.0
180.0
160.0
140.0
120.0
100.0
80.0
60.0
40.0
20.0
0.0
0.0 50.0 100.0 0.0 50.0 100.0−20.0
380.0
360.0
340.0
320.0
300.0
280.0
260.0
240.0
220.0
200.0
180.0
160.0
140.0
120.0
100.0
80.0
60.0
40.0
20.0
0.0
−20.0
Fig. 6.15 Calculated geometry of a growing billet in the spray phase (Kienzler and Schroder, 1997)
spatial constant compaction rate yields, after a certain time, relevant deviations from thereal geometry of the measured deposit. This deficit may be related to the fact that the com-paction rate in the initial phase of the spray forming process for Gaussian-shaped geometriesdepends strongly on time and location (radius). By using a quite high compaction rate ofkp = 0.8 (80% compacted material, which is quite high for this geometry but may be higherfor other geometries and materials) the geometry is reflected correctly at the initial stageof the process; but at later stages, when the compaction rate is decreased, growth of thedeposit is overpredicted. By using a variable compaction rate, as in Figure 6.14, the cal-culated growth and deposit geometry are in quite good agreement with experimental data.
The growth of a cylindrical billet during spray forming is illustrated in Figure 6.15 for atypical spraying time of 350 s. This type of billet is usually produced by sidewise sprayingonto a rotating cylindrical substrate that is withdrawn downward to maintain a constantdistance between atomizer and impingement area (to keep the spray parameters constantduring impact). The figure shows calculated contour results with and without the use ofa simple compaction rate model. The withdrawal speed of the substrate in this case was1 mm/s. The growth behaviour has been calculated and two different growth phases havebeen obtained. After the initial phase, where the billet contour changes steadily (billetgrowth rate), in the later phase, after a spraying time of t > 100 s, growth is stationary;

180 Compaction
the billet grows at a constant diameter and obtains a constant shape and contour at its tipwithin the compaction area. This result has been achieved for both calculations, though thecalculation from the compaction rate model yields a pure convex outer surface of the billet(as intended). If the operational conditions are kept constant, the billet will grow straightupwards afterwards with a constant contour at arbitrary times (limited just by the technicalrestrictions of the process).
6.2.1 Form-filling spray process
Modelling of the spraying process of a liquid metal, which solidifies on an arbitrary surface,and of the subsequent growth of the deposit has also been presented by Djuric et al. (1999).The continuous two-dimensional model developed defines the source involved in the spray-ing process; the kinetics of points on an arbitrary substrate, including their visibility andthe spray’s sticking efficiency; and redefines a new surface on the completion of everyiteration step. The surface is described by a multivalued function of its spatial coordinates(which does not cross itself at any point) at every moment of the calculation. The sourceis a function of the mass flux of the material arriving from the spray, and its distributionand movement in space is taken from corresponding experiments. A merging procedureis developed to reconnect parts of a curve, which become too close during spraying. Thisprocedure produces closed voids, called macropores, in the deposited material, defined asa continuous function of the spray parameters. The influence of the spraying angle, as themost important spray parameter, on shape evolution during filling of a (two-dimensional)notch with slightly sloped walls is discussed. A porosity distribution function is calculatedfor every set of input parameters, and its relationship to shape evolution emphasized. Thecomputational procedure consists of four steps:
� description of the curve (surface) at any moment,� calculation of the visibility function and other geometric parameters,� curve evolution because of the impacting mass, and� definition of a new curve at the end of every time step.
Some global results have been achieved from these calculations, such as:
� the formation and distribution of macropores caused by the merging of closest curvesegments, and
� the microporosity distribution in the deposited material.
An empirical local microporosity function p has been modelled as a function of the impactangle col, defined as the angle between the radius vector of any point on the curve andthe tangent vector at the same point. This function has been taken from the experimentalresults of Smith et al. (1994) in the form of a best-fit polynomial approximation:
p(col) = a0 + a1col + a22col + a3
3col + a4
4col, (6.11)
where the coefficients are a0 = 0.622, a1 = −1.749, a2 = 2.093, a3 = −1.115 and a4 =0.222.

181 6.2 Geometric modelling
0.0 0.2 0.4 0.6 0.8 1.0
1 mm 1 mm
y
Fig. 6.16 Simulated notch filling geometry for αspray = 0◦ and kp = 1. Left: shape evolution. Right:microporosity function (Djuric et al., 1999)
The model has been applied to the two-dimensional notch filling case using differentspray angles αspray in the range 0◦ to 40◦, where the source (spray) is moved along ahorizontal line at a certain distance from the top of the initial shape and with a prescribedvelocity. The mass flux distribution of the source has been taken from a standard experiment(footprint experiment). For the sticking efficiency kp, either 100% (complete compaction)or an empirical correlation, also approximating the experiments in Smith et al. (1994) as afunction of the impact angle, have been used:
kp(col) = b0 + b1col + b2 2col, (6.12)
where the coefficients are b0 = 0.339, b1 = 0.875, b2 = −0.292.The simulation results for two different spray inclination angles are illustrated in Figure
6.16 for αspray = 0◦ and kp = 1, and in Figure 6.17 for αspray = 10◦ and kp = 1 (Djuric et al.,1999). On the left, the spray formed shape evolution while filling the notch in the spray phaseis seen; while on the right, the resulting microporosity and macropore formation at the endof the spray time is seen. For the various spray angles discussed, different macroporosity(bridging) and microporosity distributions are calculated. Some final spray formed profileshave been compared to experimental profiles, which show good agreement. From thesecalculations, the process parameters influencing spray forming may be derived.
In a further development of this model, Djuric and Grant (2001) included submodelsfor splashing and redeposition of droplets during impact onto the deposit (still in twodimensions) for spray forming of a notch geometry. By including or excluding droplet-splashing effects, it has been possible to analyse the importance of droplet redeposition bothin simulations and experiments. In the case of splashing, the different microsource functionsassumed resulted in slightly different, but geometrically similar, preform shapes. Modellingof these functions was based on: continuous splashing/reemission processes, a simple point

182 Compaction
Fig. 6.17 Simulated notch filling geometry for αspray = 10◦ and kp = 1. Left: shape evolution. Right:microporosity function (Djuric et al., 1999)
source, qualitative analysis of splashing events observed during experimentation by high-speed imaging, a total mass preservation constraint, and some theoretical and experimentalresults of single-droplet impact onto hard surfaces. From the results of this model, it waspossible to predict the impact regions where direct spraying dominated deposit growth andwhere subsequent redeposition has a major influence on deposit growth and the final shape.In order to address the remaining deficiencies in the model, resulting from comparison toexperimental values, three-dimensional effects need to be taken into account.
6.2.2 Computer-hardware-tailored geometric simulation
A general geometric model describing the evolution of the deposit shape, including theeffect of multiple atomizers, as well as controlled atomizer scanning within a gear-drivendevice, has been developed by Markus and Fritsching (2003).
In a spray forming application with two independent atomizers for melt disintegration,one or both nozzles may scan periodically around a fixed axis (see Figure 6.18). Theeccentricity e is the distance between the central point of the substrate and the spray coneaxis at its zero position. The substrate rotates and is translated away from the atomizer inorder to maintain a constant distance from the surface to the atomizer that compensatesfor growth of the deposit. The deposit is described in Cartesian coordinates. A structuredgrid describes the deposit surface initially containing n × m nodes (each node located atthe centre of a cell). While the deposit is growing, the position of the nodes will move.In the case of small cells, a certain number may be combined to form a single new cell. Inthe case of coarse cells, these may be subdivided to form new, smaller cells. During spraydeposition, the cells on the surface may deform and the grid may be properly smoothed insuch a way that the nodes are equally distributed on the deposit surface.

183 6.2 Geometric modelling
α1
α2 const.
a
nozzle 1
zz
r
r
xy
nozzle 2
e
γ
z
Fig. 6.18 Sketch of the geometric arrangement of nozzles and substrate for billet production bymultiple atomization nozzles
Figure 6.19 illustrates some resulting surface meshes for different spray formed deposits.The geometries of a general, noncircular billet (a), a ring (b) and tube (c) are illustrated,respectively. Where periodic agreement between substrate rotation and the atomizer nozzlescanning frequency occurs, an irregular shape may be produced as in Figure 6.19(a).
The spray is described within a cylindrical coordinate system with its origin at the nozzle.In order to simulate growth of the deposit, the local distribution of the melt mass flux inthe spray m A needs to be prescribed, and can be derived from the experimental correlationin Uhlenwinkel (1992). For a certain material and a constant melt and gas mass flow rate,the radial distribution of the mass flux density at a certain position z can be described as aGaussian-shaped function:
m A(r, z) = m A,maxeln(0.5)( rr0.5
)k1, (6.13)
with the maximum mass flux m A,max at the centre-line of the spray at r = 0. The skewnessof the function is described by an empirical constant k1, which was found from experimentto be k1 = 1.4. At the half-width radius r0.5, the local mass flux density is decreased to half

184 Compaction
(a) (b) (c)
Fig. 6.19 Examples of surface grids for: (a) billet, (b) ring and (c) tube geometry simulation
the maximum mass flux value m A,max at the centre-line of the spray. The following equationshows the correlation between m A,max and r0.5:
r0.5 =√
k2 Mmelt
m A,max. (6.14)
The width of the spray cone is assumed to increase with increasing distance from the nozzlein a non-linear way:
r0.5 = r0.5,ref
(z
zref
) kref2
, (6.15)
where the parameter kref for a reference distance zref, 500 mm from the nozzle, is about1.5 (Buchholz, 2002). A constant sticking efficiency of the spray particles on the surface isassumed.
The visibility of surface points is calculated using a computer graphics algorithm. Theproblem of checking whether an object is visible or not, is a common task within computergraphics. Two methods may be used to check the visibility:
(1) back face culling, and(2) the Z-buffer algorithm.
A simple and fast way of checking visibility is to use back face culling. It just checks if thenormal onto the cell surface can be seen in the direction of the viewpoint or not. It can becalculated by simple vector algebra:
n × v≥0 : invisible
<0 : visible, (6.16)
with n the direction normal to the vector at the cell surface and v the direction towards theviewpoint. For completely convex bodies, this method results in correct visibility functions,but for complex shapes some problems occur. Another way to check the visibility of surface

185 6.2 Geometric modelling
l1 l2
w3 w6w4
β1'
w5
w2w1α0α,
l3
l4l5
l6
a,l7 l11
l8 l9
l10
p1
p42
p40
p41
p10
p20
p30 p50
p2
p3
p4
p7
p8
e
p10
r, s1, s2
p6
γ
β0.2+ β2'
w8
w7
Fig. 6.20 Illustration of gear mechanism for control of two atomizer nozzles
points completely using computer graphics is to employ the Z-buffer algorithm. Thisalgorithm typically forms part of the computer graphics hardware and is therefore veryfast. All objects will be flushed to the graphics card memory, where each cell is assigned,for example, to a unique colour. By reading the colours directly from the graphics cardmemory, the visibility of each cell can be checked in a quick and simple way. The neces-sary graphics programming is simplified by the availability of general graphics softwarepackages such as OpenGL.
The gear mechanism illustrated in Figure 6.20, which allows for the general scanningmovement of the atomizers, consists of a number of simple devices. Kinematic analysis ofthe modular gear system is carried out independently.
Figure 6.21 compares the geometry of a simulated billet with that produced duringspraying using conventional process parameters. In this experiment a relatively small meltorifice has been tested, with a diameter of just 1.6 mm, spraying at a small distance betweenatomizer and substrate. In this case, the spray parameters for the resulting very low meltflow rate have been extrapolated from the mass flux distribution function of Uhlenwinkel(1992). The resulting shape of the simulation agrees well with experiment.
A billet formed from the simultaneous spraying of two atomizers is shown in Figure 6.22.It has a weight of 112 kg, a height of 335 mm and a diameter of 249 mm. The simulationgives 335 × 269 mm for the dimensions of the billet.

186 Compaction
Sk1-563100Cr6
0 1 2 3 4 5
Fig. 6.21 Copper billet sprayed from a 1.6 mm melt stream. Left: simulated result. Right: experi-mental result
10 cm
Fig. 6.22 CuSn6 billet sprayed with two atomizers

187 6.3 Billet cooling
6.3 Billet cooling
The cooling conditions experienced by the metal during spray forming significantly deter-mine the resulting properties of the material. As spray formed metals are widely assumedto be superior compared to conventionally manufactured materials, analysis of the coolingconditions is a key process for understanding and optimization of spray forming processes.In the following section, thermal analysis and simulation of the solidification and coolingbehaviour of billets during two stages of spray forming, namely the growth process (duringthe spray phase) and the subsequent cooling process, will be discussed. Here, modelling ofthe behaviour of the deposit, together with its underlying substrate, and including all neces-sary submodels and boundary conditions, is introduced. Using a numerical algorithm, theprocess parameters, which are influenced by variable boundary conditions during the sprayrun, are identified and the thermal state of the deposit, in terms of the local temperature andsolidification state, is derived.
6.3.1 Method
For analysis of the thermal conditions in the deposit and substrate, the heat conduction(Fourier) equation including a source term that accounts for latent heat release, in differentialform, is discretized by means of finite differences in the solution domain. Fitting a gridstructure to the actual contour of the deposit during coordinate transformation simplifiesthe mathematical description, as well as numerical handling of the boundary conditions atcurves. Here the grid lines and discretization points are directly aligned with the contour(boundary fitted coordinates, BFC), thereby increasing the accuracy of the calculation.
6.3.2 Assumptions
A whole series of assumptions and simplifying boundary conditions need to be made forinitial calculation of the thermal state of a Gaussian preform:
� Material properties such as density ρ, heat capacity cp and heat conductivity λ are inde-pendent of temperature.

188 Compaction
� The state of the impinging spray does not change with time nor with the height of thedeposit during the growth phase.
� To model the phase change behaviour, heterogeneous nucleation is assumed. This de-scribes the solidification process while the temperature remains constant until the locallatent heat amount is released from the volume and conducted towards the surroundingfinite volume elements.
� The first calculation discusses Gaussian-shaped deposits sprayed by stationary atomiza-tion perpendicular to a non-moving cylindrical substrate. In this calculation, the massflux distribution in the spray is derived from Uhlenwinkel (1992) for spraying of differentmetals. This can be expressed in terms of a general empirical formula:
m
mc= e−k1( r
r0.5)k2
(6.17)
� where mc is the maximum value of the mass flux distribution at the centre-line of the sprayand r0.5 is the half-width of the mass flux distribution (see Figure 6.23). The empiricalconstants used are k1 = ln(2.0) and 1.2 < k2 < 2.0. The constant k2 depends on operationalprocess conditions.
� The spray enthalpy flux carried from the particles onto the deposit is derived from thecalculations described in Section 5.1.2.
6.3.3 Fundamental equation and coordinate transformation
The simulation code has been developed for two-dimensional calculations assuming cir-cumferential symmetry of the deposit and the underlying (disc-shaped) substrate. The fun-damental conservation equation is the transient heat conduction equation including a sourceterm for phase change modelling and latent heat release. It is used in the derived formulationin enthalpy form:
∂ H
∂t= a
(∂2h
∂z2+ ∂h2
∂r2+ 1
r
∂h
∂r
), (6.18)
including the temperature conductivity a, the specific enthalpy h and the total enthalpy H,defined as:
H = cpT − Ts,l
Lh+ fl , h = cp
T − Ts,l
Lh, (6.19)
with the latent heat of fusion Lh and the liquid fraction fl . The relation between specificand total enthalpy is given by:
h = H − 1, for H ≥ 1 (fluid);h = 0, for 0 < H < 1 (solidifying);h = H, for H ≤ 0 (solid).
(6.20)
The local phase and solidification state of the material are deduced directly from the totalenthalpy in this formulation.

189 6.3 Billet cooling
mc
m(r)
r0.5
0.5mc
0 r
z
˙
˙˙
Fig. 6.23 Mass flux distribution
A coordinate transformation of the fundamental equation is performed which transformsthe basic equation system into a common curvilinear non-orthogonal coordinate systemmatching the actual transient deposit contour at each time step. The underlying substrateis assumed to be a round disc that is tackled within a cylindrical coordinate system. Theresulting final grid structure (using circumferential and sidewise symmetry, by illustratinga half cut through the deposit and the substrate) is illustrated in Figure 6.24. The coordinatetransformation for this special case of a principally Gaussian-shaped deposit uses the heightcoordinate:
z(r ) = mc
ρdte−k1( r
r0.5)k2
. (6.21)
As a result, the transformed new coordinates of the system may be derived as:
ξ = r, η = zeκrk2 with κ = ln(2, 0)
rk20.5
(6.22)

190 Compaction
123
110.7
98.4
86.1
73.8
61.5
49.2
36.9
24.6
12.3
00 20 40 60 80 100
K2 = 1.3
R05 = 0.031
Fig. 6.24 Grid contour for a Gaussian-shaped deposit (Zhang, 1994)
containing the profile constant k2 of the mass flux distribution in the spray model. In thisway, thermal analysis of the deposit is directly coupled to the spray model via the mass fluxdistribution. Transformation of the conservation equation results in:
1
a
∂ H
∂t= Ahξξ + Bhξ + Chξη + Dhη + Ehηη, (6.23)
where the spatial derivatives of the local enthalpy h and the geometrical coefficients of thetransformation are:
A = ξ 2r + ξ 2
z ,
B = ξzηηz + ξrηηr + ξr
ξ,
C = 2(ξrηr + ξzηz),
D = ξzηzξ + ξrηrη + ηr
ξ,
E = η2r + η2
z .
(6.24)
In this series of equations, ξ is the radius with respect to the new coordinate system ξ =r(ξ , η). The mixed derivatives are to be included only for non-orthogonal coordinate trans-formations.
In order to describe the transient contour of the growing deposit during spray forming,during calculation additional layers need to be added to the top of the geometric model of

191 6.3 Billet cooling
subdepq
/ζ
mspray
qαtop
hspray
qεtop
qαside
qεsideqεside
qαside
qαbottomqεbottom
qλdep/sub
Fig. 6.25 Boundary conditions for thermal billet simulation
the deposit. The layer thickness at each growth step �t is adapted to the local compactedmass from the spray. Thereby at each growth step, an additional grid layer is added to thesystem and the total grid size linearly increases in the spray phase.
6.3.4 Boundary conditions
To model the growth of the deposit during thermal simulation, the necessary boundaryconditions need to be prescribed. The main processes are:
� heat transfer by convection to the gas phase from the deposit and the substrate,� heat radiation exchange with the environment,� local thermal energy and mass flux contributions from the spray entering the deposit
surface,� heat resistance between deposit and substrate from the lower deposit layer (contact layer).
The most important boundary conditions are the fluxes (mass and heat) across the boundaryof the solution domain. As illustrated in Figure 6.25 these are:

192 Compaction
mspray mass flux distribution in the spray,hspray enthalpy flux distribution in the spray,qαtop convective heat flux from the top (spray impingement area) of the depositqεtop radiative heat flux from the top (spray impingement area) of the depositqαside convective heat flux from the side of the depositqεside radiative heat flux from the side of the depositqλdep/sub conductive heat flux from the deposit to the substrate,qαbottom convective heat flux from the bottom of the substrate,qεbottom radiative heat flux from the bottom of the substrate.
These boundary conditions are derived either from simulation or from experimentalinvestigation. As an example, in the following, derivation of the surface to gas heat trans-fer coefficient and the heat resistance coefficient between deposit and substrate will bedescribed.
6.3.5 Heat resistance coefficient
Especially at the start of the spray forming process, cooling of the deposit directly dependson the heat flux from the deposit into the underlying substrate. This heat flux is of the sameorder as, or may even exceed, the heat flux contribution from the deposit surface to the gasby convection and radiation in some cases. For simulation cooling, analysis and descriptionof this heat flux is a necessary and important boundary condition. The heat flux may not beeasily incorporated into the conventional heat conduction model due to resistance effectsas will be explained below. A number of resistance effects’ need to be accounted for inreal spray forming applications, depending on e.g. material pairing (substrate/deposit) andoperational process conditions. An experimental method to determine and quantify theheat flux and heat resistance effects between deposit and substrate has been developed byBergmann (2000), which will be introduced next.
The major influence on heat flow rate Q from the deposit to the underlying substrate is thestructure and condition of the lowest layer of the deposit (i.e. the first layer to be compactedonto the substrate). This is the contact layer between the sprayed material and the substrateand, due to the process conditions pertaining at the time of formation, may exhibit thermalresistance to heat transfer between the deposit and the substrate. The phenomena affectingthermal resistance may be expressed in terms of surface roughness, porosity, and oxidelayer formation. These may result from cold spray conditions and the remaining oxygen inthe spray chamber prior to spray forming. A principal sketch of a typical deposit/substratecontact layer is illustrated in Figure 6.26.
The contact layer influences the heat flow rate Q by decreasing conductivity in the contactlayer compared to that in the deposit under normal conditions. Therefore, for example,measurements of local temperatures just above and below the contact layer show a certaintemperature difference in this area (Lavernia and Wu, 1996; Zhang, 1994). The qualitativedistribution of the temperature in the contact layer between the deposit and the substrate isshown in Figure 6.27.

193 6.3 Billet cooling
Fig. 6.26 Composition of the contact layer between deposit and substrate
Fig. 6.27 Qualitative temperature distribution in substrate and deposit with contact layer
The heat conductivity of the contact layer is not constant across its thickness �xct anddepends on the relation between the amount of oxides, the roughness and the local porosity.The assumed heat conductivity λct illustrated in Figure 6.27 is an averaged quantity.
Because the contact layer (eventually with a thickness of some millimetres) only containsa minor amount of the total deposit mass and its spatial extension is small, for calculationof the temperature distribution in the deposit detailed resolution and analysis of the com-position of the contact layer is of minor importance. Also grid resolution at the scale ofthe contact layer depth is not attempted during simulation. But the integral influence of thecontact layer on the heat transfer mechanism between deposit and substrate needs to be inves-tigated. Here, in analogy to the convective heat transfer mechanism from the surface, a heat

194 Compaction
Fig. 6.28 Qualitative temperature distribution in substrate and deposit with heat contactcoefficient αct
contact or resistance coefficient αct is defined (Baehr and Stephan, 1994). From this pointof view, the temperature distribution in the substrate and the deposit may be expressed as inFigure 6.28.
The relation between the average heat conductivity of the contact layer λct and the heatresistance coefficient of the contact layer αct is given by the thickness of the contact layer:
αct = λct
�xct. (6.25)
For experimental evaluation of the heat resistance coefficient of the contact layer, ex-postmodel analyses from spray formed products have been performed. Here cylindrical-shapedprobes have been taken from the bottom of spray formed preforms and a heat flux appliedacross the contact layer surface. The stationary temperature distribution in the cylindricalelement has been measured. From the assumption of an infinitely thin contact layer andwith the known heat flow rate Qext, the measured surface temperature at the surface of theheating element and diameter d of the probe, the heat transfer resistance coefficient is:
αct = Qextπ
4d2 (Ta − Tb)
. (6.26)
The spray forming process conditions and materials used in this study are listed inTable 6.2. The base case for evaluation of the heat resistance coefficient is the one inthe first column (standard trial). The other parameter sets deviate in one or more processconditions from this standard parameter set.

195 6.3 Billet cooling
Table 6.2 Model parameters for derivation of the heat contact coefficient
Standard V1 V2 V3
Material C30 Cu C30 C30Melt mass flow rate Ml [kg/s] 0.192 0.217 0.192 0.192Gas mass flow rate Mg [kg/s] 0.291 0.205 0.205 0.291GMR [ - ] 1.5 0.9 1.1 1.5Melt superheat �T [K] 95 200 95 95Substrate distance z [mm] 750 750 750 750Substrate material Steel Steel Steel Ceramic
40 50 60 70 80 90 100 110 120 1301000
2000
3000
4000
5000
6000
7000
8000
R [µm]
W‰r
mek
onta
ktko
effi
zien
t [W
/m≤K
] standard
V1
V2
V3
maxmaximum roughness Rmax
heat
con
tact
coe
ffic
ient
[W
/m2
K]
Fig. 6.29 Relation between measured heat contact coefficient and maximum surface roughness Rmax
(for process condition see Table 6.2)
Figure 6.29 illustrates the measured values of the heat resistance coefficient dependenton the measured roughness of the contact layer surface. The individual datum points showsamples from different positions along the contact area.
While the samples from deposit V1 (copper) show a pronounced relation between theheat resistance coefficient and the surface roughness of the contact layer (expressed here bymeans of the measured local maximum roughness Rmax), within steel spray formed productsthis behaviour could not be found. For steel spray formed products (standard, V2 and V3),the heat resistance coefficient is almost constant and smaller than for copper. Therefore, theheat flux resistance for steel is lower.

196 Compaction
The condition of the contact layer may be directly related to the spray and substrateconditions during impact of the first droplets during spray forming onto the substrate. Thisis because melt particles that have been cooled more intensively in the spray in the initialphase, impinge onto the (cold) substrate and therefore contain far less melt liquid. Thus,remelting and sintering between particles is hindered, and porosity and roughness in thecontact layer are increased. As a result, the resistance coefficient increases. This may explainwhy within trial V1, for copper, sprayed at higher relative superheating of the melt and ata lower GMR, the measured heat resistance coefficients are far higher compared to thestandard case. Also in trial V2, where a smaller GMR when compared to the standardcase has been used, the maximum measured value of the heat resistance coefficient alsoincreases.
When using a ceramic substrate material (as in case V3), the heat coefficient is expectedto increase due to the lower porosity in the contact layer, which results from less cooling ofthe droplet layers initially deposited (here the heat flux into the substrate decreases). Thiseffect is not seen, because the ceramic substrates themselves have surface roughness valuesthat are above those measured for the steel substrates in the other cases. This roughnessis reflected at the lower surface of the contact layer of the preform during deposition. Fromthis analysis, optimization potentials for spray forming processes may be derived. Coating ofthe substrate may be an efficient way of controlling the roughness. Due to the relatively highroughness values of the deposits used, the measured values of the contact heat coefficientare higher than expected from the model outlined.
The values of the measured heat contact coefficients are well within the range found inliterature. In Lavernia and Wu (1996), for a number of investigations of deposit/substrateheat transfer processes, the range of values for the heat contact coefficient within sprayformed products is between 103 and 104 W/m2 K.
6.3.6 Convective heat transfer across the surface of a spray formed billet
The distribution of the convective heat transfer coefficient on the surface of a spray formedbillet has been numerically investigated by Rau (2002). The simulation model is based on afinite volume representation of the fundamental transport equations for mass and momentum(Eq. (3.1)). A commercial CFD flow solver (FLUENT (creare.x Inc, 1990)) has been used.The main parameters of the simulation are:
� Turbulence modelling is based on a RNG–k–ε model, as this modification of the standardk–ε model has been proved to obtain better results in some flow configurations, includingstrong streamline curvature cases such as the impinging jet.
� The model is based on a single-phase approach, studying the pure (incompressible) flowof the atomizer gas.
� A fully three-dimensional case is studied: the grid is based on boundary fitting byunstructured grid elements.
� The flow around a billet of dimensions ø 200 mm and 300 mm height (typically derivedfrom experiment), where the spray is inclined by 30◦ to the billet, is studied.

197 6.3 Billet cooling
velocity [m/s]
2.34e +02
2.11e +02
1.87e +02
1.64e +02
1.41e +02
1.17e +02
9.37e +01
7.03e +01
4.69e +01
2.34e +01
0.00e +01
Fig. 6.30 Atomizer gas flow field around a billet in the three-dimensional calculation (Rau,2002)
� The momentum boundary conditions on the billet surface are derived from the ‘two-layerzonal model’ (creare.x Inc, 1990). This model obtains better resolution of the boundarylayer down to the viscous zone.
� Usage of the ‘two-layer zonal model’ requires a final grid resolution, where the nearestgrid point to the wall needs to be located at a maximum dimensionless grid distance ofy+ < 4 . . . 5. The grid distribution in the near-surface area is adapted throughout theiterational procedure and refined in regions where necessary. However, the maximumdistance which can be achieved within a domain of times up to 1.2 × 10⁶ grid points islarger than the value mentioned above. Validation of this approach is based on comparisonof results for the case of an impinging jet on a flat surface in two-dimensions and thecalculated heat transfer coefficient distribution to values published.
� The surface temperature of the billet is assumed to be constant.
The result of the computation for the case of 0.4 MPa atomizer pressure with nitrogenis seen in Figure 6.30. Here the velocity contours in a central plane around the billet areillustrated. Five main flow regions may be distinguished. The jet flow above the billet ischaracterized by typical free-jet behaviour, such as exponential decrease of the centre-linevelocity and the entrainment of ambient gas. On the top of the billet, in the impingementarea, a boundary layer resulting from diversion of the jet flow occurs. On the side of thebillet, tangentially orientated to the impinging jet, a shearing boundary layer is established.

198 Compaction
heat transfer
coefficient [W/m2 K]
front view back view side view
9.16e +02
8.25e +02
7.33e +02
6.41e +02
5.50e +02
4.58e +02
3.67e +02
2.75e +02
1.83e +02
9.16e +02
0.00e +00
Fig. 6.31 Isocontour planes of heat transfer coefficient for a billet in an atomizer gas flow (Rau,2002)
On the shadow side (beneath) of the billet, the flow may detach, resulting in recirculationwithin that particular area. On the lower side of the billet, recirculation of the gas is alsoseen.
The distribution of the heat transfer coefficient on the surface of the billet is illustrated asisocontours in Figure 6.31 for 0.4 MPa gas pressure. Maximum values of the heat transfercoefficient in the jet impingement area are about 900 W/m2 K; the lowest values are to befound in the shadow region of the billet.
Comparison of the calculated heat transfer coefficient with experimental values is seenin Figure 6.32. The heat transfer coefficient is plotted along a line on the billet surface, asindicated on the right-hand side of Figure 6.32, from the bottom to the top of the billet onits front, across the top of the billet, and down from the top to the bottom on its shadowside. For the experimental investigation of heat transfer coefficients on spray formed billetsurfaces, the lumb-capacity method has been used (Schneider et al., 2001; Tillwick, 2000).Here a dummy reflecting the real geometry and size of a spray formed billet has beenpreheated to approximately 150 ◦C. The billet is then located beneath the atomizer nozzleinside a spray chamber and is cooled down by the atomizer gas for approximately 60 s. Atseveral points on the billet surface, heat transfer probes are distributed, where the local heattransfer coefficient is measured. Comparison of experimental and simulated results showsagreement of the behaviour of the heat transfer coefficient. But the experimental value inthe stagnation point, for example, is measured at just 750 W/m2 K. Here maximum gridresolution and the y+ values of the first grid point are, in some areas of the simulation, muchtoo coarse to resolve the flow structure properly.

199 6.3 Billet cooling
−500 −400 −300 −200 −100 0 100 200 300 400 500
0
100
200
300
400
500
600
700
800
900
1000
Seite SeiteKopf
T
Wärm
eübe
rgan
gsko
effiz
ient[
aufderBolzenoberfläch e [ mm ]
heat
tran
sfe
rco
effi
cien
t
position a long the b t surface line
frontside head backsid e
exp
180°
atomizer
X180°X0°
Seite SeiteKopf
α simα exp
Wärm
eübe
rgan
gsko
effiz
ient[
der Bolzenoberfläche [ m m ]
heat
tran
sfer
coef
fici
ent
position along the billet surface line
front head back
X0°
gas jet impingement point
X0°
X
[W/m
2 K]
Fig. 6.32 Comparison of simulated (Rau, 2002) and experimental (Tillwick, 2000) heat transfercoefficient distributions along a line (see right side) on the billet
The results shown here describe the local heat transfer coefficient across a stagnantbillet surface. However, during a spray forming experiment, the billet rotates around itsvertical axis. As temporal resolution of simulation models that calculate the temperaturedistribution within a spray formed billet in the spray phase is typically much lower than thetime increment of the billet rotation, spatial averaging of the heat transfer coefficient on thebillet surface is necessary (Schneider et al., 2001; Tillwick, 2000). First, a correlation forthe averaged heat transfer coefficient at a constant distance l at the billet top was developed.To calculate the averaged value α the local heat transfer coefficient at a constant distance lfrom the centre of the billet is:
α (l) =
n∑i=1
αi
n, (6.27)
where i stands for different rotation angles ϕ. In this case, �ϕ = 90◦ and ϕ1 = 0◦. At thecentre (l = 0 mm) the average value is constant by definition, because the location doesnot change with rotation angle. The local values just oscillate around the average valueat the other locations (l �= 0 mm) at the top of the billet. In the end, one only needs tomeasure a single position (l = 0 mm) to know the averaged value at all locations at the top.This means that the average heat transfer coefficient at the top of the billet only dependson the distance z and the gas mass flow of the nozzle MG . In principle, the convectiveheat transfer of a body in a gas stream depends on the gas velocity and its degree ofturbulence. Results of hot wire anemometry measurements in flowing gas around a billethave shown that the turbulence intensity Tu does not change significantly for the parameterrange investigated. Therefore, just the maximum velocity um at the centre of the jet and the jetvelocity half-radius r0.5 describe the flow field of the jet stream and the average heat transfercoefficient α at the top of the billet (100 < l < −100 mm) can be expressed by the following

200 Compaction
empirical correlation:
αtop
(W
m2 K
)= 16.2 · um
(m
s
)·√
r0.5 (m) + 165. (6.28)
This equation is limited to the boundary conditions and parameter ranges of Schneider et al.(2001): z = 0.4 to 0.5 m, MG = 0.2 to 0.29 kg/s, Tu ∼ 23%, nitrogen and a 30◦ spray angleto the billet. The average heat transfer coefficient at the side of the billet, for one revolution,correlated with the dimensionless height h/H (H = 400 mm) using an exponential function,where h/H = 0 is the top of the billet, and h/H = 1 is the bottom of the billet. The best fitwas obtained for the following correlation:
αjacket
(h
H
)= αtop e[0.85·( h
H )2−1.65·( hH )]. (6.29)
Further-refined results from measurements or simulations are necessary to derive moregeneral correlations for the local heat transfer behaviour in spray forming, e.g. in the formof a general Nusselt–Reynolds correlation.
Some general approaches for the overall convective heat transfer coefficient in sprayforming have been suggested. Mathur et al. (1989) derived a correlation of the Nusselt (Nu)number for convective heat transfer of a preform with respect to the velocity and thermalproperties of the impinging gas:
Nu = Pr0.42
(δ
R
)[(1 − 1.1
δ
R
)I
(1 + 1.1
z
δ − 6
δ
R
)]2Re0.5
× (1 + Re0.55/200)0.5. (6.30)
Here δ is the width of the gas jets at the nozzles, R is the radial distance from the centre-lineof the spray, z is the atomizer to substrate distance, Re is the gas Reynolds number and Prthe Prandtl number.
In another approach, Liang and Lavernia (1994) suggested a relationship for the Nusseltnumber as:
Nu = 1.2Re0.58
(z
d0
)−0.62
, (6.31)
where z is the distance from the gas noozles to the surface and d0 is the diameter of thenozzle.
6.3.7 Calculated model results for Gaussian deposit cooling
In the following, some thermal simulation results of the deposit/substrate will be discussed,where in the first sequence the heat contact coefficient for the deposit/substrate has notbeen taken into account. In Figure 6.33 the growth behaviour of a Gaussian-shaped depositsprayed on a substrate 20 cm in diameter, in a spray sequence of 30 s duration, is shown,together with the calculated temperature distribution. The spray formed material is steel.After 10 s spray time, the heat flux entering the substrate from the deposit has alreadyreached the lower side of the substrate. Therefore, for longer times the deposit does not act

201 6.3 Billet cooling
Table 6.3 Variation of parameters used in the thermalcalculation of deposit cooling
Substrate height h [m] 0.02/0.05Heat conductivity substrate λ [W/m K] 30/60Mean liquid content in spray fl [%] 0/50/100
temperature
[°C]
Fig. 6.33 Temperature distribution in the growing deposit and the underlying substrate: spray timemeasured in seconds (Zhang, 1994)
as a heat sink for the sprayed deposit, storing the thermal energy; now the lower side of thesubstrate takes place in the overall heat balance by convective cooling.
Four points in the substrate and in the boundary area between substrate and deposit havebeen chosen for quantitative companion of the simulation results with experimental values.The position of the points is indicated in Figure 6.34. These points have been selectedfor investigation of the heat contact resistance mechanisms because direct comparison toexperimental values has been achieved. Variation of the parameters in the calculations basedon the list in Table 6.3 has been done.
Results for simulations based on these parametric variations are illustrated in Figures 6.35to 6.40. In a first approach, two temporal stages need to be distinguished. Within the initial

202 Compaction
1
23
4
1,23,4
Fig. 6.34 Evaluated positions within deposit and substrate
0 5 10 15 20 25 30
spray time [s]
0100200300400500600700800900
100011001200
tem
pera
ture
[°C
]
P-1P-2P-3P-4
P-1P-2P-3P-4
Fig. 6.35 Temporal temperature distribution at points 1 to 4, fl = 0% (Zhang, 1994)
three seconds of spray time the temperature at the derived points in the deposit/substratearea increases rapidly, while with increasing spray time the temperature increases far moreslowly. The total spray time in the process is assumed to be 30 s in this case.
When the amount of liquid in the impinging spray is increased, as seen in Figures 6.35 to6.37 for 0 to 100% liquid, the temperatures at the points selected raise continuously. Alsothe gradients and the increase in temperature at the beginning of the spray phase increase.The calculated temperature difference between points P2 and P3 remains almost constantfor different values of the spray liquid contents calculated.
In the spray forming process, the materials of the sprayed particles and that of the substratemay not be identical, introducing an additional degree of freedom in process design. Thecooling of the lower deposit layers, for instance, for control of porosity in the bottom ofthe deposit, may be influenced by choosing the material of the substrate, as well as byintroducing additional cooling or heating facilities within the substrate. By accounting for

203 6.3 Billet cooling
0 5 10 15 20 25 30
spray time [s]
0
100
200
300
400
500
600
700
800
900
1000
1100
1200
P-1P-2P-3P-4
tem
pera
ture
[°C
]
P-1P-2P-3P-4
Fig. 6.36 Temporal temperature distribution at points 1 to 4, fl = 50% (Zhang, 1994)
0 5 10 15 20 25 30
spray time [s]
0
100
200
300
400
500
600
700
800
900
1000
1100
1200
P-1P-2P-3P-4
tem
pera
ture
[°C
]
P-1P-2P-3P-4
Fig. 6.37 Temporal temperature distribution at points 1 to 4, fl = 100% (Zhang, 1994)
the decreased heat conductivity of the substrate in Figure 6.38, heat flow into the substrateis decreased and, as a result, the temperature increase at the centre of the substrate P1 issmaller in comparison. Due to the same reason, the temperature increase in P4 is morepronounced. From this behaviour one can see that small changes and variations of thephysical properties of the substrate (as shown here for heat conductivity), may influence thetemperature distribution within the deposit. With variation of substrate height (thickness),as shown in Figure 6.39, the temperature of the substrate hardly increases during the initialspray phase (because heat flow from the deposit has not reached the bottom of the substrate).

204 Compaction
0 5 10 15 20 25 30
spray time [s]
0
100
200
300
400
500
600
700
800
900
1000
1100
1200
P-1P-2P-3P-4
tem
pera
ture
[°C
]
25 30
P-1P-2P-3P-4
Fig. 6.38 Temporal temperature distribution at points 1 to 4, λs = 30 W/m K (Zhang, 1994)
0 5 10 15 20 25 30
spray time [s]
0
100
200
300
400
500
600
700
800
900
1000
1100
1200
P-1P-2P-3P-4te
mpe
ratu
re[°
C]
P-1P-2P-3P-4
Fig. 6.39 Temporal temperature distribution at points 1 to 4 for a thick substrate (h = 50 mm) withfl = 50% (Zhang, 1994)
Here the dimension of the substrate may be referred as semi-infinite. At larger spray times,the thicker substrate results in somewhat decreased temperatures at the observed points.
Another point for discussion is shown in Figure 6.40. Here the position of the solidificationline after 30 s spray time is illustrated. Above the solidification line, the material is in amushy state of phase change and still contains some liquid melt. Below the solidificationline, the material is fully solidified. Obviously, alteration of the height of the substrate (to50 mm) only results in small changes in the position of the solidification line at the end ofthe spray process. But the thermal state of the impinging spray, in terms of liquid content

205 6.3 Billet cooling
radius [mm]
0
10
20
30
40
50
60
70
80
90
100
110
fl = 30%fl = 50%fl = 100%H = 50 mma = 0
fl
fl
fl
shape of deposit
Hs
radius [mm]
0
10
20
30
40
50
60
70
80
90
100
110
fl = 30%
= 50%
H = 50 mma = 0
fl
fl
Hs
00
110
100
90
80
70
60
50
40
30
20
10
2010 30 40 50 60 70 80 90 100
radius [mm]
posi
tion
of s
olid
ific
aion
fro
nt [
mm
]
fl = 100%
fl = 50%
fl = 30%
Hs = 50 mm
α = 0
Fig. 6.40 Position of the solidification front at the end of the spray phase (t = 30 s) (Zhang, 1994)
of the spray, has a severe influence on the already solidified volume at the end of the sprayphase.
The effect of thermal contact resistance between the deposit and the substrate will bediscussed next. Here a temperature jump in the contact layer results that influences tem-perature evaluation and distribution in the deposit. Especially for spray forming processesaimed at the product of large preforms of high volume (such as billets), additional conduc-tive cooling from the substrate is important. Figure 6.41 shows the developing contour ofa growing Gaussian preform, together with the surface temperature of the deposit in thespray phase and in the subsequent cooling phase. In Figure 6.41(a), the contour and surfacetemperature after 15 s spray time is illustrated.
The deposit contour and surface temperature at the end of the spray phase, i.e. after 30 s,are illustrated in Figure 6.41(b). At this time, spraying ends and the subsequent coolingperiod starts. The deposit contour does not change further, as can be seen in Figure 6.41(c).The surface temperature at this time is lower, as the deposit is cooled by the gas and by theheat flux into the substrate.
A two-dimensional cut through the deposit and the underlying substrate for the sameprocess conditions and times as in the previous figure is illustrated in Figure 6.42. Here,a temperature jump at the deposit/substrate interface due to thermal contact resistance isseen.
By evaluation of the calculated temperature distributions, identification of areas withinthe deposit is possible where, for longer spray times, high temperatures may occur. Sucha hot spot, as seen in Figure 6.42(c), may result from the rapidly cooled surface of the

206 Compaction
temperature [°C]
(c)
(b)
(a)
Fig. 6.41 Surface temperature for a growing deposit (Fritsching et al., 1997b)

207 6.3 Billet cooling
temperature [°C]
1500
1250
1000
750
500
250
0
Z–A
chse
[m
]0.10
0.12
0.08
0.06
0.04
0.02
0.00
–0.02–0.10 –0.05 0.00
X–Achse [m]0.05 0.10
(a)Z
–Ach
se [
m]
0.10
0.12
0.08
0.06
0.04
0.02
0.00
–0.02–0.10 –0.05 0.00
X–Achse [m]0.05 0.10
(c)
Z–A
chse
[m
]
0.12
0.10
0.08
0.06
0.04
0.02
0.00
–0.02–0.10 –0.05 0.00
X–Achse [m]
0.05 0.10
(b)
Fig. 6.42 Temperatures inside deposit and substrate (Fritsching et al., 1997b)

208 Compaction
1 1 1000
500
1000
1500
2000
Berechnungspun
tem
pera
ture
[°C
]
1000
500
1 100100
1500
2000
calculation point
time [s]
steel h = 20 mm
steel h = 50 mm
ceramic h = 15 mm
Fig. 6.43 Temperature distributions at a central point inside the deposit, taking into account the heatcontact coefficient. Material: steel C30 (Fritsching et al., 1997b)
deposit covering a hotter area beneath. These regions are extremely undesirable in sprayforming applications, as grain growth may occur here. In particular, problems may arise ifthe unsolidified hot spot occurs in a solidified solid shell. Here the difference in materialdensities may cause high yield stresses and even crack formation in the spray formedproduct.
Figure 6.43 shows the simulated temperature distribution at a certain point inside thedeposit (see sketch). Here the type of substrate material has been changed, altering calculatedboundary conditions, while maintaining constant spray process properties and conditions.From this figure it can be seen that the deposit cools most rapidly on the 50 mm steelsubstrate, while cooling of the deposit onto the ceramic substrate takes longest. A remarkabletemperature difference with substrate thickness is not observed in the initial spray phase,but after 30 s spray time, i.e. at the end of the spray phase, and from that point on duringcooling, a significant variation in temperature is observed.
6.3.8 Thermal simulation of billet geometry
For thermal simulation of a growing spray-deposited billet, a model and simulation programhas been developed by Meyer et al. (2000). Here, especially, realistic representation of thegeometry of a spray formed billet is intended for the spray phase and the subsequent cooling

209 6.3 Billet cooling
Table 6.4 Standard conditions for the simulation of a copper billet
parameter spray phase cooling phase
Convective heat transfer coefficient billet surface α [W/m2 K] 170 10Mean liquid content in compacting material fl [kg/kg] 0.5 —Mean temperature of compacting material T [◦C] 1028 —Temperature of gas in spray chamber Tg [◦C] 250 250Emissivity billet surface ε [-] 0.5 0.5Convective heat transfer coefficient at bottom of
substrate αs [W/m2 K]450 450
Initial substrate temperature Ts [◦C] 30 —Heat contact coefficient billet/substrate αct [W/m2 K] 1000 1000Time increment between adding of layer �t [s] 4.67 —
phase. The program enables the flexible inclusion of different billet-shaped geometries.Calculation of the thermal behaviour of the billet is based on the (aforementioned) solutionof the transient heat conduction problem including phase change within the billet contour.The formulation of the energy equation is single phased (fluid and solid are described by asingle equation). Modelling of the solidification process is based on an appropriate sourceterm (Voller et al., 1990, 1991). The spray impinging onto the deposit surface consists ofsolid, semi-solid and liquid particles. During the impingement process, the top layer of thedeposit will be created, which is a mixture of fluid and solid material (i.e. a mixing zone ormushy layer).
For the simulation results presented here, the grid system shown on the left-hand sideof Figure 6.29 is used. Realization of the grid is based on the outcome of the geometrymodel introduced in Section 6.2, and aims to reflect a real billet. Therefore, direct com-parison between simulated results and actual temperature measurements, which have beenperformed during a specific spray run, is possible. The conditions of the spray formingprocess are listed in Table 6.4. The calculations and the experiment are performed forCuSn6.
Until the end of the spray period (which is 360 s in this process run) the height of thebillet is steadily increasing. The calculated distribution of the isotherms within the billetis illustrated at a time within the spray phase and at a time within the subsequent coolingphase in Figure 6.44. The temperature level is quite high, and is to be related to the assumedboundary conditions. Here the liquid content of the impinging spray is taken as 50%. Afterthe end of the spray phase, the billet cools down and the liquid material remaining in thebillet also solidifies. As the copper material used in this spray run has comparably high heatconductivity, the temperature gradients in the billet, from the top to the bottom of the billet,as well as in radial direction from the centre to the outer edge of the billet, are not very wellpronounced. The highest temperature differences are located near the bottom of the billetin the initial phase of the spray run. In the upper part of the billet the temperature gradientsare lowest until the end of the spray phase is approached. This may be due to the remaininglatent heat within the billet head in the mushy zone at the top of the billet.

210 Compaction
0 r-Achse [mm]
51 s
972 °C
918 °C
864 °C
810 °C
756 °C
623 °C
360 s
918 °C
864 °C
810 °C
756 °C
588 °C
600 s
radius [mm]
heig
ht[m
m]
radius [mm]
Substrate
1000
0
−20
305
heig
ht [
mm
]
972 °C
918 °C440 °C
Fig. 6.44 Thermal simulation of a growing billet (Meyer et al., 2000). Left: grid structure. Right:temperature distribution at certain time levels
Comparison of the simulation results based on the chosen boundary conditions showsgood agreement with experimental results, as can be seen in Figure 6.45. To allow a directcomparison, the evaluation positions are identical. At the end of the spraying time, thesimulation results indicate a more rapid temperature decrease at the bottom of the billetthan shown by the measurements. This difference indicates that in the experimental sprayrun, after the spray phase, less heat has been transferred across the billet surface thanindicated by the simulation results. Here the chosen boundary conditions must be checkedagain and more closely adapted to the experimental process conditions.
One can divide into two categories those boundary and initial conditions that directlyinfluence the thermal distribution in the billet:
� those boundary conditions that can be freely chosen, and� those coupled parameters that may only be changed in conjunction with other parameters.
Within the first group, the most important parameters are: the entrained heat flux from thespray into the billet and the heat transfer across the billet surface to the gas by convection.These parameters are directly coupled (within the spray phase). Both heat flow rates aredirectly determined by the atomization parameters of the process. Here, for example, thelocal distribution of the mass fluxes in the spray, as well as the specific energy content ofthe spray particles, depend on the GMR (gas to metal flow rate ratio) and other atomizationparameters. In the same way, heat transfer to the gas (and therefore the gas temperature in

211 6.3 Billet cooling
5
time [s]
time [s]
tem
pera
ture
[°C
]te
mpe
ratu
re [
°C]
T5
T5
T1
T1
T2
T2
T1
T1
3030
T5
T5
T4
T4
T3
T3
35
35
60
60
T4
T4
T3
T3
T2
T2
1000Ts900
800
700
600
500
1000Ts900
800
700
600
500
0 100 200
time [s]
time [s]
300 400 500 600
0 100 200 300 400 500 600
51
1
Fig. 6.45 Measured (top) and calculated (bottom) temperature distribution in a CuSn6 billet (Meyeret al., 2000)
the process) and the mean gas velocity around the billet are changed. This couples directlywith the heat transfer rate from the billet surface in the spray phase. The same is valid forthe heat contact coefficient between billet and deposit. This parameter is mainly influencedby the surface condition of the substrate, the thermal conditions in the spray and in thesubstrate and, in addition, by the material used in the process.
When the fluid content of the spray is increased, the simulation results in Figure 6.46indicate a strong increase in the amount of liquid remaining in the billet. Until the end ofthe spray phase, at t = 360 s, the liquid mass in the billet increases steadily. From thissimulation it is to be seen that, for the chosen boundary conditions of the spray, steady-state thermal conditions within the growing billet during the spray phase are not achieved,though the geometric shape grows steadily. The thermal conditions in the top of the billetchanges throughout the spray process. This may result in changing product quality ormaterial conditions depending on the height of the billet. At the end of the spray phase, therest of the liquid in the billet solidifies. The time to complete solidification depends on theremaining quantity of liquid melt in the billet. For an assumed fluid content of 10% withinthe spray, the melt impinging on the billet immediately solidifies at a time increment lowerthan the resolution time scale of the growing grid system; the mushy zone is less thick

212 Compaction
0
2
6
8
0 100 200 300 400 500 600 700 800
fl = 0.5
fl = 0.4
fl = 0.3
fl = 0.2
fl = 0.14
Bolzen
time [s]
amou
nt o
f m
elt [
kg]
mixing layer
billet
Fig. 6.46 Remaining melt content of the mixing layer (mushy zone), dependent on the liquid contentof the spray (Meyer et al., 2000)
Bolzen
Mixschicht
0
2
4
6
8
10
12
0 100 200 300 400 500 600 700Zeit [s]
α = 100 W/m2 Kα = 10 W/m2 K
α = 200 W/m2 K
α = 300 W/m2 K
α = 400 W/m2 K
amou
nt o
f m
elt [
kg]
time [s]
mixing layer
billet
Fig. 6.47 Mass of remaining liquid melt in the mixing layer of a CuSn6 billet for different values ofthe heat transfer coefficient (Meyer et al., 2000)
than the grid layer. Therefore, each top layer is completely solidified before a new layer ofmaterial is added in the simulation. The calculated liquid mass remaining in the billet iszero at all times.
The influence of the heat transfer coefficient on the remaining liquid mass in the billetis seen in Figure 6.47. Assuming different values for the heat transfer coefficient from thebillet to the gas within the spray phase, an increasing value of the heat transfer coefficientresults in a decreased amount of melt in the billet. By reducing the heat transfer coefficient,less heat is transferred into the gas and the total thermal energy content of the billet is raised.The simulation results indicate the range within which the gas heat transfer coefficient maybe varied in order to control the amount of liquid mass in the billet and the thickness of themushy zone. For an assumed heat transfer coefficient of 400 W/m2 K (standard parameter)during the spray phase, the change in liquid mass in the billet is smaller than for a lower heattransfer coefficient of 100 W/m2 K. At the beginning of the spray phase, the liquid contentin the billet increases rapidly, and after approximately 120 s the increase in liquid mass issomewhat slower. The change in thermal conditions, which have been achieved by meansof the changing heat transfer coefficient, may be achieved in a similar way by altering the

213 6.3 Billet cooling
gas temperature of the environment. As the simulation results indicate, the remaining meltin the billet can be controlled by the operational conditions.
6.3.9 Modification of thermal boundary conditions
Cui et al. (2003) have investigated the potential of spray forming as an alternative to conven-tional casting to minimize possible distortion of steel ball bearing rings during production.In order to do this, homogeneous 100Cr6 steel billets were spray formed with a uniquecooling control system. The purpose of the investigation was to control the cooling andsolidification behaviour of the deposit more freely. The distribution of the radial thermalprofile of the deposit was expected to be more uniform, and a more homogeneous structureachieved. Effects from the following were investigated:
� heating from a furnace around the billet in the spray and cooling phase,� and/or gas cooling at the bottom of the substrate,� application of gas flow behaviour inside the furnace on the deposit.
Heat flux modelling was based on the Fourier transport equation and was coupled with thetime-dependent geometry of the growing billet, where a perfectly cylindrical-shaped billethas been assumed.
The atomizing gas temperature and the temperature of the spray-chamber wall wereassumed to be constant at 250 ◦C during spray forming and subsequent cooling process.The initial temperature of the low carbon steel substrate was set as 30 ◦C. In Cui et al.’s(2003) model, an average enthalpy method was used, which assumed that the impinginglayer had a uniform enthalpy all over the deposit surface. The convective heat transfer coeffi-cient was set as 170 W/m2 K for standard spray forming conditions. At the end of the sprayphase of the melt, the heat transfer coefficient diminished sharply since no additional atomi-zing gas was sprayed towards the billet. Here the value of 10 W/m2 K has been taken forcalculation for the cooling stage of the billet. The contact heat transfer coefficient (resis-tance coefficient) between the billet and the substrate was estimated to be 1000 W/m2 K.The radiative heat transfer emissivity was taken as ε = 0.5 for the computation.
In order to reveal the effects of the heat transfer boundary conditions on the thermalprofiles of the spray formed billet, numerical simulation was carried out for side heating,bottom cooling and side isolating (parameters are listed in Table 6.5). In the case of sideheating, a furnace was installed around the deposit, and the inside wall temperature of thefurnace was set to 1000 ◦C. For bottom cooling, a gas jet was sprayed onto the bottomsurface of substrate to cool it intensively. As for side isolating, the heat transfer coefficientbetween the deposit and the side of the substrate was reduced to 10 W/m2 K as a result ofprotection of the deposit from the atomizing gas flow due to the presence of a shelter (e.g.the furnace around the deposit). In the last case, the combined effect of side heating, bottomcooling and isolation is considered for calculation.
Thermal profiles of the spray formed bearing steel billet were first numerically simulatedfor the standard spray forming conditions defined in Table 6.5. Figure 6.48 shows thecalculated temperature fields and distribution of the residual liquid fraction within the billet

214 Compaction
Table 6.5 Thermal boundary conditions for numerical simulation with thermal variations of billetheating/cooling (Cui et al., 2003)
temperature of chamberwall, Twall [◦C]
heat transfer coefficient atdeposit and side ofsubstrate, αg [W/m2 K]
heat transfer coefficient atthe bottom surface ofsubstrate, αbottom [W/m2 K]
boundary condition deposition post-deposition deposition post-deposition deposition post-deposition
(a) standard 250 250 170 10 170 10(b) side heating 1000 1000 170 10 170 10(c) bottom cooling 250 250 170 10 500 500(d) side isolating 250 250 10 10 170 10(e) (b) + (c) + (d) 1000 1000 10 10 500 500
0.35
0.3
0.25
0.2
0.15
0.1
0.05
0.05
fl = 0.1 fl = 0.01
−0.05
0
0.35
0.3
0.25
0.2
0.15
0.1
0.05
−0.05
0
0 0.1
10 s
radius [m] radius [m]radius [m]radius [m]radius [m]
0.050 0.1
heig
ht [
m]
heig
ht [
m]
heig
ht [
m]
heig
ht [
m]
heig
ht [
m]
0.35
0.3
0.25
0.2
0.15
0.1
0.05
−0.05
0
0.050 0.1
0.35250 s200 s100 s
0.3
0.25
0.2
0.15
0.1
0.05
−0.05
0
0.050 0.1
0.35
0.3
0.25
0.2
0.15
0.1
0.05
−0.05
0
0.050 0.1
1300
1200
1100
1000
900
800
700
600
fl = 0.2
fl = 0.01
fl = 0.2
fl = 0.1
fl = 0.25 fl = 0.27
fl = 0.01
fl = 0.02
fl = 0.3
fl = 0.2
fl = 0.01
350 s
fl = 0.25
Fig. 6.48 Calculated temperature and distribution of residual liquid fraction in a cylindrical depositand substrate during spray forming (Cui et al., 2003)
at different spraying times. At the beginning of deposition, the material is almost completelysolidified due to the chilling effect of the cold substrate. The overall temperature field andlocal liquid fraction in the billet increase as the billet grows, i.e. the thickness of the totalliquid mass or mushy zone at the top of the billet increases as well. At the end of thespray phase (here t = 200 s), the highest residual liquid fraction reaches approximately0.3. Because of the low thermal conductivity of the 100Cr6 bearing steel, the temperaturedifference between the billet top and bottom, as well as along the radius, is relatively high.Even when the convective heat transfer coefficient drops sharply at the end of spraying, anuneven radial temperature distribution is still expected.
The local solidification time has been used to demonstrate the cooling and solidificationbehaviour of the deposit, because the solidification microstructure is largely dependent onthis profile. As shown in Figure 6.49, isochronous solidification lines are plotted for thedeposit from 10 to 300 s. These lines indicate when and where the solidification processwill finish within the deposit. The longer the solidification time, the lower the cooling

215 6.3 Billet cooling
0.35
0.3
0.25
0.2
0.15
0.1
0.05
0
−0.05
0.35
0.3
0.25
0.2
0.15
0.1
0.05
0
−0.05
0.35
0.3
0.25
0.2
0.15
0.1
0.05
0
−0.05
0.35
0.3
0.25
0.2
0.15
0.1
0.05
0
−0.05
0.35
0.3
0.25
0.2
0.15
0.1
0.05
0
−0.050.10 0.10 0.05 0.10 0.05 0.10 0.05 0.10
radius [m] radius [m] radius [m] radius [m] radius [m]
heig
ht [
m]
heig
ht [
m]
heig
ht [
m]
heig
ht [
m]
(a)400
350
300
250
200
150
100
50
0
400
350
300
250
200
150
100
50
0
400
350
300
250
200
150
100
50
0
400
350
300
250
200
150
100
50
0
400
350
300
250
200
150
100
50
0
(b) (c)(a) (d) (e)
0.05 0.05
heig
ht [
m]
Fig. 6.49 Local solidification time of spray formed 100Cr6 billet under various boundary conditions:(a) standard, (b) side heating, (c) bottom cooling, (d) side isolating and (e) (b) + (c) + (d) (Cui et al.,2003)
and solidification rates. As mentioned before, porosity at the periphery of a spray formedbillet is always a problem, due to rapid cooling of the depositing material in that area. Ifthe local solidification time in the periphery can be prolonged, it would favour eliminationof this shrinkage porosity. Figure 6.49(b) shows the solidification profile of deposit duringside heating, where a heating device at high temperature is placed around the deposit. It canbe seen that all isochronous lines move to the right, showing that it takes a longer time forthe deposit to solidify. For bottom cooling, see Figure 6.49(c), no evident change in the plotcan be found compared to the standard case, Figure 6.49(a), due to the low conductivityof the steel substrate and the limited thermal influence. As the deposit is isolated from theatomizing gas jet, the convective heat transfer coefficient will decrease markedly, resultingin less heat transfer from the side of the deposit to the gaseous environment. Accordingly,the isochronal lines in Figure 6.49(d) move to the right as well. When the effects of sideheating, bottom cooling and isolation are combined, a much greater change in the localsolidification time of the deposit is noticed, as can be seen in Figure 6.49(e). As discoveredfrom detailed calculation of the local solidification time, fast cooling and solidification ofthe billet at the periphery, with respect to standard processing conditions, can modify thethermal boundary conditions.
The effect of control of cooling on the thermal profiles of the billet is also reflected inthe heat flows at the surface of deposit; as shown in Figure 6.50, for different modes anddirections. For the standard spray condition, Figure 6.50(a), heat flow by convection at thebottom of the deposit is very large because of the chilling effect of the cold substrate atthe beginning of deposition. With on-going deposition, the substrate temperature increasesrapidly, causing the heat flow to decrease quickly. Flow of heat from the side of the depositby gas convection and radiation increases nearly linearly as the deposit grows. The heat flowreleased from the top surface of the deposit maintains a relatively stable value during thespray period because the temperature here normally remains constant due to the continuousspraying of additional droplets. At the end of the spray phase, due to convection at the top andside of the deposit, the flow of heat drops dramatically as atomization has stopped. Radiativeheat transfer from the side and top of the billet, as well as heat flow at the deposit/substrate

216 Compaction
0
5000
10000
15000
20000
25000
30000
35000
40000
0 100 200 300 400
time [s]
heat
flo
w [
W]
1 - top convection
2 - top radiation
3 - side convection
4 - side radiation
5 - bottom convection
0
5000
10000
15000
20000
25000
30000
35000
40000
0 100 200 300 400
time [s]
heat
flo
w [
W]
1 - top convection
2 - top radiation3 - side convection
4 - side radiation5 - bottom convection6 - bottom radiation
12
3
4
5
1
2
3
4
5
Fig. 6.50 Heat flow at the surface of a cylindrical deposit in various modes and directions in sprayand cooling phases (Cui et al., 2003)
interface, also decrease gradually since the temperature of the billet decreases during thesubsequent cooling period. Thus, by controlling the cooling conditions, Figure 6.50(b), i.e.involving side heating from the furnace, bottom cooling by the gas and reduced gas flowat the side of the deposit, convective heat flow from the side of the deposit and radiativeheat transfer are greatly diminished. The flow of heat from the bottom of the deposit tothe substrate is elevated owing to enhanced gas cooling of substrate, but this effect is notvery significant. No visible change is found in the heat flow from the top surface of depositbecause the heat transfer boundary condition has not been modified here.
Computation and analysis have shown that for this case of ball bearing steel spray formingit is quite difficult to obtain an absolutely uniform thermal profile along the radius of thebillet because of (1) existing heat flows at the free surface of the deposit and (2) low heatconductivity of the steel. Nevertheless, control of cooling and solidification of the deposit,especially at its peripheries, could be affected to some extent by adjusting the boundaryconditions of heat transfer.
Thermal simulation of a growing spray formed billet within so-called ‘clean’ sprayforming process (Carter et al., 1999) has been performed by Minisandram et al. (2000).The term ‘clean’ represents a process where the melt, during heating and delivery, has nocontact with ceramic or metallic elements. Therefore, the final product is not contaminatedby ceramic or metallic inclusions. This is an important condition especially for superalloyspray forming, e.g. for turbine component (rings) production. Simulation of the overallthermal process for billet production has been divided into several steps/models:
(1) a spray model (axisymmetric, including thermal and momentum coupling);(2) a geometry model (including an experimentally determined compaction rate);(3) a thermal billet model, subdivided into two separate spatial regions:
(3a) a billet surface model,(3b) a full billet model.
The surface model describes the thermal conditions only at the surface of the growing bil-let during the spray phase. The impinging spray is resolved in time and space (scanning
217 6.3 Billet cooling
Fig. 6.51 Thickness of the sprayed layer at the billet surface for one revolution of the billet(Minisandram et al., 2000)
mechanism), also rotation of the billet is accounted for. From this model the surface temper-ature as well as the averaged (mean value, averaged for circumference of the billet surface)coefficients for convective and radiative heat transfer at the billet surface are derived. Themain assumption of the surface model is that heat transport in the plane of the billet surfacecan be neglected compared to transport normal to the surface. Therefore, the heat balancefor the deposited layer is derived independently for every part of the surface. The energybalance of the growing layer includes heat losses by convection and radiation as well as byconduction to the underlying layer. Enthalpy is introduced via the spray from above. Thebase temperature of each surface element is the corresponding temperature value of thebillet taken from the full billet model at the end of the preceding time step. Time resolutionis sufficient to resolve the actual scanning motion of the atomizer and the rotation frequencyof the billet. Evaluation of the surface temperature within the surface model is combinedwith the axisymmetric model of the whole billet for derivation of the thermal behaviour ofthe growing billet within the spray phase.
Figures 6.51 and 6.52 illustrate the results of the surface model for the first macro timestep for one revolution of the billet. Shown are the variation of billet height (thickness ofthe sprayed layer), Figure 6.51, and the distribution of the surface temperature, Figure 6.52.At the first time step, the spray impinges onto a plane surface of constant temperature. Theend of this first time phase has been chosen here in order to visualize the results clearly.The leaf-shaped structure of the sprayed layer corresponds with the scanning motion of

218 Compaction
Fig. 6.52 Temperature in the sprayed layer at the billet surface for one revolution of the billet(Minisandram et al., 2000)
the atomizer and the rotational motion of the billet. The temperature distribution illustratesthat the temperature in the last sprayed layer is highest and decreases as the spray movesacross the billet surface.
6.4 Material properties
Numerical models and simulations have been introduced into almost all engineering disci-plines. Classical materials science and materials technology models may contribute to the

219 6.4 Material properties
development of spray forming processes, predicting a priori from prescribed processes andboundary conditions, the main material properties of spray formed products.
Boundary and initial conditions for material analysis and simulation during spray formingmay be derived from the submodels aforementioned for the analysis of impacting particlesand the thermal state of the deposit. Thermal conditions and local cooling behaviour mainlyinfluence the material properties, as well as related properties such as grain size, porositydistribution or residual stresses.
6.4.1 Residual stress modelling
Kienzler and Schroder (1997) investigated the characteristic quantities of the material bymodelling within spray forming. Input models for their calculations of the residual stressand porosity distribution of spray formed deposits are appropriate material and damagemodels. The residual stress calculations used are tailored for specific materials or groupsof materials. In order to qualify for inclusion in their models, the materials selected mustbe describable in terms of the following phenomena:
� plasticity and viscoplasticity,� creep and relaxation behaviour.
In a general material model, some parameters for that specific material used need to beintroduced, which may be derived from experimental data. Complete sets of parametersare available only for a limited number of materials. Kienzler and Schroder (1997) haveincorporated such material models into a commercial finite element simulation code andused this to calculate the material properties in two-dimensional spray formed Gaussian-and billet-shaped preform deposits.
Figure 6.53 shows the calculated distribution of residual stresses and the distribution ofthe circumferential stress after spraying and cooling of the material to room temperature.This calculation has been performed for a Gaussian-shaped deposit. The material underinvestigation is a nickel-based alloy IN738LC. In the core of the deposit, tensile stresses areto be seen; while in the outer regions of the deposit, compressive stresses are found. Thesestress distributions result from the growth and cooling conditions of the sprayed deposit.The outer area of the deposit cools down faster than the core due to convective and radiativeheat transfer from the surface of the deposit. This behaviour results in strain impedimentsthat are reflected in the calculated stress distribution in the deposit.
6.4.2 Macro- and micopore formation
Problems in spray forming may arise from gas pores remaining in the preform. These mayoccur, for example, due to gas entrapment (too hot a spraying condition) or insufficientliquid content in the spray (too cold a spraying condition). The possible formation ofmacro- and micropores in spray formed deposits has been investigated during modellingof the spray process of a liquid metal, which solidifies at an arbitrary surface, during the
220 Compaction
[MPa]
z
rϕ
σϕϕ
σϕϕ
σ ϕϕ
1
2
3
4
5
−250
−200
−150
−100
−50 0
50
100
150
200
−450
−400
−350
−300
−500
Fig. 6.53 Calculated residual stress distribution (circumferential stress) of a spray formed depositof Gaussian shape (Kienzler and Schroder, 1997)
geometric simulation of Djuric and coworkers (1999, 2001). Results of their modellingduring simulated notch filling have been discussed in Section 6.2.
6.4.3 Porosity model
As pointed out, for example, by Cai and Lavernia (1997), the retention of some porosity isinevitable in spray formed materials. Typically, zero or low porosity (<1%) is found overa large area of the core of spray formed preforms, but the porosity level may increase up to10% within the surface area of the preform. From a quality point of view, the porosity inspray deposited materials yields two problems. First, material properties may degrade dueto the presence of pores. Second, secondary working (such as extrusion, rolling, forgingand HIPing) is necessary to achieve full density, which in turn limits the suitability of sprayforming as a near-net shape manufacturing process. Consequently, research and modellingefforts have been initiated in spray forming to understand the formation mechanisms ofporosity formation better and to determine ways to decrease the porosity level either byadjusting the process parameters or by exploring alternative approaches.
The total porosity in an as-deposited material in spray forming can be described as thesum of:
� porosity from gas entrapment,� interstitial porosity,� porosity associated with shrinkage during solidification.
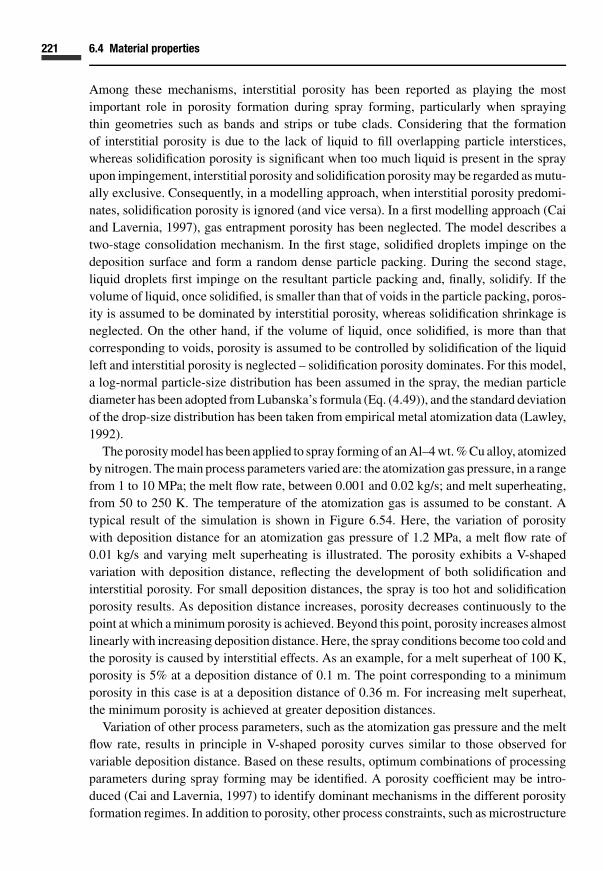
221 6.4 Material properties
Among these mechanisms, interstitial porosity has been reported as playing the mostimportant role in porosity formation during spray forming, particularly when sprayingthin geometries such as bands and strips or tube clads. Considering that the formationof interstitial porosity is due to the lack of liquid to fill overlapping particle interstices,whereas solidification porosity is significant when too much liquid is present in the sprayupon impingement, interstitial porosity and solidification porosity may be regarded as mutu-ally exclusive. Consequently, in a modelling approach, when interstitial porosity predomi-nates, solidification porosity is ignored (and vice versa). In a first modelling approach (Caiand Lavernia, 1997), gas entrapment porosity has been neglected. The model describes atwo-stage consolidation mechanism. In the first stage, solidified droplets impinge on thedeposition surface and form a random dense particle packing. During the second stage,liquid droplets first impinge on the resultant particle packing and, finally, solidify. If thevolume of liquid, once solidified, is smaller than that of voids in the particle packing, poros-ity is assumed to be dominated by interstitial porosity, whereas solidification shrinkage isneglected. On the other hand, if the volume of liquid, once solidified, is more than thatcorresponding to voids, porosity is assumed to be controlled by solidification of the liquidleft and interstitial porosity is neglected – solidification porosity dominates. For this model,a log-normal particle-size distribution has been assumed in the spray, the median particlediameter has been adopted from Lubanska’s formula (Eq. (4.49)), and the standard deviationof the drop-size distribution has been taken from empirical metal atomization data (Lawley,1992).
The porosity model has been applied to spray forming of an Al–4 wt. % Cu alloy, atomizedby nitrogen. The main process parameters varied are: the atomization gas pressure, in a rangefrom 1 to 10 MPa; the melt flow rate, between 0.001 and 0.02 kg/s; and melt superheating,from 50 to 250 K. The temperature of the atomization gas is assumed to be constant. Atypical result of the simulation is shown in Figure 6.54. Here, the variation of porositywith deposition distance for an atomization gas pressure of 1.2 MPa, a melt flow rate of0.01 kg/s and varying melt superheating is illustrated. The porosity exhibits a V-shapedvariation with deposition distance, reflecting the development of both solidification andinterstitial porosity. For small deposition distances, the spray is too hot and solidificationporosity results. As deposition distance increases, porosity decreases continuously to thepoint at which a minimum porosity is achieved. Beyond this point, porosity increases almostlinearly with increasing deposition distance. Here, the spray conditions become too cold andthe porosity is caused by interstitial effects. As an example, for a melt superheat of 100 K,porosity is 5% at a deposition distance of 0.1 m. The point corresponding to a minimumporosity in this case is at a deposition distance of 0.36 m. For increasing melt superheat,the minimum porosity is achieved at greater deposition distances.
Variation of other process parameters, such as the atomization gas pressure and the meltflow rate, results in principle in V-shaped porosity curves similar to those observed forvariable deposition distance. Based on these results, optimum combinations of processingparameters during spray forming may be identified. A porosity coefficient may be intro-duced (Cai and Lavernia, 1997) to identify dominant mechanisms in the different porosityformation regimes. In addition to porosity, other process constraints, such as microstructure

222 Compaction
P = 1.2 MPaMFR = 0.01 kg/s
14
12
10
8
6
0.1 0.2 0.3 0.4 0.5 0.6 0.7
50
100
150
250
200
4
2
0
poro
sity
[%]
superheat [K]
deposition distance [m]
Fig. 6.54 Porosity as a function of deposition distance for an atomization gas pressure of 1.2 MPaand a melt flow rate of 0.01 kg/s for Al–4 wt. % Cu (Cai and Lavernia, 1997)
as well as process economy, have to be taken into consideration to find a set of suitablespray forming process conditions.
Cai and Lavernia’s (1997) model of porosity formation during spray forming only takesspray conditions into account. To develop the model further, the influence of the state ofthe deposit surface on porosity has to be taken into account. This may be achieved bycontrolling the surface temperature of the deposit, which severely affects the porosity aswell as the particle sticking efficiency (Buchholz, 2002).
6.4.4 Microstructure modelling and material properties
One of the main advantages of spray formed materials is the associated equiaxed fine grainsizes and refined microstructure typically to be found. Typical microstructure features ofcast materials, such as large columnar grains and the presence of dendrites, may be reducedor eliminated within spray deposition processes. On the other hand, spray formed materialsoften tend to exhibit greater porosity than found in cast materials. Post-treatment processes(a machining process or heat treatment) are therefore a necessity during spray forming toreduce the porosity level. However, concurrent and additional heat treatment at sufficientlyhigh temperatures may result in undesired grain growth. Therefore, the properties of sprayformed materials also need to be described after post-processing as well as in the as-sprayedcondition.

223 6.4 Material properties
A review of microstructural properties of droplet-based manufacturing processes hasbeen given by Armster et al. (2002), who found that four primary factors contribute tosmall grain sizes and grain refinement in solidifying metal materials:
� high cooling rates of the melt,� high undercooling prior to nucleation,� the presence or absence of impurities and secondary nuclei in the melt,� fragmentation of formerly grown dendrites.
To build a certain lattice arrangement during phase change, two conditions must be fulfilled:melt elements need to have a certain amount of time and a certain amount of free energy. Forrapidly cooled particles within spray processes, the time for ordering of atoms is quite lowand the free path length for single atoms is minimized. Thereby a number of regular-shapedgrains or clusters are formed at sizes that are inversely proportional to the element coolingrate. At low cooling rates, the short-range order gives way to preferred growth directionsin the melt, resulting in the formation of large grains. Also, increased time for coolingenables simultaneous precipitation of chemical phases and the formation of larger grains.In addition, extended grain growth depends upon the presence of heterogeneous nucleationcentres, e.g. from impurities in the melt. Such heterogeneous nuclei may congregate at thegrain boundaries, thereby reducing the interfacial energy between grains and retarding graingrowth. In spray deposition processes, this means, for example, that the concentration ofreactive elements in the processing gas may also be used to control grain refinement andgrain growth. Finally, possible fragmentation of dendrites during droplet impact, causedby fluid motion within the droplet, may also contribute to the final formation of smallgrains.
Investigations concerning the relationship between processing parameters and grain sizeand refinement in metal spray deposition processes are mainly performed within single-dropexperiments or within specific spray deposition arrangements (see, for example, Norman etal. (1998); Passow et al. (1993); Schmaltz and Amon (1995)). The usefulness of microstruc-ture selection maps and the derivation of empirical correlations between microstructure,droplet undercooling and material composition in industrial droplet-based manufacturingprocesses has been investigated by Norman et al. (1998) employing single-drop experiments,for example, from drop tubes and drop levitation and spray deposition. By comparing theachievable undercooling in well-controlled experiments of relatively large levitated droplets(several millimetres) and correlating the microstructure to spray-process-related drop sizesin the micrometre range, these authors have shown that nucleation is a reasonably well-behaved function of drop diameter. Results for levitated droplets show that typical bands ofgrain refinement exist at high and low undercooling rates as well. Within the middle rangeof moderate undercooling, the primary microstructure is coarse grained and dendritic. Thisresult is shown in Figure 6.55 for Ni–Cu droplets at various mixture concentrations. How-ever, the grain morphology is quite different for low and high undercooling rates. For thelow undercooling regime, the microstructure consists largely of fragmented dendrites. Atthe high undercooling regime, larger equiaxed grains are observed. Therefore, two differentrefinement processes may be distinguished for low and high undercooling rates. For Ni–Cu

224 Compaction
250
200
150
100
50
00 20 40 60 80 100
Ni composition [at. % Cu] Cu
unde
rcoo
ling
∆T [
K] grain refined
coarse grained
grain refined
T2
•∆
T1
•∆
Fig. 6.55 Experimental microstructure selection map for Ni–Cu particles dependent on undercooling:from levitation experiment (Norman et al., 1998)
800
700
600
500
400
300
200
100
drop
let s
ize
[µm
]
20 40 60 80 CuNicomposition [at. % Cu]
predominantly dendriticpredominantly grain refined at high undercooling ratepredominantly grain refined at low undercooling ratemixture of grain refined at high and low undercooling ratesmixture of dendritic and grain refined (high and low)
Fig. 6.56 Microstructure predominance map for Ni–Cu droplets produced from drop tube andatomization experiments (Norman et al., 1998)
droplets in the size range up to 800 �m (from drop tube and atomization experiments)refinement is inversely proportional to droplet size, which implies that the amount ofundercooling increases for the smallest droplets, as shown in Figure 6.56. The larger droplets(above 600 �m) predominantly show dendritic microstructures. The smaller droplets(below 250 �m) exhibit a grain-refined microstructure and the medium-sized droplets (250

225 6.4 Material properties
solid fragment growth by solidification
liquid melt
solid
central distances
xs,i (t)
xs,i (t + ∆t)
Fig. 6.57 Solidification model inside a volume element in the mixing layer: temporal change ofdistance between the solidification fronts (two-dimensional representation) (Bergmann, 2000)
to 600 �m) show a transitional combination of dendritic and refined microstructure. Suchmicrostructural predominance maps are available only for a very limited number of alloys,but may be used for incorporation into a coupled model of final microstructure analysiswithin spray forming.
6.4.5 Grain-size modelling in spray forming
A model for the factors controlling spray formed grain sizes has been presented by Grant(1998) and has been continued, for example, by Bergmann (2002) to analyse grain forma-tion and final grain sizes within spray formed preforms of copper and steel. Because of thedispersed character of the mixing layer at the top of a spray formed specimen duringthe spray phase, no well-defined solidification front exists in this area. The materialsolidifies from the surface of a solid particle (or fragment) in all directions (as illustrated inFigure 6.57) until the individual solidification fronts approach each other and mergetogether. For analysis of this process, a mean distance xs between solid particles, surroundedby liquid melt, within the mixing layer is defined, dependent on the spray properties and thelocal fraction of solids. During solidification in the mixing layer, the solidifying materialaccreted at the surface of the already solid fragments. Based on the following assumptions:
� the solid fragments in the mixing layer are initially almost spherical,� the initial solid fragments are equally distributed within this zone, and� the densities of solid and liquid are almost identical,

226 Compaction
the mean distance xs between solid fragments can be described as:
xs = 2
3
1 − fs
fsd ′
3.2. (6.32)
The derived Sauter mean diameter d′3.2 describes the particle-size distribution of the solid
fragments immediately after compaction in the top zone of the mixing layer. FollowingGrant’s (1998) proposal, this particle-size distribution is mainly influenced by:
� the original particle-size distribution in the spray,� the mean local solid fraction of impinging particles fs,0(r ),� the critical impact particle diameter dcrit (all particles smaller than this diameter will
be deflected by the gas and will not be deposited – they contribute to the aerodynamicoverspray (Kramer et al., 1997)), and
� the number of solid fragments resulting from each impacting particle (partially or fullysolidified particles which may be fragmented during impact).
The resulting solid fragment mean diameter in the mixing layer from an individual particleimpacting at the top of the deposit is described (Grant, 1998) as:
d0 =3√
fs,0(r )D(dp) d3p
G(dp). (6.33)
The function D(dp) is a binary switch function, where D = 0 if dp is smaller than the criticalimpact diameter (∼10 �m), otherwise D = 1. The parameter G(dp) describes the numberof solid fragments resulting from the impact of a dp-sized particle onto the deposit surface(fragmentation rate). For G(dp) a functional behaviour is suggested, where for a (sprayforming typical mean) particle diameter of dp = 100 �m in the spray, a maximum value of10 is proposed and decreasing values for bigger and smaller particles. A minimum value of 1is achieved for dp = 50 �m (and smaller) and dp = 200 �m (and bigger). For simplificationof the model it has been assumed that all particles (regardless of size) are compacting andthat the particle-size distribution in the spray is not a function of the local (radial) positionand corresponds to the totally averaged particle-size distribution. Therefore, D(dp) = 1 and:
d0 =3√
fs,0(r )
G(dp)dp. (6.34)
If a constant value for G(dp) is assumed, the number density distribution of particles in thespray equals that of the solid fragments in the mixing layer q0(d0) = q0(dp).
Therefore the Sauter mean diameter d′3.2 of the solid fragment size distribution in the
mixing layer is:
d ′3.2 =
∫d3
0 q0(d0) dd0∫d2
0 q0(d0) dd0=
fs,0(r )G(
3√
fs,0(r )G
)2
∫d3
p q0(dp) ddp∫d2
p q0(dp) ddp=
3√fs,0(r )
Gd3.2. (6.35)

227 6.4 Material properties
0 0.2 0.4 0.6 0.8 10
10
20
30
40
50
60
70
80
0.01
0.1
1
10
100
1000
10000d'
3.2 [
µm]
x s [
µm]
d3.2 = 71 µm (in spray)
fs [ - ]
Fig. 6.58 Relation between Sauter diameter of the solid fraction in the mixing layer d′3.2 (for
G = 1: no disintegration), the mean distance between solid particles xs and the mean local solid-ification fraction in the mixing layer fs (Bergmann, 2000)
In this equation, d3.2 is the Sauter mean diameter of the original particle size distribution inthe spray. Typically, measured particle-size distributions within steel spray forming experi-ments have yielded a Sauter diameter of, e.g. 63 �m (GMR = 1.5) to 71 �m (GMR = 1.1).The mean distance between solid fragments immediately after deposition in the mixinglayer therefore can be described as:
xs = 2
3
1 − fs,0(r )
fs,0(r )
3√fs,0(r )
Gd3.2. (6.36)
Based on the following assumptions:
� that the number of solid fragments during the solidification step does not change (neglect-ing complete remelting of solid fragments and also additional nucleation),
� that the growth velocity is independent of size and only influenced by the local temperaturedifference, and
� that the mean local solid content of the impinging droplets fs,0(r ) can be expressed bythe instantaneous local solid content in a volume element of the mixing layer fs ,
the mean instantaneous fragment distance can be described during the whole process.Results of a grain-size model calculation based on the above assumptions are shown in
Figure 6.58 (in a first approach for G = 1: assuming no fragmentation). The mean distancebetween solid fragments xs continuously decreases with increasing total solid fractions,because the solid particles within the solidification process grow towards each other. Herebythe total area of the solidification front (this is the total surface of all solid fragments) steadilyincreases. Therefore, the change in mean distance decreases with increasing solid fraction(logarithmic scale) as the new solidified mass is distributed over a larger area. Due to the

228 Compaction
1 2 3 4 5 6 7 8 9 1020
30
40
50
60
70
80
G [ - ]
d'3.
2 [µ
m]
d3.2 = 71 µm
d3.2 = 63 µm
Fig. 6.59 Dependency of the Sauter diameter d ′3.2 in the mixing layer on the mean disintegration
rate G for different particle Sauter mean diameters in the spray d3.2 = 71 �m and d3.2 = 63 �m(Bergmann, 2000)
same reason, the Sauter diameter decreases with increasing solid fraction. As seen fromFigure 6.58 the Sauter mean diameter for the solid fragments in the mixing layer at theend of the solidification process ( fs = 1) reaches the value of the Sauter mean diameter inthe spray (here, for example, 71 �m). In this case it is assumed that, during deposition, nofragmentation of solidified droplets/particles occurs.
In publications focusing on grain-size distribution in spray formed products, Grant (1998),Jordan and Harig (1998) and Lavernia and Wu (1996), typical mean grain sizes of about 20to 40 �m have been found. Because of the homogeneous grain-size distribution typicallyfound in spray formed materials, the actual size of individual grains only slightly deviatesfrom this mean value. Therefore, its grain Sauter mean diameter is in the same size range andit is somewhat smaller than the Sauter mean diameter of the particles in the spray. Thus, forthe mean fragmentation function a value greater than 1 has to be chosen. Figure 6.59 showsthe dependency of the mixing layer Sauter mean diameter on the mean fragmentation value.A mean fragmentation value 4 < G < 6 yields mean Sauter diameters in the mixing layerof about 40 �m. Here (on average), from each compacting particle in the spray, five solidfragments in the deposit result. Therefore, a value of G = 5 is assumed and the resultingdistributions are illustrated in Figure 6.60. Because of adjustment of the fragmentationfunction to a constant value G = 5, the final value of the Sauter mean diameter for thecompletely solidified material ( fs = 1) is somewhat smaller and is in the size range of theexperimentally determined grain-size distribution of spray formed deposits. As the Sautermean diameter is the scaling value for the mean solid fragment distance in the mixing layer,the distribution of xs for G = 5 is below that for G = 1.
In summary, modelling of compaction and preform and structure evolution withrespect to the integral spray forming process, suggests some possible ways in which process

229 6.4 Material properties
80
70
60
50
40
30
20
10
0 0.2 0.4 0.6 0.8 10
d3.2 = 71 µm (in spray)d'
3.2 [
µm]
fs [-]
0.01
0.1
1
10
100
1000
10000
G = 1G = 5
x s [µm
]
Fig. 6.60 Relation between Sauter diameter d ′3.2 of the solid fraction in the mixing layer, the mean
distance between solid particles xs and the mean local solidification fraction in the mixing layer fordisintegration rates of G = 1 and G = 5 (Bergmann, 2000)
conditions may be controlled. Investigation of thermal cooling conditions of spray formeddeposits, both in the spray phase and in the cooling phase, outlines the boundary conditionsaffecting material properties of the product. Thus one may start to derive suitable processcontrol mechanisms and quality assurance of high product qualities based on modellingand numerical simulations. Possibilities include: temporal heating of the deposit withinthe spray phase (minimization of porosity effects within the bottom layers of the deposit),or successive cooling or heating of specific areas of the deposit during the spray and thecooling phases especially for high-volume products such as billets. The potential of theseprocess control mechanisms may be further investigated by simulation in spray formingapplications.
6.4.6 Grain coarsening
Besides analysis of the microstructure of the spray particles upon impact, coarsening ofthe fine-grained solid–liquid microstructure in the mushy zone needs to be analysed. It hasbeen observed (Annavarapu and Doherty, 1995) that segregate spacings after coarseningwere smaller than predicted by empirical correlations of dendrite arm spacing and freezingtime.
The substructure size in conventionally cast alloy is dependent on the amount of coarsen-ing the dendrite arms undergo during solidification. Dendrite arm coarsening is a surface-tension-driven process. The solid at highly curved surfaces is melted and preferentiallyredeposited at sites with less curvature by solute transport through the liquid. Several modelshave been proposed for this process in which the smaller dendrite arms melt back leadingto an overall increase in the average dendrite arm spacing. Simple analytical treatment,assuming diffusion-control of the coarsening process at low to medium solid fractions,

230 Compaction
time tf [s]
grai
n in
terc
ept l
engt
h cu
bed
λ3 [m
3 ]conventional λt–tf correlation
550 °C ( fs = 0.93)
575 °C ( fs = 0.89)600 °C ( fs = 0.85)
KD(10−18 m3/s) = 782
4E−13
3E−13
2E−13
1E−13
0E+000E+0 2E+2 4E+2 6E+2 8E+2 1E+3
K = 393
K = 186K = 140
K = 80
625 °C ( fs = 0.65)
Fig. 6.61 Segregate spacing as a function of isothermal coarsening time for spray cast AA2014 Alalloy (Annavarapu and Doherty, 1995)
coar
seni
ng r
ate
cons
tant
K (
×10−1
8 m
3 /s)
solid fraction fs [-]
250
200
150
100
50
00.3 0.4 0.5
IN718
IN625Udimet 720
Mar-M-002
0.6 0.7 0.8 0.9 1
Fig. 6.62 Coarsening rate constant versus solid fraction for spray formed Ni and Cu alloys (Manson-Whitton et al., 2002)

231 6.4 Material properties
(b) (c)(a)
(d)
s
rela
tive
coar
seni
ng r
ate
cons
tant
K/K
(fs
= 0.
7)
solid fraction fs [-]
r
s s
r rFFF
L LL
2.0
1.5
1.0
0.5
0.00 0.2 0.4 0.6 0.8 1
liquid filmmigration
modified liquidfilm migration
Fig. 6.63 Schematic of a solid grain of radius r surrounded by a liquid film of thickness F: (a) forfs < fs0, (b) for fs = fs0 and (c) for fs > fs0; (d) predicted coarsening rate constant as a functionof solid fraction for the modified liquid film migration model for fs0 = 0.7 (Manson-Whitton et al.,2002)
yields a typical cubic dependence of the dendrite arm spacing λt on the local solidificationtime t f :
λ3t = λ3
0 + K Dt f , (6.37)
where K D is the dendritic coarsening rate constant, which is a function of several materialproperties. The resulting λt − t f correlation is widely used to determine the cooling ratefrom the measured final spacings (dendrite arm, cell or segregate).
An important difference between spray formed materials and, for example, convention-ally cast materials is that in spray forming the grain coarsening process in the mushy zone isinitiated at an already high solid content fs . This leads to remarkable differences in the coars-ening rate constant K. The measured dependence of segregate spacing λt (Annavarapu andDoherty, 1995) on isothermal coarsening time t f for spray deposited AA2014 aluminiumalloy is illustrated in Figure 6.61. The graph shows a reduction in the coarsening rate atlower temperatures, i.e. at higher solid fractions fs . Also shown is the conventional corre-lation of segregate spacing on solidification time. The samples had an originally equiaxedmicrostructure with an average grain size of 17 �m. The observed segregate spacings aftercoarsening were smaller than predicted by the empirical correlation. The coarsening

232 Compaction
was found to become slower as the temperature was reduced and the solid fraction fs
increased. The conventional coarsening theory and experiments predict the opposite, i.e.faster coarsening at higher volume fractions of solid. Two models have been developedfor grain growth at high volume fractions of solid by processes whose rates are limited bymigration of liquid at grain boundaries as liquid films (two-grain contact surface) or liquidrods (three-grain contacts at triple points). The conventional diffusion limited coarseninglaw was reproduced, but the rate constant K contained the term (1/(1 − fs)) and so alsopredicted accelerated coarsening at fs → 1.
Manson-Whitton et al. (2002) have shown that for spray formed materials at higher solidfractions, the coarsening rate increases with fs for fs < 0.75 and then decreases again withfurther increasing fs for fs > 0.75, as illustrated in Figure 6.62, where the cubic coarseningrate constant as a function of solid fraction for spray formed Ni and Cu alloys is to be seen.A model for liquid film migration is proposed which takes into account the reducing areaof the liquid film as fs increases for high solid fraction values. This effect is illustrated inFigure 6.63, where a schematic of a solid grain of radius r, surrounded by a liquid filmof constant thickness F for (a) fs < fs0, (b) fs = fs0 and (c) fs > fs0: reduction of thesolid area in contact with the liquid is shown. In Figure 6.63(d) the predicted coarseningrate constant as a function of solid fraction for the modified liquid film migration model isillustrated for fs0 = 0.7. The formation of intergranular liquid droplets and the pinning ofgrain boundary liquid films by dispersoids during coarsening has been discussed.

7 An integral modelling approach
Coupling of several mechanisms into an integrated model for the spray forming process isthe final aim of simulation. Such an integral spray forming model has been investigated,for example, by Bergmann (2000), Minisandram et al. (2000) (which has already beenintroduced in Section 6.3) and Pedersen (2003).
Connection between those submodels aforementioned has been performed, for transienttemperature material behaviour, from melt superheating in the tundish to room temperaturein the preform via cooling and solidification, in a three-stage approach in Bergmann (2000).Tundish melt flow and a thermal model are accounted for in the first stage. The localseparation method is employed in the second stage to determine temperature-averagedproperties of the spray and solid fractions in the particle mass at the centre-line of thespray. The temporal behaviour of a melt element is derived in terms of the averaged meanresidence time of the particle mass. By combination of these data with calculated temporalcooling and solidification distributions of a fixed volume element inside the deposit, oneyields the mean thermal history of the material at a specified location in the deposit.
The transient thermal and solidification distributions are shown in Figures 7.1 and 7.2.Results are illustrated separately for the three different modelling areas (with differenttime scales) for: (a) melt flow in the tundish, (b) particle cooling in the spray, (c) growthand cooling of the deposit. The process conditions used are for a steel spray forming of aGaussian-shaped deposit (see Table 6.5).
From the top of the tundish (upper melt surface) to its exit in the atomization nozzle, themelt is cooled by approximately 20 K (for an initial melt temperature TL = 1933 K). Thesolid fraction of the melt does not change as the melt stays fully liquid (fs = 0). In total,the mean residence time of the melt in the tundish is 51.6 s for a tundish exit diameterdexit = 4 mm and a surface height h = 0.25 m (determining the melt mass flow rate). Withinthe tundish a velocity profile develops in the flowing melt, with highest velocity values atthe centre-line.
In the spray, convective heat transfer to the gas is mainly responsible for cooling of meltdroplets. Until the spray impinges onto the substrate (z = 0.6 m; s = 0.47 m), the meanresidence or flight time of the particles in the spray is 11 ms. During this time, the meltmaterial cools down by �T = 260 K (Tm = 1650 K) corresponding to a mean cooling rateof 2.4 × 10⁴ K/s. Hereby the mean solid fraction in the spray increases to fs = 0.71.
Because of thermal diffusion and the release of latent heat inside the deposit, the temper-ature of the material directly after compaction at first increases due to the further increase inquantity of the local solid fraction. For the conditions discussed, the temperature increases
233

234 An integral modelling approach
tem
pera
ture
[K
]
0 10 20 30 40 501600
1700
1800
1900
2000
55 65 75 85 9551.59 51.6
time [s]
tundish spray deposit
Fig. 7.1 Calculated mean material cooling in the three process steps. Calculation parameters aregiven in Table 6.5 (Bergmann, 2000)
solid
fra
ctio
n [-
]
0 10 20 30 40 50 55 65 75 85 9551.59 51.6
time [s]
tundish spray deposit
0
0.2
0.4
0.6
0.8
1
Fig. 7.2 Calculated mean solid fraction in the three process steps. Calculation parameters are givenin Table 6.5 (Bergmann, 2000)
by approximately 90 K. After complete solidification of the volume element under investi-gation ( fs = 1), the temperature decreases again at a cooling velocity of approximately 2to 3 K/s.
By variation of the standard process conditions, the thermal properties of the particlemass in the spray are responsible for the change in transient cooling and solidificationprocesses inside the deposit, as shown in Figure 7.3. Here increase of the spray distance

235 An integral modelling approach
z = 0.40 m
z = 0.60 m
z = 0.75 m
1400
1500
1600
1700
1800
1900
2000te
mpe
ratu
re [
K]
0
0.2
0.4
0.6
0.8
1
0 10 20 30 40 50 60 70 80 90 100
time [s]
solid
fra
ctio
n [-
]
Fig. 7.3 Influence of distance z between atomizer and substrate on the thermal history of a materialelement. Calculation parameters are given in Table 6.5 (Bergmann, 2000)
between atomizer and substrate is illustrated. For a distance of z = 0.4 m, the compactingparticle mass has a mean temperature of Tm = 1707 K and a mean solid fraction of fs =0.56. Due to the high content of liquid melt remaining, the volume element (discussed hereat the end of the time shown), is not completely solidified (fs = 0.86). Thus the temperatureonly decreases slightly, by approximately 12 K, within the solidification interval.
By increasing the spray distance to 0.6 m the mean thermal conditions of the impactingmass are changed to Tm = 1650 K and fs,m = 0.71. The temperature of the material reachesthe solidification interval for a short time and further decreases once the solidificationprocess has finished. At a spray distance of z=0.75 m, the particle mass completely solidifiesimmediately after compaction. After the temperature rises towards the solidification interval,the material cools down continuously. In comparison to the other two spray distances, thematerial inside the deposit cools down fastest in this case.
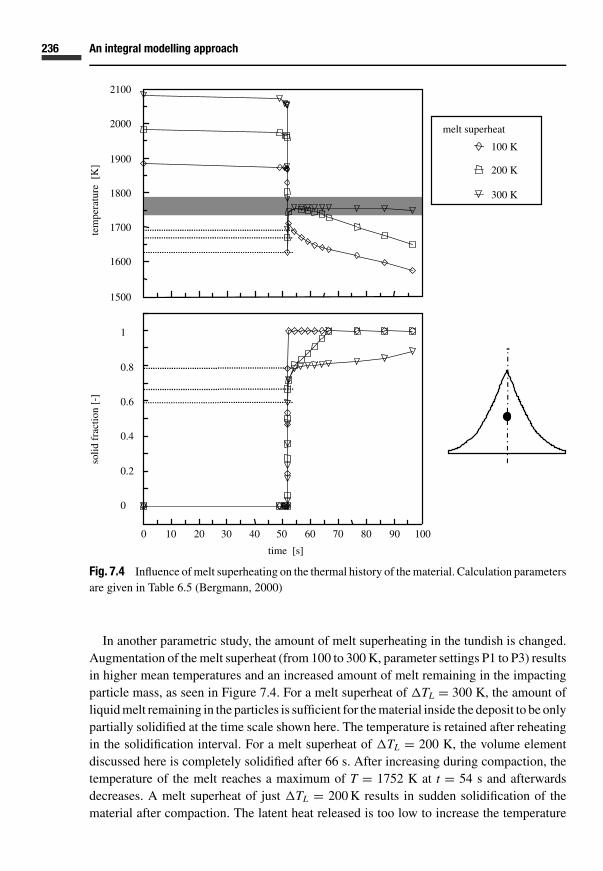
236 An integral modelling approach
100 K
200 K
300 K
melt superheat
1500
1600
1700
1800
1900
2000
2100te
mpe
ratu
re [
K]
0
0.2
0.4
0.6
0.8
1
0 10 20 30 40 50 60 70 80 90 100
time [s]
solid
fra
ctio
n [-
]
Fig. 7.4 Influence of melt superheating on the thermal history of the material. Calculation parametersare given in Table 6.5 (Bergmann, 2000)
In another parametric study, the amount of melt superheating in the tundish is changed.Augmentation of the melt superheat (from 100 to 300 K, parameter settings P1 to P3) resultsin higher mean temperatures and an increased amount of melt remaining in the impactingparticle mass, as seen in Figure 7.4. For a melt superheat of �TL = 300 K, the amount ofliquid melt remaining in the particles is sufficient for the material inside the deposit to be onlypartially solidified at the time scale shown here. The temperature is retained after reheatingin the solidification interval. For a melt superheat of �TL = 200 K, the volume elementdiscussed here is completely solidified after 66 s. After increasing during compaction, thetemperature of the melt reaches a maximum of T = 1752 K at t = 54 s and afterwardsdecreases. A melt superheat of just �TL = 200 K results in sudden solidification of thematerial after compaction. The latent heat released is too low to increase the temperature

237 An integral modelling approach
Table 7.1 Spray forming parameters for coupledsimulation. Values in italics are for adaptation ofboundary conditions (Pedersen, 2003)
Melt mass flow rate Ml [kg/s] 0.2Gas mass flow rate Mg [kg/s] 0.2–0.6Deposit rotational velocity ω [1/min] 116Spray angle α [◦] 35Eccentricity e [m] 0.02Distance to atomizer z [m] 0.5Lubanska constant [-] 50Melt stream diameter dl [mm] 3.7/7.4Total area of gas nozzles A0 [m2] 0.0003/0.0012
of the material above the liquidus. After a short increase of the temperature, the materialcools down immediately.
An integrated numerical model of the spray forming process has been developed byPedersen (2003). The model is able to predict the shape and temperature of the sprayformed preform and takes into account such factors as thermal coupling between the gasand the droplets, the change in droplet-size distribution radially in the spray, the shadowingeffect exhibited by billet-shaped preforms and the sticking efficiency of Gaussian-shapedpreforms. The model has been used to derive a relationship between the gas to melt massflow ratio GMR and surface temperature for the billet shape during spraying. The surfacetemperature is an important process control parameter in spray forming applications. Itdepends directly on the energy, respectively, the size, temperature and solid fraction, con-tained in the particles upon impact.
For variation of the GMR, the melt mass flow is chosen and the proper gas flow rate isadjusted. The melt mass flow rate is varied from 0.05 to 0.2 kg/s. The case of a melt massflow rate of 0.2 kg/s is discussed here. The process parameters investigated within sprayforming of billets of 100Cr16 in this case are listed in Table 7.1. Figure 7.5 illustrates thecalculated billet shape at different time steps. The billet produced is rather small, with awidth of 0.1 m and a height of 0.3 m after a spraying time of 60 s. An almost stationary billetshape is achieved after approximately 20 s spray time in this case; afterwards the shape ofthe top of the billet does not change, but the billet grows in height. The spray model showsthat for varying melt mass flow rates, simply adjusting the GMR will not achieve plausibleresults. Figure 7.6 shows the calculated solid fraction in the spray as a function of distancefrom the atomizer and the melt mass flow rate for a constant GMR of 2. The prescribed idealspray impingement distance of 0.5 to 0.6 m is indicated in the figure. In most investigationsof the spray forming process, it has been found that the desirable solid fraction in the sprayupon impact is between 50 and 70%. Therefore, a lower limit of 45% and a higher limitof 75% are indicated in the plot to define the region within which the solid fraction shouldbe achieved too. As can be seen, the calculated solid fraction within the impact regiongives reasonable results only for the lowest melt mass flow rate under investigation, i.e. for

238 An integral modelling approach
10 s
0.3
0.25
0.2
0.15
0.1
0.05
0
20 s30 s40 s
50 s60 s
0.090.060.030
radial distance [m]
−0.03−0.06−0.09
heig
ht [
m]
Fig. 7.5 Billet-shape evolution with time for a mass flow rate of 0.2 kg/s (Pedersen, 2003)
0.05 kg/s. Increased melt mass flow rates result in unrealistically high amounts of solidfractions upon impingement. In order to overcome this deficit a modification has been usedat higher melt flow rates, which adjusts some atomizer design parameters to the givenchange in mass flow. This is the melt stream diameter and the area of gas delivery nozzles.By applying these changes to the model, the solid fractions in the spray upon impact fall ina realistic range, as can be seen for the as-modified cases indicated in the figure.
Based on this reconfiguration of the atomizer, the proper GMR range for successfulspray forming at each melt mass flow rate can be calculated. The result for a 0.2 kg/s meltflow rate is illustrated in Figure 7.7, where a wide range of GMR values from 1 to 3 hasbeen found to achieve spray solid fractions between 45 and 75%. The overall mass mediandrop-size distribution in the spray dependent on GMR has been taken from Lubanska’s(1970) formula, Eq. (4.49), and the radial dependency of the mean drop size in the spray iscalculated from experimental observations (Hattel et al., 1999) as:
d local50 (r ) = dconst
50 e(−r/0.621). (7.1)

239 An integral modelling approach
1
0.9
0.8
0.7
0.6
0.5
0.4
0.3
0.2
0.1
00 0.1 0.2 0.3 0.4 0.5 0.6 0.7
M = 0.1 kg/s
M = 0.05 kg/s
M = 0.1 kg/s modified
M = 0.2 kg/s modified
distance from atomizer [m]
solid
fra
ctio
n [-
]
Fig. 7.6 Average solid fraction of the spray as a function of distance from the atomizer and melt massflow rate GMR = 2. Data for standard and modified parameters are presented in Table 7.1 (Pedersen,2003)
1
0.9
0.8
0.7
0.6
0.5
0.4
0.3
0.2
0.1
00 0.1 0.2 0.3 0.4 0.5 0.6 0.7
GMR = 3GMR = 2.75GMR = 2.5GMR = 2.25GMR = 2GMR = 1.75GMR = 1.5GMR = 1.25GMR = 1
distance from atomizer [m]
solid
fra
ctio
n [-
]
Fig. 7.7 Average solid fraction of the spray as a function of distance from atomizer and GMR, fora constant melt mass flow rate of 0.2 kg/s. Calculation parameters are given in Table 7.1 (Pedersen,2003)

240 An integral modelling approach
Constant factor d50 in local drop size distribution
350
300
250
200
150
100
50
01.25 1.5
GMR [-]
1.75 2 2.25 2.5 2.75 3
mean diameter in overall distribution
constant factor d50 in local drop-size distribution
drop
let m
ean
diam
eter
[µm
]
Fig. 7.8 Mean droplet diameter and local drop-size distribution coefficient as function of GMR fora constant melt mass flow rate of 0.2 kg/s (Pedersen, 2003)
0.22
0.18
0.2
0.16
0.14
0.12
0.1
0.08
0.06
0.04
0.02
0
30 mm1800
1600
1400
1200
1000
800
600
400
200
0−0.09 −0.06 −0.03 0 0.03 0.06 0.09
heig
ht [
m]
surf
ace
tem
pera
ture
[K
]
radial distance [m]
billet shape after 40 ssurface temperatureafter 40 s
Fig. 7.9 Billet shape and surface temperature after 40 s spray time for GMR = 1.5 and a melt massflow rate of 0.2 kg/s (Pedersen, 2003)

241 An integral modelling approach
1650
1600
1550
1500
1450
surf
ace
tem
pera
ture
[K
]
1.2 1.4 1.6 1.8 2 2.2 2.4 2.6 2.8 3
GMR [-]
surface temperature after 10 s
correlation
surface temperature after 20 ssurface temperature after 30 ssurface temperature after 40 s
Fig. 7.10 Surface temperature as a function of GMR using a = 1644.57, b = 4.51, x0 = 6.02 and aconstant melt mass flow rate of 0.2 kg/s (Pedersen, 2003)
This correlation contains a diameter coefficient depending on the GMR and fulfilling theintegral condition given by the overall mass median spray diameter. The result for the localmean drop size in the spray is shown in Figure 7.8. The standard deviation of the drop-sizedistribution has been taken from:
σ = 3√
d50.3/13. (7.2)
The main result of the next modelling step, the billet model, is the billet surface temperaturedistribution. The calculated surface temperature on the billet after a spray time of 40 s isillustrated in Figure 7.9 for the case of GMR = 1.5 and a melt mass flow rate of 0.2 kg/s.The time of 40 s has been chosen because at that time a quasi-stationary state is reached.Two regions on the billet surface may be distinguished. In the centre of the billet, up tor = 30 mm, the surface temperature is almost constant. In the outer region of the billet,r > 30 mm, the surface temperature decreases to about half the value at the centre. Becausethe surface temperature at the centre of the billet is almost constant, an empirical correlationin this area has been derived from this calculation.
The calculated surface temperature in the centre of the billet is dependent on GMR and isillustrated in Figure 7.10. The surface temperature decreases with increasing GMR, whileat lower GMR values almost constant surface temperatures are achieved. The decrease insurface temperature is due to the decreasing solid fraction in the spray with increasing GMRbecause of the decreasing mean drop size in the spray. Correlation between the GMR and

242 An integral modelling approach
the surface temperature is assumed to be given in the form:
Tsurface = a[1 +
(GMR
x0
)b] . (7.3)
The relationships for the factors in this equation are derived for a GMR for which theatomizer provides a solid fraction within the desirable range of 45 to 75%. The upper andlower bounds of this range are GMRhigh and GMRlow and the respective surface temperaturesat these bounds need to be known. For the constants a and b the correlations are:
a = T (GMRlow), (7.4)
b = T (GMRlow) − T (GMRhigh)
10 (GMRhigh − GMRlow)+ (GMRhigh − GMRlow), (7.5)
and x0 represents a reference GMR:
x0 = GMR2high − (GMRhigh + GMRlow). (7.6)
In the last step of Pedersen’s (2003) integrated modelling approach, the temperature dis-tribution inside the sprayed billet is discussed. The results of the temperature distributionwithin the spray formed product are in agreement with the discussions in Section 6.3.

8 Summary and outlook
The influence and importance of numerical models and simulations in science and engi-neering as appropriate tools for:
� analysis of engineering processes, as well as for� conception and design of processes, and the� development and analysis of control mechanisms,
has rapidly increased in recent years. In some technical research and development areas,simulation has been employed as an important contribution, given identical ranking asexperiment and theory. This influence is valid not only in universities and research labora-tories, but also in industry.
This technical progress of numerical simulation tools is based on ongoing rapid devel-opments that have been achieved in hardware and numerics, and also on some importantdevelopments in modelling of physical and technical processes. These models can be incor-porated and implemented into simulation codes that become easy to use. In recent devel-opments in this area, similar success compared to experimental or physical measurementtechniques have been achieved.
The possibility of using a simulation model to decouple some of the physical effectsand mechanisms involved in a complex technical process, which may only be sequentiallyanalysed by experimental means, highlights the potential of this new analytical approach.Here physical understanding of complex processes may be derived and used to optimizeand develop processes. This contributes not only to scientific understanding, but also toeconomic and ecological technical innovations.
As an example of modelling and numerical process simulation, in this book fluid atom-ization processes and the spray forming of metals have been investigated, with particularreference to transport and exchange processes within multiphase flow, including momen-tum, heat and mass transfer.
Spray forming of metals for preform production is an impact orientated spray process.Spray forming is a metallurgical process for production of near-net shaped preforms withoutstanding material properties. This process has recently been developed from laboratoryto industrial scale. Here, as in some other technical developments, scientific and physicalunderstanding lags behind realization of the process. The potentials of simulation maybe developed in parallel to practical realizations. Modelling and simulation has added animportant contribution to further spray forming process developments.
243

244 Summary and outlook
Each technical process may be further divided into a sequential number of subprocesses.Integral modelling of the complete process requires adapted division of the process. Withinspray forming these main subprocesses can be defined as:
� fragmentation and atomization of the metal melt,� dispersed multiphase spray flow,� compaction of the spray and realization and growth of the deposit.
These subprocesses may once again be subdivided into individual tasks. These tasks thenhave to be individually modelled, based on physical descriptions, and finally analysed.Thereafter, these submodels need to be coupled to result in an integral process model.Modelling and simulation of several spray forming tasks are presented here. The individualbasis for each is derived and from here the simulation tools are outlined. Application of thesemodels with respect to the spray forming process is discussed and related to experimentsand measurements, where data are available.
At the very least, this book gives a thorough introduction to a new analysis tool forprocesses within spray applications. This approach has been tailored here to the sprayforming process discussed. Necessary steps for further integration of submodels into morecomplex integral spray process models have been outlined and some have already beenrealized theoretically. Interaction between submodels and their integration into an integralspray forming process model may be generalized in the future.

Bibliography
Aamir, M. A. and Watkins, A. P. Dense propane spray analysis with a modified collision model,CD-ROM, Proc. ILASS-Europe’99, 5–7 July Toulouse (1999)
Abbott, C. E. A survey of water drop interaction experiments, Rev. Geophys. Space Phys. 15 (1977):363–74
Ahmadi, M. and Sellens, R. W. A simplified maximum-entropy-based drop size distribution, Atomiz.& Sprays 3 (1993): 292–310
Ahrens, O. Numerische Simulation des transsonischen Stromungsfeldes von unterexpandierten Frei-strahlen, Studienarbeit, Fachgebiet Verfahrenstechnik, Universitat Bremen (1995)
Albrecht, A., Bedat, B., Poinsot, T. J. and Simonin, O. Direct numerical simulation and modeling ofevaporating droplets in homogeneous turbulence: application to turbulent flames, CD-ROM, Proc.ILASS-Europe’99, 5–7 July, Toulouse (1999)
Amsden, A. A., O’Rourke, P. J. and Butler, T. D. KIVA-II: A Computer Program for ChemicallyReactive Flows with Sprays, Report LA-11560-MS, Los Alamos National Laboratory, LNM(1989)
Andersen, O. Berechnung des Temperaturverlaufs einer stationaren Schmelzestromung durch eindunnes Rohr mit Kreisquerschnitt unter gleichzeitiger Berucksichtigung von Strahlung und Kon-vektion, Diplomarbeit, Fachgebiet Verfahrenstechnik, Universitat Bremen (1991)
Anderson, I. E. and Figliola, R. S. Observations of gas atomization process dynamics, in: P. U.Gummeson and D. A. Gustafson (eds.) Modern Developments in Powder Metallurgy, Vol. 20,Metal Powder Industries Federation, Princeton, NJ (1988), pp 205–23
Anderson, I. E. and Terpstra, R. L. Progress toward gas atomization processing with increased uni-formity and control, Mater. Sci. Engng. A326 (2002) 1: 101–9
Anderson, I. E., Terpstra, R. L. and Rau, S. Progress toward understanding of gas atomization pro-cessing physics, Kolloquium des SFB 372, vol. 5, Universitat, Bremen (2001) pp 1–16
Annavarapu, S. and Apelian, D. and Lawley, A. Processing effects in spray casting of steel strip,Metall. Trans. A 19 (1988): 3077–86
Annavarapu, S., Apelian, D. and Lawley, A. Spray casting of steel strip – process analysis, Metall.Trans. A 21 (1990): 3237–56
Annavarapu, S. and Doherty, R. D. Evolution of microstructure in spray casting, Int. J. Powder Metall.29 (1993) 4: 331–43
Annavarapu, S. and Doherty, R. D. Inhibited coarsening of solid-liquid microstructures in spraycasting at high volume fractions of solid, Acta Metall. Mater. 43 (1995) 8: 3207–30
Anno, J. N. The Mechanics of Liquid Jets, Lexington Books, Lexington, MA (1977)Antipas, G., Lekakou, C. and Tsakiropoulos, P. The break-up of melt streams by high pressure gases
in spray forming, Proc. 2nd International Conference on Spray Forming ICSF-2, 13–15 Sept.,Swansea (1993) pp 15–24
245

246 Bibliography
Armster, S. Q., Delplanque, J. P., Rein, M. and Lavernia, E. J. Thermo-fluid mechanisms controllingdroplet based materials processes, Int. Mater. Rev. 47 (2002) 6: 265–301
Ashgriz, N. and Poo, J. Y. Coalescence and separation in binary collision of liquid drops, J. FluidMech. 221 (1990): 183–204
Baehr, H. D. and Stephan, K. Warme- und Stoffubertragung, Springer-Verlag, Berlin (1994)Barrett, R., Berry, M., Chan, T. F., Demmel, J., Donato, J., Dongarra, J., Eijkhout, V., Pozo, R.,
Romine, C. and van der Vorst, H. Templates for the Solution of Linear Systems: Building Blocksfor Iterative Methods, 2nd Edition, SIAM Publishing, Philadelphia, PA (1994). Available at:ftp.netlib.org/templates/templates.ps
Bauckhage, K. Das Zerstauben metallischer Schmelzen, Chem.-Ing.-Tech. 64 (1992) 4: 322–32Bauckhage, K. Stand der Technik beim Spruhkompktieren von Bolzen, Hart.-Tech.-Mitteilung 52
(1997) 5: 319–31Bauckhage, K. Use of the phase-Doppler-anemometry for the analysis and the control of the spray
forming process, Proc. PM2TEC’98, 31 May–4 June, Las Vegas (1998a)Bauckhage, K. Die Bedeutung der Partikelabkuhlung fur den Materialaufbau beim Spruhkom-
paktieren, Kolloquium des SFB 372, Vol. 4, Universitat Bremen (1998b) pp 139–74Bauckhage, K., Bergmann, D., Fritsching, U., Lohner, H., Schreckenberg, P. and Uhlenwinkel, V. Das
Scaling-Down-Problem bei der Zweistoffzerstaubung von Metallschmelzen, Chem.-Ing.-Tech. 73(2001) 4: 304–13
Bauckhage, K., Bergmann, D. and Tillwick, J. Die Massen- und Enthalpiebilanzierung desSpruhkegels als Kopplung fur die Modellvorstellung des Materialaufbaus in der Mix-Schicht,Kolloquium des SFB 372, Vol. 4, Universitat Bremen (1999) pp 139–70
Bauckhage, K. and Fritsching, U. Production of metal powders by gas atomization, in: Cooper, K. P.,Anderson, I. E., Ridder, S. D. and Biancanello F. S. (eds.) Liquid Metal Atomization: Fundamentalsand Practice, June TMS, Warrendale (2000) pp 23–36
Bauckhage, K., Liu, H. M. and Fritsching, U. Models for the transport phenomena in a newspray compacting process, 4th Proc. International Conference on Liquid Atomization and SpraySystems, ICLASS’88, Sendai/Japan, 21–24 August, The Fuel Society of Japan, Tokyo (1988)pp 424–30
Bauckhage, K. und Uhlenwinkel, V. Zu den Moglichkeiten eines automatisierten und optimiertenSpruhkompaktierbetriebes, Hart.-Tech.-Mitteilung 51 (1996b) 5: 289–97
Bauckhage, K. und Uhlenwinkel, V. (eds.) Spruhkompaktieren – Sprayforming, Kolloquium des SFB372, Vol. 1, Universitat Bremen (1996a)
Bauckhage, K. und Uhlenwinkel, V. (eds.) Spruhkompaktieren – Sprayforming, Kolloquium des SFB372, Vol. 2, Universitat Bremen (1997)
Bauckhage, K. und Uhlenwinkel, V. (eds.) Spruhkompaktieren – Sprayforming, Kolloquium des SFB372, Vol. 3, Universitat Bremen (1998)
Bauckhage, K. und Uhlenwinkel, V. (eds.) Spruhkompaktieren – Sprayforming, Kolloquium des SFB372, Vol. 4, Universitat Bremen (1999)
Bauckhage, K. und Uhlenwinkel, V. (eds.) Spruhkompaktieren – Sprayforming, Kolloquium des SFB372, Vol. 5, Universitat Bremen (2001)
Bauckhage, K., Uhlenwinkel, U. and Fritsching, U. (eds.) Proc. Spray Deposition and Melt Atomiza-tion Conference SDMA 2000, 26–28 June, Bremen, Universitat Bremen (2000)
Bauckhage, K., Fritsching, U., Uhlenwinkel, U., Ziesemis, J. and Leatham, A. (eds.) Proc. 2ndSpray Deposition and Melt Atomization Conference SDMA 2003, 22–25 June, Bremen, UniversitatBremen (2003)

247 Bibliography
Baum, S. Software for Graphics and Data Analysis, Deptartment of Oceanography, Texas A&MUniversity (1996). Available at: http://www-ocean.tamu.edu/∼baum/ocean graphics.html
Bayvel, L. and Orzechowski, Z. Liquid Atomization, Taylor & Francis, Washington, DC (1993)Bellan, J. Perspectives on large eddy simulations for sprays: issues and solutions, Atomiz. & Sprays
10 (2000): 409–25Beretta, F., Cavalieri, F. and D’Alessio, A. Drop size concentration in a spray by sideward laser light
scattering measurements, Combust. Sci. Technol. 36 (1984): 19–37Berg, J. C. (ed.) Wettability, Marcel Dekker, New York (1993)Berg, M. Zum Aufprall, zur Ausbreitung und Zerteilung von Schmelzetropfen aus reinen Metallen,
Dissertation Universitat Bremen (1999)Berg, M. and Ulrich, J. Experimental based detection of the splash limits for the normal and
oblique impact of molten metal particles on different substrates, J. Mater. Synth. Proc. 5 (1997) 1:45–9
v. Berg, E., Burger, M., Cho, S. H. and Schatz, A. Analysis of atomization of a liquid jet taking intoaccount effects of the near surface boundary layer, Proc. 11th ILASS-Europe Conference 21–23March, Nurnberg (1995)
Bergmann, D. Modellierung des Spruhkompaktierprozesses fur Kupfer- und Stahlwerkstoffe, Disser-tation, Universitat Bremen (2000)
Bergmann, D., Bauckhage, K. and Fritsching, U. Modelling the spray forming process, 1999 Inter-national Conference on Powder Metallurgy and Particulate Materials, 20–24 June, Vancouver(1999b).
Bergmann, D., Fritsching, U. and Bauckhage, K. Modellierung der Abkuhlung und raschen Erstarrungvon Metalltropfen im Fluge wahrend des Spruhkompaktierens, in: Kolloquium des SFB 372,Vol. 3, Bauckhage, K. and Uhlenwinkel, V. (eds.), Universitat Bremen (1998) pp 175–96
Bergmann, D., Fritsching, U. and Bauckhage, K. Averaging thermal conditions in molten metal sprays,in: Mishra, B. (ed.) Proc. TMS – Annual Meeting, EPD Congress 1999, 28 Feb.–4 March, San DiegoCA (1999a)
Bergmann, D., Fritsching, U. and Bauckhage, K. Coupled simulation of molten metal droplet sprays,in: Rath, H. J. (ed.) 8th International Symposium on Computational Fluid Dynamics ISCFD’99,5–10 September, Bremen (1999b)
Bergmann, D., Fritsching, U. and Bauckhage, K. A mathematical model for cooling and rapid solid-ification of molten metal droplets, Int. J. Therm. Sci. 39 (2000): 53–62
Bergmann, D., Fritsching, U. and Bauckhage, K. Simulation of molten metal droplet sprays, Comp.Fluid Dynamics J. 9 (2001a): 203–11
Bergmann, D., Fritsching, U. and Bauckhage, K. Thermische Simulation des Spruhkompaktierpro-zesses, Hart.-Tech.-Mitteilung 56 (2001b) 2: 110–19
Bergmann, D., Fritsching, U. and Crowe, C. T. Multiphase flows in the spray forming process,Proc. 2nd International Conference on Multiphase Flow, 3–7 April, Kyoto, Japan, Vol. 1 (1995)pp SP1–SP8
Bergstrom, C., Fuchs, L. and Holmborn, J. Large eddy simulation of spray injected in a strong turbulentcross flow, CD-ROM, Proc. ILASS-Europe 99, 5–7 July, Toulouse (1999)
Berthomieu, P., Carntz, H., Villedieu, P. and Lavergne, G. Characterization of droplet breakup regimes,in: Yule, A. J. (ed.) Proc. ILASS-Europe’98, 6–8 July, Manchester (1998) pp 72–7
Bewlay, B. P. and Cantor, B. Modeling of spray deposition – measurement of particle size, gasvelocity, particle velocity, and spray temperature in gas-atomized sprays, Metall. Trans. B 12B(1990): 899–912

248 Bibliography
Bhagat, R. B. and Amateau, M. F. Droplet solidification and microstructure modeling for Al–4Lialloy, Adv. Powder Metall. & Parti. Mater. 2 (1996)
Bird, R. B., Stewart, W. E. and Lightfoot, E. N. Transport Phenomena, Wiley International Edition,John Wiley & Sons, New York (1960)
Birtigh, A., Lauschke, G., Schierholz, W. F., Beck, D., Maul, C., Gilbert, N., Wagner, H.-G. andWerniger, C. Y. CFD in der chemischen Verfahrenstechnik aus industrieller Sicht, Chem.-Ing.-Tech. 72 (2000) 3: 175–93
Boettinger, W. J., Coriel, S. R., Greer, A. L., Karma, A., Kurz, W., Rappaz, M. and Trivedi, R. Solidi-fication microstructures: recent developments, future directions, Acta Mater. 48 (2000) 1: 43–70
Brackbill, J. U., Kothe, D. B. and Zemach, C. A continuum method for modelling surface tension,J. Comp. Phys. 100 (1992): 335–54
Bradley, D. On the atomization of liquids by high-velocity gases, Part 1, J. Phys. D: Appl. Phys. 6(1973a): 1724–36
Bradley, D. On the atomization of liquids by high-velocity gases, Part 2, J. Phys. D: Appl. Phys. 6(1973b): 2267–72
Brander, B. and Brauer, H. Impuls- und Stofftransport durch die Phasengrenzflache von kugelformigenfluiden Partikeln, Fortschritt-Berichte VDI, vol. 3, No. 326, VDI-Verlag, Dusseldorf (1993)
Bricknell, R. H. The structure and properties of a nickel-base superalloy produced by Osprey atom-ization and deposition, Metall. Trans A. 17A (1986): 583–91
Brody, H. D. and Flemings, C. Solute redistribution in dendritic solidification, Trans. Metall. Soc.AIME 236 (1966) 5: 615–23
Brooks, R. G., Moore, C., Leatham, A. G. and Coombs, J. S. The Osprey process, Powder Metall. 2(1977): 100–2
Buchholz, M. Untersuchung des Spruhkompaktierverhaltens an spruhkompaktierten Bolzen, Disser-tation, Universitat Bremen (2002)
Buchholz, M., Uhlenwinkel, V., v. Freyberg, A. and Bauckhage, K. Specific enthalpy measurementin molten metal spray, Mater. Sci. Engng. A326 (2002) 1: 165–75
Burger, M., v. Berg, E., Cho, S. H. and Schatz, A. Fragmentation processes in gas and water atomizationplants for process optimization purposes, Part 1: discussion of the main fragmentation processes,Powder Metall. Int. 21 (1989) 6: 10–15
Burger, M., v. Berg, E., Cho, S. H. and Schatz, A. Analysis of fragmentation processes in gas and wateratomization plants for process optimization purposes, Part 2: modelling of growth and stripping ofcapillary waves in parallel shear flow – the basic fragmentation mechanism, Powder Metall. Int.24 (1992) 6: 32–8
Burger, M., Schwalbe, W., Kim, D. S., Unger, H., Hohmann, H. and Schins, H. Two-phase descriptionof hydrodynamic fragmentation processes within thermal detonation waves, J. Heat Transfer 106(1984): 728–34
Bussmann, M., Aziz, S. D. and Chandra, S. Photographs and simulations of molten metal dropletslanding on a solid surface, J. Heat Transfer 122 (2000): 422
Bussmann, M., Mostaghimi, J. and Chandra, S. On a three-dimensional volume tracking model ofdroplet impact, Phys. Fluids 11 (1999): 1406–17
Butzer, G. A. The production-scale spray forming of superalloys for aerospace applications, J.Metals 51 (1999) 4, web-edition: http://www.tms.org/pubs/journals/J. Metals/9904/butzer/butzer-9904.html
Cai, C. A modelling study for the design and control of spray forming, PhD thesis, Drexel University(1995)

249 Bibliography
Cai, W. D. and Lavernia, E. J. Modeling of porosity during spray forming, Mater. Sci. Engng. A 226–8(1997): 8–12
Cai, C., Warner, L., Annavarapu, S. and Doherty, R. Modelling microstructural development in sprayforming: experimental verification, in: Wood, J. V. Proc. 3rd International Conference on SprayForming, Cardiff, 1996, Osprey Metals Ltd, Neath (1997)
Cappus, J. M. and German, R. M. (eds.) Proc. 1992 Powder Metallurgy World Congress, Vol. 1:Powder Production and Spray Forming, 21–26 June, San Francisco, CA (1992)
Carter, W. T., Benz, M.-G., Basu, A. K., Zabala, R. J., Knudsen, B. A., Forbes Jones, R. M., Lippard,H. E. and Kennedy, R. L. The CMSF process: the spray forming of clean metal, J. Metals 51 (1999)4, web-edition: http://www.tms.org/pubs/journals/JOM/9904/Carter/Carter-9904.html
Chang, D.-H., Kang, S., Lee, E.-S. and Ahn, S. Analysis of transient heat conduction with phasechange in a spray deposited body, in: Marsh, S. P. et al. (eds.), Solidification 1998, The Minerals,Metals & Materials Society, Warrendale, PA (1998) pp 497–508
Chao, B. T. Motion of spherical gas bubbles in a viscous liquid at large Reynolds numbers, Phys.Fluids 5 (1962) 1: 69–79
Chen, M. M., Crowe, C. T., Fritsching, U., Pien, S. J., et al. (eds.) Transport Phenomena in Mate-rials Processing and Manufacturing, Heat Transfer Division – vol. 336, Fluids Engng Division –Vol. 240, The American Society of Mechanical Engineers ASME, New York (1996)
Cheng, C., Annavarapu, S. and Doherty, R. Modelling based microstructural control in spray casting,Proc. 2nd International Conference on Spray Forming, ICSF-2, 13–15 Sept., Swansea (1993)
Clift, R., Grace, J. R. and Weber, M. E. Bubbles, Drops and Particles, Academic Press, San Diego,CA (1978)
Coimbra, C. F. M. and Rangel, R. H. General solution of the particle momentum equation in unsteadyStokes flows, J. Fluid Mech. 370 (1998): 53–72
Colella, P. and Glaz, H. M. Efficient solution algorithmus for the Riemann problem for real gases,J. Comp. Phys. 59 (1985): 264–89
Computational Fluid Dynamics Services CFX 4.1 Flow Solver User Guide, Computational FluidDynamics Services, Harwell Laboratories Oxfordshire (1995)
Conelly, S., Coombs, J. S. and Medwell, J. O. Flow characteristics of metal particles in atomizedsprays, Metal Powder Rep. 41 (1986): 9
Cousin, J. and Dumouchel, C. Effect of viscosity on the linear instability of a liquid sheet, Atomiz. &Sprays 6 (1996): 563–76
Cousin, J. and Dumouchel, C. Theoretical determination of spray drop size distribution, Proc. Inter-national Conference on Liquid Atomization and Spray Systems ICLASS’97, August, Seoul (1997)Part 1: Description of the Procedure, pp 788–95, Part 2: Applications, pp 796–803
Cousin, J., Yoon, S. J. and Dumouchel, C. Coupling of the classical linear theory and the maximumentropy formalism for the prediction of drop size distributions in sprays, application to pressureswirl atomizers, Atomiz. & Sprays 6 (1996) 5: 601 ff.
creare.x Inc. (Hrsg.) FLUENT User’s Manual, Version 3.02, Hanover (1990)Crowe, C. T. Modelling spray–air contact in spray drying systems, Adv. in Drying 1 (1980) 3: 63–99Crowe, C. T. Challenges in numerical simulation of metal sprays in spray forming processes, Kollo-
quium des SFB 372, Vol. 2, Universitat. Bremen (1997) pp 1–16Crowe, C. T. Importance of multiphase coupling in modeling metal-droplet sprays, Proc. Spray
Deposition and Melt Atomization SDMA 2000, Bremen (2000) pp 757–70Crowe, C. T., Sharma, M. P. and Stock, D. E. The particle-source-in-cell method for gas droplet flow,
J. Fluids Engng. 99 (1977): 325–32

250 Bibliography
Crowe, C. T., Sommerfeld, M. and Tsuji, Y. Multiphase Flows with Drops and Particles, CRC Press,Boca Raton, CA (1998)
Crowe, C. T., Troutt, T. R. and Chung, J. N. Numerical models for two-phase turbulent flows, Ann.Rev. Fluid Mech. 28 (1996): 11–43
Cui, C., Cao, F., Li, Z. and Li, Q. Modeling of the spray forming and solidification process of billets,Proc. 4th International Conference on Spray Forming, Baltimore, MD (1999)
Cui, C., Cao, F., Li, Z., Zhang, J. and Li, Q. Modeling of spray forming and solidification process oftubular products, Proc. Spray Deposition and Melt Atomization SDMA 2000, Bremen, (2000) pp825–38
Cui, C., Fritsching, U., Schulz, A., Bauckhage, K. and Mayr, P. Control of cooling during spray formingof bearing steel billet, Proc. Spray Deposition and Melt Atomization SDMA 2003, Bremen, 22–25June, (2003) pp 8.117–8.128
Cui, C., Li, Z. and Li, Q. Numerical simulation of heat and momentum transfer in spray formingprocess, Proc. 1998 PM World Congress, Vol. 1, 18–22 October, Grenada (1998) pp 555–60
Dash, S. M. and Wolf, D. E. Interactive phenomema in supersonic jet mixing problems, Part I:phenomenology and numerical modeling techniques, AIAA Journal 22 (1984) 7: 905–13
Delplanque, J. P., Lavernia, E. J. and Rangel, R. H. Analysis of in-flight oxidation during reac-tive spray atomization and deposition processing of aluminum, J. Heat Transfer 122 (2000):126–33
Delplanque, J.-P., Lavernia, E. J. and Rangel, R. H. Multidirectional solidification model for thedecription of micropore formation in spray deposition processes, Numerical Heat Transfer, Part A30 (1996): 1–18
Delplanque, J. P. and Rangel, R. H. Simulation of liquid-jet overflow in droplet deposition processes,Acta Mater. 47 (1999) 7: 2207–13
Delplanque, J. P. and Sirignano, W. A. Boundary-layer stripping effects on droplet transcritical con-vective vaporization, Atomiz. & Sprays 4 (1994) 3: 325–49
Dielewicz, L. G., v. Berg, E. and Lampe, M. Computation of transsonic two-phase flow in liquid metaljet atomizers, CD-ROM Proc. ILASS-Europe’99, 5–7 July Toulouse (1999)
Djuric, Z. and Grant, P. S. Two dimensional simulation of liquid metal spray deposition onto acomplex surface II: splashing and redeposition, Modelling Simul. Mater. Sci. Eng. 9 (2001):111–27
Djuric, Z., Newberry, P. and Grant, P. S. Two dimensional simulation of liquid metal spray depositiononto a complex surface, Modelling Simul. Mater. Sci. Eng. 7 (1999): 553–71
Dobre, M. and Bolle, L. Theoretical prediction of ultrasonic spray characteristics using the maximumentropy formalism, in: Yule, A. J. (ed.) Proc. ILASS-Europe’98, 6–8 July, Manchester (1998)pp 7–12
Doherty, R. D., Annavarapu, S., Cai, C. and Warner Kohler, L. K. Modeling based studies for controland microstructure development in spray forming, Kolloquium des SFB 372, Vol. 2, UniversitatBremen (1997) pp 45–78
Doherty, R. D., Cai, C. and Warner-Kohler, L. K. Modeling and microstructural development in sprayforming, Int. J. Powder Metall. 33 (1997) 3: 50–60
Dombrowski, N. and Johns, W. R. The aerodynamic instability and disintegration of viscous liquidsheets, Chem. Engng. Sci. 18 (1963): 203–14
Domnick, J., Raimann, J., Wolf, G., Berlemont, A. and Cabot, M.-S. On-line process control in meltspraying using phase-Doppler anemometry, Proc. International Conference on Liquid Atomizationand Spray Systems ICLASS ’97, 18–22 August (1997) Seoul

251 Bibliography
Drezet, J.-M. Thermomechanical aspects in solidification processes, Kolloquium des SFB 372,Vol. 3, Universitat Bremen (1998) pp 53–82
Duda, J. L. and Vrentas, J. S. Fluid mechanics of laminar liquid jets, Chem. Engng. Sci. 22 (1967):855–73
Dumouchel, C. Problemes lies a la d un pulverizateur mecanique – hydrodynamique de chambre etinstabilite de nappe, Dissertation Universite Rouen (1989)
Dunkley, J. J. Liquid metal atomization – a suitable case for investigation, in: Yule, A. J. (ed.) Proc.ILASS-Europe’98, 6–8 July, Manchester (1998) pp P1–P6
Durao, D. F. G. The application of laser anemometry to free jets and flames with and without recir-culation, PhD thesis, University of London (1976)
Durst, F., Milojevic, D. and Schonung, B. Eulerian and Lagrangian predictions of particulate two-phase flows: a numerical study, Appl. Math. Modelling 8 (1984): 101–15
Dykhuizen, R. C. Review of impact and solidification of molten thermal spray droplets, J. ThermalSpray Technol. 3 (1994): 351–61
Dykhuizen, R. C. and Smith, M. F. Gas dynamic principles of spray, J. Thermal Spray Technol. 7(1998) 2:, 205–12
Ebert, T., v. Buch, F. und Kainer, K. U. Spruhkompaktieren von Magnesiumlegierungen im Rahmendes SFB 390, Kolloquium des SFB 372, Vol. 3, Universitat Bremen (1998) pp 9–30
Ebert, T., Moll, F. and Kainer, K. U. Spray forming of magnesium alloys and composites, Proc. 3rdInternational Conference on Spray Forming, Cardiff, 1996, Osprey Metals Ltd, Neath (1997) pp177–85
Edwards, C. F. Formulating large-eddy simulations of dense multiphase flows, in: Yule, A. J. (ed.)Proc. ILASS-Europe’98, 6–8 July, Manchester (1998) pp P7–P16
Elghobashi, S. E., Abou-Arab, T. W., Rirk, M. and Mostafa, A. Prediction of the particle laden jetwith a two-equation turbulence model, Int. J. Multiphase Flow 10 (1984): 697–710
Espina, P. I. Numerical simulation of atomization gas flow, Kolloquium des SFB 372, Vol. 4, UniversitatBremen (1999) pp 127–38
Espina, P. I. and Piomelli, U. Numerical simulation of the gas flow in gas metal atomizers, Proc. 1998ASME – Fluids Engng Division, Washington (1998a), FEDSM98–4901
Espina, P. I. and Piomelli, U. Study of the gas jet in a close-coupled gas metal atomizer, AIAAAerospace Science Meeting, 12–15 June, Reno, NV, Paper 98–0959 (1998b)
Evans, R. W., Leatham, A. G. and Brooks, R. G. The Osprey preform process, Powder Metall. 28(1985): 13–20
Faeth, G. M. Structure and atomization properties of dense turbulent sprays, 23rd Symposium onCombustion, The Combustion Institute, Pittsburgh, PA (1990) pp 1345–52
Farago, Z. Activities on liquid atomization at the Research Center Lampoldshausen of the GermanAerospace Research Establishment, Proc. International Conference on Liquid Atomization andSpray Systems ICLASS ’97, 18–22 August, Seoul (1997) pp 345–52
Farago, Z. and Chigier, N. Morphological classification of disintegration of round liquid jets in acoaxial air stream, Atomiz. & Sprays 2 (1992): 137–53
Ferziger, J. H. and Peric, M. Computational Methods for Fluid Dynamics, Springer Verlag, Berlin(1996)
Fletcher, C. A. J. Computational Techniques for Fluid Dynamics Part 1: Fundamental and GeneralTechniques; Part 2: Specific Techniques for Different Flow Categories, 2nd Edition, Springer Verlag(1991)
Flow Science, Flow-3D User’s Manual, Flow Science, Santa Fe, CA (1998)

252 Bibliography
Ford, R. E. and Furmidge, C. G. L. Impact and spreading of spray drops on foliar surfaces, Wetting(Soc. Chem. Ind.) 25: 417–32 (1967)
Forrest, J., Lile, S. and Coombs, J. S. Numerical modelling of the Osprey process, Proc. InternationalConference on Spray Forming, ICSF-2, 13–15 September, Swansea (1993)
Frigaard, I. A. Growth dynamics of spray-formed aluminium billets, Part 1: steady state crown shapes,J. Mater. Proc. Manuf. Sci. 3 (1994a): 173–93
Frigaard, I. A. Growth dynamics of spray-formed aluminium billets, Part 2: transient billet growth,J. Mater. Proc. Manuf. Sci. 3 (1994b): 257–75
Frigaard, I. A. Controlling the growth of alluminium spray-formed billets, Kolloquium des SFB 372,Vol. 2, Universitat Bremen (1997) pp 29–44
Frigaard, I. A. Spray-forming of large diameter billets using twin atomizer system: basic features ofspray-form growth dynamics, Proc. Spray Deposition and Melt Atomization SDMA 2000, Bremen(2000) pp 839–54
Fritsching, U. Modelling the spray cone behaviour in the metal spray forming process, momentumand thermal coupling in two-phase flow, Phoenics J. Comp. Fluid Dynamics 8 (1995) 1: 68–90
Fritsching, U. and Bauckhage, K. Die Bewegung von Tropfen im Spruhkegel einer Ein- und einerZweistoffduse, Chem.-Ing.-Tech. 59 (1987) 9: 744–5
Fritsching, U. and Bauckhage, K. Numerical investigations on the atomization of molten metals,3rd International Phoenics-User Conference, 28 August–1 September, Dubrovnik CHAM Ltd,London (1989)
Fritsching, U. and Bauckhage, K. Investigations on the atomization of molten metals: the coaxial jetand the gas flow in the nozzle near field, PHOENICS J. Comp. Fluid Dynamics 5 (1992) 1: 81–98
Fritsching, U. and Bauckhage, K. Lagrangian modelling of thermal and kinetic droplet/particle be-haviour in the metal spray compaction process, Proc. ILASS-93/CHISA-93, 29 August–3 Septem-ber, Prague (1993)
Fritsching, U. and Bauckhage, K. Zum Impuls- und Warmetransport bei der Zerstaubung und an-schließenden Kompaktierung von Schmelzen, Chem.-Ing.-Tech. 66 (1994a) 3: 380–2
Fritsching, U. and Bauckhage, K. Sprays and jets for metallurgical applications, Proc. 7th Workshopon Two-Phase Flow Predictions, 11–14 April, Erlangen (1994b)
Fritsching, U. and Bauckhage, K. Spray modelling in spray forming, in: Chen, M. M. and Crowe, C.T. (eds.) Multiphase Flow and Heat Transfer in Materials Processing, presented at InternationalMechanical Engineering Congress 94, 6–11 November, Chicago, ASME-FED 201 (1994c): 49–54
Fritsching, U. and Bauckhage, K. Thermal treatment and conditions of the deposit in spray formingapplications, in: Chen, M. M. and Crowe, C. T. (eds.) Multiphase Flow and Heat Transfer in Mate-rials Processing, presented at International Mechanical Engineering Congress 94, 6–11 November,Chicago, ASME-Fluids Engng Division 201 (1994d): 7–18
Fritsching, U. and Bauckhage, K. Sprayforming of Metals, Ullmann’s Encyclopedia of IndustrialChemistry, 6th Edition, 1999 electronic release, Wiley VCH, Weinheim (1999)
Fritsching, U., Bergmann, D. and Bauckhage, K. Metal solidification during spray forming, Proc.International Conference on Liquid Atomization and Spray Systems ICLASS’97, 18–22 August,Seoul (1997a)
Fritsching, U., Bergmann, D., Heck, U. und Bauckhage, K. Modellierung und Simulation desSpruhkompaktierprozesses, in: Bauckhage, K. und Uhlenwinkel, V. (eds.) Kolloquium des SFB372, Vol. 2, Universitat Bremen (1997b)
Fritsching, U., Bergmann, D., Heck, U. and Bauckhage, K. Particle size distribution width in gas at-omization of molten metals, 1999 International Conference on Powder Metallurgy and ParticulateMaterials, 20–24 June, Vancouver (1999)

253 Bibliography
Fritsching, U., Liu, H. and Bauckhage, K. Numerical modelling in the spray compaction process, Proc.5th International Conference on Liquid Atomization and Spray Systems, ICLASS-91, Gaithersburg,MD, NIST SP813 (1991) pp 491–8
Fritsching, U., Heck, U. and Bauckhage, K. The gas-flowfield in the atomization region of a free fallatomizer, Proc. International Conference on Liquid Atomization and Spray Systems ICLASS’97,18–22 August, Seoul (1997)
Fritsching, U., Liu, H. and Bauckhage, K. Two-phase flow and heat transfer in the metal spraycompaction process, Proc. International Conference on Multiphase Flows ’91, 24–7 September,Tsukuba (1991)
Fritsching, U., Uhlenwinkel, V. and Bauckhage, K. Spreading of the spray cone for spray formingapplications, Proc. Powder Metallurgy World Congress, PM-93, 12–15 July, Kyoto (1993)
Fritsching, U., Uhlenwinkel, V. and Bauckhage, K. (eds.) Selected papers from the InternationalConference on Spray Deposition and Melt Atomization, SDMA-2000, Mater. Sci. Engng. A326(2002) 1
Fritsching, U., Uhlenwinkel, V., Bauckhage, K. and Urlau, U. Gas- und Partikelstromungen imDusennahbereich einer Zweistoffduse, Modelluntersuchungen zur Zerstaubung von Metall-schmelzen, Chem.-Ing.-Tech. 62 (1990) 2: 146–7
Fritsching, U., Zhang, H. and Bauckhage, K. Thermal histories of atomized and compacted metals,Proc. Powder Metallurgy World Congress PM-93, 12–15 July, Kyoto (1993a)
Fritsching, U., Zhang, H. and Bauckhage, K. Modelling of thermal histories and solidification inthe spray cone and deposit of atomized and compacted metals, Proc. International Conference onSpray Forming, ICSF-2, 13–15 September, Swansea (1993b)
Fritsching, U., Zhang, H. and Bauckhage, K. Numerical simulation of temperature distribution andsolidification behaviour during spray forming, Steel Research 65 (1994a) 7: 273–8
Fritsching, U., Zhang, H. and Bauckhage, K. Numerical results of temperature distribution and solid-ification behaviour during spray forming, Steel Research 65 (1994b) 8: 322–5
Frohn, A. and Roth, N. Dynamics of Droplets, Springer Verlag, Berlin (2000)Fukai, J., Shiiba, Y., Yamamoto, T., Miyatake, O., Poulikakos, D., Megaridis, C. M. and Zhao, Z.
Wetting effects on the spreading of a liquid droplet colliding with a flat surface: experiment andmodeling, Phys. Fluids 11 (1995): 236–47
Fukai, J., Zhao, Z., Poulikakos, D., Megaridis, C. M. and Miyatake, O. Modeling of the deformationof a liquid droplet impinging a flat surface, Phys. Fluids 5 (1993): 2588–99
Fukai, J., Asami, H. and Miyatake, O. Deformation and solidification behaviour of a molten metaldroplet colliding with a substrate: modeling and experiment, in: Marsh, S. P. et al. (eds.) So-lidification 1998, TMS, The Minerals, Metals & Materials Society, Warrendale, PA (1998),pp 473–83
Georjon, T. L. and Reitz, R. D. A drop-shattering collision model for multidimensional spray com-putations, Atomiz. & Sprays 9 (1999): 231–54
Gerking, L. Powder from metal and ceramic melts by laminar streams at supersonic speed, PowderMetall. Int. 25 (1993) 2: 59–65
Gerling, R., Liu, K. W. und Schimansky, F.-P. Pulverherstellung und Spruhformen von interme-tallischen Titanbasislegierungen, Kolloquium des SFB 372, Vol. 4, Universitat Bremen (1999)pp 105–26
Gerling, R., Schimansky, F. P., Wegmann, G. and Zhang, J. X. Spray forming of Ti 48.9Al (at%) andsubsequent hot isostatic pressing and forging, Mater. Sci. Engng. A326 (2002) 1: 73–8
Gosman, A. D. and Ioannides, E. Aspects of computer simulation of liquid-fueled combustors, J.Energy 7 (1983): 482–90

254 Bibliography
Grant, P. S., Cantor, B. and Katgerman, L. Modelling of droplet dynamic and thermal histories duringspray forming. I. Individual droplet behaviour, Acta Metall. Mater. 41 (1993a) 11: 3097–108
Grant, P. S., Cantor, B. and Katgerman, L. Modelling of droplet dynamic and thermal histories duringspray forming. II. Effect of process parameters, Acta Metall. Mater. 41 (1993b) 11: 3109–18
Grant, P. S. Spray forming, Progress in Mater. Sci. 39 (1995): 497–545Grant, P. S. A model for the factors controlling spray formed grain sizes, Kolloquium des SFB 372,
Vol. 3, Universitat Bremen (1998) pp 83–92Grant, P. S., Cantor, B. and Katgerman, L. Acta Metall. Mater. 41 (1993) 11: 3097Grant, P. S., Underhill, R. P., Cantor, B. and Bryant, D. J. Modelling droplet behaviour during spray
forming using FLUENT, TMS Annual Meeting, Orlando, FL (1997)Grigull, U. and Sandner, H. Warmeleitung, Springer-Verlag, Berlin, Heidelberg, New York, Tokyo
(1986)Gupta, M., Ibrahim, I. A., Mohammed, F. A. and Lavernia, E. J. Wetting and interfacial reactions in
Al–Li–SiCp metal matrix composites processing by spray atomization and deposition, J. Mater.Sci. 26 (1991): 6673–84
Gupta, M., Mohammed, F. A. and Lavernia, E. J. Heat transfer mechanisms and their effects onmicrostructure during spray atomization and codeposition of metal matrix composites, Mater. Sci.Engng. A144 (1991): 99–110
Gupta, M., Lane, C. and Lavernia, E. J. Microstructure and properties of spray atomized and depositedAl–7Si/SiC metal matrix composites, Scripta Metall. Mater. 26 (1992): 825–30
Gutierrez-Miravete, M., Lavernia, E. J., Trapaga, G. M. and Szekely, J. A mathematical model of theliquid dynamic compaction process. Part 2: formation of the deposit, Int. J. Rapid Solidification 4(1988): 125–50
Hagerty, W. W. and Shea, J. F. A study of the stability of plane fluid sheets, J. Appl. Mech. 22 (1955):509–14
Hansen, P. N., Hartmann, G. and Kallien, L. Numerical simulation of rapid solidification processes:powder and spray-forming technologies, Solidification Processing (1987): 373–6
Hansmann, S. und Muller, H. R. Hochzinnhaltige Bronzen mittels Spruhkompaktieren seigerungsarmhergestellt, Kolloquium des SFB 372, Vol. 4, Universitat Bremen (1999) pp 1–6
Hardalupas, Y., Tsai, R.-E. and Whitelaw, J. H. Unsteady breakup of liquid jets in coaxial airblastatomizers, Proc. International Conference on Liquid Atomization and Spray Systems ICLASS ’97,18–22 August, Seoul (1997) pp 326–33
Hardalupas, Y., Taylor, A. M. K. P. and Wilkins, J. H. Experimental investigation of sub-millimetredroplet impingement onto spherical surfaces, Int. J. Heat Fluid Flow 20 (1999): 477–85
Harlow, F. H. and Shannon, J. P. The splash of a liquid drop, J. Appl. Phys. 38 (1967) 10: 3855–66Hartmann, G. C. Die Erstarrung von Metallen im Spruhgießprozeß am Beispiel der Zinnbronze
CuSn6, Fortschritt Berichte VDI, Reihe 5: Grund- und Werkstoffe No. 195, VDI-Verlag Dusseldorf(1990)
Hattel, J. H. Mathematical modelling and numerical simulation of casting processes, Technical Uni-versity Denmark, Lyngby (1999)
Hattel, J. H., Pryds, N. H., Pedersen, T. B. and Pedersen, A. S. Numerical modelling of the sprayforming process: the effect of process parameters on the deposited material, Proc. Spray Depositionand Melt Atomization SDMA 2000, Bremen 200 pp 803–812
Hattel, J. H., Pryds, N., Thorborg, J. and Ottosen, P. A quasi-stationary numerical model of atom-ized metal droplets, Part I: model formulation, Modelling Simul. Mater. Sci. Engng. 7 (1999) 3:413–30

255 Bibliography
Heck, U. Zur Zerstaubung in Freifalldusen, Dissertation, Universitat Bremen (1998)Heck, U., Fritsching, U. und Bauckhage, K. Zur Fluiddisintegration in Freifall-Zerstaubern, in:
Koschel, W. W. and Haidn, O. J. (eds.) Spray’97, 3. Workshop uber Sprays, Erfassung vonSpruhvorgangen und Techniken der Fluidzerstaubung, DLR Lampoldshausen, 22–23 Oktober(1997)
Heck, U., Fritsching, U. and Bauckhage, K. Gas-flow effects on twin-fluid atomization of liquidmetals, Atomiz. & Sprays 10 (2000) 1: 25–46
Helebrook, B. T. and Edwards, C. F. Proc. 8th International Conference on Liquid Atomization andSpraying Systems ICLASS-2000, 16–20 July, Pasadena, CA (2000)
Henein, H. Single fluid atomization through the application of impulses to a melt, Mater. Sci. Engng.A326 (2002) 1: 92–100
Hetsroni, G. (ed.) Handbook of Multiphase Systems, Hemisphere, Washington, DC (1982)Hill, J. M. One-Dimensional Stefan Problems: An Introduction, Longman Scientific & Technical,
John Wiley, New York (1987)Hinze, J. O. Fundamentals of the hydrodynamic mechanism of splitting in dispersion processes,
AIChE J. 1 (1955): 289–95Hirt, C. W., Nichols, B. D. and Romero, N. C. SOLA – A Numerical Solution Algorithm for Transient
Fluid Flows, Report LA-5652, Los Alamos Scientific Laboratory, NM (1975)Hirth, J. P. Nucleation, undercooling and homogeneous structures in rapidly solidified powders, Metall.
Trans. A, 9A (1978) 3: 401–4Ho, S. and Lavernia, E. J. Thermal residual stresses in spray atomized and deposited Ni3Al, Scripta
Mater. 34 (1996) 4: 527–36Horvay, M. Theoretische und experimentelle Untersuchung uber den Einfluß des inneren
Stromungsfeldes auf die Zerstaubungseigenschaften von Drall-Druckzerstaubungsdusen, Disser-tation, Universitat Karlsruhe (1985)
Hsiang, L. P. and Faeth, G. M. Near-limit drop deformation and secondary breakup, Int. J. MultiphaseFlow 18 (1992) 5: 635–52
Hsiang, L. P. and Faeth, G. M. Drop properties after secondary breakup, Int. J. Multiphase Flow 19(1993) 5: 721–35
Hu, H. M., Lavernia, E. J., Lee, Z. H. and White, D. R. Residual stresses in spray-formed A2 toolsteel, J. Mater. Res. 14 (1999) 12: 4521–4530
Hummert, K. Spruhkompaktieren von Aluminiumwerkstoffen im industriellen Maßstab – Stand derEntwicklung, Kolloquium des SFB 372, Vol. 1, Universitat Bremen (1996) pp 199–215
Hummert, K. PM-Hochleistungsaluminium im industriellen Maßstab, Kolloquium des SFB 372,Vol. 4, Universitat Bremen (1999) pp 21–44
Inada, S. and Yang, W. Solidification of molton metal droplets impinging on a cold surface, Exp. HeatTransfer 7 (1994) 2: 93–100
Jeffreys, H. On the formation of water waves by wind, Proc. Roy. Soc. A, (1924): 189Jordan, N. und Harig, H. Spruhkompaktierte Kupferbasis-Werkstoffe – Stand der Forschungs- und
Entwicklungsarbeiten, Kolloquium des SFB 372, Vol. 3, Universitat Bremen (1998) pp 31–52Jordan, N., Schroder, R., Harig, H. and Kienzler, R. Influences of the spray deposition process on the
properties of copper and copper alloys, Mater. Sci. Engng. A326 (2002) 1: 51–62Kallien, L. Herstellung schnell erstarrter und hochunterkuhlter Metallpulver, PhD thesis, RWTH,
Aachen (1988)Karl, A. Untersuchung der Wechselwirkung von Tropfen mit Wanden oberhalb der Leidenfrost-
Temperatur, PhD thesis, Universitat Stuttgart (1997)

256 Bibliography
Karl, A., Rieber, M., Schelkle, M., Anders, K. and Frohn, A. Comparison of new numerical resultsfor droplet wall interactions with experimental results, Fluids Engng Division 236 (1996): 201–6
Kelkar, K. M., Hou, Z., Patankar, S. V., Minisandram, R. S., Forbes Jones, R. M., Carter Jr., W. T.,Srivatsa, S. K. and Madden, C. Mathematical model of the clean metal spray forming process,Proc. 4th International Conference on Spray Forming, Baltimore MD (1999)
Kienzler, R. and Schroder, R. Entwicklung von Materialmodellen zur Beschreibung des Spannungszu-standes und der Porendichte in spruhkompaktierten Komponenten, Spruhkompaktieren, Arbeits-und Ergebnisbericht 1994–1997, Kolloquium des SFB 372, Universitat Bremen (1997) pp 389–428
Klar, E. and Fesko, J. W. Powder Metallurgy Metals Handbook, Vol. 7, American Society for Metals,Materials Park, OH (1984)
Klein, M., Sadiki, A. and Janicka, J. Influence of the inflow conditions on the direct numericalsimulation of primary breakup of liquid jets, ILASS-Europe 2001, Zurich (2001) pp 475–80
Klein, M., Sadiki, A. and Janicka, J. Untersuchung des Primarzerfalls eines Flussigkeitsfilms: Ver-gleich direkte numerische Simulation, Experiment und lineare Theorie, Spray 2002, FreibergerForschungshefte A 870 Verfahrenstechnik, TU-Bergakademie Freiberg (2002) pp 63–72
Knight, R., Smith, R. W. and Lawley, A. Spray forming research at Drexel University, Int. J. PowderMetall. 31 (1995) 3: 205–13
Kohnen, G. Uber den Einfluß der Phasenwechselwirkungen bei turbulenten Zweiphasenstromungenund deren numerische Erfassung in der Euler-Lagrange Betrachtungsweise, Dissertation, Univer-sitat Halle-Wittenberg (1997)
Kothe, D. B. and Mjolsness, R. C. RIPPLE: a new model for incompressible flows with free surfaces,AIAA Journal 30 (1992): 11
Kozarek, R. L., Leon, D. D. and Mansour, A. An investigation of linear nozzles for spray formingaluminium sheets, Kolloquium des SFB 372, Vol. 1, Universitat Bremen (1996) pp 141–60
Kozarek, R. L., Chu, M. G. and Pien, S. J. An approach to minimize porosity in spray formed depositsthrough a model-based designed experiment, in: Marsh, S. P. et al. (eds.) Solidification 1998, TheMinerals, Metals & Materials Society, Warrendale, PA (1998) pp 461–71
Kramer, C., Uhlenwinkel, V. and Bauckhage, K. The sticking efficiency at the spray forming of metals,in: Wood, J. V. (ed.) Proc. 3rd International Conference on Spray Forming, Cardiff, 1996, OspreyMetals Ltd, Neath (1997)
Kramer, C. Die Kompaktierungsrate beim Spruhkompaktieren von Gauß-formigen Deposits, Disser-tation, Universitat Bremen (1997)
Krauss, M., Bergmann, D. and Fritsching, U. In-situ particle temperature, velocity and size measure-ments in the spray forming process, Proc. Spray Deposition and Melt Atomization SDMA 2000,26–28 June, Bremen, 26–28 June (2000) pp 659–70. Also: Mater. Sci. Engng. A326 (2002) 1:154–64
Lafaurie, B., Mantel, T. and Zaleski, S. Direct Navier–Stokes simulations of the near-nozzle region,in: Yule, A. J. (ed.) Proc. ILASS-Europe’98, 6–8 July, Manchester (1998) pp 54–9
Lafaurie, B., Nardone, C., Scardovelli, R., Zaleski, S. and Zanetti, G. Modelling merging and frag-mentation in multiphase flows with SURFER, J. Comp. Phys. 133 (1994): 134–47
Lampe, K. Experimentelle Untersuchung und Modellierung der Mehrphasenstromung im dusennahenBereich einer Ol-Brenner-Duse, Dissertation, Universitat Bremen (1994)
Launder, B. E. and Spalding, D. B. The numerical computation of turbulent flows, Comp. Meth. Appl.Mech. Engng. 3 (1974): 269–89
Lavernia, E. J. Spray atomization and deposition of metal matrix composites, Kolloquium des SFB372, Vol. 1, Universitat Bremen (1996) pp 63–122
257 Bibliography
Lavernia, E. J., Ayers, J. D. and Srivastan, T. S. Rapid solidification processing with specific applicationto aluminium alloys, Int. Mater. Rev. 37 (1992): 1–44
Lavernia, E. J., Baram, J. and Gutierrez, E. M. Precipitation and excess solid solubility in Mg–Al–Zrand Mg–Zn–Zr alloys processed by spray atomization and deposition, Mater. Sci. Engng. A132(1991): 119–33
Lavernia, E. J., Gomez, E. and Grant, N. J. The structures and properties of Mg–Zn–Zr and Mg–Zn–Zralloys produced by LDC, Mater. Sci. Engng. A95 (1987): 225–36
Lavernia, E. J., Rai, G. and Grant, N. J. Rapid solidification processing of 7XXX aluminum alloys: areview, Mater. Sci. Engng. A79 (1986): 211–21
Lavernia, E. J., Gutierrez, E. M., Szekely, J. and Grant, N. J. A mathematical model of the liquiddynamic compaction process. part 1: heat flow in gas atomization, Int. J. Rapid Solidification 4(1988): 89–124
Lavernia, E. J. and Wu, Y. Spray Atomization and Deposition, J. Wiley & Sons, Chichester (1996)Lawley, A. Atomization – The Production of Metal Powders, Metal Powder Industries Federation,
Princeton, NJ (1992)Lawley, A. Melt atomization and spray deposition – quo vadis, Proc. Spray Deposition and Melt
Atomization SDMA 2000, Bremen (2000) pp 3–16Lawley, A., Mathur, P., Apelian, D. and Meystel, A. Sprayforming: process fundamentals and control,
Powder Metall. 33 (1990): 109–11Leatham, A. Spray forming: alloys, products, and markets, J. Metals 51 (1999): 4, web-edition:
http://www.tms.org/pubs/journals/JOM/9904/Leatham/Leatham-9904.htmlLeatham, A. G., Brooks, R. G., Coombs, J. S. and Ogilvy, G. W. in: Wood, J. Proc. 1st International
Conference on Spray Forming, 17–19 September 1990, Osprey Metals Ltd, Neath, Paper 1 (1991)Leatham, A. G. and Lawley, A. The Osprey process: principles and applications, Int. J. Powder Metall.
29 (1993) 4: 321–9Lee, E. and Ahn, S. Solidification progress and heat transfer analysis of gas atomized alloy droplets
during spray forming, Acta Metall. Mater. 42 (1994) 9: 3231–43Lee, J., Yung, J. Y., Lee, E.-S., Park, W. J., Ahn, S. and Kim, N. J. Dispersion strengthened Cu alloys
fabricated in-situ by spray forming, Kolloquium des SFB 372, Vol. 4, Universitat Bremen (1999)pp 7–20
Lefebvre, A. H. Atomization and Sprays, Hemisphere, New York (1989)Leschziner, M. A. and Rodi, W. Calculation of annular and twin parallel jets using various discretiza-
tion schemes and turbulence-model variations, J. Fluids Engng. 103 (1981): 352–60Levi, C. G. The evolution of microcrystalline structures in supercooled metal powders, Metall. Trans.
A 19A (1988): 699–708Levi, C. G. and Mehrabian, R. Heat flow during rapid solidification of undercooled metal droplets,
Metall. Trans. A: Phys. Metall. Mater. Sci. 13A (1982): 221–34Levich, V. G. Physicochemical Hydrodynamics, Prentice Hall, NJ (1962)Li, B., Liang, XO., Earthman, J. C. and Lavernia, E. J. Two dimensional modeling of momentum and
thermal behaviour during spray atomization of γ -TiAl, Acta Mater. 44 (1996) 6: 2409–20Li, J. PhD thesis, University of Paris VI (1996)Li, X. Mechanism of atomization of a liquid jet, Atomiz. & Sprays 5 (1995): 89–105Li, X. and Tankin, R. S. Droplet size distribution: a derivation of Nukyama–Tanasawa type distribution
function, Combust. Sci. Technol. 56 (1987): 65Liang, X., Earthman, J. C. and Lavernia, E. J. On the mechanism of grain formation during spray
atomization and deposition, Acta Metall. Mater. 40 (1992) 11: 3003–16

258 Bibliography
Liang, X. and Lavernia, E. J. Solidification and microstructure evolution during spray atomizationand deposition of Ni3Al, Mater. Sci. Engng. A161 (1993): 221–35
Liang, X. and Lavernia, E. J. Evolution of interaction domain microstructure during spray deposition,Metall. Mater. Trans. A 25A (1994): 2341–9
Libera, M., Olsen, G. B. and van der Sande, J. B. Heterogeneous nucleation of solidification inatomized liquid metal droplets, Mater. Sci. Engng., A132 (1991): 107–18
Liu, H. Berechnungsmodelle fur die Geschwindigkeiten und die Abkuhlung von Tropfen imSpruhkegel einer Stahl-Zerstaubungsanlage, Dissertation, Universitat Bremen (1990)
Liu, H. Numerical modelling of gas atomization in spray forming process, Proc. 1997 TMS AnnualMeeting, 9–13 February, Orlando, FL (1997)
Liu, H. Science and Engineering of Droplets: Fundamentals and Applications, William Andrew,Norwich, NA (2000a)
Liu, H. Spray forming, in: Yu, K. O. Modelling and Simulation for Casting and Solidification: Theoryand Applications, Marcel Dekker Inc, NY (2000b)
Liu, H., Lavernia, E. J. and Rangel, R. H. Numerical simulation of substrate impact and freezing ofdroplets in plasma spray processes, J. Phys. D: Appl. Phys. 26 (1993): 1900–8
Liu, H., Lavernia, E. J. and Rangel, R. H. Numerical investigation of micropore formation duringsubstrate impact of molten droplets in plasma spray processes, Atomiz. & Sprays 4 (1994a): 369–84
Liu. H., Rangel, R. H. and Lavernia, E. J. Modeling of reactive atomization and deposition processingof Ni3Al, Acta Metall. Mater. 42 (1994b) 10, 3277–89
Loffler-Mang, M. Dusenstromung, Tropfenentstehung und Tropfenausbreitung bei rucklaufgeregeltenDrall-Druckzerstaubern, Dissertation, Universitat Karlsruhe (1992)
Love, E., Grisby, C. E., Lee, P. L. and Woodling, M. J. Experimental and Theoretical Studies ofAxisymmetric Free Jets, NACA Technical Report R-6, Hanover, MD (1959)
Low, T. B. and List, R. Collision, coalescence and breakup of raindrops, J. Atmosph. Sci. 39 (1982):1591–618
Lozano, A., Call, C. J. and Dopazo, C. An experimental and numerical study of the atomization ofa planar liquid sheet, Proc. International Conference on Liquid Atomization and Spray SystemsICLASS ’94, July, Rouen (1994)
Lubanska, H. Correlation of spray ring data for gas atomization of liquid droplets, J. Metals 2 (1970):45–9
Madejski, J. Solidification of droplets on a cold surface, Int. J. Heat Mass Transfer 19 (1976): 1009–18Madejski, J. Droplets on impact with a solid surface, Int. J. Heat Mass Transfer 26 (1983): 1095–8Majagi, S. I., Ranganathan, K., Lawley, A. and Apelian, D. Microstructural Design by Solidification
Processing, TMS Conference Proceedings, Warrendale, PA (1992) 139 ff.Malin, M. R. On the Prediction of Radially Spreading Turbulent Jets, CHAM Technical Report TR
143, London (1987)Malot, H. and Dumouchel, C. Volume-based spray drop size distribution: derivation of a generalized
gamma distribution from the application of the maximum entropy formalism, CD-ROM Proc.ILASS-Europe’99, 5–7 July, Toulouse (1999)
Manson-Whitton, E. D., Stone, I. C., Jones, J. R., Grant, P. S. and Cantor, B. Isothermal graincoarsening of spray formed alloys in the semi-solid state, Acta Materialia 50 (2002): 2517–25
Markus, S. and Fritsching, U. Spray forming with multiple atomization, Proc. Spray Deposition andMelt Atomization SDMA 2003, 22–25 June, Bremen (2003)
Markus, S., Fritsching, U. and Bauckhage, K. Jet break up of liquid metals, Proc. Spray Depositionand Melt Atomization SDMA 2000, 26–28 June, Bremen (2000) pp 497–510. Also: Mater. Sci.Engng. A326 (2002) 1: 122–33

259 Bibliography
Masuda, W. and Moriyama, E. Aerodynamic characteristics of coaxial impinging jets, JSME Int. J.Series B, 37 (1994) 4: 749–75
Mathur, P., Annavarapu, S., Apelian, D. and Lawley, A. Process control, modeling and applicationsof spray casting, J. Metals 41 (1989b): 23–8
Mathur, P., Annavarapu, S., Apelian, D. and Lawley, A. Spray casting: an integral model for processunderstanding and control, Mater. Sci. Engng. A142 (1991): 261–70
Mathur, P., Apelian, D. and Lawley, A. Analysis of the spray deposition process, Acta Metall. 37(1989a) 2: 429–43
Matteson, M. A., Madden, C. and Moran, A. L. An approach to modelling the spray-forming processwith artificial neural networks, Proc. International Conference on Spray Forming, ICSF-2, 13–15September, Swansea (1993)
Maxey, M. R. and Riley, J. J. Equation of motion for a small rigid sphere in a nonuniform flow, Phys.Fluids 26 (1983): 883–9
Mayer, W. Zur koaxialen Flussigkeitszerstaubung im Hinblick auf die Treibstoffaufbereitung in Rake-tentriebwerken, Dissertation, Universitat Erlangen (1993)
Medwell, J. O.; Gethin, D. T. and Muhamad, N. Analysis of the Osprey preform deposition process,in Advances in Powder Matallurgy and Particulate Materials 1992, Vol. 1: Powder Production andSpray Forming, MPIF, Princeton, NJ, pp 249–71
Megaridis, C. M. Presolidification liquid metal droplet cooling under convective conditions, Atomiz.& Sprays 3 (1993) 2: 171–91
Menchaca-Rocha, A., Huidobro, F., Martinez-Davalos, A., Michaelian, K., Perez, A., Rodriguez, V.and Carjan, N. Coalescence and fragmentation of colliding mercury drops, J. Fluid Mech. 346(1997): 291–318
Meyer, O., Fritsching, U. and Bauckhage, K. Numerical investigation of alternative process conditionsfor influencing the thermal history of spray deposited billets, Proc. Spray Deposition and MeltAtomization SDMA 2000, 26–28 June, Bremen (2000) pp 771–88
Meyer, O., Fritsching, U. and Bauckhage, K. Numerical investigation of alternative process conditionsfor influencing the thermal history of spray deposited billets, Int. J. Thermal Sci. 42 (2003):153–68
Meyer, O., Schneider, A., Uhlenwinkel, V. and Fritsching, U. Convective heat transfer from a billetdue to an oblique impinging circular jet within the spray forming process, Int. J. Thermal Sci. 42(2003) 6: S561–9
Middleman, S. Modeling Axisymmetric Flows, Dynamics of Films, Jets, and Drops, Academic Press,San Diego, CA (1995)
Miles, J. W. On the generation of surface waves by shear flows, Part 1: J. Fluid Mech. 3 (1957):185–204.
Miles, J. W. On the generation of surface waves by shear flows, Part 2: J. Fluid Mech. 6 (1958):568–82
Miles, J. W. On the generation of surface waves by shear flows, Part 3: J. Fluid Mech. 7 (1960):469–478
Miles, J. W. On the generation of surface waves by shear flows, Part 4: J. Fluid Mech. 13 (1961):433–48
Mingard, K. P., Alexander, P. W., Langride, S. J., Tomlinson, G. A. and Cantor, B. Direct measurementof sprayform temperatures and the effect of liquid fraction on microstructure, Acta Mater. 46 (1998)10: 3511–21
Mingard, K. P., Cantor, B., Palmer, I. G., Hughes, I. R., Alexander, P. W., Willis, T. W. and White, J.Macro-segregation in aluminium alloy spray formed billets, Acta Mater. 48 (2000): 2435–49

260 Bibliography
Minisandram, R. S., Forbes Jones, R. M., Kelkar, K. M., Patankar, S. V. and Carter Jr., W. T. Predictionof thermal history of preforms produced by the clean metal spray forming process, Proc. SprayDeposition and Melt Atomization SDMA 2000, Bremen (2000) pp 789–802. Also: Mater. Sci.Engng. A326 (2002) 1: 184–93
Moran, A. L. and White, D. R. Developing intelligent control for spray forming processes, J. Metals42 (1990) 7: 21–4
Muller, F. G., Benz, M. G., Carter Jr., W. T., Forbes, R. M. und Leatham, A. Neues Verfahren zur Her-stellung von Pulver, Formteilen oder Halbzeugen aus Titan oder keramikfreien Superlegierungen;Kolloquium des SFB 372, Vol. 1, Universitat Bremen (1996) pp 169–88
Muller, H. R. Eigenschaften und Einsatzpotential spruhkompaktierter Kupferlegierungen, Kolloquiumdes SFB 372, Vol. 1, Universitat Bremen (1996) pp 33–56
Mullis, A. M. and Cochrane, R. F. Grain refinement and the stability of dendrites growing intoundercooled pure metals and alloys, J. Appl. Phys. 82 (1997): 3783–90
Mundo, C. Zur Sekundarzerstaubung newtonscher Fluide an Oberflachen, Dissertation, UniversitatErlangen (1996)
Mundo, C., Sommerfeld, M. and Tropea, C. Droplet–wall collisions: experimental studies of thedeformation and breakup process, Int. J. Multiphase Flow 21 (1995): 151–73
Muoio, N. G., Crowe, C. T., Bergmann, D. and Fritsching, U. Numerical simulation of the turbu-lent gas-droplet field in spray forming, 3rd International Symposium on Engineering TurbulenceModelling and Measurements, 27–29 May, Kreta (1996)
Muoio, N. G., Crowe, C. T., Bergmann, D. and Fritsching, U. Numerical simulation of spraytemperature in spray forming process by ceramic powder injection, ASME IMECE Mul-tiphase Flow and Heat Transfer in Materials Processing, 17–22 November, Atlanta, GA(1996)
Muoio, N. G., Crowe, C. T., Fritsching, U. and Bergmann, D. Modelling metal droplet sprays in sprayforming, ASME Fluids Engng Division 223 (1995): 111–15
Muoio, N., Crowe, C. T., Fritsching, U. and Bergmann, D. Effect of thermal coupling on numeri-cal simulations of the spray forming process, Proc. 2nd International Symposium on NumericalMethods for Multiphase Flows, 7–11 July, San Diego, CA (1996)
Nasr, G. G., Yule, A. J. and Bendig, L. Industrial Sprays and Atomization: Design, Analysis andApplications, Springer-Verlag, Heidelberg (2002)
Nichiporenko, O. S. and Naida, Y. I. Soviet Powder Metallurgy Metal Ceramics 67 (1968): 509Nichols, B. D., Hirt, C. W. and Hotchkiss, R. S. SOLA-VOF: A Solution Algorithm for Transient Fluid
Flow with Multiple Free Boundaries, Report LA-8355, Los Alamos Scientific Laboratory, NM(1980)
Nigmatulin, R. I. Dynamics of Multiphase Media, Vols. 1 and 2, Hemisphere, Washington, DC (1990,1991)
Nobari, M. R. H. and Tryggvason, G. Numerical simulations of three-dimensional drop collisions,AIAA Journal 34 (1996): 750–5
Nobari, M. R. H., Jan, Y.-J. and Tryggvason, G. Head-on collision of drops – a numerical investigation,Phys. Fluids 8 (1996): 29–42
Norman, A. F., Eckler, K., Zambon, A., Gartner, F., Moir, S. A., Ramous, E., Herlach, D. M. andGreer, A. L. Application of microstructure-selection maps to droplet solidification: a case study ofthe Ni–Cu system, Acta Mater. 46 (1998) 10: 3355–70
Nunez, L. A., Lobel, T. and Palma, R. Atomizers for molten metals: macroscopic phenomena andengineering aspects, Atomiz. & Sprays 9 (1999) 6: 581–600

261 Bibliography
Obermeier, F. (ed.) 7. Workshop uber Techniken der Fluidzerstaubung und Untersuchungenvon Spruhvorgangen, Spray 2002, Freiberger Forschungshefte A 870 Verfahrenstechnik, TU-Bergakademie, Freiberg (2002)
Oertel, H. und Laurien, E. Numerische Stromungsmechanik, 2. Aufl. Vieweg Braunschweig(2003)
Ojha, S. N., Jha, J. N. and Singh, S. N. Microstructural modification in Al–Si eutectic alloy producedby spray deposition, Scripta Metall. Mater. 25 (1991): 443–7
Ojha, S. N., Tripathi, A. K. and Singh, S. N. Spray atomization and deposition of an Al–4Cu–20Pballoy, Powder Metall. Int. 25 (1993) 2: 65–9
Orme, M. A novel technique of rapid solidification net-form materials synthesis, J. Mater. Engng.Perform. 2 (1993) 3: 399–405
Orme, M. and Huang, C. Phase change manipulation for droplet-based solid freeform fabrication, J.Heat Transfer 119 (1997): 818–23
Orme, M., Liu, Q. and Fischer, J. Mono-disperse aluminium droplet generation and deposition fornet-form manufacturing of structural components, Proc. International Conference on Liquid At-omization and Spray Systems ICLASS 2000, 16–20 July, Passadena, CA (2000)
O’Rourke, P. J. Collective drop effects on vaporizing liquid sprays, PhD thesis, Los Alamos NationalLaboratory, NM (1981)
O’Rourke, P. J. and Amsden, A. A. The TAB Method for Numerical Calculation of Spray DropletBreakup, Report LA-UR-87–2105, Los Alamos National Laboratory, NM (1987)
Ottosen, P. Numerical simulation of spray forming, PhD thesis, Technical University of Denmark,TM.93.27 (1993)
Ozols, A. and Sancho, E. Solidification rates in centrifugal atomisation, Proc. 1998 PM WorldCongress, Vol. 1, 18–22 October, Grenada (1998) pp 179–84
Panchagnula, M. V., Sojky, P. E. and Bajaj, A. K. The non-linear breakup of annular liquid sheets, in:Yule, A. J. (ed.) Proc. ILASS-Europe’98, 6–8 July, Manchester, (1998) pp 36–41
Pasandideh-Fard, M., Bhola, R., Chandra, S. and Mostaghimi, J. Deposition of tin droplets on a steelplate: simulations and experiments, Int. J. Heat Mass Transfer 41 (1998): 2929–45
Pasandideh-Fard, M., Mostaghimi, J. and Chandra, S. Modeling sequential impact of two moltendroplets on a solid surface, Proc. ILASS-America, Indianapolis, IN (1999)
Pasandideh-Fard, M., Qiao, Y. M., Chandra, S. and Mostaghimi, J. Capillary effects during dropletimpact on a solid surface, Phys. Fluids 8 (1996): 650–9
Passow, C. H., Chun, J. H. and Ando, T. Spray deposition of a Sn–40 wt.% Pb alloy with uniformdroplets, Metall. Trans. A 24A (1993): 1187–93
Patankar, S. V. Numerical Heat Transfer and Fluid Flow, McGraw-Hill, Columbus, OH(1981)
Payne, R. D., Matteson, M. A. and Moran, A. L. Application of neural networks in spray formingtechnology, Int. J. Powder Metall. 29 (1993) 4: 345–51
Payne, R. D., Rebis, A. L. and Moran, A. L. Spray forming quality predictions via neural networks,J. Mat. Engng. and Perf. 2 (1996) 5: 693–702
Pedersen, T. P., Hattel, J. H., Proyds, N. H., Pedersen, A. S., Buchholz, M. and Uhlenwinkel, V. A newintegrated numerical model for spray atomization and deposition: comparison between numericalresults and experiments, Proc. Spray Deposition and Melt Atomization SDMA 2000, Bremen (2000)pp 813–24
Pedersen, T. B. Spray forming – a new integrated numerical model, PhD thesis, Technical Universityof Denmark (2003)

262 Bibliography
Petersen, K., Pedersen, A. S., Pryds, N., Thorsen, K. A. and List, J. L. The effect of particles indifferent sizes on the mechanical properties of spray formed steel composites, Mater. Sci. Engng.A326 (2002) 1: 40–50
Pien, S. J., Luo, J., Baker, F. W. and Chyu, M. K. Numerical simulation of a complex spray formingprocess, Kolloquium des SFB 372, Vol. 1, Universitat Bremen (1996) pp 161–8
Pilch, M. and Erdmann, C. A. Use of breakup time data and velocity history data to predict the maxi-mum size of stable fragments for acceleration-induced breakup of a liquid drop, Int. J. MultiphaseFlow 13 (1987): 741–57
Poulikakos, D. and Waldvogel, J. M. Heat transfer and fluid dynamics in the process of spray depo-sition, Adv. Heat Transfer 28 (1996): 1–74
Prakash, C. and Voller, V. On the numerical solution of continuum mixture model equations describingbinary solid–liquid phase change, Numer. Heat Transfer B 15 (1989): 171–89
Prud’homme, R. and Ordonneau, G. The maximum entropy method applied to liquid jet atomization,CD-ROM Proc. ILASS-Europe’99, 5–7 July, Toulouse (1999)
Pryds, N. H. and Hattel, J. H. Numerical modelling of rapid solidification, Modelling Simul. Mater.Sci. Engng. 5 (1997): 451–72
Pryds, N., Hattel, J. H., Pedersen, T. B. and Thorborg, J. An integrated numerical model of the sprayforming process, Acta Mater. 50 (2002): 4075–91
Pryds, N., Hattel, J. H. and Thorborg, J. A quasi-stationary numerical model of atomized metaldroplets, II: prediction and assessment, Modelling Simul. Mater. Sci. Engng. 7 (1999): 431–46
Quested, P. N., Brooks, R. F., Day, A. P., Richardson, M. J. and Mills, K. C. The physical propertiesof alloys relevant to spray forming, in: Wood, J. V. (ed.) Proc. 3rd International Conference onSpray Forming, 1996, Cardiff, Osprey Metals Ltd, Neath (1997)
Qian, J. and Law, C. K. Regimes of coalescence and separation in droplet collision, J. Fluid Mech.331 (1997): 59–80
Rai, G., Lavernia, E. J. and Grant, N. J. Factors influencing the powder size and distribution inultrasonic gas atomization, J. Metals 37 (1985) 8: 22–6
Rampant Release 4.0.14, Copyright 1996 Fluent Inc. Hanover, NHRangel, R. H. and Sirignano, W. A. The linear and nonlinear shear stability of a fluid sheet, Phys.
Fluids A3 (1991) 10: 2392–400Ranz, W. E. and Marshall, W. R. Evaporation from drops – I and II, Chem. Eng. Prog. 48 (1952): 141
and 173Rao, K. P. and Mehrotra, S. P. in: Hausner, H. et al. (eds.) Modern Developments in Powder Metallurgy,
Vol. 12, Metal Powder Industries Federation, Princeton, NJ (1980) pp 113–30Rau, S. Uberprufung der Eignung von CFD-Simulationsrechnungen zur Ermittlung von
Warmeubergangskoeffizienten auf einer Bolzenoberflache in einer einphasigen Freistrahlstromung,Studienarbeit thesis, University Bremen (2002)
Rayleigh, Lord, On the stability of jets, Proc. London Math. Soc. 10 (1878): 4–13Rebis, R., Madden, C., Zappia, T. and Cai, C. Computer aided process planning and simulation for the
Osprey spray forming process, in: Wood, J. V. (ed.) Proc. 3rd International Conference on SprayForming, 1996, Cardiff, Osprey Metals Ltd, Neath (1997)
Reeks, M. W. and McKee, S. The dispersive effect of Basset history forces on particle motion in aturbulent flow, Phys. Fluids 27 (1984) 7: 1573 ff.
Reich, W. and Rathjen, K. D. Numerische Simulation des Tropfenpralls auf feste, ebene Flachen,Studienarbeit Fachgebiet Verfahrenstechnik der Universitat Bremen (1990)

263 Bibliography
Reichelt, W. Stand der industriellen Anwendung des Spruhkompaktierens, Kolloquium des SFB 372,Vol. 1, Universitat Bremen (1996) pp 189–98
Reichelt, L., Pawlowski, A. and Renz, U. Numerische Untersuchungen zum aerodynamischenTropfenzerfall mit der Volume-of-Fluid (VOF)-Methode, Freiberger Forschungshefte A 870 Ver-fahrenstechnik, TU-Bergakademie, Freiberg (2002) pp 133–42
Rein, M. Phenomena of liquid drop impact on solid and liquid surfaces, Fluid Dynamics Research 12(1993): 61–93
Rein, M. The transitional regime between coalescing and splashing drops, J. Fluid Mech. 306 (1996):145–65
Rein, M. Spray deposition: the importance of droplet impact phenomena, Kolloquium des SFB 372,Vol. 3, Universitat Bremen (1998) pp 115–38
Reitz, R. D. Mechanisms of breakup of round liquid jets, PhD thesis, Princeton University, NJ (1978)Reitz, R. D. and Bracco, F. V. Mechanism of atomization of a liquid jet, Phys. Fluids 25 (1982) 10:
1730–42Reitz, R. D. and Diwarkar, R. Structure of high pressure fuel sprays, The Engineering Society for
Advancing Mobility, Land, Sea, Air, and Space, Warrendale, PA, Paper 870598 (1987)Ridder, S. D. and Biancaniello, F. S. Process control during high pressure atomization, Mater. Sci.
Engng. 98 (1988): 47–51Ridder, S. D., Osella, S. A., Espina, P. I. and Biancaniello, F. S. Intelligent control of particle size
distribution during gas atomization, Int. J. Powder Metall. 28 (1992) 2: 133–8Rieber, M. and Frohn, A. Numerical simulation of splashing drops, Proc. ILASS’98, 6–8 July, Manch-
ester (1998)Rioboo, R., Marengo, M. and Tropea, C. Time evolution of liquid drop impact onto solid, dry surfaces,
Exp. Fluids 33 (2002): 112–24Roach, S. J., Henein, H. and Owens, D. C. A new technique to measure dynamically the surface
tension, viscosity and density of molten metals, Light Metals 4 (2001): 1285–91Roe, P. L. Characteristic based schemes for the Euler equations, Ann. Rev. Fluid Mech. 18 (1986):
337–86Roisman, I. V., Rioboo, R. and Tropea, C. Model for single drop impact on dry surfaces, Proc.
International Conference on Liquid Atomization and Spray Systems ICLASS 2000, Pasadena, CA(2000)
Roisman, I. V. and Tropea, C. Impact of a drop onto a wetted wall: description of crown formationand propagation, J. Fluid Mech 472 (2002): 373–97
Rosten, H. I. and Spalding, D. B. The PHOENICS reference manual, CHAM Technical Report TR/200,London (1987)
Ruckert, F. und Stocker, P. Die neue Alunimium-Silizium-Zylinderlaufbahn-Technologie fur Kurbel-gehause aus Aluminiumdruckguß, Kolloquium des SFB 372, Vol. 4, Universitat Bremen (1999)pp 45–60
Ruger, M., Hohmann, S., Sommerfeld, M. and Kohnen, G. Euler/Lagrange calculations of tur-bulent spray: the effect of droplet collisions and coalescence, Atomiz. & Sprays 10 (2000) 1:47–82
Rumberg, O. and Rogg, B. Spray modelling via a joint-PDF formulation for two-phase flow, CD-ROMProc. ILASS-Europe’99, 5–7 July, Toulouse (1999)
Sadhal, S. S., Ayyaswamy, P. S. and Chung, J. N. Transport Phenomena with Drops and Bubbles,Mechanical Engineering Series, Springer Verlag, New York (1997)

264 Bibliography
Samenfink, W., Elsaßer, A. and Dullenkopf, K. Secondary breakup of liquid droplets: experimen-tal investigation for a numerical description, Proc. Sixth International Conference on LiquidAtomization and Spray Systems ICLASS ’94, 18–22 July, Palais des Congres, Rouen (1994)pp 156–63
Sanmarchi, C., Liu, H., Lavernia, E. J., Rangel, R. H., Sickinger, A. and Muhlberger, E., Numericalanalysis of the deformation and solidification of a single droplet impinging on a flat surface, J.Mater. Sci. 28 (1993): 3313–21
Sarkar, S. and Balakrishnan, L. Application of a Reynolds-stress turbulence model to the compressibleshear layer, ICASE Report 90–18, NASA CR 182002 (1990)
Scardovelli, R. and Zaleski, S. Direct numerical simulation of free-surface and interfacial flow, Ann.Rev. Fluid Mech. 31 (1999): 567–603
Schatz, A. Prozeßsimulation fur die Herstellung von Metallschmelzen durch die Gas- und Wasser-zerstaubung, lecture skript held at IWT Bremen, 29 September (1994)
Schelkle, M., Rieber, M., and Frohn, A. Comparison of lattice Boltzmann and Navier–Stokes simu-lations of three-dimensional free surface flows, Fluids Engng Division 236 (1996) Fluids Engng.Div. Conf. Vol. 1 ASME 1996: 207–212
Scheller, B. L. and Bousfield, D. W. Newtonian drop impact with a solid surface, AIChE Journal 41(1995) 6: 1357–67
Schmaltz, K. and Amon, C. Experimental verification of an impinging molten metal droplet numericalsimulation, Proc. ASME Heat Transfer Div. 317 (1995): 219–26
Schmehl, R. CFD analysis of fuel atomization, secondary droplet breakup and spray dispersion in thepremix duct of a LPP combustor, 8. International Conference on Liquid Atomization and SpraySystems ICLASS, July Passadena, CA, (2000)
Schneider, A., Meyer, O., Tillwick, F., Uhlenwinkel, V. und Fritsching, U. KonvektiverWarmeubergang an einem schrag angestromten Bolzen in einer turbulenten Dusenstromung, Kol-loquium des SFB 372, Vol. 5, Universitat Bremen (2001) pp 155–78
Schneider, A. Uhlenwinkel, V. und Bauckhage, K. Zum Ausfließen von Metallschmelzen, Kolloquiumdes SFB 372, Vol. 5, Universitat Bremen (2001) pp 69–96
Schneider, S. and Walzel, P. Zerfall von Flussigkeiten bei Dehnung im Schwerefeld, in: Walzel, P.and Schmidt, D. (eds.) Proc. SPRAY ’98, 13–14 October, Essen (1998)
Schonung, B. E. Numerische Stromungsmechanik, Springer Verlag, Berlin 1990Schroder, R. und Kienzler, R. Kontinuumsmechanische Untersuchungen an spruhkompaktierten De-
posits, Hart.-Tech.-Mitteilung 3 (1998a): 172–8Schroder, R. und Kienzler, R. Numerische Untersuchungen an spruhkompaktierten bolzenformigen
Deposits, Kolloquium des SFB 372, Vol. 3, Universitat Bremen (1998b) pp 93–114Schroder, T. Tropfenbildung an Gerinnestromungen im Schwere- und Zentrifugalfeld, Fortschr. Ber.
VDI Reihe 3: Verfahrenstechnik, No. 503, VDI-Verlag, Dusseldorf (1997)Schulz, G. Economic production of fine, prealloyed MIM powders by the NANOVAL gas atomization
process, Adv. Powder Metall. & Part. Materials – 1996, Metal Powder Industries Federation,Princeton, NJ (1996) pp 1–35 – 1–41
Sellens, R. W. and Brzustowski, T. A. A prediction of the drop size distribution in a spray from firstprinciples, Atomiz. & Spray Technol. I (1985): 85
Sellens, R. W. Prediction of the drop size and velocity distribution in a spray based on the maximumentropy formalism, Part. Part. Syst. Charact. 6 (1989): 17
Seok, H. K., Lee, H. C., Oh, K. H., Lee, J.-C., Lee, H. I. and Ra, H. Y. Formulation of rod formingmodels and their application to spray forming, Metall. Mater. Trans. A 31A (2000): 1479–88

265 Bibliography
Seok, H. K., Yeo, D. H., Oh, K. H., Lee, J.-C., Lee, H.-I. and Ra, H. Y. A three-dimensional modelof the spray forming method, Metall. Mater. Trans. A 29 (1998): 699–708
Seok, H. K., Yeo, D. H., Oh, K. H., Ra, H. Y. and Shin, D. S. 3-dimensional forming model of rod inspray forming method, in: Wood, J. V. (ed.) Proc. 3rd International Conference on Spray Forming,1996, Cardiff, Osprey Metals Ltd, Neath (1997)
Shan, X. and Chen, H. Simulation of non-ideal gases and liquid–gas phase transitions by the latticeBoltzmann equation, Phys. Rev. E 49 (1994): 2941–8
Shannon, C. E. and Weaver, W. The Mathematical Theory of Communication, University of IllinoisPress, Urbana, IL (1949)
Shokoohi, F. and Elrod, H. G. Numerical investigation of the disintegration of liquid jets, J. Comput.Phys. 71 (1987): 324–42
Shukla, P., Mandal, R. K. and Ojha, S. N. Non-equilibrium solidification of undercooled dropletsduring atomization process, Bull. Mater. Sci. 24 (2001) 5: 547–54
Shukla, P., Mishra, N. S. and Ojha, S. N. Modeling of heat flow and solidification during atomizationand spray deposition processing, J. Thermal Spray Technol. 12 (2003) 1: 95–100
Singer, A. R. E. The principle of spray rolling of metals, Metal Mater. 4 (1970): 246–50Singer, A. R. E. British Patent No. 1, 262, 471 (1972a)Singer, A. R. E. Aluminium and aluminium-alloy strip produced by spray deposition and rolling, J.
Inst. Metals 100 (1972b): 185–90Singer, A. R. E. Recent developments and opportunities in spray forming, Kolloquium des SFB 372,
Vol. 1, Universitat Bremen (1996) pp 123–40Singh, R. P., Lawley, A., Friedman, S. and Nurty, Y. V. Microstructure and properties of spray cast
Cu–Zr alloys, Mater. Sci. Engng. A145 (1991): 243–55Sirignano, W. A. Fluid Dynamics and Transport of Droplets and Sprays, Cambridge University Press,
New York (1999)Sizov, A. M. Dispersion of Melts by Supersonic Gas Jets, Metallurgija, Verlag Moskau (1991)Smith, M. F., Neiser, R. A. and Dykhuizen, R. C. NTSC’94, Proc. 7th National Thermal Spray
Conference, 12–15 June, American Society of Metals, Boston, MA (1994)Sommerfeld, M. Modellierung und numerische Berechnung von partikelbeladenen turbulenten
Stromungen mit Hilfe des Euler/Lagrange Verfahrens, Verlag Shaker, Aachen (1996)Song, J. L., Dowson, A., Jacobs, M. H., Brooks, J. K. and Beden, I. FE simulation of the ring rolling
process and the implications of prior processing by low pressure centrifugal spray deposition, Adv.Technol. Plasticity 12 (1999): 2419–24
Spalding, D. B. The calculation of free-convection phenomena in gas–liquid mixtures, ICHMT Sem-inar, Dubrovnik (1976)
Spalding, D. B. Combustion and Mass Transfer, 1st Edn., Pergamon Press, Oxford (1979)Spiegelhauer, C., Shaw, L., Overgaard, J. und Oaks, G. Horizontale Spruhkompaktierung von großen
Bolzen aus Fe-Legierung, Kolloquium des SFB 372, Vol. 1, Universitat Bremen (1996) pp 57–62Spiegelhauer, C. Properties of spray formed highly alloyed tool steels, Kolloquium des SFB 372,
Vol. 3, Universitat Bremen (1998) pp 1–8Spiegelhauer, C. State of the art for making tool steel billets by spray forming, Kolloquium des SFB
372, Vol. 5, Universitat Bremen (2001) pp 63–8Srivastava, V. C., Mandal, R. K. and Ojha, S. N. Monte Carlo simulation of droplet mass flux during gas
atomization and deposition, Proc. Spray Deposition and Melt Atomization SDMA 2000, Bremen(2000) pp 855–868
STAR-CD, User Guide, Computational Dynamics Ltd (1999)

266 Bibliography
Sterling, A. M. and Schleicher, C. A. The instability of capillary jets, J. Fluid Mech. 68 (1975): 477–95Sterling, T. L., Salmon, J., Becker, D. J. and Savarese, D. F. How to Build a Beowulf, A Guide to the
Implementation and Application of PC Clusters, MIT Press, Cambridge, MA (1999)Su, Y. H. and Tsao, C. Y. A. Modeling of solidification of molten metal droplets during atomization,
Metall. Mater. Trans. 28B (1997): 1249–55Taylor, G. I. Generation of Ripples by Wind Blowing over a Viscous Liquid, Collected Works of G. I.
Taylor, Vol. 3 (1940)The Aluminum Association, Aluminum Industry Technology Roadmap, The Aluminum Association,
Washington, DC (1997)Tillwick, F. Ermittlung von Warmeubergangskoeffizienten an der Bolzenoberflache in einer einphasi-
gen Freistrahlstromung, Studienarbeit, Universitat Bremen (2000)Ting, J., Peretti, M. W. and Eisen, W. B. The effect of deep aspiration on gas-atomized powder yield,
Proc. Spray Deposition and Melt Atomization SDMA 2000, Bremen (2000) pp 483–96, Also: Mater.Sci. Engng. A326 (2002) 1: 110–21
Tinscher, R., Bomas, H. und Mayr, P. Untersuchungen zum Spruhkompaktieren des Stahls 100Cr6,Kolloquium des SFB 372, Vol. 4, Universitat Bremen (1999) pp 77–104
Torrey, M. D., Cloutman, L. D., Mjolsness, R. C. and Hirt, C. W. NASA-VOF2D: A Computer Programfor Incompressible Flows with Free Surfaces, Report LA-10612-MS, Los Alamos Scientific, NM(1985)
Torrey, M. D., Mjolsness, R. C. and Stein, L. R. NASA-VOF3D: A Three-Dimensional Computer Pro-gram for Incompressible Flows with Free Surfaces, Report LA-11009-MS Los Alamos ScientificLaboratory, NM (1987)
Trapaga, G., Matthys, E. F., Valencia, J. J. and Szekely, J. Fluid flow, heat transfer and solidificationof molten metal droplets impinging on substrates – comparison of numerical and experimentalresults, Metall. Trans. B Process Metall. 23B (1992): 701–18
Trapaga, G. and Szekely, J. Mathematical modeling of the isothermal impingement of liquid dropletsin spray forming, Metall. Trans. B 22 (1991): 901–10
Truckenbrodt, E. Fluidmechanik, Vol. 1: Grundlagen und elementare Stromungsvorgangedichtebestandiger Fluide, Springer-Verlag, Berlin u.a., 3. Aufl. (1989)
Truckenbrodt, E. Fluidmechanik, Vol. 2: Elementare Stromungsvorgange dichteveranderlicher Fluidesowie Potential- und Grenzschichtstromungen, Springer-Verlag, Berlin u.a. (1980)
Tsao, C.-Y. A. and Grant, N. J. Modeling of the liquid dynamic compaction spray process, Int. J.Powder Metall. 30 (1994) 3: 323–33
Tsao, C.-Y. A. and Grant, N. J. Microstructure and recrystallization behaviour of in-situ alloyed andmicroalloyed spray-formed SAE 1008 steel, Kolloquium des SFB 372, Vol. 4, Universitat Bremen(1999) pp 61–76
Turnbull, D. Formation of crystal nuclei in liquid metals, J. Appl. Phys. 21 (1950): 1022–8Uhlenwinkel, V. Zum Ausbreitungsverhalten der Partikeln bei der Spruhkompaktierung von Metallen,
Dissertation, Universitat Bremen (1992)Uhlenwinkel, V., Fritsching, U. and Bauckhage, K. The influence of spray parameters on local mass
fluxes and deposit growth rates during spray compaction process, Proc. 5th International Con-ference on Liquid Atomization and Spray Systems, ICLASS-91, Gaithersburg, MD, NIST SP813(1991) pp 483–90
Uhlenwinkel, V., Fritsching, U., Bauckhage K. und Urlau, U. Stromungsuntersuchungen imDusennahbereich einer Zweistoffduse – Modelluntersuchungen fur die Zerstaubung von Me-tallschmelzen, Chem.-Ing. Tech. 62 (1990) 3: 228–9, Synopse 1840

267 Bibliography
Unal, A. Effect of processing variables on particle size in gas atomization of rapidly solidified alu-minium powders, Mater. Sci. Technol. 3 (1987): 1029–39
Unal, A. Flow separation and liquid rundown in a gas-atomization process, Metall. Trans. 20B (1989):613–22
Underhill, R. P., Grant, P. S., Bryant, D. J. and Cantor, B. Grain growth in spray-formed Ni superalloys,J. Mater. Synthesis Processing 3 (1995) 3: 171–9
van der Sande, E. and Smith, J. M. Jet breakup and air entrainment by low-velocity turbulent jets,Chem. Engng. Sci. 31 (1973) 3: 219–24
Vardelle, A., Themelis, N. J., Dussoubs, B., Vardelle, M. and Fauchais, P. Transport and chemicalrate phenomena in plasma sprays, High Temp. Chem. Process 1 (1997) 3: 295–313
Venekateswaren, S., Weiss, J. M. and Merkle, C. L. Propulsion Related Flowfields Using Precondi-tioned Navier–Stokes Equations, Technical Report AAIA-92-3437, American Institute of Aero-nautics and Astronautics, Reston, VA (1992)
Voller, V. R., Swaminathan, C. R. and Thomas, B. G. Fixed grid techniques for phase change problems:a review, Int. J. Num. Methods Engng. 30 (1990): 875–98
Voller, V. R., Swaminathan, C. R. and Thomas, B. G. General source-based methods for solidificationphase change, Num. Heat Transfer, Part B 19 (1991): 175–89
Waldvogel, J. M. and Poulikakos, D. Solidification phenomena in picoliter size solder droplet depo-sition on a composite substrate, Int. J. Heat Mass Transfer 40 (1997): 295–309
Walzel, P. Zerteilgrenze beim Tropfenaufprall, Chem.-Ing.-Tech. 52 (1980): 338–9Wang, G. X. and Matthys, E. F. Modelling of heat transfer and solidification during splat cooling:
effect of splat thickness and splat/substrate thermal contact, Int. J. Rapid Solidification 6 (1991):141–74
Wang, G. X. and Matthys, E. F. Numerical modelling of phase change and heat transfer during rapidsolidification processes: use of control volume integral with element subdivision, Int. J. Heat MassTransfer 35 (1992): 141–53
Weber, C. Zum Zerfall eines Flussigkeitsstrahles, Z. Angew. Math. Mech. 11 (1931): 138–45Weiss, J. M. and Smith, W. A. Preconditioning applied to variable and constant density flows, AIAA
Journal 33 (1995): 2050–57Weiss, D. A. and Yarin, A. L. Single drop impact onto liquid films: neck distortion, jetting, tiny bubble
entrainment, and crown formation, J. Fluid Mech. 385 (1999): 229–54Welch, J. E., Harlow, F. H., Shannon, J. P. and Daly, B. J. The MAC-Method: A Computing Technique for
Solving Viscous, Incompressible, Transient Fluid-Flow Problems Involving Free Surfaces, ReportLA-3425, Los Alamos Scientific Laboratory, NM (1966)
Winnikow, S. and Chao, B. T. Droplet motion in purified systems, Phys. Fluids 9 (1965) 1:50–61
Wood, J. V. (ed.) Proc. 2nd International Conference on Spray Forming, Swansea, 1993, Woodhead,Cambridge (1993)
Wood, J. V. (ed.) Proc. 3rd International Conference on Spray Forming, Cardiff, 1996, Osprey MetalsLtd, Neath (1997)
Wood, J. V. (ed.) Proc. 4th International Conference on Spray Forming, Baltimore, MD 1999, OspreyMetals Ltd and Welsh Development Agency, Neath (1999)
Woodruff, D. P. The Solid–Liquid Interface, Cambridge University Press (1973)Wu, Y., Zhang, J. and Lavernia, E. J. Modeling of the incorporation of ceramic particulates in
metallic droplets during spray atomization and coinjection, Metall. Mater. Trans. B 25 (1994):135–47

268 Bibliography
Wunnenberg, K. Spruhkompaktieren von Stahl: Verfahrenstechnik und Produkteigenschaften, Kollo-quium des SFB 372, Vol. 1, Universitat Bremen (1996) pp 1–32
Xu, Q. and Lavernia, E. J. Numerical calculations of heat transfer and nucleation in the initiallydeposited material during spray atomization and deposition, Proc. 4th International Conferenceon Spray Forming ICSF, 13–15 September, Baltimore, MD (1999)
Xu, Q. and Lavernia, E. J. Fundamentals of the spray forming process, Proc. Spray Deposition andMelt Atomization SDMA 2000, Bremen (2000) pp 17–36
Yakhot, V. and Orszag, S. A. Renormalization group analysis of turbulence, I. basic theory, J. Sci.Comput. 1 (1986): 3–51
Yang, B., Wang, F., Cui, H., Duan, B. Q. and Zhang, J. S. Research and development of spray depositedmaterial in China, Proc. Spray Deposition and Melt Atomization SDMA 2000, Bremen (2000)pp 53–60
Yarin, A. L. and Weiss, D. A. Impact of drops on solid surfaces: self-similar capillary waves, andsplashing as a new type of kinematic discontinuity, J. Fluid Mech. 283 (1995): 141–73
Yearling, P. R. and Gould, R. D. Convective heat and mass transfer from single evaporating water,methanol and ethanol droplets, ASME Fluids Engng Division 223 (1995): 33–8
Yule, A. J. and Dunkley, J. J. Atomization of Melts, Clarendon Press, Oxford (1994)Zaleski, S. and Li, J. Direct simulation of spray formation, Proc. International Conference on Liquid
Atomization and Spray Systems ICLASS ’97, Seoul, August (1997) pp 812–19Zaleski, S., Li, J., Succi, S., Scardovelli, R. and Zanetti, G. Direct numerical simulation of flows with
interfaces, Proc. 2nd International Conference on Multiphase Flow, April, Kyoto (1995)Zeng, X. and Lavernia, E. J. Interfacial behaviour during spray atomization and co-deposition, Int.
J. Rapid Solidification 7 (1992): 219–43Zhang, H. Temperaturverteilung im aufwachsenden Deposit und im Substrat sowie Verlaufe des
Erstarrungsgrades im Deposit bei der Spruhkompaktierung von Metallen, Dissertation, UniversitatBremen (1994)
Zhang, J., Wu, Y. and Lavernia, E. J. Kinetics of ceramic particulate penetration into spray atomizedmetallic droplets at variable penetration depth, Acta Metall. Mater. 42 (1994): 2955–72
Zhao, Y. Y., Dowson, A. L. and Jacobs, M. H. Modelling of liquid flow after a hydraulic jump on arotating disc prior to centrifugal atomization, Modelling Simul. Mater. Sci. Eng. 8 (2000) 1: 55–65
Zhao, Y. Y., Dowson, A. L., Johnson, T. P., Young, J. M. and Jacobs, M. H. Prediction of liquid metalvelocities on a rotating disk in spray forming by centrifugal spray deposition, Adv. Powder Metall.& Part. Materials – 1996, Metal Powder Industries Federation, Princeton, NJ (1996a) pp 9–79 –9–89
Zhao, Z., Poulikakos, D. and Fukai, J. Heat transfer and fluid dynamics during the collision of a liquiddroplet on substrate – I. modeling, Int. J. Heat Mass Transfer 39 (1996b): 2771–89
Zhou, Z.-W. and Tang, X.-D. The effect of the pulsation in gas flow on the stability of molten metaljet, Proc. 4th International Conference on Spray Forming ICSF, Baltimore, MD (1999)

Useful web pages
Author’s homepage
http://www.iwt-bremen.de/vt/MPS/
Modelling and simulation – CFD
http://www.cfd-online.com/http://www.mie.utoronto.ca/labs/tsl/http://capella.colorado.edu/∼laney/software.htm
Atomization and sprays
http://www.atomization.de/http://www.me.umist.ac.uk/asrgpage/index.htmhttp://www.ilass-eu.ic.ac.uk/ilass eu.htmhttp://www.ilass.uci.edu/http://www.atomising.co.uk/
Spray forming
http://sfb372.iwt.uni-bremen.de/home-a.htmlhttp://gram.eng.uci.edu/∼sprays/http://www.irc.bham.ac.uk/theme1/http://users.ox.ac.uk/∼pgrant/sfintro.htmlhttp://www.arl.psu.edu/areas/spraymetform/spraymetform.htmlhttp://www.ospreymetals.co.uk/http://www.dansteel.dk/Danspray/Danspray/html/DanSpray uk.htm
269


Index
algebraic solution, 25atomization, 26averaging method, 138
back face culling, 184back-splashing, 43bag break-up, 90balance force, 98Basset–Boussinesq–Oseen, 98Basset history integral, 99batch process, 33billet cooling, 187billet surface model, 216Boltzmann equation, 38boundary conditions, 29boundary fitted, 24
caloric averaging, 137centrifugal spray, 35clean spray forming process, 216close-coupled, 80close-coupled configuration, 27coaxial gas flow field, 42collision probabilities, 150compacting process, 161compaction, 6conjugate heat transfer, 30conservation equations, 21conservation, 22continuum surface, 37control, 17cooling control, 213coordinate transformation, 188crucible, 6
dilute flow, 149direct numerical simulation, 85, 96discrete vortex methods, 96disintegration, 6, 12disintegration efficiency, 52dissipation rate, 22division of spray forming, 10(drag) coefficient, 100droplet and particle, 147
droplet impact, 161droplet solidification, 169
Euler/Euler, 37Eulerian/Eulerian, 97Eulerian/Lagrangian, 96
form-filling spray process, 180fragmentation delay, 89free-fall atomizer, 27freezing, 27full billet model, 216
geometric modelling, 176geometries of spray forming, 8grain-size modelling, 225
heat resistance coefficient, 192heat transfer, 107high-resolution models, 14homogeneous two-phase model, 37hot workability, 9
ideal expanded gas, 61independent process conditions, 14industrial applications, 7integral, 17integral modelling, 233interacting gas jet systems, 55intermetallic composite, 8inviscid theory, 29
Kelvin–Helmholtz, 60
large eddy simulation, 96large-wavelength, 69laser Doppler anemometry, 43Laval nozzles, 62low-resolution models, 14Lubanska’s formula, 78
macro- and micopore formation, 219macropores, 177macro segregations, 9main modes, 89
271

272 Index
marker and cell, 36mass yield, 14material properties, 13maximum entropy formalism, 83melt delivery, 10melt disintegration, 6metal casting, 6metal-matrix-composites, 8, 156metallurgical aspects, 13microstructure, 9microstructure modelling, 222modified dissipation, 56multicoupled simulation, 95multimode, 90multipurpose, 24mushy layer, 209
near-net shape, 6neural, 18non-linear stability analyses, 71numerical model, 23
operational models, 1operational parameters, 131Osprey process, 7overexpanded jets, 61oxygen contamination, 9
partial fragmentation, 163particle/particle interactions, 13particle penetration mechanism, 156particle size spectrum, 18particle-source-in-cell, 122phase-Doppler-anemometry, 101physical model, 21piecewise linear, 85planning models, 1porosity factor, 177powder metallurgy, 6primary liquid, 75probability density functions, 96product, 13
Ranz and Marshall, 108rebounding, 163recalescence, 112residual stress, 219
secondary fragmentation, 81sensors, 18small-wavelength, 70solidification modelling, 109source or sink terms , 21span of the droplet-size distribution, 63splashing number, 176splashing of the droplet, 163spray, 6spray analysis, 12spray structure, 12spray-chamber, 144stability analysis, 68Stokes resistance, 122subsonic flow, 44super alloys, 8supersonic flow, 52surface temperature, 237surface tension, 41
the gas pressure, 18theoretical atomization, 44thermal averaging, 137thermal model, 20tracer-particle, 45transformation of, 57turbulence, 22turbulent dispersion, 105turbulent droplet, 135turbulent kinetic energy, 22twin-fluid atomization, 6twin-fluid atomizers, 26two-layer zonal model, 197two-phase flow, 12
undercooling, 111underexpanded jets, 53unit operations, 1
visualization, 25volume, 36vortex formation, 29
wall friction, 32
yield strength, 9
Related Documents