Louisiana State University LSU Digital Commons LSU Master's eses Graduate School 2011 Spray drying technology for the production and processing of microencapsulated omega-3 fish oil with egg powder Kevin Estuardo Mis Solval Louisiana State University and Agricultural and Mechanical College, [email protected] Follow this and additional works at: hps://digitalcommons.lsu.edu/gradschool_theses Part of the Life Sciences Commons is esis is brought to you for free and open access by the Graduate School at LSU Digital Commons. It has been accepted for inclusion in LSU Master's eses by an authorized graduate school editor of LSU Digital Commons. For more information, please contact [email protected]. Recommended Citation Mis Solval, Kevin Estuardo, "Spray drying technology for the production and processing of microencapsulated omega-3 fish oil with egg powder" (2011). LSU Master's eses. 1390. hps://digitalcommons.lsu.edu/gradschool_theses/1390

Welcome message from author
This document is posted to help you gain knowledge. Please leave a comment to let me know what you think about it! Share it to your friends and learn new things together.
Transcript

Louisiana State UniversityLSU Digital Commons
LSU Master's Theses Graduate School
2011
Spray drying technology for the production andprocessing of microencapsulated omega-3 fish oilwith egg powderKevin Estuardo Mis SolvalLouisiana State University and Agricultural and Mechanical College, [email protected]
Follow this and additional works at: https://digitalcommons.lsu.edu/gradschool_theses
Part of the Life Sciences Commons
This Thesis is brought to you for free and open access by the Graduate School at LSU Digital Commons. It has been accepted for inclusion in LSUMaster's Theses by an authorized graduate school editor of LSU Digital Commons. For more information, please contact [email protected].
Recommended CitationMis Solval, Kevin Estuardo, "Spray drying technology for the production and processing of microencapsulated omega-3 fish oil withegg powder" (2011). LSU Master's Theses. 1390.https://digitalcommons.lsu.edu/gradschool_theses/1390

SPRAY DRYING TECHNOLOGY FOR THE PRODUCTION AND PROCESSING OF
MICROENCAPSULATED OMEGA-3 FISH OIL WITH EGG POWDER
A Thesis
Submitted to the Graduate Faculty of the
Louisiana State University and
Agricultural and Mechanical College
in partial fulfillment of the
requirements for the degree of
Master of Science
In
The Department of Food Science
by
Kevin Estuardo Mis Solval
B.S., Escuela Agrícola Panamericana, El Zamorano, 2008
May, 2011

ii
Dedicated to
GOD

iii
ACKNOWLEDGMENTS
I would like to start with my specials thanks and gratitude to Dr. William B. Richardson,
Chancellor of the Louisiana State University Agricultural Center who financially supported my
education at LSU since my internship in the spring of 2008. Without his support, my time at
LSU would not have been possible.
My special and sincere gratitude goes to my major professor and friend Dr. Subramaniam
Sathivel for his support and guidance in every little matter throughout the entire time that I have
been at Louisiana State University (LSU) and Agricultural and Mechanical Collage.
I want to thank my committee members, Dr. Joan M. King, Dr. J. David Bankston, and Dr.
Marybeth Lima for their valuable time to serve on my committee, and for their unconditional
help and advice on the conduction of this project. Thank you so much! Special thanks go to Dr.
Peter J. Bechtel at the University of Alaska, Fairbanks within USDA/ARS Subarctic Agricultural
Research Unit for this help in the determination of fatty acid, amino acid, and mineral profiles.
My studies and research at LSU would not have been the same, without the charm and joy of
my Zamorano friends and lab mates in the Food Engineering group, special thanks to Huaixia
Yin for her advice, help and support.
Nothing would be completed without showing my gratitude and love to those ones who
brought me to this world, my beloved parents Luis Mis and Maria Solval; who altogether with
my brother Alvaro Luis and my sister Maria Jose have encouraged and supported me with their
love during my life and to my grandparents who I wish had lived to see me graduate.
To all the people in the Department of Food Science, thanks for their help and support. And
those ones I did not mention above, but who assisted in the countless hours spent in this project;
thank you very much.
iv
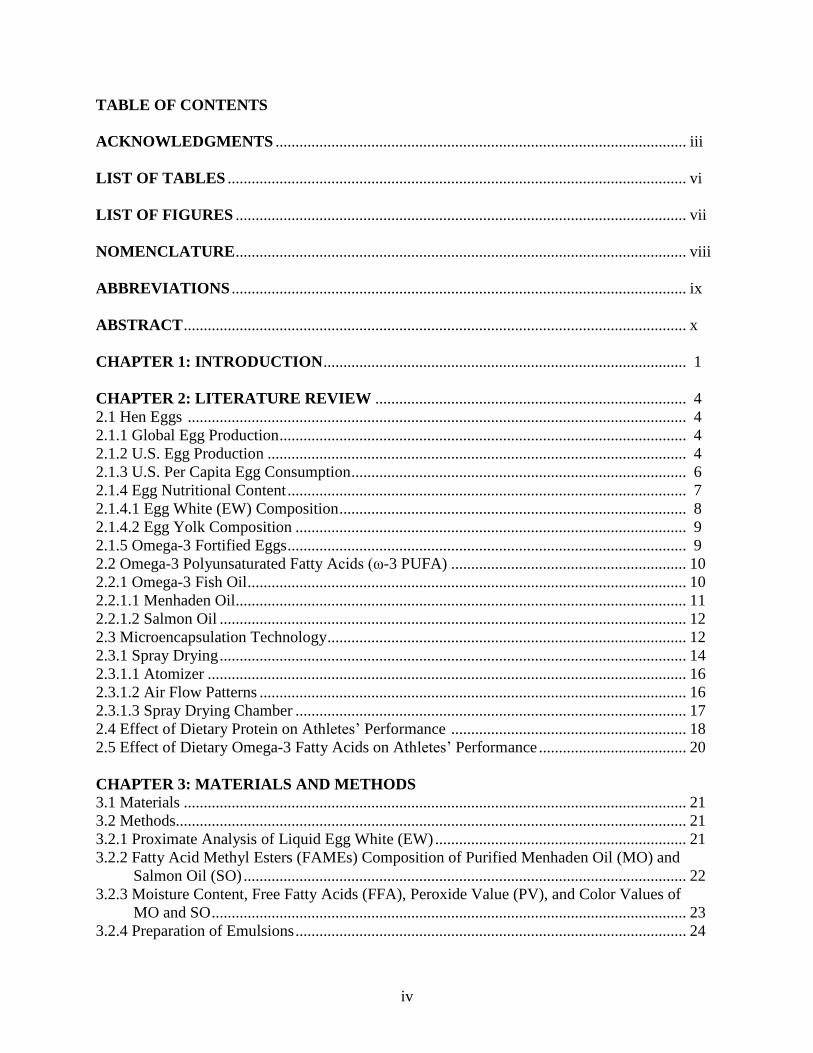
TABLE OF CONTENTS
ACKNOWLEDGMENTS ....................................................................................................... iii
LIST OF TABLES ................................................................................................................... vi
LIST OF FIGURES ................................................................................................................. vii
NOMENCLATURE ................................................................................................................. viii
ABBREVIATIONS .................................................................................................................. ix
ABSTRACT .............................................................................................................................. x
CHAPTER 1: INTRODUCTION ........................................................................................... 1
CHAPTER 2: LITERATURE REVIEW .............................................................................. 4
2.1 Hen Eggs ............................................................................................................................. 4
2.1.1 Global Egg Production ...................................................................................................... 4
2.1.2 U.S. Egg Production ......................................................................................................... 4
2.1.3 U.S. Per Capita Egg Consumption .................................................................................... 6
2.1.4 Egg Nutritional Content .................................................................................................... 7
2.1.4.1 Egg White (EW) Composition ....................................................................................... 8
2.1.4.2 Egg Yolk Composition .................................................................................................. 9
2.1.5 Omega-3 Fortified Eggs .................................................................................................... 9
2.2 Omega-3 Polyunsaturated Fatty Acids (ω-3 PUFA) ........................................................... 10
2.2.1 Omega-3 Fish Oil .............................................................................................................. 10
2.2.1.1 Menhaden Oil................................................................................................................. 11
2.2.1.2 Salmon Oil ..................................................................................................................... 12
2.3 Microencapsulation Technology .......................................................................................... 12
2.3.1 Spray Drying ..................................................................................................................... 14
2.3.1.1 Atomizer ........................................................................................................................ 16
2.3.1.2 Air Flow Patterns ........................................................................................................... 16
2.3.1.3 Spray Drying Chamber .................................................................................................. 17
2.4 Effect of Dietary Protein on Athletes’ Performance ........................................................... 18
2.5 Effect of Dietary Omega-3 Fatty Acids on Athletes’ Performance ..................................... 20
CHAPTER 3: MATERIALS AND METHODS 3.1 Materials .............................................................................................................................. 21
3.2 Methods................................................................................................................................ 21
3.2.1 Proximate Analysis of Liquid Egg White (EW) ............................................................... 21
3.2.2 Fatty Acid Methyl Esters (FAMEs) Composition of Purified Menhaden Oil (MO) and
Salmon Oil (SO) ............................................................................................................... 22
3.2.3 Moisture Content, Free Fatty Acids (FFA), Peroxide Value (PV), and Color Values of
MO and SO ....................................................................................................................... 23
3.2.4 Preparation of Emulsions .................................................................................................. 24

v
3.2.5 Characterization of Emulsions .......................................................................................... 24
3.2.5.1 Color and Emulsion Oxidation ...................................................................................... 24
3.2.5.2 Flow Behavior and Viscoelastic Properties ................................................................... 25
3.2.6 Spray Drying of Emulsions ............................................................................................... 26
3.2.6.1 Estimation of Production Rate of Microencapsulated Powders .................................... 27
3.2.6.2 Estimation of Evaporation Rate ..................................................................................... 30
3.2.6.3 Estimation of Energy Required to Dry the Emulsions ................................................... 32
3.2.7 Determination of Microencapsulation Efficiency and Color of Egg White Powders ...... 32
3.2.8 Fatty Acid Methyl Esters (FAMEs) and Lipid Oxidation of Egg White Powders ........... 33
3.2.9 Crude Protein, Total Lipids, Ash, and Water Activity (aw) of Egg White Powders ......... 34
3.2.10 Amino Acid and Mineral Analysis ................................................................................. 34
3.2.11 Scanning Electron Microscopy (SEM) and Particle Size Distribution of
Microencapsulated Powders .......................................................................................... 35
3.2.12 Statistical Analysis .......................................................................................................... 35
CHAPTER 4: RESULTS AND DISCUSSSION ................................................................... 36
4.1 Proximate Composition of Egg White (EW) ....................................................................... 36
4.2 FAMEs Composition of MO and SO .................................................................................. 36
4.3 Moisture Content, FFA, PV and Color Values of MO and SO ........................................... 36
4.4 Characterization of Emulsions ............................................................................................. 38
4.4.1 Color and Emulsion Oxidation ......................................................................................... 38
4.4.2 Flow Behavior and Viscoelastic Properties ...................................................................... 39
4.5 Spray Drying of E-EW, E-MO-EW, and E-SO-EW ............................................................ 44
4.6 Microencapsulation Efficiency (ME) and Color Values of Egg White Powders ............... 49
4.7 FAMEs Composition and Lipid Oxidation of Egg White Powders .................................... 51
4.8 Crude Protein, Total Lipids, Ash and Water Activity (aw) of DEW MO-EW and SO-EW
Powders ................................................................................................................................. 52
4.9 Amino Acid and Mineral Content of DEW, MO-EW, and SO-EW .................................... 54
4.10 SEM and Particle Size Distribution of EW, MO-EW, and SO-EW Powders ................... 58
CHAPTER 5: SUMMARY AND CONCLUSIONS ............................................................. 63
REFERENCES ......................................................................................................................... 67
APPENDIX A. RESULTS OF THE PRODUCTION AND PROCESS OF
MICROENCAPSULATED OMEGA-3 FISH OIL WITH EGG YOLK
POWDER ......................................................................................................... 76
APPENDIX B. RESULTS OF THE PRODUCTION AND PROCESS OF
MICROENCAPSULATED OMEGA-3 FISH OIL WITH WHOLE EGG
POWDER ......................................................................................................... 89
VITA.......................................................................................................................................... 102
vi
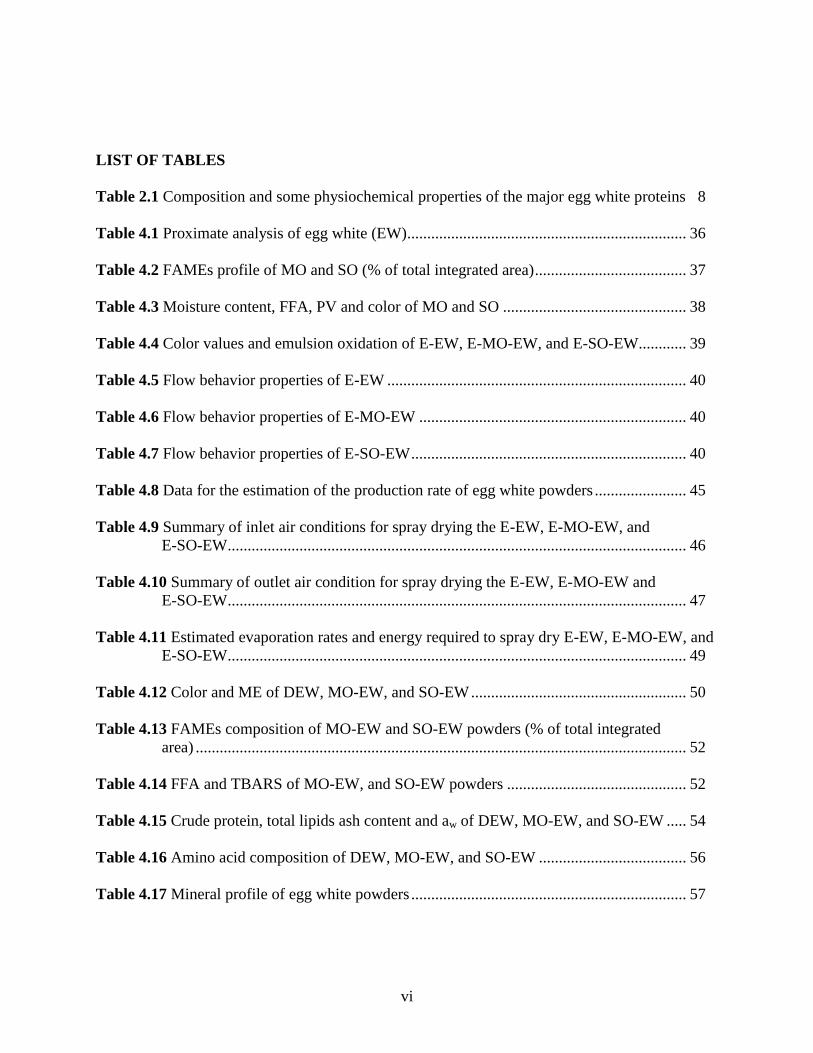
LIST OF TABLES
Table 2.1 Composition and some physiochemical properties of the major egg white proteins 8
Table 4.1 Proximate analysis of egg white (EW)...................................................................... 36
Table 4.2 FAMEs profile of MO and SO (% of total integrated area) ...................................... 37
Table 4.3 Moisture content, FFA, PV and color of MO and SO .............................................. 38
Table 4.4 Color values and emulsion oxidation of E-EW, E-MO-EW, and E-SO-EW............ 39
Table 4.5 Flow behavior properties of E-EW ........................................................................... 40
Table 4.6 Flow behavior properties of E-MO-EW ................................................................... 40
Table 4.7 Flow behavior properties of E-SO-EW ..................................................................... 40
Table 4.8 Data for the estimation of the production rate of egg white powders ....................... 45
Table 4.9 Summary of inlet air conditions for spray drying the E-EW, E-MO-EW, and
E-SO-EW ................................................................................................................... 46
Table 4.10 Summary of outlet air condition for spray drying the E-EW, E-MO-EW and
E-SO-EW ................................................................................................................... 47
Table 4.11 Estimated evaporation rates and energy required to spray dry E-EW, E-MO-EW, and
E-SO-EW ................................................................................................................... 49
Table 4.12 Color and ME of DEW, MO-EW, and SO-EW ...................................................... 50
Table 4.13 FAMEs composition of MO-EW and SO-EW powders (% of total integrated
area) ........................................................................................................................... 52
Table 4.14 FFA and TBARS of MO-EW, and SO-EW powders ............................................. 52
Table 4.15 Crude protein, total lipids ash content and aw of DEW, MO-EW, and SO-EW ..... 54
Table 4.16 Amino acid composition of DEW, MO-EW, and SO-EW ..................................... 56
Table 4.17 Mineral profile of egg white powders ..................................................................... 57
vii
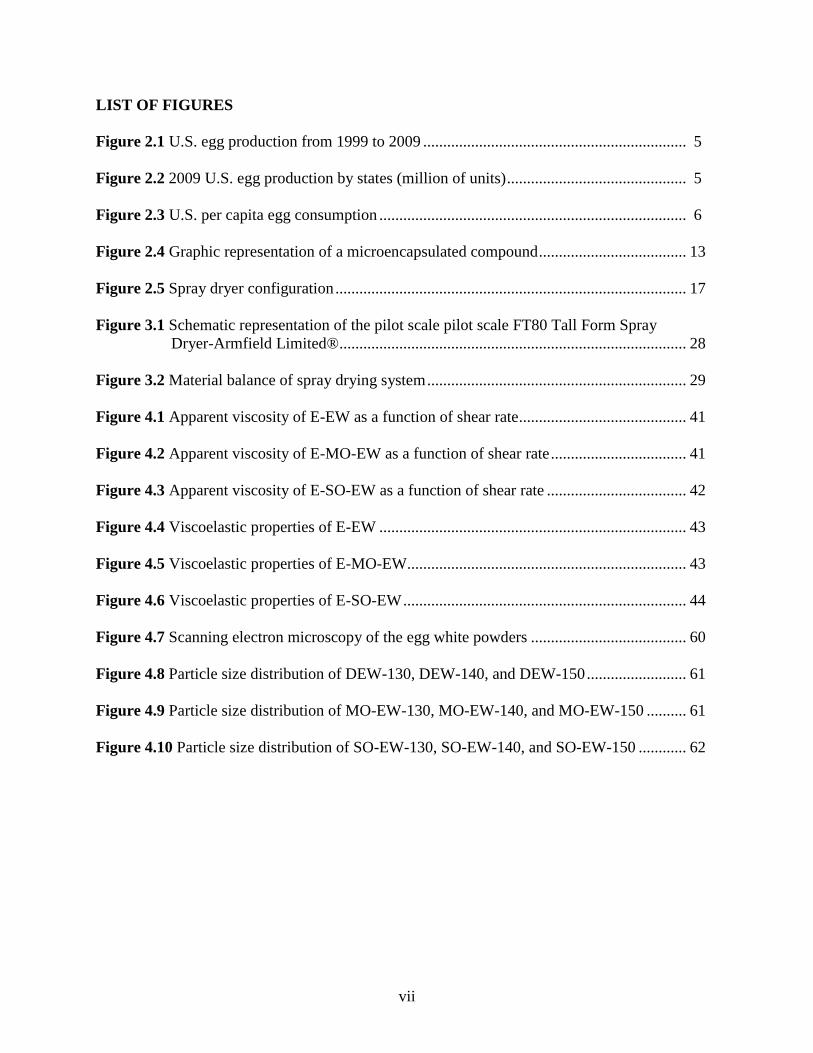
LIST OF FIGURES
Figure 2.1 U.S. egg production from 1999 to 2009 .................................................................. 5
Figure 2.2 2009 U.S. egg production by states (million of units) ............................................. 5
Figure 2.3 U.S. per capita egg consumption ............................................................................. 6
Figure 2.4 Graphic representation of a microencapsulated compound ..................................... 13
Figure 2.5 Spray dryer configuration ........................................................................................ 17
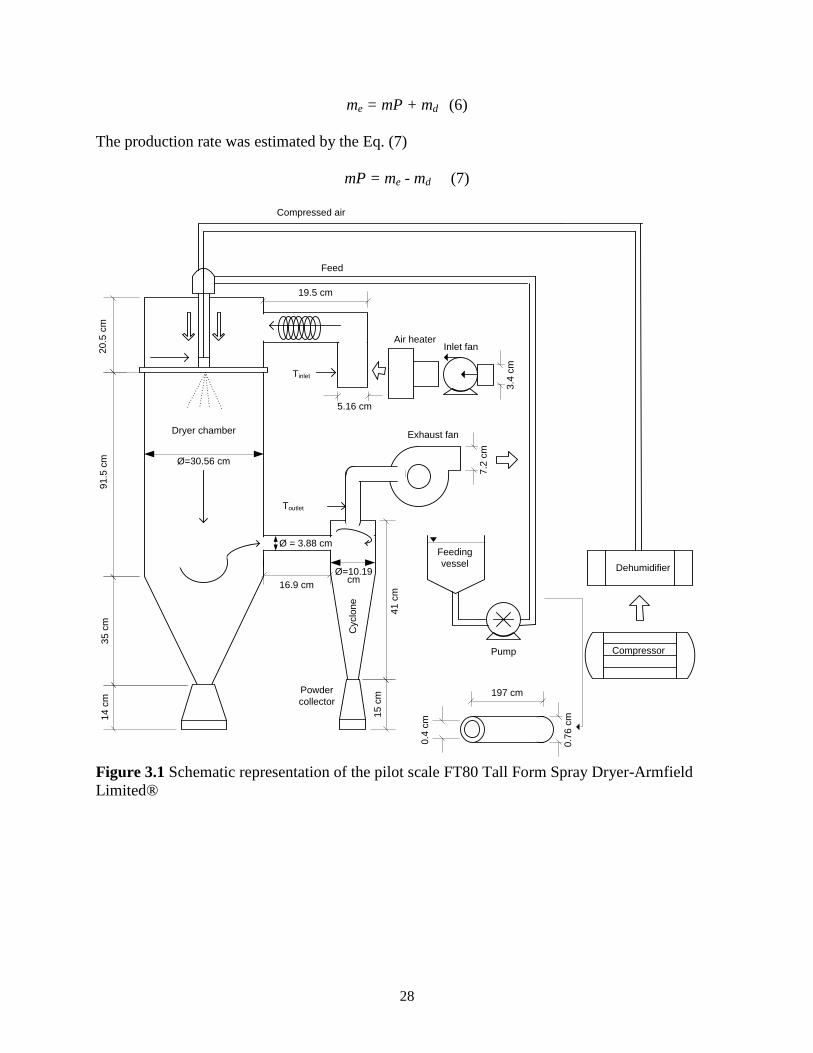
Figure 3.1 Schematic representation of the pilot scale pilot scale FT80 Tall Form Spray
Dryer-Armfield Limited® ....................................................................................... 28
Figure 3.2 Material balance of spray drying system ................................................................. 29
Figure 4.1 Apparent viscosity of E-EW as a function of shear rate .......................................... 41
Figure 4.2 Apparent viscosity of E-MO-EW as a function of shear rate .................................. 41
Figure 4.3 Apparent viscosity of E-SO-EW as a function of shear rate ................................... 42
Figure 4.4 Viscoelastic properties of E-EW ............................................................................. 43
Figure 4.5 Viscoelastic properties of E-MO-EW...................................................................... 43
Figure 4.6 Viscoelastic properties of E-SO-EW ....................................................................... 44
Figure 4.7 Scanning electron microscopy of the egg white powders ....................................... 60
Figure 4.8 Particle size distribution of DEW-130, DEW-140, and DEW-150 ......................... 61
Figure 4.9 Particle size distribution of MO-EW-130, MO-EW-140, and MO-EW-150 .......... 61
Figure 4.10 Particle size distribution of SO-EW-130, SO-EW-140, and SO-EW-150 ............ 62

viii
NOMENCLATURE
A cross sectional area of the inlet or outlet air pipe, m2
AHaa
absolute humidity of inlet ambient air, kg water/kg dry air
AHao absolute humidity of outlet air, kg water/kg dry solids
caa specific heat of inlet ambient dry air, kJ/[kg K]
cp specific heat of inlet ambient air, kJ/[kg K]
cv specific heat of water vapor, kJ/[kg K]
Eva evaporation rate calculated from the moisture uptake by the dry air, kg water/h
Evp evaporation rate calculated based on the moisture content of the cantaloupe juice
mixture, powder, kg water/h
K consistency index, Pa.s
maa dry air mass flow rate of inlet ambient air, kg dry air/h
mao dry air mass flow rate of outlet air, kg dry air/h
md dust flow rate, kg dry solids/h
me cantaloupe juice mixture flow rate, kg dry solids/h
mP estimated powder production rate, kg dry solids/h
n flow behavior index
pv saturation pressure of water vapor, kPa
pw partial pressure exerted by water vapor, kPa
Q estimated energy required to spray dry cantaloupe juice mixtures, kJ/kg
RH relative humidity, %
S solids present in the food sample, %
T temperature, °C
Taa temperature of inlet ambient air, K
Tad temperature of inlet drying air, K
Te temperature of cantaloupe juice mixture, °C
Td temperature of cantaloupe juice dust, °C
Tp temperature of cantaloupe juice powder, °C
ΔT temperature difference between inlet ambient air and heated air, K
v average velocity, m/s
V volumetric flow rate, m3/s
V’ specific volume, m3/kg dry air
wd moisture content (dry basis) of dust, kg water/kg dry solids
we moisture content (dry basis) of cantaloupe juice mixture, kg water/kg dry solids
wp moisture content (dry basis) of product, kg water/kg dry solids

ix
ABBREVIATIONS
ALA α-linolenic acid
BCCA branched-chain amino acids
CVD cardiovascular deseases
DHA docosahexaenoic acid
DEW DEW spray dried either at 130, 140, or 150°C
DEW-130 E-EW spray dried at 130°C
DEW-140 E-EW spray dried at 140°C
DEW-150 E-EW spray dried at 150°C
EAA essential amino acids
E-EW mixture containing liquid egg white and distilled water
E-MO-EW emulsion containing refined menhaden oil and liquid egg white
E-SO-EW emulsion containing purified salmon oil and liquid egg white
EPA eicosapentaenoic acid
EW liquid egg white
FFA free fatty acids
MO refined menhaden oil
MO-EW E-MO-EW spray dried either at 130, 140, or 150°C
MO-EW-130 E-MO-EW spray dried at 130°C
MO-EW-140 E-MO-EW spray dried at 140°C
MO-EW-150 E-MO-EW spray dried at 150°C
OS surface oil
OT total lipid content
OE encapsulated oil
PUFA polyunsaturated fatty acids
PV peroxides value
pI isoelectric point
SO purified salmon oil
Td denaturation temperature
TBARS thiobarbituric acid-reactive substances
SEM scanning electron microscopy
SO-EW E-SO-EW spray dried either at 130, 140, or 150°C
SO-EW-130 E-SO-EW spray dried at 130°C
SO-EW-140 E-SO-EW spray dried at 140°C
SO-EW-150 E-SO-EW spray dried at 150°C

x
ABSTRACT
Protein with essential amino acids is required for recovering, repairing, and building muscles
after intensive exercise. A powder produced with egg white (EW) (high quality protein) and fish
oil (menhaden (Brevoortia patronus) (MO) oil or salmon oil (SO)) with high DHA and EPA
content should be particularly beneficial for athletes. The objective of this study was to develop
microencapsulated omega-3 fatty acids fortified EW powders. Two stable emulsions were
prepared with 3.43% (MO) or (SO), 56.21% EW, and 40.36% water (E-MO-EW and E-SO-EW).
An EW with water solution (without fish oil) (E-EW) was prepared as a control. Two emulsions
(E-MO-EW; E-SO-EW) and E-EW solution were separately spray dried at 130, 140, and 150 oC
inlet air temperatures producing three microencapsulated menhaden oil fortified EW powders,
three microencapsulated salmon oil fortified EW powders, and three egg white powders (dried E-
EW). Physical and chemical properties of E-EW, E-MO-EW and E-SO-EW were determined
and the energy used to spray dry them was estimated. The powders were analyzed for color,
fatty acids methyl esters (FAME), protein, fat, moisture, ash, amino acid profile, minerals,
microstructure and particle size. Microencapsulated efficiency (ME) was estimated only for
microencapsulated fish oil fortified EW powders. Triplicate experiments were conducted and
data statistically analyzed (α=0.05). The actual production rate of powders ranged from 0.056 to
0.060 (kg dry solids/h). More energy was used to spray dry E-EW, E-MO-EW, and E-SO-EW at
150°C than at 130 and 140oC inlet air temperature. The inlet air temperature did not affect the
EPA or DHA content of MO and SO or the microencapsulation efficiency. The protein content
of the oil fortified powders was lower than that of the dried E-EW powders. Leucine was the
main essential amino acid found in all the powders. Most of the powders’ particles ranged in
size from 20 to 30 µm. The study demonstrated that high quality egg white protein with omega-3

xi
can be produced by microencapsulation. Oil fortified egg white powders could provide benefits
for athletes who do high intensity exercise. This study also identifies opportunities for
development of microencapsulated omega-3 fatty acids fortified egg white powders.

1
CHAPTER 1: INTRODUCTION
The American table egg production had a value of approximately 4.24 billion dollars in
2009. Iowa, Ohio, Pennsylvania, Indiana and California are the most productive states of table
eggs in the United States (USDA, 2010b). The consumption per capita of table egg has decreased
in the USA during the last years due to lifestyle changes and health concerns (Stadelman, 1999).
Table eggs are an excellent source of high-quality protein, vitamins and minerals. An average
large egg provides around 6.25 g of high-quality protein, 5 g of fat and 200 mg of cholesterol
(Weggemans et al.,2001). Eggs contain all essential amino acids (EAA) including leucine.
Leucine is an EAA that contributes to muscles’ ability to use energy and aids in post-exercise
muscle recovery from dynamic and resistance exercises; it was found that a diet rich in leucine
would be advantageous to men and women undergoing resistance exercise due to the
complementary effect between leucine and glucose utilization by muscles. Even more, leucine is
a critical element in regulating muscle protein synthesis and may be the key amino acid defining
the increased need for EAA to optimize skeletal muscles mass (Layman & Rodriguez, 2009).
Positive effects on human heath have been attributed to the consumption of omega-3
polyunsaturated fatty acids (ω-3 PUFA) (Riediger, 2009; Simopoulos, 1999). Alfa linolenic acid
(ALA) (C18:3), eicosapentaenoic acid (EPA) (C20:5) and docosahexaenoic acid (DHA) (C22:6)
are the main ω-3 PUFA (Clandinin et al.,1994). Dietary omega-3 PUFA enhances aerobic
metabolic process in athletes; therefore, improving their ability to effectively burn fat as an
energy substrate. Menhaden and salmon fish oils are good sources of EPA and DHA. Due to
their high polyunsaturated fatty acid content, menhaden and salmon fish oils are susceptible to
oxidative deterioration; this has limited the use of fish oil in food products because of flavor
degradation by oxidation.

2
Omega-3 PUFA-fortified eggs are produced through the manipulation of the hen’s diet with
some limitations (Ferrier, et al., 1995); these eggs contain up to three times the amount the ω-3
PUFA present in conventional eggs. However, a conventional egg is not a rich source of ω-3
PUFA; therefore, even a three-fold increase is considered small (Kassis et.al., 2010).
Microencapsulation is a technology that has been used to transform fish oil into powder by
surrounded the tiny fish oil droplets with a wall material resulting in small granules that have
powder like flow characteristics. Moreover, microencapsulation can help to overcome the main
problems of food fortification with ω-3 fish oil, which are the unpleasant “fishy” flavor and the
oxidation of polyunsaturated fatty acids that has negative influence on food acceptability
(Kolanowaski et al., 1999).
Spray drying is a common technology used to produce microencapsulated food ingredients.
Preparation of stable emulsions, atomization of the emulsions, and dehydration of the atomized
particles are the major basic steps involved in producing microencapsulated fish oils. The
critical elements of a spray drying system are atomizer, air flow, and spray drying chamber
(Patel et al., 2009).
Nowadays, there is a huge interest among athletes in increasing endurance or promote
muscle size and strength by the optimal type of nutrition The combination of fish oil and eggs in
a single food product may be important to active individuals who routinely consume eggs and
fish oil as part of a varied, and balanced diet.
Considerable information regarding to spray dried food powders have been reported in the
last few years; however, scientific literature related to the microencapsulation of fish oil with egg
white proteins using spray technology is limited. Hence, the objectives of this study were to: (1)
develop a spray dried microencapsulated fish oil with egg white powder for athletes, (2)

3
evaluate the nutritional components and physical properties of ω-3 PUFA-fortified egg white
powder, and (3) evaluate the spray drying conditions to produce ω-3 PUFA-fortified egg white
powder.

4
CHAPTER 2: LITERATURE REVIEW
2.1 Hen Eggs
Eggs are an excellent source of nutrients including high quality protein, vitamins and
minerals. They are, after all, designed to support life. They are consumed globally and their
production represents an important segment of the world food industry. In the U.S., eggs are
considered to be a staple food in most American households (USDA, 2009a).
2.1.1 Global Egg Production
A hen’s egg production is divided into two categories: hatching eggs and table eggs.
Hatching eggs are those eggs intended, if incubated, to develop into chicks; meanwhile, table
eggs are those sold as food products for human consumption (AEB, 1999). In 2009, the
worldwide egg production was 67.4 million metric tons, of which China produced about 41%,
followed by the United States of America (USA) (8%), India (5%), Japan (4%), and Mexico
(4%) (FAO, 2010).
2.1.2 U.S. Egg Production
In 2009, the U.S. table egg production totaled 77.75 billion eggs with a value of
approximately 4.24 billion dollars. The US table egg production has trended upward in recent
years. During 2009 the U.S. table egg production was 26% higher than in 1988 (USDA, 2010b).
The Fig. 2.1 shows the total egg production in the U.S. since 1999 to 2009. Currently, the top ten
egg-producing states are: 1. Iowa, 2. Ohio, 3. Pennsylvania, 4. Indiana, 5. California, 6. Texas, 7.
Georgia, 8. North Carolina, 9. Arkansas and 10. Michigan (Fig. 2.2).
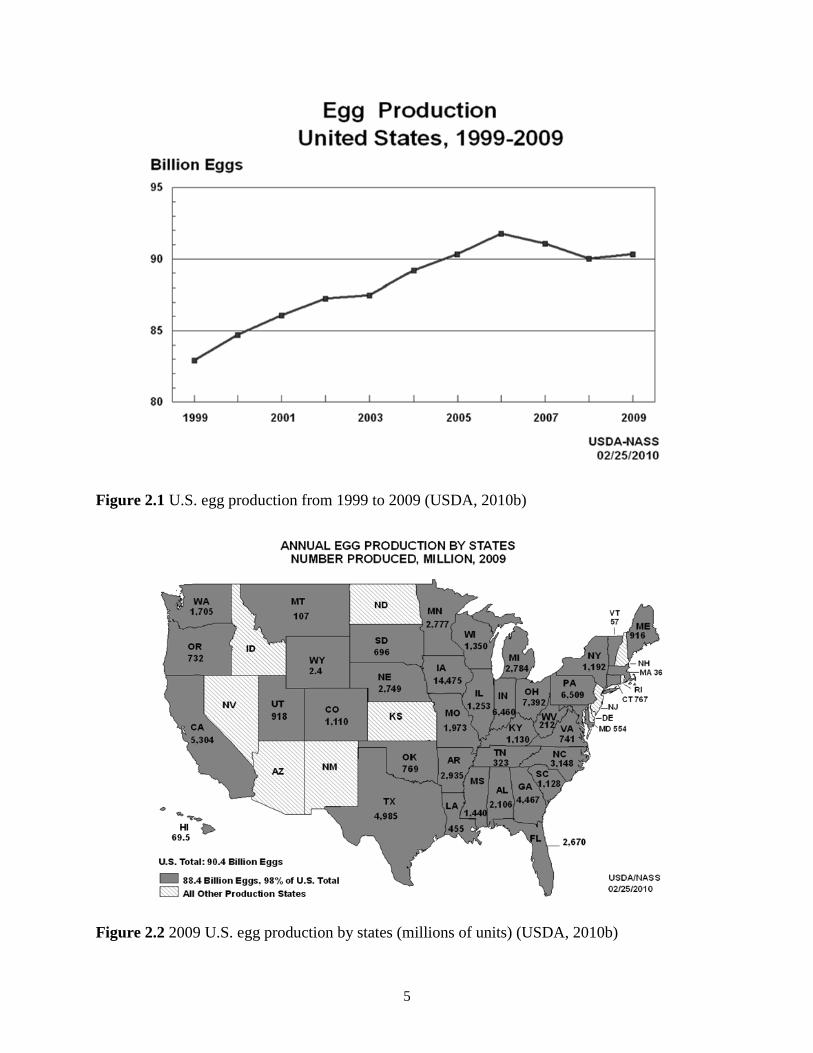
5
Figure 2.1 U.S. egg production from 1999 to 2009 (USDA, 2010b)
Figure 2.2 2009 U.S. egg production by states (millions of units) (USDA, 2010b)
6
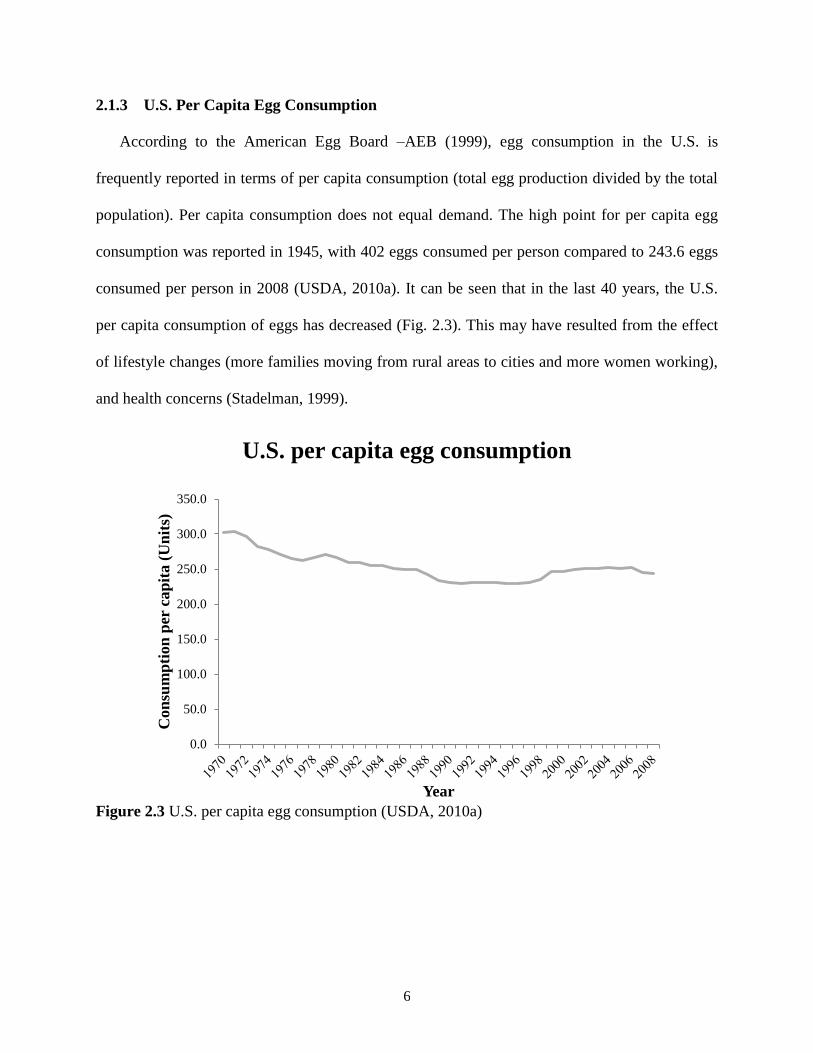
2.1.3 U.S. Per Capita Egg Consumption
According to the American Egg Board –AEB (1999), egg consumption in the U.S. is
frequently reported in terms of per capita consumption (total egg production divided by the total
population). Per capita consumption does not equal demand. The high point for per capita egg
consumption was reported in 1945, with 402 eggs consumed per person compared to 243.6 eggs
consumed per person in 2008 (USDA, 2010a). It can be seen that in the last 40 years, the U.S.
per capita consumption of eggs has decreased (Fig. 2.3). This may have resulted from the effect
of lifestyle changes (more families moving from rural areas to cities and more women working),
and health concerns (Stadelman, 1999).
Figure 2.3 U.S. per capita egg consumption (USDA, 2010a)
0.0
50.0
100.0
150.0
200.0
250.0
300.0
350.0
Con
sum
pti
on
per
cap
ita (
Un
its)
Year
U.S. per capita egg consumption

7
2.1.4 Egg Nutritional Content
Table eggs are one of best low-price sources of high quality protein. Dietary protein is used
by the human body to build and maintain muscles and other body organs, nerves, bones and
blood. Protein quality is measured by how efficiently the human body can use it for growth. It
has been reported that after mother’s milk, eggs contain the highest quality food protein known.
The Food and Agriculture Organization of the United Nations (FAO) (1970), rates the biological
value of whole egg protein at 93.7 (based on a 100-point scale), followed by cow’s milk (84.5),
fish (76), beef (74.3), soybeans (72.8), polished rice (64), whole wheat (64), corn (60) and dry
beans (58). Proteins are made up of amino acids. Some amino acids are essential to humans
because the human body cannot synthesize them. Eggs contain all nine essential amino acids
(EAA) including histidine, isoleucine, leucine, lysine, methionine, phenylalanine, threonine,
tryptophan and valine. Because the pattern of essential amino acids in egg protein is very similar
to the pattern needed by the human body; the egg is often used as a standard of comparison for
measuring the protein quality of other foods (AEB, 1999). Additionally, eggs are an excellent
source of leucine. Leucine is an EAA that contributes to muscles’ ability to use energy and aids
in post-exercise muscle recovery; it was found that a diet rich in leucine would be advantageous
to men and women undergoing resistance exercise due to the complementary effect between
leucine and glucose utilization by muscles (Layman & Rodriguez, 2009).
Eggs provide little to considerable amounts of all vitamins and minerals known to be needed
for the human body, except for vitamin C (AEB, 1999). They are also a good source of choline, a
nutrient that is essential for normal brain development, folate, and selenium (Herron &
Fernandez, 2004). An egg can be divided into two distinct parts: the albumen (egg white), and
the yolk. Both the albumen and the yolk provide important nutrients to the human body. An
8
average large egg provides 6.25 g of high-quality protein (10- 12.5% of the Daily Reference
Value for protein), and 5 grams of fat, most of which is unsaturated. Nevertheless, one large egg
also contains around 200 mg of cholesterol (Weggemans et al., 2001); which nearly meets the
dietary cholesterol intake limit established by the American Heart Association at ≤ 300 mg/d;
and they are not a good source of carbohydrates and fiber (AEB, 1999).
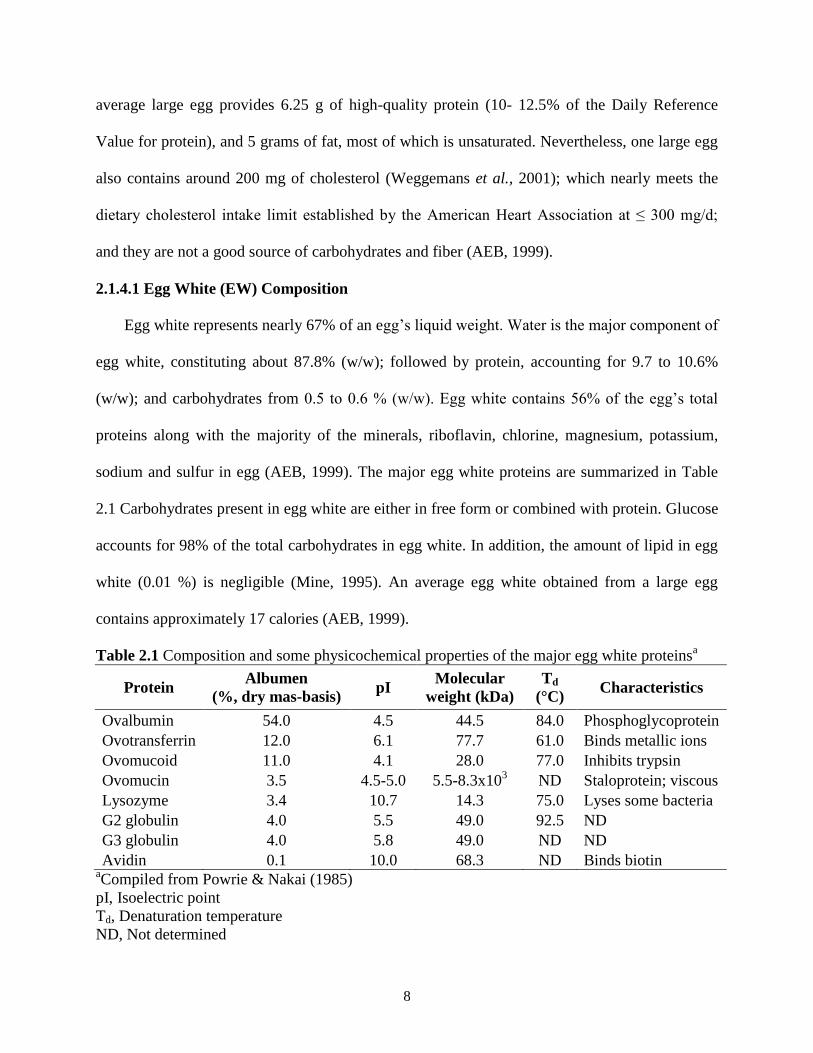
2.1.4.1 Egg White (EW) Composition
Egg white represents nearly 67% of an egg’s liquid weight. Water is the major component of
egg white, constituting about 87.8% (w/w); followed by protein, accounting for 9.7 to 10.6%
(w/w); and carbohydrates from 0.5 to 0.6 % (w/w). Egg white contains 56% of the egg’s total
proteins along with the majority of the minerals, riboflavin, chlorine, magnesium, potassium,
sodium and sulfur in egg (AEB, 1999). The major egg white proteins are summarized in Table
2.1 Carbohydrates present in egg white are either in free form or combined with protein. Glucose
accounts for 98% of the total carbohydrates in egg white. In addition, the amount of lipid in egg
white (0.01 %) is negligible (Mine, 1995). An average egg white obtained from a large egg
contains approximately 17 calories (AEB, 1999).
Table 2.1 Composition and some physicochemical properties of the major egg white proteinsa
Protein Albumen
(%, dry mas-basis) pI
Molecular
weight (kDa)
Td
(°C) Characteristics
Ovalbumin 54.0 4.5 44.5 84.0 Phosphoglycoprotein
Ovotransferrin 12.0 6.1 77.7 61.0 Binds metallic ions
Ovomucoid 11.0 4.1 28.0 77.0 Inhibits trypsin
Ovomucin 3.5 4.5-5.0 5.5-8.3x10³ ND Staloprotein; viscous
Lysozyme 3.4 10.7 14.3 75.0 Lyses some bacteria
G2 globulin 4.0 5.5 49.0 92.5 ND
G3 globulin 4.0 5.8 49.0 ND ND
Avidin 0.1 10.0 68.3 ND Binds biotin aCompiled from Powrie & Nakai (1985)
pI, Isoelectric point
Td, Denaturation temperature
ND, Not determined
9
2.1.4.2 Egg Yolk Composition
The yolk makes up around 33% of the liquid egg weight and contains all the egg’s fat and
cholesterol and 44% of its protein. A large egg yolk contains around 5 grams of fat; of which 1.6
g are saturated, 1.9 g are monounsaturated and 0.7 g are polyunsaturated fat, providing 6 and 8%
of the Daily Reference Values for total fat and saturated fat, respectively (AEB, 1999). All of the
cholesterol is located in the yolk of the egg. An average large egg contains around 213 mg of
cholesterol. It has been reported that dietary cholesterol increases serum total and LDL-
cholesterol concentrations, which are risk factors for cardiovascular disease (CVD) (Howell, et
al., 1997). Nevertheless, it has been demonstrated that eating two eggs per day had almost no
effect and that four eggs per day had only a slight effect on human serum cholesterol (Ginsberg
et al., 1994). Except for niacin and riboflavin, the yolk contains a higher proportion of each of
egg’s vitamins than does the albumen. All of the egg’s vitamin A, D and E are in the yolk.
Larger amounts of calcium, copper, iodine, iron, manganese, phosphorus, selenium and zinc are
contained in the yolk than in the albumen. Normally, the yolk of a large egg contains 59 calories
(AEB, 1999).
2.1.5 Omega-3 Fortified Eggs
Omega-3 polyunsaturated fatty acid (ω-3 PUFA) fortified eggs have been produced through
the manipulation of the hens’ diets (Ferrier, et al., 1995). As a result, ω-3 PUFA fortified eggs
contain up to three times the amount of ω-3 PUFA present in conventional eggs. However, a
conventional egg is not a rich source of ω-3 PUFA; therefore, even a three-fold increase is
considered small, if it is compared to the recommended daily intake for ω-3 PUFA by the
governments of Canada, Scandinavia, and Britain, which is between 1000 and 2000 mg/d. The
United States has not yet set a recommended daily intake for ω-3 PUFA (Kassis et al., 2010).

10
The DHA content of a fortified egg is approximately 150 mg/egg (Anonymous, 2004).
Additionally, it has been demonstrated that the incorporation of ω-3 PUFA into quail egg yolks
by altering levels of flaxseed in the feed, reduced the total saturated FA content and increased the
PUFA levels in some treatment groups without affecting the cholesterol levels. Therefore, even
though these nutritionally-enhanced eggs via alteration of hens’ diets may contain less saturated
fat, their cholesterol remains unchanged (Silva et al., 2009).
2.2 Omega-3 Polyunsaturated Fatty Acids (ω-3 PUFA)
Recently, the role of ω-3 PUFA in human health has increased attention. Several studies
have shown positive roles for ω-3 PUFA in infant development, and in combating cancer,
coronary heart diseases, hypertension, obesity, type II diabetes; and more recently, various
mental illnesses, including depression, attention-deficit hyperactivity disorder and dementia
(Riediger, 2009; Simopoulos, 1999). The major ω-3 PUFA are as follows: α-linolenic acid
(ALA) (C18:3), eicosapentaenoic acid (EPA) (C20:5) and docosahexaenoic acid (DHA) (C22:6)
(Clandinin et al.,1994). It has been proposed that the mechanisms for health benefits of ω-3
PUFA are related to the incorporation of the fatty acids into membrane phospholipids, alteration
of gene expression, or eicosanoid production. Due to the health properties attributed to the
consumption of ω-3 PUFA, several authorities have recently recommended increases in intakes
of ω-3 PUFA by the general population (Abayasekara, 1999).
2.2.1 Omega-3 Fish Oil
Omega-3 fish oil obtained recognition of its possible health benefits when it was found that
traditional Eskimo populations had a low incidence of despite high fat intake. This was attributed
to positive aspects of their diet. Deepwater fish that Eskimos consumed were high in ω-3 PUFA
(Kromhout et al., 1985). These findings led to an increase in research examining the beneficial

11
and/or preventive effects of ω-3 PUFA contained in fish on numerous debilitating and common
conditions including cardiovascular diseases (CVD), rheumatoid arthritis, and asthma, among
others (Riediger, 2009). Omega-3 fish oil is obtained from the extraction of lipids from tissues of
appropriate fish species (not all fish contain significant amounts of emega-3 PUFA). Fish do not
produce ω-3 PUFA; instead, they accumulate ω-3 PUFA from either consuming microalgae
containing ω-3 PUFA or by eating prey fish that accumulated ω-3 PUFA from microalgae. Due
to its high polyunsaturated fatty acid content, fish oil is highly susceptible to oxidative
deterioration; which has limited the use of fish oil in food products because of flavor degradation
by oxidation. Perhaps an even more serious potential problem is that hydroperoxides, the
primary product of lipid oxidation, may be toxic (Oarada & Miyazawa, 1990). Menhaden and
salmon oils are commercially produced in the U.S. and both fish oils are abundant sources of
omega-3 polyunsaturated fatty acids, especially EPA and DHA.
2.2.1.1 Menhaden Oil
Menhaden (Brevootia tyranuus) is an abundant fish in U.S. waters, but this fish is rarely
consumed in the U.S. as a food product for humans. In 2008, more than 608.45 million Kg of
menhaden was harvested in the U.S.; this represented about 16% of the total harvest of all U.S.
commercial fisheries (NMFS, 2009). Menhaden is mainly used for oil production, fish meal, fish
solubles, and as bait. According to Yin & Sathivel (2010), menhaden oil is a good source of EPA
(12.8%-15.4%) and DHA (6.9 – 9.1%). Purified menhaden oil is approved for human
consumption (FDA, 2004a). Fish oil produced from menhaden is sold in the U.S., Europe,
Canada, and Japan. It is estimated that the production of oil from Gulf of Mexico menhaden was
46,528 metric tons in 2006. Most of Gulf fishmeal/fish oil processing plants are located in Moss
Point, Miss.; and in the Louisiana cities of Empire, Abbeville, and Cameron (IFFO.net).

12
2.2.1.2 Salmon Oil
Alaska produces over 65% of the total wild fish harvested for human consumption in the
U.S. Large amounts of salmon byproducts are produced in Alaska every year. It is estimated that
around 98,045 metric tons of salmon byproducts were produced out of 363,132 metric tons of
salmon harvested in Alaska in 2009 (ADFG, 2010). Salmon heads, skin, and viscera are counted
as salmon processing by-products. According to Sathivel (2005), much of the oil in salmon
processing by-products is found in the head, which contains approximately 15-18% lipids.
Generally, fish by-products including heads are discarded or are mixed and used in the
production of fish meal, and fish oil (Bechtel & Oliveira, 2006). Refined salmon oil is approved
for human consumption (FDA, 2004b)
2.3 Microencapsulation Technology
According to Rosenberg et al. (1985), microencapsulation is a processing method in which
small quantities of solid, liquid and gaseous materials are packed into a wall matrix; which forms
microcapsules. It has been observed that these microcapsules can release their contents at
controlled rates over prolonged periods of time (Champagne & Fustier, 2007).
Microencapsulation can also help overcome the main problems of food fortification with ω-3
PUFA, the unpleasant “fishy” flavor of fish oil and the oxidation of polyunsaturated fatty acids
that has negative influence on food acceptability (Kolanowaski et al., 1999). The structure
formed by the microencapsulating agent around the microencapsulated compound (core) is
called a “wall”; this wall protects the core compound from biological degradation and enhances
its stability (Figure 2.4). Because of the direct effect of the wall on microencapsulation
efficiency, microencapsulation stability, and protection efficiency of the core compound, the
selection of the wall material is very important in the microencapsulation process (Perez-Alonso

13
et al., 2003). The wall material of a microcapsule produced by spray drying has to be highly
soluble. It is also desirable that the concentrated solution of the wall material has a low viscosity
(Reineccius, 1988). The stability of the microencapsulated substance is influenced by the
composition of the wall (Anandaraman & Reeineccius, 1986; Beatus et al.,1984; Reineccius,
1994). Choosing a particular wall material depends on many factors such as solubility, viscosity,
glass or melting transition, forming and emulsifying properties (Gharsallaoui et al., 2007).
Wall Material
Microcapsule
Microencapsulated
compound
Figure 2.4 Graphic representation of a microencapsulated compound
Carbohydrates, especially sugars like glucose and sucrose and polysaccharides like starch,
maltodextrins, pectin, alginate and chitosan, have been successfully used as wall materials
(Risch, 1995; Kenyon, 1995). However, carbohydrates cannot be used in wall systems without
the presence of a surface-active constituent because they generally have no emulsifying
properties (Bangs & Reineccius, 1988). The incorporation of carbohydrates in a wall matrix has
been shown to improve the drying properties of the wall by enhancing the formation of a dry
crust around the droplets of the microencapsulated compound. High concentrations of low
molecular weight sugars may not be suitable for spray drying due to the formation of sticky
powders and caramelization (Bayrarn et al., 2005).
Proteins have the ability to assemble at interfaces because of their amphiphilic nature. It has
been proven that proteins are good wall materials for flavor compounds because of their high

14
binding activity with flavors (Landy et al., 1995). Whey proteins have been reported to be
effective as a wall material for microencapsulation of anhydrous milkfat or volatiles. The
combination of whey protein with lactose significantly limits the diffusion of core material
through the wall thereby leading to high microencapsulation efficiency (Moreau & Rosenberg,
1993; Rosenberg & Young, 1993). Sodium caseinate is also an effective wall material for
microencapsulation of oils. It has strong amphiphilic characteristics and high diffusivity, which
provides a better distribution around the enclosed oil surface (Hogan et al., 2001). Maltodextrin,
and highly branched cyclic dextrin (BHCD) in combination with sodium caseinate and whey
protein isolate have been used as wall materials for the microencapsulation of fish oil; and it was
reported that the combination of maltodextrin or HBCD with sodium caseinate improved the
oxidative stability of encapsulated fish oil (Kagami et al., 2003). Currently, there is a lack in
scientific literature regarding lipid compounds microencapsulated in wall systems containing egg
proteins; however, it is believed that egg proteins may be good encapsulating agents due to their
emulsifying properties (Mine, 1995).
2.3.1 Spray Drying
Spray drying is a technology used to preserve foods. The core of this technique is spraying a
feed material in a liquid state into a hot drying medium (temperature ranging from 100 to 300°C)
in which liquid (often water) is evaporated. The final product of a spray drying process is a dried
form of powders, granules or agglomerates, depending upon the physical and chemical properties
of the feed, the dryer design and operation. Evaporation of water from the droplets is facilitated
by heat and vapor transfer through/from the droplets. It is believed that the wet-bulb temperature
of the droplets is in the range of 30- 50°C and total duration of drying is only a few seconds
(Schuck et al., 2009). Spray dried food powders show high storage stability, good handling

15
characteristics (for some applications) and minimized transportation weight in comparison with
liquid concentrates (Obón et al., 2009). Spray drying is a common method of encapsulation of
food ingredients in the food industry. Several studies have demonstrated the efficiency of spray
drying to encapsulate food products such as carotenoids, vitamins, minerals, flavors,
polyunsaturated oils, enzymes and probiotic microorganisms.
The basic steps in the microencapsulation involves the preparation of a stable emulsion to be
processed; homogenization of the emulsion; atomization of the emulsion; and dehydration of the
atomized particles (Dziezak, 1988; Shahidi & Han, 1993). A stable emulsion of fine droplets of
the core material in the wall solution is critical during microencapsulation (Kenyon & Anderson,
1988). Therefore, the wall materials need to have emulsifying characteristics as well (Sheu &
Roserberg, 1995). In addition, it is reported that the rheological properties of the emulsion is a
key parameter in the spray drying process; thus, an emulsion with high viscosity causes the
formation of large droplets which affects the drying rate (Drusch, 2007).
The spray drying procedure involves: (I) concentration of the feed prior to spray drying;
(II) atomization of the feed to create the optimum conditions for evaporation to a dried product
having the desired characteristics; (III) droplet–air contact in the chamber, the atomized liquid is
brought into contact with hot gas, resulting in the evaporation of +95% of the water contained in
the droplets in a matter of a few seconds; (IV) droplet drying, moisture evaporation takes place
in two stages, a) during the first stage, there is enough moisture in the drop to replace the liquid
evaporated at the surface and the evaporation rate is relatively constant (Keey & Pham, 1976),
and b) the second moisture evaporation stage begins when there is no longer enough moisture to
maintain saturated conditions at the droplet surface, causing a dried shell to form at the surface.
The evaporation rate depends on the diffusion of moisture through the shell, which increases in

16
thickness as the evaporation proceeds. The final step in a conventional spray drying process is
(V) separation; this involves the use of cyclones, bag filters, and/or electrostatic precipitators
(Patel et al., 2009). Spray drying is a technology that can be used with both heat-resistant and
heat sensitive products, and from which nearly spherical particles can be produced.
According to Patel et al. (2009), the critical elements of a spray drying system includes the
atomizer, the air flow, and the spray drying chamber.
2.3.1.1 Atomizer
The atomizer is the “heart” of any spray drying system. One of the functions of the atomizer
is to disperse the feed material into small droplets, which increases the surface are and allows a
well distribution of the feed within the dryer chamber. The atomized droplets must not be large
that they produce an incomplete dried product, nor so small that the product recovery is difficult.
There are different configurations of atomizers; however, the most common designs are in the
form of high-speed rotating disc, two fluid nozzles; airless atomization nozzles; pressure nozzle;
an ultrasonic nozzle.
2.3.1.2 Air Flow Patterns
a) Co-current flow design or parallel design; in this configuration, the feed is sprayed into
the hot air entering the dryer and both pass through the chamber in the same direction.
This exposes sensitive dry product to only the cooler exit air. (Figure 2.5a).
b) Counter-current flow: in this spray dryer configuration, the feed and the air are
introduced at opposite ends of the chamber, with the atomizer positioned at the top and
the air entering at the bottom (Figure 2.5b) This configuration exposes the product to hot
air, and evaporates bound residual water more efficiently than the co-current flow design;
it is no recommend for sensitive materials to heat.

17
Feed Flow
Drying air flow
Product
Cooled air + dust
Feed Flow
Drying air flow
Product
Cooled air + dust
a) b)
Figure 2.5 Spray dryer configuration. a) Co-current configuration. b) Counter-current
configuration.
2.3.1.3 Spray Drying Chamber
Air circulating with the chamber keeps a flow pattern, this prevent the deposition of partially
dried product on the wall or atomizer (Ronald, 1997). Air movement and temperature of inlet air
influences the type of final product.
In addition to the critical elements of a spray drying system, Patel et al. (2009) describes the
inlet air temperature, outlet air temperature, viscosity of the feed, solid content of the feed,
surface tension of the feed, feed temperature, volatility of the solvent, and nozzle material as
critical parameters of spray drying process. Spray drying technology is widely used by the food
industry. This is an ideal process where the end-product must comply with precise quality
standards regarding particle size distribution, residual moisture content, bulk density and
morphology. The production of food powders by spray drying has gained more attention in the
recent years due to the versatility and controllability of a spray drying system.

18
2.4 Effect of Dietary Protein on Athletes’ Performance
At rest, immediately after consumption of a meal containing amino acids, the absorptive
process of amino acids begins with the delivery of amino acids to muscles, which exceeds the
muscles’ capacity to assimilate them, resulting in an expansion of the intramuscular amino acid
pool, such expansion being less than might be expected (Bergstrom et al., 1990). This may be
due to protein synthesis, the inhibition of breakdown, and the stimulation of the branched-chain
amino acids (BCAAs) catabolizing enzymes. The BCCAs amino acids include valine, isoleucine
and leucine. BCCAs are transaminated, and the synthesis of alanine and glutamine, which are
stimulated in the presence of ample pyruvate (from blood glucose), is initiated. The net balance
of other nonmetabolized amino acids simply reflects the protein balance (Rennie & Tipton,
2000).
The synthesis of protein decreases and the breakdown increases during the post-absorptive
state. The novo-synthetized alanine, glutamine altogether with the dietary leucine are
decarboxylated, but only leucine is completely oxidized in the Krebs cycle and it is the only one
that gives rise to acetate. Some BCCAs carbon (from valine and isoleucine) may escape muscle
as hydroxyl acids, thereafter contributing to gluconeogenesis, which is the generation of glucose
from a non-carbohydrate carbon substrate (Brosnan & Letto, 1991). The fates of alanine and
glutamine are mainly gluconeogenesis and ureagenesis (Consoli et al., 1990; Nurjhan et al.,
1995). At rest, in the post-absorptive state, muscle amino acids may account for 30% of total
gluconeogenesis. However, the synthesis of alanine and glutamine increases almost linearly with
aerobic exercise; although gut-derived amino acids may contribute substantially as exercise
continues (Wasserman et al., 1991).

19
Dynamic exercise and resistance exercise
The oxidation of BCCAs like leucine, valine, and isoleucine is stimulated by sustained
dynamic exercise. Sustained dynamic exercise also encourages ammonia production (increasing
ureagenesis and loss of nitrogen) in proportion to exercise intensity. Energy expenditures
(exercise) greater than energy input (food) generally results in a loss of body mass, particularly
when continued over an appreciable period of time. Also, when intense physical activity is
associated with insufficient input, wasting of lean-tissue mass is inevitable unless an eating
protocol is established (Butterfiled, 1999). Even though, Butterfield & Calloway (1984)
demonstrated that an increased level of physical activity actually increased the efficiency of
protein utilization; Lemon, (1998); Phillips et al., (1993); and Tarnopolsky et al., (1992) have
concluded that regular exercise will place, on physically active people, a requirement of eating
more protein than they would otherwise do if they are to maintain their weight.
Weight lifting and other types of resistance exercises do not have effect on whole-body
leucine oxidation (Tarnopolsky, 1991), this may be due to the fact that protein is not used as fuel
by the human body in this kind of activity; instead it is used to remold the muscle; therefore, an
increased in protein intake is needed. Resistance exercise cause little changes in amino acid
oxidation but probably depresses protein synthesis and increases breakdown acutely. Protein
synthesis rebound is observed after ≤48 h of exercise; nonetheless, breakdown remains elevated,
and net positive balance is achieved only if amino acid availability is increased (Rennie &
Tipton, 2000).
It is clear that high exercise intensities produces a net loss of muscle protein as a result of
decreased in protein synthesis, increased breakdown, or both; and some amino acids are oxidized
as fuel, while the rest provide substrates for gluconeogenesis and possibly for acid-based
20
regulation. According to Layman & Rodriguez (2009), muscle recovery from exercise, both
dynamic and resistance, seems to be dependent on dietary leucine. Leucine is a critical element
in regulating muscle protein synthesis and may be the key amino acid defining the increased
needs for EAA to optimize skeletal muscle mass; moreover, increased tissue levels of leucine
combined with circulating insulin to allow skeletal muscles to manage protein metabolism and
fuel selection in relation to diet composition.
2.5 Effect of Dietary Omega-3 Fatty Acids on Athletes’ Performance
Recently, attention has been given to the benefits of the intake of omega-3 fatty acids on the
athletes’ performance. The benefits attributed to the omega-3 fatty acids intake includes the
improvement in the delivery of oxygen and nutrients to muscles and other tissues due to the
reduction of blood viscosity; this causes an improvement in aerobic metabolism because of
enhanced delivery of oxygen to cells. Moreover, the intake of omega-3 fatty acids is also
associated with an improved release of somatotropin (growth hormone) in response to normal
stimuli, such as exercise, sleep, and hunger, which may have an anabolic effect; and the
reduction of inflammation caused by muscular fatigue and overexertion; this may improve
postexercise recovery time. The prevention of tissue inflammation may be also associated to the
intake of omega-3 fatty acids (Bucci, 1993). Nevertheless, evaluations of the effectiveness of the
consumption of omega-3 fatty acids have demonstrated no improvements in strength, endurance,
and muscle soreness (Brilla & Landerholm,1990; Lenn et al., 2002). Instead, the benefits of
omega-3 fatty acids are more related to the enhancement of aerobic metabolic process, which is
an important factor in both athletic performance and in an individual’s ability to effectively burn
fat as an energy substrate.

21
CHAPTER 3: MATERIALS AND METHODS
3.1 Materials
Fresh, large, grade AA hen eggs were purchased from a local chain grocery store, in Baton
Rouge, Louisiana. The eggs were stored at 4°C, and the storage time did not exceed three days.
Refined menhaden fish oil extracted via a rendering process was obtained from Omega Protein
Corporation (Houston, TX). Salmon fish oil was obtained from salmon byproducts including
viscera, heads, skins, frame, and discarded fish was obtained from a commercial fishmeal
processing plant in Alaska. All other chemicals were obtained from Sigma Chemical Co. (St.
Louis, MO).
3.2 Methods
3.2.1 Proximate Analysis of Liquid Egg Whites (EW)
Moisture content, total lipids, crude protein and ash were determined for EW. Moisture
content was measured in triplicate according to the AOAC official method 930.15 (AOAC
1999). Total lipids content was quantified in dry samples by an automated FAS-9001 fat
analyzer (CEM Corporation, Matthews, NC, NC) using methylene chloride as the solvent.
Approximately 3 g of dry sample were place between two filter papers; afterwards, the filter
papers were placed into the fat analyzer and the weight of the defatted sample was recorded and
calculated the fat content of the samples. Crude protein content was determined according to
AOAC official method 992.15 (AOAC, 2006) using a Perkin Elmer Nitrogen Analyzer (Model
2410, Perkin Elmer Instruments, Norwalk, CT). The crude protein (%) was reported as 6.25
times of the nitrogen content (%). Ash content was determined in triplicate according to the
AOAC official method 942.05 (AOAC 1999). Approximately 5 g of dried egg white were

22
placed in a Thermolyne Type 6000 muffle furnace (Thermo Scientific, Lawrence, KS) at 550 °C
for 5 h and weighted ash content.
3.2.2 Fatty Acid Methyl Esters (FAMEs) Composition of Menhaden Oil (MO) and
Salmon Oil (SO)
The FAMEs composition of the MO and SO were determined at the USDA-ARS
Laboratory, University of Alaska Fairbanks, AK. FAMEs were produce using a modified method
of Maxwell and Marmer (1983). Approximately 20 mg of oil were poured into a glass test tube,
then, 4.5 mL of isooctane, 500 µL internal standard (10 mg methyl tricosanoate (23:0)/ml
isooctane) and 500 µL of 2N KOH (1.12g/10 mL MeOH) were added and the mixture was
vortexed for 60 s and centrifuge for 3 min at 38.67 x g; afterwards, the lower MeOH layer was
discarded and 1 ml of saturated ammonium acetate was added into the mixture. The new mixture
was again vortexed and centrifuged and the lower layer was removed. The final removal of the
lower layer was done after the addition of 3 grams of anhydrous sodium sulfate; the mixture was
then vortexed and centrifuge for 15 min. at 38.67 x g. The upper layer containing methyl esters
and isooctane was used for the gas chromatographic analysis.
The gas chromatographic (GC) with a GC model 7890A (Agilent) fitted with a HP-88
(100m x 0.25mm ID x 0.25 m film) column was used for FAMEs analysis. The oven program
used was 90°C for 8 min, followed by 10 °C/min heating to 175°C for 10 min, 4 °C/min to 190
°C for 10 min, 5 °C/min to 210°C for 5 min and then 20 °C/min to 250°C for 8 min.
ChemStation software was used to integrate peaks. Peaks were identified by comparing to
reference standards obtained from Sigma: Supelco 37 mix, PUFA #1, PUFA #3 and cod liver oil.
Data are expressed as percent of total integrated area.

23
3.2.3 Moisture Content, Free Fatty Acids (FFA), Peroxide Value (PV), and Color Values
of MO and SO
Moisture content of MO and SO was determined by a Karl Fisher titration AOAC method
984.20 (AOAC, 2006) using a moisture meter (Mitsubishi ® CA-21, Japan). Approximately 0.4
g of fish oil were injected into the moisture meter; after the reaction time (approximately 5
minutes), the moisture meter provided the moisture content of fish oil sample expressed in ppm.
The FFA content of the purified fish oils was determined by the titration method according to
AOCS Ca 5a-40 (1998). Five grams of fish oil was added in 50 mL ethanol (previously
neutralized by adding 2 mL phenolphthalein solution and enough 0.1 N NaOH to give a faint
permanent pink color). The fish oil and the alcohol mixture were titrated with 0.25 N NaOH until
as just permanent pink appeared. The percentage of FFA was expressed as oleic acid equivalent.
The peroxide value (PV) of the MO and SO were determined in triplicate by titrating according
to AOAC 965.33 (1999). Five grams sample of fish oil were dissolved in 30 mL acetic acid-
chloroform (3:2 v:v) solution. Saturated KI solution (0.5 mL) was added and the mixture was
shaken for 1 min; afterwards, 30 mL of distilled water was added. The resulting mixture was
titrated with 0.1 N Na2S2O3 until the blue color disappeared. The results were reported in terms
of milliequivalent of peroxides per kg of fish oil. Color of MO and SO was measured by using a
LabScan ® XE spectrophotometer (Hunter Associates Laboratory, INC. Resbon, VA). The
results of color determination were reported in CIELAB color scales (L* value is the degree of
lightness to darkness, a* value is the degree of redness to greenness, and b* value is the degree
of yellowness to blueness). Before each measurement, the instrument was previously
standardized using the calibrated black and white standards. Chroma and hue angle values were
calculated using Eqs.(1) and (2), respectively. Negative values of the hue angle were converted

24
to positive values by adding 180°, so that it could fall in the 90-180° quadrant (+b* = yellow; -
a*=green) (Pu et al.,2011).
Chroma = [(a*)2 + (b*)
2]
1/2 (1)
Hue = tan-1
(b*/a*) (2)
3.2.4 Preparation of Emulsions
Egg whites were carefully separated from egg yolks. Then, oil-in-water emulsions containing
MO/SO and EW for producing microencapsulated fish oil with egg white powder were prepared
by mixing distilled water, MO/SO and EW. Two stable emulsions were prepared with 3.43%
MO/SO, 56.21% egg whites, and 40.36% distilled water (E-MO-EW, and E-SO-EW). Also, a
solution containing 80% EW with distilled water (E-EW) was prepared as a control. Afterwards,
the emulsions and the control solution were homogenized for 5 min using an ultrasonic processor
(500 Watt Model CPX 500, Cole-Parmer Instrument Co. Vernon Hill, IL) fitted with a 22 mm tip
diameter at 82% amplitude with 2x1 pulses (with 1 s delay between pulses). These conditions
were selected based on previous studies and published literature (Yin et al., 2009). Samples were
held in an ice bath at 4°C during the procedure.
3.2.5 Characterization of Emulsions
3.2.5.1 Color and Emulsion Oxidation
Color of the emulsion was determined in triplicate following the procedure described in
section 3.2.3. Thiobarbituric acid-reactive substances (TBARS) were quantified to evaluate the
emulsion oxidation. TBARS of the emulsions were determined according to the method
described in Mei et al., (1998) with some modifications. A solution of Thiobarbituric acid (TBA)
was prepared by mixing 15 g of trichloroacetic acid, 0.375 g of TBA, 1.76 mL of 12 N HCL, and
82.9 mL of H2O. The TBA solution (100 mL) was mixed with 3 mL of 2% butylated

25
hydroxytoluene in ethanol, and 2 mL of this solution was mixed with 1 mL of an emulsion
sample. The resulting mixture was vortexed for 10 sec and heated in a boiling water bath for 15
min. The mixture was allowed to cool down at room temperature; then, it was centrifuged at
3400 x g for 25 min. The absorbance of the supernatant was measured at 532 nm. Concentration
of TBARS were determined from standard curves prepared with 0-0.02 mmol/L 1, 1, 3, 3-
tetraethoxypropane. The results were expressed in mmol of equivalents of malonaldehyde per kg
oil.
3.2.5.2 Flow Behavior and Viscoelastic Properties
Flow behavior and viscoelastic properties of the emulsions were measured in triplicate using
an AR 2000 Ex Rheometer (TA Instruments, New Castle, DE) fitted with a plate geometry
(acrylic plates with a 40-mm diameter, having a 200 m gap between the two plates). Each
emulsion was placed in the temperature-controlled parallel plate and allowed to equilibrate to
either 5, 15, or 25 °C. The shear stress was measured at 5, 15, and at 25°C at varying shear rates
from 1 to 100 s-1
. The mean values of triplicate samples were reported. The power law (Eq. 3)
was used to analyze the flow behavior index of the emulsions.
K n (3)
where = shear stress (Pa.s),
= shear rate (s-1
), K = consistency index (Pa.sn), and n = flow
behavior index. Logarithms were taken on both sides of Eq. 3, and a plot of log versus log
was constructed. The resulting straight line yielded the magnitude of the K (i.e., intercept) and n
(i.e., slope).
Frequency sweep tests were conducted between 0.1 to 10 Hz at a constant temperature of
25°C. The storage modulus and loss modulus of emulsion samples were obtained using
Universal Analysis (TA instrument) software and were calculated using Eqs. (4) and (5).

26
cos'
0
0
G (4)
sin''
0
0
G (5)
where G’ (Pa) is the storage modulus, G’’ (Pa) is the loss modulus, σ is generated stress, and is
oscillating strain.
3.2.6 Spray Drying of Emulsions
The emulsions containing EW and MO/SO were dried using a pilot plant scale spray dryer
(FT80 Tall Form Spray Dryer Armfield Inc., Ringwood, UK) under co-current drying conditions.
A schematic representation of the pilot scale FT80 tall form spray dryer is shown in Fig. 3.1. The
FT80 spray dryer includes inlet and exhaust air fans, an electrical air heating chamber, a tall
dryer chamber, and a cyclone separator. The air velocity and temperature of ambient air were
recorded using an anemometer (Anemomaster Model 6162, Kanomax Inc. Japan); and the
relative humidity of ambient air was measured using an Omega 4-in-1 multifunctional
anemometer (Omega Engineering, Stamford, CT). Ambient air was blown into the air heating
chamber by the inlet fan where the ambient air was heated by an electric resistance heater to 130,
140 or 150°C. The heated air (inlet air) was blown into the top of the drying chamber. The
temperature of emulsions (E-MO-EW and E-SO-EW) and solution (E-EW) was measured at the
beginning of the procedure, and then the emulsion was separately fed through the hygienic
progressing cavity pump to a spray nozzle where it was atomized and sprayed into the dryer
chamber. The emulsion droplets were dried in the drying chamber yielding dried powder and
dust. The dried powder, dust, and air were pulled to the bottom of the drying chamber and then

27
to the cyclone separator by the exhaust fan. The powder and dust were separated in the cyclone
separator. The powder separated by the cyclone separator was collected in the powder collector
and the exhaust air was released though filter bag to the atmosphere. The filter bag captured the
dust. The internal diameter of ambient air intake pipe and exhaust air pipe, exhaust (outlet) air
temperature, and outlet air velocity were measured. The relative humidity and exhaust air
temperature that passed through the exhaust fan were recorded. In total, nine egg white powders
were obtained, E-EW dried at 130°C (DEW-130), E-EW dried at 140°C (DEW-140), E-EW
dried at 150°C (DEW-150), E-MO-EW dried at 130°C (MO-EW-130), E-MO-EW dried at
140°C (MO-EW-140), E-MO-EW dried at 150°C (MO-EW-150), E-SO-EW dried at 130°C
(SO-EW-130), E-SO-EW dried at 140°C (SO-EW-140), and E-SO-EW dried at 150°C (SO-EW-
150). The E-MO-EW, E-SO-EW, and E-EW egg powder samples and dust were analyzed for
moisture content according to the AOAC official method 930.15 (AOAC, 1999). The powder
production rate was estimated and compared with the actual powder production rate. The actual
powder production rate was the mass of the powder recovered from the powder collector divided
by the time of production. The estimated production rate was the sum of the actual production
rate and the average rate at which powder was retained within the spray dryer by such
mechanisms as sticking to the walls of the spray dryer. The mass flow rate for water entering and
leaving the spray dryer and the energy required to dry the emulsion in the production of powder
were determined. The resulting powders were stored at 4oC, and the storage time did not exceed
four days. The drying procedure was carried out in triplicate.
3.2.6.1 Estimation of Production Rate of Microencapsulated Powders
The material balance expressed as average flow rates of dry solids entering and leaving the
spray dryer system (Fig. 3.2) is described by Eq. (6).
28
me = mP + md (6)
The production rate was estimated by the Eq. (7)
mP = me - md (7)
Feed
Compressed air
Inlet fanC
yclo
ne
Powder
collector
Exhaust fan
Compressor
Dehumidifier
Air heater
Tinlet
Toutlet
Dryer chamber
Pump
Feeding
vessel
20
.5 c
m9
1.5
cm
35
cm
14
cm
41
cm
15
cm
16.9 cm
19.5 cm
Ø = 3.88 cm
0.4
cm
197 cm
0.7
6 c
mØ=10.19
cm
Ø=30.56 cm
5.16 cm
7.2
cm
3.4
cm
Figure 3.1 Schematic representation of the pilot scale FT80 Tall Form Spray Dryer-Armfield
Limited®

29
where me is the average emulsion flow rate (kg dry solids/h); md is the average dust flow rate (kg
dry solids/h); mP is the estimated powder production rate which included both the average actual
production flow rate (mp) for the powder collected through powder collector vessel and product
retained in the spray dryer. It was assumed that the physical properties of product retained in the
spray dryer were the same as the powder product collected in cyclone collector vessel.
Inlet fan
Cy
clo
ne
Powder (P)
Exhaust fan
Dryer chamber
Pump
Feed (F)
Air
heate
r
Ambient airInlet
air (IA)
Outlet air (OA)
Dust (D)
mF, TF
mP, TP
mD, TD
HOA, TOA
HIA, TIA
Figure 3.2 Material balance of a spray drying system

30
3.2.6.2 Estimation of Evaporation Rate
The moisture balance expressed as water entering and leaving the spray dryer system is
described by Eq. (8).
maaAHaa+mewe = maoAHao+mdwd+mPwp (8)
where maa is the dry air mass flow rate at the inlet (ambient air) (kg dry air/h); mao is the dry air
mass flow rate of outlet air (kg dry air/h); me is the mass flow rate of the emulsion (kg dry
solids/h); md is the mass flow rate of dust (kg dry solids/h); mP included both the product flow
rate (mp) for the powder collected through cyclone vessel and product retained in the spray dryer;
AHaa is the absolute humidity of inlet ambient air (kg water/kg dry air); AHao is the absolute
humidity of outlet air (kg water/kg dry air); we is the moisture content (dry basis) of emulsion (kg
water/kg dry solids); wd is the moisture content (dry basis) of dust (kg water/kg dry solids); wp is
the moisture content (dry basis) of product (kg water/kg dry solids). It has been assumed that the
powder retained in the spray dryer has essentially the same moisture content as the collected
powder and that the encapsulation effectively removes that moisture from the air stream.
The evaporation rate (Eva) was estimated from the moisture removed by the dry air as shown by
Eq. (9).
Eva = maoAHao –maaAHaa (9)
Also, the evaporation rate (Evp) was estimated based on the moisture content of emulsion,
powder collected through cyclone vessel and dust using Eq. (10).
Evp = mewe – mdwd - mPwp (10)
The dry air mass flow rate of inlet ambient air and dry mass flow rate of outlet air were estimated
as described by the AlChE Equipment Testing Procedure (2003) using Eq. (11).
'V
Vm (11)

31
where m is the dry air mass flow rate (kg dry air/h); V is the volumetric flow rate of inlet or
outlet air (m3/h); V’ is the specific volume of inlet or outlet dry air (m
3/kg dry air).
The volumetric flow rate of inlet ambient air and outlet air was calculated as described by Eq.
(12)
V = v x A (12)
where v is the average velocity of the inlet or outlet air (m/s) and A is the cross sectional area of
the inlet or outlet air pipe (m2).
The specific volumes of inlet or outlet dry air were calculated using Eq. (13) as described by
Singh and Heldman (2001).
1829
1)4.22082.0('
AHTV (13)
where T is the temperature of inlet ambient or outlet air (°C); AH is the absolute humidity of inlet
ambient or outlet air (kg water/kg dry air).
The absolute humidity of the inlet ambient and the outlet air were calculated as Eq. (14) as
described by AlChE Equipment Testing Procedure (2003)
pw
pwxAH
325.101
622.0 (14)
where AH is the absolute humidity of the inlet ambient or outlet air (kg water/kg dry air); and pw
is the partial pressure exerted by water vapor (kPa).
The partial pressure exerted by water vapor is estimated with Eq. (15) as described by Singh
and Heldman (2001)
pw = pv x RH (15)
where pw is the partial pressure exerted by water vapor (kPa); pv is the saturation pressure of
water vapor (kPa); RH is the relative humidity (%).
32
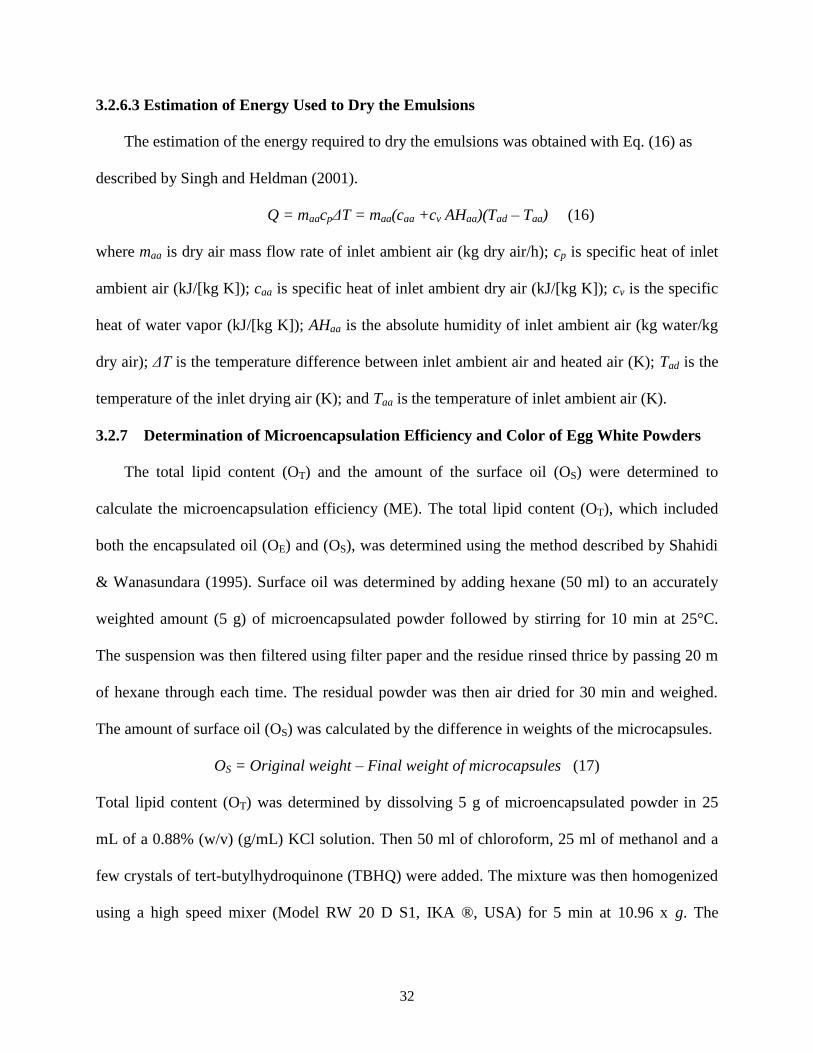
3.2.6.3 Estimation of Energy Used to Dry the Emulsions
The estimation of the energy required to dry the emulsions was obtained with Eq. (16) as
described by Singh and Heldman (2001).
Q = maacpΔT = maa(caa +cv AHaa)(Tad – Taa) (16)
where maa is dry air mass flow rate of inlet ambient air (kg dry air/h); cp is specific heat of inlet
ambient air (kJ/[kg K]); caa is specific heat of inlet ambient dry air (kJ/[kg K]); cv is the specific
heat of water vapor (kJ/[kg K]); AHaa is the absolute humidity of inlet ambient air (kg water/kg
dry air); ΔT is the temperature difference between inlet ambient air and heated air (K); Tad is the
temperature of the inlet drying air (K); and Taa is the temperature of inlet ambient air (K).
3.2.7 Determination of Microencapsulation Efficiency and Color of Egg White Powders
The total lipid content (OT) and the amount of the surface oil (OS) were determined to
calculate the microencapsulation efficiency (ME). The total lipid content (OT), which included
both the encapsulated oil (OE) and (OS), was determined using the method described by Shahidi
& Wanasundara (1995). Surface oil was determined by adding hexane (50 ml) to an accurately
weighted amount (5 g) of microencapsulated powder followed by stirring for 10 min at 25°C.
The suspension was then filtered using filter paper and the residue rinsed thrice by passing 20 m
of hexane through each time. The residual powder was then air dried for 30 min and weighed.
The amount of surface oil (OS) was calculated by the difference in weights of the microcapsules.
OS = Original weight – Final weight of microcapsules (17)
Total lipid content (OT) was determined by dissolving 5 g of microencapsulated powder in 25
mL of a 0.88% (w/v) (g/mL) KCl solution. Then 50 ml of chloroform, 25 ml of methanol and a
few crystals of tert-butylhydroquinone (TBHQ) were added. The mixture was then homogenized
using a high speed mixer (Model RW 20 D S1, IKA ®, USA) for 5 min at 10.96 x g. The

33
mixture was transferred to a separatory funnel; the chloroform layer was separated and then
evaporated using a rotavapor (Model Büichi RE121, Büichi Lab, Switzerland) at 60°C to recover
the oil.
The OE and the ME were calculated as described by Eqs. (18) and (19), respectively.
OE = OT – OS (18)
100*T
E
O
OME (19)
Color determination of egg white powders was carried out in triplicate following the method
described in section 3.2.3.
3.2.8 Fatty Acid Methyl Esters (FAMEs) and Lipid Oxidation of Egg White Powders
Fatty acid methyl ester profiles of the egg powders were determined at the USDA-ARS
Laboratory, University of Alaska Fairbanks, AK. The oil samples were extracted from MO-EW,
and SO-EW powders using the method described in section (3.2.7). FAMEs composition and
FFAs were determined for the lipid extracts following the methods detailed in sections (3.2.2)
and (3.2.3) for FAMEs composition and FFA, respectively.
TBARs analysis was carried out following the procedure described in section (3.2.5.1). A
0.5 g sample of egg white powder was dispersed in 5 mL of distilled water and vortexed for 5
min.; afterwards, 1 mL of this mixture was mixed with 2 mL of TBARs solution, vortexed and
placed in boiling water for 15 min. The mixture was allowed to cool down at room temperature,
then it was centrifuged at 3400 x g for 25 min. and absorbance was measured at 532 nm. TBARs
content was determined using a standard curve of 1,1,3,3-tetraethoxypropane. The results were
expressed in mmol of equivalents of malonaldehyde per kg oil.

34
3.2.9 Crude Protein, Total Lipids, Ash and Water Activity (aw) of Egg White Powders
Crude protein, total lipids, ash and water activity (aw) were determined for the egg white
powder samples. The methods used to determine crude protein, and ash content are described in
section (3.2.1). Total lipids were quantified according the method described in section (3.2.7).
Water activity (aw) was determined using an AquaLab water activity meter (Model Series 3 TE,
Decagon Devices, Inc., Pullman, WA, USA). All of the measurements were carried out in
triplicate.
3.2.10 Amino Acid and Mineral Analysis
Amino acid profiles of the egg white powders were determined by the AAA Service
Laboratory Inc., Boring, OR. Powder samples were hydrolyzed with 6N HCl and 2% phenol at
110 C for 22 h. Amino acids were quantified using a Beckman 6300 analyzer with post-column
ninhydrin derivatization. Tryptophan and cysteine content were not determined. We analyzed
only the most common 16 amino acids plus hydroxyproline and hydroxylysine. This method is
not satisfactory for determining the amino acids including tryptophan, cysteine, and taurine.
Determination of tryptophan and cysteine require a different hydrolysis procedure because the
condition used (6NHCL at 110 for 22 h) for analyzing the most 16 amino acids; will destroy
significant quantities of these two amino acids. A different hydrolysis procedure is required to
determine cysteine and tryptophan (Simpson et al., 1976). The AAA Service laboratory does
analyze for these amino acids but the cost of each of these amino acids analysis is the same as for
the standard hydrolysis procedure. Due to the increased cost, determination of tryptophan and
cysteine were not performed.
The mineral profile analysis of the egg powder samples was carried out in triplicate by the
acid digestion method involving microwave technology (CEM microwave, MDS-2000, CEM
35
Corp., Matthews, N.C., U.S.A.). A 0.5 g sample was placed in a vessel and 6 mL HNO3 was
added. The sealed vessel was heated until digestion was completed. The samples were cooled for
5 min. The inductively coupled argon plasma system (Model CIROS, SPECTRO Analytical
Instruments, Kleve, Germany) was utilized to determine the mineral profile.
3.2.11 Scanning Electron Microscopy (SEM) and Particle Size Distribution of
Microencapsulated Powders
The microstructure of the egg powders was evaluated by scanning electron microscopy
(SEM) (JSM-6610LV, JEOL Ltd. Japan) working with a voltage of 10 kV. The samples were
mounted on aluminum SEM stubs, and then coated with gold: palladium (60:40) in an Edwards
S150 sputter coater (Edwards High Vacuum International, Wilmington, MA). The powders were
systematically observed at 1000X of magnification.
The particle size distribution was determined by a Microtrac S3500 system (MicroTrac,
Largo FL). The system works with three solid state lasers fixed at 780 nm with a computer
controlled single lens alignment. The system has a measurement capability from 0.24 to 2800
microns. A small amount of powder samples were place into the test chamber with circulating
ethyl-alcohol in each trail. A period of 10 sec ultrasound mixing at 20 watts was used before
each test. Then the sample was pumped through sample cell at 40% of the maximum flow rate.
Light was scattered from the tri-lasers from low to high angles (0-163 degrees). The whole light
scatter pattern was collected. The volume distribution of the particle size was calculated using
modified MIE-scattering technique.
3.2.12 Statistical Analysis
All data was analyzed using SAS software version 9.2 (SAS Institute Inc., 2008). Means and
standard deviations of the data were presented. ANOVA and Tukey’s studentized range test were
carried out to determine differences among treatments at the significant level of P <0.05.

36
CHAPTER 4: RESULTS AND DISCUSSION
4.1 Proximate Composition of Egg Whites (EW)
The proximate composition of egg white can be seen in Table 4.1. The total liquid weight of
a large, grade AA egg was 50.6±0.23 g, of which 33.2±0.36 g were egg white and 16.5±0.30 g
represented the weight of egg yolk. The results are similar to those reported in AEB (1999).
Lipid content of egg white was 2.56 (g/100 g, dry basis). Mine (1995) reported that the total lipid
content in fresh egg white was almost negligible.
Table 4.1 Proximate analysis of egg white (EW)a
Egg white
Moisture (%) (wet basis) 87.25±0.05
Total lipids (g/100 g, dry basis) 2.56±0.31
Crude protein (g/100 g, dry basis) 88.28±0.32
Ash (g/100 g, dry basis) 5.36±0.06 a Values are means ± SD of triplicate determination.
4.2 FAMEs Composition of MO and SO
The FAMEs composition of MO and SO are presented in Table 4.2. MO contained
13.41±0.05% and 12.80±0.17% of EPA and DHA, respectively. Moreover, the total omega-3
fatty acids and polyunsaturated fatty acids in MO accounted for 32.38±0.44 and 34.94±0.43,
respectively. These results are similar to those reported by Wan et al., (2011) except for the total
omega-3 which was higher. EPA, DHA, total omega-3, and total polyunsaturated fatty acids in
SO accounted for 11.29±0.18 %, 11.06±0.09 %, 23.66±0.11% and 25.19±0.12%, respectively.
Similar results are reported by Wu & Bechtel (2008). MO and SO were good sources of omega-3
fatty acids, similar findings are reported by Yin & Sathivel (2010).
4.3 Moisture Content, FFA, PV and Color Values of MO and SO
The moisture content, FFA, and PV of MO and SO are presented in Table 4.3. According to
the FDA- Standard of identity (2006), MO and SO are considered generally recognized as safe

37
(GRAS) when they have FFA content below 0.1 percent. The FFA (%) of MO and SO were 0.15
and 0.18, respectively. Even though these values were higher than the maximum levels
established by the FDA; they were considered acceptable, since the initial determination of FFA
in MO and SO was needed to observe the effect of the microencapsulation processing on the
degree of hydrolysis of MO and SO; also, the resulting microencapsulated fish oil with egg white
powder was not intended for human consumption. The peroxide value of MO and SO were lower
than the maximum limit established by the FDA (5 milliequivalents per kg of oil) (FDA, 2006).
As in the case of FFA, the initial determination of PV in MO and SO was needed to observe the
effect of the microencapsulation processing on the oxidation of MO and SO. MO had a
yellowish color; meanwhile, SO had a slightly reddish color (Table 4.3).
Table 4.2 FAMEs profile of MO and SO (% of total integrated area)a
FAME MO SO
14:0 9.20±0.16 4.80±0.08
14:1n5 0.38±0.00 ND
15:0 0.92±0.02 ND
16:0 21.23±0.52 10.12±4.07
16:1n7 11.35±0.05 3.71±2.91
18:0 3.86±0.07 2.12±0.03
18:1n9c 6.11±0.07 12.16±0.11
18:1n5 3.03±0.02 2.72±0.02
18:2n6c 1.46±0.01 1.53±0.02
18:3n3 1.62±0.04 1.31±0.00
20:5n3 (EPA) 13.41±0.05 11.29±0.18
22:6n3 (DHA) 12.80±0.17 11.06±0.09
ω-3 total 32.38±0.44 23.66±0.11
ω-6 total 2.55±0.01 1.53±0.02
SAFA 51.88±4.04 17.04±4.00
MUFA 11.66±0.08 18.60±2.79
PUFA 34.94±0.43 25.19±0.12
ω-3/ω-6 12.70±0.22 15.50±0.16
P/S 0.68±0.06 1.54±0.42 a Values are means ± SD of triplicate determination. MO= purified menhaden oil, SO= salmon
oil. SAFA = total saturated fatty acids; MUFA= total monounsaturated fatty acids; PUFA= total
polyunsaturated fatty acids. ND = not detected.
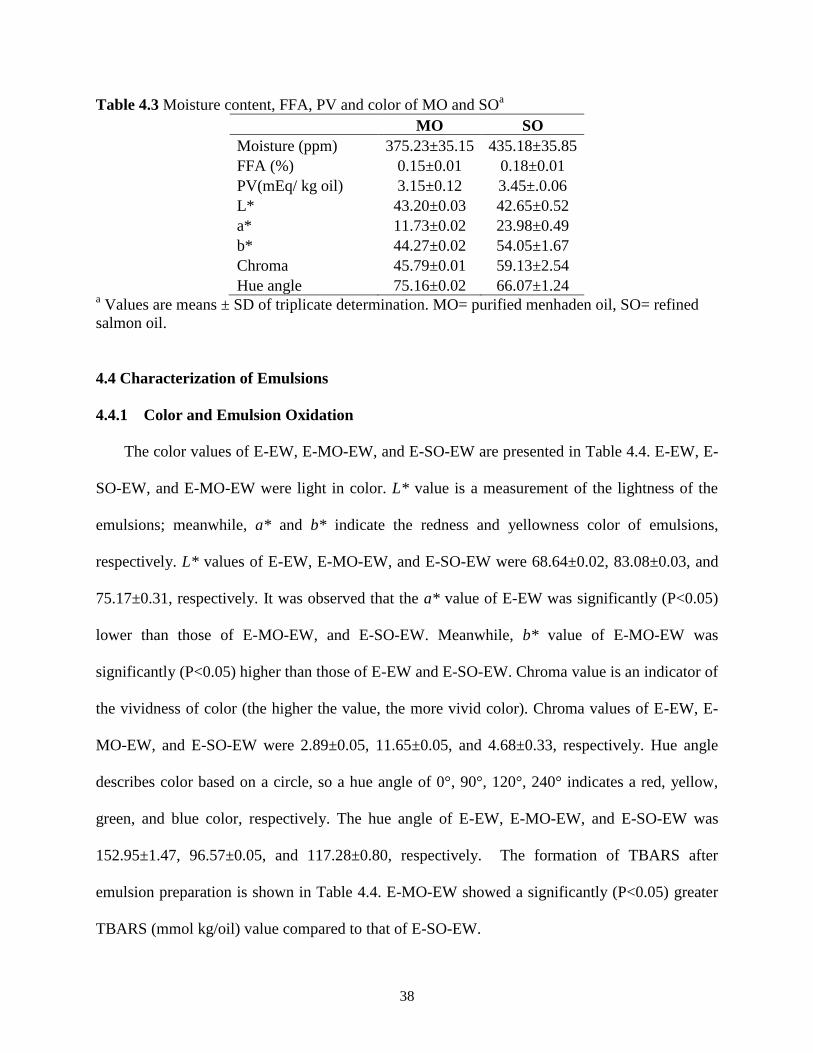
38
Table 4.3 Moisture content, FFA, PV and color of MO and SOa
MO SO
Moisture (ppm) 375.23±35.15 435.18±35.85
FFA (%) 0.15±0.01 0.18±0.01
PV(mEq/ kg oil) 3.15±0.12 3.45±.0.06
L* 43.20±0.03 42.65±0.52
a* 11.73±0.02 23.98±0.49
b* 44.27±0.02 54.05±1.67
Chroma 45.79±0.01 59.13±2.54
Hue angle 75.16±0.02 66.07±1.24 a Values are means ± SD of triplicate determination. MO= purified menhaden oil, SO= refined
salmon oil.
4.4 Characterization of Emulsions
4.4.1 Color and Emulsion Oxidation
The color values of E-EW, E-MO-EW, and E-SO-EW are presented in Table 4.4. E-EW, E-
SO-EW, and E-MO-EW were light in color. L* value is a measurement of the lightness of the
emulsions; meanwhile, a* and b* indicate the redness and yellowness color of emulsions,
respectively. L* values of E-EW, E-MO-EW, and E-SO-EW were 68.64±0.02, 83.08±0.03, and
75.17±0.31, respectively. It was observed that the a* value of E-EW was significantly (P<0.05)
lower than those of E-MO-EW, and E-SO-EW. Meanwhile, b* value of E-MO-EW was
significantly (P<0.05) higher than those of E-EW and E-SO-EW. Chroma value is an indicator of
the vividness of color (the higher the value, the more vivid color). Chroma values of E-EW, E-
MO-EW, and E-SO-EW were 2.89±0.05, 11.65±0.05, and 4.68±0.33, respectively. Hue angle
describes color based on a circle, so a hue angle of 0°, 90°, 120°, 240° indicates a red, yellow,
green, and blue color, respectively. The hue angle of E-EW, E-MO-EW, and E-SO-EW was
152.95±1.47, 96.57±0.05, and 117.28±0.80, respectively. The formation of TBARS after
emulsion preparation is shown in Table 4.4. E-MO-EW showed a significantly (P<0.05) greater
TBARS (mmol kg/oil) value compared to that of E-SO-EW.

39
Table 4.4 Color values and emulsion oxidation of E-EW, E-MO-EW, and E-SO-EW*
Parameter E-EW E-MO-EW E-SO-EW
L* 68.64±0.02c 83.08±0.03
a 75.17±0.31
b
a* -2.58±0.02c -1.33±0.02
a -2.14±0.09
b
b* 1.32±0.09c 11.57±0.05
a 4.16±0.33
b
Chroma 2.89±0.05c 11.65±0.05
a 4.68±0.33
b
Hue angle 152.95±1.47a 96.57±0.05
c 117.28±0.80
b
TBARS (mmol /kg oil) ND 0.04±0.00a 0.03±0.00
b
*Values are means and SD of triplicate determination.
abc means with different letters in each row
are significantly different (p< 0.05). E-EW = egg white mixture, E-MO-WE = emulsion
containing egg white and menhaden oil, E-SO-WE= emulsion containing egg white and salmon
oil. TBARS = Thiobarbituric acid-reactive substances. ND = not detected.
4.4.2 Flow Behavior and Viscoelastic Properties
The flow behavior index (n), consistency index (K), and apparent viscosity at 5, 15, and
25°C of E-EW, E-MO-EW, and E-SO-EW are shown in Table 4.5, 4.6, and 4.7. The n-values of
E-EW, and E-MO-EW, and E-SO-EW were significantly (P<0.05) higher at 25°C compared to
those at 5°C. Even more, the n-values of E-EW, E-MO-EW, and E-SO-EW were lower than 1.0
regardless of the temperature, which indicated that they behaved as pseudoplastic fluids (Paredes
et al.,1989). It has been reported that unmixed egg white behaves like a pseudoplastic and time-
dependent fluid. (Tung et al, 1970). According to Singh & Heldman (2001), a pseudoplastic fluid
may appear homogeneous to the naked eye; however, it may contain microscopic particles
submerged in it. Moreover, when these fluids are subjected to a shear, the randomly distributed
particles may orient themselves in the direction of flow and agglomerated particles may break up
into smaller particles; therefore, an increase in “fluidity” is observed. In this study, the
pseudoplastic fluid behavior of the emulsions may be due to the microscopic fish oil droplets.
The tiny oil droplets may align themselves in the direction of increasing shear, and therefore a
decreased of the emulsion viscosity is observed. The K-values of E-EW, E-MO-EW, and E-SO-
EW were significantly (P<0.05) lower at 25°C than those at 5°C. The apparent viscosities of E-
EW, E-MO-EW, and E-SO-EW at 5, 15, and 25°C are presented in Figures 4.1, 4.2, and 4.3. It
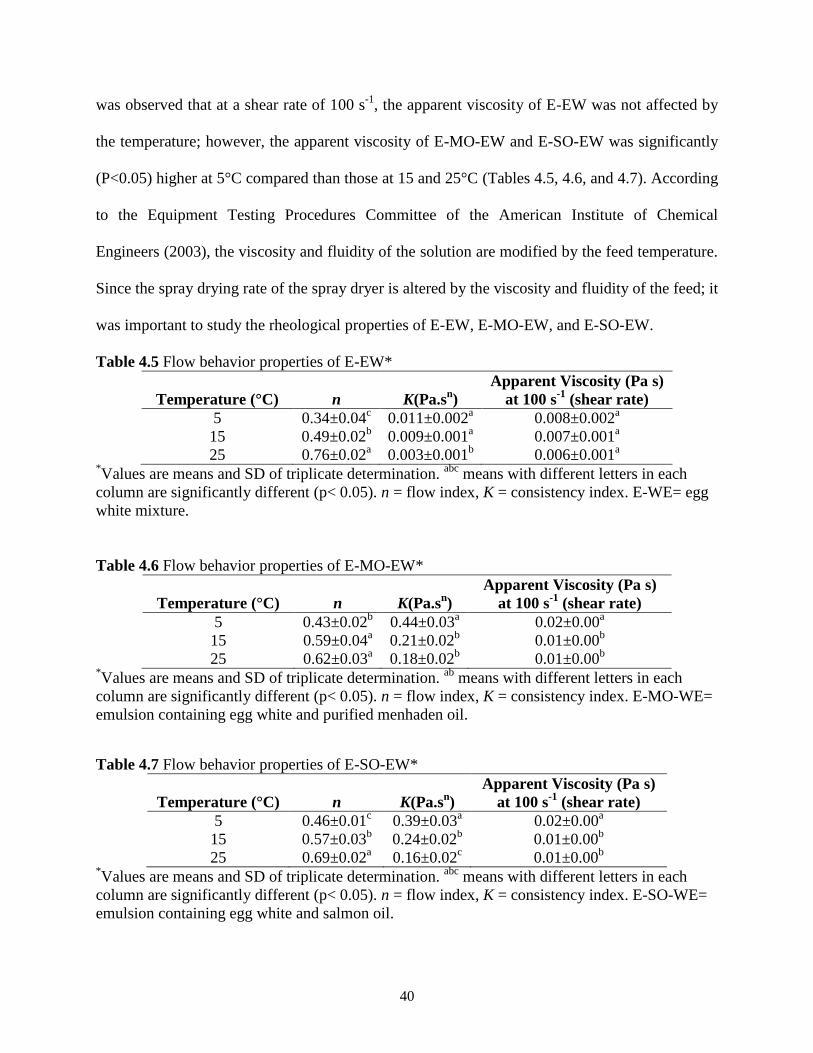
40
was observed that at a shear rate of 100 s-1
, the apparent viscosity of E-EW was not affected by
the temperature; however, the apparent viscosity of E-MO-EW and E-SO-EW was significantly
(P<0.05) higher at 5°C compared than those at 15 and 25°C (Tables 4.5, 4.6, and 4.7). According
to the Equipment Testing Procedures Committee of the American Institute of Chemical
Engineers (2003), the viscosity and fluidity of the solution are modified by the feed temperature.
Since the spray drying rate of the spray dryer is altered by the viscosity and fluidity of the feed; it
was important to study the rheological properties of E-EW, E-MO-EW, and E-SO-EW.
Table 4.5 Flow behavior properties of E-EW*
Temperature (°C) n K(Pa.sn)
Apparent Viscosity (Pa s)
at 100 s-1
(shear rate)
5 0.34±0.04c 0.011±0.002
a 0.008±0.002
a
15 0.49±0.02b 0.009±0.001
a 0.007±0.001
a
25 0.76±0.02a 0.003±0.001
b 0.006±0.001
a
*Values are means and SD of triplicate determination.
abc means with different letters in each
column are significantly different (p< 0.05). n = flow index, K = consistency index. E-WE= egg
white mixture.
Table 4.6 Flow behavior properties of E-MO-EW*
Temperature (°C) n K(Pa.sn)
Apparent Viscosity (Pa s)
at 100 s-1
(shear rate)
5 0.43±0.02b 0.44±0.03
a 0.02±0.00
a
15 0.59±0.04a 0.21±0.02
b 0.01±0.00
b
25 0.62±0.03a 0.18±0.02
b 0.01±0.00
b
*Values are means and SD of triplicate determination.
ab means with different letters in each
column are significantly different (p< 0.05). n = flow index, K = consistency index. E-MO-WE=
emulsion containing egg white and purified menhaden oil.
Table 4.7 Flow behavior properties of E-SO-EW*
Temperature (°C) n K(Pa.sn)
Apparent Viscosity (Pa s)
at 100 s-1
(shear rate)
5 0.46±0.01c 0.39±0.03
a 0.02±0.00
a
15 0.57±0.03b 0.24±0.02
b 0.01±0.00
b
25 0.69±0.02a 0.16±0.02
c 0.01±0.00
b
*Values are means and SD of triplicate determination.
abc means with different letters in each
column are significantly different (p< 0.05). n = flow index, K = consistency index. E-SO-WE=
emulsion containing egg white and salmon oil.

41
Figure 4.1 Apparent viscosity of E-EW as a function of shear rate.
E-EW= egg white mixture.
Figure 4.2 Apparent viscosity of E-MO-EW as a function of shear rate.
E-MO-EW = emulsion containing egg white and purified menhaden oil.
0
0.002
0.004
0.006
0.008
0.01
0.012
0.014
0.016
0.018
0 20 40 60 80 100
Sh
ear
vis
cosi
ty (
Pa s
)
Shear rate (1/s)
5°C
15°C
25°C
-0.005
0.005
0.015
0.025
0.035
0.045
0.055
0.065
0.075
0 20 40 60 80 100
Sh
ear
vis
cosi
ty (
Pa s
)
Shear rate (1/s)
5°C
15°C
25°C

42
Figure 4.3 Apparent viscosity of E-SO-EW as a function of shear rate.
E-SO-EW = emulsion containing egg white and refined salmon oil.
Dynamic rheological tests described viscoelastic properties of E-EW, E-MO-EW, and E-SO-
EW (Figures 4.4, 4.5, and 4.6). The G’ (an elastic or storage modulus) and G’’ (a viscous or loss
modulus) of the emulsions were determined as a function of frequency (ω) at a fixed temperature
of 25°C. According to Rao (1999), G’ is a measure of energy recovered per cycle of sinusoidal
shear deformation and G’’ is an estimate of energy dissipated as heat per cycle. E-EW, E-MO-
EW, and E-SO-EW showed a gradual increase in both G’ and G’’ with increasing frequency. G’
was always higher than G’’ in all the cases. These results indicated that E-EW, E-MO-EW, and
E-SO-EW behaved like a viscoelastic material because they presented a higher G’ than G’’; this
also indicated that the emulsions (E-MO-EW, and E-SO-EW) were stable. Moschakis et al.,
(2005) reported that an emulsion with viscoelastic characteristics would retard the
rearrangement of macroscopic phase separation. Spray drying of stable E-MO-EW, and E-SO-
EW emulsions may result in high microencapsulation efficiency. Ovalbumin, ovotransferrin, and
ovomucoid are the main proteins found in egg white (Powrie & Nakai, 1985).
0
0.01
0.02
0.03
0.04
0.05
0.06
0.07
0.08
0 20 40 60 80 100
Sh
ear
vis
cosi
ty (
Pa s
)
Shear rate (1/s)
5°C
15°C
25°C

43
Figure 4.4 Viscoelastic properties of E-EW.
E-EW = egg white mixture; G’=storage modulus; G’’=loss modulus.
Figure 4.5 Viscoelastic properties of E-MO-EW
E-MO-EW = emulsion containing egg white and purified menhaden oil; G’=storage modulus;
G’’=loss modulus.
0.01
0.1
1
0.1 1 10 100
G'
G''
(P
a)
Frequency (rad/s)
G'
G''
0.1
1
10
0.1 1 10 100
G'
G''
(P
a)
Frequency (rad/s)
G'
G''

44
Figure 4.6 Viscoelastic properties of E-SO-EW.
E-SO-EW = emulsion containing egg white and refined salmon oil; G’=storage modulus;
G’’=loss modulus.
It is reported that in an oil-in water (o/w) emulsion system made with corn oil, egg white and
water; ovalbumin was key egg white protein responsible for the emulsion stability (Drakos &
Kiosseoglou, 2006). The ovalbumin molecule has four cysteine residues and one disulfide
bridge. After adsorption to air-water interfaces, ovalbumin molecules unfold and rearrange; this
exposes hydrophobic and sulfur amino acids. Strong droplet aggregate formation may be the
result of hydrophobic interactions between the oil droplets and the unfolded protein molecules;
which will interact through hydrophobic and sulfide bonds (Doi & Kitabatake, 1997).
4.5 Spray Drying of E-EW, E-MO-EW, and E-SO-EW
The estimated production rates for egg white powders containing fish oils ranged from 0.056
to 0.062 (kg dry solids/h) and the actual production rates ranged from 0.056 to 0.060 kg dry
solids/h (Table 4.8). It was observed that the actual production rates were lower than the
estimated production rates. This may be the result of the retention of the powder particles in
dryer chamber wall, pipes, joints and cyclone separator walls.
0.1
1
10
0.1 1 10 100
G'
G''
(P
a)
Frequency (rad/s)
G'
G''
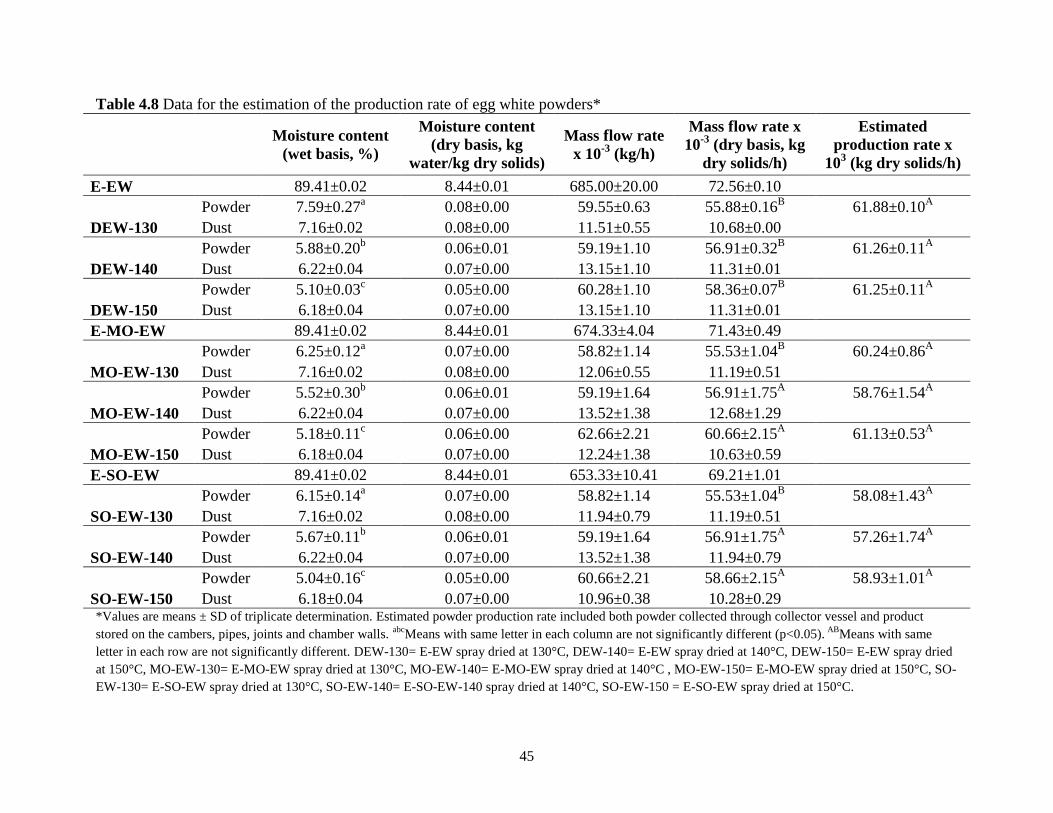
45
Table 4.8 Data for the estimation of the production rate of egg white powders*
Moisture content
(wet basis, %)
Moisture content
(dry basis, kg
water/kg dry solids)
Mass flow rate
x 10-3
(kg/h)
Mass flow rate x
10-3
(dry basis, kg
dry solids/h)
Estimated
production rate x
103 (kg dry solids/h)
E-EW
89.41±0.02 8.44±0.01 685.00±20.00 72.56±0.10
DEW-130
Powder 7.59±0.27a 0.08±0.00 59.55±0.63 55.88±0.16
B 61.88±0.10
A
Dust 7.16±0.02 0.08±0.00 11.51±0.55 10.68±0.00
DEW-140
Powder 5.88±0.20b 0.06±0.01 59.19±1.10 56.91±0.32
B 61.26±0.11
A
Dust 6.22±0.04 0.07±0.00 13.15±1.10 11.31±0.01
DEW-150
Powder 5.10±0.03c 0.05±0.00 60.28±1.10 58.36±0.07
B 61.25±0.11
A
Dust 6.18±0.04 0.07±0.00 13.15±1.10 11.31±0.01
E-MO-EW
89.41±0.02 8.44±0.01 674.33±4.04 71.43±0.49
MO-EW-130
Powder 6.25±0.12a 0.07±0.00 58.82±1.14 55.53±1.04
B 60.24±0.86
A
Dust 7.16±0.02 0.08±0.00 12.06±0.55 11.19±0.51
MO-EW-140
Powder 5.52±0.30b 0.06±0.01 59.19±1.64 56.91±1.75
A 58.76±1.54
A
Dust 6.22±0.04 0.07±0.00 13.52±1.38 12.68±1.29
MO-EW-150
Powder 5.18±0.11c 0.06±0.00 62.66±2.21 60.66±2.15
A 61.13±0.53
A
Dust 6.18±0.04 0.07±0.00 12.24±1.38 10.63±0.59
E-SO-EW
89.41±0.02 8.44±0.01 653.33±10.41 69.21±1.01
SO-EW-130
Powder 6.15±0.14a 0.07±0.00 58.82±1.14 55.53±1.04
B 58.08±1.43
A
Dust 7.16±0.02 0.08±0.00 11.94±0.79 11.19±0.51
SO-EW-140
Powder 5.67±0.11b 0.06±0.01 59.19±1.64 56.91±1.75
A 57.26±1.74
A
Dust 6.22±0.04 0.07±0.00 13.52±1.38 11.94±0.79
SO-EW-150
Powder 5.04±0.16c 0.05±0.00 60.66±2.21 58.66±2.15
A 58.93±1.01
A
Dust 6.18±0.04 0.07±0.00 10.96±0.38 10.28±0.29
*Values are means ± SD of triplicate determination. Estimated powder production rate included both powder collected through collector vessel and product
stored on the cambers, pipes, joints and chamber walls. abc
Means with same letter in each column are not significantly different (p<0.05). AB
Means with same
letter in each row are not significantly different. DEW-130= E-EW spray dried at 130°C, DEW-140= E-EW spray dried at 140°C, DEW-150= E-EW spray dried
at 150°C, MO-EW-130= E-MO-EW spray dried at 130°C, MO-EW-140= E-MO-EW spray dried at 140°C , MO-EW-150= E-MO-EW spray dried at 150°C, SO-
EW-130= E-SO-EW spray dried at 130°C, SO-EW-140= E-SO-EW-140 spray dried at 140°C, SO-EW-150 = E-SO-EW spray dried at 150°C.
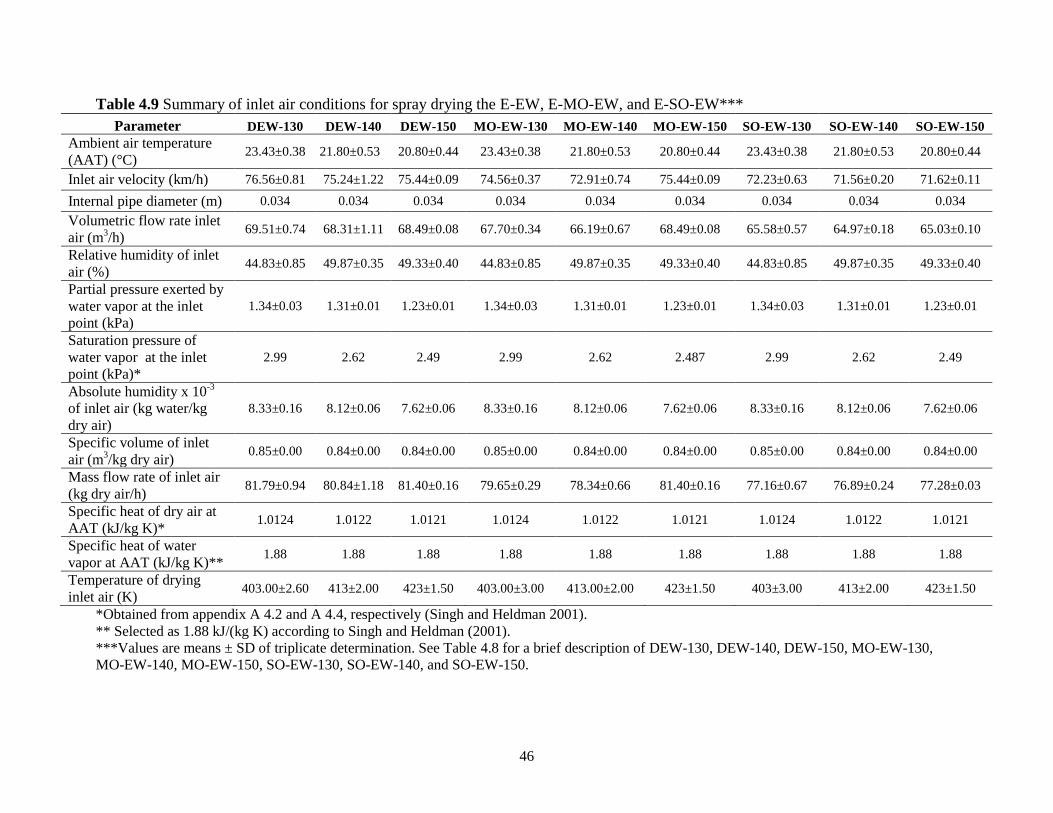
46
Table 4.9 Summary of inlet air conditions for spray drying the E-EW, E-MO-EW, and E-SO-EW***
Parameter DEW-130 DEW-140 DEW-150 MO-EW-130 MO-EW-140 MO-EW-150 SO-EW-130 SO-EW-140 SO-EW-150
Ambient air temperature
(AAT) (°C) 23.43±0.38 21.80±0.53 20.80±0.44 23.43±0.38 21.80±0.53 20.80±0.44 23.43±0.38 21.80±0.53 20.80±0.44
Inlet air velocity (km/h) 76.56±0.81 75.24±1.22 75.44±0.09 74.56±0.37 72.91±0.74 75.44±0.09 72.23±0.63 71.56±0.20 71.62±0.11
Internal pipe diameter (m) 0.034 0.034 0.034 0.034 0.034 0.034 0.034 0.034 0.034
Volumetric flow rate inlet
air (m3/h)
69.51±0.74 68.31±1.11 68.49±0.08 67.70±0.34 66.19±0.67 68.49±0.08 65.58±0.57 64.97±0.18 65.03±0.10
Relative humidity of inlet
air (%) 44.83±0.85 49.87±0.35 49.33±0.40 44.83±0.85 49.87±0.35 49.33±0.40 44.83±0.85 49.87±0.35 49.33±0.40
Partial pressure exerted by
water vapor at the inlet
point (kPa)
1.34±0.03 1.31±0.01 1.23±0.01 1.34±0.03 1.31±0.01 1.23±0.01 1.34±0.03 1.31±0.01 1.23±0.01
Saturation pressure of
water vapor at the inlet
point (kPa)*
2.99 2.62 2.49 2.99 2.62 2.487 2.99 2.62 2.49
Absolute humidity x 10-3
of inlet air (kg water/kg
dry air)
8.33±0.16 8.12±0.06 7.62±0.06 8.33±0.16 8.12±0.06 7.62±0.06 8.33±0.16 8.12±0.06 7.62±0.06
Specific volume of inlet
air (m3/kg dry air)
0.85±0.00 0.84±0.00 0.84±0.00 0.85±0.00 0.84±0.00 0.84±0.00 0.85±0.00 0.84±0.00 0.84±0.00
Mass flow rate of inlet air
(kg dry air/h) 81.79±0.94 80.84±1.18 81.40±0.16 79.65±0.29 78.34±0.66 81.40±0.16 77.16±0.67 76.89±0.24 77.28±0.03
Specific heat of dry air at
AAT (kJ/kg K)* 1.0124 1.0122 1.0121 1.0124 1.0122 1.0121 1.0124 1.0122 1.0121
Specific heat of water
vapor at AAT (kJ/kg K)** 1.88 1.88 1.88 1.88 1.88 1.88 1.88 1.88 1.88
Temperature of drying
inlet air (K) 403.00±2.60 413±2.00 423±1.50 403.00±3.00 413.00±2.00 423±1.50 403±3.00 413±2.00 423±1.50
*Obtained from appendix A 4.2 and A 4.4, respectively (Singh and Heldman 2001).
** Selected as 1.88 kJ/(kg K) according to Singh and Heldman (2001).
***Values are means ± SD of triplicate determination. See Table 4.8 for a brief description of DEW-130, DEW-140, DEW-150, MO-EW-130,
MO-EW-140, MO-EW-150, SO-EW-130, SO-EW-140, and SO-EW-150.

47
Table 4.10 Summary of outlet air conditions for spray drying the E-EW, E-MO-EW, and E-SO-EWa
Parameter DEW-130 DEW-140 DEW-150 MO-EW-130 MO-EW-140 MO-EW-150 SO-EW-130 SO-EW-140 SO-EW-150
Outlet air temperature
(°C) 62.60±0.70 63.5±0.51 67.1±0.55 62.60±0.70 63.50±0.51 67.10±0.55 62.6±0.70 63.50±0.51 67.10±0.55
Outlet air velocity (km/h) 19.50±0.36 19.2±0.06 19.7±0.05 19.1±0.06 18.9±0.05 19.7±0.05 18.50±0.14 18.40±0.04 18.9±0.05
Internal pipe diameter (m) 0.072 0.072 0.072 0.072 0.072 0.072 0.072 0.072 0.072
Volumetric flow rate of
outlet air (m3/h)
79.57±1.45 78.25±0.23 80.01±0.20 77.73±0.23 76.95±0.20 80.01±0.20 75.51±0.55 74.87±0.15 76.75±0.20
Relative humidity of
outlet air (%) 11.0±0.06 10.60±0.15 8.7±0.03 11.1±0.06 10.60±0.15 8.7±0.03 11.1±0.06 10.7±0.03 8.7±0.03
Partial pressure exerted by
water vapor (kPa) 2.49±0.01 2.50±0.04 2.41±0.01 2.50±0.01 2.50±0.04 2.41±0.01 2.50±0.01 2.51±0.01 2.40±0.01
Saturation pressure of
water vapor (kPa)* 22.59 23.5 27.62 22.56 23.5 27.62 22.59 23.503 27.62
Absolute humidity x 10-3
(kg water/kg dry air) 15.69±0.08 15.73±0.23 15.14±0.05 15.73±0.08 15.73±0.23 15.14±0.05 15.73±0.08 15.81±0.04 15.08±0.05
Specific volume of outlet
air (m3/kg dry air)
0.97±0.00 0.98±0.00 0.99±0.00 0.97±0.00 0.98±0.00 0.99±0.00 0.97±0.00 0.98±0.00 0.99±0.00
Mass flow rate of outlet
air (kg dry air/h) 81.75±1.63 80.16±0.36 81.17±0.33 79.84±0.33 78.83±0.15 81.17±0.33 77.57±0.42 76.69±0.27 77.87±0.31
a Values are means ± SD of triplicate determination.
*Obtained from appendix A 4.2 and A 4.4, respectively (Singh and Heldman 2001).
See Table 4.8 for a brief description of DEW-130, DEW-140, DEW-150, MO-EW-130, MO-EW-140, MO-EW-150, SO-EW-130,
SO-EW-140, and SO-EW-150.

48
The moisture content of the resulting powders was affected by the air inlet temperature;
emulsions spray dried at a 150°C inlet air temperature produced powders with significantly
(P<0.05) lower moisture content compared to those powders produced at a 130 and 140°C inlet
air temperature. A number factors including inlet and outlet temperatures of the air (Masters,
1991), evaporation rate (Goula & Adamopoulos, 2005), and droplet size (Obón et al., 2009) may
influence the moisture content of spray dried food powders. The summary of the inlet and outlet
air conditions for spray drying E-EW, E-MO-EW, and E-SO-EW are presented in Tables 4.9 and
4.10.
The estimated evaporation rate based on moisture uptake by the dry air was the same as the
evaporation rate estimated based on the moisture content of the powders and dust for each
individual emulsion at each of the drying (inlet) temperatures (Table 4.11). According to Goula
& Adamopoulos (2005), the evaporation rate is affected by the inlet temperature and the dryness
of the air; however, in this study the average evaporation rate was not significantly affected by
the inlet air temperature. It is reported that the evaporation of water during spray drying occurs in
two stages. Because most of the water is removed from the emulsion droplets in the first stage; it
shows a higher evaporation rate than that of the second moisture evaporation stage (Keey &
Pham, 1976). In this study, the methods used to estimate the evaporation rate was an average of
both stages, therefore, an average evaporation rate was calculated and differences were not
observed. The experimentally determined dry air mass flow rate of the inlet air and outlet air
were similar; this indicated that the technique, instrumentation and measurements used to
calculate air flow rates were accurate.
The energy used to heat the air in the spray drier for E-EW, E-MO-EW, and E-SO-EW was
significantly (P<0.05) higher at 150 °C (Table 4.11). The required power (kJ) to spray dry an

49
amount (kg) of emulsion is the energy required (kJ/kg) to heat the air to spray dry the same
amount of emulsion (kg) in a given time (s). The required power was determined as 1.70, 1.87,
and 2.05 kW for spray drying E-EW at 130, 140, and 150°C, respectively. Furthermore, the
required power for spray drying E-MO-EW at 130, 140, and 150°C was estimated as 1.63, 1.78,
and 2.02 kW, respectively. Meanwhile, the required power for spray drying E-SO-EW at 130,
140, and 150°C of inlet ambient was calculated as 1.54, 1.70, and 1.87 kW, respectively. The
heat energy for heating the ambient air was generated by an electric heater. The power
requirements in this study were well within the available power of the electric heater (4.5 kW) of
the FT80/81 Tall Form spray dryer (Spray dryer manual, Armfield, Ringwood, UK).
Table 4.11 Estimated evaporation rates and energy used to spray dry E-EW, E-MO-EW, and E-
SO-EW*
Inlet
temp.
(°C)
E-EW E-MO-EW E-SO-EW
Evaporation rate (kg
water/h)1
130 0.601±0.040 aA
0.593±0.015 aA
0.578±0.008 aA
140 0.604±0.018 aA
0.603±0.021 aA
0.587±0.004 aA
150 0.608±0.004 aA
0.608±0.004 aA
0.585±0.012 aB
Evaporation rate (kg
water/h)2
130 0.608±0.00 bA
0.598±0.00 aA
0.580±0.009 aB
140 0.609±0.00 aA
0.600±0.003 aA
0.581±0.010 aB
150 0.610±0.00 aA
0.600±0.004 aA
0.581±0.009 aB
Energy required to
heat the air in the
spray drier (kJ/kg)
130 8958.75±103.36cA
8724.64±31.86 cB
8451.64±73.02 cC
140 9818.38±143.38bA
9513.95±79.89 bB
9338.32±28.89 bB
150 10794.24±20.56aA
10794.24±20.56 aA
10248.13±4.22 aB
*Values are means ± SD of triplicate determination.
1Calculated based on the moisture uptake by
the dry air (kg water/h). 2Calculated based on the moisture content of the E-EW/E-MO-EW/E-
SO-EW emulsions, powder collected through collector vessel, and dust (kg water/h). abc
Means
with same letter in each column are not significant different (p<0.05). ABC
Means with same
letter in each row are not significant different (p<0.05). See Table 4.4 for brief description of E-
EW, E-MO-EW and E-SO-EW.
4.6 Microencapsulation Efficiency (ME) and Color Values of Egg White Powders
The results of surface oil (OS) are presented in Table 4.12. The OS of the microencapsulated
powders was around 0.89 (g/g powder) regardless of the inlet air temperature.

50
Table 4.12 Color of and ME of DEW, MO-EW, and SO-EW*
Inlet Temp (°C) DEW MO-EW SO-EW
OS (g/g powder)
130 - 0.089±0.001aA
0.089±0.002aA
140 - 0.089±0.001aA
0.089±0.001aA
150 - 0.089±0.002aA
0.089±0.002aA
OT (g/g powder)
130 - 0.32±0.001aA
0.32±0.003aA
140 - 0.32±0.002aA
0.32±0.002aA
150 - 0.32±0.001aA
0.32±0.002aA
Microencapsulation
Efficiency (ME) (%)
130 - 72.26±1.57aA
72.03±1.59aA
140 - 72.32±1.56aA
72.62±1.36aA
150 - 72.96±1.43aA
72.80±1.33aA
L*
130 92.61±0.02bB
94.24±0.02aA
90.71±0.01bC
140 91.86±0.01cA
89.39±0.01cB
85.32±0.00cC
150 92.54±0.01aA
93.16±0.02bB
90.92±0.01aC
a*
130 -0.69±0.00bC
-0.20±0.01aB
2.09±0.01aA
140 -1.00±0.01cB
-1.07±0.02cC
-0.77±0.01cB
150 -0.43±0.01aB
-0.88±0.03bC
1.14±0.02bA
b*
130 10.42±0.03cC
12.38±0.03bB
16.10±0.03aA
140 15.25±0.03aA
11.88±0.03cC
13.42±0.01bB
150 12.19±0.03bC
14.74±0.05aA
12.42±0.03cB
Chroma
130 10.44±0.03cC
12.38±0.03bB
16.24±0.02aA
140 15.28±0.03aA
11.93±0.03cC
13.44±0.01bB
150 12.20±0.03bC
14.76±0.05aA
12.48±0.03cB
Hue
130 93.81±0.02aA
90.94±0.07cB
82.61±0.05cC
140 93.75±0.03aB
95.16±0.06aA
93.30±0.02aC
150 92.02±0.04bB
93.40±0.11bA
84.77±0.08bC
*Values are means ± SD of triplicate determination. abc
means with different letters in each
column are significantly different (p< 0.05).ABC
means with different letters in each row are
significantly different (p< 0.05). DEW= egg white powder, MO-EW=egg white powder
containing purified menhaden oil, SO-EW= egg white powder containing refined salmon oil.
OS= surface oil content; OT= total oil content; - = not quantified.
Surface oil, also known as non-encapsulated oil, is usually prone to oxidation and
developing off-flavors that may affect the acceptability of the product (Drusch & Berg, 2008).
The results for microencapsulation efficiency (ME) are detailed in Table 4.12. It was observed
that the ME of MO-EW, and SO-EW powders was the same regardless of the inlet air
temperature. Microencapsulated efficiency is a relationship between the encapsulated oil and the
total lipid content of the food powder. Microencapsulated efficiency was 72.26, 72.32, and 72.96

51
for MO-EW powders obtained at 130, 140, and 150°C of inlet air temperature; meanwhile, the
ME (%) of SO-EW powders spray dried at 130, 140, and 150°C of inlet air temperature was
72.03, 72.62, and 72.80, respectively. Color values of DEW, MO-EW, and SO-EW powders are
shown in Table 4.12. All the powders were whitish in color. MO-EW and SO-EW presented
slightly higher values of yellowness that that of DEW powders, this might be the result to the
presence of MO and SO.
4.7 FAMEs Composition and Lipid Oxidation of Egg White Powders
The FAMEs composition of MO-EW and SO-EW powders are presented in Table 4.13. The
FAMEs composition was not determined in DEW powders because they contained significantly
(P<0.05) lower total lipids than MO-EW, and SO-EW powders.
The EPA, DHA, total omega-3, and polyunsaturated fatty acids content in MO-EW and SO-
EW were similar to MO and SO values (Table 4.13). Hence, the spray drying procedure did not
have any effect on the FAMEs composition of MO and SO. Degradation of fatty acids has been
related to fatty acid oxidation and acidification (Pereda et al., 2008).
The formation of FFA and TBARS content after the spray drying procedure in DEW, MO-
EW, and SO-EW are shown in Table 4.14. The spray drying procedure increased the FFA (%)
content in MO-EW and SO-EW regardless of the inlet air temperature. Additionally, the TBARS
values in MO-EW and SO-EW powders were higher than those values of the emulsions (Table
4.4); this may be the result of the of production of secondary lipid oxidation compounds that
arise from the decomposition of fatty acid hydroperoxides during processing (Damodaran et al.,
2008). Moreover, the formation of TBARS was significantly (P<0.05) lower at 130°C compared
to those of 140 and 150°C of inlet air temperature. Baik et al., (2004), Boon et al., (2008) and
Klinkesorn et al., (2005) have reported that with increasing time and temperature, the formation
of TBA in microencapsulated oil powders is also increased.

52
Table 4.13 FAMEs composition of MO-EW and SO-EW powders (% of total integrated area)*
FAME
MO-EW SO-EW
Inlet temperature (°C) Inlet temperature (°C)
130 140 150 130 140 150
14:0 9.15±0.16 9.08±0.18 9.12±0.20 4.78±0.08 4.85±0.09 4.76±0.10
16:0 21.23±0.50 21.24±0.0.32 21.24±0.40 10.12±4.07 10.01±2.03 9.98±1.65
16:1n7 11.38±0.05 11.21±0.06 11.39±0.07 3.71±2.91 3.65±0.87 3.60±0.67
18:0 3.86±0.09 3.82±0.09 3.88±0.07 2.09±0.01 2.14±0.01 2.11±0.02
18:1n9c 6.11±0.04 6.07±0.09 6.08±0.06 12.18±0.11 12.17±0.09 12.18±0.10
18:1n5 3.03±0.02 3.08±0.04 3.05±0.05 2.70±0.02 2.74±0.01 2.71±0.05
18:2n6c 1.48±0.01 1.42±0.02 1.49±0.03 1.50±0.02 1.51±0.01 1.48±0.03
18:3n3 1.62±0.04 1.72±0.05 1.66±0.05 1.26±0.01 1.29±0.02 1.23±0.01
20:5n3 (EPA) 13.41±0.05 13.44±0.07 13.45±0.09 11.29±0.18 11.27±0.20 11.28±0.21
22:6n3 (DHA) 12.87±0.17 12.78±0.12 12.85±0.15 11.07±0.09 11.14±0.10 11.09±0.10
ω-3 total 32.35±0.40 32.40±0.42 32.42±0.35 23.38±0.26 23.28±0.29 23.14±0.35
ω-6 total 2.55±0.01 2.56±0.02 2.59±0.02 1.58±0.08 1.62±0.09 1.52±0.10
SAFA 50.20±0.77 51.34±0.61 50.76±0.96 32.79±3.02 33.05±2.65 33.15±2.85
MUFA 12.02±0.07 12.85±0.12 12.02±0.13 11.13±2.69 10.96±2.70 10.98±2.82
PUFA 34.94±0.43 35.02±0.48 35.12±0.51 51.04±0.18 50.98±0.22 50.94±0.24
ω-3 / ω-6 12.70±0.22 12.66±0.23 12.59±0.21 3.34±0.03 3.34±0.05 3.35±0.05
P/S 0.67±0.03 0.67±0.04 0.65±0.03 1.54±0.12 1.54±0.10 1.54±0.13
*Values are means ± SD of triplicate determination. See Table 3.8 for a brief description of MO-
EW-130, MO-EW-140, MO-EW-150, SO-EW-130, SO-EW-140, and SO-EW-150. FAMEs
compositions of DEW powders were not determined.
Table 4.14 FFA and TBARS of MO-EW, and SO-EW powders*
FFA (%) TBARS (mmol/kg oil)
MO-EW-130 0.30±0.03a 0.12±0.00
b
MO-EW-140 0.27±0.04a 0.14±0.00
a
MO-EW-150 0.29±0.04a 0.14±0.00
a
SO-EW-130 0.35±0.05a 0.11±0.00
b
SO-EW-140 0.38±0.06a 0.12±0.00
a
SO-EW-150 0.39±0.06a 0.12±0.00
a
*Values are means ± SD of triplicate determination. ab
means with different letters in each
column are significantly different (p< 0.05).
4.8 Crude Protein, Total Lipids, Ash and Water Activity (aw) of DEW, MO-EW, and SO-
EW Powders
Crude protein, total lipids, ash, and aw of egg white powders are presented Table 4.15. MO-
EW and SO-EW powders had lower crude protein content than the control (DEW). The

53
recommend daily allowance (RDA) for protein in the USA is 0.8 to 0.9 g/kg body weight/day
(National Research Council, 1989). Athletes performing dynamic exercise requires from 1.2 to
1.8 g protein/kg body weight/day (Lemon, 1991a). Meanwhile, athletes performing resistance
exercise may require from 1.5 to 2.5 g protein/kg body weight/day (Lemon, 1991b). According
to Brounds (1993), athletes may require some protein supplementation to complete their protein
requirements per day to retain normal nitrogen balance and to decrease impairment in training
status. Milk protein, milk protein hydrolysates, whey protein and caseinates have been used for
athletes as protein supplementation due to their low fat, and cholesterol free content. A 50 g of
MO-EW of SO-EW powders contained more than 30 g of protein which could be used for
athletes as alternative protein supplementation.
MO-EW and SO-EW powders had greater total lipid content than that of DEW powders.
This result was expected since the experimental MO-EW and SO-EW were formulated to have
around 30% total lipid content. Moreover, the inlet temperature did not affect the total lipid
content in DEW, MO-EW, and SO-EW powders. It has been reported that polyunsaturated fatty
acids has an influence on the structure of the membranes of red blood cells. Dietary omega-3
PUFA increases red blood cell plasticity, maximal oxygen consumption and better blood oxygen
levels in subjects exercising at altitude (Guezennec et al.,1991).
Ash content in DEW powders was significantly (P<0.05) greater than those of MO-EW and
SO-EW powders. The USDA reported proximate composition of dried egg white as 86.01, 0.00,
and 5.6 g/100 g, dry basis of protein, total lipid, and ash content, respectively (USDA, 2009b).
Water activity (aw) measures the available free water in food that is necessary for
biochemical reactions to proceed and is an important index to determine food stability, safety,
microbial growth, and other properties (Damodaran et al., 2008). The powder produced at the

54
inlet temperature of 130oC had significantly (P<0.05) higher water activity than those produced
at 140 or 150oC (Table 4.15). Normally food is considered microbiologically stable if the water
activity is less than 0.6 (Quek et al., 2007), and no microbial proliferation is reported at aw below
0.5 (Beuchat, L.R., 1981). In this study all egg white powders showed a aw below 0.4; hence,
they were microbiologically stable.
Table 4.15 Crude protein, total lipids, ash content and aw of DEW, MO-EW, and SO-EW*
Inlet Temp
(°C) DEW MO-EW SO-EW
Crude protein (g/100
g, dry basis)
130 88.30±2.35aA
64.73±1.85aB
65.10±1.63aB
140 88.08±1.89aA
64.75±1.68aB
64.54±1.59aB
150 88.80±2.07aA
64.70±1.53aB
63.90±1.45aB
Total lipids (g/100 g,
dry basis)
130 2.06±0.05 aB
32.27±0.13 aA
32.06±0.35aA
140 2.11±0.04 aB
32.09±0.17 aA
32.48±0.24aA
150 2.15±0.04 aB
32.33±0.09 aA
32.48±0.22aA
Ash (g/100 g, dry
basis)
130 6.21±0.04 aA
5.58±0.09 abB
5.54±0.05 aB
140 5.92±0.09 bA
5.67±0.05 aB
5.43±0.01 aC
150 6.03±0.18a bA
5.39±0.16 bB
5.58±0.20 aAB
Water activity (aw)
130 0.350±0.003 aA
0.270±0.002 aB
0.269±0.001 aB
140 0.302±0.007 bA
0.271±0.002 aB
0.212±0.002 bC
150 0.207±0.002 cB
0.259±0.003 bA
0.210±0.002 bB
*Values are means ± SD of triplicate determination. abc
means with different letters in each
column are significantly different (p< 0.05).ABC
means with different letters in each row are
significantly different (p< 0.05). DEW= egg white powder, MO-EW=egg white powder
containing purified menhaden oil, SO-EW= egg white powder containing refined salmon oil.
4.9 Amino Acid and Mineral Content of DEW, MO-EW, and SO-EW
DEW, MO-EW, and SO-EW contained all the essential amino acids (EAA) including
Leucine (Table 4.16). Total essential amino acids (TEAA) content (mg/g protein) of DEW
powders was similar than those of MO-EW and SO-EW powders. Furthermore, it was observed
that the inlet air temperature did not have any effect in the amino acid profile of DEW, MO-EW,
and SO-EW powders. Even though, cysteine and tryptophan were not quantified in this study due

55
to economical issues, AEB (1999) have reported that egg white has a cysteine and tryptophan
content (mg/g protein) of 25.90 and 12.24, respectively.
According to Damodaran et al., (2008), denaturation is a phenomenon wherein a well-
defined initial state of protein formed under physiological conditions is transformed into an ill-
defined final state under nonphysiological conditions by a denaturing agent such heat; however,
it doesn’t involve any chemical changes in the protein structure. Even though, egg white proteins
may have undergone denaturation by heat, their amino acid profiles remain the same.
Leucine was the main EAA found in DEW, MO-EW, and SO-EW powders followed by
valine and phenylalanine. According to Tarnopolsky (2004) human skeletal muscle can oxidize
at least eight amino acids (alanine, asparagine, aspartate, glutamate, isoleucine, leucine, lysine
and valine); nevertheless, during exercise, the branched-chain amino acids (BCAA; isoleucine,
leucine, and valine) are preferentially oxidized. It has been reported that an increase in lysine
oxidation occurs during endurance exercise at high intensities (Wagenmakers et al., 1991), and
muscle recovery from exercise has been associated with dietary leucine (Layman & Rodriguez,
2009). DEW, MO-EW, and SO-EW powders would be expected to improve athletes’
performances due to their amino acid content. Potassium, magnesium and phosphorus were the
main minerals found in DEW, MO-EW, and SO-EW powders (Table 4.17). DEW powders
contained greater amounts of phosphorus, potassium, calcium, and magnesium than those of
MO-EW and SO-EW powders. These results can also be associated to the dilution effect
observed in the TEAA due to the addition of MO or SO. In addition, all of the egg white
powders were a good source of copper, which is an essential trace element needed in energy
metabolism, tissue synthesis and protection against free radicals (Brounds, 1993).

56
Potassium is an important element needed for the transmission of nerve impulses, muscle
cell contraction, and maintenance of normal blood pressure. During exercise, potassium is lost
from the muscle cell in the urine and in sweat because of the damage of the muscle cells during
mechanical stress; therefore, an additional potassium intake is needed for individuals under high
intensity exercise (Brounds, 1993). Magnesium in a mineral required for biosynthetic processes,
energy metabolism, and in neuromuscular transmission and activity. Low magnesium disposal
causes impaired energy metabolism, greater fatigue and the occurrence of muscle cramps
(Clarkson, 1991). It is reported that phosphorus and calcium are essential elements for bone
formation. Calcium plays a key role at the beginning of muscle contraction; while phosphorus is
an important element in enzymes as well as in energy metabolism (Brounds, 1993).
Table 4.16 Amino-acid composition of DEW, MO-EW, and SO-EW*
Amino acid
(mg/g protein)
DEW MO-EW SO-EW
Inlet Temp. (°C) Inlet Temp. (°C) Inlet Temp. (°C)
130 140 150 130 140 150 130 140 150
Aspartic acid 104.83 105.33 103.61 104.67 105.12 105.79 105.86 106.46 104.21
Threoninea 47.57 47.16 47.79 47.00 47.03 46.97 45.98 47.04 46.43
Serine 72.97 71.56 73.20 73.09 71.42 72.60 71.42 72.11 72.24
Glutamic acid 108.25 111.25 103.07 111.22 108.82 109.39 114.01 109.69 108.56
Proline 37.09 36.84 36.94 35.92 34.93 34.81 35.25 35.00 34.55
Glycine 32.25 32.29 32.49 32.18 31.91 31.79 31.66 31.92 31.54
Alanine 57.25 57.62 57.82 57.50 56.78 56.54 56.73 56.53 56.29
Valinea 70.76 71.08 70.38 70.36 70.21 70.32 71.14 70.98 70.31
Methioninea 42.13 42.15 42.35 41.30 41.39 41.10 41.32 41.19 41.13
Isoleucinea 55.44 55.39 55.74 54.59 54.56 54.30 54.58 54.74 54.49
Leucinea 93.94 93.61 94.25 92.71 92.25 92.46 91.81 92.24 91.92
Tyrosinea 44.35 44.56 45.08 43.28 44.24 43.51 42.58 42.87 43.23
Phenylalaninea 67.73 67.58 67.95 66.73 66.58 66.31 66.22 66.38 66.33
Histidinea 25.80 25.65 25.90 25.51 25.80 25.60 25.31 25.67 25.37
Lysinea 64.71 63.30 66.63 65.43 64.47 65.08 62.76 65.92 65.64
Arginine 63.90 63.77 64.66 63.12 63.00 63.51 62.33 62.82 63.54
TEAA 512.43 510.46 516.07 506.91 506.52 505.63 501.69 507.03 504.86
TAA 988.98 989.11 987.87 984.61 978.51 980.06 978.96 981.56 975.79
*Values are means of triplicate determinations. See table 4.15 for brief description of DEW,
MO-EW, and SO-EW. TEAA= total essential amino acids. TAA= Total amino acid. a
Essential
amino acid.
**Cysteine and Tryptophan were not determined.

57
Table 4.17. Mineral profile of egg white powders*
DEW MO-EW SO-EW Recommended
dietary allowance for
mineral (mg/day)a
Inlet Temp. (°C) Inlet Temp. (°C) Inlet Temp. (°C)
130 140 150 130 140 150 130 140 150
P (g/100 g powder) 0.07 0.08 0.07 0.06 0.06 0.05 0.04 0.06 0.07 800/1400
K (g/100 g powder) 1.18 1.24 1.21 0.98 1.05 0.94 1.03 0.93 0.88 2000/3500
Ca (g/100 g powder) 0.04 0.04 0.04 0.03 0.03 0.03 0.03 0.03 0.03 800/900
Mg (g/100 g powder) 0.08 0.08 0.07 0.06 0.07 0.06 0.07 0.07 0.07 350/350
Cu (mg/100 g powder) 1.15 1.31 1.19 0.49 0.66 0.58 0.65 0.68 0.55 1.5/3.0
Zn (mg/100 g powder) <1 <1 <1 <1 <1 <1 <1 <1 <1 10/15
Mn (mg/100 g powder) <1 <1 <1 1 <1 1 <1 1 <1
Fe (mg/100 g powder) <1 8 4 <1 <1 <1 <1 <1 <1 12/12
*Values are means of triplicate determinations. See Table 4.8 for a brief description of EW-130, EW-140, EW-150, MO-EW-130,
MO-EW-140, MO-EW-150, SO-EW-130, SO-EW-140, and SO-EW-150. aCompiled from Brounds (1993) for male athletes from 25 to 50 years old.

58
4.10 SEM and Particle Size Distribution of EW, MO-EW, and SO-EW Powders
Analysis of the microstructure of the spray-dried egg white powder particles was carried out
with a three-dimensional characterization through SEM. Figure 4.7 presents the
photomicrographs of the particles of DEW, MO-EW, and SO-EW powders obtained by
electronic microscopy. It was observed that DEW powders did not have spherical
microcapsules; this might be due to the lack of core material (fish oil). Higher shrinkage was
observed in MO-EW-150 and in SO-EW-150 than other MO and SO microencapsulated at 130
and 140 oC. This might be explained with moisture transport during the falling rate period
(Walton, 2000). At the constant rate, the rate of water diffusion from the inside of particle to its
surface is equal to the surface evaporation rate; once the droplet reaches a critical moisture
content, a dry crust is formed at the feed droplet surface and the drying rate quickly decreases.
The particles could tend to voids inflate and break when evaporation occurs at higher
temperatures during the falling rate period (Oakley, 1997; Rosenberg, 1988; Gharsallaoui et al.,
2007).
Huang et al., (2006) have reported that low inlet air temperatures cause low evaporation
rates and produce powders with high moisture contents, and agglomerated powder particles;
meanwhile, high air inlet temperature causes excessive evaporation and produce low quality
powders.
The particle size of DEW, MO-EW, and SO-EW powders ranged from 10 to 40 µm (Figures
4.8, 4.9 and 4.10). Most of the powder particles fall in the size range around 20 to 30 µm. Similar
results have reported by Kagami et al., (2003) on the microencapsulation of fish oil by spray
drying using protein and dextrin wall materials; moreover, the microencapsulated fish oil powder
particle size is not affected by type of wall material and oil loading rate. It was also observed that

59
the addition of MO or SO didn’t affect the particle size of EW regardless of the inlet air
temperature. According to AIChE Equipment Testing Procedure (2003), particle size of spray
dried powders depends on the spray drying operation conditions such as feed temperature, air
inlet temperature, and air outlet temperature; meanwhile, Hogan et al., (2001) have reported that
that the particle size of spray dried powders increases with the increasing of total solids content
and /or apparent viscosity of the feed.

60
Figure 4.7 Scanning electron microscopy of the egg white powders.
MO-EW-140 MO-EW-130 MO-EW-150
DEW-130 DEW-140 DEW-150
SO-EW-130 SO-EW-140 SO-EW-150
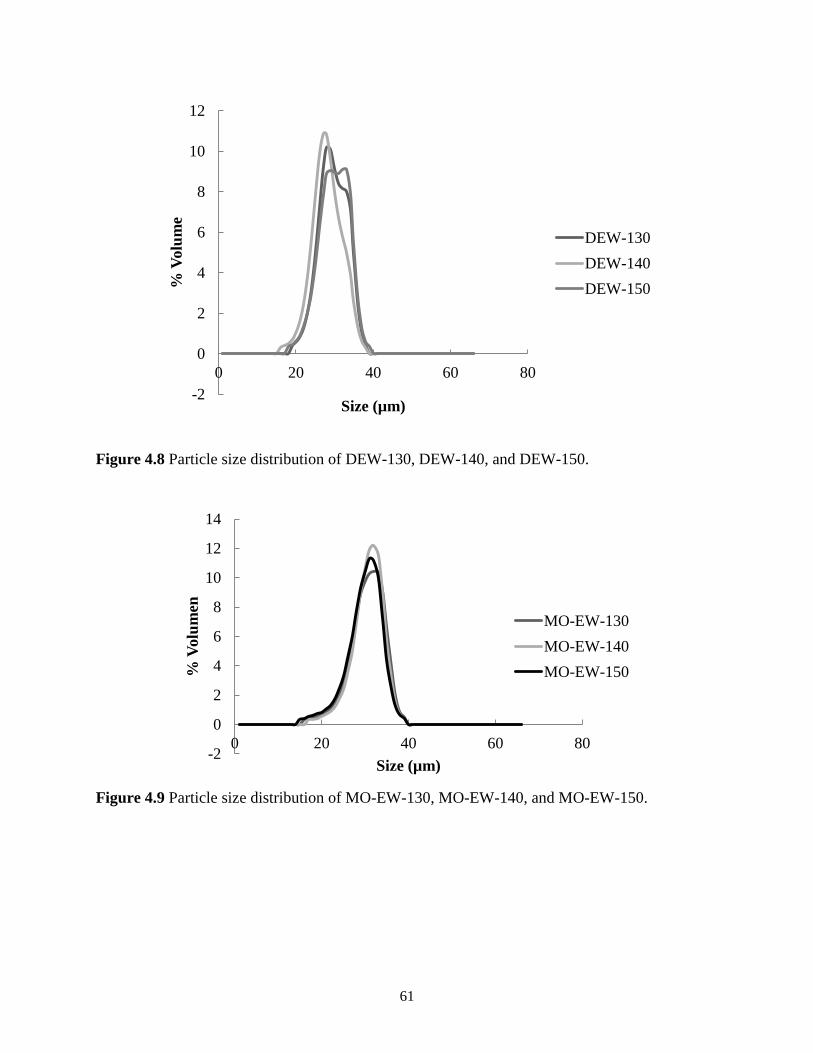
61
Figure 4.8 Particle size distribution of DEW-130, DEW-140, and DEW-150.
Figure 4.9 Particle size distribution of MO-EW-130, MO-EW-140, and MO-EW-150.
-2
0
2
4
6
8
10
12
0 20 40 60 80
% V
olu
me
Size (µm)
DEW-130
DEW-140
DEW-150
-2
0
2
4
6
8
10
12
14
0 20 40 60 80
% V
olu
men
Size (µm)
MO-EW-130
MO-EW-140
MO-EW-150

62
Figure 4.10 Particle size distribution of SO-EW-130, SO-EW-140, and SO-EW-150.
-2
0
2
4
6
8
10
12
14
0 20 40 60 80
% V
olu
men
Size (µm)
SO-EW-130
SO-EW-140
SO-EW-150

63
CHAPTER 5: SUMMARY AND CONCLUSIONS
Hen eggs are an excellent source of high quality proteins, vitamins and minerals. They are
also considered one of the most important foods across the world due to their nutritional content
and relative low cost. China is the world’s largest producer of hen eggs followed by the United
States of America, and India. en egg production is divided into two categories: hatching eggs and
table eggs. However, only table eggs are intended for human consumption as food products. The
U.S. table egg production had a value of approximately 4.24 billion dollars in 2009. In recent
years, many concerns have arisen about the consumption of hen eggs due to cholesterol issues.
All the egg’s cholesterol is located in yolk. Egg white contains all nine essential amino acids
including leucine, valine and isoleucine. Thus egg whites could supply many of the benefits of
whole eggs without the consumption of cholesterol. The oxidation of leucine, valine and
isoleucine is stimulated during dynamic exercise. Moreover, leucine is used to remold the muscle
after weight lifting and other types of resistance exercises, hence, additional intake of these
essential amino acids especially leucine may be helpful for people participating in high levels of
exercise.
Purified menhaden oil (MO) and salmon oil (SO) are a good sources of omega-3
polyunsaturated fatty acids (ω-3 PUFA) especially eicosapentaenoic acid (EPA) (C20:5) and
docosahexaenoic acid (DHA) (C22:6). Several studies have shown positive roles for ω-3 PUFA
in human health including a beneficial effect in infant development, cancer, coronary heart
diseases, hypertension, obesity, type II diabetes; and more lately, in various mental illnesses,
including depression, attention-deficit hyperactivity disorder and dementia. Furthermore, many
benefits have been attributed to the intake of ω-3 PUFA on athletes’ performances. These
purported benefits include the improvement in the delivery of oxygen and nutrients to muscles

64
and other tissues due to the reduction of blood viscosity; and the reduction of inflammation
caused by muscular fatigue and overexertion; which may improve post-exercise recovery time.
Nevertheless, evaluations of the effectiveness of the consumption of omega-3 fatty acids have
demonstrated no improvements in strength, endurance, and muscle soreness. Instead, the benefits
of omega-3 fatty acids are more related to the enhancement of aerobic metabolic process, which
is an important factor in both athletic performance and in an individual’s ability to effectively
burn fat as an energy substrate.
Attempts to increase ω-3 PUFA content in hen eggs has been done through the manipulation
of the hen’s diet, which has increased the ω-3 PUFA content in hen’s egg by up to three times.
Nevertheless, since a conventional egg is not a rich source of ω-3 PUFA; even a three-fold
increase in ω-3 PUFA is considered small. Due to the limitations of these conventional attempts
to increase ω-3 PUFA content of hen eggs, the feasibility to increase ω-3 PUFA content in hen
eggs through processing was approached in this study. The objective of this study were (1) to
develop a spray dried microencapsulated fish oil with egg white power for athletes, (2) to
evaluate the nutritional components and physical properties of 3 PUFA-fortified egg white
powder, and (3) to evaluate the spray drying conditions to produce ω-3 PUFA-fortified egg white
powder.
Two stable emulsions were prepared with 3.43% purified menhaden oil (MO) or refined
salmon oil (SO), 56.21% egg whites (EW), and 40.36% water (E-MO-EW and E-SO-EW). The
emulsions were spray dried at an inlet air temperature of 130, 140, and 150oC. EW without fish
oil (E-EW) was separately spray dried for a control. Nine powders were produced including E-
EW spray dried at 130°C of inlet temperature (DEW-130), E-EW spray dried at 140°C of inlet
temperature (DEW-140), E-EW spray dried at 150°C of inlet temperature (DEW-150), E-MO-

65
EW spray dried at 130°C of inlet temperature (MO-EW-130), E-MO-EW spray dried at 140°C of
inlet temperature (MO-EW-140), E-MO-EW spray dried at 150°C of inlet temperature (E-MO-
EW), E-SO-EW spray dried at 130°C of inlet temperature (SO-EW-130), E-SO-EW spray dried
at 140°C of inlet temperature (SO-EW-140), and E-SO-EW spray dried at 150°C inlet
temperature (SO-EW-150).
The study demonstrated that egg white (EW) contained 88.28 (g/100 g of dry powder) of
protein. EPA and DHA were the main ω-3 PUFA in MO and SO. The total ω-3 PUFA levels in
MO and SO were 32.58 and 23.66%, respectively. E-EW, E-MO-EW, and E-SO-EW were stable
at 25°C and behaved as pseudoplastic fluids at 5, 15, and 25°C. The estimated production rate
ranged from 0.056 to 0.062 kg dry solids/h and was slightly higher than the actual production
rate which ranged from 0.056 to 0.060 kg dry solids/h. The evaporation rate of water from E-
EW, E-MO-EW, and E-SO-EW during spray drying ranged from 0.593 to 0.610 (kg water/h) and
was not affected by the inlet air temperature. Higher energy requirements were needed to obtain
DEW-150, MO-EW-150, and SO-EW-150. The microencapsulation efficiency (ME) was not
significantly affected by the inlet air temperature; as evidenced by the MEs of MO-EW and SO-
EW powders which ranged from 72.03 to 72.96%.
The microencapsulation process did not affect the EPA and DHA content of MO and SO.
The protein content in MO-EW and SO-EW powders ranged from 63.90 to 65.10 g/100 g of dry
powder which was lower than that of DEW powders which ranged from 88.30 to 88.80 g/100 g
of dry powder. MO-EW and SO-EW powders had higher total lipid content than the control
(DEW powders). Moisture content and water activity (aw) of the powders were significantly
(P<0.05) lower for the powder produced at 150 °C inlet air temperature. All of the powders
contained all essential amino acids (EAA). Leucine was the main EAA found in all the egg white

66
powders. The leucine content in DEW, MO-EW, and SO-EW powders ranged from 91.81 to
94.25 mg/g protein. Potassium, magnesium, and phosphorus were the main minerals found in
DEW, MO-EW, and SO-EW powders. Most of the powder particles ranged in size from 20 to 30
µm. A 50 g of MO-EW or SO-EW powders can provide about 30 g of protein containing 15.67 g
of essential amino acid including 2885 mg of leucine. The powders can provide 14 g of
menhaden oil containing 13.43% EPA and 12.83% DHA or 14 g salmon oil containing 11.28%
EPA and 11.11% DHA. The powders also can provide 480 mg of potassium, and 1.80 mg of
copper.
In summary, the study has shown that egg white powder containing purified menhaden or
salmon oil can be effectively produced with spray drying technology. Higher quality
microencapsulated fish oil with protein can be produced at 130°C inlet temperature. The data
obtained in this research could be useful to scale up the process. Microencapsulated fish oil with
egg white powder may be beneficial for athletes performing high intensity exercise.

67
REFERENCES
Abayasekara, D.R.E., & Wathes, D.C. (1999). Effects of altering dietary fatty acid composition
on prostanglandin synthesis and fertility. Prostaglandins Leukotrienes and Essential Fatty
Acids, 61:275-287.
ADFG – Alaska Department of Fish and Game. (2010). Alaska Commercial Salmon Harvests
and Exvessel Values 2009. Alaska Department of Fish and Game.
http://www.cf.adfg.state.ak.us/geninfo/finfish/salmon/catchval/blusheet/09exvesl.pdf
Accessed January 25, 2011
AEB - American Egg Board. (1999). Eggclyclopedia – The incredible edible egg. Park Ridge, IL
AlChE Equipment Testing Procedure (2003). Spray dryers: A guide to performance evaluation.
NY: American Institute of Chemical Engineers.
Anandaraman, S., & Reineccius, G.A. (1986). Stability of encapsulated orange peel oil. Food
Technology, 40(11): 88-93.
Anonymous. (2004). Designer eggs: Best way to get your omega-3 fatty acids? Consumer
Report, 69(8): 45.
AOAC-Association of Official Analytical Chemists. (1999). Official methods of analysis. (16th
Ed.). Arlington, VA. AOAC International.
AOAC-Association of Official Analytical Chemists. (2006). Official methods of analysis. (18th
Ed.). Arlington, VA. AOAC International.
AOCS (1998). Official methods and recommended practices of the American oil Chemists’
Society. American Oil Chemists’ Society, Champaign, IL
Baik, M.Y., Suhendro, E.L., Nawar, W.W., McClements, D.J., Decker, E.A. & Chinachoti, P.
(2004). Effects of antioxidants and humidity on the oxidative stability of microencapsulated
fish oil. Journal of the American Oil Chemists’ Society, 81(4): 355-360.
Bangs, W.E., & Reineccius, G.A. (1988). Corn starch derivatives: possible wall materials for
spray-dried flavor manufacture. In: Reineccius, G.A., Risch, S.J. editors. Flavor
encapsulation. Washington, D.C.:Am. Chem. Soc. 12 p.
Bayrarn, O.A., Bayram, M., & Tekin, A.R. (2005). Spray drying of sumac flavor using sodium
chloride, sucrose, glucose and starch as carriers. Journal of Food Engineering, 69(2):253-
260.
Beatus, Y., Raziel, A., Rosenberg, M., & Kopelman, I.J. (1984). Spray-drying
microencapsulation of paprika oleoresin. Lebensmittel Wissenschaft und Technologie, 18:28-
34.

68
Beuchat, L.R. (1981). Microbial stability as affected by water activity. Cereal Foods World,
26:345-349.
Bechtel, P.J., & Oliveira, A.C.M. (2006). Chemical Characterization of Liver Lipid and Protein
from Cold-Water Fish Species. Journal of Food Science, 71(6): S480-S485.
Bergstrom, J., Furst, P., & Vinnars, E. (1990). Effect of a test meal, without and with protein, on
muscle and plasma free amino acids. Clinical Science, 79:331-337.
Boon, C.S., Xu, Z., Yue, X., McClements, D.J., Weiss, J., Decker, E.A. (2008). Factors affecting
lycopene oxidation in oil-in-water emulsions. Journal of Agricultural and Food Chemistry,
56(4):1408-1414.
Brilla, L.F., & Landerholm, T.E. (1990). Effect of fish oil supplementation and exercise on
serum lipids and aerobic fitness. Journal of Sports Medicine, 30(2):173.
Brosnan, M.E., & Letto, J. (1991). Interorgan metabolism of valine. Amino Acids, 1:29-35.
Brouns, F. (1993). Nutritional Needs of Athletes (1st. ed.). Chichester, West Sussex, England.
John Wiley & Sons Ltd.
Bucci, L. (1993). Nutrients as ergogenic aids for sports and exercise. CRC PRESS. Boca Raton,
FL, USA.
Butterfield, G.E. (1999). Nutrient requirements at high altitude. Clinics in Sports Medicine,
18:607-621.
Butterfield, G.E., & Calloway, D.H. (1984). Physical activity improves protein utilization in
young men. British Journal of Nutrition, 51:171-184.
Champagne, C.P., & Fustier, P. (2007). Microencapsulation for the improved delivery of
bioactive compounds into foods. Current Opinion in Biotechnology, 18(2): 184-190.
Clandinin, M.T., Jumpsen, J., & Suh, M. (1994). Relationship between fatty acid accretion,
membrane composition, and biologic functions. Journal of Pediatrics, 125:S25-S35.
Clarkson, P.M. (1991). Minerals: exercise performance and supplementation in athletes. Journal
of Sports Sciences. 9:91-116.
Consoli, A., Nurjhan, N., Reilly, J.J.J., Bier, D.M., & Gerich, J.E. (1990). Contribution of liver
and skeletal muscle to alanine and lactate metabolism in humans. American Journal of
Physiology, 259:E677-E684.
Damodaran, S., Parkin, K.L., & Fennema, O.R. (2008). Fennema’s Food Chemistry. (4th
ed.).
Boca Baton, FL, USA. CRC Press.
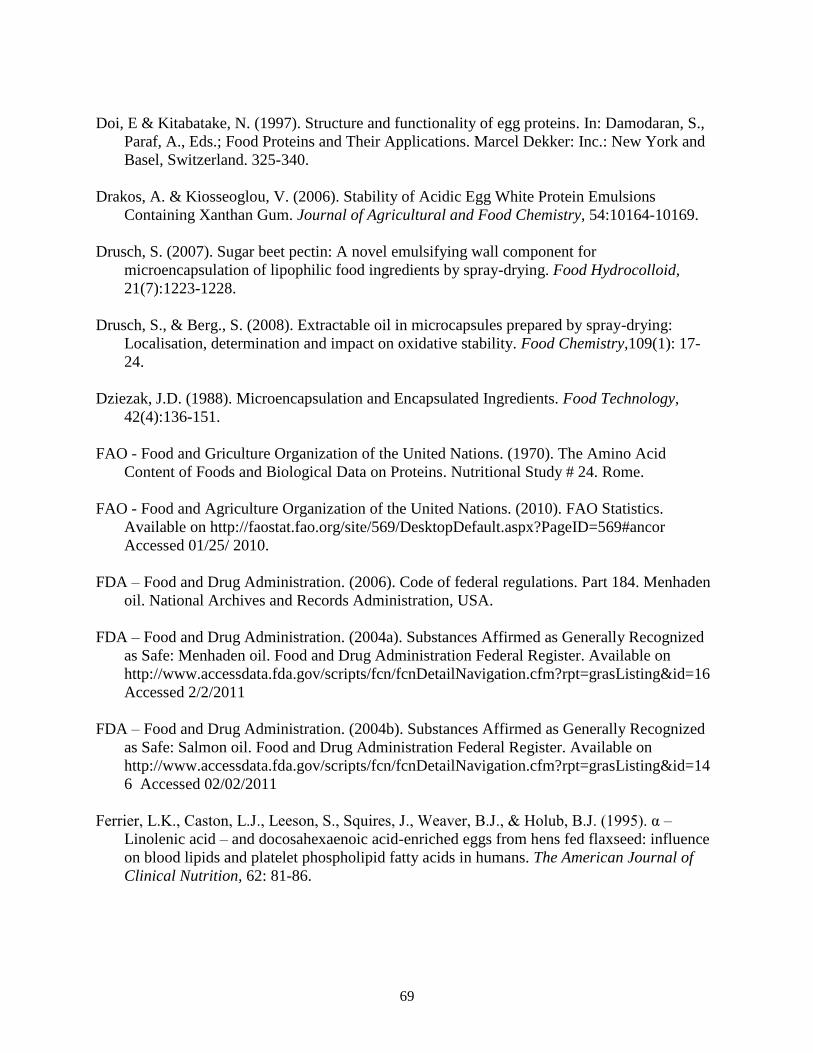
69
Doi, E & Kitabatake, N. (1997). Structure and functionality of egg proteins. In: Damodaran, S.,
Paraf, A., Eds.; Food Proteins and Their Applications. Marcel Dekker: Inc.: New York and
Basel, Switzerland. 325-340.
Drakos, A. & Kiosseoglou, V. (2006). Stability of Acidic Egg White Protein Emulsions
Containing Xanthan Gum. Journal of Agricultural and Food Chemistry, 54:10164-10169.
Drusch, S. (2007). Sugar beet pectin: A novel emulsifying wall component for
microencapsulation of lipophilic food ingredients by spray-drying. Food Hydrocolloid,
21(7):1223-1228.
Drusch, S., & Berg., S. (2008). Extractable oil in microcapsules prepared by spray-drying:
Localisation, determination and impact on oxidative stability. Food Chemistry,109(1): 17-
24.
Dziezak, J.D. (1988). Microencapsulation and Encapsulated Ingredients. Food Technology,
42(4):136-151.
FAO - Food and Griculture Organization of the United Nations. (1970). The Amino Acid
Content of Foods and Biological Data on Proteins. Nutritional Study # 24. Rome.
FAO - Food and Agriculture Organization of the United Nations. (2010). FAO Statistics.
Available on http://faostat.fao.org/site/569/DesktopDefault.aspx?PageID=569#ancor
Accessed 01/25/ 2010.
FDA – Food and Drug Administration. (2006). Code of federal regulations. Part 184. Menhaden
oil. National Archives and Records Administration, USA.
FDA – Food and Drug Administration. (2004a). Substances Affirmed as Generally Recognized
as Safe: Menhaden oil. Food and Drug Administration Federal Register. Available on
http://www.accessdata.fda.gov/scripts/fcn/fcnDetailNavigation.cfm?rpt=grasListing&id=16
Accessed 2/2/2011
FDA – Food and Drug Administration. (2004b). Substances Affirmed as Generally Recognized
as Safe: Salmon oil. Food and Drug Administration Federal Register. Available on
http://www.accessdata.fda.gov/scripts/fcn/fcnDetailNavigation.cfm?rpt=grasListing&id=14
6 Accessed 02/02/2011
Ferrier, L.K., Caston, L.J., Leeson, S., Squires, J., Weaver, B.J., & Holub, B.J. (1995). α –
Linolenic acid – and docosahexaenoic acid-enriched eggs from hens fed flaxseed: influence
on blood lipids and platelet phospholipid fatty acids in humans. The American Journal of
Clinical Nutrition, 62: 81-86.

70
Gharsallaoui, A., Roudaut, G., Chambin, O., Voilley, A., & Saurel, R. (2007). Application of
spray-drying in microencapsulation of food ingredients: An overview. Food Research
International, 40(9): 1107-1121.
Ginsberg, H.N., Karnally, W., Siddiqyi, M., Holleran, S., Tall, A.R., Ramsey, S.C., Deckelbaum,
R.J., Blaner, W.S., & Ramakrishnan, R. (1994). A dose-response study of the effects of
dietary cholesterol on fasting and postprandial lipid and lipoprotein metabolism in healthy
young men. Arteriosclerosis and Thrombosis, 14:576-586.
Guezennec, C.Y., Leger, C., Sabatin, P. (1991). Lipid metabolism and performance. In Atlan, C.,
Béliveau, L., Bouissous, P. (Eds). Muscle Fatigue: Biochemical and Physiological Aspects.
Masson, Paris. 165-172.
Goula, A.M., & Adamopoulos, K.G. (2005). Spray drying of tomato pulp in dehumidified air: II.
The effect on powder properties. Journal of Food Engineering, 66(1), 35-42.
Herron, K.L., & Fernandez, M.L. (2004). Are the current dietary guidelines regarding egg
consumption appropriate? The Journal of Nutrition, 134:187-190.
Howell, W.H., McNamara, D.J., Tosca, M.A., Smith, B.T., & Gaines, J.A. (1997). Plasma lipid
and lipoprotein responses to dietary fat and cholesterol: a meta-analysis. American Journal
of Clinical Nutrition, 65: 1747-1764.
Hogan, S.A., McNamee, B.F., O’Riodan, E.D., & O’Sullivan, M. (2001). Emulsification and
microencapsulation properties of sodium caseinate/carbohydrate blends. International Dairy
Journal, 11(3):137-144.
Huang, L.X., Kumar, K., & Mujumdar, A.S. (2006). A comparative study of a spray dryer with
rotary disc atomizer and pressure nozzle using computational fluid dynamic simulation.
Chemical Engineering and Processing, 45:461-470.
IFFO.net: Available on http://www.iffo.net/intranet/content/archivos/63.pdf Accessed
01/20/2011
Kassis, N., Drake, S.R., Beamer, S.K., Matak, K.E., & Jaczynski, J. (2010). Development of
nutraceutical egg products with omega-3 rich oils. LWT- Food Science and Technology,
43:777-783.
Kagami, Y., Sugimura, S., Fujishima, N., Matsuda, K., Kometani, T. & Matsumura, Y. (2003).
Oxidative stability, structure, and physical characteristics of microcapsules formed by spray
drying of fish oil with protein and dextrin Wall materials. Journal of Food Science, 68(7):
2248-2255.
Keey, R.B., & Pham, Q.T. (1976). Behavior of spray driers with nozzle atomizers. Chemical
Engineer-London, 311:516-521.

71
Kenyon, M.M. (1995). Modified starch, maltodextrin, and corn syrup as wall materials for food
encapsulation. ACS Symposium Series, 590:42-50.
Kenyon, M.M. Anderson, R.J. (1988). Maltodextrin and low-dextrose equivalent corn syrup
solids: production and technology for the flavor industry. In: Reineccius, G.A., Risch, S.J.,
editors. Flavor encapsulation. Washington, D.C.: Am. Chem. Soc. p. 7-12.
Klinkesorn, U., Sophanodora, P., Chinachoti, P., McClements, D.J., Decker, E.A. (2005).
Stability of spray-dried tuna oil emulsion encapsulated with two-layered interfacial
membranes. Journal of Agricultural and Food Chemistry, 53(21):8365-8371.
Kromhout, D., Bosschieter, E.B., & de Lezenne Coulander, C. (1985). The inverse relation
between fish consumption and 20-year mortality from coronary heart disease. New England
Journal of Medicine, 312:1205-1209.
Kolanowaski, W., Swiderski, F., & Berger, S. (1999). Possibilities of fish oil application for food
products enrichment with ω-3 PUFA. Journal of Food Science and Nutrition, 50: 39-49.
Layman, D.K., & Rodriguez, N.R. (2009). Egg protein as a source of power, strength, and
energy. Nutrition today, 44(1):43-48. In: Ohr, L.M. (2010). Powerful proteins. Food
Technology, 64(8):67-71.
Landy, P., Druaux, C., & Voilley, A. (1995). Retention of aroma compounds by proteins in
Aqueous-solution. Food Chemistry, 54(4):387-392.
Lemon, P.W. (1998). Effects of exercise on dietary protein requirements. International Journal
of Sport Nutrition, 8:426-447.
Lemon, P.W. (1991a). Effect of exercise on protein requirements. Journal of Sports Sciences,
9:53-70.
Lemon, P.W. (1991b). Protein and amino acid needs of the strength athlete. International
Journal of Sport Nutrition. 1:127-145.
Lenn, J., Uhl, T., Mattacola, C., Boissonneault, G., Yates, J., Ibrahim, W., & Bruckner, G.
(2002). The effects of fish oil and isoflavones on delayed onset muscle soreness. Medicine &
Science in Sports & Exercise, 34(10):1605-1613.
Masters, K. (1991). Spray drying Handbook. Longman Scientific & Technical, United
Kingdom. 365-638 p.
Maxwell, R.J., & Marmer, W.N. (1983). Systematic protocol for the accumulation of fatty acid
data from multiple tissue samples: Tissue handling, lipid extraction and class separation, and
capillary gas chromatographic analysis. Lipids, 18:453-459.

72
Mei, L., McClements, D.J., Wu, J., & Decker, E.A. (1998). Iron-catalyzed lipid oxidation in
emulsion as affected by surfactant, pH and NaCl. Food Chemistry, 61: 307-317.
Mine, Y. (1995). Recent advances in the understanding of egg white protein functionality.
Trends in Food Science & Technology, 6:225-232.
Moreau, D.L., & Rosenberg, M. (1993). Microstructure and fat extractability in microcapsules
based on whey proteins or mixtures of whey proteins or mixtures of whey proteins and
lactose. Food Structure, 12:457-468.
Moschakis, T., Murray, B.S., & Dickinson, E. (2005). Microstructural evolution of viscoelastic
emulsions stabilized by sodium caseinate and xanthan gum. Journal of Colloid and Interface
Science, 284:714-728.
National Research Council (1989) Recommended Dietary Allowances (10th
ed.) Washington,
National Academy Press.
NMSF – National Marine Fisheries Service. (2009). Fisheries of the United States 2008.
Nurjhan, N., Bucci, A., Perriello, G., Stumvoll, M., Dailey, G., Bier, D.M., Toft, I., Jenssen,
T.G. & Gerich, J.E. (1995). Glutamine: a major gluconeogenic precursor and vehicle for
Interorgan carbon transport in man. Journal of clinical Investigation, 95 (1): 272-277.
Oakley, D.E. (1997). Produce uniform particles by spray drying. Chemical Engineering Progress
10:48-54
Oarada, M., & Miyazawa, A. (1990). The effect of rancid oils on lymphoid tissues. Journal of
the Japanese Oil Chemists Society, 39:373-376.
Obón, J.M., Castellar, M.R., Alacid, M., & Fernández-López, J.A. (2009). Production of a red-
purple food colorant from Opuntia stricta fruits by spray drying and its application in food
model systems. Journal of Food Engineering, 90: 471-479.
Paredes, M.D.C., Rao, M.A., & Bourne, M. (1989). Rheological characterization of salad
dressing. 2: effect of storage. Journal of Texture Studies, 20:235-250.
Patel, R.P., Patel, M.P., & Suthar, A.M. (2009). Spray drying technology: an overview. Indian
Journal of Science and Technology, 2(10): 44-47.
Pereda, J., Ferragut, V., Quevedo, J.M., Guamis, B., & Trujillo, A.J. (2008). Effects of ultra-
high-pressure homogenization treatment on the lipolysis and lipid oxidation of milk during
refrigerated storage. Journal of Agricultural and Food Chemistry, 56(16): 7125-7130.

73
Perez-Alonso, C., Baez-Gonzalez, J.G., Beristain, C.I., Vernon-Carter, E.J., & Vizcarra-
Mendoza, M.G. (2003). Estimation of the activation energy of carbohydrate polymers blends
as selection criteria for their use as Wall material for spray-dried microcapsules.
Carbohydrate Polymers, 53(2):197-203.
Phillips, S.M., Atkinson, S.A., Tarnopolsky, M.A., & MacDougall, J.D. (1993). Gender
differences in leucine kinetics and nitrogen balance in endurance athletes. Journal of
Applied Physics, 75:2134-2141.
Powrie, W.D., & Nakai, S. (1985). Characteristics of edible fluids of animal origin: Eggs. Pages
829-856 in Food Chemistry. 2nd
ed. Marcel Dekker Inc. New York, NY.
Pu, J, J.D., Bankston, & Sathivel, S. (2011) Developing microencapsulated flaxseed oil
containing shrimp (Litopenaeus setiferus)astaxanthin using a pilot scale spray dryer.
Biosystems Engineering, 108: 121-132.
Quek, S.Y., Chok, N.K., & Swedlund, P. (2007). The physicochemical properties of spray-dried
watermelon powders. Chemical Engineering and Processing, 46(5), 386-392.
Rao, M.A. (1999). Rheological of fluids and semisolids. In: Principal and applications. An
Publishers, Inc. Gaitherburg, MD.
Reineccius, G.A. (1988). Spray drying if food flavors. In. Reineccius, G.A., Risch, S.J., editors.
Flavor encapsulation. Washington D.C.: Am. Chem. Soc. p. 45.
Reineccius, G.A. (1994). Flavor encapsulation. In: Krochta, J.M., Baldwin E.A. Nisperis-
Carriedo, M.O. Editors. Edible coatings and films to improve food quality. Lancaster,
Pa.:Technomic Publ. Co. Inc. p 105-120.
Rennie, M.J., & Tipton, K.D. (2000). Protein and Amino Acid Metabolism during and After
Exercise and the Effects of Nutrition. Annual Review of Nutrition, 20:457-483.
Riediger, N.D., Othman, R.A., Suh, M., & Monghadasian, M.H. (2009). A Systematic Review of
the Roles of n-3 Fatty Acids in Health and Disease. Journal of the American Dietetic
Association, 109:668-679.
Risch, S.J. (1995). Review of Patents for Encapsulation and Controlled-Release of Food
Ingredients. ACS Symposium Series, 590:196-203
Ronald, C.D. (1997). Spray drying innovative use of an old process. Design Elements, 7:97-113.
Rosenberg, M., Kopelman, I.J., & Talman, Y. (1985). A scanning electron microscopy study of
microencapsulation. Journal of Food Science, 50:130-144.
Rosenberg, M., Talman, Y. & Kopelman, I.J. (1988). The microstructure of spray-dried
microcapsules. Food Microstructure, 7:15-23.

74
Rosenberg, M., & Young, S.L. (1993). Whey proteins as microencapsulating agents.
Microencapsulation of anhydrous milkfat – structure evaluation. Food Structure, 12: 31-41.
USDA (2009a). Agricultural research service. Per capita egg consumption
http://www.usda.gov/wps/portal/usdahome Accessed 26/01/2011
USDA (2009b). Nutrient data laboratory.
http://www.ars.usda.gov/main/site_main.htm?modecode=12-35-45-00 Accessed 27/01/2011
USDA (2010a). Economic Research service. Food availability: Spreadsheet. Available on
http://www.ers.usda.gov/Data/FoodConsumption/FoodAvailSpreadsheets.htm#eggs
Accessed 02/01/2011
USDA (2010b). National Agricultural Statistics Service. Charts and Maps. Poultry. Available on
http://www.nass.usda.gov/Charts_and_Maps/Poultry/index.asp Accessed 01/01/2011
Sathivel, S. (2005). Thermal and flow properties of oils from salmon head. Journal of the
American Oil Chemists’ Society, 82:147-151.
Schuck, P., Dolivet, A., Méjean, S., Zhu, P., Blanchard, E., & Jeantet, R. (2009). Drying by
desorption: a tool to determine spray drying parameters. Journal of Food Engineering, 94:
199-204.
Shahidi, F., & Han X.Q. (1993). Encapsulation of Food Ingredients. Critical review in Food
Science and Nutrition, 33(6):501-547.
Shahidi, F.& Wanasundara, U.N. (1995). Oxidative stability of encapsulated seal blubber oil.
Flavor Technology, 610:139-151.
Sheu T.Y., & Rosenberg, M. (1995). Microencapsulation by spray drying ethyl caprylate in
whey protein and carbohydrate wall systems. Journal of Food Science, 60(1): 98-103.
Silva, W.A., Elias, A.H.N., Aricetti, J.A., Sakamoto, M.I., Murakami, A.E., Gomes, S.T.M.,
Visentainer, J.V., De Souza, N.E., & Matsushita, M. (2009). Quail egg yolk (Coturnix
coturnix japonica) enriched with omega-3 fatty acids. LWT- Food Science and Technology,
42:660-663.
Simopoulos, A. P. (1999). Essential fatty acids in health and chronic disease. American Journal
of Clinical Nutrition, 70(3): 560S-569S.
Simpson, R.J., Neuberger, M.R. & Liu, T.Y. (1976). Complete amino acid analysis of proteins
from a single hydrolysates. Journal of Biological Chemistry, 251 (7):1936-1940.
Singh, R.P., & Heldman, D.R. (2001). Introduction of Food Engineering. (3rd
ed.). San Diego,
Calif.; Academic Press.

75
Stadelman, W.J. (1999). The Incredible Functional Egg. Poultry Science, 78:807-811
Tarnopolsky, M. (2004). Protein requirements for endurance athletes. Nutrition, 20:662-668.
Tarnopolsky, M.A., Atkinson, S.A., MacDougall, J.D., Chesley, A., Phillips, S., & Schwarcz,
H.P. (1992). Evaluation of protein requirements for trained strength athletes. Journal of
Applied Physiology, 73:1986-1995.
Tarnopolsky, M.A., Atkinson, S.A., MacDougall, J.D., Senor, B.B., Lemon, P.W., & Schwarcz,
H. (1991). Whole body leucine metabolism during and after resistance exercise in fed
humans. Medicine and Science in Sports and Exercise, 23:326-333.
Tung, M.A., Richards, J.F., Morrison, B.C. & Watson, E.L. (1970). Rheology of fresh, aged and
gamma-irradiated egg white. Journal of Food Science, 35:872-874.
Yin, H., Pu, J., Wan, Y., Xiang, P., Bechtel, J. & Sathivel, S. (2009). Rheological and Functional
Properties of Catfish Skin Protein Hydrolysates. Journal of Food Science, 75 (1): E11-E17.
Yin, H., & Sathivel, S. (2010). Physical properties and oxidation rates of unrefined menhaden oil
(Brevooria patronus). Journal of Food Science, 75:E163-E168.
Walton, D.E. (2000). The morphology of spray-dried particles a qualitative view. Drying
Technology, 18(9):1943-1986.
Wagenmakers, A.J., Beckers, E.J., Brouns, F., Kuipers, H, & Saris, W. (1991). Carbohydrate
supplementation, glycogen depletion, and amino acid metabolism during exercise. American
Journal of Physiology, 260:E883
Wan, Y., Bechtel, P.J., & Sathivel, S. (2011). Physical and nutritional properties of baby food
containing menhaden oil (Brevoortia tyrannus) and microencapsulated menhaden oil. LWT-
Food Science and Technology, 44:576-581.
Wasserman, D.H., Geer, R.J., Williams, P.E., Becker, T., Lacy, D.B., & Abumrad, N.N. (1991).
Interaction of gut and liver in nitrogen metabolism during exercise. Metabolism, 40:307-314.
Weggemans, R.M., Zock, P.L., & Katan, M.B. (2001). Dietary cholesterol from eggs increases
the ratio of total cholesterol to high-density lipoproteins cholesterol in humans: a meta-
analysis. American Journal of Clinical Nutrition, 73:855-891.
Wu, T.H. & Bechtel, P.J. (2008). Salmon by-product storage and oil extraction. Food Chemistry,
111:868-871.

76
APPENDIX A. RESULTS OF THE PRODUCTION AND PROCESS OF
MICROENCAPSULATED OMEGA-3 FISH OIL WITH EGG YOLK POWDER
Table A.1 Proximate composition of egg yolk (EY)a
Egg yolk (EY)
Moisture (%) (wet basis) 54.01±0.30
Total lipids (g/100 g, dry basis) 64.24±0.33
Protein (g/100 g, dry basis) 35.20±0.21
Ash (g/100 g, dry basis) 3.23±0.06 aValues are means and SD of triplicate determination.
Table A.2 Color values and emulsion oxidation of E-EY, E-MO-EY, and E-SO-EY*
E-EY E-MO-EY E-SO-EY
L* 80.82±0.03c 85.63±0.03
b 88.17±0.01
a
a* -1.15±0.00c -0.77±0.02
b 0.61±0.01
a
b* 13.61±0.01c 19.98±0.01
a 16.28±0.01
b
Chroma 13.66±0.01c 19.99±0.01
a 16.29±0.01
b
Hue angle 94.83±0.00a 92.22±0.04
b 87.87±0.02
c
TBARS (mmol/kg emulsion) 0.03±0.00b 0.07±0.01
a 0.07±0.01
a
*Values are means and SD of triplicate determination.
abc means with different letters in each row
are significantly different (p< 0.05). E-EY = egg yolk emulsion, E-MO-EY = emulsion
containing egg yolk and menhaden oil, E-SO-EY= emulsion containing egg yolk and salmon oil.
TBARS = Thiobarbituric acid-reactive substances.
Table A.3 Flow behavior properties of E-EY*
Temperature (°C) n K(Pa.sn)
Apparent Viscosity (Pa s)
at 100-1
(Shear rate)
5 0.80±0.03b 0.013±0.003
a 0.005±0.000
a
15 0.85±0.03ab
0.007±0.001b 0.003±0.000
b
25 0.88±0.01a 0.005±0.000
b 0.003±0.000
c
*Values are means and SD of triplicate determination.
ab means with different letters in each
column are significantly different (p< 0.05). n = flow index, K = consistency index. E-EY= egg
yolk emulsion.
Table A.4 Flow behavior properties of E-MO-EY*
Temperature (°C) n K(Pa.sn)
Apparent Viscosity (Pa s) at
100-1
(Shear rate)
5 0.70±0.01b 0.04±0.00
a 0.008±0.00
a
15 0.73±0.01a 0.02±0.00
b 0.006±0.00
b
25 0.75±0.00a 0.02±0.00
c 0.005±0.00
c
*Values are means and SD of triplicate determination.
abc means with different letters in each
column are significantly different (p< 0.05). n = flow index, K = consistency index. E-MO-EY=
emulsion containing egg yolk and menhaden oil.

77
Table A.5 Flow behavior properties of E-SO-EY*
Temperature (°C) n K(Pa.sn)
Apparent Viscosity (Pa s)
at 100-1
(Shear rate)
5 0.77±0.01b 0.02±0.00
a 0.006±0.000
a
15 0.78±0.01ab
0.01±0.00ab
0.005±0.000b
25 0.80±0.01a 0.01±0.00
b 0.004±0.000
c
*Values are means and SD of triplicate determination.
abc means with different letters in each
column are significantly different (p< 0.05). n = flow index, K = consistency index. E-SO-EY=
emulsion containing egg yolk and salmon oil.
Figure A.1 Apparent viscosity of E-EY as a function of shear rate.
E-EY = egg yolk emulsion.
Figure A.2 Apparent viscosity of E-MO-EY as a function of shear rate.
E-MO-EY= emulsion-n containing egg yolk and menhaden oil.
0.00E+00
1.00E-03
2.00E-03
3.00E-03
4.00E-03
5.00E-03
6.00E-03
7.00E-03
8.00E-03
9.00E-03
0 50 100 150 200 250
Sh
ear
vis
cosi
ty (
Pa s
)
Shear rate (1/s)
5 °C
15 °C
25 °C
0
0.002
0.004
0.006
0.008
0.01
0.012
0.014
0.016
0.018
0 50 100 150 200 250
Sh
ear
vis
cosi
ty (
Pa s
)
Shear rate (1/s)
5 °C
15 °C
25 °C

78
Figure A.3 Apparent viscosity of E-SO-EY as a function of shear rate.
E-SO-EY= emulsion containing egg yolk and salmon oil.
Figure A.4 Viscoelastic properties of E-EY.
E-EY = egg yolk emulsion; G’=storage modulus; G’’=loss modulus.
0.00E+00
1.00E-03
2.00E-03
3.00E-03
4.00E-03
5.00E-03
6.00E-03
7.00E-03
8.00E-03
9.00E-03
1.00E-02
0 50 100 150 200 250
Sh
ear
vis
cosi
ty (
Pa s
)
Shear rate (1/s)
5 °C
15 °C
25 °C
1.00E-03
1.00E-02
1.00E-01
1.00E+00
0.1 1 10 100
G'G
''(P
a)
Frequency (rad/s)
G'
G''

79
Figure A.5 Viscoelastic properties of E-MO-EY.
E-MO-EY = emulsion containing egg yolk and menhaden oil; G’=storage modulus; G’’=loss
modulus.
Figure A.6 Viscoelastic properties of E-SO-EY.
E-SO-EY = emulsion containing egg yolk and salmon oil; G’=storage modulus; G’’=loss
modulus.
0.01
0.1
1
0.1 1 10 100
G'G
'' (
Pa)
Frequency (rad/s)
G'
G''
0.01
0.1
1
1 10 100
G'G
'' (
Pa)
Frequency (rad/s)
G'
G''

80
Table A.6 Data for the estimation of the production rate of egg yolk powders*
Moisture
content (wet
basis, %)
Moisture content
(dry basis, kg
water/kg dry solids)
Mass flow rate
x 103 (kg/h)
Mass flow rate x
103 (dry basis,
kg dry solids/h)
Estimated
production rate x
103 (kg dry solids/h)
E-EY 89.36±0.04 8.40±0.03 860.00±10.00 91.48±0.33
DEY-130
Powder 2.39±0.68 0.02±0.01 80.60±0.20 78.67±0.55 85.72±0.06
Dust 7.16±0.02 0.08±0.00 6.00±1.00 5.57±0.00
DEY-140
Powder 2.32±0.10 0.02±0.00 76.69±0.01 77.83±0.08 86.60±0.06
Dust 6.22±0.04 0.07±0.00 5.00±1.00 4.69±0.00
DEY-150
Powder 3.18±0.11 0.03±0.00 65.92±0.02 63.82±0.07 86.41±0.08
Dust 2.32±0.22 0.02±0.00 6.00±1.00 4.88±0.01
E-MO-EY 89.36±0.04 8.40±0.03 823.33±15.28 87.58±1.93
MO-EY-130
Powder 2.39±0.68 0.02±0.01 80.60±0.10 78.67±0.48 80.94±2.12
Dust 7.16±0.02 0.08±0.00 6.00±1.00 5.57±0.93
MO-EY-140
Powder 2.32±0.10 0.02±0.00 79.65±0.03 77.80±0.09 81.82±2.13
Dust 6.22±0.04 0.07±0.00 5.00±1.00 4.69±0.94
MO-EY-150
Powder 3.18±0.11 0.03±0.00 65.91±0.04 63.82±0.04 80.65±3.59
Dust 2.32±0.22 0.02±0.00 5.67±2.08 5.54±2.05
E-SO-EY 89.36±0.04 8.40±0.03 810.00±13.23 86.16±1.72
SO-EY-130
Powder 2.39±0.68 0.02±0.01 80.60±0.10 78.67±0.48 79.62±1.74
Dust 7.16±0.02 0.08±0.00 6.00±1.00 5.57±0.93
SO-EY-140
Powder 2.32±0.10 0.02±0.00 79.65±0.03 77.80±0.09 80.50±1.76
Dust 6.22±0.04 0.07±0.00 5.00±1.00 4.69±0.94
SO-EY-150
Powder 3.18±0.11 0.03±0.00 65.91±0.04 63.82±0.04 79.32±3.21
Dust 2.32±0.22 0.02±0.00 5.67±2.08 5.54±2.05
*Values are means ± SD of triplicate determination. DEY-130= E-EY spray dried at 130°C, DEY-140=E-EY spray dried at 140°C,
DEY-150= E-EY spray dried at 150°C, MO-EY-130= E-MO-EY spray dried at 130°C, MO-EY-140= E-MO-EY spray dried at 140°C
, MO-EY-150= E-MO-EY spray dried at 150°C, SO-EY-130= E-SO-EY spray dried at 130°C, SO-EY-140= E-SO-EY spray dried at
140°C, SO-EY-150 = E-SO-EY spray dried at 150°C.

81
Table A.7 Summary of inlet and ambient air conditions for spray drying E-EY, E-MO-EY, and E-SO-EY***
Parameter DEY-130 DEY-140 DEY-150 MO-EY-130 MO-EY-140 MO-EY-150 SO-EY-130 SO-EY-140 SO-EY-150
Ambient air temperature
(AAT) (°C) 23.40±0.40 22.07±0.49 21.10±0.26 23.40±0.40 22.07±0.49 21.10±0.26 23.40±0.40 22.07±0.49 21.10±0.26
Outlet air velocity (km/h) 73.46±0.57 77.16±0.02 76.19±0.06 71.13±0.02 74.16±0.02 76.19±0.06 69.19±0.08 70.16±0.02 70.24±0.04
Internal pipe diameter (m) 0.034 0.034 0.034 0.034 0.034 0.034 0.034 0.034 0.034
Volumetric flow rate of
inlet air (m3/h)
66.70±0.52 70.06±0.01 69.17±0.05 64.58±0.02 67.33±0.01 69.17±0.05 62.82±0.07 63.70±0.01 63.78±0.04
Relative humidity of inlet
air (%) 46.67±1.15 46.53±0.38 49.59±0.50 46.67±1.15 46.53±0.38 49.59±0.50 46.67±1.15 46.53±0.38 49.59±0.50
Partial pressure exerted
by water vapor (kPa) 1.39±0.03 1.27±0.01 1.36±0.01 1.39±0.03 1.27±0.01 1.36±0.01 1.39±0.03 1.27±0.01 1.36±0.01
Saturation pressure of
water vapor (kPa)* 2.985 2.736 2.736 2.985 2.736 2.736 2.985 2.736 2.736
Absolute humidity x 10-3
(kg water/kg dry air) 8.67±0.22 7.91±0.07 8.44±0.09 8.67±0.22 7.91±0.07 8.44±0.09 8.67±0.22 7.91±0.07 8.44±0.09
Specific volume of inlet
air (m3/kg dry air)
0.85±0.00 0.85±0.00 0.84±0.00 0.85±0.00 0.85±0.00 0.84±0.00 0.85±0.00 0.85±0.00 0.84±0.00
Mass flow rate (kg dry
air/h) 78.44±0.49 82.86±0.16 82.02±0.06 75.95±0.13 79.64±0.16 82.02±0.06 73.88±0.12 75.35±0.15 75.62±0.02
Specific heat of dry air at
AAT (kJ/kg K)* 1.0124 1.0122 1.0121 1.0124 1.0122 1.0121 1.0124 1.0122 1.0121
Specific heat of water
vapor at AAT(kJ/kg K)** 1.88 1.88 1.88 1.88 1.88 1.88 1.88 1.88 1.88
Temperature of drying air
(K) 403±2.60 413±2.00 423±1.50 403±3.00 413.00±2.00 423.00±1.50 403±3.00 413±2.00 423±1.50
*Obtained from appendix A 4.2 and A 4.4, respectively (Singh and Heldman 2001).
** Selected as 1.88 kJ/(kg K) according to Singh and Heldman (2001). ***
Values are means ± SD of triplicate determination.
See Table A.6 for a brief description of DEY-130, DEY-140, DEY-150, MO-EY-130, MO-EY-140, MO-EY-150, SO-EY-130, SO-
EY-140, and SO-EY-150.
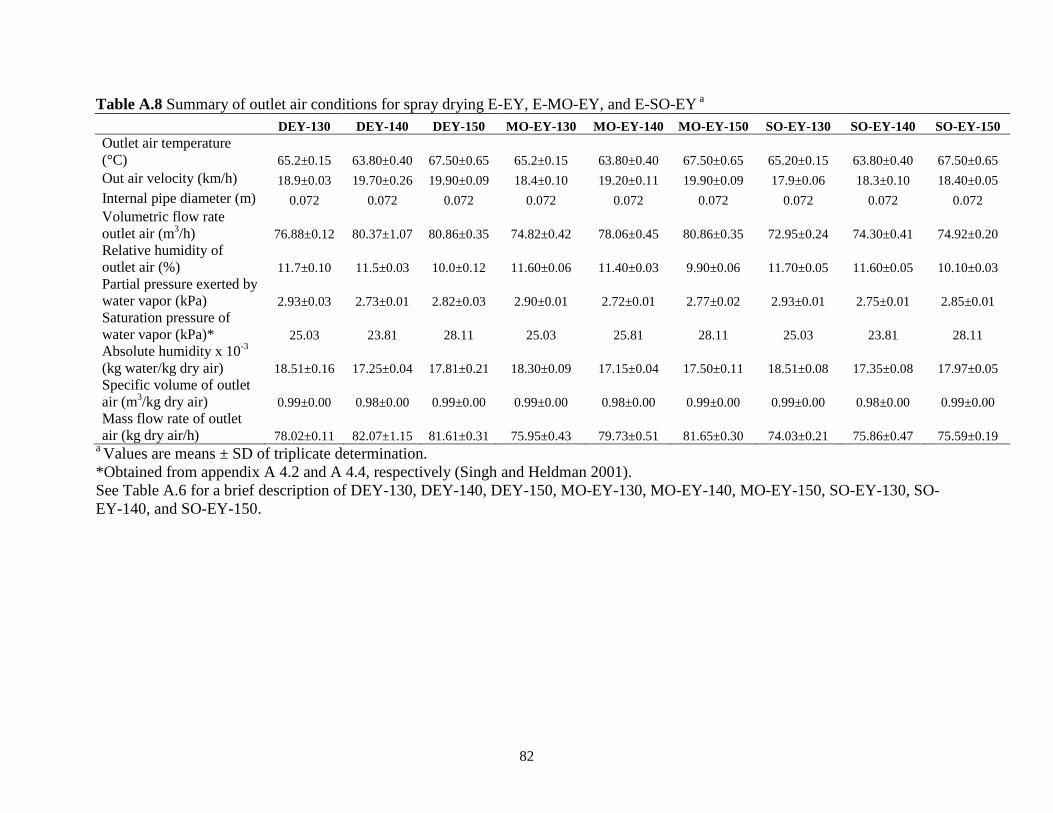
82
Table A.8 Summary of outlet air conditions for spray drying E-EY, E-MO-EY, and E-SO-EY a
DEY-130 DEY-140 DEY-150 MO-EY-130 MO-EY-140 MO-EY-150 SO-EY-130 SO-EY-140 SO-EY-150
Outlet air temperature
(°C) 65.2±0.15 63.80±0.40 67.50±0.65 65.2±0.15 63.80±0.40 67.50±0.65 65.20±0.15 63.80±0.40 67.50±0.65
Out air velocity (km/h) 18.9±0.03 19.70±0.26 19.90±0.09 18.4±0.10 19.20±0.11 19.90±0.09 17.9±0.06 18.3±0.10 18.40±0.05
Internal pipe diameter (m) 0.072 0.072 0.072 0.072 0.072 0.072 0.072 0.072 0.072
Volumetric flow rate
outlet air (m3/h) 76.88±0.12 80.37±1.07 80.86±0.35 74.82±0.42 78.06±0.45 80.86±0.35 72.95±0.24 74.30±0.41 74.92±0.20
Relative humidity of
outlet air (%) 11.7±0.10 11.5±0.03 10.0±0.12 11.60±0.06 11.40±0.03 9.90±0.06 11.70±0.05 11.60±0.05 10.10±0.03
Partial pressure exerted by
water vapor (kPa) 2.93±0.03 2.73±0.01 2.82±0.03 2.90±0.01 2.72±0.01 2.77±0.02 2.93±0.01 2.75±0.01 2.85±0.01
Saturation pressure of
water vapor (kPa)* 25.03 23.81 28.11 25.03 25.81 28.11 25.03 23.81 28.11
Absolute humidity x 10-3
(kg water/kg dry air) 18.51±0.16 17.25±0.04 17.81±0.21 18.30±0.09 17.15±0.04 17.50±0.11 18.51±0.08 17.35±0.08 17.97±0.05
Specific volume of outlet
air (m3/kg dry air) 0.99±0.00 0.98±0.00 0.99±0.00 0.99±0.00 0.98±0.00 0.99±0.00 0.99±0.00 0.98±0.00 0.99±0.00
Mass flow rate of outlet
air (kg dry air/h) 78.02±0.11 82.07±1.15 81.61±0.31 75.95±0.43 79.73±0.51 81.65±0.30 74.03±0.21 75.86±0.47 75.59±0.19 a Values are means ± SD of triplicate determination.
*Obtained from appendix A 4.2 and A 4.4, respectively (Singh and Heldman 2001).
See Table A.6 for a brief description of DEY-130, DEY-140, DEY-150, MO-EY-130, MO-EY-140, MO-EY-150, SO-EY-130, SO-
EY-140, and SO-EY-150.

83
Table A.9 Estimated evaporation rates and energy used to spray dry the egg yolk emulsions*
Inlet
Temp (°C) E-EY E-MO-EY E-SO-EY
Evaporation rate (kg
water/h)1
130 0.76±0.01aA
0.73±0.02aA
0.73±0.02aA
140 0.76±0.02aA
0.74±0.01aAB
0.72±0.01aB
150 0.76±0.01aA
0.74±0.01aAB
0.72±0.01aB
Evaporation rate (kg
water/h)2
130 0.77±0.00aA
0.73±0.01aB
0.72±0.01aB
140 0.77±0.00aA
0.73±0.01aB
0.72±0.01aB
150 0.77±0.00aA
0.73±0.01aB
0.72±0.01aB
Energy required to
spray dry CJP
(kJ/kg)
130 8599.90±53.66cA
8326.81±14.15cB
8099.70±13.67cC
140 10043.35±19.66bA
9652.88±18.97bB
9132.25±18.04bC
150 10869.33±7.71aA
10869.33±7.71aA
10021.41±2.46aB
*Values are means ± SD of triplicate determination.
1Calculated based on the moisture uptake by
the dry air (kg water/h). 2Calculated based on the moisture content of the E-EY/E-MO-EY/E-SO-
EY emulsions, powder collected through collector vessel, and dust (kg water/h). abc
Means with
same letter in each column are not significant different (p<0.05). ABC
Means with same letter in
each row are not significant different (p<0.05). See Table 4.2 for brief description of E-EY,E-
MO-EY and E-SO-EY.
Table A.10 Color and microencapsulation efficiency (ME) of EY, MO-EY, and SO-EY*
Inlet temp. (°C) DEY MO-EY SO-EY
L*
130 90.18±0.01aA
89.10±0.01bB
88.01±0.02aC
140 86.89±0.01cB
89.30±0.01aA
85.77±0.00cC
150 89.80±0.01bA
85.71±0.01cC
86.88±0.01bB
a*
130 2.69±0.02bB
1.78±0.02bC
3.70±0.01bA
140 3.19±0.01aA
2.21±0.02aB
0.63±0.01cC
150 2.63±0.01cB
0.11±0.00cC
3.77±0.02aA
b*
130 25.30±0.01bB
27.78±0.01aA
25.32±0.02bB
140 27.28±0.01aB
27.57±0.01bA
23.91±0.01cC
150 23.24±0.01cB
13.98±0.02cC
26.35±0.03aA
Hue
130 83.92±0.05aB
86.33±0.03bA
81.68±0.02cC
140 83.32±0.03cC
85.41±0.04cB
88.48±0.04aA
150 83.54±0.03bB
89.55±0.00aA
81.84±0.04bC
Chroma
130 25.44±0.01bC
27.84±0.01aA
25.59±0.02bB
140 27.46±0.00aB
27.66±0.01bA
23.92±0.02cC
150 23.39±0.00cB
13.98±0.02cC
26.62±0.02Aa
Microencapsulation
Efficiency (%)
130 72.33±0.50aA
47.22±0.43aB
46.61±0.60aB
140 70.63±0.15bA
47.36±0.33aB
47.03±0.23aB
150 70.23±0.15bA
47.48±0.42aB
47.61±0.46aB
*Values are means ± SD of triplicate determination. abc
means with different letters in each
column are significantly different (p< 0.05).AB
means with different letters in each row are
significantly different (p< 0.05). DEY = egg yolk powder; MO-EY= egg yolk powder containing
menhaden oil; SO-EY= egg yolk powder containing salmon oil.

84
Table A.11 FAMEs profile of DEY (% of total integrated area)*
FAME
(%)
Inlet Temperature (°C)
130 140 150
14:0 0.38±0.00 0.39±0.01 0.39±0.00
16:0 26.31±0.07 26.22±0.02 26.70±0.08
16:1n7 2.51±0.02 2.58±0.00 2.65±0.00
17:0 0.21±0.01 0.20±0.00 0.20±0.01
18:0 10.46±0.45 10.22±0.19 9.75±0.24
18:1n9c 38.35±0.62 38.87±0.18 38.83±0.26
18:1n5 1.45±0.01 1.51±0.00 1.49±0.01
18:2n6c 16.82±0.10 16.42±0.01 16.30±0.06
18:3n3 0.45±0.01 0.45±0.00 0.44±0.00
20:1n9 --- --- 0.29±0.03
20:4n6 1.62±0.07 1.65±0.01 1.50±0.04
22:5n6 0.39±0.04 0.42±0.00 0.45±0.04
22:6n3 0.46±0.02 0.47±0.02 0.47±0.04
*Values are means ± SD of triplicate determination. DEY= egg yolk powder.
Table A.12 FAMEs profile of MO-EY (% of total integrated area)*
FAME
(%)
Inlet Temperature (°C)
130 140 150
14:0 4.75±0.09 3.69±0.04 4.09±0.02
15:0 0.47±0.01 0.37±0.01 0.42±0.00
16:0 22.68±0.63 24.10±0.11 24.47±0.13
16:1n7 7.98±0.16 6.77±0.04 6.93±0.02
17:1n11 0.66±0.03 0.48±0.00 0.51±0.01
18:0 6.94±0.27 7.94±0.17 7.72±0.07
18:1n9c 21.96±0.51 26.61±0.34 25.31±0.09
18:1n5 2.37±0.02 2.15±0.00 2.19±0.01
18:2n6c 8.70±0.04 10.93±0.04 10.32±0.04
18:3n3 1.14±0.03 0.97±0.01 1.01±0.01
20:4n6 1.50±0.01 1.57±0.02 1.46±0.01
20:3n3 0.98±0.02 --- ---
20:5n3 7.71±0.26 5.66±0.07 6.06±0.07
22:5n3 1.57±0.05 1.17±0.03 1.25±0.01
22:6n3 7.72±0.20 5.86±0.05 6.17±0.04
*Values are means ± SD of triplicate determination. MO-EY= egg yolk powder containing
menhaden oil.

85
Table A.13 FAMEs profile of SO-EY (% of total integrated area)*
FAME
(%)
Inlet Temperature (°C)
130 140 150
14:0 2.43±0.02 2.33±0.01 2.36±0.02
16:0 21.05±0.14 21.40±0.06 20.97±0.13
16:1n7 4.21±0.02 4.10±0.01 4.09±0.04
18:0 6.82±0.06 7.10±0.01 6.81±0.04
18:1n9c 27.18±0.14 27.73±0.01 27.32±0.09
18:1n5 2.07±0.01 2.05±0.00 2.06±0.02
18:2n6c 10.01±0.07 10.57±0.00 10.57±0.06
18:3n3 0.75±0.00 0.74±0.00 0.76±0.01
20:1n9 4.86±0.01 4.65±0.01 4.77±0.05
20:4n6 1.16±0.00 1.26±0.01 1.19±0.01
20:3n3 0.79±0.00 0.78±0.01 0.76±0.01
20:5n3 5.13±0.01 4.90±0.01 5.03±0.13
22:5n3 1.08±0.02 1.03±0.02 1.05±0.01
22:6n3 5.28±0.02 5.04±0.02 5.12±0.05
*Values are means ± SD of triplicate determination. SO-EY= egg yolk powder containing
salmon oil.
Table A.14 FFA and TBARS of egg yolk powders*
FFA (%) TBARS (mmol/kg oil)
DEY-130 0.31±0.03a 0.05±0.02
a
DEY-140 0.35±0.03a 0.04±0.01
a
DEY-150 0.38±0.03a 0.05±0.01
a
MO-EY-130 0.71±0.03a 0.14±0.00
b
MO-EY-140 0.77±0.04a 0.15±0.00
a
MO-EY-150 0.78±0.04a 0.15±0.00
a
SO-EY-130 0.81±0.06a 0.14±0.00
b
SO-EY-140 0.80±0.07a 0.14±0.00
b
SO-EY-150 0.81±0.07a 0.15±0.00
a
*Values are means ± SD of triplicate determination. abc
means with different letters in each
column are significantly different (p< 0.05).ABC
means with different letters in each row are
significantly different (p< 0.05). See Table A.6 for a brief description of DEY-130, DEY-140,
DEY-150, MO-EY-130, MO-EY-140, MO-EY-150, SO-EY-130, SO-EY-140, and SO-EY-150.

86
Table A.15 Nutritional properties of DEY, MO-EY, and SO-EY*
Inlet temp. (°C) DEY MO-EY SO-EY
Moisture (%)
130 4.59±0.20aA
4.72±0.19aA
4.78±0.22aA
140 4.47±0.12aA
4.32±0.10aA
4.20±0.20bA
150 3.69±0.19bB
4.32±0.22aA
4.10±0.12bAB
Protein (g/100 g, dry
basis)
130 33.54 12.89 14.25
140 33.15 13.73 14.15
150 34.13 14.41 14.26
Lipids (g/100 g, dry
basis)
130 62.63±0.94 aC
85.78±0.17 aA
84.18±0.09bB
140 63.94±1.29 aB
85.31±0.39 aA
85.20±0.35aA
150 63.68±1.43 aB
85.66±0.59 aA
84.77±0.27abA
Ash (g/100 g, dry
basis)
130 4.43±0.11 aA
2.58±0.05 aC
2.96±0.04 aB
140 4.27±0.08 aA
2.56±0.06 aC
2.90±0.09 aB
150 4.45±0.26 aA
2.60±0.03 aB
2.84±0.03 aB
Water activity (aw)
130 0.320±0.004 aA
0.313±0.004 aA
0.298±0.003 aB
140 0.285±0.002 bA
0.276±0.003 bB
0.263±0.002 bC
150 0.225±0.004 cB
0.240±0.003 cA
0.225±0.003 cB
*Values are means ± SD of triplicate determination. abc
means with different letters in each
column are significantly different (p< 0.05).ABC
means with different letters in each row are
significantly different (p< 0.05). DEY= egg yolk powder, MO-EY= egg yolk powder containing
menhaden oil, SO-EY= egg yolk powder containing salmon oil.

87
Table A.16 Amino acid profile of DEY, MO-EY, and SO-EY*
Amino acid
(mg/g
protein)
DEY MO-EY SO-EY
Inlet Temp. (°C) Inlet Temp. (°C) Inlet Temp. (°C)
130 140 150 130 140 150 130 140 150
Aspartic acid 107.68 103.66 109.56 98.23 100.28 9905.59 102.24 101.13 101.22
Threoninea 55.05 54.39 55.61 50.84 51.19 5120.44 52.04 50.53 50.69
Serine 66.72 65.48 67.22 84.58 86.43 8673.48 87.65 84.95 85.10
Glutamic acid 85.60 95.83 84.01 95.83 87.65 9303.24 93.60 88.81 85.13
Proline 31.28 31.58 31.45 34.58 34.92 3588.54 35.24 35.67 32.62
Glycine 27.79 27.88 27.67 25.88 25.93 2626.13 26.61 25.80 25.63
Alanine 45.68 46.39 45.85 45.44 45.58 4644.89 47.25 45.60 45.21
Valinea 62.41 60.86 63.62 61.46 61.26 6080.32 62.93 60.25 61.76
Methioninea 25.39 25.07 26.05 27.18 27.16 2677.31 28.00 39.46 27.17
Isoleucinea 51.59 50.69 52.92 53.34 53.17 5277.96 54.82 52.38 53.65
Leucinea 89.14 88.64 90.71 87.31 87.53 8796.23 90.00 87.32 87.99
Tyrosinea 45.67 45.77 46.69 43.71 44.30 4428.64 46.09 44.85 45.76
Phenylalaninea 50.51 50.09 52.07 44.74 45.80 4418.30 47.94 45.46 47.46
Histidinea 22.06 21.59 22.56 26.43 26.63 2644.84 27.57 27.38 27.63
Lysinea 97.72 97.45 99.28 89.17 90.13 9103.22 92.72 88.93 88.52
Arginine 63.07 61.71 64.46 76.34 76.54 7661.09 78.26 75.28 76.96
TEAA 364.73 360.14 372.11 353.16 355.34 35322.38 366.02 364.39 356.88
TAA 927.38 927.08 939.73 945.08 944.48 94950.21 972.95 953.80 942.51
*Values are means of triplicate determinations. See Table A.10 for brief description of DEY, MO-EY, and SO-EY. TEAA= total
essential amino acids; TAA= total amino acids a
Essential amino acids
**Cysteine and tryptophan were not quantified.

88
Table A.17 Mineral profile of egg yolk powders*
DEY MO-EY SO-EY Recommended
dietary allowance
for mineral
(mg/day)a
Inlet Temp. (°C) Inlet Temp. (°C) Inlet Temp. (°C)
130 140 150 130 140 150 130 140 150
P (g/100 g powder) 0.61 0.64 0.65 0.49 0.59 0.57 0.55 0.58 0.58 800/1400
K (g/100 g powder) 0.50 0.40 0.08 0.22 0.19 0.27 0.22 0.45 0.36 2000/3500
Ca (g/100 g powder) 0.07 0.07 0.07 0.18 0.22 0.21 0.21 0.22 0.24 800/900
Mg (g/100 g powder) 0.01 0.01 0.01 0.02 0.02 0.02 0.02 0.02 0.02 350/350
Cu (mg/100 g powder) <.01 0.18 0.22 1.63 1.71 1.82 1.86 1.86 2.14 1.5/3.0
Zn (mg/100 g powder) <1 <1 <1 56 60 57 57 61 65 10/15
Mn (mg/100 g powder) <1 <1 <1 2 2 3 2 3 2
Fe (mg/100 g powder) <1 <1 <1 55 49 59 48 53 67 12/12
As (mg/100 g powder) <0.40 <.40 <.40 <.40 <.40 <0.40 2.20 3.23 2.19
Pb (mg/100 g powder) <.01 <.01 <.01 <.01 <.01 <.01 <.01 <.01 <.01
*Values are means of triplicate determinations. See Table A.6 for a brief description of DEY-130, DEY-140, DEY-150, MO-EY-130,
MO-EY-140, MO-EY-150, SO-EY-130, SO-EY-140, and SO-EY-150. aCompiled from Brounds (1993) for male athletes from 25 to 50 years old.

89
APPENDIX B. RESULTS OF THE PRODUCTION AND PROCESS OF
MICROENCAPSULATED OMEGA-3 FISH OIL WITH WHOLE EGG POWDER
Table B.1 Proximate composition of whole egg (WE)a
Whole egg (WE)
Moisture (%) (wet basis) 77.11±0.11
Total lipids (g/100 g, dry basis) 43.44±0.29
Protein (g/100 g, dry basis) 52.33±0.21
Ash (g/100 g, dry basis) 4.02±0.10 aValues are means and SD of triplicate determination.
Table B.2 Color values and emulsion oxidation of E-WE, E-MO-WE, and E-SO-WE*
E-WE E-MO-WE E-SO-WE
L* 72.31±0.05c 84.57±0.01
a 80.90±0.09
b
a* 3.58±0.04a -0.10±0.04
c 0.71±0.02
b
b* 22.82±0.30a 18.74±0.12
b 10.17±0.05
c
Chroma 23.10±0.31a 18.74±0.12
b 10.19±0.05
c
Hue angle 81.08±0.04c 90.32±0.13
a 86.01±0.08
b
TBARS (mmol/kg emulsion) 0.01±0.00b 0.05±0.01
a 0.05±0.01
a
*Values are means and SD of triplicate determination.
abc means with different letters in each row
are significantly different (p< 0.05). E-WE = whole egg emulsion, E-MO-WE = emulsion
containing whole egg and menhaden oil, E-SO-WE= emulsion containing whole egg and salmon
oil. TBARS = Thiobarbituric acid-reactive substances.
Table B.3 Flow behavior properties of E-WE*
Temperature (°C) n K(Pa.sn)
Apparent Viscosity (Pa s)
at 100-1
(Shear rate)
5 0.49±0.03c 0.54±0.08
a 0.006±0.003
a
15 0.63±0.01b 0.03±0.01
b 0.003±0.000
b
25 0.76±0.08a 0.01±0.00
c 0.003±0.000
b
*Values are means and SD of triplicate determination.
abc means with different letters in each
column are significantly different (p< 0.05). n = flow index, K = consistency index. E-WE=
whole egg emulsion.
Table B.4 Flow behavior properties of E-MO-WE*
Temperature (°C) n K(Pa.sn)
Apparent Viscosity (Pa s)
at 100-1
(Shear rate)
5 0.66±0.03c 0.014±0.002
a 0.004±0.000
a
15 0.77±0.02b 0.010±0.001
b 0.003±0.000
b
25 0.92±0.03a 0.004±0.001
c 0.003±0.000
c
*Values are means and SD of triplicate determination.
abc means with different letters in each
column are significantly different (p< 0.05). n = flow index, K = consistency index. MO-EY=
emulsion containing whole egg and menhaden oil.

90
Table B.5 Flow behavior properties of E-SO-WE*
Temperature (°C) n K(Pa.sn)
Apparent Viscosity (Pa s)
at 100-1
(Shear rate)
5 0.84±0.06a 0.008±0.003
a 0.004±0.000
a
15 0.84±0.02a 0.005±0.001
a 0.002±0.000
b
25 0.93±0.03a 0.003±0.000
a 0.002±0.000
b
*Values are means and SD of triplicate determination.
abc means with different letters in each
column are significantly different (p< 0.05). n = flow index, K = consistency index. E-SO-EY=
emulsion containing whole egg and salmon oil.
Figure B.1 Apparent viscosity of E-WE as a function of shear rate.
E-EW = whole egg emulsion
Figure B.2 Apparent viscosity of E-MO-WE as a function of shear rate.
E-MO-WE = emulsion containing whole egg and menhaden oil.
0.00E+00
1.00E-03
2.00E-03
3.00E-03
4.00E-03
5.00E-03
6.00E-03
7.00E-03
8.00E-03
0 50 100 150 200 250
Sh
ear
vis
cosi
ty (
Pa s
)
Shear rate (1/s)
5 °C
15 °C
25 °C
0.00E+00
5.00E-04
1.00E-03
1.50E-03
2.00E-03
2.50E-03
3.00E-03
3.50E-03
4.00E-03
4.50E-03
0 50 100 150 200 250
Sh
ear
vis
cosi
ty (
Pa s
)
Shear rate (1/s)
5 °C
15 °C
25 °C

91
Figure B.3 Apparent viscosity of E-SO-WE as a function of shear rate.
E-SO-WE= emulsion containing whole egg and salmon oil.
Figure B.4 Viscoelastic properties of E-WE.
E-WE = whole egg emulsion; G’=storage modulus; G’’=loss modulus.
0.00E+00
1.00E-03
2.00E-03
3.00E-03
4.00E-03
5.00E-03
6.00E-03
7.00E-03
8.00E-03
9.00E-03
0 50 100 150 200 250
Sh
ear
vis
cosi
ty (
Pa s
)
Shear rate (1/s)
5 °C
15 °C
25 °C
0.1
1
1 10 100
G'G
"(P
a)
Frequency (rad/s)
G'
G''

92
Figure B.5 Viscoelastic properties of E-MO-WE.
E-MO-WE= emulsion containing whole egg and menhaden oil; G’=storage modulus; G’’=loss
modulus.
Figure B.6 Viscoelastic properties of E-SO-WE.
E-SO-WE= emulsion containing whole egg and salmon oil; G’=storage modulus; G’’=loss
modulus.
0.01
0.1
1
1 10 100
G'G
'' (
Pa)
Frequency (rad/s)
G'
G''
0.01
0.1
1
1 10 100
G'G
'' (
Pa)
Frequency (rad/s)
G'
G''

93
Table B.6 Data for the estimation of the production rate of whole egg powders*
Moisture
content (wet
basis, %)
Moisture content
(dry basis, kg
water/kg dry solids)
Mass flow
rate x 103
(kg/h)
Mass flow rate
x 103 (dry basis,
kg dry solids/h)
Estimated
production rate x
103 (kg dry solids/h)
E-WE 89.34±0.02 8.38±0.01 810.00±10.00 87.44±0.13
DWE-130
Powder 3.66±0.69 0.04±0.01 68.70±0.10 66.19±0.48 79.94±0.12
Dust 6.21±0.04 0.07±0.00 8.00±1.00 7.50±0.00
DWE-140
Powder 3.56±0.10 0.04±0.00 68.48±0.02 66.04±0.07 78.06±0.13
Dust 6.22±0.04 0.07±0.00 10.00±2.00 9.38±0.00
DWE-150
Powder 2.49±0.17 0.03±0.00 68.00±0.20 66.50±0.12 76.69±0.14
Dust 2.32±0.22 0.02±0.00 11.00±2.00 10.74±0.02
E-MO-WE 89.34±0.02 8.38±0.01 790.00±10.00 84.24±1.03
MO-WE-130
Powder 3.66±0.69 0.04±0.01 68.10±0.52 65.61±0.36 75.80±1.97
Dust 6.21±0.04 0.07±0.00 9.00±1.00 8.44±0.94
MO-WE-140
Powder 3.56±0.10 0.04±0.00 68.47±0.06 66.3±0.04 72.67±3.39
Dust 6.22±0.04 0.07±0.00 12.33±2.52 11.57±2.36
MO-WE-150
Powder 2.49±0.17 0.03±0.00 67.73±0.50 66.05±0.58 71.87±3.08
Dust 2.32±0.22 0.02±0.00 12.67±2.08 12.37±2.06
E-SO-WE 89.34±0.02 8.38±0.01 790.00±10.00 84.24±1.03
SO-WE-130
Powder 3.66±0.69 0.04±0.01 68.10±0.52 65.61±0.36 75.80±1.97
Dust 6.21±0.04 0.01±0.00 9.00±1.00 8.44±0.94
SO-WE-140
Powder 3.56±0.10 0.04±0.00 68.47±0.06 66.03±0.04 72.67±3.39
Dust 6.22±0.04 0.07±0.00 12.33±2.52 11.57±2.36
SO-WE-150
Powder 2.49±0.17 0.03±0.00 67.73±0.50 66.05±0.58 71.87±3.08
Dust 2.32±0.22 0.02±0.00 12.67±2.08 12.37±2.06
*Values are means ± SD of triplicate determination.DEW-130= E-WE spray dried at 130°C, DWE-140= E-WE spray dried at 140°C, DWE-150=
E-WE spray dried at 150°C, MO-WE-130= E-MO-WE spray dried at 130°C, MO-WE-140= E-MO-WE spray dried at 140°C , MO-WE-150= E-
MO-WE spray dried at 150°C, SO-WE-130= E-SO-WE spray dried at 130°C, SO-WE-140= E-SO-WE spray dried at 140°C, SO-WE-150 = E-
SO-WE spray dried at 150°C.

94
Table B.7 Summary of inlet air condition for spray drying E-WE, E-MO-WE, and E-SO-WE***
Parameter DWE-130 DWE-140 DWE-150 MO-WE-130 MO-WE-140 MO-WE-150 SO-WE-130 SO-WE-140 SO-WE-150
Ambient air temperature
(°C) 23.20±0.36 22.50±0.53 21.33±0.47 23.20±0.36 22.50±0.53 21.33±0.47 23.20±0.36 22.50±0.53 21.33±0.47
Inlet air velocity (km/h) 73.71±0.08 76.25±0.23 76.07±0.10 73.11±0.14 75.25±0.23 75.07±0.10 70.11±0.14 70.25±0.23 70.43±0.25
Internal pipe diameter
(m) 0.034 0.034 0.034 0.034 0.034 0.034 0.034 0.034 0.034
Volumetric flow rate of
inlet air (m3/h)
66.92±0.07 69.23±0.21 69.06±0.09 66.38±0.13 68.32±0.21 68.15±0.09 63.65±0.13 63.78±0.21 63.95±0.22
Relative humidity of
inlet air (%) 48.67±1.53 47.10±1.40 51.14±0.03 48.67±1.53 47.10±1.40 51.14±0.03 48.67±1.53 47.10±1.40 51.14±0.03
Partial pressure exerted
by water vapor (kPa) 1.45±0.05 1.26±0.04 1.30±0.00 1.45±0.05 1.26±0.04 1.30±0.00 1.45±0.05 1.26±0.04 1.30±0.00
Saturation pressure of
water vapor (kPa)* 2.985 2.673 2.537 2.985 2.673 2.537 2.985 2.673 2.537
Absolute humidity x 10-3
(kg water/kg dry air) 9.05±0.29 7.83±0.24 8.07±0.00 9.05±0.29 7.83±0.24 8.07±0.00 9.05±0.29 7.83±0.24 8.07±0.00
Specific volume of inlet
air (m3/kg dry air)
0.85±0.00 0.85±0.00 0.84±0.00 0.85±0.00 0.85±0.00 0.84±0.00 0.85±0.00 0.85±0.00 0.84±0.00
Mass flow rate (kg dry
air/h) 78.71±0.06 81.78±0.33 81.87±0.06 78.07±0.27 80.70±0.32 80.79±0.06 74.86±0.27 75.34±0.32 75.81±0.15
Specific heat of dry air
at 23.80 °C (kJ/kg K)* 1.0124 1.0123 1.0121 1.0124 1.0123 1.0121 1.0124 1.0123 1.0121
Specific heat of water
vapor at 23.80 °C (kJ/kg
K)**
1.88 1.88 1.88 1.88 1.88 1.88 1.88 1.88 1.88
Temperature of drying
air (K) 403±2.60 413±2.00 423±1.50 403.00±3.00 413±2.00 423.00±1.50 403±3.00 413±2.00 423±1.50
*Obtained from appendix A 4.2 and A 4.4, respectively (Singh and Heldman 2001).
** Selected as 1.88 kJ/(kg K) according to Singh and Heldman (2001). ***
Values are means ± SD of triplicate determination.
See Table B.6 for a brief description of DWE-130, DWE-140, DWE-150, MO-WE-130, MO-WE-140, MO-WE-150, SO-WE-130,
SO-WE-140, and SO-WE-150.

95
Table B.8 Summary of outlet air conditions for spray drying E-WE, E-MO-WE, and E-SO-WE a
DWE-130 DWE-140 DWE-150 MO-WE-130 MO-WE-140 MO-WE-150 SO-WE-130 SO-WE-140 SO-WE-150
Outlet air temperature
(°C) 65.00±0.80 64.40±0.51 67.30±0.46 65.00±0.80 64.40±0.51 67.30±0.46 65.00±0.80 64.40±0.51 67.30±0.46
Outlet air velocity (km/h) 19.1±0.10 19.70±0.27 19.80±0.10 18.90±0.10 19.30±0.05 19.60±0.05 18.2±0.05 18.20±0.06 18.50±0.11
Internal pipe diameter (m) 0.072 0.072 0.072 0.072 0.072 0.072 0.072 0.072 0.072
Volumetric flow rate of
outlet air (m3/h) 77.77±0.41 80.10±1.10 80.62±0.41 76.95±0.41 78.58±0.20 79.80±0.20 73.90±0.20 74.28±0.25 75.20±0.44
Relative humidity of
outlet air (%) 11.50±0.05 10.90±0.05 9.7±0.10 11.40±0.03 10.80±0.03 9.6±0.10 11.50±0.03 11.1±0.13 9.80±0.03
Partial pressure exerted
by water vapor (kPa) 2.88±0.01 2.65±0.01 2.70±0.03 2.86±0.01 2.64±0.01 2.67±0.03 2.88±0.01 2.70±0.03 2.74±0.01
Saturation pressure of
water vapor (kPa)* 25.03 24.419 27.86 25.03 24.419 27.86 25.03 24.42 27.86
Absolute humidity x 10-3
(kg water/kg dry air) 18.19±0.08 16.70±0.08 17.04±0.18 18.06±0.04 16.65±0.05 16.86±0.18 18.22±0.04 17.02±0.21 17.26±0.05
Specific volume of outlet
air (m3/kg dry air) 0.98±0.00 0.98±0.00 0.99±0.00 0.98±0.00 0.98±0.00 0.99±0.00 0.98±0.00 0.98±0.00 0.99±0.00
Mass flow rate of outlet
air (kg dry air/h) 79.01±0.37 81.73±1.04 81.50±0.48 78.20±0.53 80.18±0.16 80.70±0.16 75.08±0.03 75.75±0.28 76.00±0.46 a Values are means ± SD of triplicate determination.
*Obtained from appendix A 4.2 and A 4.4, respectively (Singh and Heldman 2001).
See Table B.6 for a brief description of DWE-130, DWE-140, DWE-150, MO-WE-130, MO-WE-140, MO-WE-150, SO-WE-130,
SO-WE-140, and SO-WE-150.

96
Table B.9 Estimated evaporation rates and energy used to spray dry whole egg emulsions*
Inlet Temp.
(°C) E-WE E-MO-WE E-SO-WE
Evaporation rate
(kg water/h)1
130 0.725±0.020 aA
0.706±0.025 aA
0.691±0.023 aA
140 0.725±0.005 aA
0.703±0.018 aA
0.699±0.005 aA
150 0.729±0.011 aA
0.709±0.014 aA
0.700±0.011 aA
Evaporation rate
(kg water/h)2
130 0.729±0.000 bA
0.702±0.009 aB
0.702±0.009 aB
140 0.729±0.000 bA
0.702±0.009 aB
0.702±0.009 aB
150 0.730±0.000 aA
0.704±0.009 aB
0.704±0.009 aB
Energy required
to spray dry CJP
(kJ/kg)
130 8623.97±6.55 cA
8553.79±29.77 cB
8202.78±29.20 cC
140 9873.04±39.25 bA
9743.56±39.07 bB
9096.15±38.15 bC
150 10638.94±7.62 aA
10499.08±7.51 aB
9851.02±18.85 aC
*Values are means ± SD of triplicate determination.
1Calculated based on the moisture uptake by
the dry air (kg water/h). 2Calculated based on the moisture content of the E-WE/E-MO-WE/E-
SO-WE emulsions, powder collected through collector vessel, and dust (kg water/h). abc
Means
with same letter in each column are not significant different (p<0.05). ABC
Means with same
letter in each row are not significant different (p<0.05). See table B.2 for brief description of E-
WE, E-MO-WE and E-SO-WE.
Table B.10 Color and microencapsulation efficiency (ME) of WE, MO-WE, and SO-WE*
Inlet Temp. (°C) DWE MO-WE SO-WE
L*
130 91.46±0.02 aA
86.65±0.01 aB
84.35±0.02 cC
140 92.90±0.01 aA
86.46±0.02 bB
85.21±0.01 bC
150 86.70±0.01 cA
85.65±0.03 cB
85.53±0.01 aC
a*
130 1.14±0.01 cC
3.42±0.02 cB
5.60±0.01 aC
140 1.31±0.02 bC
5.29 ±0.01 aA
2.21±0.01 cB
150 3.75±0.02 aC
4.18±0.01 bB
4.49±0.02 bA
b*
130 16.03±0.01 cC
19.20±0.02 cB
23.18±0.01 bA
140 18.25±0.01 bC
22.18±0.01 aB
22.21±0.01 cA
150 24.37±0.00 aA
21.10±0.01 bC
23.28±0.02 aB
Hue
130 85.93±0.03aA
79.91±0.05 aB
76.42±0.01 cC
140 85.88±0.07 aA
76.58±0.03 cC
84.32±0.02 aB
150 81.24±0.05 bA
78.79±0.02 bC
79.09±0.04 bB
Chroma
130 16.07±0.01 cC
19.50±0.01 cB
23.84±0.01 aA
140 18.30±0.01 bC
22.80±0.01 aA
22.32±0.01 cB
150 24.65±0.00 aA
21.51±0.01 bC
23.71±0.01 bB
Microencapsulation
Efficiency (%)
130 74.40±1.13 aA
54.69±0.06 bB
54.43±0.47 aB
140 73.50±0.66 aA
55.06±0.23 abB
54.63±0.06 aB
150 73.57±0.40 aA
55.09±0.14 aB
54.64±0.10 aB
*Values are means ± SD of triplicate determination. abc
means with different letters in each
column are significantly different (p< 0.05).AB
means with different letters in each row are
significantly different (p< 0.05). DWE= whole egg powder, MO-WE= whole egg powder
containing menhaden oil, SO-WE= whole egg powder containing salmon oil.

97
Table B.11 FAMEs profile of DWE (% of total integrated area)*
FAME
(%)
Inlet Temp. (°C)
130 140 150
14:00 0.41±0.00 0.38±0.01 0.41±0.00
16:00 26.64±0.16 26.41±0.03 26.17±0.19
16:1n7 2.54±0.03 2.48±0.02 2.65±0.04
18:00 10.37±0.19 10.21±0.04 10.14±0.45
18:1n9c 39.39±0.24 40.06±0.10 40.60±0.49
18:1n5 1.49±0.02 1.47±0.01 1.55±0.02
18:2n6c 16.54±0.06 15.52±0.08 15.25±0.05
18:3n3 0.45±0.01 0.44±0.03 0.42±0.01
20:4n6 1.60±0.04 1.52±0.03 1.38±0.06
22:5n3 0.39±0.01 0.39±0.01 0.36±0.02
22:6n3 0.40±0.02 0.43±0.03 0.39±0.01
*Values are means ± SD of triplicate determination. DWE= whole egg powder.
Table B.12 FAMEs profile of MO-WE (% of total integrated area)*
FAME
(%)
Inlet Temp. (°C)
130 140 150
14:0 5.63±0.02 4.59±0.05 5.20±0.01
15:0 0.55±0.00 0.46±0.00 0.53±0.00
16:0 21.98±0.54 23.82±0.06 24.26±0.17
16:1n7 8.82±0.03 7.64±0.06 7.77±0.07
17:1n11 0.80±0.01 0.61±0.01 0.61±0.01
18:0 6.23±0.32 7.25±0.05 6.85±0.15
18:1n9c 18.60±0.30 22.40±0.06 22.30±0.10
18:1n5 2.53±0.00 2.31±0.01 2.36±0.02
18:2n6c 6.61±0.20 9.55±0.09 8.65±0.01
18:3n3 1.24±0.01 1.09±0.01 1.12±0.01
20:4n6 1.33±0.06 1.45±0.01 1.22±0.03
20:3n3 1.17±0.02 0.93±0.01 0.94±0.01
20:5n3 9.20±0.22 7.11±0.06 7.13±0.08
22:5n3 1.84±0.02 1.45±0.01 1.45±0.02
22:6n3 9.00±0.09 7.21±0.04 7.05±0.06
*Values are means ± SD of triplicate determination. MO-WE= whole egg powder containing
menhaden oil.

98
Table B.13 FAMEs profile of SO-WE (% of total integrated area)*
FAME
(%)
Inlet Temp. (°C)
130 140 150
14:00 2.72±0.03 2.90±0.01 2.79±0.01
15:00 0.34±0.00 0.35±0.00 0.35±0.00
16:00 20.26±0.07 19.00±0.09 19.56±0.05
16:1n7 4.44±0.03 4.50±0.02 4.38±0.00
18:00 6.15±0.08 5.65±0.08 5.91±0.02
18:1n9c 25.47±0.09 24.96±0.02 25.73±0.02
18:1n5 2.19±0.02 2.25±0.01 2.19±0.01
18:2n6c 8.88±0.06 8.52±0.04 8.61±0.03
18:3n3 0.78±0.01 0.82±0.01 0.79±0.00
20:1n9 5.51±0.06 5.94±0.02 5.73±0.03
20:4n6 1.05±0.03 0.97±0.02 1.09±0.01
20:3n3 0.90±0.02 0.97±0.02 0.93±0.01
20:5n3 5.89±0.03 6.32±0.04 6.07±0.01
22:5n3 1.23±0.02 1.31±0.01 1.27±0.01
22:6n3 5.90±0.07 6.33±0.05 6.09±0.01
*Values are means ± SD of triplicate determination. SO-WE= whole egg powder containing
salmon oil.
Table B.14 FFA and TBARS of whole egg powders*
FFA (%) TBARS (mmol/kg oil)
DWE-130 0.21±0.03a 0.03±0.02
a
DWE-140 0.25±0.03a 0.03±0.01
a
DWE-150 0.28±0.03a 0.04±0.01
a
MO-WE-130 0.65±0.03a 0.15±0.00
b
MO-WE-140 0.66±0.04a 0.16±0.00
a
MO-WE-150 0.66±0.04a 0.16±0.00
a
SO-WE-130 0.69±0.06b 0.14±0.00
b
SO-WE-140 0.69±0.07b 0.15±0.00
a
SO-WE-150 0.70±0.07a 0.15±0.00
a
*Values are means ± SD of triplicate determination. abc
means with different letters in each
column are significantly different (p< 0.05).ABC
means with different letters in each row are
significantly different (p< 0.05). See Table B.6 for a brief description of DWE-130, DWE-140,
DWE-150, MO-WE-130, MO-WE-140, MO-WE-150, SO-WE-130, SO-WE-140, and SO-WE-
150.

99
Table B.15 Nutritional properties of DWE, MO-WE, and SO-WE*
Inlet Temp. (°C) DWE MO-WE SO-WE
Moisture (%)
130 6.79±0.27 aA
5.66±0.36 aB
5.51±0.05 aB
140 4.84±0.11 bC
5.56±0.10 aA
5.30±0.10 bB
150 4.50±0.25 bA
4.49±0.17 bA
4.59±0.09 cA
Protein (g/100 g, dry
basis)
130 50.152 19.786 20.186
140 49.879 19.853 20.089
150 48.248 20.185 20.845
Lipids (g/100 g, dry
basis)
130 42.11±0.27 aB
71.33±0.15 aA
71.08±0.04 aB
140 42.47±0.80 aB
72.16±0.26 bA
70.93±0.16 aA
150 42.58±1.29 aB
71.41±0.27 bA
70.43±0.21 bA
Ash (g/100 g, dry
basis)
130 3.40±0.05 aA
2.33±0.06 bB
2.32±0.06 aB
140 3.36±0.17 aA
2.53±0.16 abB
2.63±0.30 aB
150 3.26±0.04 aA
2.76±0.12 aB
2.81±0.07 bB
Water activity (aw)
130 0.329±0.003 aA
0.314±0.004 aB
0.318±0.004 aB
140 0.264±0.004 aA
0.265±0.002 bA
0.271±0.004 bA
150 0.226±0.003 aA
0.221±0.003 cA
0.225±0.004 cA
*Values are means ± SD of triplicate determination. abc
means with different letters in each
column are significantly different (p< 0.05).ABC
means with different letters in each row are
significantly different (p< 0.05). DWE= whole egg powder, MO-WE= egg yolk containing
menhaden oil, SO-WE= whole egg powder containing salmon oil.

100
Table B.16 Amino acid profile of DWE, MO-WE, and SO-WE powders*
Amino acid
(mg/g protein)
DWE MO-WE SO-WE
Inlet Temp. (°C) Inlet Temp. (°C) Inlet Temp. (°C)
130 140 150 130 140 150 130 140 150
Aspartic acid 111.65 111.05 110.06 107.48 106.17 104.74 106.31 104.59 101.59
Threoninea 51.80 51.46 51.46 50.23 49.30 48.70 49.48 48.42 49.46
Serine 75.19 74.61 73.74 80.46 79.84 78.54 79.31 77.57 79.27
Glutamic acid 97.50 100.53 96.04 85.38 87.36 90.86 91.65 90.72 104.07
Proline 34.27 33.98 33.05 32.72 33.11 33.00 33.71 32.70 35.15
Glycine 30.25 30.15 29.50 28.22 28.37 28.18 28.72 28.31 29.23
Alanine 52.22 52.37 51.06 48.62 48.73 48.85 49.67 48.94 51.40
Valinea 71.59 70.88 70.45 68.61 66.96 66.21 67.37 65.91 66.55
Methioninea 37.63 37.31 36.53 34.64 34.34 34.25 35.04 34.25 34.99
Isoleucinea 55.42 55.10 54.89 54.62 53.38 52.87 53.68 52.33 53.52
Leucinea 94.95 94.66 94.25 90.28 89.44 89.05 90.59 88.90 90.42
Tyrosinea 45.41 45.26 45.20 43.22 43.05 42.84 43.26 42.86 43.22
Phenylalaninea 65.30 64.62 63.80 57.82 57.47 57.25 58.47 57.01 58.33
Histidinea 25.64 25.28 25.07 25.12 25.61 25.31 25.59 25.21 25.75
Lysinea 77.85 77.06 77.60 76.56 75.68 74.79 76.65 74.45 74.42
Arginine 65.56 64.50 64.07 70.40 68.93 68.28 68.89 67.40 68.75
TEAA 525.59 521.63 519.24 501.10 495.23 491.26 500.14 489.33 496.66
TAA 992.24 988.81 976.76 954.39 947.72 943.70 958.40 939.56 966.11
*Values are means of triplicate determinations. See table B.10 for brief description of DWE, MO-WE, and SO-WE. TEAA= total
essential amino acids; TAA= total amino acids a
Essential amino acids
**Cysteine and tryptophan were not quantified.
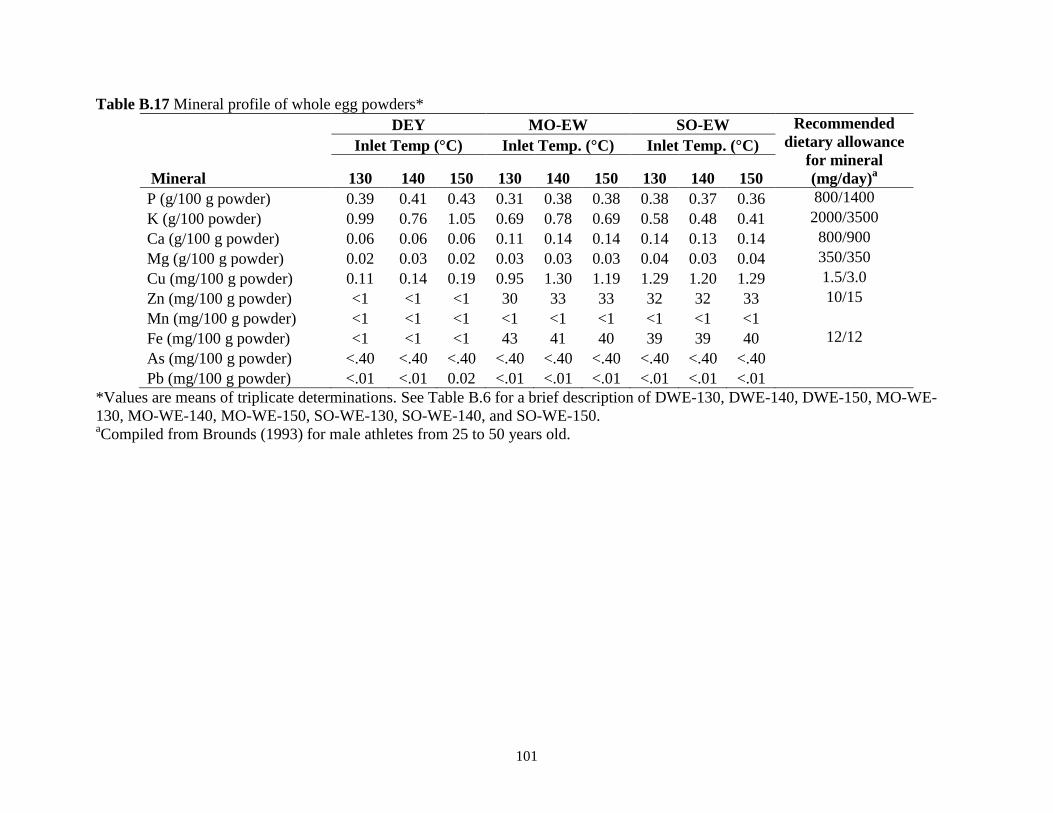
101
Table B.17 Mineral profile of whole egg powders*
Mineral
DEY MO-EW SO-EW Recommended
dietary allowance
for mineral
(mg/day)a
Inlet Temp (°C) Inlet Temp. (°C) Inlet Temp. (°C)
130 140 150 130 140 150 130 140 150
P (g/100 g powder) 0.39 0.41 0.43 0.31 0.38 0.38 0.38 0.37 0.36 800/1400
K (g/100 powder) 0.99 0.76 1.05 0.69 0.78 0.69 0.58 0.48 0.41 2000/3500
Ca (g/100 g powder) 0.06 0.06 0.06 0.11 0.14 0.14 0.14 0.13 0.14 800/900
Mg (g/100 g powder) 0.02 0.03 0.02 0.03 0.03 0.03 0.04 0.03 0.04 350/350
Cu (mg/100 g powder) 0.11 0.14 0.19 0.95 1.30 1.19 1.29 1.20 1.29 1.5/3.0
Zn (mg/100 g powder) <1 <1 <1 30 33 33 32 32 33 10/15
Mn (mg/100 g powder) <1 <1 <1 <1 <1 <1 <1 <1 <1
Fe (mg/100 g powder) <1 <1 <1 43 41 40 39 39 40 12/12
As (mg/100 g powder) <.40 <.40 <.40 <.40 <.40 <.40 <.40 <.40 <.40
Pb (mg/100 g powder) <.01 <.01 0.02 <.01 <.01 <.01 <.01 <.01 <.01
*Values are means of triplicate determinations. See Table B.6 for a brief description of DWE-130, DWE-140, DWE-150, MO-WE-
130, MO-WE-140, MO-WE-150, SO-WE-130, SO-WE-140, and SO-WE-150. aCompiled from Brounds (1993) for male athletes from 25 to 50 years old.

102
VITA
Kevin Estuardo Mis Solval was born in November 1986, in Samayac, Suchitepequez,
Guatemala. He graduated from high school at Escuela Nacional Central de Agricultura in 2002.
In December 2009 he obtained his Bachelor of Science in Food Science and Technology from
Escuela Agricola Panamericana, El Zamorano, Honduras. In the spring of 2008, he successfully
completed an undergraduate internship at the Department of Food Science at Louisiana State
University and Agricultural and Mechanical College under the supervision of Dr. Subramaniam
Sathivel. He joined Dr. Sathivel’s research group as a master student in the spring of 2009.
Kevin Mis is experienced in the production of biodiesel, supercritical fluid extraction and the
spray drying technologies. He is set to obtain his master’s degree in food science in May 2011.
Kevin enjoys being active by traveling, swimming, and cooking.
Related Documents