Spotlight on the New Wealth Builders The Economist Intelligence Unit, sponsored by Citi, uncovers the growth dynamics, lifestyles, values, and investing habits of the world’s fastest-growing wealth segment

Welcome message from author
This document is posted to help you gain knowledge. Please leave a comment to let me know what you think about it! Share it to your friends and learn new things together.
Transcript
Spotlight on the New Wealth BuildersThe Economist Intelligence Unit, sponsored by Citi, uncovers the growth dynamics, lifestyles, values, and investing habits of the world’s fastest-growing wealth segment
2 Spotlight on the New Wealth Builders
New Wealth Builders, the fastest-growing wealth segment, focus on making progress for themselves and others
A new and robust wealth class has appeared on the global economic scene with little fanfare. These are the New Wealth Builders (NWBs) — households with financial assets of $100,000 to $2 million.
NWBs were barely on the economic radar as this century began; today, however, they constitute a formidable and hardworking segment driving growth and economic expansion in vibrant communities throughout the world.
As self-made professionals, corporate executives, and entrepreneurs, New Wealth Builders defy stereotypes. They make progress through hard work and philanthropy and they embody the positive aspects of globalization. As global prosperity unfolds in new regions and populations, they are projected to be an important engine of growth.
To obtain unique insight into this wealth segment, the Economist Intelligence Unit (EIU), sponsored by Citi, determined the size of the New Wealth Builder market and forecasted its growth across 32 countries. Additionally, a global survey was conducted to find out more about their lifestyles, beliefs, and core values, while gleaning insights related to their sources of financial counsel and investing habits.
3 Spotlight on the New Wealth Builders
Table of contents
1.�� The�fastest-growing�global�wealth�group 4
New Wealth Builders (NWBs) are poised to grow in population and assets. Since 2010, the number of households in the NWB segment has grown faster than either the High Net Worth or Mass Market Segment.
Latin America and Asia Pacific set the regional growth pace for new households. And Asia Pacific — led by China and Japan — will dominate in NWB assets by 2020.
2.�What�makes�the�New�Wealth�Builders�different? 15
NWBs represent a new breed of self-generated success. They are global citizens with a generosity of spirit that focuses on making progress for those around them.
3.��Investment�strategies:�Building�blocks�for�success 19
NWBs are savvy investors who are focused on growth. Passion investing appeals to them as a means of establishing legacies for their heirs.
Conclusion 23
Appendix 24
The New Wealth Builder Scorecard ranks 32 countries.

4 Spotlight on the New Wealth Builders
2014 (000s)
2020(000s)
2010–2020 CAGR
2014 (USD, MM)
2020 (USD, MM)
2010–2020 CAGR
High Net Worth (HNW)> $2M household wealth
8,005 13,988 7.5% $43,291,429 $71,973,663 7.1%
New Wealth Builders (NWB)> $100K – $2M household wealth
267,410 403,358 6.7% $88,352,045 $145,140,195 7.3%
Mass Market (MM)<$100K household wealth
1,095,315 1,017,325 -0.8% $22,325,95 $24,806,106 2.5%
New�Wealth�Builders�(NWBs)�—�households�with�financial�assets�of�$100,000�to��$2�million�—�constitute�the�world’s�fastest-growing�and�broadest�wealth�segment�and��yet�it�is�the�least-documented�group.��Extremes at either end of the wealth spectrum often draw the most attention. However, NWBs exceed the High Net Worth households (>$2M) in terms of aggregate assets and rates of growth — and the gap is widening. Contributing to the growth in the NWB segment is the steady flow of Mass Market households transitioning up into this segment. NWBs with $88 trillion today are motoring toward $145 trillion in 2020 — 7.3% compound annual growth rate growth (CAGR) from 2010-2020.
NWB�households�exceed�HNW�households�in�aggregate�assets�and�rates�of�growth*�
1. The fastest-growing wealth group
Financial�assets�of�households�Number�of�households�
*Source for all charts and tables in Section 1: EIU estimates
5 Spotlight on the New Wealth Builders
2010
$300
$250
$200
$150
$100
$50
0
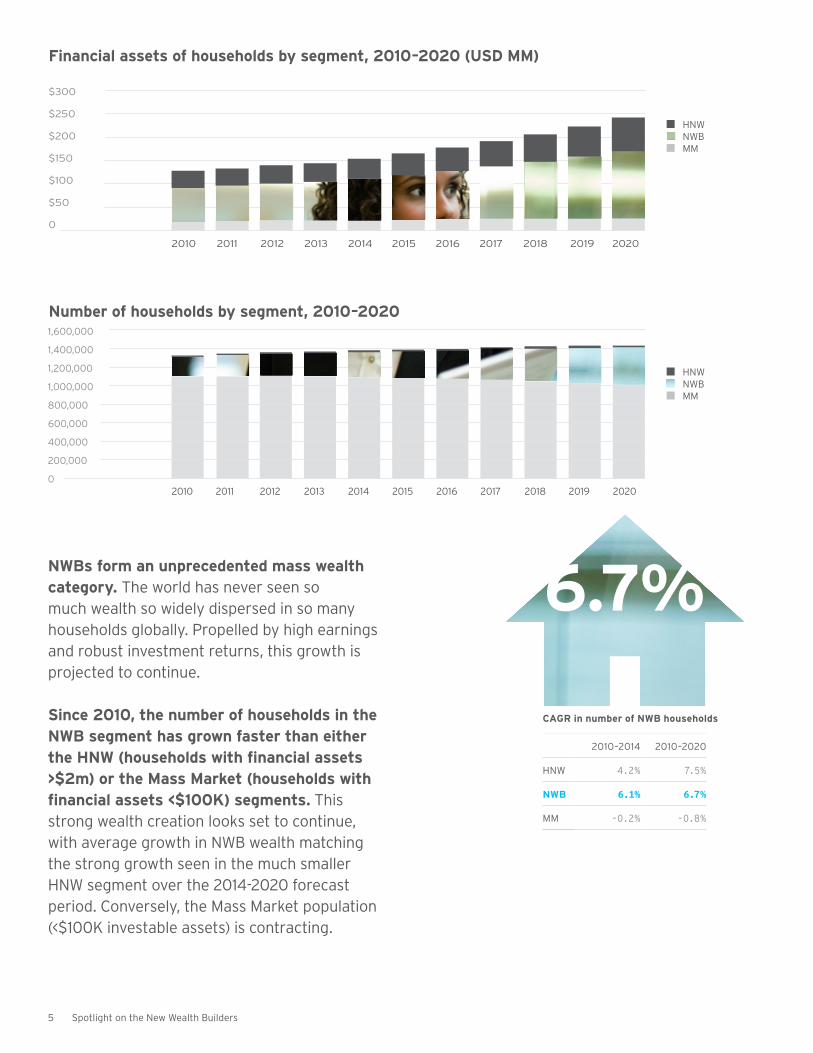
Financial�assets�of�households�by�segment,�2010–2020�(USD�MM)
20142012 2016 20182011 20152013 2017 2019 2020
2010
1,600,000
1,400,000
1,200,000
1,000,000
800,000
600,000
400,000
200,000
0
Number�of�households�by�segment,�2010–2020
20142012 2016 20182011 20152013 2017 2019 2020
NWBs�form�an�unprecedented�mass�wealth�category.�The world has never seen so much wealth so widely dispersed in so many households globally. Propelled by high earnings and robust investment returns, this growth is projected to continue.
Since�2010,�the�number�of�households�in�the�NWB�segment�has�grown�faster�than�either�the�HNW�(households�with�financial�assets�>$2m)�or�the�Mass�Market�(households�with�financial�assets�<$100K)�segments. This strong wealth creation looks set to continue, with average growth in NWB wealth matching the strong growth seen in the much smaller HNW segment over the 2014-2020 forecast period. Conversely, the Mass Market population (<$100K investable assets) is contracting.
6.7%
HNWNWBMM
HNWNWBMM
2010–2014 2010–2020
HNW 4.2% 7.5%
NWB 6.1% 6.7%
MM -0.2% -0.8%
CAGR�in�number�of�NWB�households
6 Spotlight on the New Wealth Builders
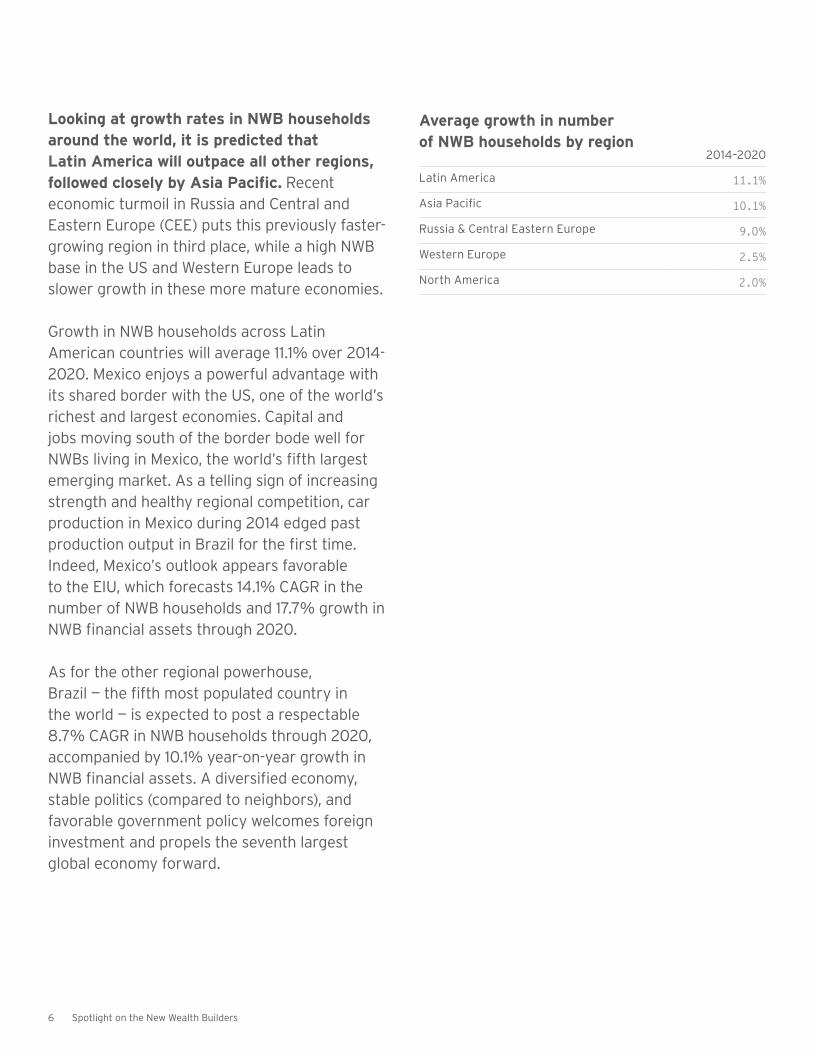
Looking�at�growth�rates�in�NWB�households�around�the�world,�it�is�predicted�that��Latin�America�will�outpace�all�other�regions,�followed�closely�by�Asia�Pacific. Recent economic turmoil in Russia and Central and Eastern Europe (CEE) puts this previously faster-growing region in third place, while a high NWB base in the US and Western Europe leads to slower growth in these more mature economies.
Growth in NWB households across Latin American countries will average 11.1% over 2014-2020. Mexico enjoys a powerful advantage with its shared border with the US, one of the world’s richest and largest economies. Capital and jobs moving south of the border bode well for NWBs living in Mexico, the world’s fifth largest emerging market. As a telling sign of increasing strength and healthy regional competition, car production in Mexico during 2014 edged past production output in Brazil for the first time. Indeed, Mexico’s outlook appears favorable to the EIU, which forecasts 14.1% CAGR in the number of NWB households and 17.7% growth in NWB financial assets through 2020.
As for the other regional powerhouse, Brazil — the fifth most populated country in the world — is expected to post a respectable 8.7% CAGR in NWB households through 2020, accompanied by 10.1% year-on-year growth in NWB financial assets. A diversified economy, stable politics (compared to neighbors), and favorable government policy welcomes foreign investment and propels the seventh largest global economy forward.
2014–2020
Latin America 11.1%
Asia Pacific 10.1%
Russia & Central Eastern Europe 9.0%
Western Europe 2.5%
North America 2.0%
Average�growth�in�number��of�NWB�households�by�region
7 Spotlight on the New Wealth Builders
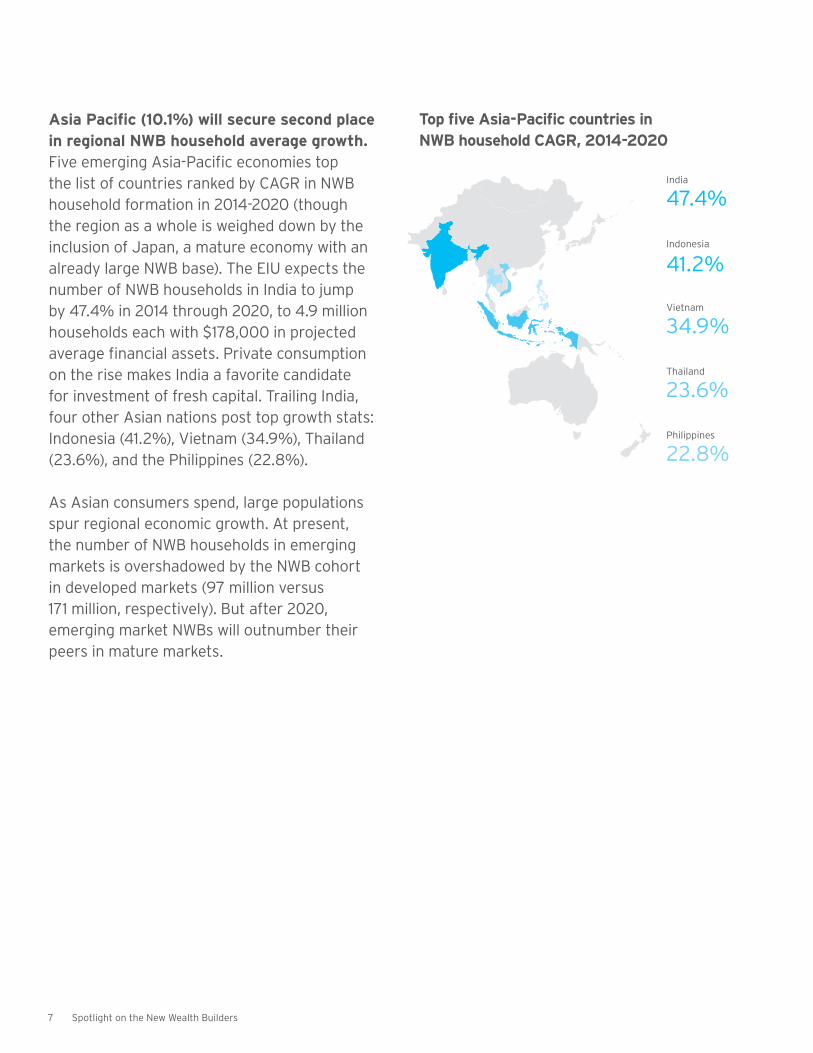
Asia�Pacific�(10.1%)�will�secure�second�place�in�regional�NWB�household�average�growth. Five emerging Asia-Pacific economies top the list of countries ranked by CAGR in NWB household formation in 2014-2020 (though the region as a whole is weighed down by the inclusion of Japan, a mature economy with an already large NWB base). The EIU expects the number of NWB households in India to jump by 47.4% in 2014 through 2020, to 4.9 million households each with $178,000 in projected average financial assets. Private consumption on the rise makes India a favorite candidate for investment of fresh capital. Trailing India, four other Asian nations post top growth stats: Indonesia (41.2%), Vietnam (34.9%), Thailand (23.6%), and the Philippines (22.8%).
As Asian consumers spend, large populations spur regional economic growth. At present, the number of NWB households in emerging markets is overshadowed by the NWB cohort in developed markets (97 million versus 171 million, respectively). But after 2020, emerging market NWBs will outnumber their peers in mature markets.
India
Indonesia
Vietnam
Thailand
Philippines
47.4%
41.2%
34.9%
23.6%
22.8%
Top�five�Asia-Pacific�countries�in��NWB�household�CAGR,�2014-2020

8 Spotlight on the New Wealth Builders
Russia�and�CEE�(9.0%)�will�take�third�spot�in�rankings�by�region. Sanctions stemming from conflict in Ukraine in 2014 have harmed regional growth prospects and rising tensions have escalated uncertainty in the region. Declining oil prices exacerbate the pain for 132 million Russians. Fleeing capital amid political unrest bleeds the economy, diverts resources from productive uses, and accelerates inflation, now in double digits. A smaller base of NWBs, however, will likely foster dramatic gains when growth resumes in the future. EIU forecasts are rosier for Hungary and Poland, numbers six and seven in overall rankings by year-on-year CAGR in NWB households, 19.8% and 19.1% respectively. Both show comparable growth through 2020 in NWB financial assets.
NWB�segments�post�slower�growth�in�Western�Europe�(2.5%)�and�North�America�(2.0%),�more�mature�economies�with�large�NWB�populations.�Europe continues to struggle, both economically and politically. The continent has yet to recover from the damage done by the financial crisis. The results of the January election in Greece have renewed fears that the country may eventually be forced to leave the Eurozone. Fears of deflation were raised in December 2014 as overall consumer prices fell. And conditions remain weak in the major economies, including Germany, which has been hurt by the turmoil in Russia. On the other hand, the US economy has not exhibited so much steam for a decade. Strong job creation is lowering unemployment and putting upward pressure on wages and giving a boost to spending. NWB growth is only constrained by a NWB population with less room to grow.
9 Spotlight on the New Wealth Builders
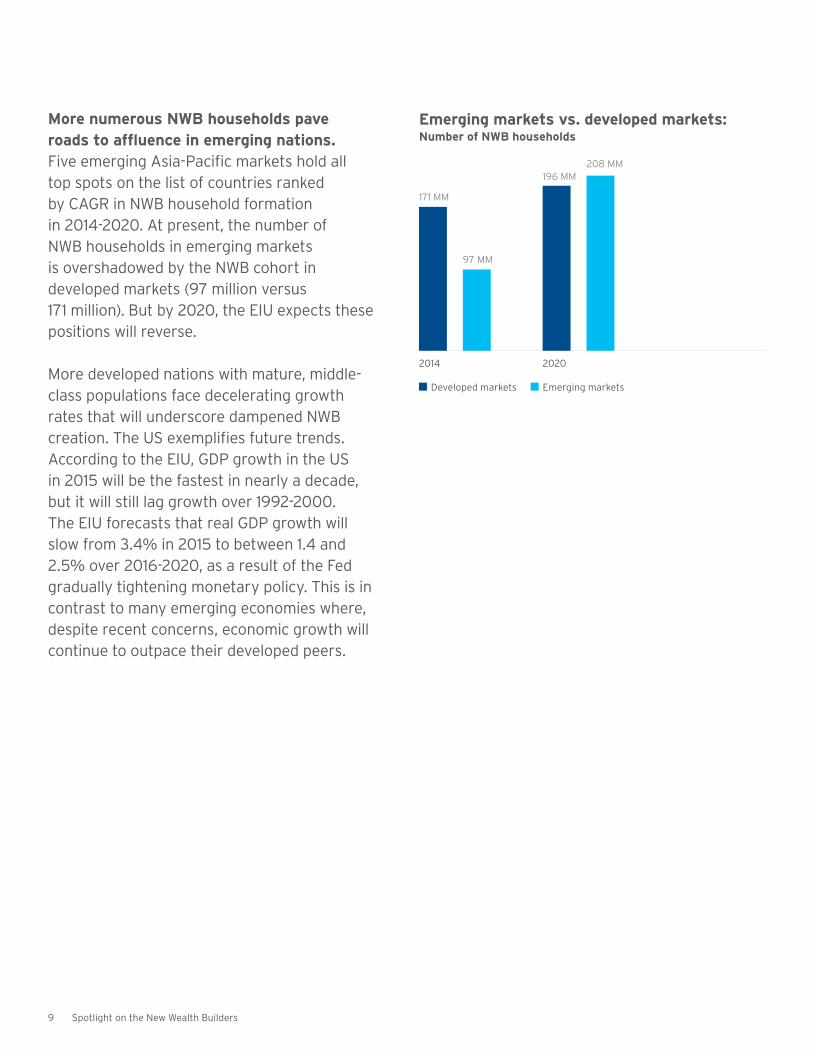
More�numerous�NWB�households�pave��roads�to�affluence�in�emerging�nations.��Five emerging Asia-Pacific markets hold all top spots on the list of countries ranked by CAGR in NWB household formation in 2014-2020. At present, the number of NWB households in emerging markets is overshadowed by the NWB cohort in developed markets (97 million versus 171 million). But by 2020, the EIU expects these positions will reverse.
More developed nations with mature, middle- class populations face decelerating growth rates that will underscore dampened NWB creation. The US exemplifies future trends. According to the EIU, GDP growth in the US in 2015 will be the fastest in nearly a decade, but it will still lag growth over 1992-2000. The EIU forecasts that real GDP growth will slow from 3.4% in 2015 to between 1.4 and 2.5% over 2016-2020, as a result of the Fed gradually tightening monetary policy. This is in contrast to many emerging economies where, despite recent concerns, economic growth will continue to outpace their developed peers.
Developed markets Emerging markets
2014 2020
171 MM
196 MM
97 MM
208 MM
Emerging�markets�vs.�developed�markets:��Number�of�NWB�households

10 Spotlight on the New Wealth Builders
Developed Markets Emerging Markets
On�aggregate,�NWBs�in�emerging�markets�are�accumulating�wealth�much�faster�than�their�counterparts�in�developed�countries (and this is projected to continue, with the EIU forecasting an average annual growth of 17.8% versus 4.0% over 2014-2020). The mature developed markets will, however, continue to control more assets than emerging markets throughout the forecast period. And they continue to have greater assets per household.
Among�countries�within�the�EIU�NWB�database,�India�will�set�the�pace�through�2020�in�financial�asset�CAGR�(47%). The country is forecast to enjoy real GDP growth of between 6% and 6.7% per year through 2020. Further, the subcontinent’s high savings and investment rates, rapid workforce growth, quickly expanding middle class, and shift from low-productivity agriculture to higher-productivity manufacturing will underlie the fast growth in India’s NWB households through 2020.
Indeed, the EIU predicts that big increases in household financial assets in India will be supported by important economic reforms, attention to infrastructure, a stable political outlook, and positive investor sentiment, all highly favorable to NWBs. This favorable environment will see aggregate Indian NWB assets grow tenfold by 2020, to nearly $900 trillion.
The balance of global economic power is shifting as New Wealth Builders in emerging markets accumulate wealth at faster rates than peers in developed markets.
CAGR�in�financial�assets�among�NWB�households
Emerging�Markets�vs.�Developed�Markets:��Financial�assets�among�NWB�households�(USD�T)
2010 2011 2012 2013 2014 2015 2016 2017 2018 2019 2020
$90
$80
$70
$60
$50
$40
$30
$20
$10
0
2010 –2014
2014 –2020
Emerging Markets 26.3% 17.8%
Developed Markets 0.8% 4.0%

11 Spotlight on the New Wealth Builders
The�EIU’s�New�Wealth�Builder�Scorecard�documents�the�growth�of�this�segment�in�a�comprehensive�dossier�of�NWB�households��in�32�countries.
NWB�scorecard:�The�top�five,�median,�and�bottom�five�countries�ranked�by�expected�growth�of�the�segment
Country
Number of NWB households CAGR
2010-2014
Number of NWB households CAGR
2014-2020
Projected financial assets
in 2020 (USD, MM)
Projected avg. wealth per NWB
household in 2020
(USD, 000)
Top 5 1. India 13.7% 47.4% $879,713 $178.163
2. Indonesia 17.7% 41.2% $361,968 $190.605
3. Vietnam 36.7% 34.9% $68,105 $196.498
4. Thailand 15.2% 23.6% $500,486 $229.170
5. Philippines 28.4% 22.8% $582,246 $235.643
Median 2.8% 7.3% $865,749 $261.914
Bottom 5 28. UK 1.7% 1.7% $6,964,647 $411.028
29. Japan 1.2% 1.2% $14,503,883 $408.359
30. Hong Kong 0.1% 0.1% $1,130,037 $720.922
31. Singapore -0.3% -0.3% $643,393 $795.937
32. Argentina -0.8% -0.8% $61,947 $207.358
Argentina
UK
Hong Kong
India
Thailand
Indonesia
Vietnam
Philippines
Japan
Singapore
Country rankings by 2014-2020 CAGR in the number of NWB households show countries that lead and those that lag behind. The full NWB Scorecard, outlining key metrics for each of the 32 countries within the study, can be found in the Appendix.

12 Spotlight on the New Wealth Builders
Indonesia�will�earn�second�place�worldwide�in�CAGR�of�NWB�financial�assets�(41%). The EIU country forecast anticipates real GDP growth to expand at rates between 5.5% and 6.6% over 2015-2020. Improved local infrastructure and workplace skills positions Indonesia to capture jobs in manufacturing that once headed to China. According to the EIU, Indonesia will credit most of its economic growth to private consumption expanding at 5.6% annually. Global fixed income investors signaled confidence in February 2015 by moving quickly to snap up at auction bonds offered by the Ministry of Finance, which beat target price.
The EIU also predicts robust economic expansion in Vietnam (No. 3) through 2018 (35%). Analysts foresee a steady acceleration in private consumption growth that will shake off the effects of the spiraling inflation of 2011- 2012. Economic performance surpassed expectation in 2014, prompting the EIU to raise expectations for 2015. Credit is given to a steady increase in private consumption growth, rooted partly in stable price conditions and accelerating wage growth. Conditions favorable to NWBs in Vietnam should prevail for the next two decades, the EIU predicts.
NWB�segments�post�the�fastest�growth�in�developing�countries�with�the�most�room��to�grow. A low base favors the regions that are sprinting ahead of North America and Western Europe in terms of growth rates. Nimbler countries and regions feature rapid “catch-up” growth with a caveat: on average, these NWB households are less affluent than NWBs in slow- growing, developed markets.
NWBs�find�the�friendliest�climates�in�the�highly�developed�economies�of�Singapore,�Hong�Kong,�the�US,�Canada,�and�Australia. Very small populations and very high levelsof financial investment vault Hong Kong and Singapore to the top of this list. The US, Canada, and Australia boast top-ranked wealth perNWB household in 2014 and 2020.
2010 2014 2020
1. Singapore 661.3 1. Singapore 702.2 1. Singapore 795.9
2. Hong Kong 626.1 2. Hong Kong 653.7 2. Hong Kong 720.9
3. US 458.5 3. US 468.2 3. Canada 530.7
4. Canada 445.2 4. Australia 464.7 4. Australia 524.4
5. Australia 426.5 5. Canada 455.9 5. US 491.0
Top�five�countries�in�average�wealth�per�NWB�household�(USD,�000s)

13 Spotlight on the New Wealth Builders
The�US�will�cede�the�top�spot�in�the�global�ranking�of�NWB�assets�to�counterparts�in�China. In 2014, $23 trillion of NWB assets in the US exceed those in China by 18%. Come 2020, the EIU predicts that because of its population advantage and a rate of economic growth fueled by the loosening of monetary and fiscal policy, China will outstrip the US in NWB assets by almost 2 to 1, $53 trillion to $27 trillion in the US.
While the US ($491M) is projected to maintain a lead over China ($319M) in average wealth per NWB households through 2020, China is making significant inroads given strong growth.
In terms of growth in average NWB wealth per household, the emerging markets lead, with China topping the list for average annual growth for both the recent historical period and the forecast period.
2014 20142020 2020
$23T$27T
$19.5T
$53T
Jostling�for�leadership�in�growth�in�average�wealth�per�NWB�household
Top�five�countries�in�total�NWB�assets�(USD)
2010–2014 CAGR 2014-2020 CAGR
China 4.8% China 4.4%
Taiwan 2.6% South Korea 4.1%
Peru 2.4% Taiwan 3.8%
Venezuela 2.2% Mexico 3.2%
Australia 2.2% Japan 3.0%
2014 2020
US $23T China $53T
China 19.5T US $27T
Japan 11.2T Japan 14.5T
UK 5.9T Germany 7.2T
Germany 5.2T UK 7.0T
NWB�assets�in�the�US�(USD)
NWB�assets��in�China�(USD)

14 Spotlight on the New Wealth Builders
All�in�all,�a�vital�and�resilient�NWB�sector�now�extends�to�267�million�households�worldwide�that�share�economic�and�lifestyle�aspirations. These households represent $88 trillion in assets, the largest wealth group that the world has ever seen. Shared goals outweigh regional or even income disparities.
Through 2020, 136 million more households will join this dynamic population segment, adding $57 trillion in wealth that will move markets and shape consumer demand. Their success in mature and emerging markets will propel worldwide economic vitality in the local, national, and regional spheres.
Big winners will come from less-charted regions and countries, thanks to small populations with access to prosperity for the first time. Modest winners will come from more developed regions and countries with large NWB populations and, hence, less opportunity to extend affluence to new households. Except for outliers, who may benefit indirectly, the EIU finds that everybody wins as NWB households proliferate.
Number�of�NWB�households��and�aggregate�NWB�wealth�worldwide,2014�vs�2020�(USD)
267 MM households
403 MM households
Each house icon represents 10 MM households
2020
2014
$88 T
$145 T
15 Spotlight on the New Wealth Builders
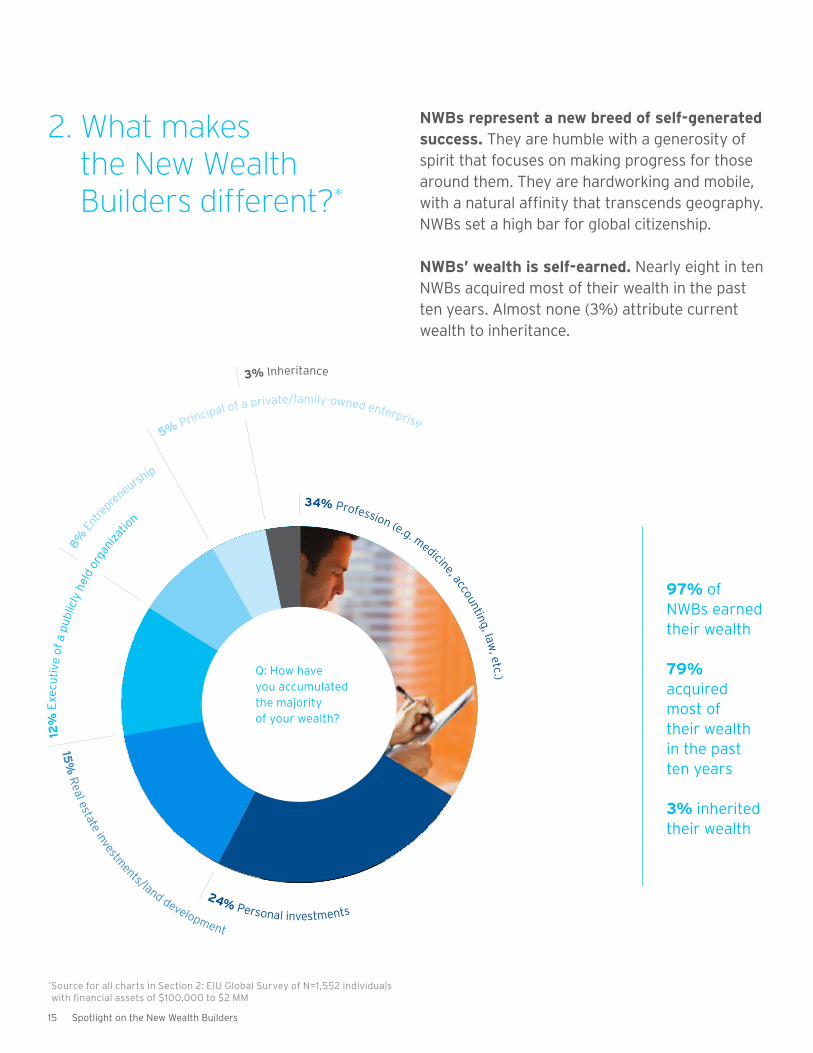
3%�Inheritance
NWBs�represent�a�new�breed�of�self-generated�success.�They are humble with a generosity of spirit that focuses on making progress for those around them. They are hardworking and mobile, with a natural affinity that transcends geography. NWBs set a high bar for global citizenship.
NWBs’�wealth�is�self-earned.�Nearly eight in ten NWBs acquired most of their wealth in the past ten years. Almost none (3%) attribute current wealth to inheritance.
2. What makes the New Wealth Builders different?*
8%�E
ntre
preneursh
ip
34%�Profession (e.g. medicine, accounting, law, etc.)
12%
�Exe
cutiv
e of
a p
ublic
ly h
eld
orga
niza
tion
5%�Principal of a private/family-owned enterprise
24%�Personal investments
15%
�Real estate investm
ents/land development
97% of NWBs earned their wealth
79% acquired most of their wealth in the past ten years
3% inherited their wealth
* Source for all charts in Section 2: EIU Global Survey of N=1,552 individuals with financial assets of $100,000 to $2 MM
Q: How have you accumulated the majority of your wealth?

16 Spotlight on the New Wealth Builders
51% travel abroad for business 3+ times per year
48% travel abroad for pleasure 2+ times per year
35% have sent or will send their children abroad for education
26% maintain bank accounts in 2+ countries
Don’t�call�NWBs�wealthy.�Few�would�agree. The vast majority of the NWB population in the EIU Survey (83%) do not call themselves wealthy. Most say that wealth requires $1 million to invest and many set the bar at $2 million or higher.
NWBs�attach�priorities�to�education,�knowledge,�and�hard�work. They are doctors, lawyers, accountants, investment advisers, and executives who keep companies humming from London to Kuala Lumpur. They prize independence, self-motivation, social responsibility, and rigorous stewardship of financial assets.
NWBs�are�global�citizens.�Almost two-thirds have lives that transcend borders. One-third send their children abroad for education; half travel abroad for pleasure or recreation more than twice a year; a fourth maintain bank accounts in more than two countries.
Percent�of�NWBs�who�consider�themselves�wealthy
64%�of�NWBs�are�global�citizens
83% don’t consider themselves wealthy
17% do consider themselves wealthy.

17 Spotlight on the New Wealth Builders
Giving�back�gets�priority. 97% of NWBs give some percentage of their income to charity. NWBs donate across a range of charities — favoring their country of birth and local communities. They also give to initiatives in low-income countries and countries with urgent needs amid health challenges and national disasters.
0% 3%
30%
67%
6%+
1-5%
Number of respondents: Each figure represents 1% of NWBs
How�much�NWBs�give�back�to�charity
97% of all NWBs donate to charity
43% donate to their country of birth
54% donate to low income countries/countries with specific needs
56% donate to their local community/primary residence
Percentage of gross income given to charity

18 Spotlight on the New Wealth Builders
Overall,�in�charitable�giving,�similarities�outweigh�differences�among�regions. More than two-thirds of NWBs born or currently residing in Asia give between 1% and 5% of their gross income to charity. “For thousands of years, China has had an approach and a way of thinking about charity and philanthropy that is embedded either in Confucianism, Buddhism, or their culture,” says Elizabeth Knup, who represents the Ford Foundation in China. “There has definitely always been a sense that one should give back to society if one has done well.”
The May 2008 earthquake in Wenchuan that killed 70,000 Chinese people mobilized national financial support in an unprecedented way, adds Knup. “People just had an outpouring of desire to help. It overcame the notion that the government was the one to do the helping.”
NWBs in other regions donate similar amounts. Mushrooming philanthropic initiatives enjoy global support that NWBs can afford. “We’re finding people with dramatically more choices,” says Paul Schervish, a Boston College sociology professor who directs the Boston College Center on Wealth and Philanthropy.
“ I think of myself as someone who has been very fortunate in life... The�more�fortunate�we�are,�the�greater�I�think�is�our�responsibility�to�give�back. So I try to give back here, in Africa and India, et cetera.”
Regions�show�similar�charitable�preferences.�When asked about their priorities, residents of all regions give the most importance to children’s charities, education, poverty reduction, and health.
– Sanjiv Suri, president and CEO of Zatisi Group, a network of upscale restaurants in the Czech Republic and Hungary, expressing a common sentiment among NWBs. Giving back translates, Suri says, into a company commitment to give at least 20 percent or more of profits to philanthropy. After a modest profit share, the rest goes to charitable causes, among them UNICEF, People in Need, and a crisis center for children in Prague.
Children’s charities
83%
76%
75%
69%
67%
Health
Education
Poverty reduction
Religious
NWBs’�top�five�charitable�preferences

19 Spotlight on the New Wealth Builders
NWBs�are�confident,�self-directed�investors.�The vast majority, 84%, self-direct their investment portfolios, though slightly more than half seek professional guidance on specific technical or tax matters.
As�the�name�implies,�New�Wealth�Builders�favor�growth-oriented�asset�classes. Domestic equity leads all rival asset classes, followed by mutual funds and pooled funds. In last place: sovereign bonds. More than half cite steady or high growth as their main investment goal. Appetite for growth, together with increased confidence in global markets, has added more exotic names to the list of nations where NWBs told the EIU that they plan to start investing in the near future: Andorra, Bhutan, Ecuador, Ghana, Greenland, Iceland, and Malawi.
NWBs�invest�where�the�economic�outlook�looks�most�favorable. Most investments reside currently in strong and stable nations with long commitments to free and transparent markets: the US, the UK, India, Australia, and Singapore. The outlook for China is starting to furnish NWBs with confidence.
3. Investment strategies: Building blocks for success*
Where�NWBs�are�investing�—�Top�five�markets
Q: In which countries do you currently invest most of your assets by value?
Q: In which countries are you most likely to invest assets in the near future?
Q: Which countries do you think have the best economic outlook?
1. US
2. India
3. UK
4. Australia
5. Singapore
1. US
2. India
3. UK
4. China
5. Singapore
1. China
2. US
3. UK
4. India
5. Singapore
* Source for all charts in Section 3: EIU Global Survey of N=1,552 individuals with financial assets of $100,000 to $2 MM
20 Spotlight on the New Wealth Builders
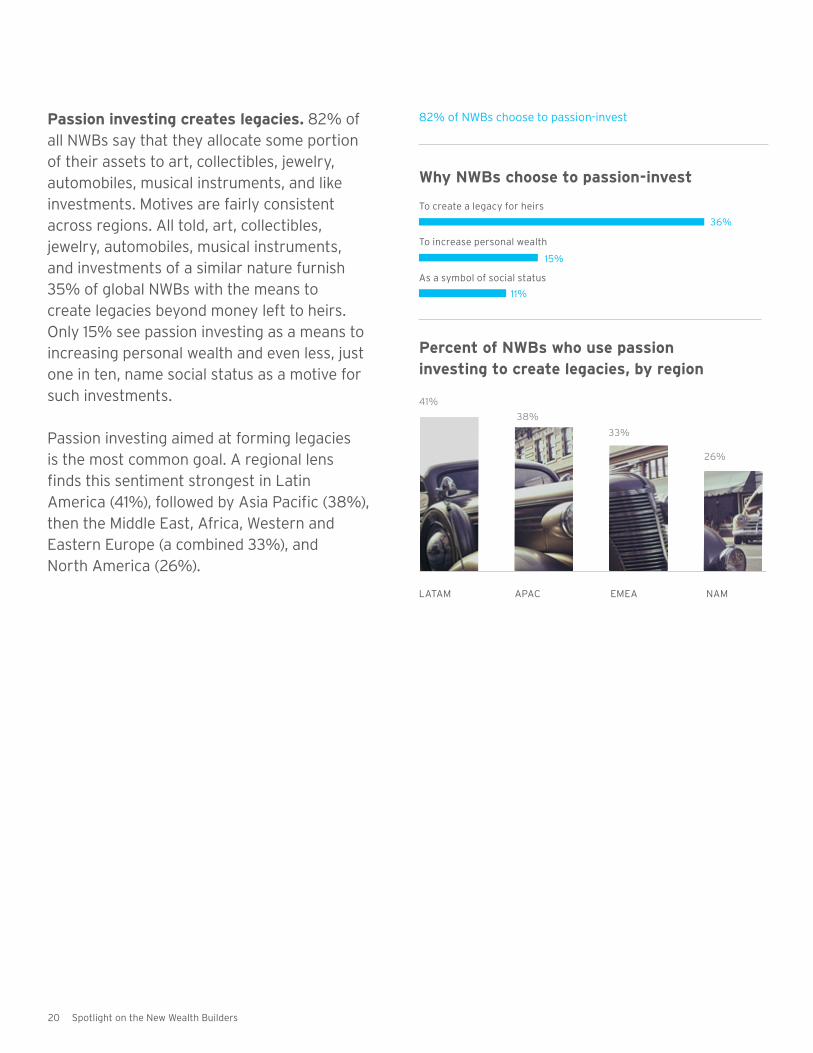
Passion�investing�creates�legacies. 82% of all NWBs say that they allocate some portion of their assets to art, collectibles, jewelry, automobiles, musical instruments, and like investments. Motives are fairly consistent across regions. All told, art, collectibles, jewelry, automobiles, musical instruments, and investments of a similar nature furnish 35% of global NWBs with the means to create legacies beyond money left to heirs. Only 15% see passion investing as a means to increasing personal wealth and even less, just one in ten, name social status as a motive for such investments.
Passion investing aimed at forming legacies is the most common goal. A regional lens finds this sentiment strongest in Latin America (41%), followed by Asia Pacific (38%), then the Middle East, Africa, Western and Eastern Europe (a combined 33%), and North America (26%).
LATAM
To create a legacy for heirs
41%
36%
38%
15%
33%
11%
26%
82% of NWBs choose to passion-invest
APAC
To increase personal wealth
EMEA
As a symbol of social status
NAM
Percent�of�NWBs�who�use�passion�investing�to�create�legacies,�by�region
Why�NWBs�choose�to�passion-invest

21 Spotlight on the New Wealth Builders
The�diverse�and�fast-growing�passion-investing�category�is�becoming�more�systematized, with one luxury index after another emerging in the marketplace. For example, as the value of top quality art increases, collectors can often find themselves in a situation where the value of their art collection is far greater and disproportionate to their other more traditional investments. Citi Private Bank, a private wealth manager, estimates that art holdings often represent 9 to 17% of individual collectors’ overall net worth in today’s market. In fact, for some long-term collectors, art collections can represent well above 50% of their wealth. In addition, prices for classic automobiles and watches have more than doubled in value over the last several years, demonstrating that following a passion can produce robust gains in addition to personal satisfaction.
“ Today’s [investment] products are increasingly technical, complicated and impersonal... they are not particularly exciting. Investors�now�tend�to�look�for�diversification�and�prefer�solutions�that�offer�tangibility�and�hold�a�personal�interest.”�As confirmed by a source at a firm that trades in passion investments, passion�investments�can�offer�a�palpable�advantage�over�investments�in�securities.

22 Spotlight on the New Wealth Builders
Ethical�caveats�temper�investment�decisions.�Ethical considerations factor heavily into investment decisions, with 95% of NWBs stating they take them into account when investing. Topping the list is social responsibility, such as fair trade and animal welfare. Also informing their investment choices: product harm, environmental sustainability, and corporate citizenship.
Systemic�economic�threats�keep�NWBs�alert. When inflection points or market turns occur, NWBs often register the earliest and steepest impact. Some 40% say that local and global economic factors pose the biggest threat to asset growth. Nearly as many cite corporate income taxes and increased competition in key markets as major deterrents to growth.
Social responsibility
53%
40%
37%
31%
26%
21%
23%
16%
5%
Product harm
Environmental stability
Corporate citizenship
Political activity or contributions
Corporate governance
Anti-competitive behavior
Religious issues
Ethical issues are not a factor
NWBs’�ethical�considerations�when�investing
23
Research�shows�NWBs�represent�a�global�wealth�segment�of�increasing�importance. Their spending and investment decisions will govern success or failure of large-scale initiatives in global markets.
A�wealth�sector�with�unrivaled�economic�resources�transcends�historical�borders. Local, national, and regional distinctions fade as shared prosperity unites a global audience that wants economic stability and access to orderly markets. A singular NWB identity comes into focus, commands attention, and spends.
Growth-oriented�economies�attract�NWBs. This wealth category creates demand on a mass scale. NWBs serve as engines of vibrant economies with far-reaching economic and social benefits.
If�long-term�economic�and�market�trends�continue,�this�is�just�the�beginning�of�the�positive�growth�trajectory�for�increasing�numbers�of�NWBs. Opportunities beckon in robust developed markets and vibrant emerging markets, both fertile turf for investment and consumption.
NWBs�define�the�best�aspects�of�globalization�through�hard�work�and�philanthropy. Their efforts drive markets and foster worldwide economic engagement in the 21st century. As global prosperity unfolds in new regions and populations, they will earn the lion’s share of benefits and the credit.
Conclusion:A vibrant New Wealth Builder category spurs global progress

24 Spotlight on the New Wealth Builders
Research�Methodology
SurveyIn February 2014, The Economist Intelligence Unit (EIU) carried out a global survey to learn about New Wealth Builders (NWBs) with investible assets between US$100,000 and $2 million (excluding personal residences). The survey, sponsored by Citi, reached 1,552 individuals who meet NWB criteria in 30 countries across 18 industries. Survey responses reveal characteristics, lifestyles, and investment choices by the global NWB segment. In-depth interviews with NWBs and financial services executives that engage with this wealth class supplement the survey data.
ForecastsIn 2014 and early 2015, the EIU projected sizes of NWB segments in 32 countries across the globe by estimating the number of households within specific asset bands using a two-step procedure. Step one calculates total household financial assets within a country. Step two developed a Lorenz curve to measure the distribution of financial assets in each county. All forecasts reflect conditions in February 2014 with the exception of Russia, which, due to changes in its market fundamentals, was revised in February 2015.
The�EIU/Citi�Global�New�Wealth��Builder�Scorecard This novel benchmark ranks countries and regions in the pivotal race to nurture New Wealth Builders. Winners and losers stand out, inviting investigation into reasons for good or poor performance. The Scorecard ranks countries according to projections of NWB household compound annual growth rates from 2014 to 2020.
In projected average growth of NWB households through 2020, India (47%) leads, followed by Indonesia (41%), Vietnam (35%), and Thailand (24%). At the low end of the scale are Singapore (-0.3%) and Argentina (-0.8%). The US occupies 27th place (2%), below Spain but above the UK.
Appendix

25 Spotlight on the New Wealth Builders
A�ranking�of�countries�by�NWB�household�CAGR�2014-2020�(number�of�households)
Rank Country Number of NWB households in 2010
(000s)
Number of NWB households in 2014
(000s)
Projected number of NWB households
in 2020 (000s)
Number of NWB households CAGR
2010-2020
Number of NWB households CAGR
2010-2014
Number of NWB households CAGR
2014-2020
1 India 288 481 4,938 32.9% 13.7% 47.4%
2 Indonesia 125 240 1,899 31.3% 17.7% 41.2%
3 Vietnam 16 57 347 35.6% 36.7% 34.9%
4 Thailand 347 611 2,184 20.2% 15.2% 23.6%
5 Philippines 265 721 2,471 25.0% 28.4% 22.8%
6 Hungary 254 160 472 6.4% -11.0% 19.8%
7 Poland 650 717 2,046 12.2% 2.5% 19.1%
8 Czech Republic 379 412 1,046 10.7% 2.1% 16.8%
9 Peru 113 271 653 19.2% 24.4% 15.8%
10 Turkey 374 624 1,458 14.6% 13.7% 15.2%
11 Mexico 2,274 3,985 8,773 14.5% 15.1% 14.1%
12 China 31,759 78,754 166,059 18.0% 25.5% 13.2%
13 Colombia 170 328 681 14.9% 17.9% 13.0%
14 Russia 1,086 1,320 2,425 8.4% 5.0% 10.7%
15 Brazil 3,795 4,311 7,099 6.5% 3.2% 8.7%
16 South Korea 4,741 6,348 9,932 7.7% 7.6% 7.7%
17 Malaysia 1,287 1,762 2,616 7.3% 8.2% 6.8%
18 Venezuela 866 1,706 2,328 10.4% 18.5% 5.3%
19 Germany 16,890 17,624 21,250 2.3% 1.1% 3.2%
20 Italy 10,052 9,384 11,272 1.2% -1.7% 3.1%
21 Greece 970 669 795 -2.0% -8.9% 2.9%
22 France 13,257 13,986 16,182 2.0% 1.3% 2.5%
23 Australia 4,536 5,090 5,868 2.6% 2.9% 2.4%
24 Taiwan 4,189 4,666 5,376 2.5% 2.7% 2.4%
25 Canada 6,722 7,100 8,157 2.0% 1.4% 2.3%
26 Spain 6,403 6,032 6,917 0.8% -1.5% 2.3%
27 USA 45,719 49,020 54,980 1.9% 1.8% 1.9%
28 UK 14,307 15,352 16,944 1.7% 1.8% 1.7%
29 Japan 36,357 32,979 35,517 -0.2% -2.4% 1.2%
30 Hong Kong 1,479 1,562 1,567 0.6% 1.4% 0.1%
31 Singapore 771 823 808 0.5% 1.6% -0.3%
32 Argentina 296 314 299 0.1% 1.5% -0.8%
Overall 210,739 267,410 403,358 6.7% 6.1% 7.1%

26 Spotlight on the New Wealth Builders
A�ranking�of�countries�by�NWB�household�CAGR�2014-2020�(total�and�avg.�financial�assets)
Rank Country NWB financial assets in 2010
(USD MM)
NWB financial assets in 2014
(USD MM)
Projected financial assets
in 2020 (USD MM)
Financial assets CAGR
2010-2020
Financial assets CAGR
2010-2014
Financial assets CAGR
2014-2020
Projected avg. wealth per NWB
household in 2020 (000s)
1 India $50,349 $84,689 $879,713 33.1% 13.9% 47.7% 178
2 Indonesia $21,858 $42,125 $361,968 32.4% 17.8% 43.1% 191
3 Vietnam $3,156 $11,074 $68,105 36.0% 36.9% 35.4% 196
4 Thailand $70,446 $126,859 $500,486 21.7% 15.8% 25.7% 229
5 Philippines $52,362 $152,981 $582,246 27.2% 30.7% 25.0% 236
6 Hungary $49,884 $30,914 $95,727 6.7% -11.3% 20.7% 203
7 Poland $129,721 $143,630 $438,846 13.0% 2.6% 20.5% 214
8 Czech Republic $74,325 $81,329 $233,411 12.1% 2.3% 19.2% 223
9 Peru $21,553 $56,750 $152,218 21.6% 27.4% 17.9% 233
10 Turkey $72,622 $125,874 $314,690 15.8% 14.7% 16.5% 216
11 Mexico $520,843 $983,208 $2,608,986 17.5% 17.2% 17.7% 297
12 China $6,493,477 $19,431,506 $52,926,770 23.3% 31.5% 18.2% 319
13 Colombia $32,010 $66,392 $149,725 16.7% 20.0% 14.5% 220
14 Russia $218,348 $267,025 $503,068 8.7% 5.2% 11.1% 207
15 Brazil $842,487 $970,550 $1,726,454 7.4% 3.6% 10.1% 243
16 South Korea $1,193,629 $1,740,631 $3,467,875 11.3% 9.9% 12.2% 349
17 Malaysia $345,183 $507,904 $851,785 9.5% 10.1% 9.0% 326
18 Venezuela $184,218 $395,978 $570,316 12.0% 21.1% 6.3% 245
19 Germany $4,942,367 $5,247,855 $7,180,979 3.8% 1.5% 5.4% 338
20 Italy $2,699,175 $2,431,747 $3,143,317 1.5% -2.6% 4.4% 279
21 Greece $237,607 $152,126 $184,806 -2.5% -10.5% 3.3% 233
22 France $4,155,076 $4,509,254 $5,954,434 3.7% 2.1% 4.7% 368
23 Australia $1,934,365 $2,365,395 $3,076,786 4.8% 5.2% 4.5% 524
24 Taiwan $1,444,988 $1,785,838 $2,575,006 5.9% 5.4% 6.3% 479
25 Canada $2,992,873 $3,236,578 $4,328,573 3.8% 2.0% 5.0% 531
26 Spain $1,814,058 $1,639,420 $1,964,946 0.8% -2.5% 3.1% 284
27 USA $20,962,772 $22,949,097 $26,995,054 2.6% 2.3% 2.7% 491
28 UK $5,232,609 $5,871,553 $6,964,647 2.9% 2.9% 2.9% 411
29 Japan $13,655,165 $11,279,699 $14,503,883 0.6% -4.7% 4.3% 408
30 Hong Kong $925,679 $1,020,880 $1,130,037 2.0% 2.5% 1.7% 721
31 Singapore $510,225 $577,701 $643,393 2.3% 3.2% 1.8% 796
32 Argentina $61,563 $65,484 $61,947 0.1% 1.6% -0.9% 207
Overall $71,944,993 $88,773,716 147,285,826 7.3% 5.3% 8.6% 360

© 2015 Citigroup Inc. All rights reserved.
Citi, Citi and Arc Design, and Citibank are trademarks and service marks of Citigroup Inc. (and its affiliates) are used and registered throughout the world.
Whilst every effort has been taken to verify the accuracy of this information, neither The Economist Intelligence Unit Ltd. nor the sponsor of this report can accept any responsibility or liability for reliance by any person on this white paper or any of the information, opinions or conclusions set out in the white paper.
Related Documents