Spontaneous focal activation of invariant natural killer T (iNKT) cells in mouse liver and kidney Zeng and Howard Zeng and Howard BMC Biology 2010, 8:142 http://www.biomedcentral.com/1741-7007/8/142 (30 November 2010)

Welcome message from author
This document is posted to help you gain knowledge. Please leave a comment to let me know what you think about it! Share it to your friends and learn new things together.
Transcript
Spontaneous focal activation of invariant naturalkiller T (iNKT) cells in mouse liver and kidneyZeng and Howard
Zeng and Howard BMC Biology 2010, 8:142http://www.biomedcentral.com/1741-7007/8/142 (30 November 2010)
RESEARCH ARTICLE Open Access
Spontaneous focal activation of invariant naturalkiller T (iNKT) cells in mouse liver and kidneyJia Zeng1,2, Jonathan C Howard1*
Abstract
Background: Invariant natural killer T (iNKT) cells differ from other T cells by their hyperactive effector T-cell status,in addition to the expression of NK lineage receptors and semi-invariant T-cell receptors. It is generally agreed thatthe immune phenotype of iNKT cells is maintained by repeated activation in peripheral tissues although no explicitevidence for such iNKT cell activity in vivo has so far been reported.
Results: We used an interferon (IFN)-g-inducible cytoplasmic protein, Irga6, as a histological marker for local IFN-gproduction. Irga6 was intensely expressed in small foci of liver parenchymal cells and kidney tubular epithelium.Focal Irga6 expression was unaffected by germ-free status or loss of TLR signalling and was totally dependent onIFN-g secreted by T cells in the centres of expression foci. These were shown to be iNKT cells by diagnostic T cellreceptor usage and their activity was lost in both CD1 d and Ja-deficient mice.
Conclusions: This is the first report that supplies direct evidence for explicit activation events of NKT cells in vivoand raises issues about the triggering mechanism and consequences for immune functions in liver and kidney.
BackgroundInvariant natural killer-like T (iNKT) cells are placedambiguously between adaptive and innate immune sys-tems (reviewed in [1,2]). Derived from the thymus,expressing rearranged T-cell receptor (TCR) alpha andbeta chains, they seem to belong to the adaptiveimmune system, while their receptor homogeneity, theircontinuous state of activation, their rapid secretion oflarge amounts of interferon (IFN)-g and interleukin(IL)-4, their presumed recognition of invariant glycolipidself-ligands associated with the non-classical major his-tocompatibility (MHC) class I molecule, CD1 d, recallvarious aspects of innate immune recognition. Manyfeatures of iNKT cell behaviour are puzzling: their thy-mic ontogeny and relation to the classical pathways ofT-cell mediated differentiation; the relative importanceof endogenous and exogenous ligands in activation; andthe polarity of their cytokine profile towards IFN-g orIL-4 in relation to the activating ligand. However, in thisreport we address the basis for another characteristic ofthese enigmatic cells, namely their constitutive state of
readiness to respond with massive cytokine production(reviewed in [3]). Using a sensitive endogenous reporterfor IFN-g production, we show that iNKT cells are con-stitutively and endogenously activated to IFN-g produc-tion in the liver and kidney of normal mice. Theactivation is apparently restricted to these tissues, focal,spontaneous and independent of signals derived frombacteria or viruses. It is, however, dependent on theexpression of CD1 d and on the presence of the classicaliNKT cell receptor. The results suggest that the consti-tutive state of iNKT readiness may be maintained byintermittent local stimulation with endogenous ligands.
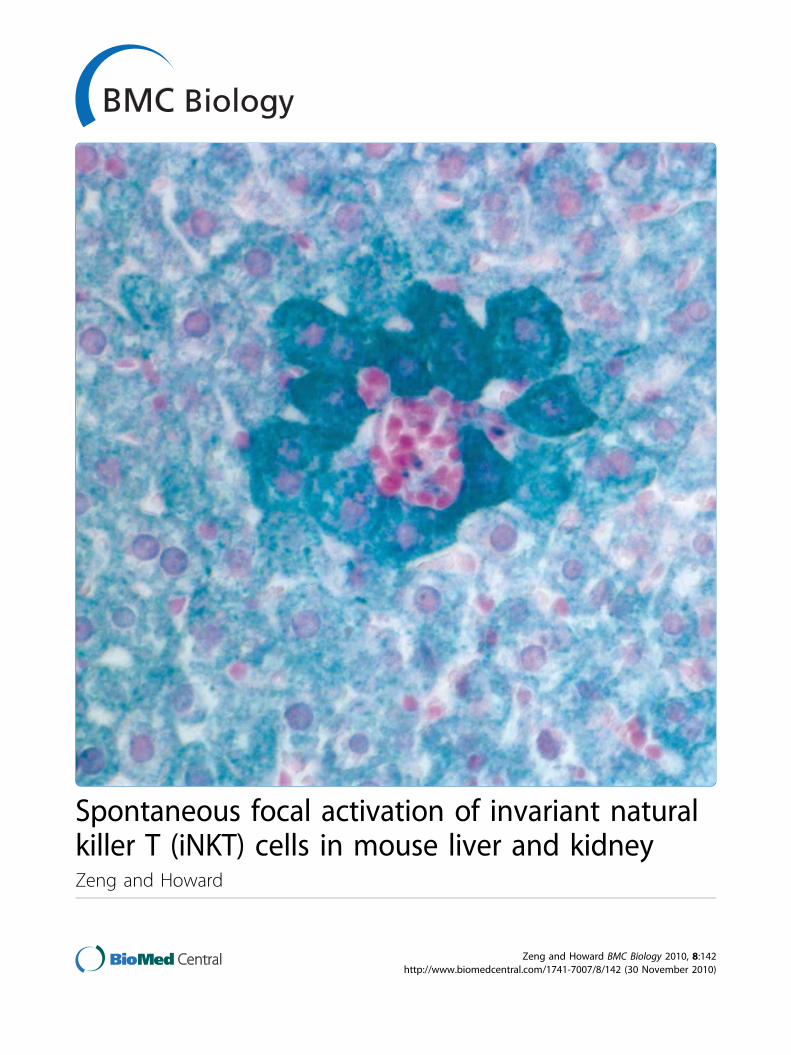
Results and discussionWe recently demonstrated the constitutive expression ofthe IFN-g-inducible, immunity-related GTPase, Irga6, inhepatic parenchymal cells of normal mice [4]. This wasattributed to the presence of a dedicated, liver-specificpromoter associated with this innate immune resistancegene. During these studies we noticed that the expres-sion of Irga6 in hepatic parenchymal cells was not uni-form. Small focal patches, each consisting of a few to afew dozen contiguous cells, expressed very much moreIrga6 than the general expression level (Figure 1A).These foci of high Irga6 expression resembled those that
* Correspondence: [email protected] for Genetics, University of Cologne, Zuelpicher Strasse 47a, 50674Cologne, GermanyFull list of author information is available at the end of the article
Zeng and Howard BMC Biology 2010, 8:142http://www.biomedcentral.com/1741-7007/8/142
© 2010 Zeng and Howard; licensee BioMed Central Ltd. This is an Open Access article distributed under the terms of the CreativeCommons Attribution License (http://creativecommons.org/licenses/by/2.0), which permits unrestricted use, distribution, andreproduction in any medium, provided the original work is properly cited.
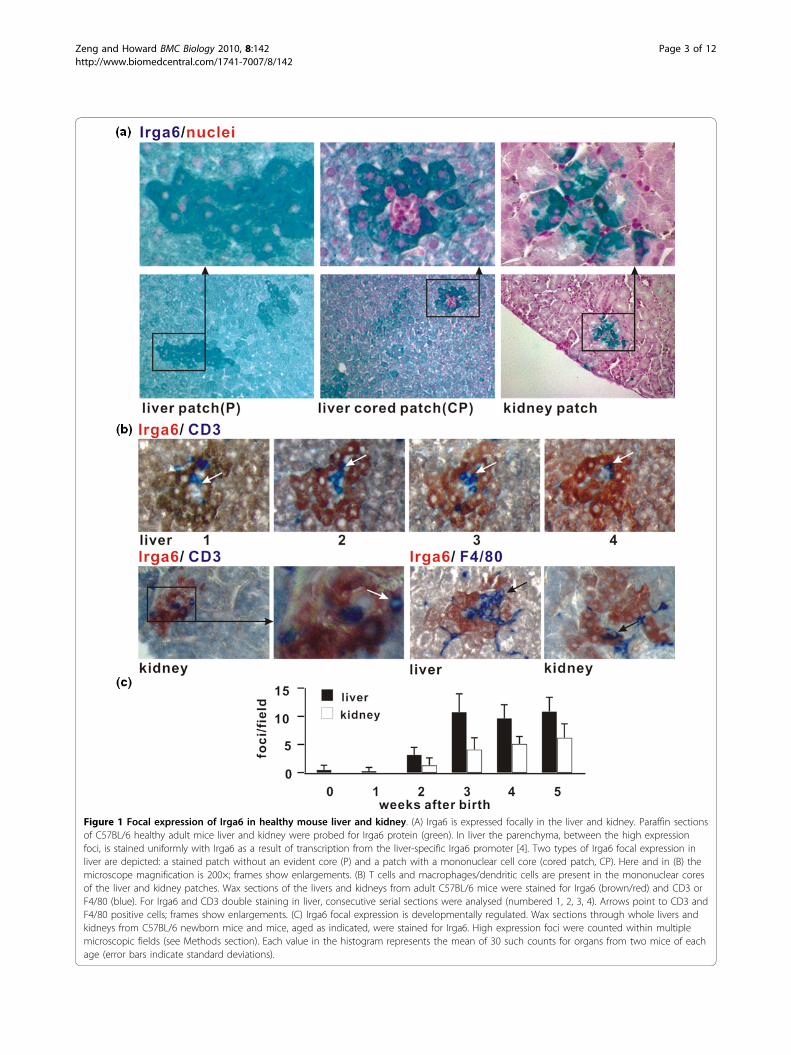
Figure 1 Focal expression of Irga6 in healthy mouse liver and kidney. (A) Irga6 is expressed focally in the liver and kidney. Paraffin sectionsof C57BL/6 healthy adult mice liver and kidney were probed for Irga6 protein (green). In liver the parenchyma, between the high expressionfoci, is stained uniformly with Irga6 as a result of transcription from the liver-specific Irga6 promoter [4]. Two types of Irga6 focal expression inliver are depicted: a stained patch without an evident core (P) and a patch with a mononuclear cell core (cored patch, CP). Here and in (B) themicroscope magnification is 200×; frames show enlargements. (B) T cells and macrophages/dendritic cells are present in the mononuclear coresof the liver and kidney patches. Wax sections of the livers and kidneys from adult C57BL/6 mice were stained for Irga6 (brown/red) and CD3 orF4/80 (blue). For Irga6 and CD3 double staining in liver, consecutive serial sections were analysed (numbered 1, 2, 3, 4). Arrows point to CD3 andF4/80 positive cells; frames show enlargements. (C) Irga6 focal expression is developmentally regulated. Wax sections through whole livers andkidneys from C57BL/6 newborn mice and mice, aged as indicated, were stained for Irga6. High expression foci were counted within multiplemicroscopic fields (see Methods section). Each value in the histogram represents the mean of 30 such counts for organs from two mice of eachage (error bars indicate standard deviations).
Zeng and Howard BMC Biology 2010, 8:142http://www.biomedcentral.com/1741-7007/8/142
Page 3 of 12
we reported in the kidney parenchyma associated withtubular epithelium [4]. About 10% of high expressionfoci in the liver were characterized by a central accumu-lation of small mononuclear cells. We could establishimmunohistologically that T cells, defined by CD3, andmacrophage/DC lineage cells, defined by F4/80, werepresent in these mononuclear cell cores (Figure 1B).The same cell types could be found adjacent to thepatches of high Irga6 expression in the kidney corticaltubular epithelium, following closely the pattern of F4/80+ DC described in mouse kidney [5]. In subsequentanalysis of the liver we distinguished between the min-ority of Irga6 expression patches with and the majoritywithout, visible mononuclear cell cores (see Materialsand Methods), as they clearly have different origins (seebelow). There are mononuclear cells associated with allkidney patches and the patches seem to have only oneorigin (see below). High Irga6 expression patches arenot present in newborn mice but develop rapidly inboth the kidney and liver between 1 week and 3 weeksafter birth (Figure 1C).As Irga6 expression is induced by IFN-g [6,7], we
asked whether high expression patches were due to thelocal expression of IFN-g. First, we examined the liverand kidneys of mice with genomic disruptions of com-ponents of the IFN response mechanism on the C57BL/6 background (Figure 2AAdditional file 1: Table S1.Both IFN-g [8] and IFN-gamma receptor (IFNGR) [9]deficiencies eliminated all high Irga6 expression patchesfrom the kidney and all Irga6 patches with mononuclearcores from the liver. The liver patches without coreswere not significantly affected. IFNAR deficiency [10]had no marked effect on either organ. As expected, allkidney patches and liver patches with mononuclearcores were eliminated by STAT-1 deficiency. Surpris-ingly, the high expression patches without mononuclearcell cores were also absent in the STAT-1-deficientlivers, even though the loss of type I and type II IFNreceptors had no effect on them. We conclude thatcoreless liver patches are caused by the local action ofanother cytokine probably not of lymphoid origin, per-haps IFN-l (IL-29) or IL-27 which both transduce sig-nals via STAT1 in hepatocytes, but initiate signallingthrough distinct receptors [11,12]. Rag1 deficiency [13]behaved like IFN-g or IFNGR deficiency, eliminating allIrga6 high expression foci with mononuclear cores fromthe liver, showing that lymphocytes with rearrangedreceptor chains were required for the focal expressionpatches with mononuclear cell cores but not forthe coreless patches. It was not possible to assesshigh expression patches in kidney because of near uni-versal high expression in these organs (Additional file 2:Figure S1). No liver phenotype was detected in B-cell-deficient JHT mice [14], excluding B cells from further
consideration. Again, excessive high expression wasfound in the kidneys (Additional file 2: Figure S1).Secondly, if IFN-g is responsible for the focal induc-
tion of Irga6, there should be activation in the highexpression patches of the IFN-g-dependent promoter ofthe Irga6 gene, with the use of exon 1A, in contrastto the general hepatic parenchyma in which the liver-specific promoter is constitutively expressed with usageof exon 1B [4]. We therefore isolated high expressionpatches and areas of general expression level by lasermicrodissection and used quantitative real-time poly-merase chain reaction (qRT-PCR) in order to identifythe use of the IFN-g-dependent 5’-untranslated 1A exonand the constitutively expressed 5’-untranslated 1B exonin the two tissue sites (Figure 2C). Expression of theIFN-g-dependent exon 1A was 27.5× higher by qRT-PCR in the high expression patches than in the generalliver, while 1B exon expression was not altered (1.5×).However, when the Irga6-1A PCR products from thegeneral liver were cloned and sequenced, only 5.9% ofwere specific (a consequence of the very low absoluteexpression of the IFN-g-inducible transcript in non-focalhepatic parenchyma), while 100% of those cloned fromthe high expression patches were specific. Thus, the trueexcess of Irga6-1A in the high expression patches rela-tive to the general parenchyma was 100 × 27.9/5.9 orabout 470×, confirming the intense local induction byIFN-g.Thirdly, if IFN-g is being secreted locally, affected cells
should express not only Irga6 but also other membersof the IFN-g-inducible IRG protein family that are notconstitutively expressed in hepatic parenchymal cells [4].We therefore stained adjacent histological sections ofliver and kidney for Irga6 and for Irgm3. Indeed, focalexpression of Irgm3 coincided accurately with the highIrga6 expression patches (Additional file 3: Figure S2).Direct evidence for the expression of IFN-g in the
patches with mononuclear cell cores, but not in thecoreless patches, was obtained by RT-PCR for IFN-gtranscripts in microdissected patch material. A strongsignal for IFN-g was recovered from only the patcheswith mononuclear cell cores (Figure 2D). These experi-ments established beyond doubt that the liver andkidney contain reactive foci of local, T-cell-dependentIFN-g production identified by the local high expressionof Irga6.The character of the small IFN-g-secreting reactive
foci in the liver and kidney suggested that they could bedue to local immune activity stimulated by microbialmaterial. We therefore analysed the liver and kidney forreactive foci from mice deficient in components of theToll-le receptor (TLR) system (Figure 2B). No effectswere seen in mice deficient in TLR2, 4 or 9 or MyD88,arguing against bacterial components as the initiators of
Zeng and Howard BMC Biology 2010, 8:142http://www.biomedcentral.com/1741-7007/8/142
Page 4 of 12
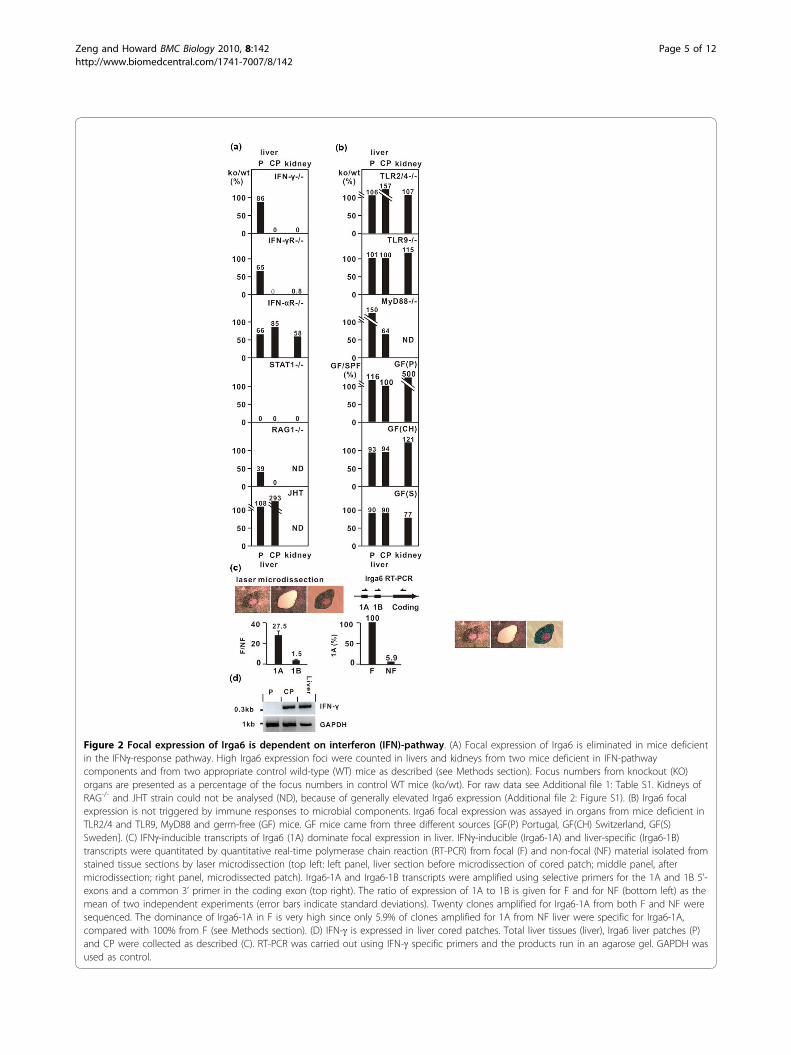
Figure 2 Focal expression of Irga6 is dependent on interferon (IFN)-pathway. (A) Focal expression of Irga6 is eliminated in mice deficientin the IFNg-response pathway. High Irga6 expression foci were counted in livers and kidneys from two mice deficient in IFN-pathwaycomponents and from two appropriate control wild-type (WT) mice as described (see Methods section). Focus numbers from knockout (KO)organs are presented as a percentage of the focus numbers in control WT mice (ko/wt). For raw data see Additional file 1: Table S1. Kidneys ofRAG-/- and JHT strain could not be analysed (ND), because of generally elevated Irga6 expression (Additional file 2: Figure S1). (B) Irga6 focalexpression is not triggered by immune responses to microbial components. Irga6 focal expression was assayed in organs from mice deficient inTLR2/4 and TLR9, MyD88 and germ-free (GF) mice. GF mice came from three different sources [GF(P) Portugal, GF(CH) Switzerland, GF(S)Sweden]. (C) IFNg-inducible transcripts of Irga6 (1A) dominate focal expression in liver. IFNg-inducible (Irga6-1A) and liver-specific (Irga6-1B)transcripts were quantitated by quantitative real-time polymerase chain reaction (RT-PCR) from focal (F) and non-focal (NF) material isolated fromstained tissue sections by laser microdissection (top left: left panel, liver section before microdissection of cored patch; middle panel, aftermicrodissection; right panel, microdissected patch). Irga6-1A and Irga6-1B transcripts were amplified using selective primers for the 1A and 1B 5’-exons and a common 3’ primer in the coding exon (top right). The ratio of expression of 1A to 1B is given for F and for NF (bottom left) as themean of two independent experiments (error bars indicate standard deviations). Twenty clones amplified for Irga6-1A from both F and NF weresequenced. The dominance of Irga6-1A in F is very high since only 5.9% of clones amplified for 1A from NF liver were specific for Irga6-1A,compared with 100% from F (see Methods section). (D) IFN-g is expressed in liver cored patches. Total liver tissues (liver), Irga6 liver patches (P)and CP were collected as described (C). RT-PCR was carried out using IFN-g specific primers and the products run in an agarose gel. GAPDH wasused as control.
Zeng and Howard BMC Biology 2010, 8:142http://www.biomedcentral.com/1741-7007/8/142
Page 5 of 12
the foci. In order to test this conclusion further, weexamined the liver and kidney from germ-free micefrom three independent sources. No significant reduc-tion in numbers of reactive foci in liver or spleen wasdetected (Figure 2B). Bacterial infection is, thus, unlikelyto be a stimulus for the reactive fociTwo further explanations were considered for the
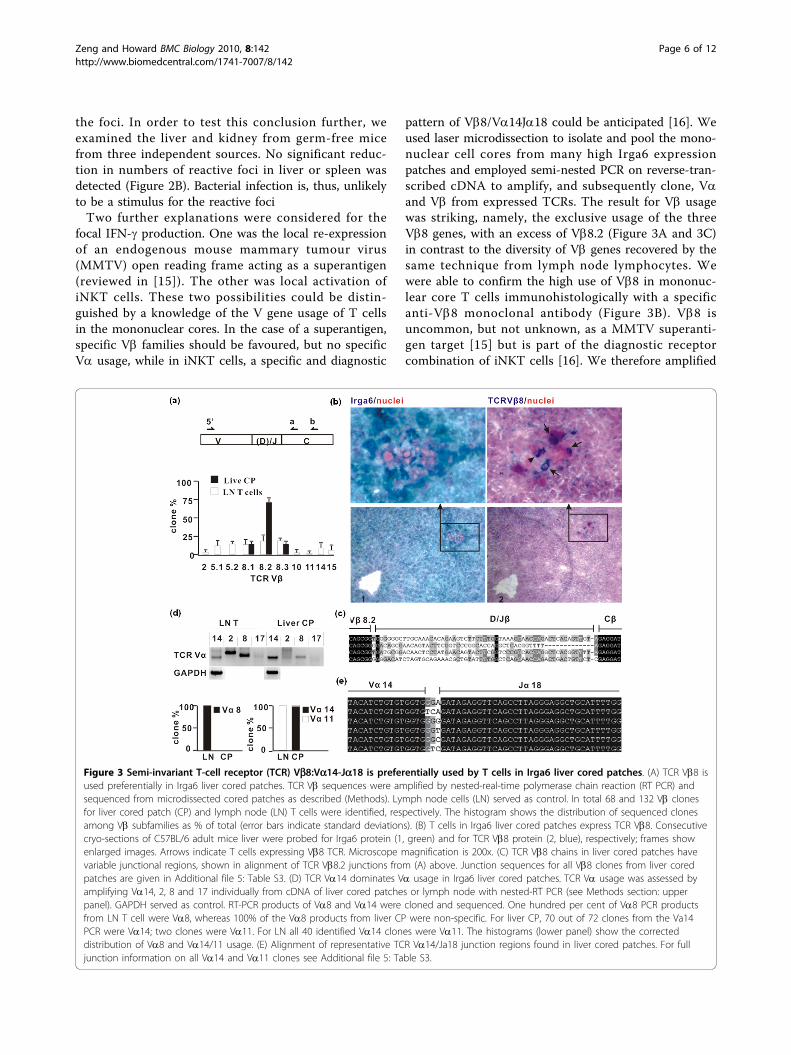
focal IFN-g production. One was the local re-expressionof an endogenous mouse mammary tumour virus(MMTV) open reading frame acting as a superantigen(reviewed in [15]). The other was local activation ofiNKT cells. These two possibilities could be distin-guished by a knowledge of the V gene usage of T cellsin the mononuclear cores. In the case of a superantigen,specific Vb families should be favoured, but no specificVa usage, while in iNKT cells, a specific and diagnostic
pattern of Vb8/Va14Ja18 could be anticipated [16]. Weused laser microdissection to isolate and pool the mono-nuclear cell cores from many high Irga6 expressionpatches and employed semi-nested PCR on reverse-tran-scribed cDNA to amplify, and subsequently clone, Vaand Vb from expressed TCRs. The result for Vb usagewas striking, namely, the exclusive usage of the threeVb8 genes, with an excess of Vb8.2 (Figure 3A and 3C)in contrast to the diversity of Vb genes recovered by thesame technique from lymph node lymphocytes. Wewere able to confirm the high use of Vb8 in mononuc-lear core T cells immunohistologically with a specificanti-Vb8 monoclonal antibody (Figure 3B). Vb8 isuncommon, but not unknown, as a MMTV superanti-gen target [15] but is part of the diagnostic receptorcombination of iNKT cells [16]. We therefore amplified
Figure 3 Semi-invariant T-cell receptor (TCR) Vb8:Va14-Ja18 is preferentially used by T cells in Irga6 liver cored patches. (A) TCR Vb8 isused preferentially in Irga6 liver cored patches. TCR Vb sequences were amplified by nested-real-time polymerase chain reaction (RT PCR) andsequenced from microdissected cored patches as described (Methods). Lymph node cells (LN) served as control. In total 68 and 132 Vb clonesfor liver cored patch (CP) and lymph node (LN) T cells were identified, respectively. The histogram shows the distribution of sequenced clonesamong Vb subfamilies as % of total (error bars indicate standard deviations). (B) T cells in Irga6 liver cored patches express TCR Vb8. Consecutivecryo-sections of C57BL/6 adult mice liver were probed for Irga6 protein (1, green) and for TCR Vb8 protein (2, blue), respectively; frames showenlarged images. Arrows indicate T cells expressing Vb8 TCR. Microscope magnification is 200x. (C) TCR Vb8 chains in liver cored patches havevariable junctional regions, shown in alignment of TCR Vb8.2 junctions from (A) above. Junction sequences for all Vb8 clones from liver coredpatches are given in Additional file 5: Table S3. (D) TCR Va14 dominates Va usage in Irga6 liver cored patches. TCR Va usage was assessed byamplifying Va14, 2, 8 and 17 individually from cDNA of liver cored patches or lymph node with nested-RT PCR (see Methods section: upperpanel). GAPDH served as control. RT-PCR products of Va8 and Va14 were cloned and sequenced. One hundred per cent of Va8 PCR productsfrom LN T cell were Va8, whereas 100% of the Va8 products from liver CP were non-specific. For liver CP, 70 out of 72 clones from the Va14PCR were Va14; two clones were Va11. For LN all 40 identified Va14 clones were Va11. The histograms (lower panel) show the correcteddistribution of Va8 and Va14/11 usage. (E) Alignment of representative TCR Va14/Ja18 junction regions found in liver cored patches. For fulljunction information on all Va14 and Va11 clones see Additional file 5: Table S3.
Zeng and Howard BMC Biology 2010, 8:142http://www.biomedcentral.com/1741-7007/8/142
Page 6 of 12
by RT-PCR a number of specific Va families fromlymph node cells and from mononuclear cell cores (Fig-ure 3D). In lymph node T cells a weak signal for Va14was seen, compared with strong signals for Va2 andVa8. From the mononuclear core cells a strong signalwas seen for Va14, an unclear result for Va2 and aweaker signal for Va8. However, the true excess ofVa14 in the core cells was striking since the weak signalof Va14 from lymph nodes proved, on cloning andsequencing, to be due, with a single exception, to theamplification of Va11 which is closely related to Va14.In contrast, all except one of the clones amplified forVa14 from mononuclear cell cores of liver patches wereindeed Va14 (Figure 3D). Thus, the TCR V-gene usageof the mononuclear cell cores was consistent with theTCRs of iNKT cells. This was further confirmed byshowing that exclusively the canonical Ja18 was usedwith no length variation (Figure 3E).If the NKT function is dependent on a dedicated Vb8/
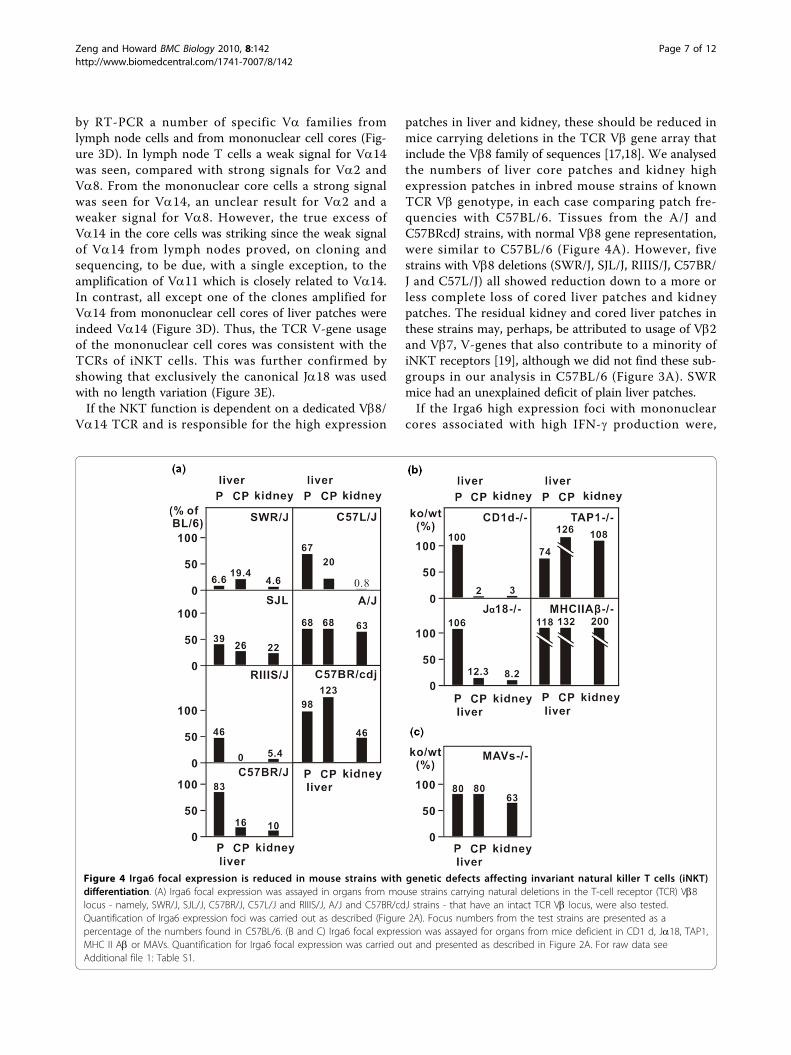
Va14 TCR and is responsible for the high expression
patches in liver and kidney, these should be reduced inmice carrying deletions in the TCR Vb gene array thatinclude the Vb8 family of sequences [17,18]. We analysedthe numbers of liver core patches and kidney highexpression patches in inbred mouse strains of knownTCR Vb genotype, in each case comparing patch fre-quencies with C57BL/6. Tissues from the A/J andC57BRcdJ strains, with normal Vb8 gene representation,were similar to C57BL/6 (Figure 4A). However, fivestrains with Vb8 deletions (SWR/J, SJL/J, RIIIS/J, C57BR/J and C57L/J) all showed reduction down to a more orless complete loss of cored liver patches and kidneypatches. The residual kidney and cored liver patches inthese strains may, perhaps, be attributed to usage of Vb2and Vb7, V-genes that also contribute to a minority ofiNKT receptors [19], although we did not find these sub-groups in our analysis in C57BL/6 (Figure 3A). SWRmice had an unexplained deficit of plain liver patches.If the Irga6 high expression foci with mononuclear
cores associated with high IFN-g production were,
Figure 4 Irga6 focal expression is reduced in mouse strains with genetic defects affecting invariant natural killer T cells (iNKT)differentiation. (A) Irga6 focal expression was assayed in organs from mouse strains carrying natural deletions in the T-cell receptor (TCR) Vb8locus - namely, SWR/J, SJL/J, C57BR/J, C57L/J and RIIIS/J, A/J and C57BR/cdJ strains - that have an intact TCR Vb locus, were also tested.Quantification of Irga6 expression foci was carried out as described (Figure 2A). Focus numbers from the test strains are presented as apercentage of the numbers found in C57BL/6. (B and C) Irga6 focal expression was assayed for organs from mice deficient in CD1 d, Ja18, TAP1,MHC II Ab or MAVs. Quantification for Irga6 focal expression was carried out and presented as described in Figure 2A. For raw data seeAdditional file 1: Table S1.
Zeng and Howard BMC Biology 2010, 8:142http://www.biomedcentral.com/1741-7007/8/142
Page 7 of 12
indeed, due to iNKT cells, they should also be absentfrom mice deficient in the essential ligand-presentingmolecule CD1 d [20,21] and in mice deficient in iNKTcells as a result of deletion of the diagnostic Ja18 T cellreceptor segment [22]. Both these predictions were ful-filled, with a substantial loss of high Irga6 expressionpatches from the kidney and cored patches from theliver in both mutants (Figure 4B). The patches of highIrga6 expression in the liver without mononuclear coreswere not affected in either case. In order to find outwhether CD4+ or CD8+ T cells play any additional rolein the induction of high Irga6 expression patches,organs from mice lacking MHC Abb (CD4+ T cell defi-cient [23]) and TAP1 (CD8+ T cell deficient [24]) werealso examined. Patches of high Irga6 expression werenormal in liver and kidney from both strains. Thus,iNKT cells alone appear to be responsible for the highIrga6 expression foci.We present direct evidence for the constitutive activa-
tion of mouse iNKT cells in two organs, the liver andthe kidneys, generating small foci of high IFN-g expres-sion detected by the local high expression of an IFN-g-inducible cytoplasmic protein, Irga6. In a previous study,we surveyed the pattern of constitutive Irga6 expressionin a number of other organs and high expression fociwere not seen [4]. The liver and kidneys thus appear tobe special in this respect. Our results suggest a localactivation event that triggers production of type II inter-feron by iNKT cells. The mouse liver sinusoids areknown to contain a major population of NKT cells andNKT cells have been reported in the kidney, probablycorresponding to the T cells identified in the tubulo-interstitial spaces [25]. Dendritic cells (DC) and hepaticstellate cells (Ito cells) [26] can both present exogenousa-GalCer via CD1 d to iNKT cells. Stellate cells ofthe liver sinusoids have also been shown to be IL-15-dependent activators of iNKT cells to proliferation inthe absence of exogenous antigen [26]. An apparentlysimilar cell type is also found in the tubular cortex ofthe kidney essentially co-localizing with dendritic cells[5,27]. Both DC and stellate cells are strong candidatesfor the activating cell implied by our experiments, butthis does not, by itself, account for the focal triggeringevent. Our experiments with germ-free and TLR-deficient mice make bacterial products acting on DCTLRs [28,29] an unlikely cause. More plausible would,perhaps, be a locally reactivating endogenous retrovirustriggering DC or stellate cells and, thereby, iNKT cellslocally. Arguing against a primary viral stimulus, wecould show no deficit in liver cored high expressionpatches or kidney patches in organs from mice deficientin MAVS/CARDIF [30], the common activation pathwayof the cytosolic RIG helicases that act as viral sensors(Figure 4C).
It will be interesting to know how the spontaneousactivation of iNKT cells and consequent constitutiveIFN-g production in liver and kidney of major inbredstrains of mouse affects immunological function in theseorgans. NKT cells have been identified very recently asa minority population among normal resident lympho-cytes in mouse kidney and both an excitatory role inischaemia-reperfusion injury [31] and an inhibitory rolein experimental glomerular nephritis induction by antiglomerular basement membrane antibody [32,33] havebeen described. Likewise, the large population of NKTcells that patrol the liver sinusoids [34] have been impli-cated in various liver disorders [35], but their sponta-neous, focal activation has not been reported.Spontaneous focal activation of NKT cells in the liverand kidney with high local levels of IFN-g will have tobe considered in future studies of immune function inthese organs.
ConclusionsInvariant natural killer T (iNKT) cells are activatedspontaneously in mouse liver and kidney. These activa-tion events are local, probably extravascular, and resultin the local secretion of IFN-g. This in turn results inthe local induction of IFN-g-responsive genes in non-immune tissue cells, namely hepatic parenchymal cellsand renal tubular epithelial cells. These activation eventsare spontaneous in the sense that they appear to beindependent of exogenous pathogenic material of bac-terial or viral origin. The cause of individual activationevents is still unclear. In general, however, the resultsare consistent with a widely held view that iNKT cellsare rendered spontaneously active by interaction with anendogenous ligand. In this study we demonstrate theseactivation events histologically. Further investigationsmay reveal the nature of the stimulatory event that liesat the heart of each activating focus. It will be importantto generalise these findings to the human case, and toassess the implications of these findings for liver andkidney immunopathology.
MethodsMice and organ preparationC57BL/6J mice were obtained from the specific patho-gen-free mouse facility in the Institute for Genetics Uni.Köln. We are enormously indebted to the many collea-gues and institutions that provided mice or organs forthis study. TLR2-/- [36], TLR4-/- [37], TLR9-/- [38],TLR2/4-/-[39] and MyD88-/- [40] mice were provided byProfessor Dr Marina Freudenberg (Max Planck Institutefor Immunobiology, Freiburg). IFN-g-/- mice [8], IFN-receptor deficient mice (IFNAR, [10]), (IFNGR, [9]) andSTAT-1-/- mice [41] were provided by Dr ThomasKolbe (University of Veterinary Medicine, Vienna).
Zeng and Howard BMC Biology 2010, 8:142http://www.biomedcentral.com/1741-7007/8/142
Page 8 of 12
RAG-1-/- mice [13] were provided by Dr Heike Weigh-ardt (Technische Universitaet Muenchen, Munich). JHTmice [14] were provided by Dr Ari Waisman (JohannesGutenberg-Universität Mainz, Mainz, Germany). Germ-free C57BL/6 mice were provided from three indepen-dent facilities, namely, University of Zürich, Zürich,Switzerland (Mr Rudolf Jörg), the Gulbenkian Instituteof Science, Oeiras, Portugal (Dr Jocelyne Demengeot)and the Karolinska Institute, Stockholm. CD1d-/- mice[21] were provided by Professor Luc van Kaer (Vander-bilt University Medical Center, TN, USA). Ja18-/- mice[22] were provided by Dr Maria C. Leite-de-Moraes,Hôpital Necker, Paris, France. MAVS/CARDIF-deficientmice [30] were provided by Dr Jürg Tschopp (Lausanne,Switzerland). MHC Ab-/- mice [23] were provided by DrJocelyne Demongeot (Gulbenkian Institute of Sciences,Oeiras, Portugal). TAP1-/- mice [24] were purchasedfrom the Jackson Laboratory (Maine, US). For all assays,wild-type C57BL/6 mice from the same donor facilitywere used as controls. To control germ-free C57BL/6mice, C57BL/6 mice from colonies maintained at SPFlevel from the same suppliers were used. All the abovemice were on the C57BL/6J background. SWR/J, SJL,C57BR/J, C57L/J, RIIIS/J, A/J and C57BR/cdJ strainswere purchased from The Jackson Laboratory (Maine,USA). In most cases, liver and kidneys were removed atthe donor animal facility, immediately fixed in coldTBS/4% paraformaldehyde and shipped at 4°C by thequickest route to the Institute for Genetics in Cologne,Germany.
Tissue preparationFor paraffin sections, mouse tissues were fixed in TBS/4% paraformaldehyde at 4°C and dehydrated through anethanol series at 4°C (50%, 70%, 90% and 96%). Tissueswere then transferred into isopropanol and finally into aparaffin:isopropanol (1:1) solution at 60°C. The isopro-panol was evaporated and fresh paraffin was thenreplenished several times at 60°C before the tissues(in paraffin) were moved to room temperature. Theembedded tissues were cut with a microtome RM 2065(Leica Microsystems, Wetzlar, Germany) into 6 μmthick serial sections. For cryosections, mouse liver wassnap-frozen in liquid nitrogen and cut into consecutiveserial sections (6 μm) using a cryotome CM 3050 S(Leica Microsystems).
ImmunohistochemistryParaffin sections were de-waxed in xylene and post-fixedin 4% paraformaldehyde (1 h, RT). For Irga6 or Irgm3staining, protein epitopes were demasked (10 min, boil-ing) in 10 mM citrate buffer (pH 6.0). For F4/80 or CD3staining, protein epitopes were demasked by 0.1% Tryp-sin (SIGMA Type II) solution (0.1% CaCl2, pH7.8) for
30mins at 37°C or in 1 mM EDTA (pH8.0) for 10 minat 100°C, respectively. Sections were then saturated withquenching buffer (0.3% H2O2, 20 min). After phosphatebuffered saline (PBS) washing, the sections were probedeither with rabbit anti-Irga6 antiserum 165/3 [42] ormouse anti-Irgm3 mAb (BD Transduction Laboratory)in DAKO diluent. HRP-staining was carried out withthe horseradish peroxidase (HRP)-substrate kit Histo-Green (Linaris, Wetzlar, Germany). Nuclei were coun-terstained with Nuclear Fast Red. For Irga6 and F4/80or CD3 double staining, Irga6 was first probed with165/3 and stained with HRP-substrate AEC (Sigma,MO, USA). The sections were then washed with PBS(1 h) and subsequently probed with anti-F4/80 mAb(Serotec, NC, USA) or anti-CD3 mAb (Vector Labora-tories, Linaris). The AP-staining was then carried outwith AP-substrate kit III (Vector laboratory, Linaris).For staining of cryo-sections, sections were fixed firstwith cold acetone (10 min), before probing with anti-Irga6 antiserum 165/3 or anti-TCR Vb8.1/8.2 mAb (BDPharmingen, CA, USA). The sections were then stainedwith the HRP-substrate kit HistoGreen for Irga6 or withAP-substrate kit III for TCR Vb 8. Samples were ana-lysed using Zeiss Axioplan II microscope (Zeiss, Jena,Germany) equipped with SPOT RT slider digital camera(Diagnostic Instruments, MI, USA).
Quantitation of Irga6 expression foci in histologicalsectionsIrga6 high expression foci were counted on stained6 μm histological sections using 100× total magnifica-tion. Sections 300 μm apart were examined in order toavoid repeated counts of the same high expressionpatch. A total of 30 fields were counted from eachorgan, from which the mean number of high expressionpatches per field was estimated. The raw data from allsuch determinations are presented in Additional file 1:Table S1.
Laser microdissectionConsecutive serial cryosections (6 μm) for liver wereprepared using a cryotome CM 3050 S (Leica Microsys-tems) and sections were carried on PALM Membrane-Slides (P.A.L.M. Microlaser Technologies, Bernried,Germany), which was covered with a polyethylenenaphthalate membrane. In order to avoid the RNAdegradation caused by the staining of sections with anti-body, the following procedure was followed. Consecutivesections were numbered (1, 2, 3, 4...). All sections withodd-numbers (1, 3...) were on one slide (named ‘A’) andthe sections with even numbers (2, 4...) on another slide(named ‘B’). Both slides were then fixed in 70% ethanol(-20°C). The B slide was stored at -80°C and the A slidewas stained for Irga6 with 165/3 using histogreen
Zeng and Howard BMC Biology 2010, 8:142http://www.biomedcentral.com/1741-7007/8/142
Page 9 of 12
substrate. Geographical locations of Irga6 focal expres-sion on the A slide were recorded photographically. TheB slide was then stained only with Nuclear Fast Red,dehydrated in an ethanol series (70%, 96%, 100% 2 mineach) and dried at 50°C. Irga6 focal expression waslocated on the B slide by referring to the photos of adja-cent sections on the A slide. The Irga6 expression fociand non-focus region on the B slides were then col-lected by laser microdissection (LMD) equipment gener-ously made available by Dr Margarete Odenthal(Institute for Pathology, University of Cologne, Cologne,Germany) consisting of an Interface Microbeam Minilaser (P.A.L.M Microlaser Technologies) and an Axio-vert 135 microscope (Zeiss). Total RNA from the dis-sected samples (50-100 foci) was extracted with theRNeasy Micro kit (QIAGEN, Hilden, Germany) andcDNA was synthesized with half of the total RNA withthe Superscript First-Strand Synthesis System for RT-PCR kit (Invitrogen, CA, USA).
Real-time PCRPCR was carried out in a Light Cycler I System (Roche,Berlin, Germany) using a LightCycler SYBR Green I PCRkit (Roche). The 5’ primers specific for Irga6 1A and 1Btogether with the common 3’ primer on the coding exonwere used to detect expression level of Irga6-1A andIrga6-1B transcript forms as target genes [4]. MouseGAPDH gene was used as a reference gene and inputcontrol (for primers see Additional file 4: Table S2). 2-4μL of cDNA from materials collected by LMD was usedas templates. Primer efficiency for Irga6-1A, -1B ormGAPDH was determined using liver cDNA dilutionseries (1, 1/10, 1/100...) as templates as described pre-viously [43]. The proportional increase in Irga6-1A or-1B expression for ‘foci’ to ‘non-foci’ was then deter-mined according to [43]. Melting curve analyses wereperformed in order to verify the amplification specificity.Each sample was tested in duplicate or triplicate. In orderto determine whether the final PCR products amplifiedfor Irga6-1A were -1A specific, 1A PCR products werecloned in to pGEM-T-easy (Promega, CA, USA) vectorand sequenced. The percentage of -1A specific cloneswas then calculated. For Irga6 high expression foci, allclones amplified for Irga6-1A were -1A, while for thenon-focal material, only 5.9% of clones amplified forIrga6-1A were -1A. The directly determined enrichmentfactor of 27.9 for Irga6-1A in Irga6 high expression foci(Figure 2C) can, therefore, be multiplied a factor of 16.9(100/5.9) in order to give a relative enrichment of over470 in Irga6-1A compared with non-focal tissue.
Nested-RT-PCRTotal RNA from mouse liver or lymph nodes wasextracted using the RNeasy Mini kit (QIAGEN) and
cDNA was synthesized using the Superscript First-Strand Synthesis System for RT-PCR kit (Invitrogen).One mcrolitre cDNA from the liver and T cells or 2-4μL of cDNA from laser dissected materials were used ineach of the following RT-PCR reactions as templates.Primers located in different exons were used to generatespecific products only from cDNA but not from geno-mic DNA (Additional file 4: Table S2). For nested-PCR,1 μL PCR product of the first round of PCR was used astemplate for the second PCR, making use of a nestedprimer and the common 3’ or 5’ primer. The cycle num-ber was always 45 for each round of PCR. All final PCR-products were verified by sequencing.
TCR repertoire screeningIn order to determine the TCR Vb usage and Va14junctional diversity, nested-RT-PCR was performed.cDNA from more than 50 Irga6 cored patches collectedby LMD or cDNA of 1000 lymphocytes from mesentericand cervical lymph nodes were synthesized and nested-RT-PCR was performed as described in [4] The Vb8and Cb primers [44] Va14 and Ca primers [16], Va2,Va8, Va17 primers [45] were described before (Addi-tional file 4: Table S2). The final products of nested-PCR were cloned into pGEM-T-easy (Promega) andsequenced. The sequences were compared to classicalTCR V sequences in the database online using IMGT/V-QUEST http://imgt.cines.fr/. Clones with a sequenceidentity of more than 95% to known TCR V sequenceswere identified as correct TCR V clones. Clones wereclassified into groups with same junctions. Representa-tives from each group were selected aligned and ana-lysed with free software GeneDoc (Version 2.6.002;http://www.nrbsc.org) and Vector NTI (Version 9, Invi-trogen). See Additional file 5: Table S3 for completejunction sequence data.
Additional material
Additional file 1: Table S1 - Quantification of Irga6 focal expressionpatches in liver and kidneys of various mouse strains. Focal Irga6expression was quantified on stained histological sections of liver andkidney from strains of mice listed, as described in Materials and Methods.Each value in the table is the mean number of expression foci permicroscope field averaged over 30 fields. WT = wild type; KO = knock-out, IFN R are mice lacking IFN-type I (IFNAR) and type II (IFNGR)receptors respectively; SPF = specific pathogen free; GF = germ-free;Portugal, Sweden and Switzerland refer to the national origins of threeindependent germ-free C57BL/6 strains.
Additional file 2: Figure S1 - Irga6 is over-expressed in the kidneyof RAG and JHT mice. Paraffin sections from kidneys of RAG or JHTmice were probed for Irga6 protein (Green). Nuclei were counterstainedin red. Kidneys from WT control mice were also included.
Additional file 3: Figure S2 - Irgm3 is co-expressed at Irga6expression foci in liver and kidney. Serial paraffin sections (6 μm) oforgans from C57BL/6 adult mice were prepared. In each case, twoadjacent serial sections were probed for Irga6 (1, green) and Irgm3
Zeng and Howard BMC Biology 2010, 8:142http://www.biomedcentral.com/1741-7007/8/142
Page 10 of 12
protein (2, green) respectively. Frames show enlarged images. Nucleiwere counter-stained in red.
Additional file 4: Table S2 - List of primers used in RT-PCR and Realtime PCR.
Additional file 5: Table S3 - Sequence comparison of identified TCRclones. Sequences of identified TCR Vb8 (A) and Va14/11 (B) clones fromIrga6 liver cored patches, and sequences of identified TCR Va11 (C)clones from lymph nodes were compared and classified into differentjunction types. The number of clones belonging to each junction typewas listed. Vb, Db, Jb, Va and Ja subfamily names were labeled (’ - ‘means not identifiable). TCR Vb-N(D)N-Jb or TCR Va-N-J junctionalsequences were displayed. ‘Short’ indicates that the length of thesequence was too short to identify the entire junctional region.
Abbreviationsa-GalCer: alpha-galactosyl ceramide; F: foci; NF: non-focus region; iNKT:invariant natural killer-like T cell; FN: interferon; IFNAR: IFN type I receptor;IFNGR: IFN type II receptor; IL: interleukin; HRP: horseradish peroxidase; IRG:immunity-related GTPases; MHC: major histocompatibility; MMTV: mousemammary tumour virus; PBS: phosphate buffered saline; PCR: polymerasechain reaction; qRT-PCR: quantitative reverse transcription PCR; TCR: T-cellreceptor; TLR: Toll-like receptor.
AcknowledgementsWe are very much indebted to Dr Margarete Odenthal, Institute ofPathology, University of Cologne, Cologne, Germany, for allowing us tomake extensive use of her LMD facility. This work would not have beenpossible without the generosity of many scientists who provided knock-outand wild-type mice (itemized in Materials and Methods) and in some casesalso enabled us to harvest tissues in their facilities. For this our thanks aredue to Marina Freudenberg (Freiburg, Germany), Maria Leite de Moraes(Paris, France), Luc Van Kaer (Vanderbilt, TN, USA), Jocelyne Demengeot(Oeiras, Portugal), Jurg Tschopp (Lausanne, Switzerland), Rudolf Jörg (Zürich,Switzerland), Thomas Kolbe (Vienna, Austria), Heike Weighardt (Munich,Germany) and Ari Waisman (Mainz, Germany). We are grateful to twoanonymous referees for suggesting that we identify iNKT cells moreexplicitly by examining tissues from mice deficient in Ja18, TAP and class IIMHC. We owe special thanks to Pia Scholl, Institute for Genetics, for herdevoted attention recently to the immunohistology of these as well as ofthe MAVS/CARDIF deficie.This work was supported in part by the University of Cologne, Cologne,Germany, and in part by grants in the Schwerpunktprogramm 1110 and thecollaborative research programme, SFB670 ‘Cell-autonomous Immunity’, bothfrom the Deutsche Forschungsgemeinschaft. Jia Zeng was supported in partfrom the International Graduate School in Genetics and FunctionalGenomics.
Author details1Institute for Genetics, University of Cologne, Zuelpicher Strasse 47a, 50674Cologne, Germany. 2Section of Experimental Therapeutics, Leeds Institute ofMolecular Medicine, Level 7, Wellcome Trust Brenner Building, St James’sUniversity Hospital, Leeds LS9 7TF, UK.
Authors’ contributionsJZ and JCH identified the problem and conceived the experimentalapproach. JZ performed all the experimental work, counted the histologicaldata and prepared the figures. JCH drafted the manuscript, which wascompleted collaboratively by JZ and JCH. Both authors read and approvedthe final manuscript.
Competing interestsThe authors declare that they have no competing interests.
Received: 17 June 2010 Accepted: 30 November 2010Published: 30 November 2010
References1. Bendelac A, Savage PB, Teyton L: The biology of NKT cells. Annu Rev
Immunol 2007, 25:297-336.2. Kronenberg M: Toward an understanding of NKT cell biology: progress
and paradoxes. Annu Rev Immunol 2005, 23:877-900.3. Gapin L: iNKT cell autoreactivity: what is ‘self’ and how is it recognized?
Nat Rev Immunol 2010, 10(4):272-277.4. Zeng J, Parvanova IA, Howard JC: A dedicated promoter drives
constitutive expression of the cell-autonomous immune resistanceGTPase, Irga6 (IIGP1) in mouse liver. PLoS ONE 2009, 4(8):e6787.
5. Kruger T, Benke D, Eitner F, Lang A, Wirtz M, Hamilton-Williams EE, Engel D,Giese B, Muller-Newen G, Floege J, Kurts C: Identification and functionalcharacterization of dendritic cells in the healthy murine kidney and inexperimental glomerulonephritis. J Am Soc Nephrol 2004, 15(3):613-621.
6. Boehm U, Guethlein L, Klamp T, Ozbek K, Schaub A, Fütterer A, Pfeffer K,Howard JC: Two families of GTPases dominate the complex cellularresponse to interferon-g. J Immunol 1998, 161:6715-6723.
7. Zerrahn J, Schaible UE, Brinkmann V, Guhlich U, Kaufmann SH: The IFN-inducible Golgi- and endoplasmic reticulum- associated 47-kDa GTPaseIIGP is transiently expressed during listeriosis. J Immunol 2002,168(7):3428-3436.
8. Dalton DK, Pitts-Meek S, Keshav S, Figari IS, Bradley A, Stewart TA: Multipledefects of immune cell function in mice with disrupted interferon-gamma genes. Science 1993, 259(5102):1739-1742.
9. Huang S, Hendriks W, Althage A, Hemmi S, Bluethmann H, Kamijo R,Vilcek J, Zinkernagel RM, Aguet M: Immune response in mice that lack theinterferon-gamma receptor. Science 1993, 259(5102):1742-1745.
10. Muller U, Steinhoff U, Reis LF, Hemmi S, Pavlovic J, Zinkernagel RM,Aguet M: Functional role of type I and type II interferons in antiviraldefense. Science 1994, 264(5167):1918-1921.
11. Doyle SE, Schreckhise H, Khuu-Duong K, Henderson K, Rosler R, Storey H,Yao L, Liu H, Barahmand-pour F, Sivakumar P, et al: Interleukin-29 uses atype 1 interferon-like program to promote antiviral responses in humanhepatocytes. Hepatology 2006, 44(4):896-906.
12. Bender H, Wiesinger MY, Nordhoff C, Schoenherr C, Haan C, Ludwig S,Weiskirchen R, Kato N, Heinrich PC, Haan S: Interleukin-27 displaysinterferon-gamma-like functions in human hepatoma cells andhepatocytes. Hepatology 2009, 50(2):585-591.
13. Mombaerts P, Iacomini J, Johnson RS, Herrup K, Tonegawa S,Papaioannou VE: RAG-1-deficient mice have no mature B and Tlymphocytes. Cell 1992, 68(5):869-877.
14. Gu H, Zou YR, Rajewsky K: Independent control of immunoglobulinswitch recombination at individual switch regions evidenced throughCre-loxP-mediated gene targeting. Cell 1993, 73(6):1155-1164.
15. Acha-Orbea H, MacDonald HR: Superantigens of mouse mammary tumorvirus. Annu Rev Immunol 1995, 13:459-486.
16. Lantz O, Bendelac A: An invariant T cell receptor alpha chain is used by aunique subset of major histocompatibility complex class I-specific CD4+and CD4-8-T cells in mice and humans. J Exp Med 1994, 180(3):1097-1106.
17. Wilson RK, Lai E, Concannon P, Barth RK, Hood LE: Structure, organizationand polymorphism of murine and human T-cell receptor alpha and betachain gene families. Immunol Rev 1988, 101:149-172.
18. Haqqi TM, Banerjee S, Anderson GD, David CS: RIII S/J (H-2r). An inbredmouse strain with a massive deletion of T cell receptor V beta genes. JExp Med 1989, 169(6):1903-1909.
19. Apostolou I, Cumano A, Gachelin G, Kourilsky P: Evidence for twosubgroups of CD4-CD8-NKT cells with distinct TCR alpha betarepertoires and differential distribution in lymphoid tissues. J Immunol2000, 165(5):2481-2490.
20. Chen YH, Chiu NM, Mandal M, Wang N, Wang CR: Impaired NK1+ T celldevelopment and early IL-4 production in CD1-deficient mice. Immunity1997, 6(4):459-467.
21. Mendiratta SK, Martin WD, Hong S, Boesteanu A, Joyce S, Van Kaer L:CD1d1 mutant mice are deficient in natural T cells that promptlyproduce IL-4. Immunity 1997, 6(4):469-477.
22. Cui J, Shin T, Kawano T, Sato H, Kondo E, Toura I, Kaneko Y, Koseki H,Kanno M, Taniguchi M: Requirement for Valpha14 NKT cells in IL-12-mediated rejection of tumors. Science 1997, 278(5343):1623-1626.
Zeng and Howard BMC Biology 2010, 8:142http://www.biomedcentral.com/1741-7007/8/142
Page 11 of 12
23. Cosgrove D, Gray D, Dierich A, Kaufman J, Lemeur M, Benoist C, Mathis D:Mice lacking MHC class II molecules. Cell 1991, 66(5):1051-1066.
24. Van Kaer L, Ashton-Rickardt PG, Ploegh HL, Tonegawa S: TAP1 mutantmice are deficient in antigen presentation, surface class I molecules, andCD4-8+ T cells. Cell 1992, 71(7):1205-1214.
25. Ascon DB, Ascon M, Satpute S, Lopez-Briones S, Racusen L, Colvin RB,Soloski MJ, Rabb H: Normal mouse kidneys contain activated and CD3+CD4-CD8-double-negative T lymphocytes with a distinct TCRrepertoire. J Leukoc Biol 2008, 84(6):1400-1409.
26. Winau F, Hegasy G, Weiskirchen R, Weber S, Cassan C, Sieling PA,Modlin RL, Liblau RS, Gressner AM, Kaufmann SH: Ito cells are liver-residentantigen-presenting cells for activating T cell responses. Immunity 2007,26(1):117-129.
27. Kida Y, Asahina K, Inoue K, Kawada N, Yoshizato K, Wake K, Sato T:Characterization of vitamin A-storing cells in mouse fibrous kidneysusing Cygb/STAP as a marker of activated stellate cells. Arch Histol Cytol2007, 70(2):95-106.
28. Brigl M, Brenner MB: How invariant natural killer T cells respond toinfection by recognizing microbial or endogenous lipid antigens. SeminImmunol 2003, 22(2):79-86.
29. Mattner J, Debord KL, Ismail N, Goff RD, Cantu C, Zhou D, Saint-Mezard P,Wang V, Gao Y, Yin N, et al: Exogenous and endogenous glycolipidantigens activate NKT cells during microbial infections. Nature 2005,434(7032):525-529.
30. Michallet MC, Meylan E, Ermolaeva MA, Vazquez J, Rebsamen M, Curran J,Poeck H, Bscheider M, Hartmann G, Konig M, et al: TRADD protein is anessential component of the RIG-like helicase antiviral pathway. Immunity2008, 28(5):651-661.
31. Li L, Huang L, Sung SS, Lobo PI, Brown MG, Gregg RK, Engelhard VH,Okusa MD: NKT cell activation mediates neutrophil IFN-gammaproduction and renal ischemia-reperfusion injury. J Immunol 2007,178(9):5899-5911.
32. Yang SH, Kim SJ, Kim N, Oh JE, Lee JG, Chung NH, Kim S, Kim YS: NKT cellsinhibit the development of experimental crescentic glomerulonephritis.J Am Soc Nephrol 2008, 19(9):1663-1671.
33. Mesnard L, Keller AC, Michel ML, Vandermeersch S, Rafat C, Letavernier E,Tillet Y, Rondeau E, Leite-de-Moraes MC: Invariant natural killer T cells andTGF-beta attenuate anti-GBM glomerulonephritis. J Am Soc Nephrol 2009,20(6):1282-1292.
34. Geissmann F, Cameron TO, Sidobre S, Manlongat N, Kronenberg M,Briskin MJ, Dustin ML, Littman DR: Intravascular immune surveillance byCXCR6+ NKT cells patrolling liver sinusoids. PLoS Biol 2005, 3(4):e113.
35. Kronenberg M, Gapin L: The unconventional lifestyle of NKT cells. Nat RevImmunol 2002, 2(8):557-568.
36. Takeuchi O, Hoshino K, Kawai T, Sanjo H, Takada H, Ogawa T, Takeda K,Akira S: Differential roles of TLR2 and TLR4 in recognition of gram-negative and gram-positive bacterial cell wall components. Immunity1999, 11(4):443-451.
37. Poltorak A, He X, Smirnova I, Liu MY, Huffel CV, Du X, Birdwell D, Alejos E,Silva M, Galanos C, Freudenberg M, et al: Defective LPS signaling in C3H/HeJ and C57BL/10ScCr mice: mutations in Tlr4 gene. Science 1998, , 282:2085-2088.
38. Hemmi H, Takeuchi O, Kawai T, Kaisho T, Sato S, Sanjo H, Matsumoto M,Hoshino K, Wagner H, Takeda K, Akira S: A Toll-like receptor recognizesbacterial DNA. Nature 2000, 408(6813):740-745.
39. Lembo A, Kalis C, Kirschning CJ, Mitolo V, Jirillo E, Wagner H, Galanos C,Freudenberg MA: Differential contribution of Toll-like receptors 4 and 2to the cytokine response to Salmonella enterica serovar Typhimuriumand Staphylococcus aureus in mice. Infect Immun 2003, 71(10):6058-6062.
40. Adachi O, Kawai T, Takeda K, Matsumoto M, Tsutsui H, Sakagami M,Nakanishi K, Akira S: Targeted disruption of the MyD88 gene results inloss of IL-1- and IL-18-mediated function. Immunity 1998, 9(1):143-150.
41. Meraz MA, White JM, Sheehan KC, Bach EA, Rodig SJ, Dighe AS, Kaplan DH,Riley JK, Greenlund AC, Campbell D, et al: Targeted disruption of the Stat1gene in mice reveals unexpected physiologic specificity in the JAK-STATsignaling pathway. Cell 1996, 84(3):431-442.
42. Martens S, Sabel K, Lange R, Uthaiah R, Wolf E, Howard JC: Mechanismsregulating the positioning of mouse p47 resistance GTPases LRG-47 andIIGP1 on cellular membranes: retargeting to plasma membrane inducedby phagocytosis. J Immunol 2004, 173:2594-2606.
43. Pfaffl MW: A new mathematical model for relative quantification in real-time RT-PCR. Nucleic Acids Res 2001, 29(9):e45.
44. Kawagishi A, Kubosaki A, Takeyama N, Sakudo A, Saeki K, Matsumoto Y,Hayashi T, Onodera T: Analysis of T-cell receptor Vbeta gene frominfiltrating T cells in insulitis and myocarditis in encephalomyocarditisvirus-infected BALB/C mice. Biochem Biophys Res Commun 2003,310(3):791-795.
45. Yoshida R, Yoshioka T, Yamane S, Matsutani T, Toyosaki-Maeda T, Tsuruta Y,Suzuki R: A new method for quantitative analysis of the mouse T-cellreceptor V region repertoires: comparison of repertoires among strains.Immunogenetics 2000, 52(1-2):35-45.
doi:10.1186/1741-7007-8-142Cite this article as: Zeng and Howard: Spontaneous focal activation ofinvariant natural killer T (iNKT) cells in mouse liver and kidney. BMCBiology 2010 8:142.
Submit your next manuscript to BioMed Centraland take full advantage of:
• Convenient online submission
• Thorough peer review
• No space constraints or color figure charges
• Immediate publication on acceptance
• Inclusion in PubMed, CAS, Scopus and Google Scholar
• Research which is freely available for redistribution
Submit your manuscript at www.biomedcentral.com/submit
Zeng and Howard BMC Biology 2010, 8:142http://www.biomedcentral.com/1741-7007/8/142
Page 12 of 12
Related Documents