Sponsored by: Bank of America Bank of New York Citigroup Foundation Fannie Mae Foundation J.P. Morgan Chase New York City Department of Housing Preservation and Development New York State Association for Affordable Housing The Surdna Foundation Technology Opportunities Program, United States Department of Commerce Washington Mutual

Welcome message from author
This document is posted to help you gain knowledge. Please leave a comment to let me know what you think about it! Share it to your friends and learn new things together.
Transcript

Sponsored by:
Bank of America Bank of New York
Citigroup Foundation Fannie Mae Foundation
J.P. Morgan Chase New York City Department of Housing Preservation and Development
New York State Association for Affordable Housing The Surdna Foundation
Technology Opportunities Program, United States Department of Commerce Washington Mutual

STATE OF NEW YORK CITY’S
HOUSING & NEIGHBORHOODS
2005
Vicki Been Caroline K. Bhalla Ingrid Gould Ellen
Solomon J. Greene Andrew E. Schinzel
Ioan Voicu
Project Director: Research Assistants: Graphic Design & Layout: Andrew Schinzel Michael Gedal, Christa Jones, Rachel Meltzer, Sesha Pochiraju Keren Mertens, & Sesha Pochiraju

Many people in New York City’s housing community also assisted us by providing data, information, and guid-ance. We would like to thank the following people for their help: Richard Bernard New York City Department of Buildings Sue Clay Public Data Corporation David Chen New York City Police Department Nancy Feinberg New York City Department of Finance Thomas Gallagher Lepercq, Inc. Kenneth Garcia New York City Department of Education Delores Jacobs New York City Department of Housing Preservation and Development Gerald Koszer New York City Department of Finance Moon Wha Lee New York City Department of Housing Preservation and Development Annette Malatesta New York City Department of Finance Sam Miller New York City Department of Finance Chandra Mohan New York City Department of Finance Dan Moliterno New York City Department of Housing Preservation and Development Calvin Parker New York City Department of Housing Preservation and Development Cary Peskin New York City Department of Housing Preservation and Development Randall Scheessele United States Department of Housing and Urban Development Pat Sammut New York City Department of Finance Bill Sears New York City Department of City Planning Harold Shultz New York City Department of Housing Preservation and Development Anne-Marie Flatley New York City Housing Authority
Bernie Carr New York State Association for Affordable
Housing Mark Castle
Bank of New York Maurice Coleman Bank of America
The Honorable Shaun Donovan New York City Department
of Housing Preservation and Development Donald Druker
Technology Opportunities Program, United States Department of Commerce
Allen Gomez Washington Mutual
Kil Huh Fannie Mae Foundation
Marc Jahr Citigroup Foundation Vanitha Venugopal
The Surdna Foundation Mark Willis
J.P. Morgan Chase
Cover photos: Gail Pickett We would also like to thank Frank Lopresti, Paul Sporaco, and Yakov Smotritsky for their help in data management. Any errors in this report are the sole responsibility of the Furman Center. Any views expressed herein be-long entirely to the Furman Center, and not to our sponsors or those who kindly provided their assistance.
This report could not have been produced without the assistance and support of a large number of people. The Furman Center would like to thank our generous sponsors for making this effort possible.
Acknowledgments

T A B L E O F C O N T E N T S
1 Overview
5 Recent Trends in the Availability and Affordability of Housing in New York City 17 Notes on the 2005 Edition
18 Indicators
27 New York City
31 Bronx
47 Brooklyn
69 Manhattan
85 Queens
103 Staten Island
110 Appendix: Methods
113 Community District Index
114 About NYCHANIS
115 About PlanNYC
116 About the Furman Center


The Furman Center is pleased to present the 2005 edition of the State of New York City’s Housing and Neighborhoods (State of the City Report, for short). Every year the Furman Center compiles statistics on housing, demographics and quality of life in New York City’s neighborhoods from a variety of sources. The data is made available in full through our online data service, the New York City Housing and Neighborhood Information System, NYCHANIS.com. For the past five years, the Furman Center also has published the data in yearly editions of the State of the City Report. Because NYCHANIS provides data on more than 1800 different measures, the published report was becoming increasingly unwieldy, and we feared the volume of information might divert readers from the important insights the data provides about trends and future challenges. Accordingly, this edition streamlines the presentation to focus attention on the critical data that reveals how the City, its five boroughs, and its 59 community districts, have fared in recent years. It shows how each of the City’s neighborhoods is progressing, both in absolute terms and in relation to other areas of the City. It provides the first independent analysis of the just released results of the 2005 Housing and Vacancy Survey. Finally, it adds a chapter analyzing how the affordability and availability of housing have changed between 2002 and 2005. The new format and the analysis provided in the pages that follow reveal two important trends:
One: In the past three years, the combination of falling real incomes and rising rents has significantly increased the burden housing costs impose upon the City’s households, especially those households earning incomes paid to the workforce that staff the City’s police, fire and other basic services.
In the three years between 2002 and 2005, the median monthly rent for unsubsidized apartments in the City increased by 20 percent. Even after adjusting for inflation, the median monthly rent increased by more than 8 percent. But the citywide median income fell by 6.3 percent, again adjusted for inflation, during those three years. The combination of decreasing real income and increasing real rents (not to mention other rising housing costs, such as heating bills), left individuals and families in a serious bind: the median share of income spent on rent by New York City renters rose from 28.6 percent in 2002 to 31.2 percent in 2005, surpassing the 30 percent threshold that is commonly considered the maximum burden households should bear. Among unsubsidized, low-income renters, the median share of income spent on rent rose to over 50 percent in 2005, up from 43.9 percent in 2002. The number of rental units available at rents affordable to low and moderate income households in the City fell significantly in just three years. The number of units available for less than $600 per month (in 2005 dollars), for example, fell by 11 percent; the number of units available at rents between $600 and $799 fell 17.6 percent. To assess what the rise in rents and the decrease in the number of rental units available at lower rents means for residents of the City, it is helpful to look at the number of housing units that households with modest incomes could afford (i.e., that require less than 30 percent of the household’s gross income). To rent an apartment for $600, a household would have to make nearly $24,000 (just under 60 percent of the City’s median income in 2005). The number of units available at rents that would qualify as affordable for such a household fell by 91,652 units between 2002 and 2005.1 That is a drop of almost 15 percent, in just three years. The drop leaves only 26 percent of the City’s housing units affordable to such households.
2005 overview
1 | TH
E FURM
AN
CEN
TER FOR REA
L ESTATE &
URBA
N PO
LICY

Similarly, to rent an apartment for $800, a household would need to earn $32,000 (almost 80 percent of the City's median income in 2005). The number of rental units affordable to households earning 80 percent of the City’s median income fell by almost 205,000 units in the last three years. Although 58 percent of the City’s rental housing was affordable to such a household in 2002, only 48 percent of the rental stock was affordable to that same household in 2005. To put those numbers in perspective, the City's firefighters currently earn $32,740 in starting salary.2
Two: Home values are appreciating rapidly, and homeownership rates are up, but more lending is at subprime rates.
The median price of condominiums sold in the City rose 12 percent between 2002 and 2004, reaching $430,000 in 2004. The average sales price per unit of 2 to 4 family homes rose even more rapidly, increasing by 34 percent over this two-year period. Housing appreciation obviously is a significant benefit to existing homeowners. The downside of rising home prices is that they may make homeownership difficult for more households. Nonetheless, the rate of homeownership continued to rise in recent years -- from 32.7 in 2002 to 33.3 percent in 2005. Other promising signs include: the rate of notices of foreclosure issued fell slightly citywide between 2002 and 2004, and the percent of properties with tax delinquencies of more than one year dropped significantly during that period. The warning sign, though, is that the percentage of home purchase loans that were subprime more than doubled between 2002 and 2004. While subprime lending may allow borrowers with imperfect credit records to gain access to financing, some subset of these subprime loans are predatory and force borrowers to pay unreasonably high interest rates, making them far more vulnerable to foreclosure risk. In 14 community districts, over 30 percent of all home purchase loans were subprime in 2005, and in two, the share of refinance loans that were subprime was fifty percent or higher.
The rental affordability problem
The drop in the availability of affordable rental housing should be viewed in the context of several other trends: • The decline in rental units available at rates affordable to households with modest incomes occurred
despite a record increase in levels of residential construction. During the 2002 to 2005 period, housing production accelerated and population growth slowed down, so that housing stock grew almost three times faster than housing demand (average annual increase in stock was 14,100 units, compared to a 4,800 unit increase in demand).
• While the new construction added to the rental stock, that stock shifted significantly up-market. The
number of units available at rents of less than $1,000 (in 2005 constant dollars) fell by 156,833 between 2002 and 2005, the number rented for $1,400 or more grew by 63,187 – an increase of almost 25 percent.
• Between 2002 and 2005, the number of rental units in the City grew by only 0.4 percent, while the
number of condos and other owned units grew by 3.5 percent. • The pace of new construction would have to continue to surpass the rate of population growth in the City in
order to relieve the pressure on the rental housing market. The City came out of the 1990s with a
___________________________________________________________________________________________________ 1 The U.S. Department of Housing and Urban Development (HUD) and the New York City Housing Preservation and Development (HPD)
use a different "area median income" for their calculations about the affordability of housing, defined for the broader metropolitan area and differentiated by household size. Using the HUD/HPD area median income for a 3-person family (the approximate house-hold size in New York City), which was $56,500 in both 2002 and 2005, would show that the number of units affordable for low income households earning 60% of the area median income dropped even more significantly, by 311,278 units. We have used the more conservative estimate based on only the City's median income, which was considerably lower than the broader metropolitan area's median.
2 The source for the firefighters’ salary is http://www.nyc.gov/html/fdny/html/community/firefighter_faq.shtml#start_salary.
2

significant imbalance between the demand for and supply of housing: during that decade, housing demand grew at a rate of 17,800 units annually, while housing stock grew less than half as quickly, at 7,900 per year. Accordingly, construction today must not only meet the needs of any growth in the City’s population, but must also catch up from the imbalance of the 1990s.
• We estimate that the difference between the current demand for housing and the current supply was
about 100,000 units in 2005. That deficit is large, but if housing production continues at the pace set between 2002 and 2005, and population doesn’t grow unexpectedly, that difference will drop significantly in the next few years.
• New housing production does, of course, also have to meet the needs of tomorrow’s population, which is
predicted to grow by 1.2 million over the next 20 years.3
• The decline in units renting at rates affordable to households below the City’s median income stemmed primarily from increasing rents for units receiving no subsidies under government housing programs. Although there have been much-publicized losses in the stock of subsidized housing in the past few years, as subsidy periods expired and units converted to rent-regulated or market rents, those losses do not explain the enormous changes in the affordable housing stock since 2002. While the share of all rental units that were subsidized fell from 17 percent to 15 percent since 2002, that accounts for only 38,000 units. The losses in affordable rental stock occurred not just in the subsidized units, therefore, but in the rent-regulated and market-rate units as well.
• The Mayor’s ambitious 10-year affordable housing plan, which envisions the construction and preservation
of 116,874 rental and 48,158 homeownership units, has to be viewed against the declining numbers of units priced at rent levels affordable to lower and moderate income households. The Mayor has promised to provide 73,335 new rental units by 2013, and to preserve another 43,539 existing rental units during that time. More than two-thirds of the rental units provided under the plan will be targeted to households earning $50,240 or less.
• New construction may not continue at today’s record pace. The percentage of the City’s buildable land
made up of vacant lots fell from 7.5 percent to 6.8 percent between 2003 and 2005. In recent years, the City has rezoned some land for higher density residential development, but it has rezoned many communities for lower density development than previous zoning allowed. Interest rates are an important factor in the level of housing production, and some of the other costs of constructing new housing are rising significantly as a result of growing demand for building materials around the world, and increasing prices for oil and oil-based products.
The City has seen significant improvements in many measures of neighborhood quality, but some
neighborhoods are faring better than others.
For the first time, this edition of the State of the City Report ranks the boroughs and the community districts within boroughs by each measure of housing and neighborhood vitality. Those rankings allow users to quickly identify neighborhoods that are gaining or losing ground relative to other areas of the City. Significant improvements in the City’s quality of life, such as decreasing crime rates and increasing school performance, are benefiting almost all neighborhoods. Other improvements are not shared as widely. • The percentage of households living below the poverty line fell slightly for the City as a whole, from 17.5
to 17.3, and many neighborhoods saw decreases in poverty. But 35 neighborhoods saw poverty rates increase.
3 | THE FU
RMA
N C
ENTER FO
R REAL ESTA
TE & U
RBAN
POLIC
Y
___________________________________________________________________________________________________ 3 This population growth projection is produced by Urbanomics, a consultant to the New York Metropolitan Transportation Council, and
was reported in the New York Times story, “Coming Soon, 9 Million Stories in the Crowded City,” February 19, 2006 (available at http://www.nytimes.com/2006/02/19/nyregion/19population.html).
• The rental vacancy rate for the City as a whole increased (indicating that the rental market is a little less tight) between 2002 and 2005. Some neighborhoods saw a tightening. For example, neighborhoods throughout the Bronx witnessed a sharp decline in rental vacancy rates in recent years, and although the borough had the second highest vacancy rate in 2002, it now has the lowest vacancy rate in the City.
• The percentage of home purchase and refinancing loans that were subprime increased across the City, but
the distribution of subprime lending activity changed significantly over the past three years. Crown Heights, Brooklyn, for example, moved 17 places, going from one of the neighborhoods with a fairly low percentage of subprime home purchase loans in 2002 to one of the neighborhoods with a relatively high percentage in 2005. On the other hand, Greenpoint/Williamsburg, Brooklyn saw a dramatic decline in subprime lending activity, dropping 19 places in the ranking.
• The rate of notices of foreclosure fell for the city as a whole, and some neighborhoods (such as
Morrisania/Crotona) saw significant decreases; but some neighborhoods (such as Washington Heights) saw increases.
• The racial diversity index for the City as a whole slightly increased (indicating that the City became more
diverse) between 2002 and 2005. Some neighborhoods saw declines in diversity, however. For example, Kingsbridge Heights/Bedford Park and Jackson Heights dropped 10 and 12 places in ranking, respectively.
It is our hope that the changes in this edition of the State of New York City’s Housing and Neighborhoods will allow you to see the big picture, spot trouble signs that portend challenges for the future, and see how neighborhoods are faring relative to others in the City. Our goal at the Furman Center is to provide both data and analysis that will help neighborhoods – and the organizations that serve them – more effectively target their efforts to make communities better, to guide public policy regarding housing and land use regulation, and to inform public debate. We hope you find this edition of the State of the City Report helpful and provocative. Please keep us informed of how you use the report, how you like the changes, and any suggestions you have for further improvement. You can send any comments to [email protected].
4

5 | TH
E FURM
AN
CEN
TER FOR REA
L ESTATE &
URBA
N PO
LICY
Recent Trends in the Availability & Affordability of Housing in New York City
Mike Gedal Ioan Voicu
A broad range of interests – from affordable housing advocates to businesses worried about their workforce – are increasingly concerned that housing affordability in the City is declining rapidly, and that at least one of the causes of that decline is a shortage of housing in the City. In this chapter we use the most recent data from the 2005 New York City Housing and Vacancy Survey (HVS) to assess these concerns. First, we examine changes in affordability over the last three years, and do find a striking decrease in the number of units that are affordable to lower-income City residents. Second, we analyze the balance between the demand for, and supply of, housing in the City by looking at the extent to which the housing stock has grown relative to changes in population in recent years. After looking at those trends, we offer a snapshot assessment of the size of the imbalance between housing demand and supply as of 2005.
RECENT TRENDS IN HOUSING AFFORDABILITY
Despite strong growth in the overall housing stock in recent years, a combination of falling real incomes (adjusted for inflation) and rising rents has significantly increased the burden of housing costs for New Yorkers. Real median household income decreased between 2002 and 2005 by more than 6.3 percent. During the same time, median monthly rent increased by more than 8 percent in real terms. That combination of decreasing real income and increasing real rents (not to mention other rising housing costs, such as heating bills), left individuals and families in a serious bind: the median share of income spent on rent by New York City renters rose from 28.6 percent in 2002 to 31.2 percent in 2005, surpassing the 30 percent threshold that is commonly considered the maximum burden households should bear.
From 2002 to 2005, the citywide housing stock grew considerably faster than during the 1990s. As indicated in Table 1, total available units in the City increased by an annual average of over 14,000 units between 2002 and 2005, compared to just 8,000 in the 1990s. But despite the brisk pace of production in recent years, the number of rental units grew significantly slower than owner housing. There were 35,000 owner units added to the stock between 2002 and 2005, but the City gained just 7,600 rental units over this same period. This figure is particularly striking considering that two-thirds of units in the City are rentals.
While the City’s overall rental stock experienced modest growth over the last three years, the size of the subsidized housing stock fell by 11 percent, from 345,000 in 2002 to about 308,000 in 2005.1 This decline – remarkable in that it took place over the course of just three years – has also been documented in various recent reports.2 The trend in subsidized housing in New York City is an important component of affordability, but the story is incomplete without an examination of affordability that also includes unsubsidized rental units.
Table 2 reveals significant changes in overall rent levels in the City. Even after controlling for inflation, the number of rental units available at rents affordable to low and moderate income households has fallen significantly since 2002.3 These increases in rent levels are especially disconcerting given the decline in citywide median income from 2002 to 2005.
As indicated in panel A of Table 2, the number of units available citywide for less than $600 a month (reported in 2005 dollars) decreased by more than 56,000 units – or 11 percent – from 2002 to 2005. The number of units renting for between $600 and $799 decreased by almost 90,000 units, or 17.6 percent. On the other hand, the number of units renting for $1,000 or above grew by over 30 percent, or 172,000 units, in just three years.
1 These figures are calculated from Table 2 by subtracting unsubsidized rental units (panel B) from total rental units (panel A).
2 See, for example, Waters and Bach 2006.
3 Note that our analysis of affordability does not account for changes in average unit size (number of rooms) or average household size that may have occurred between 2002 and 2005. However, Census estimates indicate that average household size in New York City remained steady (about 2.5 persons) between 2000 and 2004. Additionally, the average number of bedrooms in rental units remained virtually unchanged (about 2.6 bedrooms) between 2002 and 2005.

6
Notes: 1 Housing stock in 1990 is adjusted to reflect the undercount in the 1990 Census, based on estimates produced by the NYC Department of City Planning (NYC DCP). Total available housing stock is obtained for 1990 by applying borough-level percent total available units as reported by NYC DCP unit counts.
2 Total available housing stock in 2002 and 2005 excludes units classified in HVS as either "vacant unavailable" or "vacant dilapidated." For 1990 and 2000, it was not possible to remove dilapidated vacant units, as Census counts do not identify these units. However, HVS data suggest that the number of vacant dilapidated units was miniscule; in 2002 and 2005, respectively, there were 718 and 211 dilapidated vacant units citywide.
3 For the purposes of this table, rental housing stock includes all rental units, regardless of reported rent. Note that the rent level analysis in Table 2 reports a somewhat smaller rental housing stock due to exclusion of units with missing or zero rent.
Sources: 1990 and 2000: Census; NYC Dept. of City Planning
2002 and 2005: HVS
Table 2. Rent Levels in New York City,1 2002-2005
A. Total Available Rental Units by Rent Level, Adjusted for InflationDistribution of Units
Rent Level Across Rent LevelsExpressed in 2005$ 2002 2005 Change % Change 2002 2005
$1 - $599 515,381 458,840 -56,541 -11.0% 25.3% 22.3%$600 - $799 509,525 419,740 -89,785 -17.6% 25.0% 20.4%$800 - $999 452,437 441,931 -10,506 -2.3% 22.2% 21.5%$1,000 - $1,199 186,090 241,312 55,222 29.7% 9.1% 11.7%$1,200 - $1,399 118,526 172,213 53,688 45.3% 5.8% 8.4%$1,400 and above 257,825 321,012 63,187 24.5% 12.6% 15.6%
Total Units22,039,784 2,055,049 15,264 0.7% 100% 100%
B. Unsubsidized Rental Units3 by Rent Level, Adjusted for InflationDistribution of Units
Rent Level Across Rent LevelsExpressed in 2005$ 2002 2005 Change % Change 2002 2005
$1 - $599 295,650 250,919 -44,730 -15.1% 17.4% 14.4%$600 - $799 460,683 372,980 -87,703 -19.0% 27.2% 21.3%$800 - $999 418,557 414,133 -4,423 -1.1% 24.7% 23.7%$1,000 - $1,199 171,319 229,477 58,158 33.9% 10.1% 13.1%$1,200 - $1,399 109,816 167,366 57,550 52.4% 6.5% 9.6%$1,400 and above 238,454 312,886 74,432 31.2% 14.1% 17.9%
Total Unsubsidized Units21,694,478 1,747,762 53,284 3.1% 100.0% 100.0%
Notes: 1 Rent is expressed in constant 2005 dollars for both 2002 and 2005; monthly rent is calculated as the contract rent rounded to the nearest dollar, since gross rent was unavailable for vacant units. Contract rent is also the more conservative measure of affordability.
2 All counts exclude units where rent is missing or zero. As a result, total available rental units in this table are somewhat smaller than the total number of available rental units reported in Table 1. Total available housing stock excludes units classified in HVS as either “vacant unavailable” or “vacant dilapidated.”
3 Unsubsidized units include market rate and rent-controlled/rent-stabilized units.
Sources: HVS 2002, 2005
Table 1. Housing Stock in New York City, 1990-2000 and 2002-2005
A. Changes in Housing Stock, 1990-20001990 2000 Change % Change Annual Avg.
Total Available Housing Stock1,23,029,127 3,107,734 78,607 2.6% 7,861
B. Changes in Housing Stock, 2002-20052002 2005 Change % Change Annual Avg.
Total Available Housing Stock2 3,081,772 3,124,144 42,372 1.4% 14,124
Owner Housing Stock 997,003 1,031,780 34,777 3.5% 11,592
Rental Housing Stock32,084,769 2,092,363 7,595 0.4% 2,532

At the same time, the stock of units renting for between $800 and $999 remained relatively steady, dropping by only 2.3 percent over this period. Focusing solely on the unsubsidized rental stock (Table 2, panel B), the recent decrease in affordability is even more pronounced. Whereas the number of total units renting for less than $800 (in 2005 dollars) decreased by 14 percent across all rental units, unsubsidized units experienced a decline of 18 percent.
To assess what the rise in rents (and the decrease in the number of rental units available at lower rents) means for New Yorkers, it is helpful to look at the number of
housing units that households with modest incomes could afford (in other words, that require less than 30 percent of the household’s gross income). In Table 3, we show the number and share of rental units in the City that would be affordable to households making various percentages of the City’s median income, in 2002 and in 2005, and calculate the change in those numbers during that period. Table 3 shows that, in 2002, almost 632,000 units rented at rates affordable to a household making 60 percent of the City’s median income in 2002. In 2005, however, only 540,000 apartments were available at rents affordable to a household making 60 percent of the City’s median income in 2005. The number of units available at rents that would qualify as affordable for
Notes:
1 For the purposes of this table, median monthly income is taken from HVS 2002 and 2005. HVS 2002 reports income as of 2001 (in 2001 dollars), while HVS 2005 reports 2004 income (in 2004 dollars). To ensure a valid comparison of rent and income, we transform median monthly income figures for 2001 into 2002 dollars and for 2004 into 2005 dollars. 2 Affordable units are defined as those renting for up to 30% of household income. Monthly rent for each units is calculated as the contract rent rounded to the nearest dollar, since gross rent was unavailable for vacant units. Contract rent is also the more conservative measure of affordability. 3 All counts exclude units where rent is missing or zero. As a result, total available rental units in this table are somewhat smaller than the total number of available rental units reported in Table 1. The counts also exclude units classified in HVS as either “vacant unavailable” or “vacant dilapidated.” Sources: HVS 2002, 2005
7 | TH
E FURM
AN
CEN
TER FOR REA
L ESTATE &
URBA
N PO
LICY
Table 3. Affordability of Rental Housing in New York City, 2002-2005
A. Affordable Rental Units (Where Rent Burden ≤ 30%), by Income Level
Household Number of Affordable Units2 Share of Total Rental Units
Income Level1 by Income Level that Are Affordable(% of New York City (Cumulative count) by Income Level
Median Income) 2002 2005 Change % Change 2002 2005
30% median 175,673 172,295 -3,378 -1.9% 8.6% 8.4% 60% median 631,734 540,083 -91,652 -14.5% 31.0% 26.3% 80% median 1,189,962 985,063 -204,899 -17.2% 58.3% 47.9% 100% median 1,564,355 1,425,688 -138,667 -8.9% 76.7% 69.4%
Total Rental Units 32,039,784 2,055,049 15,264 0.7%
B. Maximum Affordable Rent, by Income LevelHousehold
Income Level1 Annual Maximum Annual Maximum(% of New York City income1 affordable rent income1 affordable rent
Median Income)
30% median $11,994 $300 $12,451 $311 60% median $23,988 $600 $24,902 $623 80% median $31,984 $800 $33,203 $830 100% median $39,980 $999 $41,504 $1,038
2002 (in 2002$) 2005 (in 2005$)

8 such a household thus fell by 91,652 units from 2002 to 2005.4 That is a drop of 15 percent in just three years. The drop leaves only 26 percent of the City’s housing units affordable to such households in 2005. Similarly, the number of rental units affordable to households earning 80 percent of the City’s median income fell by almost 205,000 units in the last three years. Although 58 percent of the City’s rental housing was affordable to such a household in 2002, only 48 percent of the rental stock was affordable to that household in 2005. To put those numbers in perspective, 80 percent of the City’s median income in 2005 was $33,203, which was higher than the starting salary in 2006 for the City's firefighters.5 RECENT TRENDS IN HOUSING AVAILABILITY It is often said that the City faces a housing shortage, and that the disparity between the supply of and demand for housing in the City is large and growing. However, there are no accurate estimates of just how large this imbalance is. Commentators often provide only anecdotal evidence to support assertions about the
housing shortage.6 In this section, we present an analysis of the housing imbalance in New York City, which improves upon prior research methods and uses the most recent housing data from the 2005 New York City Housing and Vacancy Survey (HVS). Our analysis focuses on two questions: 1) what are the recent trends in the imbalance of housing supply and demand in New York City and how do they compare with changes in the 1990s?; and 2) what was the size of the housing imbalance in New York City in 2005? Methodology and Data For the purpose of this research, we use data from the 1990 and 2000 Census, the 2002 and 2005 HVS, and annual intercensal population estimates produced by the Census Bureau.7 We also use estimates of the homeless population in 2005 from the NYC Department of Homeless Services. Our main analysis is carried out for the city as a whole. In an appendix, we also include the results of a borough-level analysis.8
4 The U.S. Department of Housing and Urban Development (HUD) and the New York City Housing Preservation and Development (HPD) use a different "area median income" for their calculations about the affordability of housing, defined for the broader metropolitan area and differentiated by household size. The HUD/HPD area median income for a 3-person family (the approximate household size in New York City), was $56,500 in both 2002 and 2005 (meaning that median income declined in real terms over this three-year period at the same rate as inflation). Using that figure in the analysis would show that the number of units affordable for low income house holds earning 60% of the area median income dropped even more significantly, by 311,278 units, or 23.7 percent. To be consistent with this report’s focus on trends specific to New York City, we have used the more conservative estimate based on only the City's median income, which was considerably lower than the broader metropolitan area's median.
5 The source for the firefighters’ salary is http://www.nyc.gov/html/fdny/html/community/firefighter_faq.shtml#start_salary.
6 Several researchers have attempted to quantify the housing gap. For example, Salins provided the first in-depth empirical analysis of the difference between housing supply and demand in New York City in a series of reports (1996, 2002, 2004). In his latest report “New York City’s Housing Gap: The Road to Recovery” (2004), Salins constructs a measure of the change in the housing gap between 1999 and 2002 by comparing the net change in housing stock with the growth in the number of households during this period. Most of the data used in Salins’ analysis come from the New York City Housing and Vacancy Survey (HVS) 1999 and 2002. Salins estimated changes in the housing gap over time, but not the magnitude of the existing housing shortage at a given point in time. The scope of our study is broader; we estimate both changes in the housing imbalance over time and the existing shortage in 2005.
There are several notable drawbacks in Salins’ latest analysis. First, although he revises the 1999 housing stock from HVS upwards to
account for a significant undercount that plagues all the HVS data of the past decade – as well as the 1990 Census – he fails to make the necessary adjustment for the number of households. Given the extent of the undercount, this inconsistency is likely to result in a substantial over-estimation of the housing gap. Second, and perhaps more fundamentally, Salins uses the HVS number of households to estimate the gap. Since the number of households in HVS is identical to the number of occupied housing units, it is impossible – by definition – to uncover a housing shortage. The estimated shortage then is mostly an artifact of the inconsistent adjustment mentioned above. Third, it is not clear why rehabilitated, previously vacant units are included among the components of the increase in the total housing stock. Before renovation these units were, presumably, still part of the housing stock but probably listed as vacant/unavailable; upon renovation, they would be added to the stock of available housing, but deleted from the stock of unavailable housing, thus leaving the total housing stock unchanged. In addition, it is not clear why demolitions are not included among the components of change in housing stock. Finally, Salins does not allow for a “healthy” vacancy rate in his estimation.
In a recent study coordinated by the Newman Real Estate Institute of Baruch College, “The Context of Affordable Housing in New York
City,” (2005) by Burchell, Braconi, Gross, Traylor, and Uffen, the authors try to quantify the need for affordable housing in New York City. The study defines the affordable housing need as the total of those lower income households who pay too much for their housing (cost-burdened need), those lower income households who live in deteriorated or over-crowded housing (rehabilitation need), and those lower-income households for whom the market will not provide (future need). However, the CUNY study omits the homeless population, a potentially important component of the housing need. And, like Salins, the CUNY study does not account for a “healthy” vacancy rate when quantifying the additional units necessary to satisfy the future need.
7 All population and housing unit counts for 1990 are adjusted to reflect the undercount in the 1990 Census. The adjustment is based on estimates produced by the New York City Department of City Planning.
8 Borough-level comparisons of changes in housing demand and supply are useful to identify borough-level trends that may be driving citywide changes in the housing imbalance over time. However, measures of the housing imbalance at the borough level are not a meaningful indication of unmet housing need in a given borough. To the extent that residents feel free to move between boroughs, boroughs do not represent separate housing markets.
9 | TH
E FURM
AN
CEN
TER FOR REA
L ESTATE &
URBA
N PO
LICY
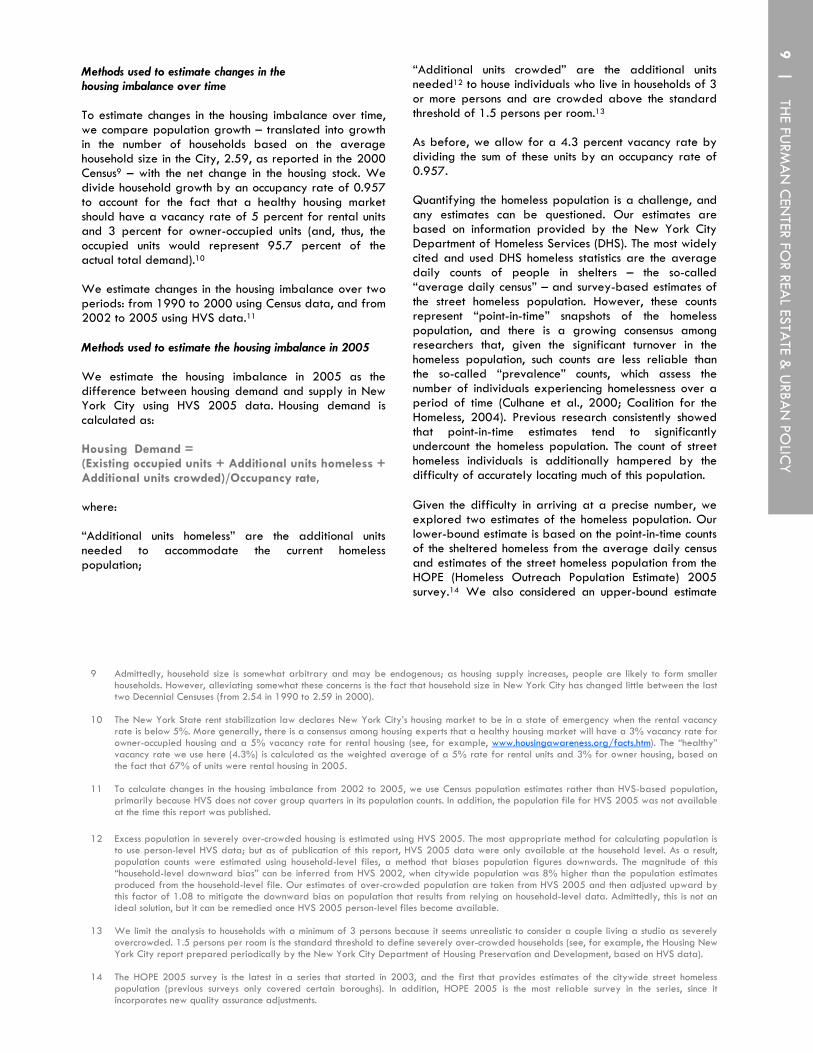
Methods used to estimate changes in the housing imbalance over time To estimate changes in the housing imbalance over time, we compare population growth – translated into growth in the number of households based on the average household size in the City, 2.59, as reported in the 2000 Census9 – with the net change in the housing stock. We divide household growth by an occupancy rate of 0.957 to account for the fact that a healthy housing market should have a vacancy rate of 5 percent for rental units and 3 percent for owner-occupied units (and, thus, the occupied units would represent 95.7 percent of the actual total demand).10 We estimate changes in the housing imbalance over two periods: from 1990 to 2000 using Census data, and from 2002 to 2005 using HVS data.11 Methods used to estimate the housing imbalance in 2005 We estimate the housing imbalance in 2005 as the difference between housing demand and supply in New York City using HVS 2005 data. Housing demand is calculated as: Housing Demand = (Existing occupied units + Additional units homeless + Additional units crowded)/Occupancy rate, where: “Additional units homeless” are the additional units needed to accommodate the current homeless population;
“Additional units crowded” are the additional units needed12 to house individuals who live in households of 3 or more persons and are crowded above the standard threshold of 1.5 persons per room.13
As before, we allow for a 4.3 percent vacancy rate by dividing the sum of these units by an occupancy rate of 0.957. Quantifying the homeless population is a challenge, and any estimates can be questioned. Our estimates are based on information provided by the New York City Department of Homeless Services (DHS). The most widely cited and used DHS homeless statistics are the average daily counts of people in shelters – the so-called “average daily census” – and survey-based estimates of the street homeless population. However, these counts represent “point-in-time” snapshots of the homeless population, and there is a growing consensus among researchers that, given the significant turnover in the homeless population, such counts are less reliable than the so-called “prevalence” counts, which assess the number of individuals experiencing homelessness over a period of time (Culhane et al., 2000; Coalition for the Homeless, 2004). Previous research consistently showed that point-in-time estimates tend to significantly undercount the homeless population. The count of street homeless individuals is additionally hampered by the difficulty of accurately locating much of this population. Given the difficulty in arriving at a precise number, we explored two estimates of the homeless population. Our lower-bound estimate is based on the point-in-time counts of the sheltered homeless from the average daily census and estimates of the street homeless population from the HOPE (Homeless Outreach Population Estimate) 2005 survey.14 We also considered an upper-bound estimate
9 Admittedly, household size is somewhat arbitrary and may be endogenous; as housing supply increases, people are likely to form smaller
households. However, alleviating somewhat these concerns is the fact that household size in New York City has changed little between the last two Decennial Censuses (from 2.54 in 1990 to 2.59 in 2000).
10 The New York State rent stabilization law declares New York City’s housing market to be in a state of emergency when the rental vacancy
rate is below 5%. More generally, there is a consensus among housing experts that a healthy housing market will have a 3% vacancy rate for owner-occupied housing and a 5% vacancy rate for rental housing (see, for example, www.housingawareness.org/facts.htm). The “healthy” vacancy rate we use here (4.3%) is calculated as the weighted average of a 5% rate for rental units and 3% for owner housing, based on the fact that 67% of units were rental housing in 2005.
11 To calculate changes in the housing imbalance from 2002 to 2005, we use Census population estimates rather than HVS-based population,
primarily because HVS does not cover group quarters in its population counts. In addition, the population file for HVS 2005 was not available at the time this report was published.
12 Excess population in severely over-crowded housing is estimated using HVS 2005. The most appropriate method for calculating population is
to use person-level HVS data; but as of publication of this report, HVS 2005 data were only available at the household level. As a result, population counts were estimated using household-level files, a method that biases population figures downwards. The magnitude of this “household-level downward bias” can be inferred from HVS 2002, when citywide population was 8% higher than the population estimates produced from the household-level file. Our estimates of over-crowded population are taken from HVS 2005 and then adjusted upward by this factor of 1.08 to mitigate the downward bias on population that results from relying on household-level data. Admittedly, this is not an ideal solution, but it can be remedied once HVS 2005 person-level files become available.
13 We limit the analysis to households with a minimum of 3 persons because it seems unrealistic to consider a couple living a studio as severely
overcrowded. 1.5 persons per room is the standard threshold to define severely over-crowded households (see, for example, the Housing New York City report prepared periodically by the New York City Department of Housing Preservation and Development, based on HVS data).
14 The HOPE 2005 survey is the latest in a series that started in 2003, and the first that provides estimates of the citywide street homeless
population (previous surveys only covered certain boroughs). In addition, HOPE 2005 is the most reliable survey in the series, since it incorporates new quality assurance adjustments.

10 based on a prevalence count, published by the DHS in a policy brief, “Homeless Demographics in New York City.” This count gives the number of different individuals who used the shelter system in a given fiscal year.15 In line with findings of previous research, the difference between the point-in-time count and the prevalence count citywide in 2005 is considerable – the former (our low estimate) is 40,300, whereas the latter (our high estimate) is 102,600. The main results of our study rely on the lower point-in-time count of the homeless because this serves as a more conservative baseline and seems more appropriate than a prevalence count in the context of our analysis. In particular, since the prevalence count measures the number of people touched by homelessness at any point within a given year, it is quite likely that at least some of the residents listed in this count would also show up in our measure of the over-crowded population. The point-in-time homeless estimate alleviates this double-counting problem.16 The units needed to house the population without a home or living in over-crowded conditions are computed by dividing the total population without adequate housing by the average household size in the city from the 2000 Census (2.59 persons). The housing imbalance in 2005 is then calculated as the difference between housing demand and the existing total available housing stock. To err on the side of caution, we exclude from the housing supply measure both vacant units not available for rent or sale and dilapidated vacant units.17
Results Changes in the housing imbalance, the 1990’s and 2002-2005 As shown in Table 4, during the 1990s, the citywide population grew by 441,100 persons, resulting in an increase in housing demand of 178,000 units.18
15 Unfortunately, a similar prevalence count is not available for the street homeless, so the high estimate also relies on the point-in-time estimate from the HOPE survey.
16 Furthermore, unlike the prevalence count, the point-in-time estimate of homelessness is conceptually consistent with the other components of the
housing imbalance (over-crowded population, occupied units, total available housing stock) in that it represents a snapshot in time. 17 HVS defines dilapidated units as those failing to provide safe and adequate shelter. The number of dilapidated vacant units is miniscule: in
2002, there were 718 dilapidated vacant units citywide, and in 2005, only 211. 18 Note that unlike the HVS data, Decennial Census data does not identify dilapidated vacant units. Thus, measures of housing stock for the
1990s (based on Census data) include vacant dilapidated units, whereas those for 2002 and 2005 (based on HVS data) do not. However, as mentioned above, the number of vacant dilapidated units is very small.
19 The increased housing production during recent years fits into a longer-term trend; the 1990s, for example, saw considerable increases in
annual production over the 1980s and 1970s. 20 This measure of over-crowding includes both rental and owner-occupied units. Note that other measures of over-crowding in “The State of
New York City’s Housing and Neighborhoods 2005” reflect over-crowding only in rental units. 21 Using the high estimate of the homeless population (102,600 persons), the housing shortage increases to 125,200 units. If only homelessness is
considered in the measure of households without adequate housing, the citywide housing shortage in 2005 decreases to between 68,000 (low homeless estimate) and 93,100 units (high homeless estimate). We also estimated the housing imbalance counting the excess of people in all severely over-crowded units, not just those in households with 3 or more persons. Using this less restrictive – though, in our opinion, also less realistic – approach, we estimate a citywide shortage of almost 106,000 units when using the low homeless count, and of 131,000 units when using the high homeless count.
Meanwhile, the net increase in the total available housing stock was just 78,600 units. As a result, we estimate an increase in the housing shortage of almost 100,000 units during the 1990s. The average annual increase in the housing shortage during the 1990s – almost 10,000 units per year – stands in sharp contrast to the 2002-2005 period, when the housing imbalance decreased by 9,300 units annually (Table 5). This reversal of trends in the housing imbalance was driven by notable changes on both the demand and supply sides. During the 1990s, housing demand far outpaced supply; demand grew at a rate of 17,800 units annually, while housing stock grew less than half as quickly at 7,900 per year. During the 2002-2005 period, housing production accelerated and population growth slowed down, so that housing stock grew almost three times faster than housing demand (the average annual increase in stock was 14,100 units, compared to 4,800 unit increase in demand).19 The housing imbalance in 2005 Table 6 presents the lower-bound estimate of the housing imbalance and its components in 2005. As shown in panel A of this table, the excess population in severely over-crowded households (i.e., those individuals who cause the household to cross the 1.5 persons per room threshold) was very substantial – 79,500 persons.20 An additional 40,300 persons were living without a home. Combined, the homeless and the over-crowded estimates total almost 120,000 persons in need of housing. At an average household size of 2.59, 46,200 housing units would have to be created to accommodate this population. Taking the existing 3,038,000 occupied units, adding 46,200 to accommodate the 120,000 people in need of housing, and building in a healthy vacancy rate, the total demand for housing amounted to 3,224,200 units, compared to a total available housing stock of 3,124,100 units. Therefore, we estimate a citywide housing shortage in 2005 of 100,000 units.21

Table 5. Change in the Housing Imbalance in New York City, 2002-2005
A. Population Changes
Population Household
Population growth growth1
2002 2005 2002-2005 2002-2005
8,107,428 8,143,197 35,769 13,810
B. Housing Stock Changes
Net increase
Total available in total available
housing stock2 housing stock2002 2005 2002-2005
3,081,772 3,124,144 42,372
C. Change in the Housing Imbalance
2002-2005 Annual avg. 2002-2005 Annual avg. 2002-2005 Annual avg.
14,437 4,812 42,372 14,124 (27,935) (9,312)
in housing demand3 total available housing stock Housing Shortage4
Growth Net increase in Change in
Table 4. Change in the Housing Imbalance in New York City, 1990-2000
A. Population Changes1
Population Household
growth growth2
1990 2000 1990-2000 1990-2000
7,567,146 8,008,278 441,132 170,321
B. Housing Stock Changes
Net increase
in total available
housing stock19901
2000 1990-2000
3,029,127 3,107,734 78,607
C. Change in the Housing Imbalance
1990-2000 Annual avg. 1990-2000 Annual avg. 1990-2000 Annual avg.
178,049 17,805 78,607 7,861 99,442 9,944
Population
Total available
housing stock3,4
Growth Net increase in Change in
in housing demand5 total available housing stock Housing Shortage6
11 | TH
E FURM
AN
CEN
TER FOR REA
L ESTATE &
URBA
N PO
LICY
Notes
1 The 1990 population and total housing unit counts are adjusted to reflect the undercount in the 1990 Census. The adjustment is done based on estimates produced by the NYC Department of City Planning (NYC DCP).
2 Household growth is obtained by dividing population growth by average household size (=2.59, from Census 2000).
3 Total available housing stock for 1990 is obtained by applying borough-level percent total available units from the actual Decennial Census counts to the NYC DCP's adjusted total housing stock estimate.
4 As it is not possible to identify vacant dilapidated units using Census data, we are unable to remove these units from measures of the total available housing stock. However, HVS data indicate that the number of vacant dilapidated units is very small.
5 Growth in housing demand is calculated as household growth divided by 0.9566 to account for the increase in vacant housing stock needed to ensure a healthy vacancy rate of 4.34%. This vacancy rate is a weighted average of a 5% rate for rental units and 3% for owner occupied units, based on the fact that 67% of the stock was rental housing (HVS 2005).
6 Positive values indicate that the housing shortage increased from 1990-2000.
Sources: Census 1990, 2000; NYC Dept. of City Planning
Notes
1 Household growth is obtained by dividing population growth by average household size (=2.59, from Census 2000).
2 Total available housing stock excludes units classified in HVS as either “vacant unavailable” or “vacant dilapidated.”
3 Growth in housing demand is calculated as household growth divided by 0.9566 to account for the increase in vacant housing stock needed to ensure a healthy vacancy rate of 4.34%. This vacancy rate is a weighted average of a 5% rate for rental units and 3% for owner occupied units, based on the fact that 67% of the stock was rental housing (HVS 2005).
4 Negative values indicate that the size of the housing shortage decreased from 2002 to 2005.
Sources: HVS 2002, 2005; Census population estimates, 2002 and 2005

12
Notes:
1 Severely over-crowded housing units are considered those with 3 or more persons and with more than 1.5 persons per room.
2 Population counts were estimated using number of persons in a household from the HVS 2005 household file, a method that biases population downwards. For example, total population from HVS 2002 is 7,944,577 (from the person file), but aggregating the number of persons per household from the household file yields an estimated population of 7,355,736, a ratio of 1.08. Thus, the estimates of excess population in severely over-crowded units reported here have been adjusted upwards by this factor of 1.08.
3 Number of households is obtained by dividing population by average household size (=2.59, from Census 2000).
4 Total available housing stock excludes units classified in HVS as either “vacant unavailable” or “vacant dilapidated.”
5 Housing demand is the sum of households without adequate housing and occupied housing units, divided by 0.9566 to ensure a healthy vacancy rate of 4.34%. This vacancy rate is a weighted average of a 5% rate for rental units and 3% for owner occupied units, based on the fact that 67% of the stock was rental housing (HVS 2005).
C O N C L U S I O N From 2002 to 2005, the citywide housing stock grew considerably faster than during the 1990s. Despite strong growth in the overall housing stock in recent years, a combination of falling real incomes and rising rents has significantly increased the burden of housing costs for many New Yorkers. While the City’s overall rental stock experienced modest growth over the last three years, the number of rental units available at rents affordable to low and moderate income households has fallen since 2002. Our housing availability analysis shows that the housing shortage in New York City has been decreasing in recent years, by over 9,000 units per year, compared to an average annual increase of about 10,000 units during the 1990s. This differential appears to reflect a
combination of slower population growth and rising residential construction activity in recent years. However, despite these recent positive trends, the housing shortage remains severe. Our estimates indicate that in 2005, housing demand exceeded the total housing stock by 100,000 units. If current rates of housing production relative to population growth continue, so that the housing imbalance continues to decline at the rate of 9,000 units annually, it will take 11 years to eliminate the housing shortage entirely. The significant, albeit shrinking, housing shortage in 2005, coupled with the declining availability of units available for rents affordable to low and moderate income households show that significant challenges remain for the City’s housing policy in the coming years.
Table 6. Housing Imbalance in New York City, 2005
A. Population without Adequate HousingExcess population in Total population Total households
severly over-crowded Homeless population without adequate without adequate
housing units1,2 (Low estimate) housing housing3
79,451 40,293 119,744 46,233
B. Housing StockTotal available Occupied
housing stock4 housing units3,124,144 3,037,996
C. Imbalance between Housing Supply and DemandHousing Total available Housing
demand5 housing stock shortage3,224,158 3,124,144 100,014

13 | TH
E FURM
AN
CEN
TER FOR REA
L ESTATE &
URBA
N PO
LICY
APPENDIX: Borough-Level Analysis Changes in the housing imbalance: the 1990’s and 2002-2005 Table 7, panel A, reveals that much of the citywide increase in the housing imbalance during the 1990s was driven by the substantial growth of the gap in Queens (by almost 54,000 units). At the other extreme, the housing imbalance in the Bronx and Staten Island increased by only 6,200 and 1,600 units, respectively, over the 1990s. From 2002-2005, the housing shortage declined in all boroughs except Brooklyn (Table 7, panel B). The largest decline by far occurred in Queens (14,400 units). In Manhattan and the Bronx, the drop – although significant – was about half that in Queens. In Brooklyn, the shortage increased slightly, by about 2,600 units. Thus, the recent drop in the citywide housing shortage appears to have been driven by changes that occurred primarily in Queens, and to a smaller extent in Manhattan and the Bronx. The housing imbalance in 200522 Table 8 shows that, among boroughs, the largest populations in need of housing in 2005 were in Manhattan (32,400) and Brooklyn (31,500). Staten Island was at the other extreme, with only 5,600 people who were homeless or in over-crowded housing. Notably, the Bronx had the highest share of its residents as excess population in over-crowded units (1.3 percent), compared to 0.6 percent in Staten Island, 0.7 percent in Manhattan, and 1.0 percent in Brooklyn and Queens. When considering only the homeless, Manhattan was a distant first, with its homeless residents accounting for more than 50 percent of the citywide homeless population.23 Translating the population in need of housing into housing units and comparing demand to the supply of housing in each borough, we find the largest housing shortages in Brooklyn (28,800 units) and Queens (26,100 units). The Bronx and Manhattan also had relatively large gaps (20,500 and 18,600 units, respectively), whereas Staten Island had a much lower shortage (6,000 units). C O N C L U S I O N Following substantial worsening of the housing imbalance over the course of the 1990s, the housing shortage saw a decline in most boroughs between 2002 and 2005, most notably in Queens. However, despite this recent decline, the housing shortage remains severe in most boroughs, with Brooklyn and Queens exhibiting the largest deficits.
R E F E R E N C E S Burchell, R., F. Braconi, A. Gross, W. Traylor, and F.
Uffen. 2005. “The Context of Affordable Housing in New York City.” Newman Real Estate Institute of Baruch College.
Coalition for the Homeless. 2004. “Undercounting the
Homeless: How the Bloomberg Administration’s Homeless Survey Undercounts the Street Homeless and Misleads the Public.” Policy Brief, Coalition for the Homeless.
Culhane, D., et al. 2000. “The Prevalence of
Homelessness in 1998: Results from the Analysis of Administrative Data in Nine US Jurisdictions.” Center for Mental Health Policy and Services Research, University of Pennsylvania.
New York City Department of Homeless Services. 2004.
“Homeless Demographics in New York City.” Policy Brief. http://www.nyc.gov/html/dhs/ downloads/pdf/demographic.pdf
Salins, P. 1996. “New York City’s Housing Gap.” Civic
Report, 2, Manhattan Institute. Salins, P. 2002. “New York City’s Housing Gap
(Revisited).” Civic Report, 25, Manhattan Institute.
Salins, P. 2004. “New York City’s Housing Gap: The
Road to Recovery.” Rethinking Development Report, Center for Rethinking Development, Manhattan Institute.
Waters, T. and V. Bach, 2006. “Closing the Door:
Accelerating Losses of New York City Subsidized Housing.” Policy Brief, Community Service Society.
22 Results based on the low estimate of the homeless population. 23 Sheltered homeless population was not available by borough. To estimate the borough breakdown, we used the distribution of shelter units across
boroughs, obtained from the NYC DHS.

14
Notes:
1 The 1990 population and total housing unit counts are adjusted to reflect the undercount in the 1990 Census. The adjustment is done based on estimates produced by the NYC Department of City Planning (NYC DCP). Total available housing stock for 1990 is obtained by applying borough-level % total available units from the actual Decennial Census counts to the NYC DCP's adjusted total housing stock estimate.
2 Growth in housing demand is calculated as household growth divided by 0.9566 to account for the increase in vacant housing stock needed to ensure a healthy vacancy rate of 4.34%. This vacancy rate is a weighted average of a 5% rate for rental units and 3% for owner occupied units, based on the fact that 67% of the stock was rental housing (HVS 2005). Household growth is determined by dividing population growth by average household size (=2.59, from Census 2000).
3 Total available housing stock in 2002 and 2005 excludes units classified in HVS as either "vacant unavailable" or "vacant dilapidated." For 1990 and 2000, it was not possible to remove dilapidated vacant units, as Census counts do not identify these units. However, HVS data suggest that the number of vacant dilapidated units was miniscule; in 2002 and 2005, respectively, there were 718 and 211 dilapidated vacant units citywide.
4 Positive (negative) values indicate that the size of the housing shortage increased (decreased) during the period.
Sources: 1990-2000: Census 1990, 2000; NYC Dept. of City Planning; 2002-2005: HVS 2002, 2005; Census population estimates, 2002 and 2005
Table 7. Changes in the Housing Imbalance by Borough
A. Changes in the Housing Imbalance, 1990-20001
Borough 1990-2000 Annual avg. 1990-2000 Annual avg. 1990-2000 Annual avg.NYC 178,049 17,805 78,607 7,861 99,442 9,944 Bronx 35,782 3,578 29,574 2,957 6,208 621 Brooklyn 35,445 3,544 19,180 1,918 16,265 1,626 Manhattan (11) (1) (21,720) (2,172) 21,710 2,171 Queens 85,807 8,581 32,165 3,217 53,642 5,364 Staten Island 21,026 2,103 19,408 1,941 1,618 162
B. Changes in the Housing Imbalance, 2002-2005
Borough 2002-2005 Annual avg. 2002-2005 Annual avg. 2002-2005 Annual avg.NYC 14,437 4,812 42,372 14,124 (27,935) (9,312) Bronx (527) (176) 6,120 2,040 (6,647) (2,216) Brooklyn 2,784 928 144 48 2,640 880 Manhattan 11,305 3,768 18,738 6,246 (7,433) (2,478) Queens (2,701) (900) 11,723 3,908 (14,424) (4,808) Staten Island 3,576 1,192 5,647 1,882 (2,071) (690)
in housing demand2
in housing demand2
Growth
Growth
Change in
total available housing stock3 Housing Shortage4
Change in
total available housing stock3 Housing Shortage4
Net increase in
Net increase in

Notes:
1 Severely over-crowded housing units are considered those with 3 or more persons and with more than 1.5 persons per room.
2 Population counts were estimated using number of persons in a household from the HVS 2005 household file, a method that biases population downwards. For example, total population from HVS 2002 is 7,944,577 (from the person file), but aggregating the number of persons per household from the household file yields an estimated population of 7,355,736, a ratio of 1.08. Thus, the estimates of excess population in severely over-crowded units reported here have been adjusted upwards by this factor of 1.08.
3 Number of households is obtained by dividing population by average household size (=2.59, from Census 2000).
4 Total available housing stock excludes units classified in HVS as either “vacant unavailable” or “vacant dilapidated.”
5 Housing demand is the sum of households without adequate housing and occupied housing units, divided by 0.9566 to ensure a healthy vacancy rate of 4.34%. This vacancy rate is a weighted average of a 5% rate for rental units and 3% for owner occupied units, based on the fact that 67% of the stock was rental housing (HVS 2005).
Sources: HVS 2005; NYC Dept. of Homeless Services ("Average Daily Census", "Critical Activities Report", "HOPE 2005: The NYC Street Survey")
15 | TH
E FURM
AN
CEN
TER FOR REA
L ESTATE &
URBA
N PO
LICY
Table 8. Housing Imbalance by Borough, 2005
A. Population without Adequate HousingExcess population in Total population Total households
severly over-crowded Homeless population without adequate without adequate
Borough housing units1,2(Low estimate) housing housing3
NYC 79,451 40,293 119,744 46,233 Bronx 18,110 6,663 24,773 9,565 Brooklyn 24,819 6,719 31,538 12,177 Manhattan 11,901 20,487 32,388 12,505 Queens 21,623 3,802 25,425 9,817 Staten Island 2,998 2,622 5,619 2,170
B. Housing StockTotal available Occupied
Borough housing stock4housing units
NYC 3,124,144 3,037,996
Bronx 483,198 472,246
Brooklyn 901,342 877,552
Manhattan 765,673 737,768
Queens 806,608 786,766 Staten Island 167,322 163,663
C. Imbalance between Housing Demand and SupplyHousing Total available Housing
Borough demand5 housing stock4shortage
NYC 3,224,158 3,124,144 100,014 Bronx 503,670 483,198 20,472 Brooklyn 930,095 901,342 28,753 Manhattan 784,312 765,673 18,639 Queens 832,723 806,608 26,115 Staten Island 173,357 167,322 6,035

Rankings comparing
New York City’s boroughs and community districts with respect to
more than 25 indicators
Descriptions and
analysis of trends
in housing and development issues and plans in each borough and community
district
What’s new in the 2005
State of NYC’s Housing &
Neighborhoods?
Highlights of some of the most
important features of boroughs and
community districts across New York City
Indicators of neighborhood characteristics, quality of life,
lending activity, land use, and more for each
borough and community district in
New York City
16

Notes on the 2005 Edition
Information in this report is presented for the entire City of New York, for the five boroughs, and for the neighborhoods within each borough. The City divides the boroughs into a total of 59 community districts; the United States Census Bureau, however, divides the bor-oughs into 55 “sub-borough areas.” The boundaries of these two types of sub-city areas are similar, but they do not coincide perfectly. This report provides data for community districts where available, but it uses data at the sub-borough level for certain indicators not avail-able for community districts.
B O R O U G H Each New York City borough is also a county. Counties are legal entities, with boundaries defined by State law. The Census Bureau uses boroughs as the major geographic entities in its data products for New York City. New York City consists of five boroughs - Bronx, Brooklyn, Manhattan, Queens and Staten Island.
C O M M U N I T Y D I S T R I C T Community districts are political boundaries unique to New York City. Each of the 59 community districts has a Community Board whose members are appointed by the Borough President; half of the members are nominated by the City Council members who represent the district. The Community Boards review applications for zoning changes and other land use proposals and make recom-mendations for budget priorities.
S U B - B O R O U G H A R E A Sub-borough areas are geographic units created by the Census Bureau for the administration of the New York City Housing and Vacancy Survey. They are designed to approximate New York’s community districts. How-ever, since sub-borough areas are constructed from census tracts, their boundaries do not coincide precisely with community district boundaries. There are 59 community districts in New York but only 55 sub-borough areas because the areas of four pairs of community districts were combined by the Census Bureau in creating the sub-borough areas to improve sampling and enhance the confidentiality of respon-dents. These pairs are Mott Haven/Melrose (CD 101) and Hunts Point/Longwood (CD 102) in the Bronx, Mor-risania/Crotona (CD 103) and Belmont/East Tremont (CD 106) in the Bronx, the Financial District (CD 301) and Greenwich Village/Soho (CD 302) in Manhattan, and Clinton/Chelsea (CD 304) and Midtown (CD 305) in Manhattan.
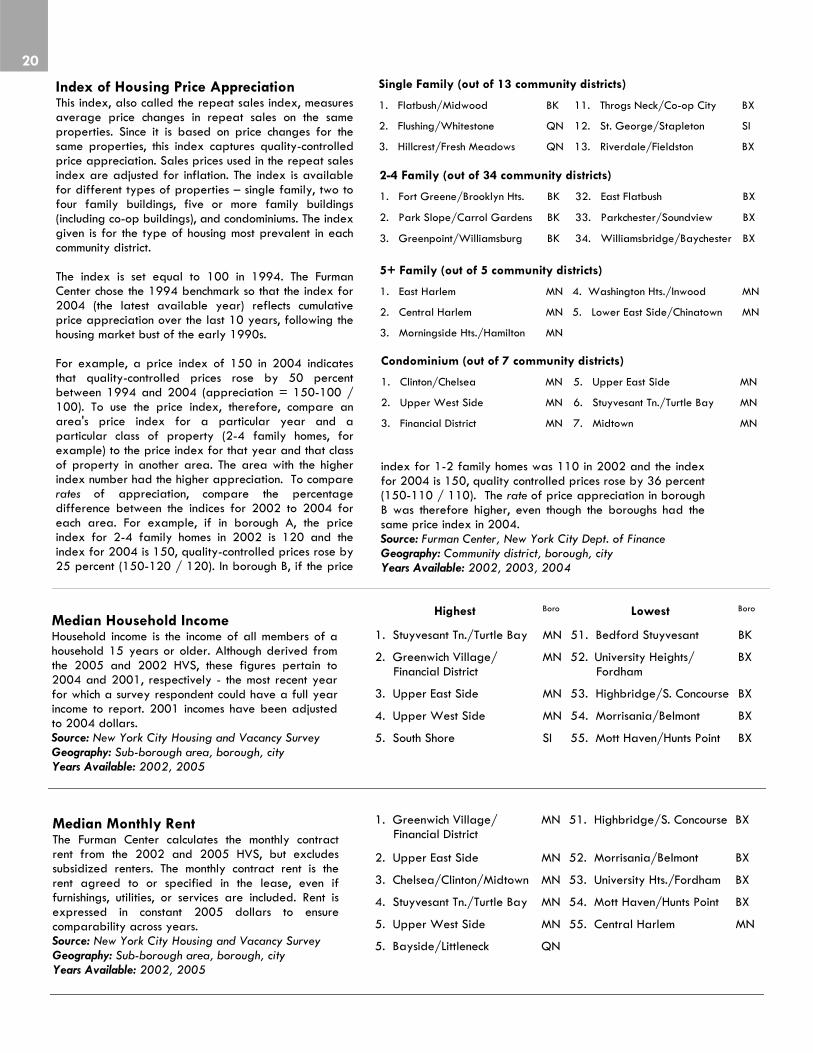
R A N K I N G S The 2005 edition of this report includes, for the first time, rankings of the five boroughs and all 59 community districts for each indicator. The neighborhood ranked first has the highest number or percentage of the measure at issue (even if the measure is for a quality that one might think is "best" if lower). However, since data for several indicators – including all indicators drawn from the New York City Housing and Vacancy Survey – are available only at the sub-borough level, these indicators are ranked out of 55 total neighborhoods. In addition, a few other indicators were not available for all community districts, and therefore are ranked out of a subset of community districts. For instance, the Furman Center only calculates the index of housing price appreciation at the community district level for the most prevalent housing type in that district. The rankings for this indicator therefore are out of a substantially reduced subset of the community districts. By contrast, the Furman Center calculates median price per housing unit for each community district in which sufficient sales data are available and ranks each community district accordingly. Data on notices of foreclosure are not available for the three community districts in Staten Island; therefore, rankings for this indicator are out of 56 community districts.
G E O G R A P H I C D E F I N I T I O N S
I N F L A T I O N A D J U S T M E N T S When reporting median income, all dollar amounts are adjusted to 2004 dollars, the most recent year for which income data exists from the Housing and Vacancy Survey. When reporting median rent, all dollars amounts are adjusted to 2005 dollars. This allows for more consistent comparisons across years for individual indicators.
H O U S E H O L D S A N D I N D I V I D U A L S Because person-level data are unavailable from the 2005 Housing and Vacancy Survey at the time this re-port went to press, all indicators derived from race and ethnicity categories rely on the race/ethnicity of the head of household, rather than individuals within the household. For consistency, although person-level data is available for 2002, race and ethnicity data from that year were also derived from the race/ethnicity of the head of household. However, racial composition figures are substantially similar when using either individuals or heads of household.
17 | TH
E FURM
AN
CEN
TER FOR REA
L ESTATE &
URBA
N PO
LICY

1. Clinton/Chelsea MN 55. Morningside Heights/ Hamilton
MN
2. Tottenville/Great Kills SI 56. S. Crown Hts./Prospect Hts. BK
3. Financial District MN 57. Greenwich Village/Soho MN
4. St. George/Stapleton SI 58. Kingsbridge Hts./ Bedford Park
BX
5. Upper East Side MN 59. Washington Hts./Inwood MN
Highest Boro Lowest Boro
Certificates of Occupancy The Department of City Planning provides data on new Certificates of Occupancy issued each year. A Certificate of Occupancy is required for all newly constructed housing units. Rehabilitated housing units generally do not require a Certificate of Occupancy, unless the rehabilitation is so significant that the floor plan of the unit is changed. Source: New York City Department of City Planning Geography: Community district, borough, city Years Available: 2002, 2003, 2004, 2005
1. Bushwick BK 51. Lower E. Side/Chinatown MN
2. Bedford Stuyvesant BK 51. Astoria QN
3. East NY/Starrett City BK 53. Borough Park BK
4. Brownsville/Ocean Hill BK 54. East Harlem MN
5. Ozone Park/Woodhaven QN 55. Williamsburg/Greenpt. BK
Home Purchase Loans (per 1,000 properties) The extent of mortgage lending provides insight into capital investment in housing in New York City. Per the federal Home Mortgage Disclosure Act (HMDA), financial institutions with assets totaling $31 million or more are required to report information on loan applications and originations. Thus, the HMDA data capture most, but not all, residential mortgage lending activity. Source: Home Mortgage Disclosure Act Geography: Sub-borough area, borough, city Years Available: 2002, 2003, 2004
Indicators
In this section we define each neighborhood data indicator used in this report and provide the source of the indicator, the levels of geography for which it is available, the years for which data are available, and the five neighborhoods with the highest and lowest totals for that indicator. Rankings are provided for the most recent year data are available for each indicator. In the event of a tie, rank numbers are repeated.
Though community districts and sub-borough areas may share boundaries, they often have slightly different names. In the rankings, we use the name appropriate to the level of geography. In addition, because there are 59 community districts and 55 sub-borough areas, indicator ranks fluctuate accordingly. Refer to “Notes on the 2005 Edition” for more information on rankings and geographies.
1. Midtown MN 55. Queens Village QN
2. Clinton/Chelsea MN 56. Bensonhurst BK
3. Financial District MN 57. S. Beach/Willowbrook SI
4. Greenwich Village/Soho MN 58. Borough Park BK
5. Fort Greene/Brooklyn Hts. BK 59. Tottenville/Great Kills SI
Felony Crime Rate The New York City Police Department collects data on a variety of crimes based on submitted reports. Crime statistics are tracked separately for each of the 76 police precincts in the City. The crime rate data in this report are based on the seven major felonies that the police track: burglary, larceny and motor vehicle theft, which are considered property crimes; and murder, rape, robbery, and assault, which are considered violent crimes. Rates are calculated as the number of crimes per 1,000 people residing in the area. Crime data from the New York City Police Department are received at the police precinct level. The Furman Center aggregates the data to the community district level using a population weighting formula. Source: New York City Police Department Geography: Community district, borough, city Years Available: 2002, 2003, 2004
18

1. Elmhurst/Corona QN 51. Pk. Slope/Carroll Gd. BK
2. Jackson Heights QN 51. Upper East Side MN
3. East Flatbush BK 53. Throgs Neck/Co-op City BX
4. Washington Hts./Inwood MN 54. Greenwich Village/ Financial District
MN
5. Sunnyside/Woodside QN 55. South Shore SI
% Immigrant Households This number represents the percentage of all heads of household who were not born in the United States. Source: New York City Housing and Vacancy Survey Geography: Sub-borough area, borough, city Years Available: 2002, 2005
1. Bayside/Little Neck QN 51. N. Crown Hts./Prospect Hts. BK
2. Upper West Side MN 52. Highbridge/S. Concourse BX
3. Upper East Side MN 52. Soundview/Parkchester BX
4. Rego Park/Forest Hill QN 54. Mott Haven/Hunts Point BX
5. Bay Ridge BK 55. University Hts./Fordham BX
5. Stuyvesant Tn./Turtle Bay MN
5. Bensonhurst BK
Highest Boro Lowest Boro Home Purchase Loan Approval Rate Also derived from HMDA, the home purchase loan approval rate is the percentage of all home purchase loan applications that are approved. Due to space limitations, this indicator is omitted from CD pages. Refer to www.nychanis.com for sub-borough area level data. Source: Home Mortgage Disclosure Act Geography: Sub-borough area, borough, city Years Available: 2002, 2003, 2004
1. South Shore SI 51. Morrisania/Belmont BX
2. Bayside/Little Neck QN 52. Highbridge/S. Concourse BX
3. Queens Village QN 53. Kingsbridge Heights/ Mosholu
BX
4. Mid-Island SI 54. Mott Haven/Hunts Point BX
5. Throgs Neck/Co-op City BX 55. Univ. Heights/Fordham BX
Homeownership Rate Homeownership rate is the number of owner-occupied units divided by the total number of occupied units. We consider the following categories to be owner-occupied: Homeowner (Conventional), which are privately owned houses; Mitchell-Lama Co-op, which are privately owned units constructed under the New York State or New York City Mitchell-Lama cooperative program; and Private Co-op/Condo, which are privately owned cooperative or condominium units not constructed under the Mitchell-Lama program. Source: New York City Housing and Vacancy Survey Geography: Sub-borough area, borough, city Years Available: 2002, 2005
1. Lower E. Side/Chinatown MN 51. Sunnyside/Woodside QN
2. Coney Island BK 52. Jamaica QN
3. Borough Park BK 53. Jackson Heights QN
3. Brownsville/Ocean Hill BK 54. Hillcrest/Fresh Meadows QN
3. Chelsea/Clinton/Midtown MN 55. Ozone Park/ Woodhaven
QN
Income Diversity Ratio The Furman Center calculates the income diversity ratio for each sub-borough area and borough, and the City, by dividing the 80th percentile income by the 20th percentile income in each geography. For example, if the 20th percentile income is $15,000 and the 80th percentile income is $75,000, then the income diversity ratio is 5. A higher number indicates a broader range of incomes in a given area. Source: New York City Housing and Vacancy Survey, Furman Center Geography: Sub-borough area, borough, city Years Available: 2002, 2005
19 | TH
E FURM
AN
CEN
TER FOR REA
L ESTATE &
URBA
N PO
LICY
1. Greenwich Village/ Financial District
MN 51. Highbridge/S. Concourse BX
2. Upper East Side MN 52. Morrisania/Belmont BX
3. Chelsea/Clinton/Midtown MN 53. University Hts./Fordham BX
4. Stuyvesant Tn./Turtle Bay MN 54. Mott Haven/Hunts Point BX
5. Upper West Side MN 55. Central Harlem MN
5. Bayside/Littleneck QN
Median Monthly Rent The Furman Center calculates the monthly contract rent from the 2002 and 2005 HVS, but excludes subsidized renters. The monthly contract rent is the rent agreed to or specified in the lease, even if furnishings, utilities, or services are included. Rent is expressed in constant 2005 dollars to ensure comparability across years. Source: New York City Housing and Vacancy Survey Geography: Sub-borough area, borough, city Years Available: 2002, 2005
1. Stuyvesant Tn./Turtle Bay MN 51. Bedford Stuyvesant BK
2. Greenwich Village/ Financial District
MN 52. University Heights/ Fordham
BX
3. Upper East Side MN 53. Highbridge/S. Concourse BX
4. Upper West Side MN 54. Morrisania/Belmont BX
5. South Shore SI 55. Mott Haven/Hunts Point BX
Highest Boro Lowest Boro Median Household Income Household income is the income of all members of a household 15 years or older. Although derived from the 2005 and 2002 HVS, these figures pertain to 2004 and 2001, respectively - the most recent year for which a survey respondent could have a full year income to report. 2001 incomes have been adjusted to 2004 dollars. Source: New York City Housing and Vacancy Survey Geography: Sub-borough area, borough, city Years Available: 2002, 2005
1. Flatbush/Midwood BK 11. Throgs Neck/Co-op City BX
2. Flushing/Whitestone QN 12. St. George/Stapleton SI
3. Hillcrest/Fresh Meadows QN 13. Riverdale/Fieldston BX
Single Family (out of 13 community districts)
1. Fort Greene/Brooklyn Hts. BK 32. East Flatbush BX
2. Park Slope/Carrol Gardens BK 33. Parkchester/Soundview BX
3. Greenpoint/Williamsburg BK 34. Williamsbridge/Baychester BX
2-4 Family (out of 34 community districts)
1. East Harlem MN 4. Washington Hts./Inwood MN
2. Central Harlem MN 5. Lower East Side/Chinatown MN
3. Morningside Hts./Hamilton MN
5+ Family (out of 5 community districts)
1. Clinton/Chelsea MN 5. Upper East Side MN
2. Upper West Side MN 6. Stuyvesant Tn./Turtle Bay MN
3. Financial District MN 7. Midtown MN
Condominium (out of 7 community districts)
Index of Housing Price Appreciation This index, also called the repeat sales index, measures average price changes in repeat sales on the same properties. Since it is based on price changes for the same properties, this index captures quality-controlled price appreciation. Sales prices used in the repeat sales index are adjusted for inflation. The index is available for different types of properties – single family, two to four family buildings, five or more family buildings (including co-op buildings), and condominiums. The index given is for the type of housing most prevalent in each community district. The index is set equal to 100 in 1994. The Furman Center chose the 1994 benchmark so that the index for 2004 (the latest available year) reflects cumulative price appreciation over the last 10 years, following the housing market bust of the early 1990s. For example, a price index of 150 in 2004 indicates that quality-controlled prices rose by 50 percent between 1994 and 2004 (appreciation = 150-100 / 100). To use the price index, therefore, compare an area's price index for a particular year and a particular class of property (2-4 family homes, for example) to the price index for that year and that class of property in another area. The area with the higher index number had the higher appreciation. To compare rates of appreciation, compare the percentage difference between the indices for 2002 to 2004 for each area. For example, if in borough A, the price index for 2-4 family homes in 2002 is 120 and the index for 2004 is 150, quality-controlled prices rose by 25 percent (150-120 / 120). In borough B, if the price
index for 1-2 family homes was 110 in 2002 and the index for 2004 is 150, quality controlled prices rose by 36 percent (150-110 / 110). The rate of price appreciation in borough B was therefore higher, even though the boroughs had the same price index in 2004. Source: Furman Center, New York City Dept. of Finance Geography: Community district, borough, city Years Available: 2002, 2003, 2004
20

Number of Housing Units A housing unit is a house, an apartment, a group of rooms, or a single room occupied or intended for occupancy as separate living quarters. Separate living quarters are those in which the occupants live separately from any other persons in the structure, and access the quarters directly from the outside of the building or through a common hall. Source: New York City Housing and Vacancy Survey Geography: Sub-borough area, borough, city Years Available: 2002, 2005
1. Upper East Side MN 51. Pelham Parkway BX
2. Upper West Side MN 52. South Crown Heights BK
3. Stuyvesant Tn./Turtle Bay MN 53. Rockaways QN
4. Flushing/Whitestone QN 54. S. Ozone Pk./Howard Bch. QN
5. Chelsea/Clinton/Midtown MN 55. Bushwick BK
Median Price Per Unit Price per unit is the sales price of single family homes. For multifamily buildings, the price per unit is calculated by dividing the sales price of a residential building by the number of units contained within the building. For condominium buildings, the sale price is available for each apartment. Building sales data are obtained from the Department of Finance. Prices are expressed in constant 2004 dollars to ensure comparability across years. In this report, the median price per unit in a two to four family building is provided for every community district (except the Financial District and Midtown, which lack sufficient data). In addition, we provide the median price per unit for the predominant housing type in a CD, if other than two to four family building. For each housing type, CDs are ranked against all CDs with a statistically reliable number of sales (five or more) for that housing type. Source: Furman Center, New York City Dept. of Finance Geography: Community district, borough, city Years Available: 2002, 2003, 2004
1. Upper East Side MN 48. Fordham/University Hts. BX
2. Greenwich Village/Soho MN 49. Mott Haven/Melrose BX
3. Stuyvesant Tn./Turtle Bay MN 50. Brownsville BK
Single Family (out of 50 community districts)
1. Upper East Side MN 55. Morrisania/Crotona BX
2. Greenwich Village/Soho MN 56. Mott Haven/Melrose BX
3. Stuyvesant Tn./Turtle Bay MN 57. Hunts Point/Longwood BX
2-4 Family (out of 57 community districts)
1. Upper West Side MN 43. S. Crown Hts./Prospect Hts. BK
2. Stuyvesant Tn./Turtle Bay MN 44. Mott Haven/Melrose BX
3. Upper East Side MN 45. Rockaway/Broad Channel QN
5+ Family (out of 45 community districts)
1. Greenwich Village/Soho MN 45. Morris Park/Bronxdale BX
2. Clinton/Chelsea MN 46. Mott Haven/Melrose BX
3. Upper West Side MN 47. Parkchester/Soundview BX
Condominium (out of 47 community districts)
1. Bedford Stuyvesant BK 53. Financial District MN
3. Brownsville BK 53. Lower E. Side/Chinatown MN
4. Crown Heights BK 53. Midtown MN
5. Bushwick BK 53. St. George/Stapleton SI
53. S. Beach/Willowbrook SI
53. Tottenville/Great Kills SI
2. Washington Hts./Inwood MN 53. Greenwich Village/Soho MN
Highest Boro Lowest Boro Notices of Foreclosure (per 1,000 1-4 family properties) A notice of foreclosure, or lis pendens, is a legal notice filed to provide property owners who are late on mortgage payments with notice that title to the property is being contested. In many cases, the filing of a lis pendens does not lead to an actual mortgage foreclosure; instead the borrower and lender work out some other solution to the borrower’s default or the borrower sells the property prior to foreclosure. Data on mortgage foreclosure activity provides insight into the economic vitality of New York City’s housing stock. Because data on these legal filings are not available for Staten Island, only four boroughs are covered for this indicator and the community districts are ranked accordingly. Source: Public Data Corporation and New York City Department of Finance (Real Property Assessment Data) Geography: Community district, borough, city Years Available: 2002, 2003, 2004
21 | TH
E FURM
AN
CEN
TER FOR REA
L ESTATE &
URBA
N PO
LICY

Highest Boro Lowest Boro
1. Flushing/Whitestone QN 55. Belmont/E. Tremont BX
2. Jamaica/Hollis QN 56. Morrisania/Crotona BX
3. Upper East Side MN 57. Hunts Pt./Longwood BX
4. Astoria QN 58. Midtown MN
5. Washington Hts./Inwood MN 59. Financial District MN
Population The Census defines “population” as all people, both children and adults, living in a given geographic area. Population figures for each community district are derived from the 2000 Census. Borough and City population totals for 2002 to 2005 are obtained from yearly Census estimates. Source: United States Census Geography: Community district, borough, city Years Available: 2002, 2003, 2004, 2005
2. S. Ozone Pk./Howard Bch. QN 50. Brownsville/Ocean Hill BK
3. Hillcrest/Fresh Meadows QN 52. Greenwich Village/ Financial District
MN
4. Morningside Hts./Hamilton MN 53. Upper East Side MN
5. Flatbush BK 54. East Flatbush BK
55. South Shore SI
1. Ozone Park/Woodhaven QN 50. Sheep. Bay/Gravesend BK Racial Diversity Index The Furman Center calculates the racial diversity index by measuring the probability that two randomly chosen heads of households in a given neighborhood will be of a different race. Using the categories of Asian/Pacific Islander, Black (including Hispanic), Hispanic (non-Black), White (non-Hispanic), and Native American, the raw index varies from 0 (minimum diversity) to 0.75 (maximum diversity). The data are then normalized so the maximum value is 1. A higher number indicates a more racially diverse neighborhood. Because person-level data is unavailable from the 2005 HVS, the racial diversity index and the percentage breakdowns of each race/ethnicity are calculated based on the race or ethnicity of the head of household rather than each individual in the home. Heads of household reporting more than one race are excluded from this calculation. Source: New York City Housing and Vacancy Survey, Furman Center Geography: Sub-borough area, borough, city Years Available: 2002, 2005
1. East Harlem MN
2. Brownsville/Ocean Hill BK
3. Mott Haven/Hunts Point BX
4. Lower East Side/ Chinatown
MN
5. Bedford Stuyvesant BK
18 tied for the lowest ranking, with 0% public housing: Sunset Park (BK), S. Crown Heights (BK), Bay Ridge (BK), Bensonhurst (BK), Bor-ough Park (BK), Flatbush (BK), E. Flatbush (BK), Greenwich Village/Financial Dis-trict (MN), Sunnyside/Woodside (QN), Jackson Heights (QN), Elmhurst/Corona (QN), Middle Village/Ridgewood (QN), Rego Park/Forest Hills (QN), Flushing/Whitestone (QN), Ozone Park/Woodhaven (QN), S. Ozone Park/Howard Beach (QN), Bayside/Little Neck (QN), and S. Shore (SI)
% Public Housing Units This indicator is calculated by dividing the number of public housing units by the total number of units in a given geographic area. The Housing and Vacancy Survey defines public housing as any rental units in structures owned and maintained by the New York City Housing Authority. Source: New York City Housing and Vacancy Survey Geography: Sub-borough area, borough, city Years Available: 2002, 2005
1. Mott Haven/Hunts Point BX 51. Mid-Island SI
2. Morrisania/Belmont BX 52. Stuyvesant Tn./Turtle Bay MN
3. University Heights/ Fordham
BX 53. Greenwich Village/ Financial District
MN
4. Highbridge/S. Concourse BX 54. Rego Park/Forest Hills QN
5. Bedford Stuyvesant BK 55. Upper East Side MN
Poverty Rate Poverty rate is calculated using income data from the HVS in combination with income cutoffs or “poverty thresholds” adjusted to take into account such factors as size of family unit, age of householder, and number of children. Poverty thresholds are defined by a federal interagency committee. Source: New York City Housing and Vacancy Survey Geography: Sub-borough area, borough, city Years Available: 2002, 2005
22

1. North Shore SI 51. Clinton/Chelsea/Midtown MN
2. Greenwich Village/ Financial District
MN 51. South Shore SI
3. Central Harlem MN 53. Mott Haven/Hunts Point BX
4. Upper East Side MN 53. Mid-Island SI
5. Mid. Village/Ridgewood QN 55. Bensonhurst BK
Rental Vacancy Rate The percentage of all rental apartments that are vacant is calculated by dividing the number of vacant, habitable for-rent units by the number of renter occupied units plus vacant, habitable for-rent units. This calculation excludes housing units in group quarters, such as hospitals, jails, mental institutions, and college dormitories. Source: New York City Housing and Vacancy Survey Geography: Sub-borough area, borough, city Years Available: 2002, 2005
1. Bedford Stuyvesant BK 51. Washington Hts./Inwood MN
2. East Flatbush BK 52. Riverdale/Kingsbridge BX
3. East NY/Starrett City BK 53. Rego Park/Forest Hills QN
4. Bushwick BK 54. Lower E. Side/Chinatown MN
5. Brownsville/Ocean Hill BK 55. East Harlem MN
Highest Boro Lowest Boro Refinance Loan Rate (per 1,000 properties) The refinance loan rate, calculated with data from the Home Mortgage Disclosure Act, represents the rate per 1,000 properties of refinance mortgage loan originations. For more information on HMDA, see “Home Purchase Loans” definition. Source: Home Mortgage Disclosure Act Geography: Sub-borough area, borough, city Years Available: 2002, 2003, 2004
1. Highbridge/S. Concourse BX 51. Stuyvesant Tn./Turtle Bay MN
2. Kingsbridge Hts./Mosholu BX 52. Bay Ridge BK
3. Morrisania/Belmont BX 53. Bayside/Little Neck QN
4. Jackson Heights QN 54. Brooklyn Hts./Ft. Greene BK
5. Borough Park BK 54. Upper West Side MN
All renter households
Rent Burden This indicator represents the median amount of income spent on gross rent (rent plus electricity and fuel costs) by New York City households. For each borough, as well as New York City as a whole, this report lists the rent burden in 2002 and 2005 for all renter households and for unsubsidized low-income renter households. Unsubsidized low-income households are those in which the renter’s income falls below the HUD-defined low-income threshold and the renter is not receiving a federal subsidy such as a section 8 voucher. Due to space limitations, this indicator is omitted from CD pages. Refer to www.nychanis.com for sub-borough area level data. Source: New York City Housing and Vacancy Survey Geography: Sub-borough area, borough, city Years Available: 2002, 2005
1. Upper East Side MN 51. Pelham Parkway BX
2. Bayside/Little Neck QN 52. Bushwick BK
3. Borough Park BK 53. Rockaways QN
4. Stuyvesant Town/Turtle Bay MN 54. Sunset Park BK
5. Greenwich Village/ Financial District
MN 54. Central Harlem MN
Low income, unsubsidized renter households
23 | TH
E FURM
AN
CEN
TER FOR REA
L ESTATE &
URBA
N PO
LICY
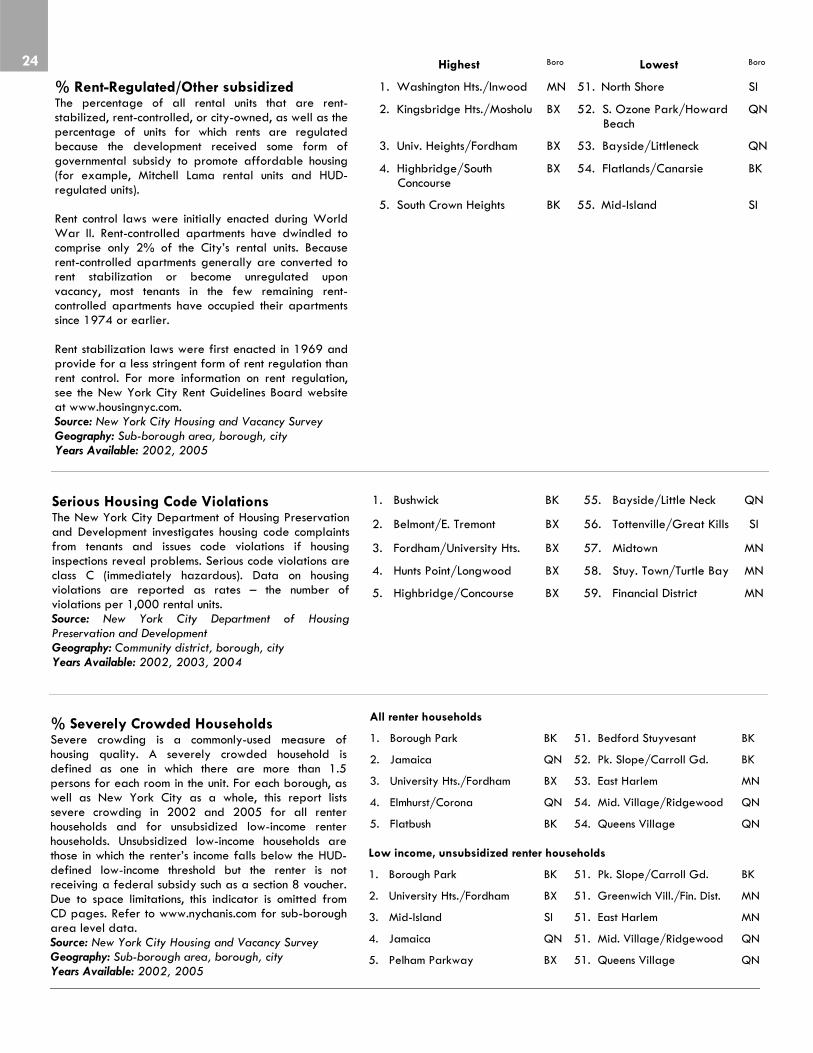
Highest Boro Lowest Boro
1. Washington Hts./Inwood MN 51. North Shore SI
2. Kingsbridge Hts./Mosholu BX 52. S. Ozone Park/Howard Beach
QN
3. Univ. Heights/Fordham BX 53. Bayside/Littleneck QN
4. Highbridge/South Concourse
BX 54. Flatlands/Canarsie BK
5. South Crown Heights BK 55. Mid-Island SI
% Rent-Regulated/Other subsidized The percentage of all rental units that are rent-stabilized, rent-controlled, or city-owned, as well as the percentage of units for which rents are regulated because the development received some form of governmental subsidy to promote affordable housing (for example, Mitchell Lama rental units and HUD-regulated units). Rent control laws were initially enacted during World War II. Rent-controlled apartments have dwindled to comprise only 2% of the City’s rental units. Because rent-controlled apartments generally are converted to rent stabilization or become unregulated upon vacancy, most tenants in the few remaining rent-controlled apartments have occupied their apartments since 1974 or earlier. Rent stabilization laws were first enacted in 1969 and provide for a less stringent form of rent regulation than rent control. For more information on rent regulation, see the New York City Rent Guidelines Board website at www.housingnyc.com. Source: New York City Housing and Vacancy Survey Geography: Sub-borough area, borough, city Years Available: 2002, 2005
1. Bushwick BK 55. Bayside/Little Neck QN
2. Belmont/E. Tremont BX 56. Tottenville/Great Kills SI
3. Fordham/University Hts. BX 57. Midtown MN
4. Hunts Point/Longwood BX 58. Stuy. Town/Turtle Bay MN
5. Highbridge/Concourse BX 59. Financial District MN
Serious Housing Code Violations The New York City Department of Housing Preservation and Development investigates housing code complaints from tenants and issues code violations if housing inspections reveal problems. Serious code violations are class C (immediately hazardous). Data on housing violations are reported as rates – the number of violations per 1,000 rental units. Source: New York City Department of Housing Preservation and Development Geography: Community district, borough, city Years Available: 2002, 2003, 2004
% Severely Crowded Households Severe crowding is a commonly-used measure of housing quality. A severely crowded household is defined as one in which there are more than 1.5 persons for each room in the unit. For each borough, as well as New York City as a whole, this report lists severe crowding in 2002 and 2005 for all renter households and for unsubsidized low-income renter households. Unsubsidized low-income households are those in which the renter’s income falls below the HUD-defined low-income threshold but the renter is not receiving a federal subsidy such as a section 8 voucher. Due to space limitations, this indicator is omitted from CD pages. Refer to www.nychanis.com for sub-borough area level data. Source: New York City Housing and Vacancy Survey Geography: Sub-borough area, borough, city Years Available: 2002, 2005
1. Borough Park BK 51. Bedford Stuyvesant BK
2. Jamaica QN 52. Pk. Slope/Carroll Gd. BK
3. University Hts./Fordham BX 53. East Harlem MN
4. Elmhurst/Corona QN 54. Mid. Village/Ridgewood QN
5. Flatbush BK 54. Queens Village QN
All renter households
1. Borough Park BK 51. Pk. Slope/Carroll Gd. BK
2. University Hts./Fordham BX 51. Greenwich Vill./Fin. Dist. MN
3. Mid-Island SI 51. East Harlem MN
4. Jamaica QN 51. Mid. Village/Ridgewood QN
5. Pelham Parkway BX 51. Queens Village QN
Low income, unsubsidized renter households
24
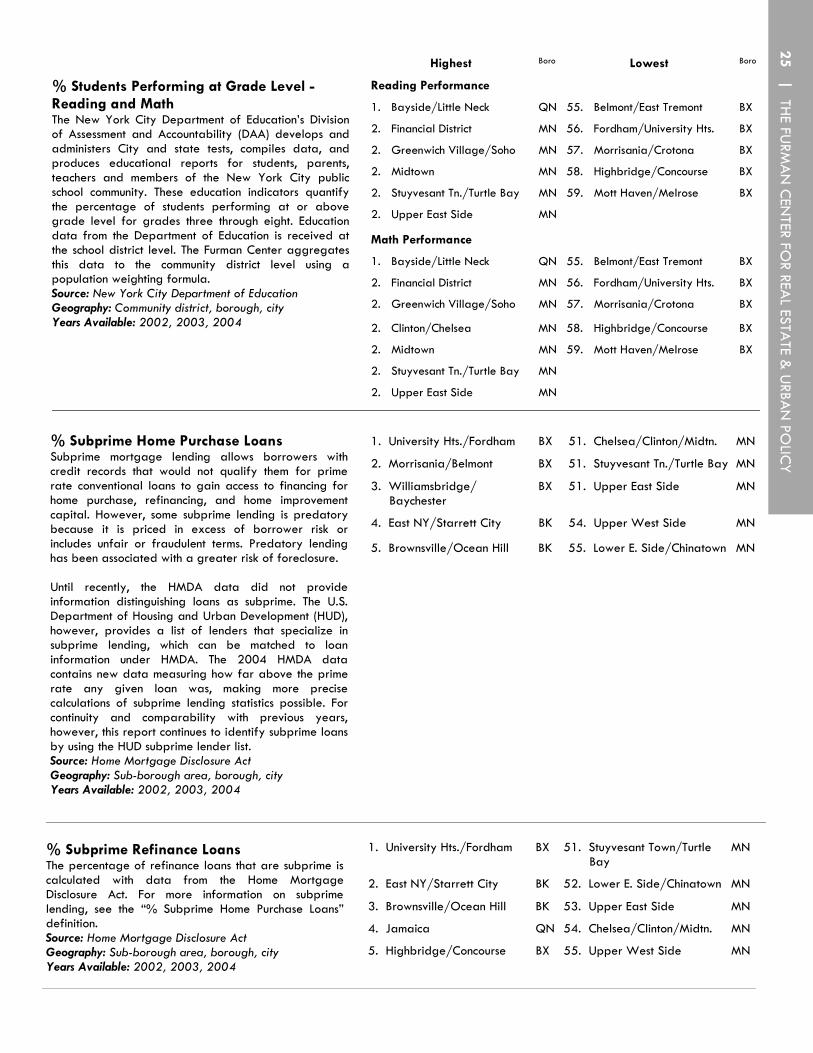
1. University Hts./Fordham BX 51. Chelsea/Clinton/Midtn. MN
2. Morrisania/Belmont BX 51. Stuyvesant Tn./Turtle Bay MN
3. Williamsbridge/ Baychester
BX 51. Upper East Side MN
4. East NY/Starrett City BK 54. Upper West Side MN
5. Brownsville/Ocean Hill BK 55. Lower E. Side/Chinatown MN
% Subprime Home Purchase Loans Subprime mortgage lending allows borrowers with credit records that would not qualify them for prime rate conventional loans to gain access to financing for home purchase, refinancing, and home improvement capital. However, some subprime lending is predatory because it is priced in excess of borrower risk or includes unfair or fraudulent terms. Predatory lending has been associated with a greater risk of foreclosure. Until recently, the HMDA data did not provide information distinguishing loans as subprime. The U.S. Department of Housing and Urban Development (HUD), however, provides a list of lenders that specialize in subprime lending, which can be matched to loan information under HMDA. The 2004 HMDA data contains new data measuring how far above the prime rate any given loan was, making more precise calculations of subprime lending statistics possible. For continuity and comparability with previous years, however, this report continues to identify subprime loans by using the HUD subprime lender list. Source: Home Mortgage Disclosure Act Geography: Sub-borough area, borough, city Years Available: 2002, 2003, 2004
% Students Performing at Grade Level - Reading and Math The New York City Department of Education’s Division of Assessment and Accountability (DAA) develops and administers City and state tests, compiles data, and produces educational reports for students, parents, teachers and members of the New York City public school community. These education indicators quantify the percentage of students performing at or above grade level for grades three through eight. Education data from the Department of Education is received at the school district level. The Furman Center aggregates this data to the community district level using a population weighting formula. Source: New York City Department of Education Geography: Community district, borough, city Years Available: 2002, 2003, 2004
1. Bayside/Little Neck QN 55. Belmont/East Tremont BX
2. Financial District MN 56. Fordham/University Hts. BX
2. Greenwich Village/Soho MN 57. Morrisania/Crotona BX
2. Midtown MN 58. Highbridge/Concourse BX
2. Stuyvesant Tn./Turtle Bay MN 59. Mott Haven/Melrose BX
2. Upper East Side MN
Reading Performance
Highest Boro Lowest Boro
1. Bayside/Little Neck QN 55. Belmont/East Tremont BX
2. Financial District MN 56. Fordham/University Hts. BX
2. Greenwich Village/Soho MN 57. Morrisania/Crotona BX
2. Clinton/Chelsea MN 58. Highbridge/Concourse BX
2. Midtown MN 59. Mott Haven/Melrose BX
2. Stuyvesant Tn./Turtle Bay MN
Math Performance
2. Upper East Side MN
1. University Hts./Fordham BX 51. Stuyvesant Town/Turtle Bay
MN
2. East NY/Starrett City BK 52. Lower E. Side/Chinatown MN
3. Brownsville/Ocean Hill BK 53. Upper East Side MN
4. Jamaica QN 54. Chelsea/Clinton/Midtn. MN
5. Highbridge/Concourse BX 55. Upper West Side MN
% Subprime Refinance Loans The percentage of refinance loans that are subprime is calculated with data from the Home Mortgage Disclosure Act. For more information on subprime lending, see the “% Subprime Home Purchase Loans” definition. Source: Home Mortgage Disclosure Act Geography: Sub-borough area, borough, city Years Available: 2002, 2003, 2004
25 | TH
E FURM
AN
CEN
TER FOR REA
L ESTATE &
URBA
N PO
LICY

Units Authorized by New Residential Building Permits This indicator is derived from the building permit statistics of the Department of Buildings. Permit renewals are not included. Not all building permits will result in actual construction, but the number of units authorized by new permits is the best available indicator of how many units are under construction. Source: New York City Department of Buildings Geography: Community district, borough, city Years Available: 2002, 2003, 2004
1. Clinton/Chelsea MN 55. Morningside Heights/ Hamilton
MN
2. Upper East Side MN 56. S. Crown Hts./Prospect Hts. BK
3. Rockaway/Brd. Channel QN 57. East Flatbush BK
4. Greenpoint/Williamsburg BK 58. Rego Park/Forest Hills QN
5. Astoria QN 59. Washington Hts./Inwood MN
1. Morrisania/Belmont BX 50. Bay Ridge BK
2. University Hts./Fordham BX 50. Upper East Side MN
3. Bushwick BK 50. South Shore SI
4. Brownsville/Ocean Hill BK 53. Throgs Neck/Co-op City BX
5. Mott Haven/Hunts Point BX 54. Bayside/Little Neck QN
55. Coney Island BK
Unemployment Rate Unemployed persons are those individuals who, during the week prior to the HVS interview, had no employment but were available for work, and (1) had engaged in any specific job seeking activity within the past 4 weeks; (2) were waiting to be called back to a job from which they had been laid off; or (3) were waiting to report to a new wage or salary job within 30 days. Person-level data for the 2005 HVS was unavailable at the time of publication so unemployment rate figures are reported for 2002 only. Due to space limitations, this indicator is omitted from CD pages. Refer to www.nychanis.com for sub-borough area level data. Source: New York City Housing and Vacancy Survey Geography: Sub-borough area, borough, city Years Available: 2002
1. Washington Hts./Inwood MN 55. Rego Parks/Forest Hills QN
2. Central Harlem/E. Harlem MN 55. Bayside/Little Neck QN
2. East Harlem MN 57. Greenwich Village/Soho MN
4. Fordham/Univ. Heights BX 58. Financial District MN
4. Crown Heights BK 58. Midtown MN
Highest Boro Lowest Boro % Tax Delinquencies (Delinquent ≥ 1 year) Like foreclosure data, information on property tax delinquencies provides an indicator of the economic health of the City’s housing stock. A property is considered delinquent if the tax payment was not received by the due date. This report only includes delinquencies of more than $500, because those under $500 are not likely to reflect significant economic problems with the property. Source: New York City Department of Finance Open Balance File and Real Property Assessment Data Geography: Community district, borough, city Years Available: 2002, 2003, 2004
1. Tottenville/Great Kills SI 55. Financial District MN
2. East NY/Starrett City BK 55. Greenwich Village/Soho MN
3. S. Beach/Willowbrook SI 57. Stuyvesant Tn./Turtle Bay MN
4. Coney Island BK 58. Bay Ridge/Dyker Hts. BK
5. St. George/Stapleton SI 59. Upper East Side MN
% Vacant Land Area This indicator represents the percentage of total land area that is vacant in a given geographic area. These data come from the Department of Finance’s Real Property Assessment Data (RPAD) file, which contains records on nearly 1 million unique tax lots. Each record provides data on geographic location, land use, building type, building size, number of units, and other information for the lot. Source: Department of Finance Real Property Assessment Data File Geography: Community district, borough, city Years Available: 2003, 2004, 2005
26

N E W Y O R K C I T Y
27 | TH
E FURM
AN
CEN
TER FOR REA
L ESTATE &
URBA
N PO
LICY
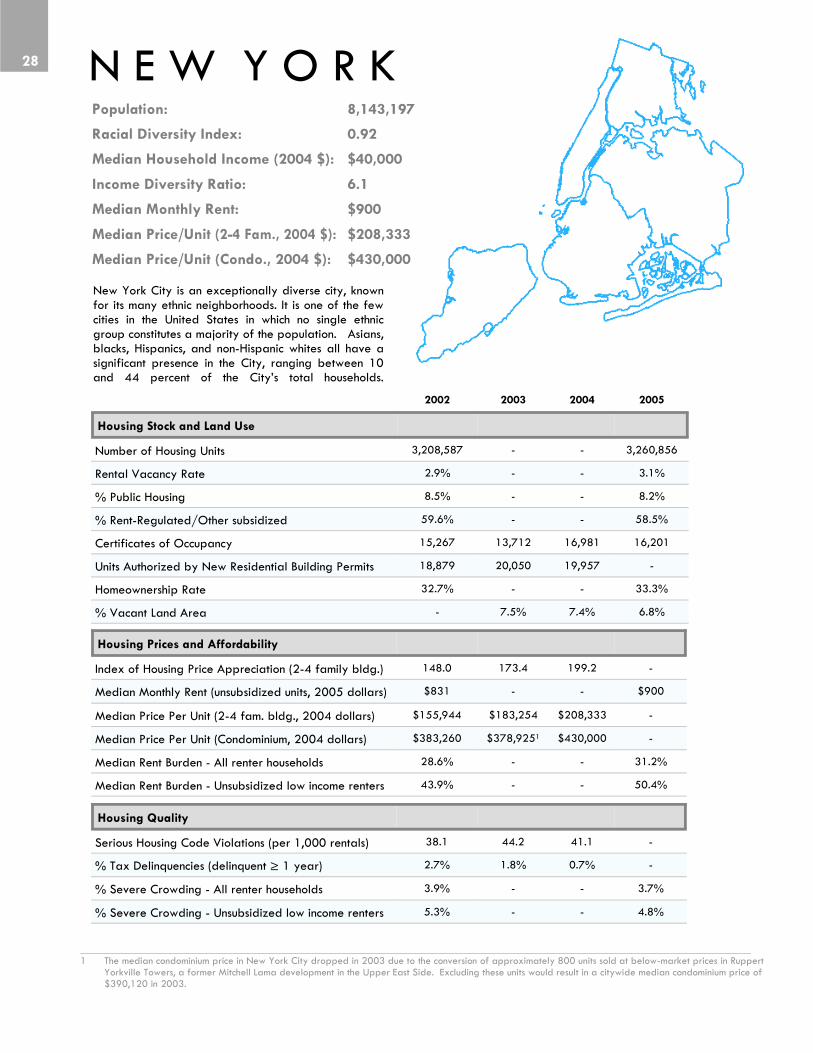
________________________________________________________________________________________________________________ 1 The median condominium price in New York City dropped in 2003 due to the conversion of approximately 800 units sold at below-market prices in Ruppert
Yorkville Towers, a former Mitchell Lama development in the Upper East Side. Excluding these units would result in a citywide median condominium price of $390,120 in 2003.
2002 2003 2004 2005
Housing Stock and Land Use
Number of Housing Units 3,208,587 - - 3,260,856
Rental Vacancy Rate 2.9% - - 3.1%
% Public Housing 8.5% - - 8.2%
% Rent-Regulated/Other subsidized 59.6% - - 58.5%
Certificates of Occupancy 15,267 13,712 16,981 16,201
Units Authorized by New Residential Building Permits 18,879 20,050 19,957 -
Homeownership Rate 32.7% - - 33.3%
% Vacant Land Area - 7.5% 7.4% 6.8%
Housing Quality
Serious Housing Code Violations (per 1,000 rentals) 38.1 44.2 41.1 -
% Tax Delinquencies (delinquent ≥ 1 year) 2.7% 1.8% 0.7% -
% Severe Crowding - All renter households 3.9% - - 3.7%
% Severe Crowding - Unsubsidized low income renters 5.3% - - 4.8%
Housing Prices and Affordability
Index of Housing Price Appreciation (2-4 family bldg.) 148.0 173.4 199.2 -
Median Monthly Rent (unsubsidized units, 2005 dollars) $831 - - $900
Median Price Per Unit (2-4 fam. bldg., 2004 dollars) $155,944 $183,254 $208,333 -
Median Price Per Unit (Condominium, 2004 dollars) $383,260 $378,9251 $430,000 -
Median Rent Burden - All renter households 28.6% - - 31.2%
Median Rent Burden - Unsubsidized low income renters 43.9% - - 50.4%
New York City is an exceptionally diverse city, known for its many ethnic neighborhoods. It is one of the few cities in the United States in which no single ethnic group constitutes a majority of the population. Asians, blacks, Hispanics, and non-Hispanic whites all have a significant presence in the City, ranging between 10 and 44 percent of the City’s total households.
N E W Y O R K Population: 8,143,197 Racial Diversity Index: 0.92 Median Household Income (2004 $): $40,000 Income Diversity Ratio: 6.1
Median Monthly Rent: $900
Median Price/Unit (2-4 Fam., 2004 $): $208,333 Median Price/Unit (Condo., 2004 $): $430,000
28
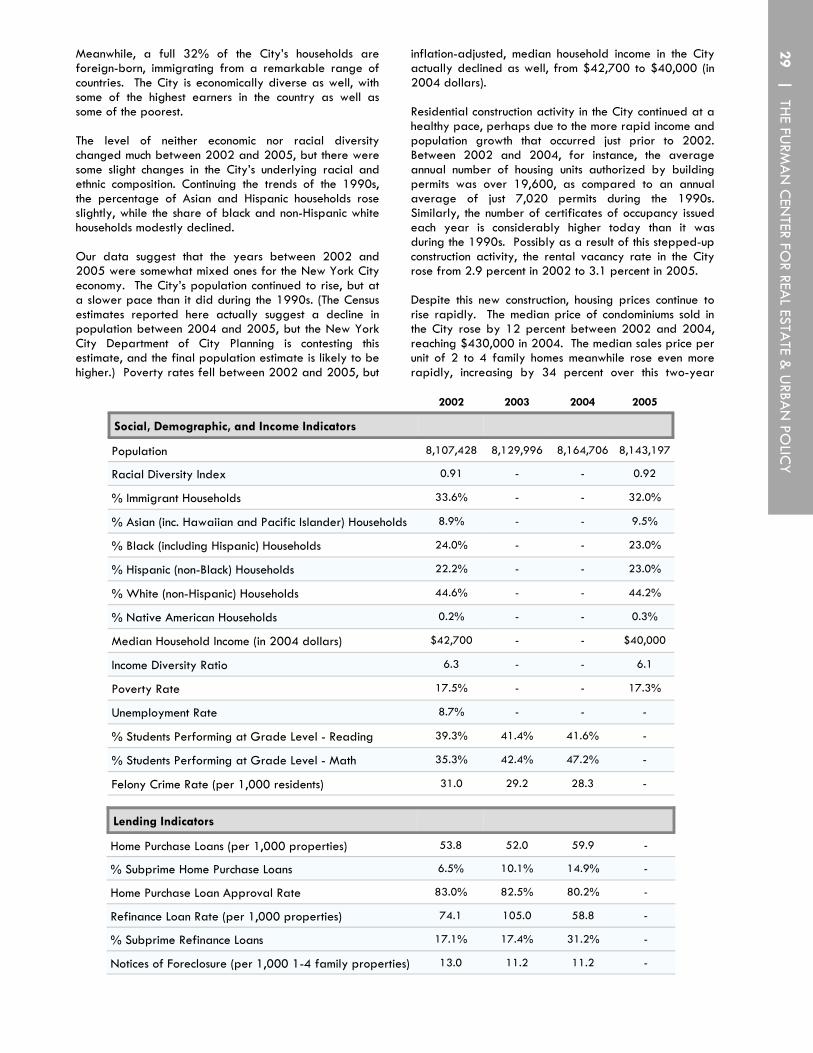
Meanwhile, a full 32% of the City’s households are foreign-born, immigrating from a remarkable range of countries. The City is economically diverse as well, with some of the highest earners in the country as well as some of the poorest. The level of neither economic nor racial diversity changed much between 2002 and 2005, but there were some slight changes in the City’s underlying racial and ethnic composition. Continuing the trends of the 1990s, the percentage of Asian and Hispanic households rose slightly, while the share of black and non-Hispanic white households modestly declined. Our data suggest that the years between 2002 and 2005 were somewhat mixed ones for the New York City economy. The City’s population continued to rise, but at a slower pace than it did during the 1990s. (The Census estimates reported here actually suggest a decline in population between 2004 and 2005, but the New York City Department of City Planning is contesting this estimate, and the final population estimate is likely to be higher.) Poverty rates fell between 2002 and 2005, but
inflation-adjusted, median household income in the City actually declined as well, from $42,700 to $40,000 (in 2004 dollars). Residential construction activity in the City continued at a healthy pace, perhaps due to the more rapid income and population growth that occurred just prior to 2002. Between 2002 and 2004, for instance, the average annual number of housing units authorized by building permits was over 19,600, as compared to an annual average of just 7,020 permits during the 1990s. Similarly, the number of certificates of occupancy issued each year is considerably higher today than it was during the 1990s. Possibly as a result of this stepped-up construction activity, the rental vacancy rate in the City rose from 2.9 percent in 2002 to 3.1 percent in 2005. Despite this new construction, housing prices continue to rise rapidly. The median price of condominiums sold in the City rose by 12 percent between 2002 and 2004, reaching $430,000 in 2004. The median sales price per unit of 2 to 4 family homes meanwhile rose even more rapidly, increasing by 34 percent over this two-year
Lending Indicators
Home Purchase Loans (per 1,000 properties) 53.8 52.0 59.9 -
% Subprime Home Purchase Loans 6.5% 10.1% 14.9% -
Home Purchase Loan Approval Rate 83.0% 82.5% 80.2% -
Refinance Loan Rate (per 1,000 properties) 74.1 105.0 58.8 -
% Subprime Refinance Loans 17.1% 17.4% 31.2% -
Notices of Foreclosure (per 1,000 1-4 family properties) 13.0 11.2 11.2 -
2002 2003 2004 2005
Social, Demographic, and Income Indicators
Population 8,107,428 8,129,996 8,164,706 8,143,197
Racial Diversity Index 0.91 - - 0.92
% Immigrant Households 33.6% - - 32.0%
% Asian (inc. Hawaiian and Pacific Islander) Households 8.9% - - 9.5%
% Black (including Hispanic) Households 24.0% - - 23.0%
% Hispanic (non-Black) Households 22.2% - - 23.0%
% White (non-Hispanic) Households 44.6% - - 44.2%
% Native American Households 0.2% - - 0.3%
Median Household Income (in 2004 dollars) $42,700 - - $40,000
Income Diversity Ratio 6.3 - - 6.1
Poverty Rate 17.5% - - 17.3%
Unemployment Rate 8.7% - - -
% Students Performing at Grade Level - Reading 39.3% 41.4% 41.6% -
% Students Performing at Grade Level - Math 35.3% 42.4% 47.2% -
Felony Crime Rate (per 1,000 residents) 31.0 29.2 28.3 -
29 | TH
E FURM
AN
CEN
TER FOR REA
L ESTATE &
URBA
N PO
LICY
57
period. While existing homeowners have enjoyed healthy rates of appreciation, many prospective homebuyers are being priced out of the market. The small and declining share of vacant land in the City suggests that additional increases in residential construction will be ever more challenging, unless the City undertakes to allow higher density building in areas now zoned residential, or to allow residential development in areas now zoned for other uses. Mortgage lending data similarly suggest robust levels of investment. The volume of both home purchase and refinance mortgage originations has risen since 2002, though the number of refinance loans fell sharply between 2003 and 2004, largely due to shifts in interest rates. A growing fraction of these mortgage loans, however, are subprime, with dramatic citywide increases in subprime shares of refinance lending between 2003 and 2004. While subprime lending may allow borrowers with imperfect credit records to gain access to financing, some subset of these subprime loans are predatory and force borrowers to pay unreasonably high interest rates, making them far more vulnerable to foreclosure risk. So far, there is little evidence that foreclosures have increased citywide; between 2002 and 2004, the rate of notices of foreclosure issued fell slightly. The percent of properties with tax delinquencies of more than one year dropped significantly in this two-year period. On the rental side of the market, affordability pressures clearly grew. The median monthly contract rent increased from $831 to $900 (after adjusting for inflation), and the median share of income spent on rent by New York City renters (the median rent burden) rose from 28.6 percent in 2002 to 31.2 percent in 2005. These numbers suggest that rents represent a significant strain for many households, especially those at the low-end of the income spectrum who are not fortunate enough to live in subsidized housing. Among unsubsidized, low-income renters, the median share of income spent on rent rose to over 50 percent in 2005, up from 43.9 percent in 2002. Surprisingly, perhaps, the share of unsubsidized, low-income renter households that live in severely crowded housing actually fell during this period from 5.3 percent in 2002 to 4.8 percent in 2005. In the analysis that accompanies this report, we explore affordability pressures further by examining and comparing recent trends in the housing demand and supply in the City. We also compare these recent patterns to those changes that took place during the 1990s. While many New York City renters are paying more, and spending a greater share of their incomes, to live in their neighborhoods, conditions in those neighborhoods have improved in recent years. In particular, crime rates continued their steady and consistent decline, with the
total felony crime rate falling to 28.3 per 1,000 residents, its lowest rate since the 1960s. Local public schools also have done well during this period. Elementary school students in the City’s public schools improved their average performance on standardized tests, achieving especially large gains on math tests. Naturally, such average improvements may mask considerable variation across neighborhoods and individuals. Not every neighborhood fared quite so well, while some fared considerably better. The rest of this volume describes and compares changes in housing and neighborhood conditions across the City’s five boroughs and its 59 community districts.
30
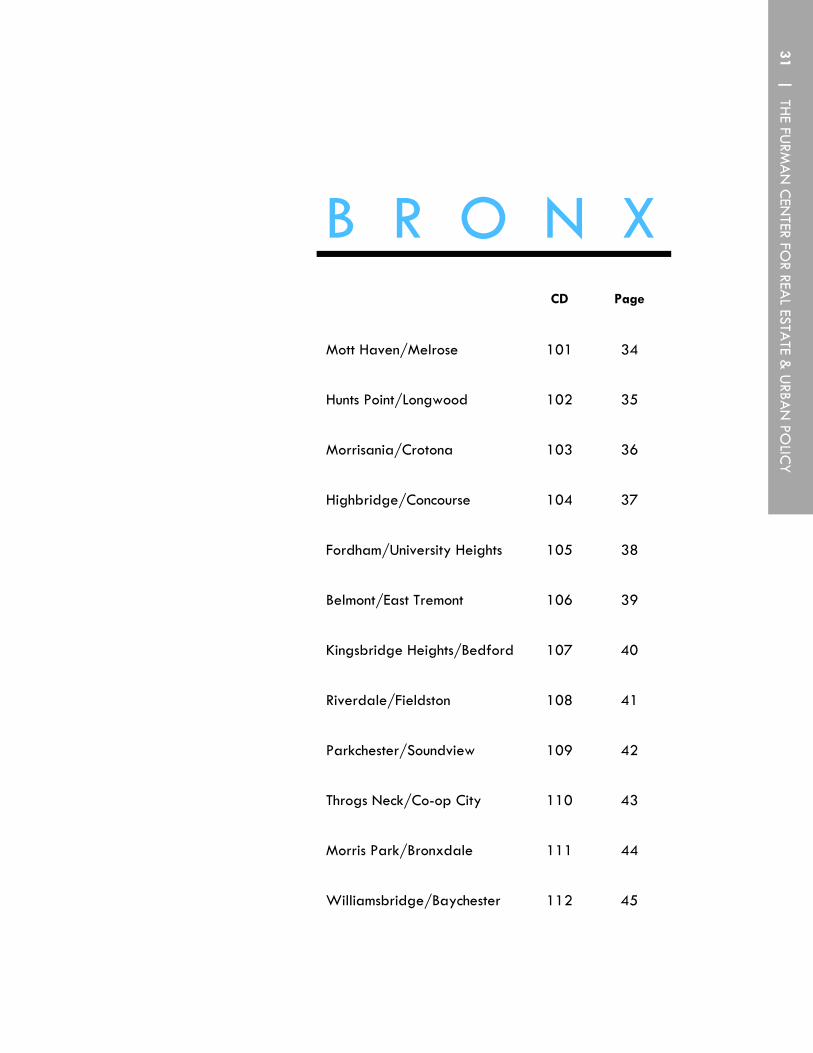
B R O N X
Mott Haven/Melrose 34
Hunts Point/Longwood 35
Morrisania/Crotona 36
Highbridge/Concourse 37
Fordham/University Heights 38
Belmont/East Tremont 39
Kingsbridge Heights/Bedford 40
Riverdale/Fieldston 41
Parkchester/Soundview 42
Throgs Neck/Co-op City 43
Morris Park/Bronxdale 44
Williamsbridge/Baychester 45
Page CD
101
102
103
104
105
106
107
108
109
110
111
112
31 | TH
E FURM
AN
CEN
TER FOR REA
L ESTATE &
URBA
N PO
LICY

B R O N X
Although crime rates have fallen and home values have risen significantly in the Bronx in recent years, the borough continues to exhibit signs of housing and neighborhood distress. At 22.1%, the homeownership rate in the Bronx is the lowest among the five boroughs. Despite having the largest stock of rent-regulated and subsidized units in the City, the median rent burden and levels of
2002 2003 2004 2005 (2002) (2004/5)
Number of Housing Units 491,006 - - 499,029 4 4
Rental Vacancy Rate 3.3% - - 2.6% 2 5
% Public Housing 11.7% - - 10.2% 1 1
% Rent-Regulated/Other subsidized 67.8% - - 71.6% 2 1
Certificates of Occupancy 1,220 1,465 1,755 1,434 5 5
Units Authorized by New Residential Building Permits 2,621 2,942 3,534 - 4 4
Homeownership Rate 22.5% - - 22.1% 5 5
% Vacant Land Area - 4.4% 4.3% 4.9% 4 3
Housing Stock and Land Use
Serious Housing Code Violations (per 1,000 rentals) 58.0 79.1 63.3 - 1 1
% Tax Delinquencies (delinquent ≥ 1 year) 3.3% 2.2% 1.6% - 3 2
% Severe Crowding - All renter households 3.8% - - 4.5% 2 2
% Severe Crowding - Unsubsidized low income renters 4.9% - - 5.7% 3 2
Housing Quality
________________________________________________________________________________________________________________ 1 Since Staten Island experienced fewer than 5 sales of 5+ family buildings in 2004, the ranking for this indicator only ranges from 1 to 4 in this year. 2 Notice of foreclosure data is unavailable for Staten Island, therefore the ranking for this indicator only ranges from 1 to 4 in both 2002 and 2004.
Index of Housing Price Appreciation (2-4 fam. building) 132.5 152.6 172.8 - 5 5
Median Monthly Rent (unsubsidized units, 2005 dollars) $720 - - $768 5 5
Median Price Per Unit (2-4 fam. bldg., 2004 dollars) $133,879 $151,428 $171,500 - 5 5
Median Price Per Unit (5+ fam. bldg., 2004 dollars) $48,126 $55,139 $64,146 - 5 41
Median Rent Burden - All renter households 31.0% - - 34.5% 1 1
Median Rent Burden - Unsubsidized low income renters 46.0% - - 52.4% 2 2
Housing Prices and Affordability
Rank (2002)
Rank (2004/5)
Population: 1,357,589 4 4
Racial Diversity Index: 0.86 3 3
Income Diversity Ratio: 6.6 3 2
Median Monthly Rent: $768 5 5
Median Price/Unit (2-4 fam.): $171,500 5 5
Median Price/Unit (5+ fam.): $64,146 5 41
Median Household Income: $27,500 5 5
Rank Rank
32
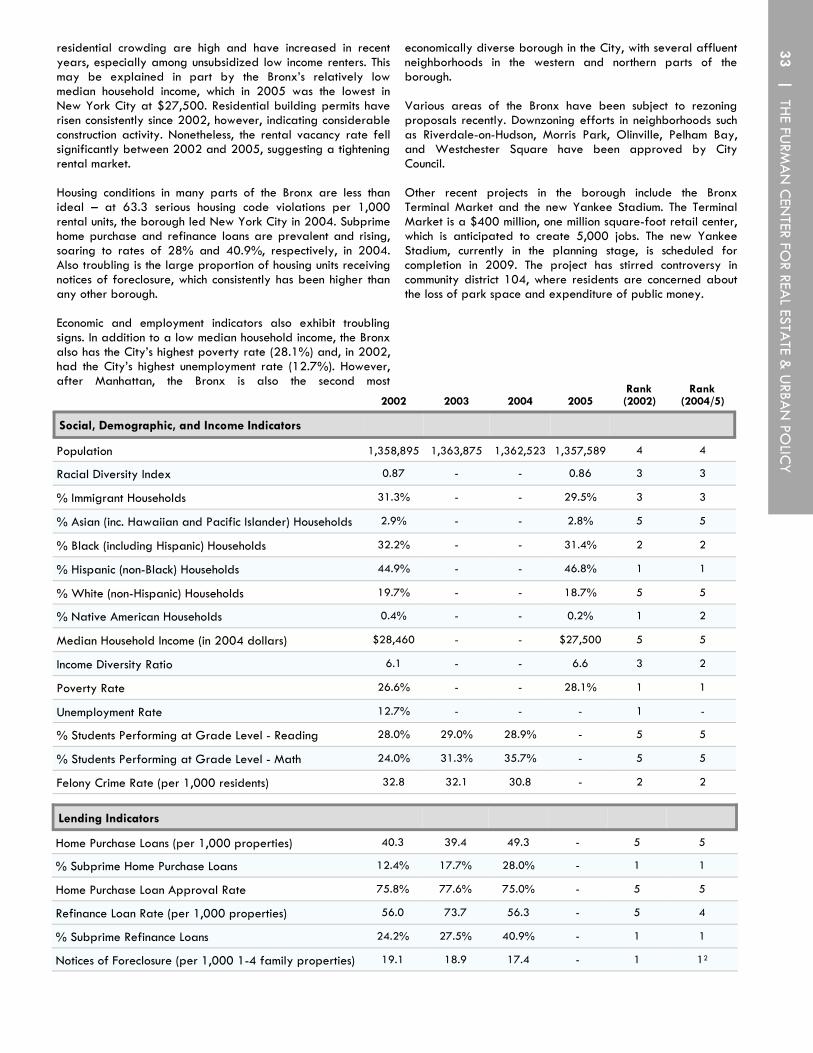
residential crowding are high and have increased in recent years, especially among unsubsidized low income renters. This may be explained in part by the Bronx’s relatively low median household income, which in 2005 was the lowest in New York City at $27,500. Residential building permits have risen consistently since 2002, however, indicating considerable construction activity. Nonetheless, the rental vacancy rate fell significantly between 2002 and 2005, suggesting a tightening rental market. Housing conditions in many parts of the Bronx are less than ideal – at 63.3 serious housing code violations per 1,000 rental units, the borough led New York City in 2004. Subprime home purchase and refinance loans are prevalent and rising, soaring to rates of 28% and 40.9%, respectively, in 2004. Also troubling is the large proportion of housing units receiving notices of foreclosure, which consistently has been higher than any other borough. Economic and employment indicators also exhibit troubling signs. In addition to a low median household income, the Bronx also has the City’s highest poverty rate (28.1%) and, in 2002, had the City’s highest unemployment rate (12.7%). However, after Manhattan, the Bronx is also the second most
economically diverse borough in the City, with several affluent neighborhoods in the western and northern parts of the borough. Various areas of the Bronx have been subject to rezoning proposals recently. Downzoning efforts in neighborhoods such as Riverdale-on-Hudson, Morris Park, Olinville, Pelham Bay, and Westchester Square have been approved by City Council. Other recent projects in the borough include the Bronx Terminal Market and the new Yankee Stadium. The Terminal Market is a $400 million, one million square-foot retail center, which is anticipated to create 5,000 jobs. The new Yankee Stadium, currently in the planning stage, is scheduled for completion in 2009. The project has stirred controversy in community district 104, where residents are concerned about the loss of park space and expenditure of public money.
Lending Indicators
Home Purchase Loans (per 1,000 properties) 40.3 39.4 49.3 - 5 5
% Subprime Home Purchase Loans 12.4% 17.7% 28.0% - 1 1
Home Purchase Loan Approval Rate 75.8% 77.6% 75.0% - 5 5
Refinance Loan Rate (per 1,000 properties) 56.0 73.7 56.3 - 5 4
% Subprime Refinance Loans 24.2% 27.5% 40.9% - 1 1
Notices of Foreclosure (per 1,000 1-4 family properties) 19.1 18.9 17.4 - 1 12
Social, Demographic, and Income Indicators
Population 1,358,895 1,363,875 1,362,523 1,357,589 4 4
Racial Diversity Index 0.87 - - 0.86 3 3
% Immigrant Households 31.3% - - 29.5% 3 3
% Asian (inc. Hawaiian and Pacific Islander) Households 2.9% - - 2.8% 5 5
% Black (including Hispanic) Households 32.2% - - 31.4% 2 2
% Hispanic (non-Black) Households 44.9% - - 46.8% 1 1
% White (non-Hispanic) Households 19.7% - - 18.7% 5 5
% Native American Households 0.4% - - 0.2% 1 2
Median Household Income (in 2004 dollars) $28,460 - - $27,500 5 5
Income Diversity Ratio 6.1 - - 6.6 3 2
Poverty Rate 26.6% - - 28.1% 1 1
Unemployment Rate 12.7% - - - 1 -
% Students Performing at Grade Level - Reading 28.0% 29.0% 28.9% - 5 5
% Students Performing at Grade Level - Math 24.0% 31.3% 35.7% - 5 5
Felony Crime Rate (per 1,000 residents) 32.8 32.1 30.8 - 2 2
2002 2003 2004 2005 (2002) (2004/5) Rank Rank
33 | TH
E FURM
AN
CEN
TER FOR REA
L ESTATE &
URBA
N PO
LICY

2002 2003 2004 2005 Rank (2002)
Rank (2004/5)
Median Household Income (in 2004 dollars) $16,419 - - $15,544 54 55
Poverty Rate 44.6% - - 46.7% 2 1
% Immigrant Households 26.9% - - 26.4% 38 37
Rental Vacancy Rate 2.3% - - 0.9% 32 53
Number of Housing Units 44,125 - - 46,003 48 46
% Public Housing 31.1% - - 26.1% 2 3
% Rent-Regulated/Other subsidized 61.3% - - 67.9% 23 15
Certificates of Occupancy 205 185 128 243 19 25
Units Authorized by New Residential Building Permits 265 248 344 - 27 24
Homeownership Rate 5.6% - - 6.1% 54 54
Index of Housing Price Appreciation (2-4 family building) 162.6 146.2 192.0 - 12 242
Home Purchase Loans (per 1,000 properties) 69.1 62.9 56.5 - 12 29
% Subprime Home Purchase Loans 7.1% 19.4% 35.1% - 30 8
Refinance Loan Rate (per 1,000 properties) 44.3 76.1 69.3 - 41 21
% Subprime Refinance Loans 29.4% 29.8% 45.2% - 13 12
Notices of Foreclosure (per 1,000 1-4 family properties) 16.0 20.4 23.7 - 21 15
% Tax Delinquencies (delinquent ≥ 1 year) 4.8% 3.2% 2.5% - 17 15
% Vacant Land Area - 2.9% 3.0% 2.9% 31 31
Serious Housing Code Violations (per 1,000 rental units) 25.8 29.9 50.9 - 29 20
% Students Performing at Grade Level - Reading 21.6% 22.7% 20.2% - 59 59
% Students Performing at Grade Level - Math 16.6% 22.8% 27.1% - 59 59
Felony Crime Rate (per 1,000 residents) 45.9 48.2 44.0 - 7 7
CD 101 has the highest poverty rate in the City (46.7%) and the lowest median household income ($15,544). The rate of homeownership is one of the lowest in the City at 6.1%. Since 2002, the percentage of home purchase loans that are subprime has increased nearly five-fold. Contrary to citywide trends, the rate of serious housing code violations has risen substantially, and reading scores have decreased.
In March 2006, ground was broken for the new “Hub Retail and Office Center.” The area is a popular destination because four train lines and six bus lines converge there. Due to a lack of open space in the area, some community advocates and political officials are calling for increased access to historic North Brother Island, which lies off the shore of CD 101.
CD 101
_____________________________________________________________________________________________________________ Numbers in italics are based on a small number of observations and should be treated with caution. 1 Community districts 101 and 102 both fall within sub-borough area 101. Data at the sub-borough area level for these two CDs is identical. 2 Ranked out of 34 community districts with the same predominant housing type (2-4 family buildings).
Rank (2002)
Population (2000): 82,159 54
Racial Diversity Index: 0.49 44
Income Diversity Ratio: 5.9 22
Median Monthly Rent: $650 54
Median Price/Unit (2-4 fam.): $137,500 45
Rank (2004/5)
-
48
19
54
56
Median Household Income: $15,544 54 55
M O T T H A V E N / M E L R O S E1
34
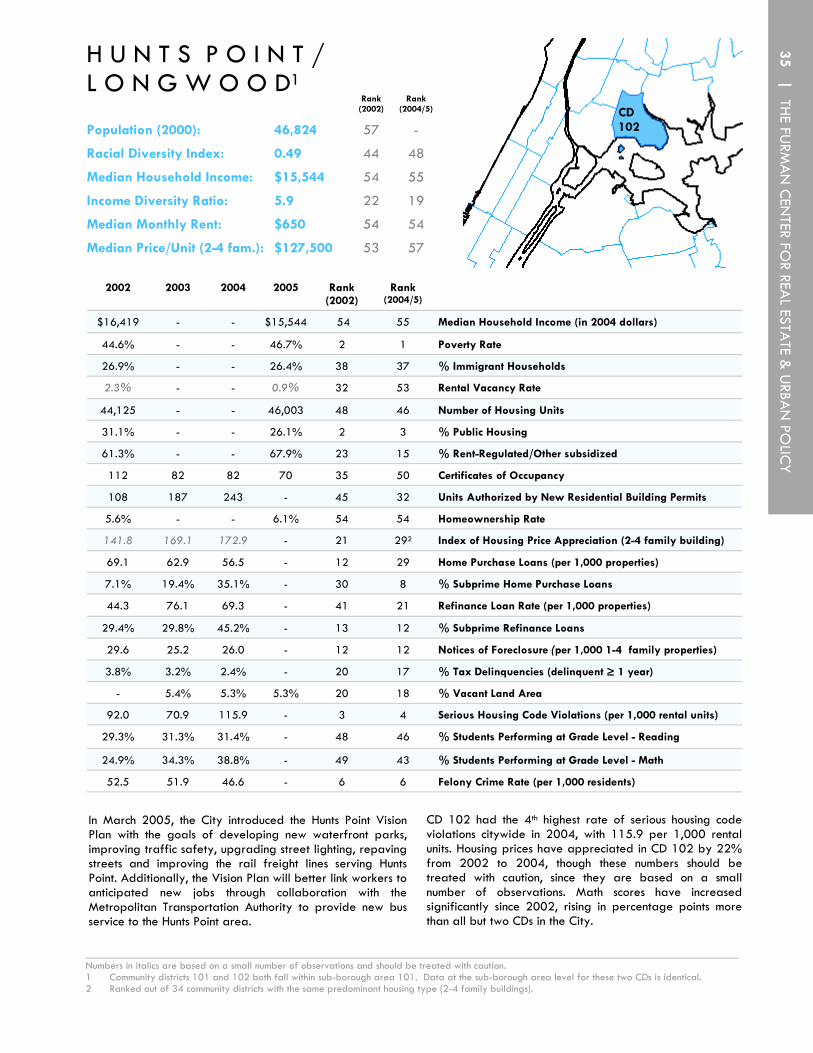
2002 2003 2004 2005 Rank (2002)
Rank (2004/5)
$16,419 - - $15,544 54 55 Median Household Income (in 2004 dollars)
44.6% - - 46.7% 2 1 Poverty Rate
26.9% - - 26.4% 38 37 % Immigrant Households
2.3% - - 0.9% 32 53 Rental Vacancy Rate
44,125 - - 46,003 48 46 Number of Housing Units
31.1% - - 26.1% 2 3 % Public Housing
61.3% - - 67.9% 23 15 % Rent-Regulated/Other subsidized
112 82 82 70 35 50 Certificates of Occupancy
108 187 243 - 45 32 Units Authorized by New Residential Building Permits
5.6% - - 6.1% 54 54 Homeownership Rate
141.8 169.1 172.9 - 21 292 Index of Housing Price Appreciation (2-4 family building)
69.1 62.9 56.5 - 12 29 Home Purchase Loans (per 1,000 properties)
7.1% 19.4% 35.1% - 30 8 % Subprime Home Purchase Loans
44.3 76.1 69.3 - 41 21 Refinance Loan Rate (per 1,000 properties)
29.4% 29.8% 45.2% - 13 12 % Subprime Refinance Loans
29.6 25.2 26.0 - 12 12 Notices of Foreclosure (per 1,000 1-4 family properties)
3.8% 3.2% 2.4% - 20 17 % Tax Delinquencies (delinquent ≥ 1 year)
- 5.4% 5.3% 5.3% 20 18 % Vacant Land Area
92.0 70.9 115.9 - 3 4 Serious Housing Code Violations (per 1,000 rental units)
29.3% 31.3% 31.4% - 48 46 % Students Performing at Grade Level - Reading
24.9% 34.3% 38.8% - 49 43 % Students Performing at Grade Level - Math
52.5 51.9 46.6 - 6 6 Felony Crime Rate (per 1,000 residents)
In March 2005, the City introduced the Hunts Point Vision Plan with the goals of developing new waterfront parks, improving traffic safety, upgrading street lighting, repaving streets and improving the rail freight lines serving Hunts Point. Additionally, the Vision Plan will better link workers to anticipated new jobs through collaboration with the Metropolitan Transportation Authority to provide new bus service to the Hunts Point area.
CD 102 had the 4th highest rate of serious housing code violations citywide in 2004, with 115.9 per 1,000 rental units. Housing prices have appreciated in CD 102 by 22% from 2002 to 2004, though these numbers should be treated with caution, since they are based on a small number of observations. Math scores have increased significantly since 2002, rising in percentage points more than all but two CDs in the City.
CD 102
_____________________________________________________________________________________________________________ Numbers in italics are based on a small number of observations and should be treated with caution. 1 Community districts 101 and 102 both fall within sub-borough area 101. Data at the sub-borough area level for these two CDs is identical. 2 Ranked out of 34 community districts with the same predominant housing type (2-4 family buildings).
Rank (2002)
Population (2000): 46,824 57
Racial Diversity Index: 0.49 44
Income Diversity Ratio: 5.9 22
Median Monthly Rent: $650 54
Median Price/Unit (2-4 fam.): $127,500 53
Rank (2004/5)
-
48
19
54
57
Median Household Income: $15,544 54 55
H U N T S P O I N T / L O N G W O O D1
35 | TH
E FURM
AN
CEN
TER FOR REA
L ESTATE &
URBA
N PO
LICY

2002 2003 2004 2005 Rank (2002)
Rank (2004/5)
Median Household Income (in 2004 dollars) $15,324 - - $16,800 55 54
Poverty Rate 45.6% - - 40.0% 1 2
% Immigrant Households 31.1% - - 28.6% 34 34
Rental Vacancy Rate 3.9% - - 2.1% 15 37
Number of Housing Units 49,732 - - 52,078 34 28
% Public Housing 19.3% - - 18.2% 7 9
% Rent-Regulated/Other subsidized 67.2% - - 68.4% 18 14
Certificates of Occupancy 44 91 202 226 50 27
Units Authorized by New Residential Building Permits 362 516 326 - 19 26
Homeownership Rate 8.3% - - 8.3% 50 51
Index of Housing Price Appreciation (2-4 family building) 173.1 207.7 258.5 - 6 42
Home Purchase Loans (per 1,000 properties) 41.5 47.5 70.2 - 39 18
% Subprime Home Purchase Loans 17.9% 24.0% 45.9% - 2 2
Refinance Loan Rate (per 1,000 properties) 43.3 66.5 71.4 - 44 20
% Subprime Refinance Loans 32.6% 31.6% 48.7% - 10 9
Notices of Foreclosure (per 1,000 1-4 family properties) 38.2 36.8 25.9 - 2 13
% Tax Delinquencies (delinquent ≥ 1 year) 6.2% 4.5% 3.6% - 12 10
% Vacant Land Area - 7.0% 6.6% 8.0% 10 9
Serious Housing Code Violations (per 1,000 rental units) 54.6 55.7 67.5 - 16 14
% Students Performing at Grade Level - Reading 25.1% 26.6% 25.2% - 57 57
% Students Performing at Grade Level - Math 21.8% 29.8% 32.8% - 56 57
Felony Crime Rate (per 1,000 residents) 39.2 40.1 39.6 - 12 9
CD 103 has the 2nd lowest median household income in New York City, at $16,800, and the 2nd highest poverty rate, with 40% of the households living in poverty. Additionally, CD 103 was one of four CDs for which crime rates increased from 2002 to 2004. Despite these signs of distress, the prices of homes are appreciating rapidly, with the price index rising nearly 50% from 2002 to 2004. The number of home purchase loans has nearly doubled from 41.5 per 1,000 properties in 2002 to 70.2 in 2004. In
Morrisania/Crotona 45.9% of the home purchase loans were subprime in 2004, which makes it the community district with the 2nd highest share of subprime home purchase loans in the City. CD 103 ranks near the bottom citywide in elementary school performance, with 32.8% of students performing at or above grade level in math in 2004, but this still represents a marked improvement from a low 21.8% in 2002.
CD 103
_____________________________________________________________________________________________________________ Numbers in italics are based on a small number of observations and should be treated with caution. 1 Community districts 103 and 106 both fall within sub-borough area 102. Data at the sub-borough area level for these two CDs is identical. 2 Ranked out of 34 community districts with the same predominant housing type (2-4 family buildings).
Rank (2002)
Rank (2004/5)
Population (2000): 68,574 56 -
Racial Diversity Index: 0.75 24 23
Median Household Income: $16,800 55 54
Income Diversity Ratio: 4.4 38 47
Median Monthly Rent: $731 53 52
Median Price/Unit (2-4 fam.): $140,000 54 55
M O R R I S A N I A / C R O T O N A1
36

2002 2003 2004 2005 Rank (2002)
Rank (2004/5)
$23,041 - - $21,280 51 53 Median Household Income (in 2004 dollars)
31.9% - - 35.2% 7 4 Poverty Rate
40.5% - - 39.3% 23 19 % Immigrant Households
2.7% - - 3.8% 27 15 Rental Vacancy Rate
45,762 - - 45,441 45 49 Number of Housing Units
3.5% - - 2.6% 31 33 % Public Housing
85.8% - - 88.7% 4 4 % Rent-Regulated/Other subsidized
35 249 200 192 54 30 Certificates of Occupancy
396 380 590 - 16 9 Units Authorized by New Residential Building Permits
7.5% - - 8.2% 52 52 Homeownership Rate
171.3 186.5 207.9 - 7 142 Index of Housing Price Appreciation (2-4 family building)
28.6 23.8 37.5 - 53 48 Home Purchase Loans (per 1,000 properties)
14.5% 21.6% 31.1% - 6 12 % Subprime Home Purchase Loans
17.7 25.3 28.9 - 55 48 Refinance Loan Rate (per 1,000 properties)
39.5% 41.9% 49.7% - 3 5 % Subprime Refinance Loans
29.2 27.0 27.0 - 13 11 Notices of Foreclosure (per 1,000 1-4 family properties)
10.0% 6.3% 4.4% - 4 8 % Tax Delinquencies (delinquent ≥ 1 year)
- 5.5% 4.9% 5.7% 19 16 % Vacant Land Area
84.3 87.0 109.8 - 6 5 Serious Housing Code Violations (per 1,000 rental units)
22.9% 23.9% 22.8% - 58 58 % Students Performing at Grade Level - Reading
20.3% 27.3% 29.3% - 58 58 % Students Performing at Grade Level - Math
32.1 31.6 28.2 - 22 28 Felony Crime Rate (per 1,000 residents)
In 2005, the Yankees announced plans for a new stadium in CD 104. Approval from the state legislature and the City Council are pending, but under the proposal, the state would contribute about $70 million to increase parking from 7,000 spaces to 11,000. The City would replace lost parkland as part of the deal, which also includes a new commuter train station and expanded ferry terminal. Another project, the Gateway Center at Bronx Terminal Market, was approved in 2006. That plan calls for the
redevelopment of a portion of the current Bronx Terminal Market site, along with the Bronx House of Detention. The percent of tax delinquencies decreased substantially from 10% in 2002 to 4.4% in 2004. On the other hand, CD 104 still had one of the highest rates of serious housing code violations citywide, with 109.8 per 1,000 rental units. The percentage of school children performing at grade level in reading and math is the 2nd lowest citywide.
CD 104
_____________________________________________________________________________________________________________ Numbers in italics are based on a small number of observations and should be treated with caution. 1 Community district 104 matches sub-borough area 103. 2 Ranked out of 34 community districts with the same predominant housing type (2-4 family buildings).
Rank (2002)
Rank (2004/5)
Population (2000): 139,563 28 -
Racial Diversity Index: 0.72 27 28
Median Household Income: $21,280 51 53
Income Diversity Ratio: 5.4 28 25
Median Monthly Rent: $743 50 51
Median Price/Unit (2-4 fam.): $142,333 51 54
H I G H B R I D G E / C O N C O U R S E1
37 | TH
E FURM
AN
CEN
TER FOR REA
L ESTATE &
URBA
N PO
LICY

Rank (2002)
Population (2000): 128,313 30
Racial Diversity Index: 0.73 29
Median Household Income: $22,000 52
Income Diversity Ratio: 5.9 28
Median Monthly Rent: $665 52
Median Price/Unit (2-4 fam.): $157,500 56
Rank (2004/5)
-
26
52
19
53
51
F O R D H A M / U N I V E R S I T Y H E I G H T S1
2002 2003 2004 2005 Rank (2002)
Rank (2004/5)
Median Household Income (in 2004 dollars) $22,768 - - $22,000 52 52
Poverty Rate 35.9% - - 37.2% 3 3
% Immigrant Households 40.8% - - 37.8% 21 21
Rental Vacancy Rate 3.3% - - 3.7% 20 16
Number of Housing Units 44,247 - - 45,480 47 48
% Public Housing 3.1% - - 3.6% 33 30
% Rent-Regulated/Other subsidized 93.2% - - 91.5% 2 3
Certificates of Occupancy 137 116 31 85 28 47
Units Authorized by New Residential Building Permits 102 190 109 - 47 49
Homeownership Rate 2.2% - - 2.3% 55 55
Index of Housing Price Appreciation (2-4 family building) 140.6 163.5 178.6 - 24 282
Home Purchase Loans (per 1,000 properties) 39.7 47.5 56.0 - 42 30
% Subprime Home Purchase Loans 18.1% 20.7% 47.3% - 1 1
Refinance Loan Rate (per 1,000 properties) 41.8 77.7 75.0 - 46 17
% Subprime Refinance Loans 37.7% 37.6% 55.2% - 5 1
Notices of Foreclosure (per 1,000 1-4 family properties) 35.4 32.1 28.2 - 4 9
% Tax Delinquencies (delinquent ≥ 1 year) 7.8% 5.1% 4.6% - 8 4
% Vacant Land Area - 4.3% 4.1% 3.7% 25 27
Serious Housing Code Violations (per 1,000 rental units) 83.0 89.4 120.9 - 7 3
% Students Performing at Grade Level - Reading 25.5% 27.0% 27.0% - 56 56
% Students Performing at Grade Level - Math 21.9% 29.2% 33.2% - 55 56
Felony Crime Rate (per 1,000 residents) 33.9 33.4 31.7 - 17 17
Although the homeownership rate in CD 105 is the lowest in the City, and little new construction is underway, the rate of home purchase loans in CD 105 has increased between 2002 and 2004, from 39.7 to 56.0 per 1,000 properties. The percentage of home purchase loans that are subprime more than doubled from 18.1% to 47.3%. The rate of refinance lending also increased, with the rate per 1,000 properties moving from 41.8 to 75. In 2004, CD 105 ranked the highest in subprime refinance loans citywide;
55.2% of its refinance loans were subprime. The rate of notices of foreclosure also was high, at 28.2 per 1,000 one to four family homes. CD 105 ranks low in elementary school performance, with 33.2% of students performing at or above grade level in math in 2004, and 27.0% of students performing at or above grade level in reading.
CD 105
_____________________________________________________________________________________________________________ Numbers in italics are based on a small number of observations and should be treated with caution. 1 Community district 105 matches sub-borough area 104. 2 Ranked out of 34 community districts with the same predominant housing type (2-4 family buildings).
38

Rank (2002)
Population (2000): 75,688 55
Racial Diversity Index: 0.75 24
Median Household Income: $16,800 55
Income Diversity Ratio: 4.4 38
Median Monthly Rent: $731 53
Median Price/Unit (2-4 fam.): $147,500 52
Rank (2004/5)
-
23
54
47
52
53
B E L M O N T / E A S T T R E M O N T1
2002 2003 2004 2005 Rank (2002)
Rank (2004/5)
$15,324 - - $16,800 55 54 Median Household Income (in 2004 dollars)
45.6% - - 40.0% 1 2 Poverty Rate
31.1% - - 28.6% 34 34 % Immigrant Households
3.9% - - 2.1% 15 37 Rental Vacancy Rate
49,732 - - 52,078 34 28 Number of Housing Units
19.3% - - 18.2% 7 9 % Public Housing
67.2% - - 68.4% 18 14 % Rent-Regulated/Other subsidized
109 46 204 82 37 49 Certificates of Occupancy
251 272 385 - 28 19 Units Authorized by New Residential Building Permits
8.3% - - 8.3% 50 51 Homeownership Rate
153.8 193.8 219.1 - 13 102 Index of Housing Price Appreciation (2-4 family building)
41.5 47.5 70.2 - 39 18 Home Purchase Loans (per 1,000 properties)
17.9% 24.0% 45.9% - 2 2 % Subprime Home Purchase Loans
43.3 66.5 71.4 - 44 20 Refinance Loan Rate (per 1,000 properties)
32.6% 31.6% 48.7% - 10 9 % Subprime Refinance Loans
32.6 34.3 27.1 - 8 10 Notices of Foreclosure (per 1,000 1-4 family properties)
5.8% 5.1% 3.6% - 15 10 % Tax Delinquencies (delinquent ≥ 1 year)
- 6.1% 5.9% 5.6% 14 17 % Vacant Land Area
86.9 112.1 125.6 - 5 2 Serious Housing Code Violations (per 1,000 rental units)
26.5% 28.4% 27.5% - 55 55 % Students Performing at Grade Level - Reading
22.2% 30.1% 34.9% - 54 55 % Students Performing at Grade Level - Math
43.2 41.8 41.0 - 9 8 Felony Crime Rate (per 1,000 residents)
One of the poorest neighborhoods in the City, CD 106 has seen the rate of home purchase loans increase from 41.5 per 1,000 properties in 2002 to 70.2 in 2004. In both 2002 and 2004 Belmont/East Tremont had the 2nd highest percentage of home purchase loans that were subprime in the City: 45.9% in 2004, compared to 17.9% in 2002. The rate of refinance loans also surged from 43.3 in 2002 to 71.4 per 1,000 properties in 2004. 48.7% of these refinance loans were subprime. The rate of serious housing
code violations increased to 125.6 in 2004, giving CD 106 the 2nd highest rate of serious code violations in the City. While school performance in math jumped significantly, reading scores changed little. One sign of recovery, however, is the extent of new construction: CD 106 rose to number 19 in the number of new residential building permits.
CD 106
_____________________________________________________________________________________________________________ Numbers in italics are based on a small number of observations and should be treated with caution. 1 Community districts 103 and 106 both fall within sub-borough area 102. Data at the sub-borough area level for these two CDs is identical. 2 Ranked out of 34 community districts with the same predominant housing type (2-4 family buildings).
39 | TH
E FURM
AN
CEN
TER FOR REA
L ESTATE &
URBA
N PO
LICY

2002 2003 2004 2005 Rank (2002)
Rank (2004/5)
Median Household Income (in 2004 dollars) $23,063 - - $24,000 50 47
Poverty Rate 33.7% - - 28.5% 4 9
% Immigrant Households 37.8% - - 37.7% 29 23
Rental Vacancy Rate 3.6% - - 3.1% 19 21
Number of Housing Units 45,984 - - 47,036 44 44
% Public Housing 1.8% - - 1.8% 35 35
% Rent-Regulated/Other subsidized 89.5% - - 91.7% 3 2
Certificates of Occupancy 3 2 0 7 59 58
Units Authorized by New Residential Building Permits 77 4 107 - 52 51
Homeownership Rate 7.9% - - 6.6% 51 53
Index of Housing Price Appreciation (2-4 family building) 142.3 168.7 192.8 - 19 232
Home Purchase Loans (per 1,000 properties) 43.8 41.4 48.7 - 36 36
% Subprime Home Purchase Loans 11.5% 9.0% 22.3% - 8 21
Refinance Loan Rate (per 1,000 properties) 39.0 47.4 50.2 - 50 28
% Subprime Refinance Loans 23.9% 31.6% 41.0% - 17 17
Notices of Foreclosure (per 1,000 1-4 family properties) 32.4 30.6 28.7 - 9 8
% Tax Delinquencies (delinquent ≥ 1 year) 6.1% 3.8% 2.8% - 13 14
% Vacant Land Area - 4.3% 3.8% 4.0% 25 25
Serious Housing Code Violations (per 1,000 rental units) 73.2 80.4 97.5 - 11 6
% Students Performing at Grade Level - Reading 27.8% 29.7% 30.6% - 52 50
% Students Performing at Grade Level - Math 22.8% 30.3% 36.5% - 52 50
Felony Crime Rate (per 1,000 residents) 33.7 33.2 32.3 - 18 16
There is little new development in CD 107—it had one of the lowest number of certificates of occupancy issued citywide, with 0 in 2004 and 7 in 2005. Despite an increase in real median income and a decrease in poverty rate, CD 107 has the 8th highest rate of foreclosures citywide, with 28.7 per 1,000 one to four family homes receiving notice of foreclosure in 2004. The rate of refinance loans per 1,000 properties surged from 39.0 in 2002 to 50.2 in 2004. 41% of these loans were subprime.
Mirroring citywide trends, elementary education performance has improved in reading and math since 2002. 30.6% of students performed at or above grade level in reading in 2004, compared with 27.8% in 2002, and in math 36.5% of students performed at grade level in 2004, compared with 22.8% in 2002, which represents the 5th highest percentage point increase in the City.
CD 107
_____________________________________________________________________________________________________________ Numbers in italics are based on a small number of observations and should be treated with caution. 1 Community district 107 matches sub-borough area 105. 2 Ranked out of 34 community districts with the same predominant housing type (2-4 family buildings).
Rank (2002)
Population (2000): 141,411 27
Racial Diversity Index: 0.73 16
Median Household Income: $24,000 50
Income Diversity Ratio: 5.7 15
Median Monthly Rent: $800 43
Median Price/Unit (2-4 fam.): $150,250 47
Rank (2004/5)
-
26
47
21
48
52
K I N G S B R I D G E H E I G H T S / B E D F O R D P A R K1
40

2002 2003 2004 2005 Rank (2002)
Rank (2004/5)
$49,257 - - $44,000 17 21 Median Household Income (in 2004 dollars)
13.7% - - 16.3% 35 30 Poverty Rate
29.7% - - 24.1% 35 40 % Immigrant Households
2.4% - - 2.7% 31 29 Rental Vacancy Rate
51,966 - - 50,795 28 34 Number of Housing Units
2.4% - - 1.7% 34 36 % Public Housing
81.9% - - 81.8% 6 6 % Rent-Regulated/Other subsidized
6 27 129 0 58 59 Certificates of Occupancy
64 223 199 - 54 39 Units Authorized by New Residential Building Permits
32.3% - - 33.1% 22 21 Homeownership Rate
134.6 157.2 163.1 - 10 133 Index of Housing Price Appreciation (1 family building)
30.8 34.6 38.7 - 52 47 Home Purchase Loans (per 1,000 properties)
1.8% 2.7% 4.5% - 47 37 % Subprime Home Purchase Loans
33.2 50.8 24.4 - 53 52 Refinance Loan Rate (per 1,000 properties)
7.3% 7.3% 13.9% - 46 43 % Subprime Refinance Loans
6.5 7.7 7.1 - 33 34 Notices of Foreclosure (per 1,000 1-4 family properties)
2.1% 1.7% 1.0% - 38 38 % Tax Delinquencies (delinquent ≥ 1 year)
- 4.8% 4.7% 5.1% 23 19 % Vacant Land Area
24.9 33.9 44.9 - 32 22 Serious Housing Code Violations (per 1,000 rental units)
27.8% 29.7% 30.6% - 52 50 % Students Performing at Grade Level - Reading
22.8% 30.3% 36.5% - 52 50 % Students Performing at Grade Level - Math
23.3 21.2 20.3 - 48 46 Felony Crime Rate (per 1,000 residents)
On October 11, 2005, the City Council approved a downzoning in CD 108. The rezoning aims to preserve neighborhood character in the areas generally located west of Riverdale Avenue/Henry Hudson Parkway and east of the Hudson River between West 230th and West 261st streets. The predominant development in this area is single family detached houses on large lots.
CD 108 is one of the many neighborhoods in the City in which real median household income fell. The poverty rate also increased significantly, as did the number of serious housing code violations. It remains one of the CDs with the highest percentage of rent-regulated and subsidized units (81.8%).
CD 108
_____________________________________________________________________________________________________________ Numbers in italics are based on a small number of observations and should be treated with caution. 1 Community district 108 matches sub-borough area 106. 2 Ranked out of 50 community districts with sufficient single family home sales. 3 Ranked out of 13 community districts with the same predominant housing type (single family homes).
R I V E R D A L E /F I E L D S T O N1 Rank
(2002)
Population (2000): 101,332 48
Racial Diversity Index: 0.79 19
Median Household Income: $44,000 17
Median Monthly Rent: $863 31
Median Price/Unit (2-4 fam.): $212,500 20
Median Price/Unit (1 fam.): $630,000 8
Rank (2004/5)
-
20
21
31
30
82
Income Diversity Ratio: 6.1 28 15
41 | TH
E FURM
AN
CEN
TER FOR REA
L ESTATE &
URBA
N PO
LICY
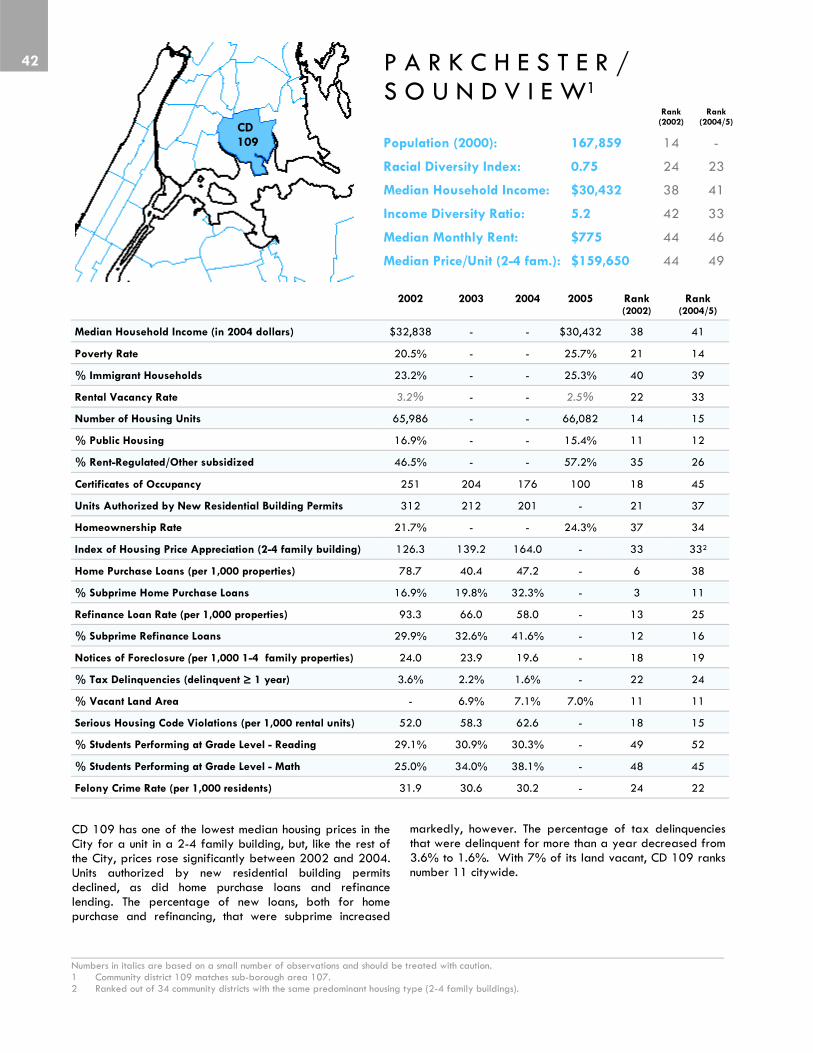
2002 2003 2004 2005 Rank (2002)
Rank (2004/5)
Median Household Income (in 2004 dollars) $32,838 - - $30,432 38 41
Poverty Rate 20.5% - - 25.7% 21 14
% Immigrant Households 23.2% - - 25.3% 40 39
Rental Vacancy Rate 3.2% - - 2.5% 22 33
Number of Housing Units 65,986 - - 66,082 14 15
% Public Housing 16.9% - - 15.4% 11 12
% Rent-Regulated/Other subsidized 46.5% - - 57.2% 35 26
Certificates of Occupancy 251 204 176 100 18 45
Units Authorized by New Residential Building Permits 312 212 201 - 21 37
Homeownership Rate 21.7% - - 24.3% 37 34
Index of Housing Price Appreciation (2-4 family building) 126.3 139.2 164.0 - 33 332
Home Purchase Loans (per 1,000 properties) 78.7 40.4 47.2 - 6 38
% Subprime Home Purchase Loans 16.9% 19.8% 32.3% - 3 11
Refinance Loan Rate (per 1,000 properties) 93.3 66.0 58.0 - 13 25
% Subprime Refinance Loans 29.9% 32.6% 41.6% - 12 16
Notices of Foreclosure (per 1,000 1-4 family properties) 24.0 23.9 19.6 - 18 19
% Tax Delinquencies (delinquent ≥ 1 year) 3.6% 2.2% 1.6% - 22 24
% Vacant Land Area - 6.9% 7.1% 7.0% 11 11
Serious Housing Code Violations (per 1,000 rental units) 52.0 58.3 62.6 - 18 15
% Students Performing at Grade Level - Reading 29.1% 30.9% 30.3% - 49 52
% Students Performing at Grade Level - Math 25.0% 34.0% 38.1% - 48 45
Felony Crime Rate (per 1,000 residents) 31.9 30.6 30.2 - 24 22
CD 109 has one of the lowest median housing prices in the City for a unit in a 2-4 family building, but, like the rest of the City, prices rose significantly between 2002 and 2004. Units authorized by new residential building permits declined, as did home purchase loans and refinance lending. The percentage of new loans, both for home purchase and refinancing, that were subprime increased
markedly, however. The percentage of tax delinquencies that were delinquent for more than a year decreased from 3.6% to 1.6%. With 7% of its land vacant, CD 109 ranks number 11 citywide.
CD 109
_____________________________________________________________________________________________________________ Numbers in italics are based on a small number of observations and should be treated with caution. 1 Community district 109 matches sub-borough area 107. 2 Ranked out of 34 community districts with the same predominant housing type (2-4 family buildings).
Rank (2002)
Population (2000): 167,859 14
Racial Diversity Index: 0.75 24
Median Household Income: $30,432 38
Income Diversity Ratio: 5.2 42
Median Monthly Rent: $775 44
Median Price/Unit (2-4 fam.): $159,650 44
Rank (2004/5)
-
23
41
33
46
49
P A R K C H E S T E R / S O U N D V I E W1
42

T H R O G S N E C K / C O - O P C I T Y1
2002 2003 2004 2005 Rank (2002)
Rank (2004/5)
$42,033 - - $40,700 28 23 Median Household Income (in 2004 dollars)
11.0% - - 15.8% 42 32 Poverty Rate
13.8% - - 15.8% 52 49 % Immigrant Households
4.2% - - 2.6% 12 32 Rental Vacancy Rate
49,956 - - 51,480 33 30 Number of Housing Units
10.8% - - 8.8% 18 22 % Public Housing
41.1% - - 51.4% 39 33 % Rent-Regulated/Other subsidized
137 135 165 158 28 37 Certificates of Occupancy
276 287 461 - 25 14 Units Authorized by New Residential Building Permits
68.7% - - 65.4% 4 5 Homeownership Rate
129.1 158.3 176.0 - 13 113 Index of Housing Price Appreciation (1 family building)
27.3 28.1 35.3 - 55 50 Home Purchase Loans (per 1,000 properties)
10.2% 15.5% 20.7% - 14 22 % Subprime Home Purchase Loans
43.4 60.7 34.9 - 43 40 Refinance Loan Rate (per 1,000 properties)
18.5% 20.7% 30.0% - 28 24 % Subprime Refinance Loans
7.3 7.8 7.7 - 32 31 Notices of Foreclosure (per 1,000 1-4 family properties)
1.8% 1.1% 0.8% - 40 44 % Tax Delinquencies (delinquent ≥ 1 year)
- 5.8% 5.8% 6.0% 18 15 % Vacant Land Area
11.7 13.7 11.9 - 46 48 Serious Housing Code Violations (per 1,000 rental units)
32.5% 33.9% 34.3% - 44 41 % Students Performing at Grade Level - Reading
28.4% 37.2% 41.4% - 42 41 % Students Performing at Grade Level - Math
26.7 27.1 28.2 - 35 29 Felony Crime Rate (per 1,000 residents)
Three rezonings have recently been approved for CD 110: the Pelham Bay rezoning, Westchester Square rezoning, and the Brush Avenue rezoning. All three efforts aim to preserve neighborhood character and scale. CD 110 ranks 49th in percentage of immigrant households, with a percentage of only 15.8% in 2005. It ranks 5th
highest in homeownership rate citywide, with a rate of 65.4% in 2005. Nevertheless, the homeownership rate decreased between 2002 and 2005, and the poverty rate in CD 110 increased significantly. Additionally, the crime rate has increased in absolute numbers more than all CDs but one in the City.
CD 110
_____________________________________________________________________________________________________________ Numbers in italics are based on a small number of observations and should be treated with caution. 1 Community district 110 matches sub-borough area 108. 2 Ranked out of 50 community districts with sufficient single family home sales. 3 Ranked out of 13 community districts with the same predominant housing type (single family homes).
Rank (2002)
Population (2000): 115,948 38
Racial Diversity Index: 0.86 19
Median Household Income: $40,700 28
Median Monthly Rent: $900 32
Median Price/Unit (2-4 fam.): $197,083 32
Median Price/Unit (1 fam.): $360,000 27
Rank (2004/5)
-
14
23
21
35
302
Income Diversity Ratio: 5.7 19 21
43 | TH
E FURM
AN
CEN
TER FOR REA
L ESTATE &
URBA
N PO
LICY
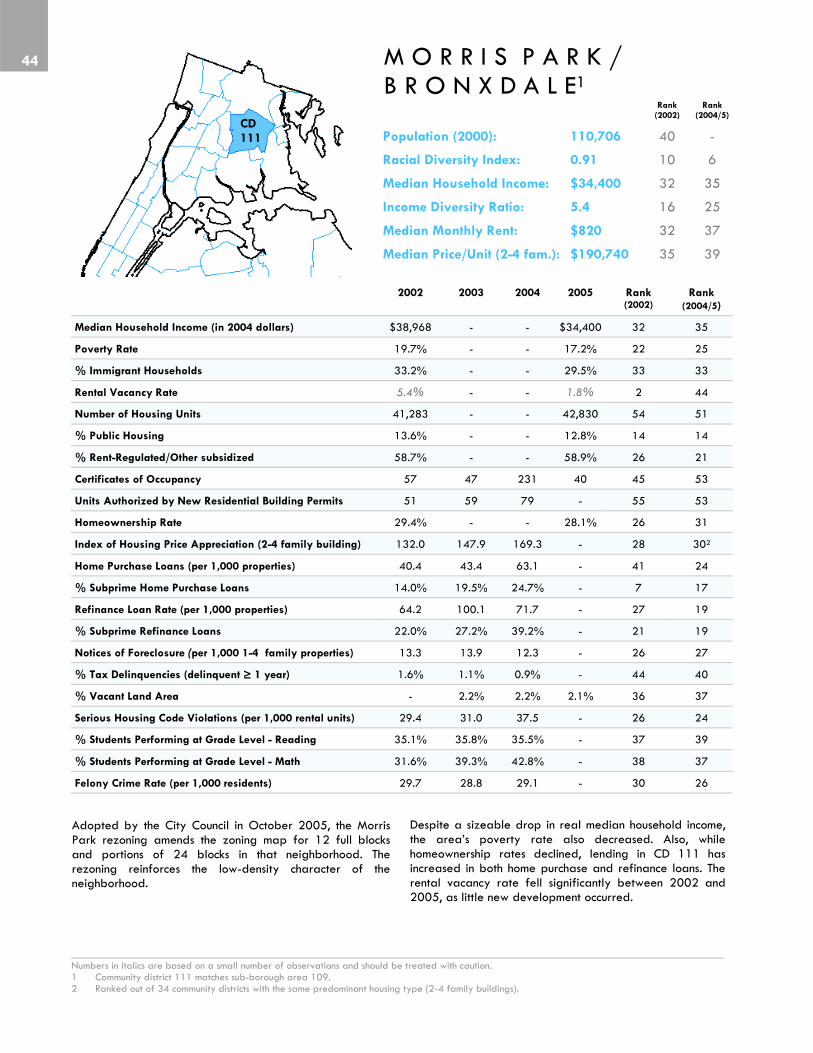
2002 2003 2004 2005 Rank (2002)
Rank (2004/5)
Median Household Income (in 2004 dollars) $38,968 - - $34,400 32 35
Poverty Rate 19.7% - - 17.2% 22 25
% Immigrant Households 33.2% - - 29.5% 33 33
Rental Vacancy Rate 5.4% - - 1.8% 2 44
Number of Housing Units 41,283 - - 42,830 54 51
% Public Housing 13.6% - - 12.8% 14 14
% Rent-Regulated/Other subsidized 58.7% - - 58.9% 26 21
Certificates of Occupancy 57 47 231 40 45 53
Units Authorized by New Residential Building Permits 51 59 79 - 55 53
Homeownership Rate 29.4% - - 28.1% 26 31
Index of Housing Price Appreciation (2-4 family building) 132.0 147.9 169.3 - 28 302
Home Purchase Loans (per 1,000 properties) 40.4 43.4 63.1 - 41 24
% Subprime Home Purchase Loans 14.0% 19.5% 24.7% - 7 17
Refinance Loan Rate (per 1,000 properties) 64.2 100.1 71.7 - 27 19
% Subprime Refinance Loans 22.0% 27.2% 39.2% - 21 19
Notices of Foreclosure (per 1,000 1-4 family properties) 13.3 13.9 12.3 - 26 27
% Tax Delinquencies (delinquent ≥ 1 year) 1.6% 1.1% 0.9% - 44 40
% Vacant Land Area - 2.2% 2.2% 2.1% 36 37
Serious Housing Code Violations (per 1,000 rental units) 29.4 31.0 37.5 - 26 24
% Students Performing at Grade Level - Reading 35.1% 35.8% 35.5% - 37 39
% Students Performing at Grade Level - Math 31.6% 39.3% 42.8% - 38 37
Felony Crime Rate (per 1,000 residents) 29.7 28.8 29.1 - 30 26
CD 111
_____________________________________________________________________________________________________________ Numbers in italics are based on a small number of observations and should be treated with caution. 1 Community district 111 matches sub-borough area 109. 2 Ranked out of 34 community districts with the same predominant housing type (2-4 family buildings).
Adopted by the City Council in October 2005, the Morris Park rezoning amends the zoning map for 12 full blocks and portions of 24 blocks in that neighborhood. The rezoning reinforces the low-density character of the neighborhood.
Despite a sizeable drop in real median household income, the area’s poverty rate also decreased. Also, while homeownership rates declined, lending in CD 111 has increased in both home purchase and refinance loans. The rental vacancy rate fell significantly between 2002 and 2005, as little new development occurred.
Rank (2002)
Population (2000): 110,706 40
Racial Diversity Index: 0.91 10
Median Household Income: $34,400 32
Income Diversity Ratio: 5.4 16
Median Monthly Rent: $820 32
Median Price/Unit (2-4 fam.): $190,740 35
Rank (2004/5)
-
6
35
25
37
39
M O R R I S P A R K / B R O N X D A L E1
44
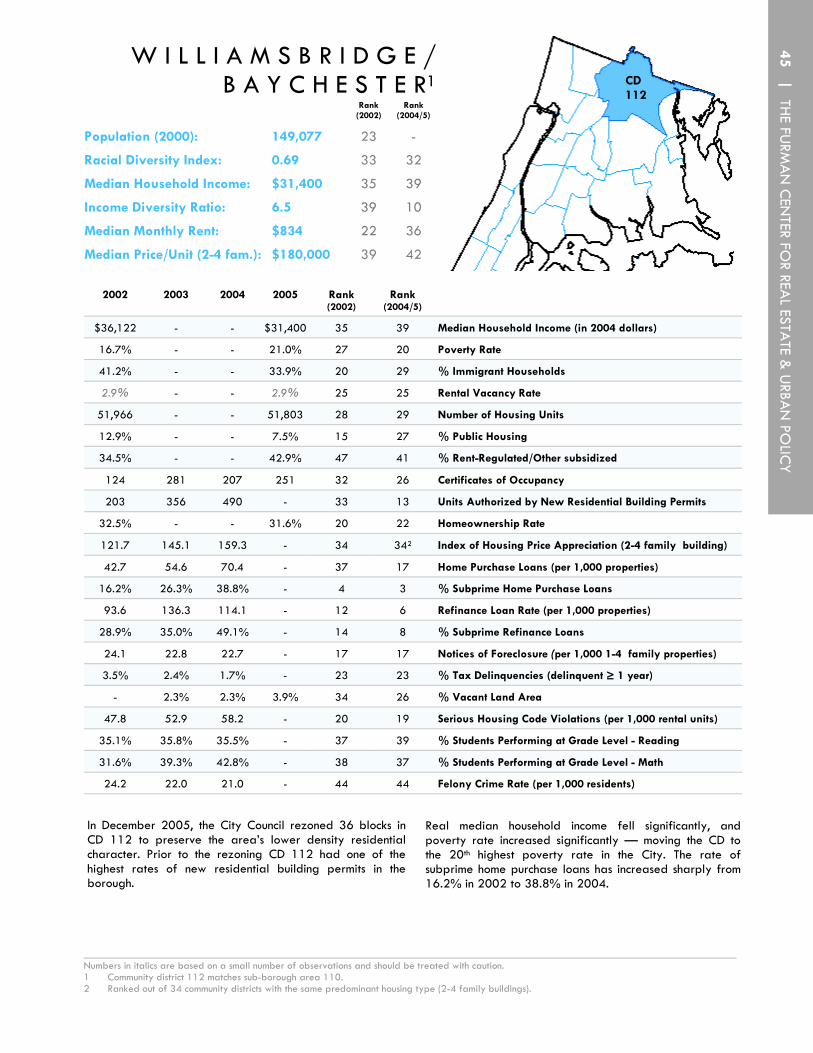
2002 2003 2004 2005 Rank (2002)
Rank (2004/5)
$36,122 - - $31,400 35 39 Median Household Income (in 2004 dollars)
16.7% - - 21.0% 27 20 Poverty Rate
41.2% - - 33.9% 20 29 % Immigrant Households
2.9% - - 2.9% 25 25 Rental Vacancy Rate
51,966 - - 51,803 28 29 Number of Housing Units
12.9% - - 7.5% 15 27 % Public Housing
34.5% - - 42.9% 47 41 % Rent-Regulated/Other subsidized
124 281 207 251 32 26 Certificates of Occupancy
203 356 490 - 33 13 Units Authorized by New Residential Building Permits
32.5% - - 31.6% 20 22 Homeownership Rate
121.7 145.1 159.3 - 34 342 Index of Housing Price Appreciation (2-4 family building)
42.7 54.6 70.4 - 37 17 Home Purchase Loans (per 1,000 properties)
16.2% 26.3% 38.8% - 4 3 % Subprime Home Purchase Loans
93.6 136.3 114.1 - 12 6 Refinance Loan Rate (per 1,000 properties)
28.9% 35.0% 49.1% - 14 8 % Subprime Refinance Loans
24.1 22.8 22.7 - 17 17 Notices of Foreclosure (per 1,000 1-4 family properties)
3.5% 2.4% 1.7% - 23 23 % Tax Delinquencies (delinquent ≥ 1 year)
- 2.3% 2.3% 3.9% 34 26 % Vacant Land Area
47.8 52.9 58.2 - 20 19 Serious Housing Code Violations (per 1,000 rental units)
35.1% 35.8% 35.5% - 37 39 % Students Performing at Grade Level - Reading
31.6% 39.3% 42.8% - 38 37 % Students Performing at Grade Level - Math
24.2 22.0 21.0 - 44 44 Felony Crime Rate (per 1,000 residents)
In December 2005, the City Council rezoned 36 blocks in CD 112 to preserve the area’s lower density residential character. Prior to the rezoning CD 112 had one of the highest rates of new residential building permits in the borough.
Real median household income fell significantly, and poverty rate increased significantly — moving the CD to the 20th highest poverty rate in the City. The rate of subprime home purchase loans has increased sharply from 16.2% in 2002 to 38.8% in 2004.
CD 112
_____________________________________________________________________________________________________________ Numbers in italics are based on a small number of observations and should be treated with caution. 1 Community district 112 matches sub-borough area 110. 2 Ranked out of 34 community districts with the same predominant housing type (2-4 family buildings).
Rank (2002)
Population (2000): 149,077 23
Racial Diversity Index: 0.69 33
Median Household Income: $31,400 35
Income Diversity Ratio: 6.5 39
Median Monthly Rent: $834 22
Median Price/Unit (2-4 fam.): $180,000 39
Rank (2004/5)
-
32
39
10
36
42
W I L L I A M S B R I D G E / B A Y C H E S T E R1
45 | TH
E FURM
AN
CEN
TER FOR REA
L ESTATE &
URBA
N PO
LICY

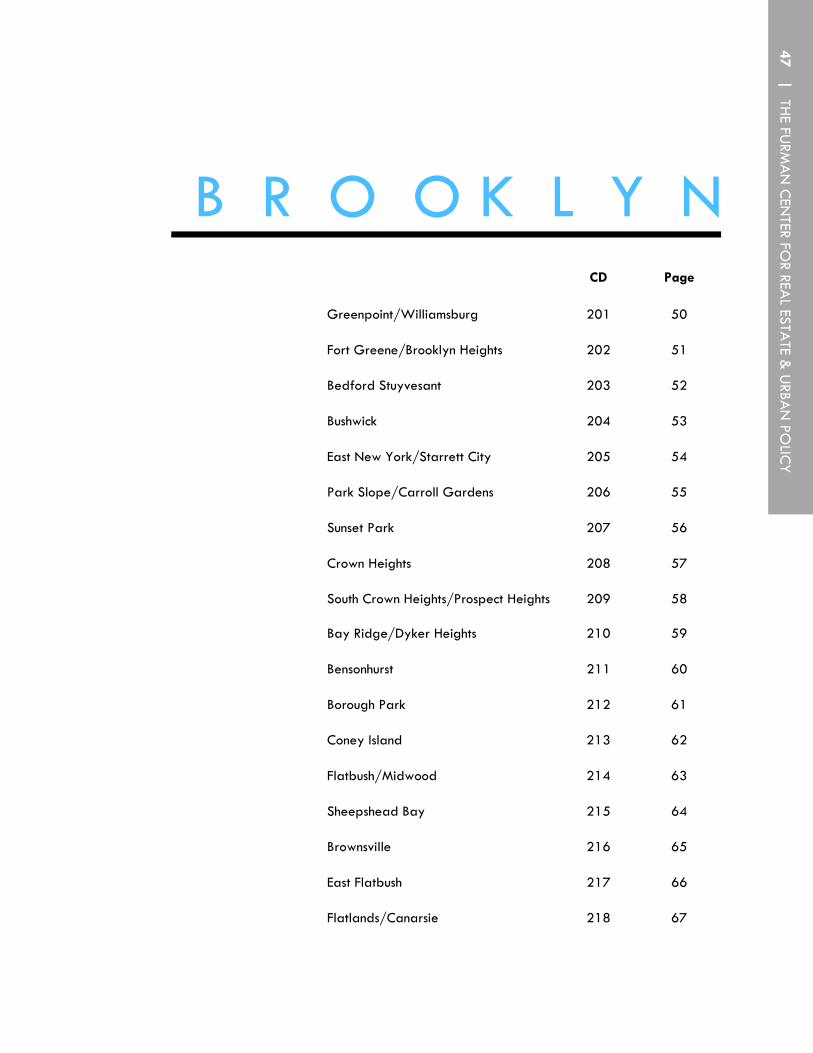
B R O O K L Y N CD
Greenpoint/Williamsburg 201 50
Fort Greene/Brooklyn Heights 202 51
Bedford Stuyvesant 203 52
Bushwick 204 53
East New York/Starrett City 205 54
Park Slope/Carroll Gardens 206 55
Sunset Park 207 56
Crown Heights 208 57
South Crown Heights/Prospect Heights 209 58
Page
Bay Ridge/Dyker Heights 210 59
Bensonhurst 211 60
Borough Park 212 61
Coney Island 213 62
Flatbush/Midwood 214 63
Sheepshead Bay 215 64
Brownsville 216 65
East Flatbush 217 66
Flatlands/Canarsie 218 67
47 | TH
E FURM
AN
CEN
TER FOR REA
L ESTATE &
URBA
N PO
LICY

2002 2003 2004 2005 (2002) (2004/5)
Housing Stock and Land Use
Number of Housing Units 930,085 - - 944,731 1 1
Rental Vacancy Rate 2.7% - - 2.8% 3 3
% Public Housing 9.2% - - 9.3% 3 2
% Rent-Regulated/Other subsidized 51.7% - - 51.4% 3 3
Certificates of Occupancy 2,378 2,574 2,847 4,117 3 2
Units Authorized by New Residential Building Permits 5,260 5,770 4,767 - 2 2
Homeownership Rate 28.7% - - 29.2% 3 3
% Vacant Land Area - 5.2% 5.1% 5.2% 2 2
Housing Quality
Serious Housing Code Violations (per 1,000 rentals) 50.3 50.0 52.9 - 2 2
% Tax Delinquencies (delinquent ≥ 1 year) 3.5% 2.3% 1.6% - 2 2
% Severe Crowding - All renter households 3.6% - - 3.3% 3 4
% Severe Crowding - Unsubsidized low income renters 5.1% - - 4.8% 2 4
________________________________________________________________________________________________________________ 1 Notice of foreclosure data is unavailable for Staten Island, therefore the ranking for this indicator only ranges from 1 to 4 in both 2002 and 2004.
Housing Prices and Affordability
Index of Housing Price Appreciation (2-4 fam. building) 154.1 180.3 210.0 - 2 2
Median Monthly Rent (unsubsidized units, 2005 dollars) $779 - - $850 4 3
Median Price Per Unit (2-4 fam. bldg., 2004 dollars) $146,829 $179,660 $208,333 - 4 3
Median Price Per Unit (1 fam. bldg., 2004 dollars) $288,758 $343,433 $397,000 - 3 2
Median Rent Burden - All renter households 29.1% - - 31.3% 2 3
Median Rent Burden - Unsubsidized low income renters 41.5% - - 48.5% 5 5
B R O O K L Y N
Brooklyn is New York City’s most populous borough, and like the other four boroughs, Brooklyn has witnessed significant change on many fronts in recent years. Mirroring citywide patterns, educational performance has generally been on the rise and crime rates have been on the decline in Brooklyn. Housing prices have been rising rapidly in Brooklyn, with the median price of a single family home increasing from $288,758 in 2002 to $397,000 in 2004. The quality-controlled index of housing
Rank (2002)
Population: 2,486,235 1
Racial Diversity Index: 0.90 2
Median Household Income: $35,000 4
Median Monthly Rent: $850 4
Median Price/Unit (2-4 fam.): $208,333 4
Median Price/Unit (1 fam.): $397,000 3
Rank (2004/5)
1
2
4
3
3
2
Income Diversity Ratio: 6.3 2 3
Rank Rank
48

price appreciation showed a similar surge. Certificates of occupancy, which are issued for newly created housing units, have increased significantly as new housing becomes available. Perhaps as a result of new construction, severe residential overcrowding has declined in Brooklyn since 2002. Following a citywide trend, the rate of tax delinquency has steadily declined in Brooklyn. The rate of home purchase loans per 1,000 properties has risen from 47.9 in 2002 to 58.4 in 2004. However, 18.4% of these loans were subprime in 2004, more than double the rate only two years earlier. Brooklyn ranks 2nd among the boroughs in both subprime home purchase and subprime refinance loans. It is also ranked 2nd in notices of foreclosure. Although Brooklyn’s racial diversity index remained steady between 2002 and 2005, the borough’s racial composition shifted somewhat. The percentage of Brooklyn households who identify as Asian increased slightly from 6.4% to 7.3%, while the proportion of black (including Hispanic) households dropped from 35% in 2002 to 32.4% in 2005. The share of immigrants overall dropped from 40.2% to 37.5%.
Brooklyn is home to many large development projects and rezoning measures. The Atlantic Yards proposal, intended for the neighborhood of Prospect Heights, is by far the most controversial of these proposed developments. The Brooklyn Waterfront Greenway, a 14-mile stretch of green space from Sunset Park to Greenpoint, is another complex, contentious undertaking. In 2005, multiple rezonings took place in Brooklyn. Most were downzonings intended to restrict “out of context” development and preserve neighborhood character, although one – the Greenpoint-Williamsburg waterfront measure, approved in May 2005 – rezoned portions of that area from manufacturing to residential and allowed for increased building heights through an inclusionary zoning program.
Lending Indicators
Home Purchase Loans (per 1,000 properties) 47.9 49.3 58.4 - 4 4
% Subprime Home Purchase Loans 8.4% 12.8% 18.4% - 2 2
Home Purchase Loan Approval Rate 80.9% 80.4% 78.1% - 4 4
Refinance Loan Rate (per 1,000 properties) 67.0 104.2 66.0 - 4 2
% Subprime Refinance Loans 22.2% 21.8% 35.5% - 2 2
Notices of Foreclosure (per 1,000 1-4 family properties) 15.0 15.3 14.0 - 2 21
Social, Demographic, and Income Indicators
Population 2,479,338 2,483,164 2,497,859 2,486,235 1 1
Racial Diversity Index 0.89 - - 0.90 2 2
% Immigrant Households 40.2% - - 37.5% 2 2
% Asian (inc. Hawaiian and Pacific Islander) Households 6.4% - - 7.3% 3 3
% Black (including Hispanic) Households 35.0% - - 32.4% 1 1
% Hispanic (non-Black) Households 16.4% - - 16.6% 4 4
% White (non-Hispanic) Households 42.0% - - 42.4% 4 3
% Native American Households 0.1% - - 0.2% 2 2
Median Household Income (in 2004 dollars) $36,997 - - $35,000 4 4
Income Diversity Ratio 6.2 - - 6.3 2 3
Poverty Rate 20.5% - - 20.7% 2 2
Unemployment Rate 9.1% - - - 2 -
% Students Performing at Grade Level - Reading 40.3% 42.0% 41.9% - 4 3
% Students Performing at Grade Level - Math 36.7% 42.6% 47.3% - 3 4
Felony Crime Rate (per 1,000 residents) 29.6 28.6 27.6 - 3 3
2002 2003 2004 2005 2002 (2004/5) Rank Rank
49 | TH
E FURM
AN
CEN
TER FOR REA
L ESTATE &
URBA
N PO
LICY

G R E E N P O I N T / W I L L I A M S B U R G
CD 201
Nearly 200 blocks in Greenpoint-Williamsburg were rezoned in 2005 to make way for thousands of new residential units and a new 27.8 acre waterfront park. This massive rezoning initiative involved both land already zoned for residential use as well as land that was zoned for industrial activity and largely vacant. The zoning changes included a voluntary inclusionary zoning program, which allows developers who provide affordable housing to build extra stories.
2002 2003 2004 2005 Rank (2002)
Rank (2004/5)
Median Household Income (in 2004 dollars) $32,838 - - $35,000 38 30
Poverty Rate 24.2% - - 24.2% 15 17
% Immigrant Households 39.3% - - 38.3% 25 20
Rental Vacancy Rate 3.9% - - 1.7% 15 47
Number of Housing Units 55,000 - - 54,412 22 26
% Public Housing 10.4% - - 10.3% 19 18
% Rent-Regulated/Other subsidized 62.2% - - 64.0% 22 17
Certificates of Occupancy 417 412 289 559 12 8
Units Authorized by New Residential Building Permits 922 1,455 837 - 3 4
Homeownership Rate 17.3% - - 16.8% 43 44
Index of Housing Price Appreciation (2-4 family building) 214.0 232.5 289.7 - 3 31
Home Purchase Loans (per 1,000 properties) 52.0 25.9 30.3 - 27 55
% Subprime Home Purchase Loans 8.1% 10.0% 3.0% - 25 44
Refinance Loan Rate (per 1,000 properties) 50.6 74.4 40.2 - 36 34
% Subprime Refinance Loans 20.0% 16.0% 15.4% - 24 39
Notices of Foreclosure (per 1,000 1-4 family properties) 3.7 4.4 4.4 - 44 38
% Tax Delinquencies (delinquent ≥ 1 year) 3.4% 2.6% 1.9% - 24 22
% Vacant Land Area - 4.1% 4.0% 4.3% 28 24
Serious Housing Code Violations (per 1,000 rental units) 26.8 22.5 19.6 - 28 36
% Students Performing at Grade Level - Reading 36.2% 43.9% 39.7% - 36 36
% Students Performing at Grade Level - Math 36.2% 45.6% 45.8% - 32 35
Felony Crime Rate (per 1,000 residents) 30.3 29.9 28.9 - 28 27
Growth has been evident in CD 201 for the past few years. The number of housing units authorized by new building permits has been consistently high in recent years, and the number of certificates of occupancy issued in the CD was the 8th highest in the City. Home prices are on the rise, with real median monthly rent increasing by the 4th highest dollar amount in the City. Our quality-controlled index of price appreciation shows that, for 2 to 4 family buildings, housing prices have risen in CD 201 more rapidly since 1994 than in almost any other CD in the City.
Rank (2002)
Rank (2004/5)
Population (2000): 160,338 20 -
Racial Diversity Index: 0.66 32 34
Median Household Income: $35,000 38 30
Income Diversity Ratio: 6.2 28 12
Median Monthly Rent: $900 44 21
Median Price/Unit (2-4 fam.): $229,417 38 27
50
_____________________________________________________________________________________________________________ Numbers in italics are based on a small number of observations and should be treated with caution. 1 Ranked out of 34 community districts with the same predominant housing type (2-4 family buildings).

F O R T G R E E N E / B R O O K L Y N H E I G H T S
CD 202
______________________________________________________________________________________________________________ Numbers in italics are based on a small number of observations and should be treated with caution. 1 Ranked out of 34 community districts with the same predominant housing type (2-4 family buildings).
2002 2003 2004 2005 Rank (2002)
Rank (2004/5)
$44,879 - - $42,500 22 22 Median Household Income (in 2004 dollars)
17.7% - - 18.0% 24 24 Poverty Rate
16.4% - - 18.6% 47 47 % Immigrant Households
4.7% - - 2.0% 7 39 Rental Vacancy Rate
50,252 - - 50,083 32 35 Number of Housing Units
15.4% - - 15.8% 12 11 % Public Housing
47.6% - - 48.9% 32 36 % Rent-Regulated/Other subsidized
14 71 325 63 56 51 Certificates of Occupancy
234 349 357 - 31 23 Units Authorized by New Residential Building Permits
32.2% - - 29.2% 23 30 Homeownership Rate
237.4 308.9 363.5 - 1 11 Index of Housing Price Appreciation (2-4 family building)
60.6 63.6 59.0 - 18 27 Home Purchase Loans (per 1,000 properties)
4.5% 4.5% 4.4% - 40 38 % Subprime Home Purchase Loans
71.2 108.7 52.3 - 25 26 Refinance Loan Rate (per 1,000 properties)
11.2% 9.8% 15.4% - 41 39 % Subprime Refinance Loans
14.1 14.7 11.0 - 25 29 Notices of Foreclosure (per 1,000 1-4 family properties)
4.6% 3.4% 2.2% - 18 19 % Tax Delinquencies (delinquent ≥ 1 year)
- 2.2% 2.3% 2.4% 36 33 % Vacant Land Area
25.8 21.3 18.2 - 29 39 Serious Housing Code Violations (per 1,000 rental units)
34.5% 36.2% 37.7% - 39 37 % Students Performing at Grade Level - Reading
31.7% 38.5% 42.1% - 37 39 % Students Performing at Grade Level - Math
56.6 53.4 51.2 - 5 5 Felony Crime Rate (per 1,000 residents)
CD 202, home to neighborhoods such as Brooklyn Heights, Clinton Hill, Boerum Hill and Fort Greene, is also the location for much of the Brooklyn Waterfront Greenway. The Greenway plan, the centerpiece of which is a public park intended to replace much of the industrial waterfront, spans 14 miles of Brooklyn’s waterfront, from Sunset Park to Newtown Creek in Greenpoint.
Like the rest of the City, CD 202 has seen a marked decrease in property tax delinquencies. The prices of 2 to 4 family homes has risen more since 1994 than in any other CD in the City. Contrary to citywide trends, homeownership rates have decreased at the 4th highest rate in the City in percentage point terms. CD 202 ranks 21st citywide for income diversity, down from 2002, when the CD ranked 3rd.
Rank (2002)
Rank (2004/5)
Population (2000): 98,620 49 -
Racial Diversity Index: 0.86 12 14
Median Household Income: $42,500 22 22
Income Diversity Ratio: 5.7 3 21
Median Monthly Rent: $950 15 14
Median Price/Unit (2-4 fam.): $324,750 8 9
51 | TH
E FURM
AN
CEN
TER FOR REA
L ESTATE &
URBA
N PO
LICY

B E D F O R D S T U Y V E S A N T
CD 203
Although the area has undergone a moderate residential resurgence in recent years, Bedford Stuyvesant continues to exhibit signs of housing and neighborhood distress. CD 203 led the City in the rates of home purchase and refinance loans, but this promising sign was countered by the prevalence of subprime loans, a potential sign of predatory lending. The rate of foreclosure notices, at 43.1 per 1,000
2002 2003 2004 2005 Rank (2002)
Rank (2004/5)
Median Household Income (in 2004 dollars) $27,190 - - $22,200 47 51
Poverty Rate 29.8% - - 34.5% 8 5
% Immigrant Households 22.4% - - 23.8% 41 41
Rental Vacancy Rate 2.7% - - 2.7% 27 29
Number of Housing Units 48,313 - - 48,495 37 39
% Public Housing 18.2% - - 22.1% 9 5
% Rent-Regulated/Other subsidized 33.0% - - 30.6% 48 48
Certificates of Occupancy 53 277 460 355 47 18
Units Authorized by New Residential Building Permits 895 685 511 - 4 12
Homeownership Rate 18.9% - - 21.2% 41 36
Index of Housing Price Appreciation (2-4 family building) 186.9 209.3 245.0 - 4 61
Home Purchase Loans (per 1,000 properties) 75.5 94.1 120.2 - 7 2
% Subprime Home Purchase Loans 16.1% 23.2% 34.3% - 5 10
Refinance Loan Rate (per 1,000 properties) 86.6 138.4 131.3 - 17 1
% Subprime Refinance Loans 38.0% 41.0% 49.2% - 4 7
Notices of Foreclosure (per 1,000 1-4 family properties) 43.9 46.2 43.1 - 1 1
% Tax Delinquencies (delinquent ≥ 1 year) 8.9% 6.2% 4.5% - 5 6
% Vacant Land Area - 9.3% 9.1% 8.8% 8 8
Serious Housing Code Violations (per 1,000 rental units) 100.3 93.9 97.4 - 2 7
% Students Performing at Grade Level - Reading 33.1% 33.4% 33.3% - 43 45
% Students Performing at Grade Level - Math 27.6% 35.8% 38.0% - 43 47
Felony Crime Rate (per 1,000 residents) 40.0 39.1 39.4 - 11 10
one to four family properties in 2004, was the highest in New York City that year. Real incomes fell significantly between 2002 and 2004. The area has also witnessed consistently high poverty rates and serious housing code violations rates in recent years.
______________________________________________________________________________________________________________ Numbers in italics are based on a small number of observations and should be treated with caution. 1 Ranked out of 34 community districts with the same predominant housing type (2-4 family buildings).
Rank (2002)
Population (2000): 143,867 25
Racial Diversity Index: 0.57 42
Median Household Income: $22,200 47
Median Monthly Rent: $750 51
Median Price/Unit (2-4 fam.): $192,500 46
Rank (2004/5)
-
39
51
48
38
Income Diversity Ratio: 6.6 13 8
52
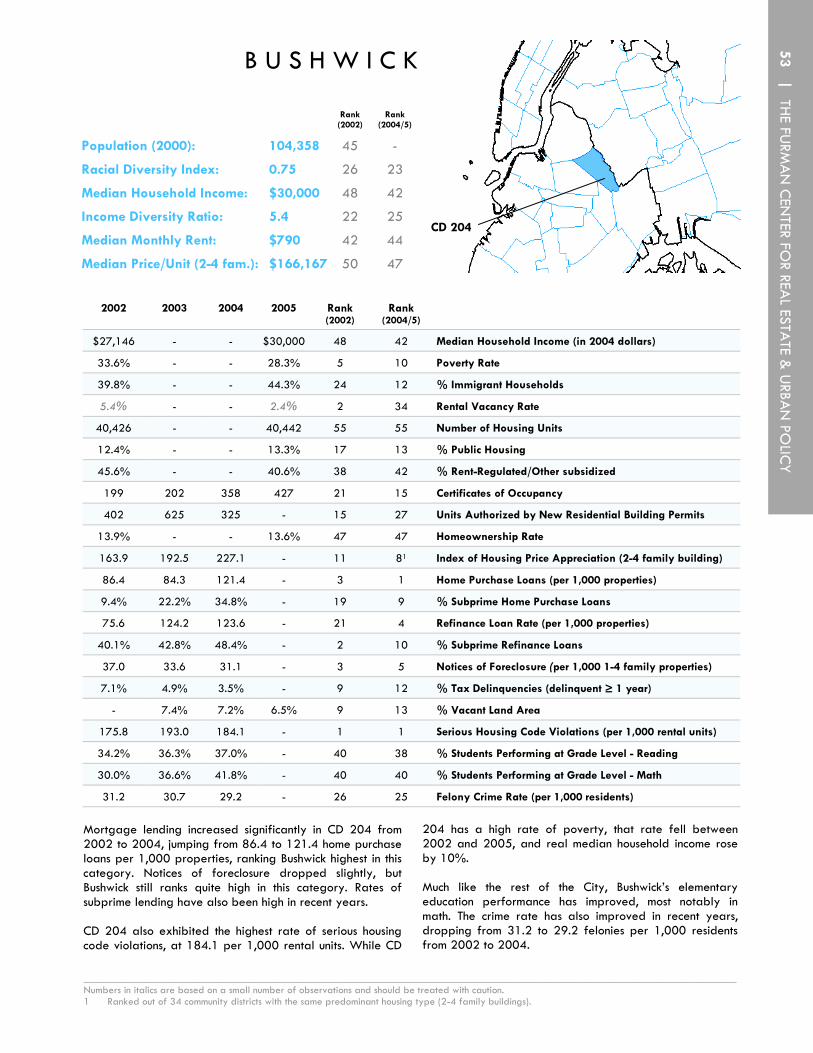
B U S H W I C K
CD 204
2002 2003 2004 2005 Rank (2002)
Rank (2004/5)
$27,146 - - $30,000 48 42 Median Household Income (in 2004 dollars)
33.6% - - 28.3% 5 10 Poverty Rate
39.8% - - 44.3% 24 12 % Immigrant Households
5.4% - - 2.4% 2 34 Rental Vacancy Rate
40,426 - - 40,442 55 55 Number of Housing Units
12.4% - - 13.3% 17 13 % Public Housing
45.6% - - 40.6% 38 42 % Rent-Regulated/Other subsidized
199 202 358 427 21 15 Certificates of Occupancy
402 625 325 - 15 27 Units Authorized by New Residential Building Permits
13.9% - - 13.6% 47 47 Homeownership Rate
163.9 192.5 227.1 - 11 81 Index of Housing Price Appreciation (2-4 family building)
86.4 84.3 121.4 - 3 1 Home Purchase Loans (per 1,000 properties)
9.4% 22.2% 34.8% - 19 9 % Subprime Home Purchase Loans
75.6 124.2 123.6 - 21 4 Refinance Loan Rate (per 1,000 properties)
40.1% 42.8% 48.4% - 2 10 % Subprime Refinance Loans
37.0 33.6 31.1 - 3 5 Notices of Foreclosure (per 1,000 1-4 family properties)
7.1% 4.9% 3.5% - 9 12 % Tax Delinquencies (delinquent ≥ 1 year)
- 7.4% 7.2% 6.5% 9 13 % Vacant Land Area
175.8 193.0 184.1 - 1 1 Serious Housing Code Violations (per 1,000 rental units)
34.2% 36.3% 37.0% - 40 38 % Students Performing at Grade Level - Reading
30.0% 36.6% 41.8% - 40 40 % Students Performing at Grade Level - Math
31.2 30.7 29.2 - 26 25 Felony Crime Rate (per 1,000 residents)
Mortgage lending increased significantly in CD 204 from 2002 to 2004, jumping from 86.4 to 121.4 home purchase loans per 1,000 properties, ranking Bushwick highest in this category. Notices of foreclosure dropped slightly, but Bushwick still ranks quite high in this category. Rates of subprime lending have also been high in recent years. CD 204 also exhibited the highest rate of serious housing code violations, at 184.1 per 1,000 rental units. While CD
204 has a high rate of poverty, that rate fell between 2002 and 2005, and real median household income rose by 10%. Much like the rest of the City, Bushwick’s elementary education performance has improved, most notably in math. The crime rate has also improved in recent years, dropping from 31.2 to 29.2 felonies per 1,000 residents from 2002 to 2004.
_____________________________________________________________________________________________________________ Numbers in italics are based on a small number of observations and should be treated with caution. 1 Ranked out of 34 community districts with the same predominant housing type (2-4 family buildings).
Rank (2002)
Rank (2004/5)
Population (2000): 104,358 45 -
Racial Diversity Index: 0.75 26 23
Median Household Income: $30,000 48 42
Income Diversity Ratio: 5.4 22 25
Median Monthly Rent: $790 42 44
Median Price/Unit (2-4 fam.): $166,167 50 47
53 | TH
E FURM
AN
CEN
TER FOR REA
L ESTATE &
URBA
N PO
LICY

E A S T N E W Y O R K
CD 205
Like many other New York City communities, CD 205 has witnessed an upsurge in home purchase and refinance lending, accompanied by a dramatic increase in subprime loans. Subprime home purchase loans have more than tripled from 10.5% in 2002 to 38.2% of loans in 2004. The rate of subprime refinance loans was among the highest in the City, at 50.7% in 2004.
2002 2003 2004 2005 Rank (2002)
Rank (2004/5)
Median Household Income (in 2004 dollars) $32,838 - - $28,000 38 45
Poverty Rate 22.2% - - 25.9% 17 13
% Immigrant Households 42.5% - - 34.9% 16 27
Rental Vacancy Rate 1.7% - - 3.3% 40 20
Number of Housing Units 48,425 - - 48,763 36 38
% Public Housing 20.2% - - 21.2% 5 6
% Rent-Regulated/Other subsidized 38.0% - - 35.4% 43 44
Certificates of Occupancy 440 397 396 482 11 12
Units Authorized by New Residential Building Permits 616 456 443 - 6 16
Homeownership Rate 23.5% - - 20.5% 36 39
Index of Housing Price Appreciation (2-4 family building) 138.1 165.0 193.9 - 25 221
Home Purchase Loans (per 1,000 properties) 67.8 77.4 106.4 - 14 3
% Subprime Home Purchase Loans 10.5% 22.5% 38.2% - 13 4
Refinance Loan Rate (per 1,000 properties) 91.4 132.4 125.8 - 15 3
% Subprime Refinance Loans 35.9% 38.9% 50.7% - 7 2
Notices of Foreclosure (per 1,000 1-4 family properties) 33.1 35.5 29.5 - 7 7
% Tax Delinquencies (delinquent ≥ 1 year) 6.0% 3.5% 2.4% - 14 17
% Vacant Land Area - 16.5% 16.3% 17.7% 4 2
Serious Housing Code Violations (per 1,000 rental units) 58 63.5 60.6 - 15 17
% Students Performing at Grade Level - Reading 26.8% 28.5% 28.4% - 54 54
% Students Performing at Grade Level - Math 21.5% 29.6% 36.1% - 57 53
Felony Crime Rate (per 1,000 residents) 33.4 34.6 36.4 - 19 14
Although reading and math performance have improved in recent years - math scores have increased by the most percentage points citywide - CD 205 remains behind the rest of New York City. This area also has the 2nd highest percentage of vacant land in the City. Contrary to citywide trends, the felony crime rate increased and the homeownership rate decreased in CD 205.
_____________________________________________________________________________________________________________ Numbers in italics are based on a small number of observations and should be treated with caution. 1 Ranked out of 34 community districts with the same predominant housing type (2-4 family buildings).
Rank (2002)
Population (2000): 173,198 10
Racial Diversity Index: 0.85 23
Median Household Income: $28,000 38
Median Monthly Rent: $800 32
Median Price/Unit (2-4 fam.): $170,000 48
Rank (2004/5)
-
17
45
38
46
Income Diversity Ratio: 6.0 20 16
54

P A R K S L O P E / C A R R O L L G A R D E N S
CD 206
2002 2003 2004 2005 Rank (2002)
Rank (2004/5)
$51,446 - - $50,000 12 13 Median Household Income (in 2004 dollars)
13.6% - - 13.3% 36 34 Poverty Rate
16.7% - - 15.9% 46 48 % Immigrant Households
4.3% - - 1.3% 9 50 Rental Vacancy Rate
47,687 - - 47,782 39 42 Number of Housing Units
9.5% - - 10.9% 22 16 % Public Housing
37.7% - - 32.2% 44 47 % Rent-Regulated/Other subsidized
111 94 58 107 36 44 Certificates of Occupancy
281 90 147 - 23 47 Units Authorized by New Residential Building Permits
29.9% - - 29.5% 25 29 Homeownership Rate
232.8 271.5 332.0 - 2 21 Index of Housing Price Appreciation (2-4 family building)
64.0 64.4 67.7 - 17 19 Home Purchase Loans (per 1,000 properties)
3.2% 3.6% 2.0% - 45 46 % Subprime Home Purchase Loans
96.3 157.0 60.6 - 10 23 Refinance Loan Rate (per 1,000 properties)
10.9% 7.0% 12.8% - 42 45 % Subprime Refinance Loans
4.8 3.9 2.5 - 37 50 Notices of Foreclosure (per 1,000 1-4 family properties)
2.5% 1.4% 1.2% - 31 35 % Tax Delinquencies (delinquent ≥ 1 year)
- 2.0% 1.9% 1.9% 39 38 % Vacant Land Area
21.9 16.4 14.7 - 35 44 Serious Housing Code Violations (per 1,000 rental units)
44.1% 44.7% 45.7% - 27 28 % Students Performing at Grade Level - Reading
39.7% 45.1% 50.3% - 27 30 % Students Performing at Grade Level - Math
32.4 32.3 31.4 - 21 18 Felony Crime Rate (per 1,000 residents)
The plan to build an Ikea furniture store in Red Hook has stirred controversy in CD 206. Proponents say the project will benefit the community through the creation of more than 500 new jobs, the construction of a new public waterfront esplanade, and a commitment to investing in the communities the store serves. Opponents say the benefits do not outweigh the traffic impacts, destruction of historic structures, and public investment in infrastructure.
CD 206, which also contains Park Slope and Carroll Gardens, ranks high in median monthly rent and median home prices. Since 1994, prices of 2 to 4 family homes have more than tripled, the 2nd highest increase in the City. The area has one of the lowest rates of foreclosure notices in the City, and its rental vacancy rate has dropped to a mere 1.3% in 2005.
______________________________________________________________________________________________________________ Numbers in italics are based on a small number of observations and should be treated with caution. 1 Ranked out of 34 community districts with the same predominant housing type (2-4 family buildings).
Rank (2002)
Population (2000): 104,054 46
Racial Diversity Index: 0.59 31
Median Household Income: $50,000 12
Median Monthly Rent: $1,090 7
Median Price/Unit (2-4 fam.): $424,500 6
Rank (2004/5)
-
37
13
7
7
Income Diversity Ratio: 5.4 22 25
55 | TH
E FURM
AN
CEN
TER FOR REA
L ESTATE &
URBA
N PO
LICY

S U N S E T P A R K
CD 207
The rate of home purchase lending has increased steadily in recent years, along with home prices. Sunset Park has one of the lowest amounts of vacant land in the City – only 0.8% of land was unused in 2005. Sunset Park is one of the most racially diverse community districts in New York City. The poverty rate fell substantially between 2002 and 2005.
2002 2003 2004 2005 Rank (2002)
Rank (2004/5)
Median Household Income (in 2004 dollars) $39,406 - - $40,000 30 24
Poverty Rate 18.2% - - 14.6% 23 33
% Immigrant Households 49.5% - - 36.9% 9 25
Rental Vacancy Rate 2.1% - - 2.3% 35 35
Number of Housing Units 46,978 - - 48,032 41 40
% Public Housing 0.0% - - 0.0% 38 38
% Rent-Regulated/Other subsidized 40.5% - - 43.1% 41 39
Certificates of Occupancy 13 95 76 124 57 39
Units Authorized by New Residential Building Permits 170 75 173 - 38 42
Homeownership Rate 27.3% - - 28.0% 32 32
Index of Housing Price Appreciation (2-4 family building) 169.9 213.8 252.5 - 8 51
Home Purchase Loans (per 1,000 properties) 42.7 50.7 53.0 - 37 32
% Subprime Home Purchase Loans 7.3% 8.9% 7.1% - 27 33
Refinance Loan Rate (per 1,000 properties) 62.3 92.4 51.5 - 31 27
% Subprime Refinance Loans 19.7% 17.4% 24.9% - 27 31
Notices of Foreclosure (per 1,000 1-4 family properties) 6.1 5.9 7.0 - 35 35
% Tax Delinquencies (delinquent ≥ 1 year) 2.5% 1.9% 1.4% - 31 26
% Vacant Land Area - 0.8% 0.8% 0.8% 53 54
Serious Housing Code Violations (per 1,000 rental units) 32.2 32.6 30.7 - 24 28
% Students Performing at Grade Level - Reading 47.1% 48.1% 48.9% - 21 21
% Students Performing at Grade Level - Math 43.8% 48.2% 54.0% - 23 21
Felony Crime Rate (per 1,000 residents) 23.3 25.2 22.1 - 48 40
Sunset Park is one of the few neighborhoods in the City in which percentage of rental units that are rent-regulated or subsidized rose. Education performance has risen in recent years, particularly, student’s math performance. Housing prices have appreciated dramatically, rising 48% in a two year period.
_____________________________________________________________________________________________________________ Numbers in italics are based on a small number of observations and should be treated with caution. 1 Ranked out of 34 community districts with the same predominant housing type (2-4 family buildings).
Rank (2002)
Rank (2004/5)
Population (2000): 120,063 34 -
Racial Diversity Index: 0.89 10 9
Median Household Income: $40,000 30 24
Income Diversity Ratio: 4.8 48 43
Median Monthly Rent: $892 22 29
Median Price/Unit (2-4 fam.): $258,333 22 18
56

C R O W N H E I G H T S
CD 208
2002 2003 2004 2005 Rank (2002)
Rank (2004/5)
$29,252 - - $31,556 45 38 Median Household Income (in 2004 dollars)
26.6% - - 24.4% 11 16 Poverty Rate
35.3% - - 31.1% 32 32 % Immigrant Households
3.3% - - 4.2% 20 13 Rental Vacancy Rate
50,894 - - 54,780 30 25 Number of Housing Units
14.0% - - 8.9% 13 21 % Public Housing
60.5% - - 63.2% 24 19 % Rent-Regulated/Other subsidized
71 61 98 280 43 21 Certificates of Occupancy
180 308 270 - 35 29 Units Authorized by New Residential Building Permits
18.2% - - 19.3% 42 40 Homeownership Rate
168.3 216.8 233.8 - 9 71 Index of Housing Price Appreciation (2-4 family building)
70.5 64.4 71.6 - 10 14 Home Purchase Loans (per 1,000 properties)
7.0% 17.2% 27.1% - 31 14 % Subprime Home Purchase Loans
73.5 121.2 94.4 - 23 11 Refinance Loan Rate (per 1,000 properties)
32.1% 27.7% 42.8% - 11 14 % Subprime Refinance Loans
33.3 38.1 36.6 - 6 4 Notices of Foreclosure (per 1,000 1-4 family properties)
8.3% 6.8% 4.6% - 6 4 % Tax Delinquencies (delinquent ≥ 1 year)
- 5.0% 4.9% 4.8% 22 21 % Vacant Land Area
89.6 96.1 95.0 - 4 8 Serious Housing Code Violations (per 1,000 rental units)
33.2% 34.0% 33.7% - 42 44 % Students Performing at Grade Level - Reading
25.9% 33.1% 36.2% - 45 52 % Students Performing at Grade Level - Math
34.4 33.6 30.7 - 16 20 Felony Crime Rate (per 1,000 residents)
Prospect Heights, part of CD 208, is the site of the proposed Atlantic Yards development, a large-scale, mixed-use project that would consist of a basketball arena, 6,800 units of housing, approximately one million square feet of office and retail space, and seven acres of open space. The proposal is a subject of intense debate.
Educational performance in CD 208, while on an upward trend, remains behind the majority of community districts in the City. The rate of notices of foreclosure and tax delinquencies are among the highest in the City. Serious housing code violations also are an issue in CD 208, with 95 violations occurring for every 1,000 rental units.
_____________________________________________________________________________________________________________ Numbers in italics are based on a small number of observations and should be treated with caution. 1 Ranked out of 34 community districts with the same predominant housing type (2-4 family buildings).
Rank (2002)
Rank (2004/5)
Population (2000): 96,076 50 -
Racial Diversity Index: 0.66 40 34
Median Household Income: $31,556 45 38
Income Diversity Ratio: 6.0 10 16
Median Monthly Rent: $800 32 38
Median Price/Unit (2-4 fam.): $200,000 40 34
57 | TH
E FURM
AN
CEN
TER FOR REA
L ESTATE &
URBA
N PO
LICY

S O U T H C R O W N H T S ./ P R O S P E C T H E I G H T S
CD 209
Nearly half of the households in CD 209 are immigrant households, though this number decreased slightly between 2002 and 2005. Also of note is the community district’s large share of rent-regulated and subsidized housing, the 5th highest proportion in the City.
2002 2003 2004 2005 Rank (2002)
Rank (2004/5)
Median Household Income (in 2004 dollars) $35,027 - - $31,200 36 40
Poverty Rate 17.6% - - 19.2% 26 22
% Immigrant Households 50.3% - - 48.2% 7 7
Rental Vacancy Rate 4.0% - - 4.5% 14 7
Number of Housing Units 42,457 - - 42,622 52 52
% Public Housing 0.0% - - 0.0% 38 38
% Rent-Regulated/Other subsidized 81.6% - - 87.6% 7 5
Certificates of Occupancy 41 10 7 122 52 40
Units Authorized by New Residential Building Permits 41 132 53 - 57 56
Homeownership Rate 15.3% - - 15.8% 46 45
Index of Housing Price Appreciation (2-4 family building) 137.4 163.7 186.4 - 26 261
Home Purchase Loans (per 1,000 properties) 33.1 34.7 39.2 - 50 45
% Subprime Home Purchase Loans 9.9% 20.1% 24.8% - 16 16
Refinance Loan Rate (per 1,000 properties) 62.8 98.4 72.7 - 30 18
% Subprime Refinance Loans 33.8% 28.6% 46.4% - 9 11
Notices of Foreclosure (per 1,000 1-4 family properties) 19.3 17.9 18.5 - 20 21
% Tax Delinquencies (delinquent ≥ 1 year) 6.4% 4.3% 3.2% - 11 13
% Vacant Land Area - 1.2% 1.6% 1.7% 49 41
Serious Housing Code Violations (per 1,000 rental units) 66.8 84.0 70.1 - 13 12
% Students Performing at Grade Level - Reading 33.7% 34.7% 33.8% - 41 42
% Students Performing at Grade Level - Math 25.2% 32.1% 35.5% - 47 54
Felony Crime Rate (per 1,000 residents) 35.6 32.8 31.1 - 15 19
The number of certificates of occupancy issued rose to 122 in 2005, up from just 7 in 2004. Housing values have been steadily rising. Home purchase and refinance loans have also increased, as have the percentages of these loans that are subprime. CD 209 is one of the least racially diverse community districts, with a racial diversity index of 0.55.
_____________________________________________________________________________________________________________ Numbers in italics are based on a small number of observations and should be treated with caution. 1 Ranked out of 34 community districts with the same predominant housing type (2-4 family buildings).
Rank (2002)
Rank (2004/5)
Population (2000): 104,014 47 -
Racial Diversity Index: 0.55 46 41
Median Household Income: $31,200 36 40
Income Diversity Ratio: 4.7 49 44
Median Monthly Rent: $750 32 48
Median Price/Unit (2-4 fam.): $195,195 42 36
58
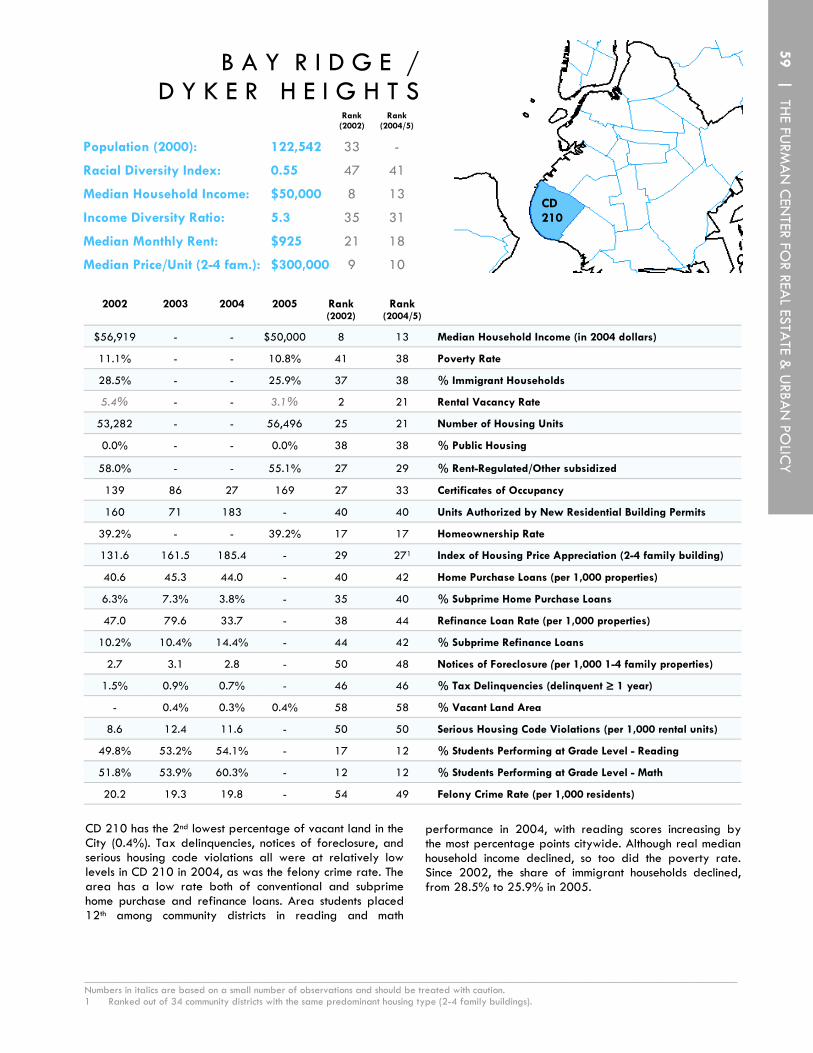
B A Y R I D G E / D Y K E R H E I G H T S
CD 210
2002 2003 2004 2005 Rank (2002)
Rank (2004/5)
$56,919 - - $50,000 8 13 Median Household Income (in 2004 dollars)
11.1% - - 10.8% 41 38 Poverty Rate
28.5% - - 25.9% 37 38 % Immigrant Households
5.4% - - 3.1% 2 21 Rental Vacancy Rate
53,282 - - 56,496 25 21 Number of Housing Units
0.0% - - 0.0% 38 38 % Public Housing
58.0% - - 55.1% 27 29 % Rent-Regulated/Other subsidized
139 86 27 169 27 33 Certificates of Occupancy
160 71 183 - 40 40 Units Authorized by New Residential Building Permits
39.2% - - 39.2% 17 17 Homeownership Rate
131.6 161.5 185.4 - 29 271 Index of Housing Price Appreciation (2-4 family building)
40.6 45.3 44.0 - 40 42 Home Purchase Loans (per 1,000 properties)
6.3% 7.3% 3.8% - 35 40 % Subprime Home Purchase Loans
47.0 79.6 33.7 - 38 44 Refinance Loan Rate (per 1,000 properties)
10.2% 10.4% 14.4% - 44 42 % Subprime Refinance Loans
2.7 3.1 2.8 - 50 48 Notices of Foreclosure (per 1,000 1-4 family properties)
1.5% 0.9% 0.7% - 46 46 % Tax Delinquencies (delinquent ≥ 1 year)
- 0.4% 0.3% 0.4% 58 58 % Vacant Land Area
8.6 12.4 11.6 - 50 50 Serious Housing Code Violations (per 1,000 rental units)
49.8% 53.2% 54.1% - 17 12 % Students Performing at Grade Level - Reading
51.8% 53.9% 60.3% - 12 12 % Students Performing at Grade Level - Math
20.2 19.3 19.8 - 54 49 Felony Crime Rate (per 1,000 residents)
CD 210 has the 2nd lowest percentage of vacant land in the City (0.4%). Tax delinquencies, notices of foreclosure, and serious housing code violations all were at relatively low levels in CD 210 in 2004, as was the felony crime rate. The area has a low rate both of conventional and subprime home purchase and refinance loans. Area students placed 12th among community districts in reading and math
performance in 2004, with reading scores increasing by the most percentage points citywide. Although real median household income declined, so too did the poverty rate. Since 2002, the share of immigrant households declined, from 28.5% to 25.9% in 2005.
_____________________________________________________________________________________________________________ Numbers in italics are based on a small number of observations and should be treated with caution. 1 Ranked out of 34 community districts with the same predominant housing type (2-4 family buildings).
Rank (2002)
Rank (2004/5)
Population (2000): 122,542 33 -
Racial Diversity Index: 0.55 47 41
Median Household Income: $50,000 8 13
Income Diversity Ratio: 5.3 35 31
Median Monthly Rent: $925 21 18
Median Price/Unit (2-4 fam.): $300,000 9 10
59 | TH
E FURM
AN
CEN
TER FOR REA
L ESTATE &
URBA
N PO
LICY

B E N S O N H U R S T
CD 211
Similar to neighboring Bay Ridge/Dyker Heights, CD 211 had high education performance scores, with reading scores increasing at the 3rd highest rate citywide, and it had an extremely low crime rate in 2004. CD 211, which encompasses Bensonhurst and Gravesend, among other neighborhoods, has a high percentage of immigrant households, at 41% in 2005.
2002 2003 2004 2005 Rank (2002)
Rank (2004/5)
Median Household Income (in 2004 dollars) $37,8290 - - $34,440 34 34
Poverty Rate 21.4% - - 17.2% 19 25
% Immigrant Households 49.9% - - 41.0% 8 16
Rental Vacancy Rate 1.9% - - 0.4% 37 55
Number of Housing Units 66,672 - - 66,838 13 13
% Public Housing 0.0% - - 0.0% 38 38
% Rent-Regulated/Other subsidized 46.0% - - 45.7% 37 37
Certificates of Occupancy 136 97 100 159 30 35
Units Authorized by New Residential Building Permits 198 169 210 - 34 36
Homeownership Rate 28.7% - - 29.9% 28 27
Index of Housing Price Appreciation (2-4 family building) 134.2 164.9 203.3 - 27 191
Home Purchase Loans (per 1,000 properties) 34.6 37.0 42.5 - 48 43
% Subprime Home Purchase Loans 4.4% 9.3% 3.3% - 42 42
Refinance Loan Rate (per 1,000 properties) 47.0 73.8 32.4 - 38 45
% Subprime Refinance Loans 15.3% 13.4% 18.5% - 32 36
Notices of Foreclosure (per 1,000 1-4 family properties) 2.5 2.2 2.8 - 51 48
% Tax Delinquencies (delinquent ≥ 1 year) 1.3% 0.8% 0.6% - 51 51
% Vacant Land Area - 1.4% 1.4% 1.5% 45 44
Serious Housing Code Violations (per 1,000 rental units) 13 12.0 12.2 - 44 46
% Students Performing at Grade Level - Reading 51.3% 53.8% 54.9% - 15 11
% Students Performing at Grade Level - Math 52.3% 54.8% 60.6% - 11 11
Felony Crime Rate (per 1,000 residents) 18.5 17.0 16.4 - 56 56
Property tax delinquencies were extremely low in 2004 – only 0.6% of delinquencies were of one year or longer. Housing prices have been on the rise in CD 211, especially in the last two years. The City rezoned 120 blocks in Bensonhurst in 2005 to preserve the area’s prevailing low-density character.
_____________________________________________________________________________________________________________ Numbers in italics are based on a small number of observations and should be treated with caution. 1 Ranked out of 34 community districts with the same predominant housing type (2-4 family buildings).
Rank (2002)
Rank (2004/5)
Population (2000): 172,129 11 -
Racial Diversity Index: 0.70 34 30
Median Household Income: $34,440 34 34
Median Monthly Rent: $850 30 32
Median Price/Unit (2-4 fam.): $258,333 21 18
Income Diversity Ratio: 5.4 13 25
60
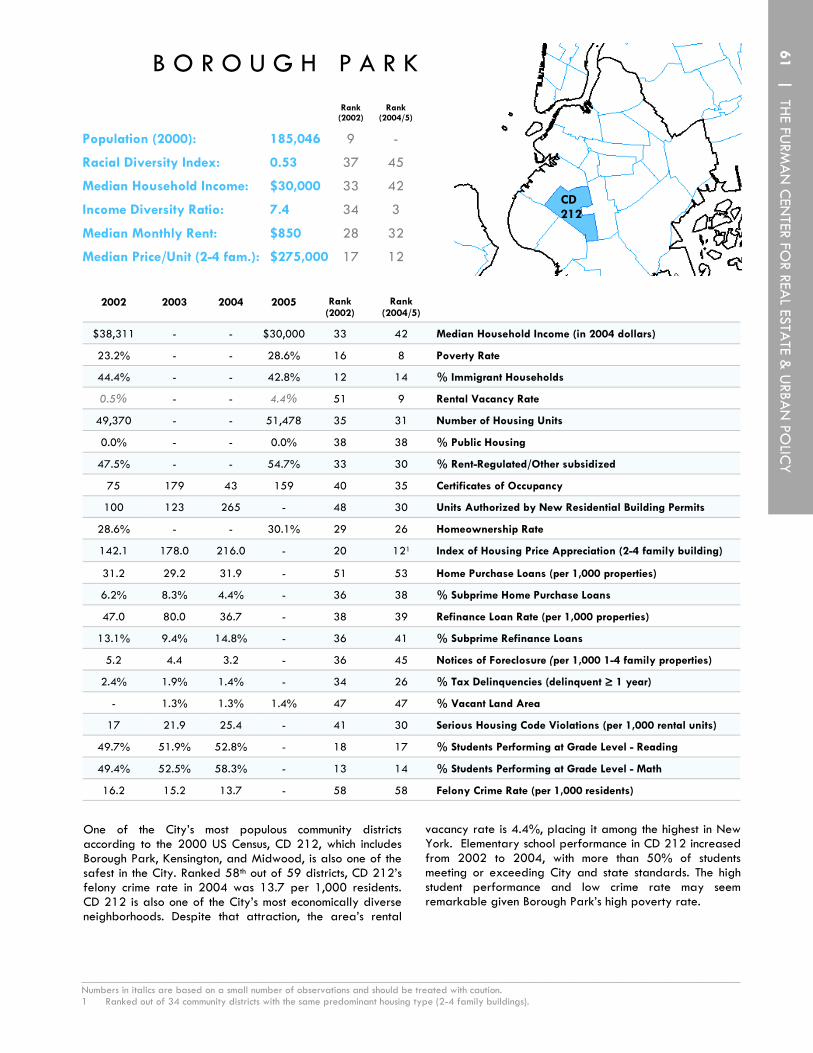
B O R O U G H P A R K
CD 212
2002 2003 2004 2005 Rank (2002)
Rank (2004/5)
$38,311 - - $30,000 33 42 Median Household Income (in 2004 dollars)
23.2% - - 28.6% 16 8 Poverty Rate
44.4% - - 42.8% 12 14 % Immigrant Households
0.5% - - 4.4% 51 9 Rental Vacancy Rate
49,370 - - 51,478 35 31 Number of Housing Units
0.0% - - 0.0% 38 38 % Public Housing
47.5% - - 54.7% 33 30 % Rent-Regulated/Other subsidized
75 179 43 159 40 35 Certificates of Occupancy
100 123 265 - 48 30 Units Authorized by New Residential Building Permits
28.6% - - 30.1% 29 26 Homeownership Rate
142.1 178.0 216.0 - 20 121 Index of Housing Price Appreciation (2-4 family building)
31.2 29.2 31.9 - 51 53 Home Purchase Loans (per 1,000 properties)
6.2% 8.3% 4.4% - 36 38 % Subprime Home Purchase Loans
47.0 80.0 36.7 - 38 39 Refinance Loan Rate (per 1,000 properties)
13.1% 9.4% 14.8% - 36 41 % Subprime Refinance Loans
5.2 4.4 3.2 - 36 45 Notices of Foreclosure (per 1,000 1-4 family properties)
2.4% 1.9% 1.4% - 34 26 % Tax Delinquencies (delinquent ≥ 1 year)
- 1.3% 1.3% 1.4% 47 47 % Vacant Land Area
17 21.9 25.4 - 41 30 Serious Housing Code Violations (per 1,000 rental units)
49.7% 51.9% 52.8% - 18 17 % Students Performing at Grade Level - Reading
49.4% 52.5% 58.3% - 13 14 % Students Performing at Grade Level - Math
16.2 15.2 13.7 - 58 58 Felony Crime Rate (per 1,000 residents)
One of the City’s most populous community districts according to the 2000 US Census, CD 212, which includes Borough Park, Kensington, and Midwood, is also one of the safest in the City. Ranked 58th out of 59 districts, CD 212’s felony crime rate in 2004 was 13.7 per 1,000 residents. CD 212 is also one of the City’s most economically diverse neighborhoods. Despite that attraction, the area’s rental
vacancy rate is 4.4%, placing it among the highest in New York. Elementary school performance in CD 212 increased from 2002 to 2004, with more than 50% of students meeting or exceeding City and state standards. The high student performance and low crime rate may seem remarkable given Borough Park’s high poverty rate.
______________________________________________________________________________________________________________ Numbers in italics are based on a small number of observations and should be treated with caution. 1 Ranked out of 34 community districts with the same predominant housing type (2-4 family buildings).
Rank (2002)
Rank (2004/5)
Population (2000): 185,046 9 -
Racial Diversity Index: 0.53 37 45
Median Household Income: $30,000 33 42
Median Monthly Rent: $850 28 32
Median Price/Unit (2-4 fam.): $275,000 17 12
Income Diversity Ratio: 7.4 34 3
61 | TH
E FURM
AN
CEN
TER FOR REA
L ESTATE &
URBA
N PO
LICY

C O N E Y I S L A N D
CD 213
Brooklyn CD 213, which covers neighborhoods such as Coney Island and Brighton Beach, is one of the most economically diverse areas in the City. The area also contains a high proportion of immigrant households, and ranks near the top of the City’s CDs in elementary school performance in both reading and math. At 12.3%, a relatively high percentage of land is vacant, and the rate of both home purchase and refinance loans were low in
2002 2003 2004 2005 Rank (2002)
Rank (2004/5)
Median Household Income (in 2004 dollars) $27,365 - - $23,000 46 48
Poverty Rate 21.6% - - 29.6% 18 7
% Immigrant Households 55.9% - - 44.9% 4 11
Rental Vacancy Rate 2.5% - - 1.9% 30 42
Number of Housing Units 48,173 - - 49,998 38 36
% Public Housing 19.7% - - 21.1% 6 7
% Rent-Regulated/Other subsidized 63.4% - - 54.6% 21 31
Certificates of Occupancy 134 108 191 216 31 29
Units Authorized by New Residential Building Permits 176 192 258 - 36 31
Homeownership Rate 32.4% - - 34.8% 21 20
Index of Housing Price Appreciation (2-4 family building) 148.0 172.1 204.6 - 17 171
Home Purchase Loans (per 1,000 properties) 37.0 26.5 37.2 - 45 49
% Subprime Home Purchase Loans 9.9% 8.0% 9.6% - 16 29
Refinance Loan Rate (per 1,000 properties) 39.9 45.3 26.2 - 48 50
% Subprime Refinance Loans 12.4% 14.7% 25.0% - 37 30
Notices of Foreclosure (per 1,000 1-4 family properties) 8.5 7.7 8.3 - 31 30
% Tax Delinquencies (delinquent ≥ 1 year) 3.1% 1.9% 1.4% - 26 26
% Vacant Land Area - 12.5% 11.5% 12.3% 6 4
Serious Housing Code Violations (per 1,000 rental units) 13.2 15.7 11.7 - 43 49
% Students Performing at Grade Level - Reading 53.8% 54.8% 56.2% - 10 10
% Students Performing at Grade Level - Math 53.0% 56.3% 61.0% - 10 10
Felony Crime Rate (per 1,000 residents) 31.0 26.9 24.1 - 27 36
2004 compared to other community districts in the City. A recently released development plan from the Coney Island Development Corporation proposes to develop vacant and underused properties as a mixed use community, both providing affordable housing and reinforcing the area’s character as an entertainment and amusement destination.
_____________________________________________________________________________________________________________ Numbers in italics are based on a small number of observations and should be treated with caution. 1 Ranked out of 34 community districts with the same predominant housing type (2-4 family buildings).
Rank (2002)
Rank (2004/5)
Population (2000): 106,120 44 -
Racial Diversity Index: 0.57 38 39
Median Household Income: $23,000 46 48
Income Diversity Ratio: 7.7 8 2
Median Monthly Rent: $850 44 32
Median Price/Unit (2-4 fam.): $207,500 36 33
62

F L A T B U S H / M I D W O O D
CD 214
2002 2003 2004 2005 Rank (2002)
Rank (2004/5)
$33,878 - - $35,000 37 30 Median Household Income (in 2004 dollars)
21.3% - - 18.3% 20 23 Poverty Rate
44.4% - - 52.8% 12 5 % Immigrant Households
0.9% - - 3.6% 48 17 Rental Vacancy Rate
58,410 - - 58,716 20 20 Number of Housing Units
0.0% - - 0.0% 38 38 % Public Housing
82.1% - - 81.6% 5 7 % Rent-Regulated/Other subsidized
43 16 6 86 51 46 Certificates of Occupancy
69 44 69 - 53 54 Units Authorized by New Residential Building Permits
19.9% - - 21.2% 38 36 Homeownership Rate
144.2 178.3 208.9 - 4 12 Index of Housing Price Appreciation (1 family building)
28.2 31.5 39.2 - 54 45 Home Purchase Loans (per 1,000 properties)
9.1% 7.9% 9.6% - 21 29 % Subprime Home Purchase Loans
41.6 75.5 37.7 - 47 36 Refinance Loan Rate (per 1,000 properties)
18.5% 14.4% 26.9% - 28 27 % Subprime Refinance Loans
9.3 7.0 7.2 - 30 33 Notices of Foreclosure (per 1,000 1-4 family properties)
3.2% 2.0% 1.3% - 25 30 % Tax Delinquencies (delinquent ≥ 1 year)
- 1.3% 1.3% 1.4% 47 47 % Vacant Land Area
58.2 72.4 67.9 - 14 13 Serious Housing Code Violations (per 1,000 rental units)
48.2% 50.4% 49.5% - 20 20 % Students Performing at Grade Level - Reading
44.3% 50.1% 54.2% - 22 20 % Students Performing at Grade Level - Math
29.9 29.4 27.8 - 29 30 Felony Crime Rate (per 1,000 residents)
The rezoning of Brooklyn’s Midwood neighborhood, approved in April 2006, covers an area of roughly 80 blocks and seeks to preserve the existing neighborhood character, though it also allows for higher density residential development on selected streets.
CD 214 has a low percentage of vacant land, at only 1.4%. More than four-fifths of the area’s housing units are rent-regulated or subsidized. Although the home purchase loan rate was relatively low in 2004, subprime loans have nonetheless been on the rise. It is one of the most racially diverse community districts in the City, with one of the highest percentages of immigrant households.
_____________________________________________________________________________________________________________ Numbers in italics are based on a small number of observations and should be treated with caution. 1 Ranked out of 50 community districts with sufficient single family home sales. 2 Ranked out of 13 community districts with the same predominant housing type (single family homes).
Rank (2002)
Population (2000): 168,806 13
Racial Diversity Index: 0.92 6
Median Household Income: $35,000 37
Median Monthly Rent: $850 32
Median Price/Unit (2-4 fam.): $250,000 24
Median Price/Unit (1 fam.): $659,850 12
Rank (2004/5)
-
5
30
32
22
71
Income Diversity Ratio: 5.3 18 31
63 | TH
E FURM
AN
CEN
TER FOR REA
L ESTATE &
URBA
N PO
LICY

S H E E P S H E A D B A Y
CD 215
Brooklyn CD 215, which includes Sheepshead Bay and Homecrest, is the subject of two recent rezonings. In Sheepshead Bay, parts of eight blocks as well as the Special Sheepshead Bay District have been rezoned to limit development. In addition, 70 blocks in Homecrest were rezoned to restrict overall development while permitting taller buildings on certain wide streets.
2002 2003 2004 2005 Rank (2002)
Rank (2004/5)
Median Household Income (in 2004 dollars) $43,784 - - $40,000 24 24
Poverty Rate 16.4% - - 17.2% 28 25
% Immigrant Households 43.0% - - 39.9% 15 18
Rental Vacancy Rate 1.2% - - 2.0% 45 39
Number of Housing Units 61,460 - - 64,886 17 16
% Public Housing 4.2% - - 7.6% 28 26
% Rent-Regulated/Other subsidized 59.5% - - 57.5% 25 24
Certificates of Occupancy 100 50 60 255 38 23
Units Authorized by New Residential Building Permits 111 320 212 - 43 35
Homeownership Rate 42.7% - - 42.0% 14 16
Index of Housing Price Appreciation (2-4 family building) 140.7 180.0 203.6 - 23 181
Home Purchase Loans (per 1,000 properties) 34.5 42.3 47.8 - 49 37
% Subprime Home Purchase Loans 6.8% 6.8% 5.5% - 34 35
Refinance Loan Rate (per 1,000 properties) 43.7 72.0 34.0 - 42 42
% Subprime Refinance Loans 11.9% 10.4% 16.8% - 39 38
Notices of Foreclosure (per 1,000 1-4 family properties) 4.7 4.8 4.3 - 39 39
% Tax Delinquencies (delinquent ≥ 1 year) 1.7% 1.1% 0.8% - 41 44
% Vacant Land Area - 6.4% 6.5% 6.6% 12 12
Serious Housing Code Violations (per 1,000 rental units) 10.0 11.7 14.6 - 49 45
% Students Performing at Grade Level - Reading 51.8% 53.8% 53.5% - 14 16
% Students Performing at Grade Level - Math 49.3% 54.4% 58.6% - 14 13
Felony Crime Rate (per 1,000 residents) 24.4 24.7 23.0 - 43 37
CD 215 had relatively low rates of tax delinquencies and serious housing code violations in 2004, and its rental vacancy rate was only 2.0% in 2005. Sheepshead Bay is one of the City’s most diverse neighborhoods with regard to income, but is one of the least diverse with regards to race. Nonetheless, almost 40% of households in CD 215 in 2005 were foreign-born.
________________________________________________________________________________________________________________ Numbers in italics are based on a small number of observations and should be treated with caution. 1 Ranked out of 34 community districts with the same predominant housing type (2-4 family buildings).
Rank (2002)
Rank (2004/5)
Population (2000): 160,319 21 -
Racial Diversity Index: 0.47 51 50
Median Household Income: $40,000 24 24
Median Monthly Rent: $900 22 21
Median Price/Unit (2-4 fam.): $265,000 16 14
Income Diversity Ratio: 6.7 5 7
64

B R O W N S V I L L E
CD 216
2002 2003 2004 2005 Rank (2002)
Rank (2004/5)
$29,554 - - $22,338 43 50 Median Household Income (in 2004 dollars)
28.6% - - 31.6% 10 6 Poverty Rate
36.6% - - 34.1% 30 28 % Immigrant Households
0.1% - - 4.6% 52 6 Rental Vacancy Rate
43,169 - - 43,501 50 50 Number of Housing Units
28.3% - - 26.2% 3 2 % Public Housing
36.8% - - 43.0% 45 40 % Rent-Regulated/Other subsidized
45 315 128 292 49 20 Certificates of Occupancy
291 309 227 - 22 34 Units Authorized by New Residential Building Permits
19.3% - - 19.1% 39 41 Homeownership Rate
152.9 188.1 211.3 - 14 131 Index of Housing Price Appreciation (2-4 family building)
85.2 77.6 96.0 - 4 4 Home Purchase Loans (per 1,000 properties)
10.9% 19.3% 37.2% - 11 5 % Subprime Home Purchase Loans
76.5 116.6 121.4 - 20 5 Refinance Loan Rate (per 1,000 properties)
41.6% 44.3% 49.9% - 1 3 % Subprime Refinance Loans
34.6 36.2 37.2 - 5 3 Notices of Foreclosure (per 1,000 1-4 family properties)
7.9% 4.7% 3.7% - 7 9 % Tax Delinquencies (delinquent ≥ 1 year)
- 9.9% 9.3% 9.3% 7 6 % Vacant Land Area
82.4 81.4 84.2 - 9 10 Serious Housing Code Violations (per 1,000 rental units)
28.4% 30.3% 31.2% - 51 47 % Students Performing at Grade Level - Reading
23.1% 32.1% 37.7% - 51 49 % Students Performing at Grade Level - Math
42.6 39.7 39.3 - 10 11 Felony Crime Rate (per 1,000 residents)
The Brownsville/Ocean Hill area, which had one of the lowest populations in New York City in 2000, was among the City’s poorest neighborhoods in 2005. It was near the top in many home lending categories in 2004. Home purchase and refinance loans were prevalent, and the rate of subprime loans was also extremely high. Although the crime rate and education performance have both improved since 2002, and math scores increased at the 2nd highest
rate citywide in the last two years (in percentage points), Brownsville/Ocean Hill remains at the lower end citywide for these two important indicators. Housing prices continued to rise in recent years, and the percent of tax delinquencies lasting more than one year fell to 3.7% in 2004. CD 216 has among the City’s highest poverty rates and ranks 2nd citywide in the percent of housing units that are public housing.
_______________________________________________________________________________________________________________ Numbers in italics are based on a small number of observations and should be treated with caution. 1 Ranked out of 34 community districts with the same predominant housing type (2-4 family buildings).
Rank (2002)
Rank (2004/5)
Population (2000): 85,343 53 -
Racial Diversity Index: 0.47 49 50
Median Household Income: $22,338 43 50
Median Monthly Rent: $790 49 44
Median Price/Unit (2-4 fam.): $172,115 54 45
Income Diversity Ratio: 7.4 16 3
65 | TH
E FURM
AN
CEN
TER FOR REA
L ESTATE &
URBA
N PO
LICY

E A S T F L A T B U S H
CD 217
At 60.6%, CD 217 has one of the highest percentages of immigrant households in New York City. The area, which encompasses Flatbush, Rugby, Farragut and other neighborhoods, is one of the City’s least racially and economically diverse neighborhoods, however. The CD has relatively few serious housing code violations. Home purchase loans rose dramatically since 2002, and the
2002 2003 2004 2005 Rank (2002)
Rank (2004/5)
Median Household Income (in 2004 dollars) $40,062 - - $40,000 29 24
Poverty Rate 14.9% - - 15.9% 29 31
% Immigrant Households 60.9% - - 60.6% 1 3
Rental Vacancy Rate 3.7% - - 3.4% 18 18
Number of Housing Units 52,101 - - 51,196 27 33
% Public Housing 0.0% - - 0.0% 38 38
% Rent-Regulated/Other subsidized 57.0% - - 50.5% 28 34
Certificates of Occupancy 40 13 17 44 53 52
Units Authorized by New Residential Building Permits 37 117 48 - 58 57
Homeownership Rate 31.2% - - 31.3% 24 23
Index of Housing Price Appreciation (2-4 family building) 128.6 141.5 165.0 - 32 321
Home Purchase Loans (per 1,000 properties) 38.7 43.7 61.2 - 44 25
% Subprime Home Purchase Loans 11.1% 23.8% 37.1% - 10 6
Refinance Loan Rate (per 1,000 properties) 93.8 151.7 130.3 - 11 2
% Subprime Refinance Loans 33.9% 38.8% 49.5% - 8 6
Notices of Foreclosure (per 1,000 1-4 family properties) 25.1 25.4 23.3 - 16 16
% Tax Delinquencies (delinquent ≥ 1 year) 4.6% 2.7% 2.0% - 18 21
% Vacant Land Area - 2.0% 1.9% 1.8% 39 39
Serious Housing Code Violations (per 1,000 rental units) 78.1 86.4 62.0 - 10 16
% Students Performing at Grade Level - Reading 39.1% 40.9% 39.9% - 33 34
% Students Performing at Grade Level - Math 32.3% 38.9% 43.3% - 36 36
Felony Crime Rate (per 1,000 residents) 28.0 25.7 24.5 - 32 33
percent of those loans that are subprime increased even more sharply. The number of new certificates of occupancy and units authorized by new residential building permits have been consistently low, suggesting little new development.
_____________________________________________________________________________________________________________ Numbers in italics are based on a small number of observations and should be treated with caution. 1 Ranked out of 34 community districts with same predominant housing type (2-4 family buildings).
Rank (2002)
Rank (2004/5)
Population (2000): 165,753 17 -
Racial Diversity Index: 0.28 55 54
Median Household Income: $40,000 29 24
Median Monthly Rent: $800 32 38
Median Price/Unit (2-4 fam.): $162,225 49 48
Income Diversity Ratio: 4.4 46 47
66

F L A T L AN D S / C A N A R S I E
CD 218
2002 2003 2004 2005 Rank (2002)
Rank (2004/5)
$51,446 - - $58,000 12 8 Median Household Income (in 2004 dollars)
14.5% - - 11.2% 31 37 Poverty Rate
41.4% - - 37.8% 19 21 % Immigrant Households
1.6% - - 2.1% 42 37 Rental Vacancy Rate
67,017 - - 66,211 12 14 Number of Housing Units
18.8% - - 17.5% 8 10 % Public Housing
16.4% - - 12.0% 53 54 % Rent-Regulated/Other subsidized
307 91 208 218 17 28 Certificates of Occupancy
276 231 179 - 25 41 Units Authorized by New Residential Building Permits
57.2% - - 60.8% 9 7 Homeownership Rate
129.2 144.5 167.2 - 31 311 Index of Housing Price Appreciation (2-4 family building)
50.4 55.4 71.9 - 29 13 Home Purchase Loans (per 1,000 properties)
11.3% 15.5% 23.7% - 9 19 % Subprime Home Purchase Loans
101.4 162.3 107.4 - 7 8 Refinance Loan Rate (per 1,000 properties)
22.2% 25.1% 40.8% - 20 18 % Subprime Refinance Loans
16.0 16.6 15.0 - 21 23 Notices of Foreclosure (per 1,000 1-4 family properties)
2.3% 1.2% 0.9% - 36 40 % Tax Delinquencies (delinquent ≥ 1 year)
- 4.2% 4.2% 4.8% 27 21 % Vacant Land Area
22.3 14.2 17.6 - 34 40 Serious Housing Code Violations (per 1,000 rental units)
45.5% 47.9% 46.8% - 25 34 % Students Performing at Grade Level - Reading
40.2% 46.8% 51.5% - 26 27 % Students Performing at Grade Level - Math
27.9 26.7 26.1 - 33 32 Felony Crime Rate (per 1,000 residents)
CD 218 includes the neighborhoods of Canarsie, Flatlands, and Bergen Beach. With a median household income of $58,000 in 2005, CD 218 has the 8th highest median income, which increased by the 2nd highest dollar amount in New York City. Only 12.0% of rental units are rent-regulated or subsidized (not including public housing), the 2nd lowest proportion in the City. Also, the rental vacancy
rate is quite low. The homeownership rate in Flatlands/Canarsie is among the highest citywide, and has increased by the 2nd most percentage points of all CDs. Refinance loans, at 107.4 per 1,000 properties, were high in 2004. On other neighborhood indicators such as education, crime, and poverty, CD 218 falls in the middle of the spectrum for New York City neighborhoods.
_______________________________________________________________________________________________________________ Numbers in italics are based on a small number of observations and should be treated with caution. 1 Ranked out of 34 community districts with the same predominant housing type (2-4 family buildings).
Rank (2002)
Rank (2004/5)
Population (2000): 194,653 17 -
Racial Diversity Index: 0.81 19 19
Median Household Income: $58,000 12 8
Median Monthly Rent: $918 8 20
Median Price/Unit (2-4 Fam.): $212,500 27 30
Income Diversity Ratio: 5.1 22 38
67 | TH
E FURM
AN
CEN
TER FOR REA
L ESTATE &
URBA
N PO
LICY


M A N H A T T A N
Financial District 301 72
Greenwich Village/Soho 302 73
Lower East Side/Chinatown 303 74
Clinton/Chelsea 304 75
Midtown 305 76
Stuyvesant Town/Turtle Bay 306 77
Upper West Side 307 78
Upper East Side 308 79
Morningside Heights/Hamilton 309 80
Central Harlem 310 81
East Harlem 311 82
Washington Heights/Inwood 312 83
CD Page
69 | TH
E FURM
AN
CEN
TER FOR REA
L ESTATE &
URBA
N PO
LICY

M A N H A T T A N
Manhattan’s neighborhoods have seen continued growth in the past few years, with steady increases in population. Still, the borough continues to typify many of New York City’s sharpest contrasts in housing and neighborhood conditions. Manhattan contains the two wealthiest sub-borough areas in the City – Stuyvesant Town/Turtle Bay and Greenwich Village/Financial District – as well as the 8th poorest, East Harlem.
2002 2003 2004 2005 (2002) (2004/5)
Housing Stock and Land Use
Number of Housing Units 798,859 - - 815,265 3 3
Rental Vacancy Rate 3.9% - - 3.8% 1 2
% Public Housing 9.6% - - 9.0% 2 3
% Rent-Regulated/Other subsidized 73.2% - - 67.6% 1 2
Certificates of Occupancy 7,863 4,965 6,111 4,825 1 1
Units Authorized by New Residential Building Permits 5,618 4,629 4,742 - 1 3
Homeownership Rate 22.6% - - 23.6% 4 4
% Vacant Land Area - 2.4% 2.4% 2.3% 5 5
Housing Quality
Serious Housing Code Violations (per 1,000 rentals) 24.6 31.8 28.5 - 3 3
% Tax Delinquencies (delinquent ≥ 1 year) 4.8% 3.1% 2.2% - 1 1
Severe Crowding - All renter households 3.1% - - 2.6% 5 5
Severe Crowding - Unsubsidized low income renters 4.7% - - 3.1% 4 5
________________________________________________________________________________________________________________ 1 The median condominium price in Manhattan dropped in 2003 due to the conversion of approximately 800 units sold at below-market prices in Ruppert
Yorkville Towers, a former Mitchell Lama development in the Upper East Side. Excluding these units would result in a Manhattan median condominium price of $580,046 in 2003.
2 Notice of foreclosure data is unavailable for Staten Island, therefore the ranking for this indicator only ranges from 1 to 4 in both 2002 and 2004.
Housing Prices and Affordability
Index of Housing Price Appreciation (condominium) 200.6 205.7 243.0 - 1 2
Median Monthly Rent (unsubsidized units, 2005 dollars) $1,027 - - $1,186 1 1
Median Price Per Unit (2-4 fam. bldg., 2004 dollars) $192,505 $261,363 $432,917 - 1 1
Median Price Per Unit (condominium, 2004 dollars) $609,016 $489,8781 $695,000 - 1 1
Median Rent Burden - All renter households 27.5% - - 29.1% 4 4
Median Rent Burden - Unsubsidized low income renters 50.0% - - 53.3% 1 1
Rank (2002)
Population: 1,593,200 3
Racial Diversity Index: 0.78 4
Median Household Income: $50,000 2
Median Monthly Rent: $1,186 1
Median Price/Unit (2-4 fam.): $432,917 1
Median Price/Unit (condo.): $695,000 1
Rank (2004/5)
3
4
2
1
1
1
Income Diversity Ratio: 7.8 1 1
Rank Rank
70

Overall, Manhattan is the City’s most economically diverse borough and is home to the community district with the highest income diversity ratio, the Lower East Side/Chinatown. Renters in Manhattan pay more for housing than those in other parts of the City, but they also have access to the second-largest stock of rent-regulated units in the City. Prices to purchase an apartment in Manhattan have been on an upward trend for many years. Despite the elevated cost of apartments, median rent burdens and levels of severe crowding are not as high as those in other boroughs, likely because of Manhattan’s greater number of affluent renters and rent-regulated units. That said, rent burdens for unsubsidized low-income renters are the highest in the City, and the share of the borough’s rental stock that is rent-regulated appears to be falling. Housing construction activity has not risen as quickly in recent years in Manhattan as it has in other boroughs. In 2002, 30% of the City’s total number of housing units authorized by new residential building permits were located in Manhattan. By 2004, Manhattan’s share of housing units authorized by new building permits fell to 24%, and the borough slipped from the top-ranked borough for new permits to 3rd in this category.
Manhattan continues to have the lowest proportion of vacant land area in the City. The mortgage lending market remains strong in Manhattan. The borough’s rate of home purchase loan originations has declined somewhat from 2002, but this rate remains the 2nd highest in the City. Loan approval rates of 84.4% topped the citywide rankings. Manhattan has the lowest rate of subprime lending in the City by a significant margin, with subprime loans representing only 0.6% of home purchase loans and 3% of refinance loans in 2004. Large-scale development projects and proposals are numerous in Manhattan, foremost among them is the lower Manhattan redevelopment effort. Other proposals, such as the extension of the number 7 subway line and the redevelopment of the East River waterfront, are currently awaiting further approval. Although Manhattan has not seen as many rezonings as the other boroughs, several rezonings have taken place or are underway in such downtown neighborhoods as the West Village and Tribeca.
Lending Indicators
Home Purchase Loans (per 1,000 properties) 67.4 56.5 60.5 - 2 2
% Subprime Home Purchase Loans 1.3% 1.8% 0.6% - 5 5
Home Purchase Loan Approval Rate 87.9% 86.1% 84.4% - 1 1
Refinance Loan Rate (per 1,000 properties) 83.8 99.3 32.6 - 2 5
% Subprime Refinance Loans 1.7% 1.6% 3.0% - 5 5
Notices of Foreclosure (per 1,000 1-4 family properties) 12.1 13.2 10.4 - 3 42
Social, Demographic, and Income Indicators
Population 1,565,190 1,578,386 1,590,911 1,593,200 3 3
Racial Diversity Index 0.79 - - 0.78 4 4
% Immigrant Households 20.3% - - 18.2% 4 4
% Asian (inc. Hawaiian and Pacific Islander) Households 7.6% - - 8.2% 2 2
% Black (including Hispanic) Households 13.9% - - 13.2% 4 4
% Hispanic (non-Black) Households 19.3% - - 18.1% 3 3
% White (non-Hispanic) Households 59.0% - - 60.2% 2 2
% Native American Households 0.1% - - 0.4% 4 1
Median Household Income (in 2004 dollars) $52,979 - - $50,000 2 2
Income Diversity Ratio 9.7 - - 7.8 1 1
Poverty Rate 16.2% - - 14.6% 3 3
Unemployment Rate 7.6% - - - 3 -
% Students Performing at Grade Level - Reading 40.7% 40.5% 40.6% - 3 4
% Students Performing at Grade Level - Math 36.4% 41.8% 47.4% - 4 3
Felony Crime Rate (per 1,000 residents) 44.6 42.2 41.3 - 1 1
2002 2003 2004 2005 (2002) (2004/5) Rank Rank
71 | TH
E FURM
AN
CEN
TER FOR REA
L ESTATE &
URBA
N PO
LICY

CD 309
CD 301
Since the events of September 11, 2001, the government has attempted to revitalize the area through several economic incentives and targeted development. Much of this activity is channeled through the Lower Manhattan Development Corporation (LMDC), created by Governor Pataki and then-Mayor Giuliani. In addition to economic development, LMDC is in charge of building the memorial at the World Trade Center site.
2002 2003 2004 2005 Rank (2002)
Rank (2004/5)
Median Household Income (in 2004 dollars) $84,284 - - $75,000 2 2
Poverty Rate 9.5% - - 7.9% 49 53
% Immigrant Households 10.9% - - 7.5% 55 55
Rental Vacancy Rate 4.1% - - 6.3% 13 2
Number of Housing Units 72,726 - - 73,530 10 9
% Public Housing 0.0% - - 0.0% 38 38
% Rent-Regulated/Other subsidized 69.3% - - 57.3% 17 25
Certificates of Occupancy 452 629 759 955 10 1
Units Authorized by New Residential Building Permits 321 696 525 - 20 11
Homeownership Rate 28.1% - - 30.3% 30 24
Index of Housing Price Appreciation (condominium) 186.9 197.1 238.2 - 5 34
Home Purchase Loans (per 1,000 properties) 93.3 62.1 78.0 - 2 7
% Subprime Home Purchase Loans 1.5% 1.8% 0.6% - 49 50
Refinance Loan Rate (per 1,000 properties) 111.8 122.7 43.1 - 4 30
% Subprime Refinance Loans 1.5% 1.4% 2.1% - 52 50
Notices of Foreclosure (per 1,000 1-4 family properties) 20.0 0.0 0.0 - 19 53
% Tax Delinquencies (delinquent ≥ 1 year) 0.0% 4.5% 0.0% - 58 58
% Vacant Land Area - 0.7% 0.5% 0.7% 54 55
Serious Housing Code Violations (per 1,000 rental units) 4.9 1.5 2.1 - 57 59
% Students Performing at Grade Level - Reading 67.9% 67.6% 69.2% - 2 2
% Students Performing at Grade Level - Math 63.1% 68.9% 74.0% - 2 2
Felony Crime Rate (per 1,000 residents) 106.4 101.6 96.9 - 3 3
In the Financial District, real median income has fallen by the 4th highest dollar amount in the City, but poverty rates also have declined. CD 301 has the lowest rate of serious housing code violations in the City. It also has the highest median monthly rent, which increased since 2002 by the highest dollar amount in the City. In 2005, CD 301 had the 2nd highest rental vacancy rate in the City.
______________________________________________________________________________________________________________ Numbers in italics are based on a small number of observations and should be treated with caution. 1 Community districts 301 and 302 both fall within sub-borough area 301. Data at the sub-borough area level for these two CDs will be identical. 2 Ranked out of 44 community districts with sufficient condominium sales. 3 Ranked out of 47 community districts with sufficient condominium sales. 4 Ranked out of 7 community districts with the same predominant housing type (condominiums).
Rank (2002)
Population (2000): 34,420 59
Racial Diversity Index: 0.38 52
Income Diversity Ratio: 5.2 7
Median Monthly Rent: $1,640 2
Median Price/Unit (2-4 fam.): N/A -
Median Price/Unit (condo.): $720,412 92
Rank (2004/5)
-
52
33
1
-
53
Median Household Income: $75,000 2 2
F I N A N C I A L D I S T R I C T1
72
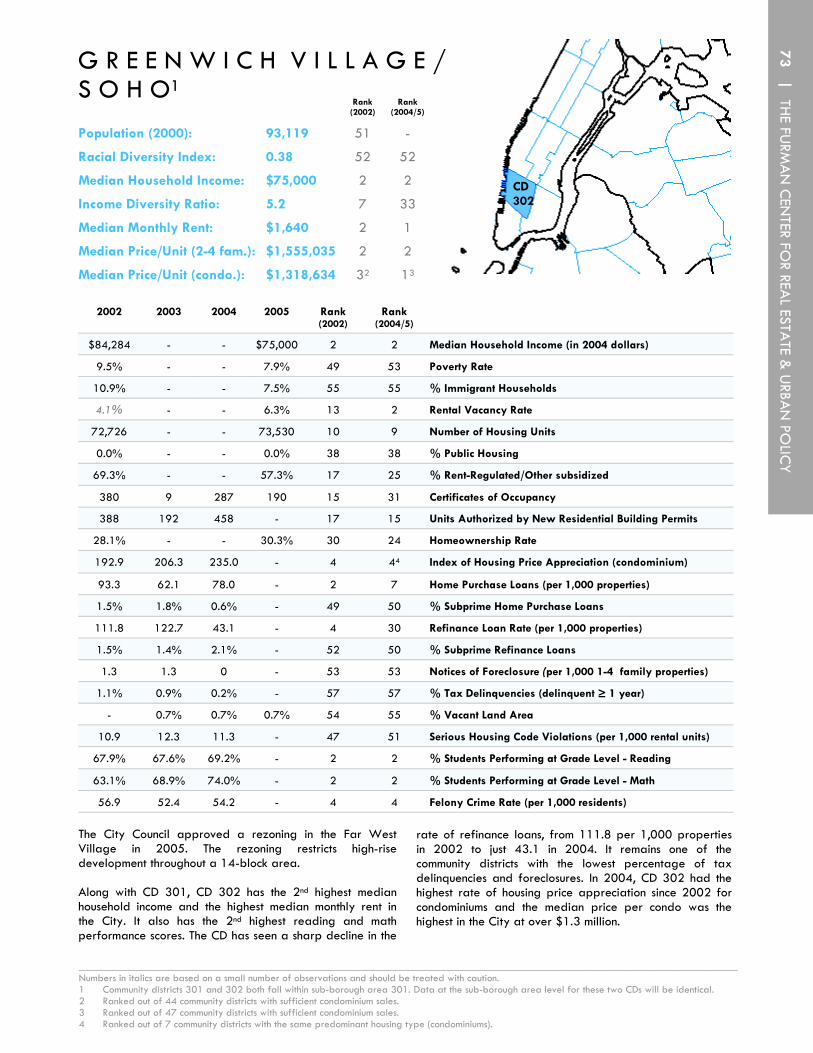
CD 302
2002 2003 2004 2005 Rank (2002)
Rank (2004/5)
$84,284 - - $75,000 2 2 Median Household Income (in 2004 dollars)
9.5% - - 7.9% 49 53 Poverty Rate
10.9% - - 7.5% 55 55 % Immigrant Households
4.1% - - 6.3% 13 2 Rental Vacancy Rate
72,726 - - 73,530 10 9 Number of Housing Units
0.0% - - 0.0% 38 38 % Public Housing
69.3% - - 57.3% 17 25 % Rent-Regulated/Other subsidized
380 9 287 190 15 31 Certificates of Occupancy
388 192 458 - 17 15 Units Authorized by New Residential Building Permits
28.1% - - 30.3% 30 24 Homeownership Rate
192.9 206.3 235.0 - 4 44 Index of Housing Price Appreciation (condominium)
93.3 62.1 78.0 - 2 7 Home Purchase Loans (per 1,000 properties)
1.5% 1.8% 0.6% - 49 50 % Subprime Home Purchase Loans
111.8 122.7 43.1 - 4 30 Refinance Loan Rate (per 1,000 properties)
1.5% 1.4% 2.1% - 52 50 % Subprime Refinance Loans
1.3 1.3 0 - 53 53 Notices of Foreclosure (per 1,000 1-4 family properties)
1.1% 0.9% 0.2% - 57 57 % Tax Delinquencies (delinquent ≥ 1 year)
- 0.7% 0.7% 0.7% 54 55 % Vacant Land Area
10.9 12.3 11.3 - 47 51 Serious Housing Code Violations (per 1,000 rental units)
67.9% 67.6% 69.2% - 2 2 % Students Performing at Grade Level - Reading
63.1% 68.9% 74.0% - 2 2 % Students Performing at Grade Level - Math
56.9 52.4 54.2 - 4 4 Felony Crime Rate (per 1,000 residents)
The City Council approved a rezoning in the Far West Village in 2005. The rezoning restricts high-rise development throughout a 14-block area. Along with CD 301, CD 302 has the 2nd highest median household income and the highest median monthly rent in the City. It also has the 2nd highest reading and math performance scores. The CD has seen a sharp decline in the
rate of refinance loans, from 111.8 per 1,000 properties in 2002 to just 43.1 in 2004. It remains one of the community districts with the lowest percentage of tax delinquencies and foreclosures. In 2004, CD 302 had the highest rate of housing price appreciation since 2002 for condominiums and the median price per condo was the highest in the City at over $1.3 million.
______________________________________________________________________________________________________________ Numbers in italics are based on a small number of observations and should be treated with caution. 1 Community districts 301 and 302 both fall within sub-borough area 301. Data at the sub-borough area level for these two CDs will be identical. 2 Ranked out of 44 community districts with sufficient condominium sales. 3 Ranked out of 47 community districts with sufficient condominium sales. 4 Ranked out of 7 community districts with the same predominant housing type (condominiums).
Rank (2002)
Rank (2004/5)
Population (2000): 93,119 51 -
Racial Diversity Index: 0.38 52 52
Median Household Income: $75,000 2 2
Median Monthly Rent: $1,640 2 1
Median Price/Unit (2-4 fam.): $1,555,035 2 2
Median Price/Unit (condo.): $1,318,634 32 13
Income Diversity Ratio: 5.2 7 33
G R E E N W I C H V I L L A G E / S O H O1
73 | TH
E FURM
AN
CEN
TER FOR REA
L ESTATE &
URBA
N PO
LICY

_____________________________________________________________________________________________________________ Numbers in italics are based on a small number of observations and should be treated with caution. 1 Community district 303 matches sub-borough area 302. 2 Ranked out of 47 community districts with sufficient sales of buildings with five or more units. 3 Ranked out of 45 community districts with sufficient sales of buildings with five or more units.
CD 303
2002 2003 2004 2005 Rank (2002)
Rank (2004/5)
Median Household Income (in 2004 dollars) $32,838 - - $33,000 38 36
Poverty Rate 25.7% - - 24.5% 12 15
% Immigrant Households 29.4% - - 21.1% 36 43
Rental Vacancy Rate 2.1% - - 2.0% 35 39
Number of Housing Units 74,735 - - 77,366 7 7
% Public Housing 28.2% - - 25.4% 4 4
% Rent-Regulated/Other subsidized 66.3% - - 58.0% 19 23
Certificates of Occupancy 710 356 177 538 5 9
Units Authorized by New Residential Building Permits 216 630 395 - 32 18
Homeownership Rate 16.2% - - 17.4% 44 43
Index of Housing Price Appreciation (5+ family building) 197.1 249.4 266.6 - 5 54
Home Purchase Loans (per 1,000 properties) 47.1 37.8 34.9 - 33 51
% Subprime Home Purchase Loans 0.8% 1.1% 0.0% - 54 55
Refinance Loan Rate (per 1,000 properties) 35.4 49.1 20.6 - 52 54
% Subprime Refinance Loans 3.2% 2.5% 1.7% - 50 52
Notices of Foreclosure (per 1,000 1-4 family properties) 0.0 0.0 0.0 - 54 53
% Tax Delinquencies (delinquent ≥ 1 year) 1.3% 2.2% 0.9% - 51 40
% Vacant Land Area - 1.4% 1.1% 1.3% 45 49
Serious Housing Code Violations (per 1,000 rental units) 7.2 16.8 19.3 - 53 38
% Students Performing at Grade Level - Reading 44.0% 44.7% 45.7% - 28 28
% Students Performing at Grade Level - Math 41.0% 50.0% 54.7% - 26 19
Felony Crime Rate (per 1,000 residents) 38.5 37.6 37.4 - 13 13
In 2003, the Mayor's Office of Lower Manhattan Development, the Department of City Planning, and the New York City Economic Development Corporation, began the East River Waterfront project, which aims to link the Financial District, the South Street Seaport, Chinatown and the Lower East Side with green space.
25.4% of the housing stock in CD 303 is public housing—the 4th highest proportion in the City. The percentage of rent-regulated units decreased by 8 percentage points between 2002 and 2005. Residents of Chinatown and the Lower East Side have a wide range of income levels: in 2005 the area had the highest income diversity ratio in the City. Additionally, math scores have increased since 2002 by the 4th highest number of percentage points in the City.
Rank (2002)
Rank (2004/5)
Population (2000): 164,407 18 -
Racial Diversity Index: 0.90 6 7
Median Household Income: $33,000 38 36
Median Monthly Rent: $1,056 8 8
Median Price/Unit (2-4 fam.): $733,333 N/A 5
Median Price/Unit (5+ fam.): $154,167 82 63
Income Diversity Ratio: 8.3 2 1
L O W E R E A S T S I D E / C H I N A T O W N1
74

2002 2003 2004 2005 Rank (2002)
Rank (2004/5)
$54,730 - - $54,752 9 10 Median Household Income (in 2004 dollars)
10.9% - - 9.9% 45 43 Poverty Rate
15.7% - - 14.3% 50 51 % Immigrant Households
6.3% - - 1.2% 1 51 Rental Vacancy Rate
76,626 - - 81,627 6 5 Number of Housing Units
4.1% - - 3.7% 29 29 % Public Housing
70.6% - - 65.5% 15 16 % Rent-Regulated/Other subsidized
2,344 1,580 693 269 1 22 Certificates of Occupancy
892 1,220 1,158 - 5 1 Units Authorized by New Residential Building Permits
24.5% - - 24.4% 35 33 Homeownership Rate
250.6 273.4 303.2 - 1 14 Index of Housing Price Appreciation (condominium)
93.6 70.2 65.6 - 1 21 Home Purchase Loans (per 1,000 properties)
1.6% 2.3% 0.5% - 48 51 % Subprime Home Purchase Loans
108.7 103.6 34.9 - 5 40 Refinance Loan Rate (per 1,000 properties)
1.2% 1.6% 1.0% - 53 54 % Subprime Refinance Loans
0.0 0.0 3.9 - 54 43 Notices of Foreclosure (per 1,000 1-4 family properties)
2.0% 1.6% 1.2% - 39 35 % Tax Delinquencies (delinquent ≥ 1 year)
- 2.4% 2.3% 2.4% 33 33 % Vacant Land Area
7.9 10.7 12.0 - 52 47 Serious Housing Code Violations (per 1,000 rental units)
67.8% 67.5% 69.1% - 7 7 % Students Performing at Grade Level - Reading
63.0% 68.8% 74.0% - 7 2 % Students Performing at Grade Level - Math
124.9 119.0 114.8 - 2 2 Felony Crime Rate (per 1,000 residents)
CD 304 is home to many large developments either proposed or underway, including the development of Moynihan Station to replace Penn Station, the movement of Madison Square Garden to 9th Avenue, the expansion of the Javits Center, and the extension of the number 7 subway line. Also, in 2005 the City Council approved rezonings for both Hudson Yards and West Chelsea, which includes the High Line project.
Although crime in CD 304 has declined sharply since 2002, the area still has the 2nd highest crime rate in the City. Clinton/Chelsea is experiencing incredible growth, with the most units authorized by new residential building permits in the City in 2004 and the highest number of certificates of occupancy in 2002. CD 304 has experienced the 2nd highest dollar increase in real median monthly rents citywide since 2002.
CD 202
CD 310
CD 304
______________________________________________________________________________________________________________ Numbers in italics are based on a small number of observations and should be treated with caution. 1 Community districts 304 and 305 both fall within sub-borough area 303. Data at the sub-borough area level for these two CDs will be identical. 2 Ranked out of 44 community districts with sufficient condominium sales. 3 Ranked out of 47 community districts with sufficient condominium sales. 4 Ranked out of 7 community districts with the same predominant housing type (condominiums).
Rank (2002)
Rank (2004/5)
Population (2000): 87,479 52 -
Racial Diversity Index: 0.55 40 41
Median Household Income: $54,752 9 10
Median Monthly Rent: $1,475 3 3
Median Price/Unit (2-4 fam.): $728,333 5 6
Median Price/Unit (condo.): $865,000 32 23
Income Diversity Ratio: 7.4 3 3
C L I N T O N / C H E L S E A1
75 | TH
E FURM
AN
CEN
TER FOR REA
L ESTATE &
URBA
N PO
LICY

M I D T O W N1
CD 305
CD 305 is the site of the East Side Access (ESA) project, which will connect the Long Island Rail Road's (LIRR) Main and Port Washington lines in Queens to a new LIRR terminal beneath Grand Central Station in Manhattan. When completed in 2012, the ESA project will be the largest construction project ever undertaken by the Metropolitan Transit Authority.
2002 2003 2004 2005 Rank (2002)
Rank (2004/5)
Median Household Income (in 2004 dollars) $54,730 - - $54,752 9 10
Poverty Rate 10.9% - - 9.9% 45 43
% Immigrant Households 15.7% - - 14.3% 50 51
Rental Vacancy Rate 6.3% - - 1.2% 1 51
Number of Housing Units 76,626 - - 81,627 6 5
% Public Housing 4.1% - - 3.7% 29 29
% Rent-Regulated/Other subsidized 70.6% - - 65.5% 15 16
Certificates of Occupancy 887 384 679 594 3 6
Units Authorized by New Residential Building Permits 1,025 331 334 - 2 25
Homeownership Rate 24.5% - - 24.4% 35 33
Index of Housing Price Appreciation (condominium) 184.0 189.1 220.2 - 7 74
Home Purchase Loans (per 1,000 properties) 93.6 70.2 65.6 - 1 21
% Subprime Home Purchase Loans 1.6% 2.3% 0.5% - 48 51
Refinance Loan Rate (per 1,000 properties) 108.7 103.6 34.9 - 5 40
% Subprime Refinance Loans 1.2% 1.6% 1.0% - 53 54
Notices of Foreclosure (per 1,000 1-4 family properties) 0 0 0 - 54 53
% Tax Delinquencies (delinquent ≥ 1 year) 0.0% 2.8% 0.0% - 58 58
% Vacant Land Area - 0.5% 0.5% 1.0% 56 52
Serious Housing Code Violations (per 1,000 rental units) 7.1 6.2 6.5 - 54 57
% Students Performing at Grade Level - Reading 67.9% 67.6% 69.2% - 2 2
% Students Performing at Grade Level - Math 63.1% 68.9% 74.0% - 2 2
Felony Crime Rate (per 1,000 residents) 226.9 207.8 199.6 - 1 1
Midtown has the highest crime rate in the City, though it also has experienced the largest decrease in crime rate (in raw numbers) since 2002. This high rate is partially because crime rates are calculated using the resident population, not including tourists or workers. Midtown has seen a sharp decrease in units authorized by new residential building permits, and its rental vacancy rate has fallen in recent years.
______________________________________________________________________________________________________________ Numbers in italics are based on a small number of observations and should be treated with caution. 1 Community districts 304 and 305 both fall within sub-borough area 303. Data at the sub-borough area level for these two CDs will be identical. 2 Ranked out of 44 community districts with sufficient condominium sales. 3 Ranked out of 47 community districts with sufficient condominium sales. 4 Ranked out of 7 community districts with the same predominant housing type (condominiums).
Rank (2002)
Rank (2004/5)
Population (2000): 44,028 58 -
Racial Diversity Index: 0.55 40 41
Median Household Income: $54,752 9 10
Median Monthly Rent: $1,475 3 3
Median Price/Unit (2-4 fam.): N/A - -
Median Price/Unit (condo.): $725,000 62 43
Income Diversity Ratio: 7.4 3 3
76
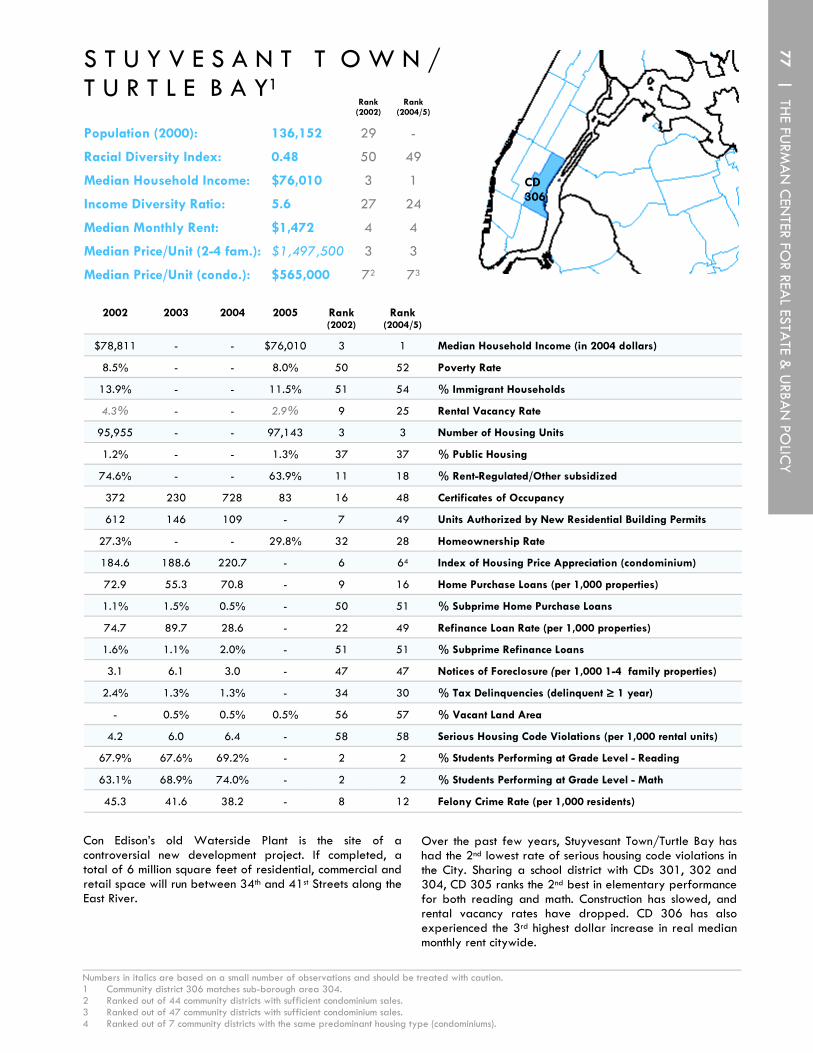
CD 306
2002 2003 2004 2005 Rank (2002)
Rank (2004/5)
$78,811 - - $76,010 3 1 Median Household Income (in 2004 dollars)
8.5% - - 8.0% 50 52 Poverty Rate
13.9% - - 11.5% 51 54 % Immigrant Households
4.3% - - 2.9% 9 25 Rental Vacancy Rate
95,955 - - 97,143 3 3 Number of Housing Units
1.2% - - 1.3% 37 37 % Public Housing
74.6% - - 63.9% 11 18 % Rent-Regulated/Other subsidized
372 230 728 83 16 48 Certificates of Occupancy
612 146 109 - 7 49 Units Authorized by New Residential Building Permits
27.3% - - 29.8% 32 28 Homeownership Rate
184.6 188.6 220.7 - 6 64 Index of Housing Price Appreciation (condominium)
72.9 55.3 70.8 - 9 16 Home Purchase Loans (per 1,000 properties)
1.1% 1.5% 0.5% - 50 51 % Subprime Home Purchase Loans
74.7 89.7 28.6 - 22 49 Refinance Loan Rate (per 1,000 properties)
1.6% 1.1% 2.0% - 51 51 % Subprime Refinance Loans
3.1 6.1 3.0 - 47 47 Notices of Foreclosure (per 1,000 1-4 family properties)
2.4% 1.3% 1.3% - 34 30 % Tax Delinquencies (delinquent ≥ 1 year)
- 0.5% 0.5% 0.5% 56 57 % Vacant Land Area
4.2 6.0 6.4 - 58 58 Serious Housing Code Violations (per 1,000 rental units)
67.9% 67.6% 69.2% - 2 2 % Students Performing at Grade Level - Reading
63.1% 68.9% 74.0% - 2 2 % Students Performing at Grade Level - Math
45.3 41.6 38.2 - 8 12 Felony Crime Rate (per 1,000 residents)
Con Edison’s old Waterside Plant is the site of a controversial new development project. If completed, a total of 6 million square feet of residential, commercial and retail space will run between 34th and 41st Streets along the East River.
Over the past few years, Stuyvesant Town/Turtle Bay has had the 2nd lowest rate of serious housing code violations in the City. Sharing a school district with CDs 301, 302 and 304, CD 305 ranks the 2nd best in elementary performance for both reading and math. Construction has slowed, and rental vacancy rates have dropped. CD 306 has also experienced the 3rd highest dollar increase in real median monthly rent citywide.
______________________________________________________________________________________________________________ Numbers in italics are based on a small number of observations and should be treated with caution. 1 Community district 306 matches sub-borough area 304. 2 Ranked out of 44 community districts with sufficient condominium sales. 3 Ranked out of 47 community districts with sufficient condominium sales. 4 Ranked out of 7 community districts with the same predominant housing type (condominiums).
Rank (2002)
Rank (2004/5)
Population (2000): 136,152 29 -
Racial Diversity Index: 0.48 50 49
Median Household Income: $76,010 3 1
Median Monthly Rent: $1,472 4 4
Median Price/Unit (2-4 fam.): $1,497,500 3 3
Median Price/Unit (condo.): $565,000 72 73
Income Diversity Ratio: 5.6 27 24
S T U Y V E S A N T T O W N / T U R T L E B A Y1
77 | TH
E FURM
AN
CEN
TER FOR REA
L ESTATE &
URBA
N PO
LICY

U P P E R W E S T S I D E1
CD 307
The homeownership rate in CD 307 has increased slightly since 2002, but the rate of home purchase loans dropped to 61.2 per 1,000 properties in 2004. The Upper West Side has a low subprime rate for both home purchase loans and refinance loans. Additionally, CD 307 had a very low rate of foreclosure and tax delinquency in 2004.
2002 2003 2004 2005 Rank (2002)
Rank (2004/5)
Median Household Income (in 2004 dollars) $77,936 - - $70,000 4 4
Poverty Rate 11.9% - - 9.1% 38 45
% Immigrant Households 16.2% - - 14.8% 49 50
Rental Vacancy Rate 4.4% - - 4.3% 8 12
Number of Housing Units 119,679 - - 119,220 2 2
% Public Housing 5.8% - - 7.9% 26 25
% Rent-Regulated/Other subsidized 71.0% - - 69.8% 14 12
Certificates of Occupancy 772 538 597 482 4 11
Units Authorized by New Residential Building Permits 174 315 163 - 37 43
Homeownership Rate 29.1% - - 30.2% 27 25
Index of Housing Price Appreciation (condominium) 220.4 211.9 263.4 - 2 24
Home Purchase Loans (per 1,000 properties) 73.1 66.1 61.2 - 8 25
% Subprime Home Purchase Loans 0.9% 1.6% 0.2% - 53 54
Refinance Loan Rate (per 1,000 properties) 122.2 142.5 40.6 - 2 33
% Subprime Refinance Loans 0.8% 0.6% 0.9% - 54 55
Notices of Foreclosure (per 1,000 1-4 family properties) 3.8 5.8 1.9 - 43 52
% Tax Delinquencies (delinquent ≥ 1 year) 3.1% 1.5% 0.7% - 26 46
% Vacant Land Area - 5.9% 5.7% 7.2% 17 10
Serious Housing Code Violations (per 1,000 rental units) 10.5 12.9 16.3 - 48 42
% Students Performing at Grade Level - Reading 46.5% 44.9% 45.0% - 23 31
% Students Performing at Grade Level - Math 38.4% 44.4% 51.4% - 31 28
Felony Crime Rate (per 1,000 residents) 25.4 24.7 24.3 - 38 35
While school performance in math improved significantly, as it did across the City, CD 307 was one of four neighborhoods in which school performance in reading dropped since 2002. CD 307 has one of the highest median incomes citywide.
_____________________________________________________________________________________________________________ Numbers in italics are based on a small number of observations and should be treated with caution. 1 Community district 307 matches sub-borough area 305. 2 Ranked out of 44 community districts with sufficient condominium sales. 3 Ranked out of 47 community districts with sufficient condominium sales. 4 Ranked out of 7 community districts with the same predominant housing type (condominiums).
Rank (2002)
Rank (2004/5)
Population (2000): 207,699 6 -
Racial Diversity Index: 0.58 38 38
Median Household Income: $70,000 4 4
Median Monthly Rent: $1,200 5 5
Median Price/Unit (2-4 fam.): $1,445,833 4 4
Median Price/Unit (condo.): $770,000 42 33
Income Diversity Ratio: 7.3 6 6
78

U P P E R E A S T S I D E1
CD 308
2002 2003 2004 2005 Rank (2002)
Rank (2004/5)
$87,240 - - $74,700 1 3 Median Household Income (in 2004 dollars)
5.1% - - 6.5% 53 55 Poverty Rate
12.2% - - 11.7% 54 53 % Immigrant Households
4.8% - - 6.0% 6 4 Rental Vacancy Rate
135,015 - - 136,583 1 1 Number of Housing Units
3.6% - - 2.8% 30 31 % Public Housing
72.1% - - 60.1% 13 20 % Rent-Regulated/Other subsidized
673 605 585 752 6 4 Certificates of Occupancy
457 119 1,042 - 13 2 Units Authorized by New Residential Building Permits
33.5% - - 34.9% 19 19 Homeownership Rate
193.6 193.1 225.7 - 3 54 Index of Housing Price Appreciation (condominium)
58.3 58.8 57.3 - 20 28 Home Purchase Loans (per 1,000 properties)
1.0% 1.4% 0.5% - 51 51 % Subprime Home Purchase Loans
77.7 101.7 30.3 - 19 46 Refinance Loan Rate (per 1,000 properties)
0.8% 1.0% 1.3% - 54 53 % Subprime Refinance Loans
4.2 6.7 4.2 - 41 40 Notices of Foreclosure (per 1,000 1-4 family properties)
1.5% 1.0% 1.4% - 46 26 % Tax Delinquencies (delinquent ≥ 1 year)
- 0.2% 0.3% 0.3% 59 59 % Vacant Land Area
6.5 7.1 9.7 - 56 53 Serious Housing Code Violations (per 1,000 rental units)
67.9% 67.6% 69.2% - 2 2 % Students Performing at Grade Level - Reading
63.1% 68.9% 74.0% - 2 2 % Students Performing at Grade Level - Math
25.7 23.6 24.5 - 37 33 Felony Crime Rate (per 1,000 residents)
In November 2005, voters approved the Transportation Bond Act, which will provide funding for the Second Avenue Subway project. Shovels will break ground in 2006 on the new subway line's first phase, which will run down Second Avenue from 96th Street to 63rd Street. Ultimately, the Second Avenue Subway will run north to 125th Street and south to Hanover Square in the Financial District.
CD 308 has the City’s 3rd highest median income but experienced the largest dollar decrease in household income citywide since 2002. At over $2.1 million, the Upper East Side was the most expensive place to purchase a unit in a 2 to 4 family building in 2004. It has one of the lowest rates of poverty, and ranks near the bottom citywide in racial diversity.
_____________________________________________________________________________________________________________ Numbers in italics are based on a small number of observations and should be treated with caution. 1 Community district 308 matches sub-borough area 306. 2 Ranked out of 44 community districts with sufficient condominium sales. 3 Ranked out of 47 community districts with sufficient condominium sales. 4 Ranked out of 7 community districts with the same predominant housing type (condominiums).
Rank (2002)
Rank (2004/5)
Population (2000): 217,063 3 -
Racial Diversity Index: 0.36 52 53
Median Household Income: $74,700 1 3
Median Monthly Rent: $1,600 1 2
Median Price/Unit (2-4 fam.): $2,137,500 1 1
Median Price/Unit (condo): $717,500 52 63
Income Diversity Ratio: 5.2 26 33
79 | TH
E FURM
AN
CEN
TER FOR REA
L ESTATE &
URBA
N PO
LICY

CD 309
Over the next fifteen to twenty years, Columbia University plans to develop about 17 additional acres near its 36-acre campus. The plans have stirred community opposition. CD 309 has seen a rise in its housing prices in recent years, with the appreciation index for 5+ family buildings increasing more than 100% from 2002 to 2004. The community has one of the lowest homeownership rates in the
2002 2003 2004 2005 Rank (2002)
Rank (2004/5)
Median Household Income (in 2004 dollars) $32,838 - - $32,918 38 37
Poverty Rate 25.5% - - 22.4% 14 19
% Immigrant Households 25.0% - - 28.1% 39 35
Rental Vacancy Rate 1.7% - - 4.4% 40 9
Number of Housing Units 53,317 - - 53,178 24 27
% Public Housing 9.3% - - 8.8% 23 22
% Rent-Regulated/Other subsidized 80.3% - - 79.1% 8 9
Certificates of Occupancy 161 13 77 12 26 56
Units Authorized by New Residential Building Permits 170 0 58 - 38 55
Homeownership Rate 11.3% - - 12.5% 48 48
Index of Housing Price Appreciation (5+ family building) 289.6 436.6 582.0 - 3 34
Home Purchase Loans (per 1,000 properties) 35.0 28.2 45.3 - 47 41
% Subprime Home Purchase Loans 3.7% 3.5% 0.9% - 44 48
Refinance Loan Rate (per 1,000 properties) 47.6 67.1 29.0 - 37 47
% Subprime Refinance Loans 5.9% 5.7% 11.7% - 47 46
Notices of Foreclosure (per 1,000 1-4 family properties) 29.8 29.4 25.4 - 11 14
% Tax Delinquencies (delinquent ≥ 1 year) 12.4% 7.2% 4.5% - 2 6
% Vacant Land Area - 1.9% 2.0% 2.7% 41 32
Serious Housing Code Violations (per 1,000 rental units) 69.4 72.8 76.0 - 12 11
% Students Performing at Grade Level - Reading 30.2% 32.9% 30.8% - 46 48
% Students Performing at Grade Level - Math 25.8% 33.5% 38.5% - 46 44
Felony Crime Rate (per 1,000 residents) 29.1 29.4 29.5 - 31 24
City, similar to adjacent neighborhoods in northern Manhattan. The percentage of rent-regulated units has declined somewhat since 2002. Contrary to citywide trends, the crime rate increased in this neighborhood. CD 309, which in 2002 was the most economically diverse district in the City, now ranks 12th.
________________________________________________________________________________________________________________ Numbers in italics are based on a small number of observations and should be treated with caution. 1 Community district 309 matches sub-borough area 307. 2 Ranked out of 47 community districts with sufficient sales of buildings with five or more units. 3 Ranked out of 45 community districts with sufficient sales of buildings with five or more units. 4 Ranked out of 5 community districts with the same predominant housing type (5+ family buildings).
Rank (2002)
Rank (2004/5)
Population (2000): 111,724 39 -
Racial Diversity Index: 0.94 4 4
Median Household Income: $32,918 38 37
Median Monthly Rent: $922 27 19
Median Price/Unit (2-4 fam.): $222,735 31 28
Median Price/Unit (5+ fam.): $82,185 252 193
Income Diversity Ratio: 6.2 1 12
M O R N I N G S I D E H T S. / H A M I L T O N1
80
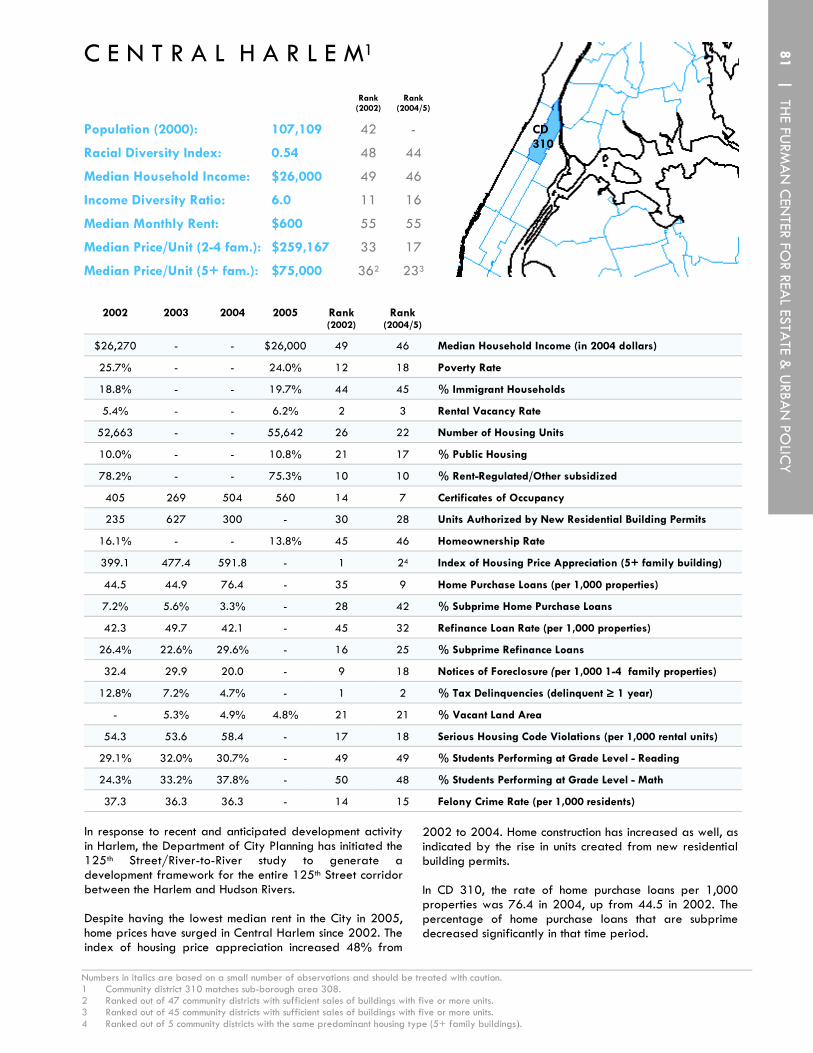
CD 202
CD 310
2002 2003 2004 2005 Rank (2002)
Rank (2004/5)
$26,270 - - $26,000 49 46 Median Household Income (in 2004 dollars)
25.7% - - 24.0% 12 18 Poverty Rate
18.8% - - 19.7% 44 45 % Immigrant Households
5.4% - - 6.2% 2 3 Rental Vacancy Rate
52,663 - - 55,642 26 22 Number of Housing Units
10.0% - - 10.8% 21 17 % Public Housing
78.2% - - 75.3% 10 10 % Rent-Regulated/Other subsidized
405 269 504 560 14 7 Certificates of Occupancy
235 627 300 - 30 28 Units Authorized by New Residential Building Permits
16.1% - - 13.8% 45 46 Homeownership Rate
399.1 477.4 591.8 - 1 24 Index of Housing Price Appreciation (5+ family building)
44.5 44.9 76.4 - 35 9 Home Purchase Loans (per 1,000 properties)
7.2% 5.6% 3.3% - 28 42 % Subprime Home Purchase Loans
42.3 49.7 42.1 - 45 32 Refinance Loan Rate (per 1,000 properties)
26.4% 22.6% 29.6% - 16 25 % Subprime Refinance Loans
32.4 29.9 20.0 - 9 18 Notices of Foreclosure (per 1,000 1-4 family properties)
12.8% 7.2% 4.7% - 1 2 % Tax Delinquencies (delinquent ≥ 1 year)
- 5.3% 4.9% 4.8% 21 21 % Vacant Land Area
54.3 53.6 58.4 - 17 18 Serious Housing Code Violations (per 1,000 rental units)
29.1% 32.0% 30.7% - 49 49 % Students Performing at Grade Level - Reading
24.3% 33.2% 37.8% - 50 48 % Students Performing at Grade Level - Math
37.3 36.3 36.3 - 14 15 Felony Crime Rate (per 1,000 residents)
In response to recent and anticipated development activity in Harlem, the Department of City Planning has initiated the 125th Street/River-to-River study to generate a development framework for the entire 125th Street corridor between the Harlem and Hudson Rivers. Despite having the lowest median rent in the City in 2005, home prices have surged in Central Harlem since 2002. The index of housing price appreciation increased 48% from
2002 to 2004. Home construction has increased as well, as indicated by the rise in units created from new residential building permits. In CD 310, the rate of home purchase loans per 1,000 properties was 76.4 in 2004, up from 44.5 in 2002. The percentage of home purchase loans that are subprime decreased significantly in that time period.
________________________________________________________________________________________________________________ Numbers in italics are based on a small number of observations and should be treated with caution. 1 Community district 310 matches sub-borough area 308. 2 Ranked out of 47 community districts with sufficient sales of buildings with five or more units. 3 Ranked out of 45 community districts with sufficient sales of buildings with five or more units. 4 Ranked out of 5 community districts with the same predominant housing type (5+ family buildings).
Rank (2002)
Rank (2004/5)
Population (2000): 107,109 42 -
Racial Diversity Index: 0.54 48 44
Median Household Income: $26,000 49 46
Median Monthly Rent: $600 55 55
Median Price/Unit (2-4 fam.): $259,167 33 17
Median Price/Unit (5+ fam.): $75,000 362 233
Income Diversity Ratio: 6.0 11 16
C E N T R A L H A R L E M1
81 | TH
E FURM
AN
CEN
TER FOR REA
L ESTATE &
URBA
N PO
LICY

E A S T H A R L E M1
CD 311
2002 2003 2004 2005 Rank (2002)
Rank (2004/5)
Median Household Income (in 2004 dollars) $19,703 - - $23,000 53 48
Poverty Rate 33.5% - - 27.1% 6 11
% Immigrant Households 21.3% - - 19.1% 42 46
Rental Vacancy Rate 4.3% - - 2.9% 9 25
Number of Housing Units 43,972 - - 45,932 49 47
% Public Housing 45.6% - - 38.4% 1 1
% Rent-Regulated/Other subsidized 46.1% - - 50.4% 36 35
Certificates of Occupancy 590 352 1,012 380 8 1
Units Authorized by New Residential Building Permits 1,128 289 200 - 1 38
Homeownership Rate 10.3% - - 8.6% 49 50
Index of Housing Price Appreciation (5+ family building) 361.0 619.9 609.2 - 2 14
Home Purchase Loans (per 1,000 properties) 69.2 32.8 30.4 - 11 54
% Subprime Home Purchase Loans 1.0% 3.4% 2.8% - 51 45
Refinance Loan Rate (per 1,000 properties) 32.0 23.2 11.0 - 54 55
% Subprime Refinance Loans 8.2% 6.6% 10.1% - 45 47
Notices of Foreclosure (per 1,000 1-4 family properties) 6.2 11.2 11.2 - 34 28
% Tax Delinquencies (delinquent ≥ 1 year) 6.5% 4.4% 4.7% - 10 2
% Vacant Land Area - 2.8% 3.0% 3.6% 32 28
Serious Housing Code Violations (per 1,000 rental units) 30.2 46.3 43.5 - 25 23
% Students Performing at Grade Level - Reading 32.5% 34.8% 33.8% - 44 42
% Students Performing at Grade Level - Math 29.3% 37.2% 41.0% - 41 42
Felony Crime Rate (per 1,000 residents) 32.8 33.0 30.4 - 20 21
East Harlem ranks 48th citywide in median household income, with a 2005 median income of $23,000, but it has experienced the 3rd highest dollar increase in real income citywide since 2002. The poverty rate in CD 311 fell to 27.1% in 2005. Housing prices in East Harlem have increased by 69% since 2002. The rate of home purchase loans decreased by more than half, and the rate of
refinance loans dropped sharply as well. Elementary math performance improved considerably between 2002 and 2004, with an increase from 29.3% to 41.0% of students performing at or above their grade level in math. East Harlem is one of the most racially diverse neighborhoods. It also has one of the lowest percentages of immigrant households.
________________________________________________________________________________________________________________ Numbers in italics are based on a small number of observations and should be treated with caution. 1 Community district 311 matches sub-borough area 309. 2 Ranked out of 47 community districts with sufficient sales of buildings with five or more units. 3 Ranked out of 45 community districts with sufficient sales of buildings with five or more units. 4 Ranked out of 5 community districts with the same predominant housing type (5+ family buildings).
Rank (2002)
Rank (2004/5)
Population (2000): 117,743 35 -
Racial Diversity Index: 0.86 19 14
Median Household Income: $23,000 53 48
Median Monthly Rent: $931 32 17
Median Price/Unit (2-4 fam.): $180,324 34 41
Median Price/Unit (5+ fam.): $99,375 432 143
Income Diversity Ratio: 6.2 11 12
82

CD 312
2002 2003 2004 2005 Rank (2002)
Rank (2004/5)
$29,554 - - $30,000 43 42 Median Household Income (in 2004 dollars)
29.3% - - 26.2% 9 12 Poverty Rate
47.8% - - 46.0% 10 10 % Immigrant Households
1.4% - - 1.8% 44 44 Rental Vacancy Rate
74,172 - - 75,044 8 8 Number of Housing Units
3.5% - - 2.5% 31 34 % Public Housing
94.6% - - 94.7% 1 1 % Rent-Regulated/Other subsidized
117 0 13 9 34 5 Certificates of Occupancy
0 64 0 - 59 59 Units Authorized by New Residential Building Permits
7.3% - - 9.5% 53 49 Homeownership Rate
252.0 357.0 422.8 - 4 44 Index of Housing Price Appreciation (5+ family building)
47.1 40.1 41.8 - 33 44 Home Purchase Loans (per 1,000 properties)
0.5% 0.5% 0.7% - 55 49 % Subprime Home Purchase Loans
38.6 64.7 25.9 - 51 51 Refinance Loan Rate (per 1,000 properties)
3.5% 2.5% 3.9% - 49 49 % Subprime Refinance Loans
27.8 34.8 41.8 - 14 2 Notices of Foreclosure (per 1,000 1-4 family properties)
11.2% 7.5% 4.9% - 3 1 % Tax Delinquencies (delinquent ≥ 1 year)
- 4.4% 4.4% 1.6% 24 43 % Vacant Land Area
83.0 77.3 92.9 - 7 9 Serious Housing Code Violations (per 1,000 rental units)
29.8% 32.7% 29.5% - 47 53 % Students Performing at Grade Level - Reading
26.2% 32.8% 38.1% - 44 45 % Students Performing at Grade Level - Math
23.6 21.3 21.4 - 45 42 Felony Crime Rate (per 1,000 residents)
CD 312 has witnessed a tremendous increase in foreclosure activity since 2002, with the rate per 1,000 one to four family properties rising from 27.8 to 41.8 in 2004. Indeed, Washington Heights/Inwood had the 2nd highest ranking for foreclosures in 2004, compared to the 14th highest in 2002. The rate of refinance loans rose to 25.9 per 1,000 properties in 2004, but the percentage of those loans that
are subprime was quite low, with a rate of 3.9%. CD 312’s crime rate remained fairly stable, with a rate of 21.4 per 1,000 residents in 2004 and a rate of 23.6 in 2002. Washington Heights has also experienced a decrease in reading test scores, contrary to citywide trends.
________________________________________________________________________________________________________________ Numbers in italics are based on a small number of observations and should be treated with caution. 1 Community district 312 matches sub-borough area 310. 2 Ranked out of 47 community districts with sufficient sales of buildings with five or more units. 3 Ranked out of 45 community districts with sufficient sales of buildings with five or more units. 4 Ranked out of 5 community districts with the same predominant housing type (5+ family buildings).
Rank (2002)
Rank (2004/5)
Population (2000): 208,414 5 -
Racial Diversity Index: 0.71 28 29
Median Household Income: $30,000 43 42
Median Monthly Rent: $770 44 47
Median Price/Unit (2-4 fam.): $158,667 23 50
Median Price/Unit (5+ fam.): $78,000 452 213
Income Diversity Ratio: 6.6 8 8
W A S H I N G T O N H T S. / I N W O O D1
83 | TH
E FURM
AN
CEN
TER FOR REA
L ESTATE &
URBA
N PO
LICY


Q U E E N S
Astoria 401 88
Woodside/Sunnyside 402 89
Jackson Heights 403 90
Elmhurst/Corona 404 91
Ridgewood/Maspeth 405 92
Rego Park/Forest Hills 406 93
Flushing/Whitestone 407 94
Hillcrest/Fresh Meadows 408 95
Ozone Park/Woodhaven 409 96
S. Ozone Park/Howard Beach 410 97
Bayside/Little Neck 411 98
Jamaica/Hollis 412 99
Queens Village 413 100
Rockaway/Broad Channel 414 101
CD Page
85 | TH
E FURM
AN
CEN
TER FOR REA
L ESTATE &
URBA
N PO
LICY
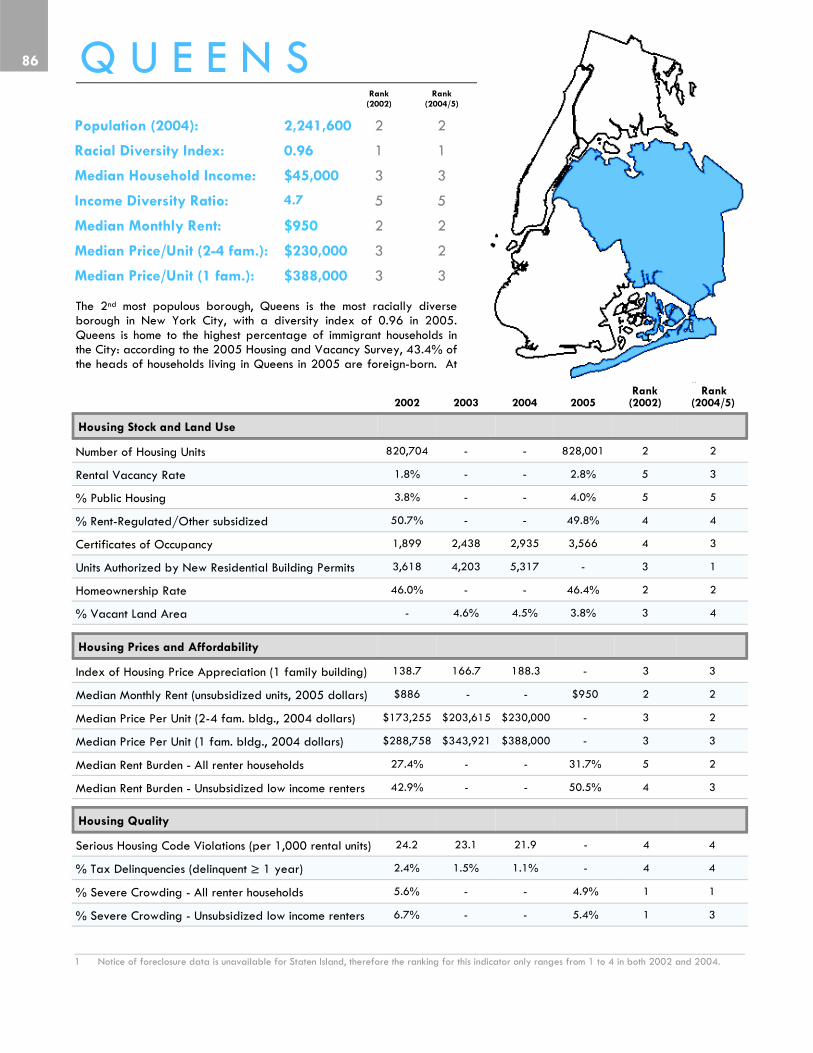
Q U E E N S
The 2nd most populous borough, Queens is the most racially diverse borough in New York City, with a diversity index of 0.96 in 2005. Queens is home to the highest percentage of immigrant households in the City: according to the 2005 Housing and Vacancy Survey, 43.4% of the heads of households living in Queens in 2005 are foreign-born. At
2002 2003 2004 2005 (2002) (2004/5)
Housing Stock and Land Use
Number of Housing Units 820,704 - - 828,001 2 2
Rental Vacancy Rate 1.8% - - 2.8% 5 3
% Public Housing 3.8% - - 4.0% 5 5
% Rent-Regulated/Other subsidized 50.7% - - 49.8% 4 4
Certificates of Occupancy 1,899 2,438 2,935 3,566 4 3
Units Authorized by New Residential Building Permits 3,618 4,203 5,317 - 3 1
Homeownership Rate 46.0% - - 46.4% 2 2
% Vacant Land Area - 4.6% 4.5% 3.8% 3 4
Housing Quality
Serious Housing Code Violations (per 1,000 rental units) 24.2 23.1 21.9 - 4 4
% Tax Delinquencies (delinquent ≥ 1 year) 2.4% 1.5% 1.1% - 4 4
% Severe Crowding - All renter households 5.6% - - 4.9% 1 1
% Severe Crowding - Unsubsidized low income renters 6.7% - - 5.4% 1 3
________________________________________________________________________________________________________________ 1 Notice of foreclosure data is unavailable for Staten Island, therefore the ranking for this indicator only ranges from 1 to 4 in both 2002 and 2004.
Housing Prices and Affordability
Index of Housing Price Appreciation (1 family building) 138.7 166.7 188.3 - 3 3
Median Monthly Rent (unsubsidized units, 2005 dollars) $886 - - $950 2 2
Median Price Per Unit (2-4 fam. bldg., 2004 dollars) $173,255 $203,615 $230,000 - 3 2
Median Price Per Unit (1 fam. bldg., 2004 dollars) $288,758 $343,921 $388,000 - 3 3
Median Rent Burden - All renter households 27.4% - - 31.7% 5 2
Median Rent Burden - Unsubsidized low income renters 42.9% - - 50.5% 4 3
Rank (2002)
Population (2004): 2,241,600 2
Racial Diversity Index: 0.96 1
Median Household Income: $45,000 3
Median Monthly Rent: $950 2
Median Price/Unit (2-4 fam.): $230,000 3
Median Price/Unit (1 fam.): $388,000 3
Rank (2004/5)
2
1
3
2
2
3
Income Diversity Ratio: 4.7 5 5
Rank Rank
86

the same time, Queens has the lowest income diversity ratio among the five boroughs. Queens has experienced a surge in new building permits in recent years. In 2004 alone, new residential building permits authorized the construction of 5,317 units of housing. Certain community districts in Queens had the greatest increases in building permits in recent years, including CD 401 (Astoria and parts of Long Island City) and CD 405 (Ridgewood/Maspeth). Despite this considerable boom in construction and an increase in the rental vacancy rate, Queens continues to have the City’s highest percentage of severely crowded renter households, although this figure has declined somewhat since 2002. The percentage of the borough’s land area that is vacant has been declining steadily in recent years, and Queens now trails only Manhattan in the scarcity of vacant land. As in other boroughs, home prices have continued to rise in Queens since 2002. Renters in Queens have been particularly burdened by rising housing costs. In comparison
to renters in other boroughs, Queens renters were the least burdened by housing costs in 2002, but the borough ranks second on this indicator in 2005. In addition, a steadily increasing proportion of homeowners in Queens have turned to subprime lenders for both home purchase and refinance loans. At the same time, the rate of foreclosure notices in the borough has been edging up. With a crime rate of 21.4 felonies per 1,000 residents, Queens is one of the safest boroughs. Along with the rest of the City, the crime rate has decreased steadily in recent years. Likewise, elementary school performance has improved, following the citywide trend. Rezonings have been approved for a number of neighborhoods throughout Queens, including Middle Village/Glendale in CD 405, Whitestone in CD 407, Kew Gardens in CD 409, and Cambria Heights in CD 413. Each of these plans downzones the neighborhood in order to restrict development and preserve the low-density residential character of these areas.
Lending Indicators
Home Purchase Loans (per 1,000 properties) 52.7 51.7 60.1 - 3 3
% Subprime Home Purchase Loans 7.1% 11.5% 17.7% - 3 3
Home Purchase Loan Approval Rate 82.7% 82.1% 80.3% - 3 3
Refinance Loan Rate (per 1,000 properties) 72.8 101.7 62.2 - 3 3
% Subprime Refinance Loans 20.9% 21.2% 34.2% - 3 3
Notices of Foreclosure (per 1,000 1-4 family properties) 10.23 10.54 11.84 - 4 31
Social, Demographic, and Income Indicators
Population 2,248,293 2,244,238 2,250,718 2,241,600 2 2
Racial Diversity Index 0.94 - - 0.96 1 1
% Immigrant Households 43.5% - - 43.4% 1 1
% Asian (inc. Hawaiian and Pacific Islander) Households 17.3% - - 18.1% 1 1
% Black (including Hispanic) Households 19.4% - - 19.6% 3 3
% Hispanic (non-Black) Households 20.2% - - 22.4% 2 2
% White (non-Hispanic) Households 42.9% - - 39.7% 3 4
% Native American Households 0.2% - - 0.2% 3 2
Median Household Income (in 2004 dollars) $48,162 - - $45,000 3 3
Income Diversity Ratio 4.4 - - 4.7 5 5
Poverty Rate 11.2% - - 11.6% 4 4
Unemployment Rate 7.4% - - - 4 -
% Students Performing at Grade Level - Reading 47.6% 49.1% 49.7% - 2 2
% Students Performing at Grade Level - Math 44.7% 49.6% 55.0% - 2 2
Felony Crime Rate (per 1,000 residents) 25.1 22.2 21.4 - 4 4
2002 2003 2004 2005 (2002) (2004/5) Rank Rank
87 | TH
E FURM
AN
CEN
TER FOR REA
L ESTATE &
URBA
N PO
LICY

A S T O R I A
2002 2003 2004 2005 Rank (2002)
Rank (2004/5)
Median Household Income (in 2004 dollars) $39,406 - - $38,300 30 28
Poverty Rate 17.7% - - 17.2% 24 25
% Immigrant Households 47.8% - - 32.5% 10 31
Rental Vacancy Rate 1.9% - - 1.6% 37 48
Number of Housing Units 78,229 - - 76,618 5 6
% Public Housing 12.5% - - 11.2% 16 15
% Rent-Regulated/Other subsidized 55.8% - - 55.9% 29 28
Certificates of Occupancy 201 116 77 365 20 17
Units Authorized by New Residential Building Permits 277 480 835 - 24 5
Homeownership Rate 19.2% - - 18.1% 40 42
Index of Housing Price Appreciation (2-4 family building) 147.3 180.2 198.0 - 18 211
Home Purchase Loans (per 1,000 properties) 36.8 34.0 34.9 - 46 51
% Subprime Home Purchase Loans 7.0% 14.1% 9.0% - 31 31
Refinance Loan Rate (per 1,000 properties) 68.4 83.0 42.9 - 26 31
% Subprime Refinance Loans 16.8% 14.4% 22.0% - 31 34
Notices of Foreclosure (per 1,000 1-4 family properties) 3.4 3.1 4.1 - 46 41
% Tax Delinquencies (delinquent ≥ 1 year) 1.7% 1.1% 0.7% - 41 46
% Vacant Land Area - 2.3% 2.0% 1.8% 34 39
Serious Housing Code Violations (per 1,000 rental units) 15.6 15.6 16.3 - 42 42
% Students Performing at Grade Level - Reading 46.8% 48.4% 48.5% - 22 22
% Students Performing at Grade Level - Math 47.1% 49.4% 53.3% - 15 22
Felony Crime Rate (per 1,000 residents) 24.9 19.1 20.3 - 41 46
CD 401, which includes the large neighborhood of Astoria, has one of the highest populations in the City, at 211,220. CD 401 had a very low rate of home purchase loans in 2004 and ranked in the middle of all community districts for subprime lending. Home values have been on the rise in Astoria, but at a slower rate than many other neighborhoods.
Growth is evident in CD 401: it had the 5th highest number of housing units authorized by new building permits in the City in 2004. The felony crime rate and rate of serious housing code violations were both in the bottom quartile.
CD 401
______________________________________________________________________________________________________________ Numbers in italics are based on a small number of observations and should be treated with caution. 1 Ranked out of 34 community districts with the same predominant housing type (2-4 family buildings).
Rank (2002)
Rank (2004/5)
Population (2000): 211,220 4 -
Racial Diversity Index: 0.78 16 22
Median Household Income: $38,300 30 28
Income Diversity Ratio: 4.5 35 46
Median Monthly Rent: $950 13 14
Median Price/Unit (2-4 fam.): $250,000 18 22
88

W O O D S I D E /S U N N Y S I D E
2002 2003 2004 2005 Rank (2002)
Rank (2004/5)
$43,644 - - $40,000 25 24 Median Household Income (in 2004 dollars)
14.2% - - 12.8% 32 35 Poverty Rate
52.0% - - 48.6% 5 6 % Immigrant Households
2.3% - - 4.0% 32 14 Rental Vacancy Rate
50,469 - - 51,402 31 32 Number of Housing Units
1.4% - - 0.0% 36 38 % Public Housing
72.7% - - 70.2% 12 11 % Rent-Regulated/Other subsidized
65 456 168 40 44 53 Certificates of Occupancy
110 63 237 - 44 33 Units Authorized by New Residential Building Permits
27.5% - - 24.3% 31 34 Homeownership Rate
175.4 195.4 217.0 - 5 111 Index of Housing Price Appreciation (2-4 family building)
54.1 47.6 47.1 - 26 39 Home Purchase Loans (per 1,000 properties)
5.1% 7.8% 8.0% - 39 32 % Subprime Home Purchase Loans
51.7 65.4 38.5 - 35 35 Refinance Loan Rate (per 1,000 properties)
15.0% 11.9% 17.8% - 33 37 % Subprime Refinance Loans
3.0 6.1 6.4 - 48 36 Notices of Foreclosure (per 1,000 1-4 family properties)
1.7% 1.1% 1.0% - 41 38 % Tax Delinquencies (delinquent ≥ 1 year)
- 6.3% 6.2% 6.3% 13 14 % Vacant Land Area
25.5 24.2 26.1 - 31 29 Serious Housing Code Violations (per 1,000 rental units)
45.4% 47.4% 47.6% - 26 24 % Students Performing at Grade Level - Reading
43.5% 48.0% 52.5% - 24 25 % Students Performing at Grade Level - Math
31.6 28.7 26.8 - 25 31 Felony Crime Rate (per 1,000 residents)
CD 402 covers the neighborhoods of Sunnyside, Woodside, and part of Long Island City. The area is 6th in the City in the percentage of immigrant households, at 48.6%. CD 402 also has a large share of rent-regulated housing. Unlike most CDs, Woodside/Sunnyside has seen a decrease in homeownership rates and in both home purchase and refinance loans, but an increase in notices of mortgage
foreclosure. Although not among the neighborhoods with the highest rates of subprime lending, CD 402 has nonetheless witnessed an increase in subprime home purchase lending since 2002. Following the citywide trend, school performance in reading and math has risen considerably in CD 402, while the crime rate has declined.
CD 402
______________________________________________________________________________________________________________ Numbers in italics are based on a small number of observations and should be treated with caution. 1 Ranked out of 34 community districts with the same predominant housing type (2-4 family buildings).
Rank (2002)
Rank (2004/5)
Population (2000): 109,920 41 -
Racial Diversity Index: 0.90 6 7
Median Household Income: $40,000 25 24
Median Monthly Rent: $900 29 21
Median Price/Unit (2-4 fam.): $258,230 13 20
Income Diversity Ratio: 4.1 35 51
89 | TH
E FURM
AN
CEN
TER FOR REA
L ESTATE &
URBA
N PO
LICY

J A C K S O N H E I G H T S
2002 2003 2004 2005 Rank (2002)
Rank (2004/5)
Median Household Income (in 2004 dollars) $42,252 - - $35,600 27 29
Poverty Rate 14.0% - - 11.6% 33 36
% Immigrant Households 57.2% - - 61.0% 3 2
Rental Vacancy Rate 0.9% - - 1.8% 48 44
Number of Housing Units 54,549 - - 55,235 23 24
% Public Housing 0.0% - - 0.0% 38 38
% Rent-Regulated/Other subsidized 46.9% - - 45.7% 34 37
Certificates of Occupancy 179 198 186 183 24 32
Units Authorized by New Residential Building Permits 150 320 375 - 41 20
Homeownership Rate 36.0% - - 35.7% 18 18
Index of Housing Price Appreciation (2-4 family building) 164.5 195.5 224.1 - 10 91
Home Purchase Loans (per 1,000 properties) 59.3 56.7 65.5 - 19 22
% Subprime Home Purchase Loans 10.8% 15.8% 20.0% - 12 23
Refinance Loan Rate (per 1,000 properties) 63.3 89.0 60.9 - 29 22
% Subprime Refinance Loans 23.1% 24.9% 33.0% - 19 22
Notices of Foreclosure (per 1,000 1-4 family properties) 10.6 10.1 12.4 - 29 26
% Tax Delinquencies (delinquent ≥ 1 year) 2.5% 1.7% 1.3% - 31 30
% Vacant Land Area - 1.9% 1.8% 1.5% 41 44
Serious Housing Code Violations (per 1,000 rental units) 35.9 29.7 31.1 - 21 27
% Students Performing at Grade Level - Reading 46.1% 47.8% 48.0% - 24 23
% Students Performing at Grade Level - Math 45.3% 48.7% 52.9% - 20 24
Felony Crime Rate (per 1,000 residents) 26.0 20.8 21.1 - 36 43
Like CDs 401 and 402, CD 403 has a high immigrant population. At 61% of households, it is ranked 2nd overall in New York City for this indicator. The area also has a very low rental vacancy rate – only 1.8% of rental apartments were vacant in 2005. Home purchase loans have risen since 2002, but this has been paired with a doubling of subprime home purchase lending. Similar to CD 402, refinance
lending has decreased while the subprime share of refinance loans has gone up. CD 403 has very little vacant land and a relatively low crime rate. Although school performance in math increased in 2004, CD 403 dropped in the rankings for that indicator. CD 403 is one of the least economically diverse community districts in the City.
CD 403
________________________________________________________________________________________________________________ Numbers in italics are based on a small number of observations and should be treated with caution. 1 Ranked out of 34 community districts with the same predominant housing type (2-4 family buildings).
Rank (2002)
Rank (2004/5)
Population (2000): 169,083 12 -
Racial Diversity Index: 0.84 6 18
Median Household Income: $35,600 27 29
Median Monthly Rent: $962 15 12
Median Price/Unit (2-4 fam.): $257,500 15 21
Income Diversity Ratio: 3.9 42 53
90
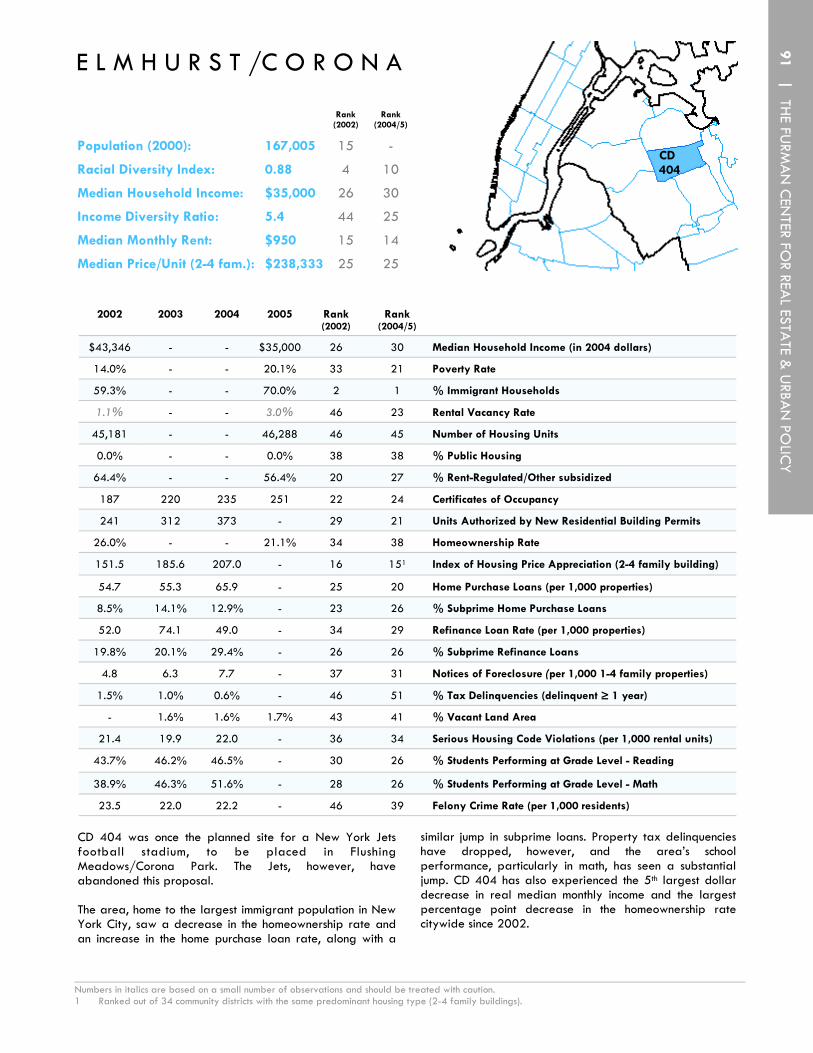
E L M H U R S T /C O R O N A
2002 2003 2004 2005 Rank (2002)
Rank (2004/5)
$43,346 - - $35,000 26 30 Median Household Income (in 2004 dollars)
14.0% - - 20.1% 33 21 Poverty Rate
59.3% - - 70.0% 2 1 % Immigrant Households
1.1% - - 3.0% 46 23 Rental Vacancy Rate
45,181 - - 46,288 46 45 Number of Housing Units
0.0% - - 0.0% 38 38 % Public Housing
64.4% - - 56.4% 20 27 % Rent-Regulated/Other subsidized
187 220 235 251 22 24 Certificates of Occupancy
241 312 373 - 29 21 Units Authorized by New Residential Building Permits
26.0% - - 21.1% 34 38 Homeownership Rate
151.5 185.6 207.0 - 16 151 Index of Housing Price Appreciation (2-4 family building)
54.7 55.3 65.9 - 25 20 Home Purchase Loans (per 1,000 properties)
8.5% 14.1% 12.9% - 23 26 % Subprime Home Purchase Loans
52.0 74.1 49.0 - 34 29 Refinance Loan Rate (per 1,000 properties)
19.8% 20.1% 29.4% - 26 26 % Subprime Refinance Loans
4.8 6.3 7.7 - 37 31 Notices of Foreclosure (per 1,000 1-4 family properties)
1.5% 1.0% 0.6% - 46 51 % Tax Delinquencies (delinquent ≥ 1 year)
- 1.6% 1.6% 1.7% 43 41 % Vacant Land Area
21.4 19.9 22.0 - 36 34 Serious Housing Code Violations (per 1,000 rental units)
43.7% 46.2% 46.5% - 30 26 % Students Performing at Grade Level - Reading
38.9% 46.3% 51.6% - 28 26 % Students Performing at Grade Level - Math
23.5 22.0 22.2 - 46 39 Felony Crime Rate (per 1,000 residents)
CD 404
________________________________________________________________________________________________________________ Numbers in italics are based on a small number of observations and should be treated with caution. 1 Ranked out of 34 community districts with the same predominant housing type (2-4 family buildings).
similar jump in subprime loans. Property tax delinquencies have dropped, however, and the area’s school performance, particularly in math, has seen a substantial jump. CD 404 has also experienced the 5th largest dollar decrease in real median monthly income and the largest percentage point decrease in the homeownership rate citywide since 2002.
CD 404 was once the planned site for a New York Jets football stadium, to be placed in Flushing Meadows/Corona Park. The Jets, however, have abandoned this proposal. The area, home to the largest immigrant population in New York City, saw a decrease in the homeownership rate and an increase in the home purchase loan rate, along with a
Rank (2002)
Rank (2004/5)
Population (2000): 167,005 15 -
Racial Diversity Index: 0.88 4 10
Median Household Income: $35,000 26 30
Median Monthly Rent: $950 15 14
Median Price/Unit (2-4 fam.): $238,333 25 25
Income Diversity Ratio: 5.4 44 25
91 | TH
E FURM
AN
CEN
TER FOR REA
L ESTATE &
URBA
N PO
LICY
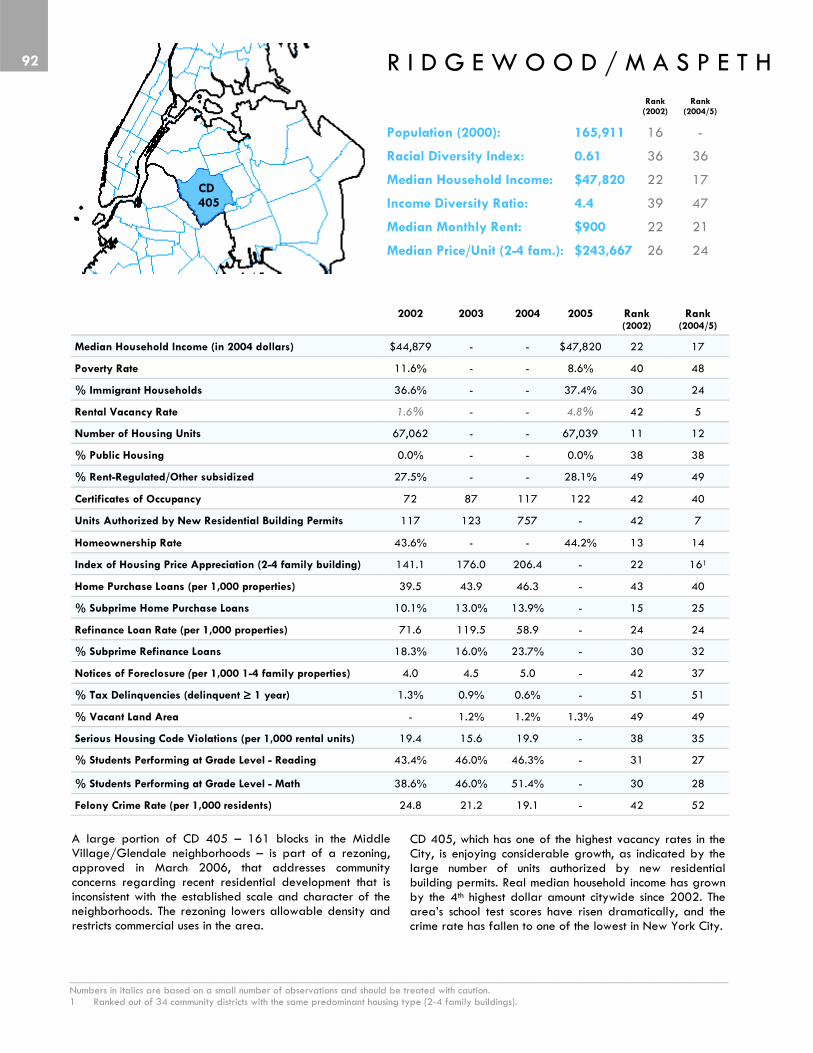
R I D G E W O O D / M A S P E T H
A large portion of CD 405 – 161 blocks in the Middle Village/Glendale neighborhoods – is part of a rezoning, approved in March 2006, that addresses community concerns regarding recent residential development that is inconsistent with the established scale and character of the neighborhoods. The rezoning lowers allowable density and restricts commercial uses in the area.
2002 2003 2004 2005 Rank (2002)
Rank (2004/5)
Median Household Income (in 2004 dollars) $44,879 - - $47,820 22 17
Poverty Rate 11.6% - - 8.6% 40 48
% Immigrant Households 36.6% - - 37.4% 30 24
Rental Vacancy Rate 1.6% - - 4.8% 42 5
Number of Housing Units 67,062 - - 67,039 11 12
% Public Housing 0.0% - - 0.0% 38 38
% Rent-Regulated/Other subsidized 27.5% - - 28.1% 49 49
Certificates of Occupancy 72 87 117 122 42 40
Units Authorized by New Residential Building Permits 117 123 757 - 42 7
Homeownership Rate 43.6% - - 44.2% 13 14
Index of Housing Price Appreciation (2-4 family building) 141.1 176.0 206.4 - 22 161
Home Purchase Loans (per 1,000 properties) 39.5 43.9 46.3 - 43 40
% Subprime Home Purchase Loans 10.1% 13.0% 13.9% - 15 25
Refinance Loan Rate (per 1,000 properties) 71.6 119.5 58.9 - 24 24
% Subprime Refinance Loans 18.3% 16.0% 23.7% - 30 32
Notices of Foreclosure (per 1,000 1-4 family properties) 4.0 4.5 5.0 - 42 37
% Tax Delinquencies (delinquent ≥ 1 year) 1.3% 0.9% 0.6% - 51 51
% Vacant Land Area - 1.2% 1.2% 1.3% 49 49
Serious Housing Code Violations (per 1,000 rental units) 19.4 15.6 19.9 - 38 35
% Students Performing at Grade Level - Reading 43.4% 46.0% 46.3% - 31 27
% Students Performing at Grade Level - Math 38.6% 46.0% 51.4% - 30 28
Felony Crime Rate (per 1,000 residents) 24.8 21.2 19.1 - 42 52
CD 405, which has one of the highest vacancy rates in the City, is enjoying considerable growth, as indicated by the large number of units authorized by new residential building permits. Real median household income has grown by the 4th highest dollar amount citywide since 2002. The area’s school test scores have risen dramatically, and the crime rate has fallen to one of the lowest in New York City.
CD 405
______________________________________________________________________________________________________________ Numbers in italics are based on a small number of observations and should be treated with caution. 1 Ranked out of 34 community districts with the same predominant housing type (2-4 family buildings).
Rank (2002)
Rank (2004/5)
Population (2000): 165,911 16 -
Racial Diversity Index: 0.61 36 36
Median Household Income: $47,820 22 17
Median Monthly Rent: $900 22 21
Median Price/Unit (2-4 fam.): $243,667 26 24
Income Diversity Ratio: 4.4 39 47
92

R E G O P A R K /F O R E S T H I L L S
2002 2003 2004 2005 Rank (2002)
Rank (2004/5)
$54,730 - - $55,000 9 9 Median Household Income (in 2004 dollars)
10.3% - - 7.3% 47 54 Poverty Rate
41.9% - - 46.1% 17 9 % Immigrant Households
0.0% - - 1.9% 53 42 Rental Vacancy Rate
55,460 - - 55,547 21 23 Number of Housing Units
0.0% - - 0.0% 38 38 % Public Housing
78.7% - - 80.8% 9 8 % Rent-Regulated/Other subsidized
75 30 68 22 40 55 Certificates of Occupancy
51 68 21 - 55 58 Units Authorized by New Residential Building Permits
43.8% - - 45.5% 12 12 Homeownership Rate
140.2 171.3 188.1 - 7 52 Index of Housing Price Appreciation (1 family building)
56.5 49.9 53.8 - 23 31 Home Purchase Loans (per 1,000 properties)
2.5% 2.3% 1.9% - 46 47 % Subprime Home Purchase Loans
39.9 59.8 23.3 - 48 53 Refinance Loan Rate (per 1,000 properties)
5.7% 5.0% 6.7% - 48 48 % Subprime Refinance Loans
2.1 2.8 2.5 - 52 50 Notices of Foreclosure (per 1,000 1-4 family properties)
1.3% 0.9% 0.5% - 51 55 % Tax Delinquencies (delinquent ≥ 1 year)
- 1.0% 1.0% 1.2% 51 51 % Vacant Land Area
12.2 10.4 10.9 - 45 52 Serious Housing Code Violations (per 1,000 rental units)
50.5% 51.0% 51.6% - 16 18 % Students Performing at Grade Level - Reading
45.8% 52.5% 57.2% - 19 15 % Students Performing at Grade Level - Math
25.3 20.7 23.0 - 39 37 Felony Crime Rate (per 1,000 residents)
CD 406 has very little vacant land and little new housing under construction, ranking close to last citywide in certificates of occupancy issued and units authorized by new residential building permits. It also ranked near the bottom in foreclosure notices and percentage of properties that were tax delinquent for one year or longer in 2004. It also had an extremely low rate of serious housing code
violations that year. CD 406 has the 2nd lowest poverty rate and ranks in the top ten for median household income. Mortgage lending decreased slightly since 2002, though there was a slight increase in subprime refinance lending. More than half of the students performed at or above their grade levels in reading and math in 2004.
CD 406
_______________________________________________________________________________________________________________ Numbers in italics are based on a small number of observations and should be treated with caution. 1 Ranked out of 50 community districts with sufficient single family home sales. 2 Ranked out of 13 community districts with the same predominant housing type (single family homes).
Rank (2002)
Population (2000): 115,967 37
Racial Diversity Index: 0.69 35
Median Household Income: $55,000 9
Median Monthly Rent: $980 8
Median Price/Unit (2-4 fam.): $262,500 12
Median Price/Unit (1 fam.): $545,000 6
Rank (2004/5)
-
32
9
10
15
111
Income Diversity Ratio: 5.2 20 33
93 | TH
E FURM
AN
CEN
TER FOR REA
L ESTATE &
URBA
N PO
LICY
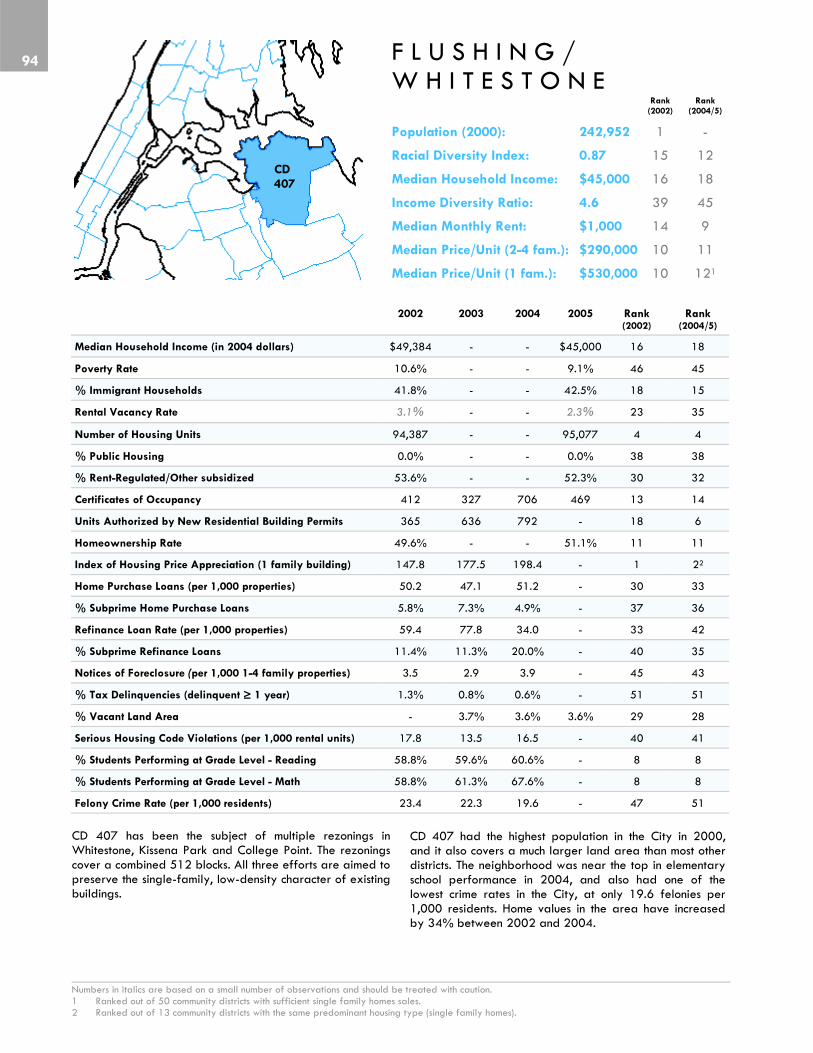
CD 407 has been the subject of multiple rezonings in Whitestone, Kissena Park and College Point. The rezonings cover a combined 512 blocks. All three efforts are aimed to preserve the single-family, low-density character of existing buildings.
2002 2003 2004 2005 Rank (2002)
Rank (2004/5)
Median Household Income (in 2004 dollars) $49,384 - - $45,000 16 18
Poverty Rate 10.6% - - 9.1% 46 45
% Immigrant Households 41.8% - - 42.5% 18 15
Rental Vacancy Rate 3.1% - - 2.3% 23 35
Number of Housing Units 94,387 - - 95,077 4 4
% Public Housing 0.0% - - 0.0% 38 38
% Rent-Regulated/Other subsidized 53.6% - - 52.3% 30 32
Certificates of Occupancy 412 327 706 469 13 14
Units Authorized by New Residential Building Permits 365 636 792 - 18 6
Homeownership Rate 49.6% - - 51.1% 11 11
Index of Housing Price Appreciation (1 family building) 147.8 177.5 198.4 - 1 22
Home Purchase Loans (per 1,000 properties) 50.2 47.1 51.2 - 30 33
% Subprime Home Purchase Loans 5.8% 7.3% 4.9% - 37 36
Refinance Loan Rate (per 1,000 properties) 59.4 77.8 34.0 - 33 42
% Subprime Refinance Loans 11.4% 11.3% 20.0% - 40 35
Notices of Foreclosure (per 1,000 1-4 family properties) 3.5 2.9 3.9 - 45 43
% Tax Delinquencies (delinquent ≥ 1 year) 1.3% 0.8% 0.6% - 51 51
% Vacant Land Area - 3.7% 3.6% 3.6% 29 28
Serious Housing Code Violations (per 1,000 rental units) 17.8 13.5 16.5 - 40 41
% Students Performing at Grade Level - Reading 58.8% 59.6% 60.6% - 8 8
% Students Performing at Grade Level - Math 58.8% 61.3% 67.6% - 8 8
Felony Crime Rate (per 1,000 residents) 23.4 22.3 19.6 - 47 51
CD 407 had the highest population in the City in 2000, and it also covers a much larger land area than most other districts. The neighborhood was near the top in elementary school performance in 2004, and also had one of the lowest crime rates in the City, at only 19.6 felonies per 1,000 residents. Home values in the area have increased by 34% between 2002 and 2004.
CD 407
______________________________________________________________________________________________________________ Numbers in italics are based on a small number of observations and should be treated with caution. 1 Ranked out of 50 community districts with sufficient single family homes sales. 2 Ranked out of 13 community districts with the same predominant housing type (single family homes).
Rank (2002)
Population (2000): 242,952 1
Racial Diversity Index: 0.87 15
Median Household Income: $45,000 16
Median Monthly Rent: $1,000 14
Median Price/Unit (2-4 fam.): $290,000 10
Median Price/Unit (1 fam.): $530,000 10
Rank (2004/5)
-
12
18
9
11
121
Income Diversity Ratio: 4.6 39 45
F L U S H I N G / W H I T E S T O N E
94

2002 2003 2004 2005 Rank (2002)
Rank (2004/5)
$47,068 - - $50,000 18 13 Median Household Income (in 2004 dollars)
11.0% - - 10.7% 42 40 Poverty Rate
38.8% - - 35.7% 27 26 % Immigrant Households
3.8% - - 1.4% 17 49 Rental Vacancy Rate
59,849 - - 60,261 18 19 Number of Housing Units
8.2% - - 9.3% 24 20 % Public Housing
69.8% - - 68.9% 16 13 % Rent-Regulated/Other subsidized
35 58 130 343 54 19 Certificates of Occupancy
417 622 102 - 14 52 Units Authorized by New Residential Building Permits
49.8% - - 52.5% 10 10 Homeownership Rate
145.6 172.5 194.2 - 2 31 Index of Housing Price Appreciation (1 family building)
57.3 45.3 49.2 - 22 35 Home Purchase Loans (per 1,000 properties)
4.5% 6.5% 7.0% - 40 34 % Subprime Home Purchase Loans
61.5 74.0 37.3 - 32 37 Refinance Loan Rate (per 1,000 properties)
13.8% 12.0% 22.5% - 34 33 % Subprime Refinance Loans
4.3 4.4 4.1 - 40 41 Notices of Foreclosure (per 1,000 1-4 family properties)
1.5% 1.1% 0.7% - 46 46 % Tax Delinquencies (delinquent ≥ 1 year)
- 0.9% 0.9% 1.0% 52 52 % Vacant Land Area
18.3 18.4 19.5 - 39 37 Serious Housing Code Violations (per 1,000 rental units)
56.8% 57.7% 58.0% - 9 9 % Students Performing at Grade Level - Reading
54.5% 58.5% 63.5% - 9 9 % Students Performing at Grade Level - Math
25.0 23.5 22.1 - 40 40 Felony Crime Rate (per 1,000 residents)
CD 408
Rank (2002)
Population (2000): 146,594 24
Racial Diversity Index: 0.95 3
Median Household Income: $50,000 18
Median Monthly Rent: $960 8
Median Price/Unit (2-4 fam.): $267,500 14
Median Price/Unit (1 fam.): $506,500 13
Rank (2004/5)
-
3
13
13
13
151
Income Diversity Ratio: 3.7 44 54
H I L L C R E S T / F R E S H M E A D O W S
95 | TH
E FURM
AN
CEN
TER FOR REA
L ESTATE &
URBA
N PO
LICY
_____________________________________________________________________________________________________________ Numbers in italics are based on a small number of observations and should be treated with caution. 1 Ranked out of 50 community districts with sufficient single family home sales. 2 Ranked out of 13 community districts with the same predominant housing types (single family homes).
In an effort to preserve the low-rise, single-family character of CD 408’s housing stock, the Department of City Planning recently rezoned 83 blocks in the neighborhoods of Fresh Meadows, Utopia Estates and West Cunningham Park. The homeownership rate in CD 408, at 52.5% in 2005, is ranked 10th citywide. Median household income has grown by the 5th highest dollar amount in the City. Elementary
education performance is strong – CD 408 is ranked 9th out of the 59 community districts for both reading and math standardized test performance. Although vacant land is scarce, the neighborhood has experienced some new construction, as indicated by the certificates of occupancy and new units authorized by building permits. CD 408 is one of the most racially diverse and least economically diverse neighborhoods in the City.

O Z O N E P A R K / W O O D H A V E N
CD 409, like many other areas of the City, recently underwent a partial rezoning. The measure, covering all or part of 140 blocks in Kew Gardens and Richmond Hill, restricts building in some areas but also provides for increased development along specified commercial thoroughfares.
2002 2003 2004 2005 Rank (2002)
Rank (2004/5)
Median Household Income (in 2004 dollars) $45,973 - - $44,684 19 20
Poverty Rate 11.9% - - 10.3% 38 42
% Immigrant Households 50.8% - - 53.7% 6 4
Rental Vacancy Rate 2.3% - - 4.5% 32 7
Number of Housing Units 47,320 - - 47,903 40 41
% Public Housing 0.0% - - 0.0% 38 38
% Rent-Regulated/Other subsidized 36.2% - - 33.3% 46 46
Certificates of Occupancy 55 54 113 114 46 43
Units Authorized by New Residential Building Permits 104 192 148 - 46 45
Homeownership Rate 40.7% - - 42.2% 16 15
Index of Housing Price Appreciation (2-4 family building) 152.0 173.6 198.8 - 15 201
Home Purchase Loans (per 1,000 properties) 67.5 76.7 89.3 - 15 5
% Subprime Home Purchase Loans 7.6% 14.3% 23.9% - 26 18
Refinance Loan Rate (per 1,000 properties) 85.9 130.4 86.8 - 18 14
% Subprime Refinance Loans 20.0% 21.2% 33.0% - 24 22
Notices of Foreclosure (per 1,000 1-4 family properties) 11.4 11.8 14.2 - 28 24
% Tax Delinquencies (delinquent ≥ 1 year) 2.2% 1.3% 0.9% - 37 40
% Vacant Land Area - 1.6% 1.7% 1.5% 43 44
Serious Housing Code Violations (per 1,000 rental units) 29.2 27.1 24.8 - 27 33
% Students Performing at Grade Level - Reading 40.1% 41.2% 43.1% - 32 32
% Students Performing at Grade Level - Math 36.7% 42.6% 49.6% - 32 32
Felony Crime Rate (per 1,000 residents) 27.1 23.1 20.0 - 34 48
At 53.7% in 2005, CD 409 has the 4th highest percentage of immigrants in the City. The homeownership rate is increasing, and CD 409 had the 5th highest rate of home purchase loans in 2004. Subprime home purchase loans skyrocketed, however, from 7.6% of home loans in 2002 to 23.9% in 2004. CD 409 is the most racially diverse and the least economically diverse neighborhood in the City.
CD 409
______________________________________________________________________________________________________________ Numbers in italics are based on a small number of observations and should be treated with caution. 1 Ranked out of 34 community districts with the same predominant housing type (2-4 family buildings).
Rank (2002)
Rank (2004/5)
Population (2000): 141,608 26 -
Racial Diversity Index: 0.96 2 1
Median Household Income: $44,684 19 20
Median Monthly Rent: $900 15 21
Median Price/Unit (2-4 fam.): $215,135 30 29
Income Diversity Ratio: 3.5 53 55
96
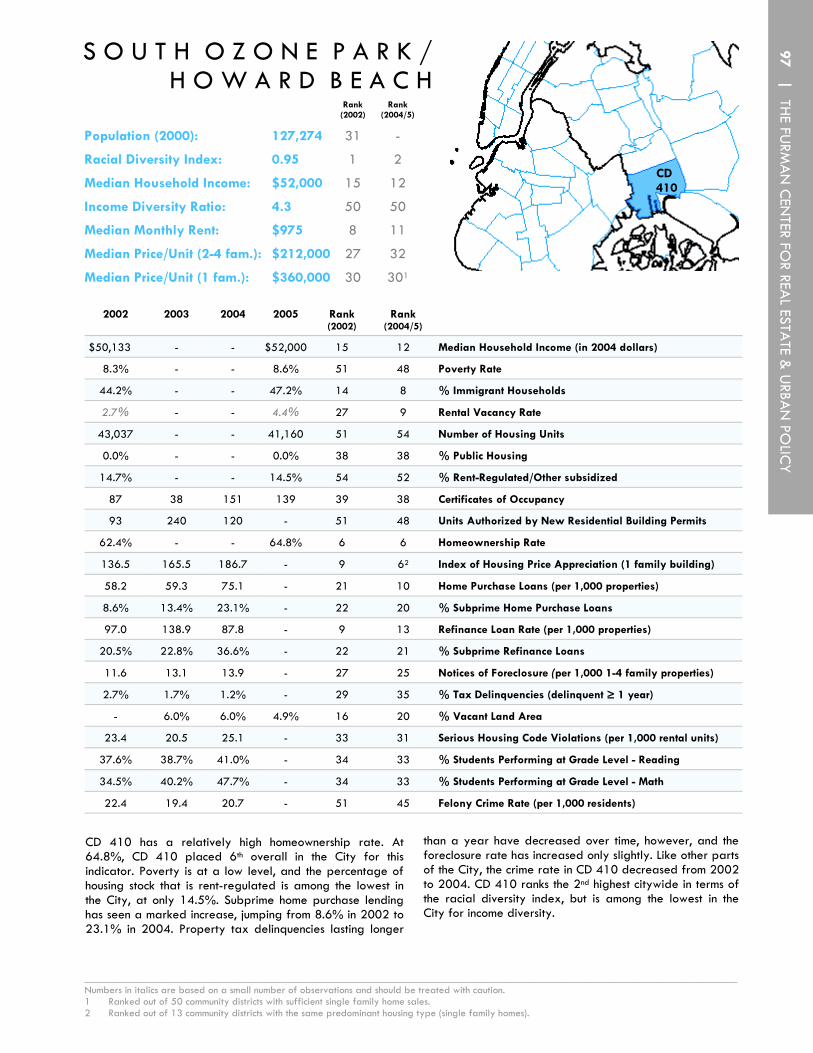
S O U T H O Z O N E P A R K / H O W A R D B E A C H
2002 2003 2004 2005 Rank (2002)
Rank (2004/5)
$50,133 - - $52,000 15 12 Median Household Income (in 2004 dollars)
8.3% - - 8.6% 51 48 Poverty Rate
44.2% - - 47.2% 14 8 % Immigrant Households
2.7% - - 4.4% 27 9 Rental Vacancy Rate
43,037 - - 41,160 51 54 Number of Housing Units
0.0% - - 0.0% 38 38 % Public Housing
14.7% - - 14.5% 54 52 % Rent-Regulated/Other subsidized
87 38 151 139 39 38 Certificates of Occupancy
93 240 120 - 51 48 Units Authorized by New Residential Building Permits
62.4% - - 64.8% 6 6 Homeownership Rate
136.5 165.5 186.7 - 9 62 Index of Housing Price Appreciation (1 family building)
58.2 59.3 75.1 - 21 10 Home Purchase Loans (per 1,000 properties)
8.6% 13.4% 23.1% - 22 20 % Subprime Home Purchase Loans
97.0 138.9 87.8 - 9 13 Refinance Loan Rate (per 1,000 properties)
20.5% 22.8% 36.6% - 22 21 % Subprime Refinance Loans
11.6 13.1 13.9 - 27 25 Notices of Foreclosure (per 1,000 1-4 family properties)
2.7% 1.7% 1.2% - 29 35 % Tax Delinquencies (delinquent ≥ 1 year)
- 6.0% 6.0% 4.9% 16 20 % Vacant Land Area
23.4 20.5 25.1 - 33 31 Serious Housing Code Violations (per 1,000 rental units)
37.6% 38.7% 41.0% - 34 33 % Students Performing at Grade Level - Reading
34.5% 40.2% 47.7% - 34 33 % Students Performing at Grade Level - Math
22.4 19.4 20.7 - 51 45 Felony Crime Rate (per 1,000 residents)
CD 410 has a relatively high homeownership rate. At 64.8%, CD 410 placed 6th overall in the City for this indicator. Poverty is at a low level, and the percentage of housing stock that is rent-regulated is among the lowest in the City, at only 14.5%. Subprime home purchase lending has seen a marked increase, jumping from 8.6% in 2002 to 23.1% in 2004. Property tax delinquencies lasting longer
than a year have decreased over time, however, and the foreclosure rate has increased only slightly. Like other parts of the City, the crime rate in CD 410 decreased from 2002 to 2004. CD 410 ranks the 2nd highest citywide in terms of the racial diversity index, but is among the lowest in the City for income diversity.
CD 410
_____________________________________________________________________________________________________________ Numbers in italics are based on a small number of observations and should be treated with caution. 1 Ranked out of 50 community districts with sufficient single family home sales. 2 Ranked out of 13 community districts with the same predominant housing type (single family homes).
Rank (2002)
Population (2000): 127,274 31
Racial Diversity Index: 0.95 1
Median Household Income: $52,000 15
Median Monthly Rent: $975 8
Median Price/Unit (2-4 fam.): $212,000 27
Median Price/Unit (1 fam.): $360,000 30
Rank (2004/5)
-
2
12
11
32
301
Income Diversity Ratio: 4.3 50 50
97 | TH
E FURM
AN
CEN
TER FOR REA
L ESTATE &
URBA
N PO
LICY

B A Y S I D E / L I T T L E N E C K
On April 12, 2005, the City Council approved the Department of City Planning's rezoning proposal for Bayside. The Bayside rezoning seeks to protect the area's established detached and semi-detached residential character. CD 411, which includes the neighborhoods of Bayside, Little Neck, and Douglaston, had the lowest poverty rate in the City in 2002, but it has more than doubled to 9.3% in
2002 2003 2004 2005 Rank (2002)
Rank (2004/5)
Median Household Income (in 2004 dollars) $65,676 - - $60,000 5 7
Poverty Rate 4.4% - - 9.3% 55 44
% Immigrant Households 38.8% - - 32.6% 27 30
Rental Vacancy Rate 0.0% - - 3.0% 53 23
Number of Housing Units 46,673 - - 47,415 43 43
% Public Housing 0.0% - - 0.0% 38 38
% Rent-Regulated/Other subsidized 20.8% - - 13.1% 51 53
Certificates of Occupancy 53 53 115 116 47 42
Units Authorized by New Residential Building Permits 97 167 160 - 49 44
Homeownership Rate 71.1% - - 74.4% 3 2
Index of Housing Price Appreciation (1 family building) 143.5 166.6 190.0 - 5 42
Home Purchase Loans (per 1,000 properties) 54.8 47.3 50.2 - 24 34
% Subprime Home Purchase Loans 4.2% 6.2% 3.4% - 43 41
Refinance Loan Rate (per 1,000 properties) 64.1 91.5 36.9 - 28 38
% Subprime Refinance Loans 10.6% 8.7% 13.3% - 43 44
Notices of Foreclosure (per 1,000 1-4 family properties) 2.8 2.3 3.1 - 49 46
% Tax Delinquencies (delinquent ≥ 1 year) 1.3% 0.7% 0.5% - 51 55
% Vacant Land Area - 6.1% 6.1% 2.2% 14 35
Serious Housing Code Violations (per 1,000 rental units) 8.0 7.9 7.0 - 51 55
% Students Performing at Grade Level - Reading 73.7% 73.8% 74.2% - 1 1
% Students Performing at Grade Level - Math 73.3% 75.7% 79.5% - 1 1
Felony Crime Rate (per 1,000 residents) 19.4 19.1 17.8 - 55 54
2005. The homeownership rate in the area is among the highest in the City, while subprime lending, housing code violations, and crime rate were all extremely low in 2004. CD 411 leads the City in elementary school performance, with reading scores increasing by the 5th most percentage points citywide since 2002.
CD 411
_____________________________________________________________________________________________________________ Numbers in italics are based on a small number of observations and should be treated with caution. 1 Ranked out of 50 community districts with sufficient single family home sales. 2 Ranked out of 13 community districts with the same predominant housing type (single family homes).
Rank (2002)
Population (2000): 116,404 36
Racial Diversity Index: 0.70 30
Median Household Income: $60,000 5
Median Monthly Rent: $1,200 6
Median Price/Unit (2-4 fam.): $325,000 7
Median Price/Unit (1 fam.): $562,750 7
Rank (2004/5)
-
30
7
5
8
91
Income Diversity Ratio: 5.2 53 33
98
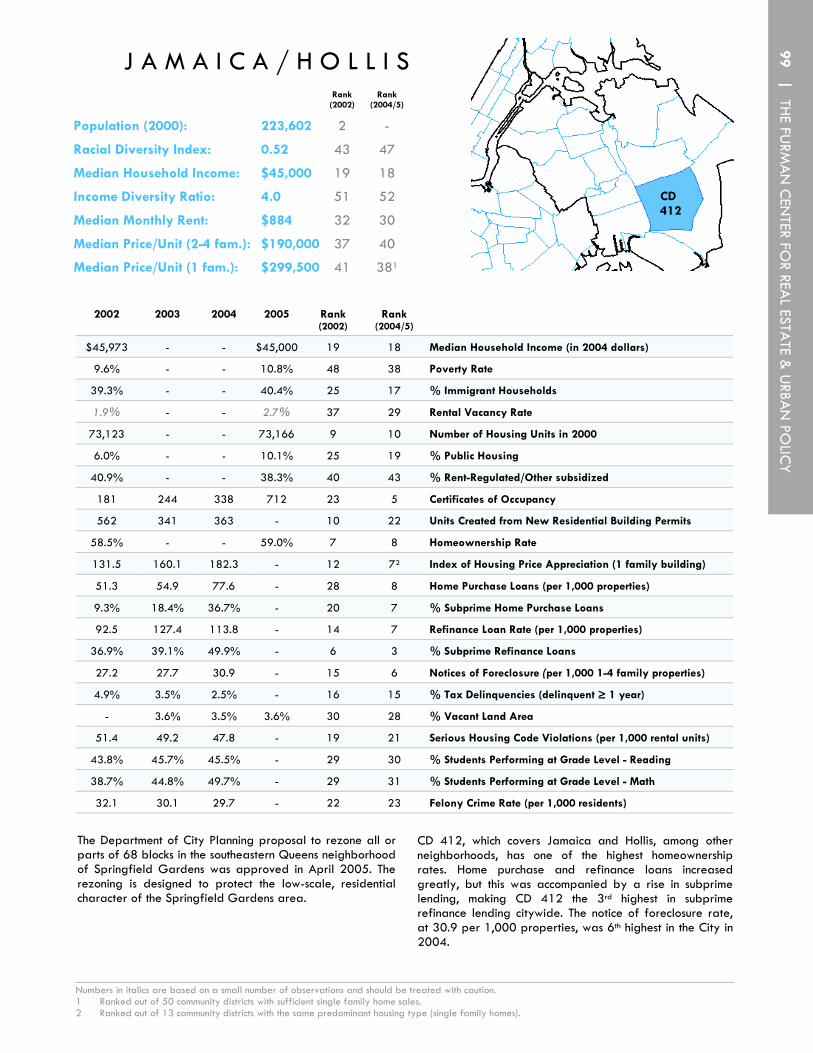
J A M A I C A / H O L L I S
2002 2003 2004 2005 Rank (2002)
Rank (2004/5)
$45,973 - - $45,000 19 18 Median Household Income (in 2004 dollars)
9.6% - - 10.8% 48 38 Poverty Rate
39.3% - - 40.4% 25 17 % Immigrant Households
1.9% - - 2.7% 37 29 Rental Vacancy Rate
73,123 - - 73,166 9 10 Number of Housing Units in 2000
6.0% - - 10.1% 25 19 % Public Housing
40.9% - - 38.3% 40 43 % Rent-Regulated/Other subsidized
181 244 338 712 23 5 Certificates of Occupancy
562 341 363 - 10 22 Units Created from New Residential Building Permits
58.5% - - 59.0% 7 8 Homeownership Rate
131.5 160.1 182.3 - 12 72 Index of Housing Price Appreciation (1 family building)
51.3 54.9 77.6 - 28 8 Home Purchase Loans (per 1,000 properties)
9.3% 18.4% 36.7% - 20 7 % Subprime Home Purchase Loans
92.5 127.4 113.8 - 14 7 Refinance Loan Rate (per 1,000 properties)
36.9% 39.1% 49.9% - 6 3 % Subprime Refinance Loans
27.2 27.7 30.9 - 15 6 Notices of Foreclosure (per 1,000 1-4 family properties)
4.9% 3.5% 2.5% - 16 15 % Tax Delinquencies (delinquent ≥ 1 year)
- 3.6% 3.5% 3.6% 30 28 % Vacant Land Area
51.4 49.2 47.8 - 19 21 Serious Housing Code Violations (per 1,000 rental units)
43.8% 45.7% 45.5% - 29 30 % Students Performing at Grade Level - Reading
38.7% 44.8% 49.7% - 29 31 % Students Performing at Grade Level - Math
32.1 30.1 29.7 - 22 23 Felony Crime Rate (per 1,000 residents)
The Department of City Planning proposal to rezone all or parts of 68 blocks in the southeastern Queens neighborhood of Springfield Gardens was approved in April 2005. The rezoning is designed to protect the low-scale, residential character of the Springfield Gardens area.
CD 412, which covers Jamaica and Hollis, among other neighborhoods, has one of the highest homeownership rates. Home purchase and refinance loans increased greatly, but this was accompanied by a rise in subprime lending, making CD 412 the 3rd highest in subprime refinance lending citywide. The notice of foreclosure rate, at 30.9 per 1,000 properties, was 6th highest in the City in 2004.
CD 412
______________________________________________________________________________________________________________ Numbers in italics are based on a small number of observations and should be treated with caution. 1 Ranked out of 50 community districts with sufficient single family home sales. 2 Ranked out of 13 community districts with the same predominant housing type (single family homes).
Rank (2002)
Population (2000): 223,602 2
Racial Diversity Index: 0.52 43
Median Household Income: $45,000 19
Median Monthly Rent: $884 32
Median Price/Unit (2-4 fam.): $190,000 37
Median Price/Unit (1 fam.): $299,500 41
Rank (2004/5)
-
47
18
30
40
381
Income Diversity Ratio: 4.0 51 52
99 | TH
E FURM
AN
CEN
TER FOR REA
L ESTATE &
URBA
N PO
LICY

Q U E E N S V I L L A G E
In July 2005 the City Council approved the rezoning of the Cambria Heights neighborhood in community district 413. The rezoning, which covers almost 200 blocks, is another in a string of efforts to maintain the existing low-rise, low-density character of neighborhoods in the outer boroughs.
2002 2003 2004 2005 Rank (2002)
Rank (2004/5)
Median Household Income (in 2004 dollars) $59,489 - - $50,000 7 13
Poverty Rate 5.1% - - 10.4% 53 41
% Immigrant Households 40.6% - - 43.2% 22 13
Rental Vacancy Rate 0.0% - - 3.4% 53 18
Number of Housing Units 63,808 - - 67,515 15 11
% Public Housing 0.0% - - 2.8% 38 31
% Rent-Regulated/Other subsidized 22.2% - - 23.7% 50 50
Certificates of Occupancy 120 226 91 161 33 34
Units Authorized by New Residential Building Permits 95 93 148 - 50 45
Homeownership Rate 73.7% - - 71.9% 1 3
Index of Housing Price Appreciation (1 family building) 133.6 159.5 181.3 - 11 82
Home Purchase Loans (per 1,000 properties) 48.7 53.0 64.9 - 31 23
% Subprime Home Purchase Loans 8.4% 15.7% 27.8% - 24 13
Refinance Loan Rate (per 1,000 properties) 102.7 149.9 102.8 - 6 9
% Subprime Refinance Loans 27.8% 29.0% 43.0% - 15 13
Notices of Foreclosure (per 1,000 1-4 family properties) 15.3 15.5 16.3 - 23 22
% Tax Delinquencies (delinquent ≥ 1 year) 2.8% 1.6% 1.3% - 28 30
% Vacant Land Area - 2.1% 2.1% 2.2% 38 35
Serious Housing Code Violations (per 1,000 rental units) 35.2 29.6 24.9 - 22 32
% Students Performing at Grade Level - Reading 49.1% 51.6% 50.3% - 19 19
% Students Performing at Grade Level - Math 44.5% 49.2% 53.2% - 21 23
Felony Crime Rate (per 1,000 residents) 20.9 19.1 17.6 - 53 55
In 2005, CD 413 had the 3rd highest homeownership rate in the City, at 71.9%. It experienced 3rd largest decrease in real median household income citywide, decreasing from $59,489 to $50,000. CD 413 had one of the lowest crime rates in the City in 2004. Only 23.7% of the housing stock in the area is rent-regulated. The percentage of subprime home purchase loans has risen steadily in recent years.
CD 413
_____________________________________________________________________________________________________________ Numbers in italics are based on a small number of observations and should be treated with caution. 1 Ranked out of 50 community districts with sufficient single family home sales. 2 Ranked out of 13 community districts with the same predominant housing type (single family homes).
Rank (2002)
Population (2000): 196,284 7
Racial Diversity Index: 0.79 16
Median Household Income: $50,000 7
Median Monthly Rent: $900 15
Median Price/Unit (2-4 fam.): $193,750 29
Median Price/Unit (1 fam.): $349,000 28
Rank (2004/5)
-
20
13
21
37
341
Income Diversity Ratio: 5.0 55 40
100

2002 2003 2004 2005 Rank (2002)
Rank (2004/5)
$45,973 - - $35,000 19 30 Median Household Income (in 2004 dollars)
12.7% - - 17.2% 37 25 Poverty Rate
21.0% - - 26.6% 43 36 % Immigrant Households
0.9% - - 2.8% 48 28 Rental Vacancy Rate
41,559 - - 41,373 53 53 Number of Housing Units
17.3% - - 19.0% 10 8 % Public Housing
50.9% - - 58.8% 31 22 % Rent-regulated/Other subsidized
177 331 440 529 25 10 Certificates of Occupancy
515 436 886 - 12 3 Units Authorized by New Residential Building Permits
42.0% - - 44.9% 15 13 Homeownership Rate
130.7 165.4 189.7 - 30 251 Index of Housing Price Appreciation (2-4 family building)
47.4 59.1 74.8 - 32 11 Home Purchase Loans (per 1,000 properties)
9.7% 12.1% 26.0% - 18 15 % Subprime Home Purchase Loans
89.9 114.5 80.9 - 16 15 Refinance Loan Rate (per 1,000 properties)
23.9% 26.6% 42.4% - 17 15 % Subprime Refinance Loans
15.3 15.3 18.8 - 23 20 Notices of Foreclosure (per 1,000 1-4 family properties)
3.7% 2.7% 2.1% - 21 20 % Tax Delinquencies (delinquent ≥ 1 year)
- 17.0% 16.6% 8.9% 3 7 % Vacant Land Area
34.7 32.4 34.8 - 23 26 Serious Housing Code Violations (per 1,000 rental units)
36.3% 37.5% 39.9% - 35 34 % Students Performing at Grade Level - Reading
33.4% 39.0% 46.8% - 35 34 % Students Performing at Grade Level - Math
22.6 20.3 17.9 - 50 53 Felony Crime Rate (per 1,000 residents)
CD 414 has been the location of two recent rezoning efforts. The Bayswater/Far Rockaway proposal, which was approved on April 26, 2006, covers roughly 82 blocks. The Far Rockaway and Mott Creek initiative, approved in September 2005, rezoned 21 blocks. Both rezonings seek to preserve the existing, low density neighborhood character.
CD 414 has seen a drop in the percentage of vacant land from 2002 to 2005. A large number of units authorized by new residential building permits and certificates of occupancy issued make CD 414 one of the busiest neighborhoods for new residential construction in the City. The homeownership rate increased at the 4th highest rate in the City, while real median household income decreased by the 2nd highest dollar amount from 2002 to 2005.
CD 414
_____________________________________________________________________________________________________________ Numbers in italics are based on a small number of observations and should be treated with caution. 1 Ranked out of 34 community districts with the same predominant housing type (2-4 family buildings).
Rank (2002)
Population (2000): 106,686 43
Racial Diversity Index: 0.88 13
Median Household Income: $35,000 19
Median Monthly Rent: $800 32
Median Price/Unit (2-4 fam.): $172,633 43
Median Price/Unit (1 fam.): $317,500 37
Rank (2004/5)
-
10
30
38
44
36
Income Diversity Ratio: 6.5 51 10
R O C K A W A Y / B R O A D C H A N N E L
101 | THE FU
RMA
N C
ENTER FO
R REAL ESTA
TE & U
RBAN
POLIC
Y

S T A T E N I S L A N D
St. George/Stapleton 501 106
South Beach/Willowbrook 502 107
Tottenville/Great Kills 503 108
CD Page
103 | THE FU
RMA
N C
ENTER FO
R REAL ESTA
TE & U
RBAN
POLIC
Y

Staten Island, the least populous of the five boroughs, leads the City in a variety of housing and neighborhood indicators. Homeownership in Staten Island far outstrips the rest of the City; 67.7% of its housing units are owner-occupied. Similarly, the borough consistently leads the City in mortgage lending activity. Although Staten Island has lower rates of subprime lending than all other boroughs except Manhattan, its rates of subprime lending for
2002 2003 2004 2005 (2002) (2004/5)
Housing Stock and Land Use
Number of Housing Units 167,932 - - 173,830 5 5
Rental Vacancy Rate 2.4% - - 4.7% 4 1
% Public Housing 5.8% - - 4.9% 4 4
% Rent-Regulated/Other subsidized 24.3% - - 23.1% 5 5
Certificates of Occupancy 2,453 2,270 3,333 2,259 2 4
Units Authorized by New Residential Building Permits 1,762 2,506 1,597 - 5 5
Homeownership Rate 64.6% - - 67.7% 1 1
% Vacant Land Area - 18.1% 18.0% 16.6% 1 1
Housing Quality
Serious Housing Code Violations (per 1,000 rental units) 12.7 22.2 17.9 - 5 5
% Tax Delinquencies (delinquent ≥ 1 year) 1.9% 1.3% 0.9% - 5 5
% Severe Crowding - All renter households 3.5% - - 3.7% 4 3
% Severe Crowding - Unsubsidized low income renters 4.3% - - 5.8% 5 1
Housing Prices and Affordability
Index of Housing Price Appreciation (1 family building) 142.1 150.1 178.2 - 2 4
Median Monthly Rent (unsubsidized units, 2005 dollars) $803 - - $850 3 3
Median Price Per Unit (2-4 fam. bldg., 2004 dollars) $186,327 $161,951 $202,500 - 2 4
Median Price Per Unit (1 fam. bldg., 2004 dollars) $290,858 $292,590 $339,690 - 2 4
Median Rent Burden - All renter households 27.7% - - 28.8% 3 5
Median Rent Burden - Unsubsidized low income renters 45.0% - - 48.8% 3 4
S T A T E N I S L A N D Rank
(2002)
Population: 464,573 5
Racial Diversity Index: 0.59 5
Median Household Income: $60,000 1
Median Monthly Rent: $850 3
Median Price/Unit (2-4 fam.): $202,500 2
Median Price/Unit (1 fam.): $339,690 2
Rank (2004/5)
5
5
1
3
4
4
Income Diversity Ratio: 4.9 4 4
Rank Rank
104

both home purchase and refinance nearly doubled between 2002 and 2004. Housing prices in Staten Island generally have increased in recent years, but at a lower rate than other boroughs. In 2004, Staten Island was ranked 4th citywide in the index of housing price appreciation for single-family homes, and median prices for single family homes were fourth of the five boroughs. The most recent New York City Housing and Vacancy Survey paints a mixed picture for Staten Island renters – although the borough has the City’s lowest average rent burden, low-income renters in unsubsidized units have a higher rate of severe crowding than in any other borough. Serious housing code violations are scarce in Staten Island, with only 17.9 violations per 1,000 rental units, the lowest rate in New York City. Staten Island also has the City’s lowest rate of tax delinquencies. Despite having the highest percentage of vacant land in the City by a significant margin, new construction appears to be relatively rare in Staten Island. The number of units authorized by new residential building permits in Staten Island in 2005 was 1,597, only 8% of the citywide total and less than half the number of such units authorized in the Bronx, the next lowest ranked borough in this category.
In recent years, Staten Island consistently has had the City’s highest median household income and lowest poverty rate. Elementary school performance in 2004 was ranked first in both reading and math, with over 50% of children performing at or above grade level. At 16 felonies per 1,000 residents, Staten Island has the lowest incidence of crime in the City. The borough is probably the City’s most homogenous. With a racial diversity index of 0.59, Staten Island is the City’s least racially diverse borough, and it is nearly the least economically diverse as well – second only to Queens. Much of Staten Island has been rezoned in recent years in order to prevent higher density development. In 2004, the City designated the entire borough a Lower Density Growth Management Area, and since then the Staten Island Growth Management Task Force has worked to expand regulations affecting residential and commercial development. A proposed NASCAR racetrack has stirred considerable disagreement. Also on the drawing board is a proposal to redevelop the former Fresh Kills landfill into a 2,200 acre public park.
Lending Indicators
Home Purchase Loans (per 1,000 properties) 70.9 67.9 76.4 - 1 1
% Subprime Home Purchase Loans 6.7% 10.7% 13.8% - 4 4
Home Purchase Loan Approval Rate 87.1% 85.7% 82.2% - 2 2
Refinance Loan Rate (per 1,000 properties) 115.6 176.4 88.4 - 1 1
% Subprime Refinance Loans 15.9% 16.2% 30.0% - 4 4
Notices of Foreclosure (per 1,000 1-4 family properties) N/A N/A N/A - N/A N/A
Social, Demographic, and Income Indicators
Population 455,712 460,333 462,695 464,573 5 5
Racial Diversity Index 0.56 - - 0.59 5 5
% Immigrant Households 15.9% - - 17.7% 5 5
% Asian (inc. Hawaiian and Pacific Islander) Households 5.2% - - 5.6% 4 4
% Black (including Hispanic) Households 7.5% - - 7.6% 5 5
% Hispanic (non-Black) Households 12.1% - - 14.2% 5 5
% White (non-Hispanic) Households 74.8% - - 72.5% 1 1
% Native American Households 0.4% - - 0.0% 1 5
Median Household Income (in 2004 dollars) $58,014 - - $60,000 1 1
Income Diversity Ratio 5.1 - - 4.9 4 4
Poverty Rate 11.0% - - 8.4% 5 5
Unemployment Rate 6.8% - - - 5 -
% Students Performing at Grade Level - Reading 53.3% 54.1% 54.1% - 1 1
% Students Performing at Grade Level - Math 46.7% 53.0% 56.7% - 1 1
Felony Crime Rate (per 1,000 residents) 17.5 15.6 16.0 - 5 5
2002 2003 2004 2005 (2002) (2004/5) Rank Rank
105 | THE FU
RMA
N C
ENTER FO
R REAL ESTA
TE & U
RBAN
POLIC
Y

2002 2003 2004 2005 Rank (2002)
Rank (2004/5)
Median Household Income (in 2004 dollars) $54,730 - - $52,500 9 11
Poverty Rate 14.8% - - 8.8% 30 47
% Immigrant Households 18.3% - - 20.3% 45 44
Rental Vacancy Rate 3.1% - - 8.8% 23 1
Number of Housing Units 62,051 - - 60,467 16 18
% Public Housing 10.4% - - 8.1% 19 24
% Rent-Regulated/Other subsidized 40.0% - - 35.4% 42 44
Certificates of Occupancy 524 614 1,212 918 9 2
Units Authorized by New Residential Building Permits 582 1,117 531 - 9 10
Homeownership Rate 57.9% - - 58.1% 8 9
Index of Housing Price Appreciation (1 family building) 137.9 140.7 173.7 - 8 122
Home Purchase Loans (per 1,000 properties) 68.8 70.6 85.6 - 13 6
% Subprime Home Purchase Loans 7.2% 12.3% 19.6% - 28 24
Refinance Loan Rate (per 1,000 properties) 99.4 159.2 97.3 - 8 10
% Subprime Refinance Loans 20.3% 21.1% 37.0% - 23 20
Notices of Foreclosure (per 1,000 1-4 family properties) N/A N/A N/A - N/A N/A
% Tax Delinquencies (delinquent ≥ 1 year) 2.7% 1.9% 1.3% - 29 30
% Vacant Land Area - 12.6% 12.4% 9.5% 5 5
Serious Housing Code Violations (per 1,000 rental units) 19.9 26.4 36.8 - 37 25
% Students Performing at Grade Level - Reading 53.3% 54.1% 54.1% - 11 12
% Students Performing at Grade Level - Math 46.7% 53.0% 56.7% - 16 16
Felony Crime Rate (per 1,000 residents) 22.4 19.3 19.7 - 51 50
A NASCAR racetrack has been proposed for a former oil tank facility in Bloomfield, Staten Island. The proposal, which has stirred controversy over its scale and potential impact on traffic and quality of life, includes not only the racetrack but also thousands of housing units and a large retail complex.
St. George/Stapleton had one of the highest rates of home purchase loans in the five boroughs in 2004, with 85.6 per 1,000 properties. The percent of home purchase loans that are subprime more than doubled since 2002. The rental vacancy rate has almost tripled since 2002, as certificates of occupancy increase significantly. CD 501 had one of the lowest crime rates in the City in 2004, with 19.7 felonies per 1,000 residents.
CD 501
______________________________________________________________________________________________________________ Numbers in italics are based on a small number of observations and should be treated with caution. 1 Ranked out of 50 community districts with sufficient single family home sales. 2 Ranked out of 13 community districts with the same predominant housing type (single family homes).
Rank (2002)
Population (2000): 162,609 19
Racial Diversity Index: 0.87 13
Median Household Income: $52,500 9
Median Monthly Rent: $900 20
Median Price/Unit (2-4 fam.): $174,975 41
Median Price/Unit (1 fam.): $283,460 34
Rank (2004/5)
-
12
11
21
43
421
Income Diversity Ratio: 4.9 28 41
S T . G E O R G E / S T A P L E T O N
106
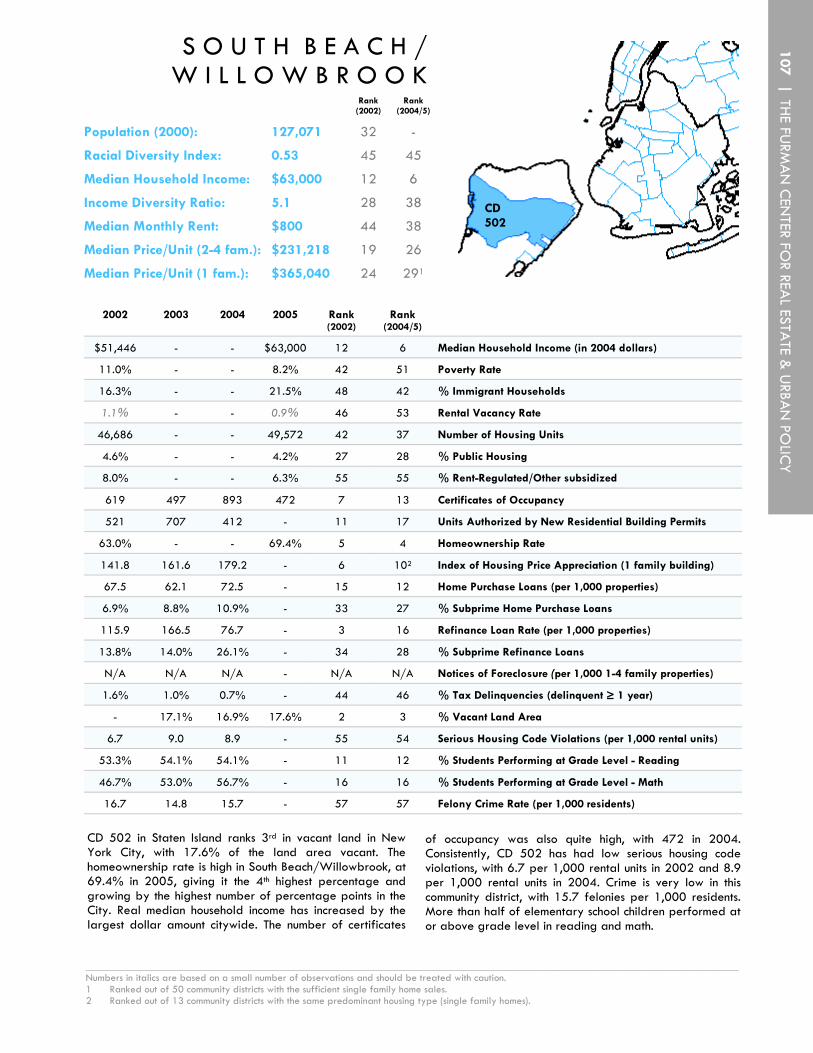
S O U T H B E A C H / W I L L O W B R O O K
2002 2003 2004 2005 Rank (2002)
Rank (2004/5)
$51,446 - - $63,000 12 6 Median Household Income (in 2004 dollars)
11.0% - - 8.2% 42 51 Poverty Rate
16.3% - - 21.5% 48 42 % Immigrant Households
1.1% - - 0.9% 46 53 Rental Vacancy Rate
46,686 - - 49,572 42 37 Number of Housing Units
4.6% - - 4.2% 27 28 % Public Housing
8.0% - - 6.3% 55 55 % Rent-Regulated/Other subsidized
619 497 893 472 7 13 Certificates of Occupancy
521 707 412 - 11 17 Units Authorized by New Residential Building Permits
63.0% - - 69.4% 5 4 Homeownership Rate
141.8 161.6 179.2 - 6 102 Index of Housing Price Appreciation (1 family building)
67.5 62.1 72.5 - 15 12 Home Purchase Loans (per 1,000 properties)
6.9% 8.8% 10.9% - 33 27 % Subprime Home Purchase Loans
115.9 166.5 76.7 - 3 16 Refinance Loan Rate (per 1,000 properties)
13.8% 14.0% 26.1% - 34 28 % Subprime Refinance Loans
N/A N/A N/A - N/A N/A Notices of Foreclosure (per 1,000 1-4 family properties)
1.6% 1.0% 0.7% - 44 46 % Tax Delinquencies (delinquent ≥ 1 year)
- 17.1% 16.9% 17.6% 2 3 % Vacant Land Area
6.7 9.0 8.9 - 55 54 Serious Housing Code Violations (per 1,000 rental units)
53.3% 54.1% 54.1% - 11 12 % Students Performing at Grade Level - Reading
46.7% 53.0% 56.7% - 16 16 % Students Performing at Grade Level - Math
16.7 14.8 15.7 - 57 57 Felony Crime Rate (per 1,000 residents)
CD 502 in Staten Island ranks 3rd in vacant land in New York City, with 17.6% of the land area vacant. The homeownership rate is high in South Beach/Willowbrook, at 69.4% in 2005, giving it the 4th highest percentage and growing by the highest number of percentage points in the City. Real median household income has increased by the largest dollar amount citywide. The number of certificates
of occupancy was also quite high, with 472 in 2004. Consistently, CD 502 has had low serious housing code violations, with 6.7 per 1,000 rental units in 2002 and 8.9 per 1,000 rental units in 2004. Crime is very low in this community district, with 15.7 felonies per 1,000 residents. More than half of elementary school children performed at or above grade level in reading and math.
CD 502
_____________________________________________________________________________________________________________ Numbers in italics are based on a small number of observations and should be treated with caution. 1 Ranked out of 50 community districts with the sufficient single family home sales. 2 Ranked out of 13 community districts with the same predominant housing type (single family homes).
Rank (2002)
Population (2000): 127,071 32
Racial Diversity Index: 0.53 45
Median Household Income: $63,000 12
Median Monthly Rent: $800 44
Median Price/Unit (2-4 fam.): $231,218 19
Median Price/Unit (1 fam.): $365,040 24
Rank (2004/5)
-
45
6
38
26
291
Income Diversity Ratio: 5.1 28 38
107 | THE FU
RMA
N C
ENTER FO
R REAL ESTA
TE & U
RBAN
POLIC
Y

2002 2003 2004 2005 Rank (2002)
Rank (2004/5)
Median Household Income (in 2004 dollars) $65,676 - - $65,000 5 5
Poverty Rate 7.2% - - 8.3% 52 50
% Immigrant Households 13.1% - - 12.3% 53 52
Rental Vacancy Rate 2.8% - - 1.2% 26 51
Number of Housing Units 59,195 - - 63,791 19 17
% Public Housing 0.0% - - 0.0% 38 38
% Rent-Regulated/Other subsidized 17.5% - - 18.2% 52 51
Certificates of Occupancy 1,310 1,159 1,228 869 2 3
Units Authorized by New Residential Building Permits 592 635 654 - 8 8
Homeownership Rate 72.5% - - 75.2% 2 1
Index of Housing Price Appreciation (1 family building) 144.6 165.6 180.5 - 3 92
Home Purchase Loans (per 1,000 properties) 79.6 70.4 71.5 - 5 15
% Subprime Home Purchase Loans 5.7% 10.6% 9.9% - 38 28
Refinance Loan Rate (per 1,000 properties) 146.1 200.0 90.0 - 1 12
% Subprime Refinance Loans 12.3% 14.2% 25.8% - 38 29
Notices of Foreclosure (per 1,000 1-4 family properties) N/A N/A N/A - N/A N/A
% Tax Delinquencies (delinquent ≥ 1 year) 1.4% 1.0% 1.6% - 50 24
% Vacant Land Area - 22.6% 22.6% 20.4% 1 1
Serious Housing Code Violations (per 1,000 rental units) 4.1 10.2 6.7 - 59 56
% Students Performing at Grade Level - Reading 53.3% 54.1% 54.1% - 11 12
% Students Performing at Grade Level - Math 46.7% 53.0% 56.7% - 16 16
Felony Crime Rate (per 1,000 residents) 13.1 12.2 12.3 - 59 59
The City is developing a master plan for the Fresh Kills area of CD 503, which will address new uses for the former landfill over time. CD 503 has the 3rd most certificates of occupancy issued citywide. The homeownership rate is 75.2%, the highest among all community districts. It also ranks the highest in vacant land, with 20.4% of the land area vacant. Although
the rate of housing code violations rose slightly from 4.1 to 6.7 per 1,000 rental units, it ranks 56th citywide for housing violations. This CD ranks the lowest in racial diversity and is among the lowest in percentage of immigrant households. The poverty rate is also one of the lowest in the City, and the median household income is among the top five citywide.
CD 503
_____________________________________________________________________________________________________________ Numbers in italics are based on a small number of observations and should be treated with caution. 1 Ranked out of 50 community districts with sufficient single family home sales. 2 Ranked out of 13 community districts with the same predominant housing type (single family homes).
Rank (2002)
Population (2000): 152,908 22
Racial Diversity Index: 0.26 54
Median Household Income: $60,000 5
Median Monthly Rent: $750 22
Median Price/Unit (2-4 fam.): $262,500 11
Median Price/Unit (1 fam.): $385,000 23
Rank (2004/5)
-
55
5
48
15
261
Income Diversity Ratio: 4.9 46 42
T O T T E N V I L L E / G R E A T K I L L S
108


A P P E N D I X
New York City Housing and Vacancy Survey (HVS) The HVS is conducted every two to three years by the U.S. Census Bureau under contract with the City of New York. The New York City Department of Housing Preservation and Development (HPD) sponsors and supervises the HVS. The primary purpose of the HVS is to satisfy the City’s statutory requirement to measure the rental vacancy rate in order to determine if rent regulations should be continued. In addition to the housing unit and household information, a limited set of data is also collected regarding each person in the household. Because the HVS is a sample survey, not a Census, all data derived from the HVS are estimates, not exact counts. The sample for the HVS is designed primarily to achieve acceptable reliability in estimating the ‘vacant available for rent’ rate for the entire City, so estimates for smaller geographic units, such as sub-borough areas, are subject to potentially large sampling errors. This report uses the convention established by HPD in cautioning the reader about any estimates that are based on 2,000 or fewer weighted observations. Readers should treat these estimates with some skepticism and be aware that the true value may differ significantly from the reported estimate. When reporting median income, all dollar amounts are adjusted to 2004 dollars, the most recent year for which income data exists from the Housing and Vacancy Survey. When reporting median rent, all dollars amounts are adjusted to 2005 dollars. This allows for more consistent comparisons across years for individual indicators. Indices of Housing Price Appreciation These indices, also called the repeat sales indices, are a relative measure of changes in property values over time. The indices have been constructed for four different property types (condominiums, single-family homes, 2 to 4 family homes, and 5+ unit apartment buildings) for New York City as a whole and for each borough. Due to insufficient data, the price indices have been created only for the most representative building type at the community district level. Estimating price indices separately for different types of properties allows for different market valuations and fluctuations within each property type. The primary data set used to construct the price index was obtained under an exclusive arrangement with the New York City Department of Finance. This data set contains information on address, price, and date of sale for all transactions involving sales of apartment buildings,
condominium apartments and single family homes in New York City between 1974 and 2004. A total of roughly 200,000 pairs of sales were used in the estimation. The repeat sales price indices are created using statistical regression techniques. There are two basic approaches that are used by economists to estimate housing price indices: the hedonic regression and the repeat sales method. Both of these approaches estimate the temporal price movement controlling for the variation in the types of homes sold over time. Each method has its own strengths and weaknesses. The repeat-sales methodology controls for hedonic characteristics by using data on properties that have sold more than once. An attractive feature of this method is that, unlike the hedonic approach, it does not require the measurement of house quality; it only requires time invariance of the quality of individual houses in the sample. The most important drawback of the repeat sales method is that it fails to use the full information available in the data. In most data sets, only a small proportion of the housing stock is sold more than once, and none of the data on single sales can be used. Moreover, properties that transact more than once may not be representative of all properties in the market, raising concerns about sample selection bias. As the index period lengthens, more houses fit the multiple sales category. This attenuates sample selection bias but exacerbates a heteroskedasticity problem; Case and Schiller (1989) show evidence that price change variability is positively related to the interval of time between sales. This report uses the repeat sales method to estimate price indices. Most of the problems associated with this method are overcome in this report. Specifically, the data set used here is quite large, so that we lose little precision by eliminating observations (properties that sold only once). Moreover, the time period of 30 years is long enough that we capture a fairly large proportion of the housing stock. Finally, we use the three-step procedure suggested by Case and Schiller (1989) and modified by Quigley and Van Order (1995) to account for the possibility of time-dependent error variances. In the first stage, the log price per unit of the second sale minus the log price per unit of the first sale is regressed on a set of dummy variables, one for each time period (year, in this case) in the sample except for the first. The dummy variables have values of +1 for the year of the second sale, -1 for the year of the first sale, and zeros otherwise.
M e t h o d s
110

In the second stage, the squared residuals from the first stage are regressed on a constant term, the time interval between sales, and the time interval squared. The fitted value in the stage-two regression is a consistent estimate of the error variance in the stage-one regression. In the third stage, the stage-one regression is re-estimated by generalized least squares, using as weights the inverse of the square root of the fitted values in the stage-two regression.
Case, K.E. and R.J. Schiller, 1989. “The Efficiency of the Market for Single Family Homes.” American Economic Review, 79, p.125-37. Goodman, A.C. and J.L. Goodman, Jr., 1997. “The Co- op Discount.” Journal of Real Estate Finance and Economics, 14(1-2), p.223-33. Quigley, J.M. and R. Van Order, 1995. “Explicit Tests of Contingent Claims Models of Mortgage Default.” Journal of Real Estate Finance and Economics, 11(2), p.99-117. Racial Diversity Index The Furman Center calculates the racial diversity index by measuring the probability that two randomly chosen heads of households in a given neighborhood will be of a different race. Using the categories of Asian/Pacific Islander, Black (including Hispanic), Hispanic (non-Black), White (non-Hispanic), and Native American, the raw index varies from 0 (minimum diversity) to 0.75 (maximum diversity). The data are then normalized so the maximum value is 1. A higher number indicates a more racially diverse neighborhood. Because person-level data is unavailable from the 2005 HVS, the racial diversity index and the percentage breakdowns of each race/ethnicity are calculated based on the race or ethnicity of the head of household rather than each individual in the home. Heads of household reporting more than one race are excluded from this calculation.
PAsian (inc. Hawaiian and Pacific Islander)2 + PBlack (inc.
Hispanic)2 + PHispanic2 + PNat. Am.2+ PWhite2 = Psame
race
1 - Psame race = Pdifferent races Income Diversity Ratio The Furman Center calculates the income diversity ratio for each sub-borough area and borough, as well as the City, by dividing the 80th percentile income by the 20th percentile income in each geographic area. For example, if the 20th percentile income is $15,000 and the 80th percentile income is $75,000, then the income diversity ratio is 5. A higher number indicates a broader range of incomes in a given area.
Crime and Education Data Weighting Utilizing tax lots and residential unit counts from the City’s PLUTO dataset, the Furman Center calculates the relative weight of each school district and police precinct by community district. This allows for easier comparison of data through a common geography.
111 | THE FU
RMA
N C
ENTER FO
R REAL ESTA
TE & U
RBAN
POLIC
Y


I N D E X O F C O M M U N I T Y D I S T R I C T S
B R O N X 34 Mott Haven/Melrose 101
35 Hunts Point/Longwood 102
36 Morrisania/Crotona 103
37 Highbridge/Concourse 104
38 Fordham/University Heights 105
39 Belmont/East Tremont 106
40 Kingsbridge Heights/Bedford 107
41 Riverdale/Fieldston 108
42 Parkchester/Soundview 109
43 Throgs Neck/Co-op City 110
44 Morris Park/Bronxdale 111
45 Williamsbridge/Baychester 112
B R O O K L Y N 50 Greenpoint/Williamsburg 201
51 Fort Greene/Brooklyn Heights 202
52 Bedford Stuyvesant 203
53 Bushwick 204
54 East New York/Starrett City 205
55 Park Slope/Carroll Gardens 206
56 Sunset Park 207
57 Crown Heights 208
58 South Crown Heights/Prospect Hts. 209
59 Bay Ridge/Dyker Heights 210
60 Bensonhurst 211
61 Borough Park 212
62 Coney Island 213
63 Flatbush/Midwood 214
64 Sheepshead Bay 215
65 Brownsville 216
66 East Flatbush 217
67 Flatlands/Canarsie 218
Q U E E N S 88 Astoria 401
89 Woodside/Sunnyside 402
90 Jackson Heights 403
91 Elmhurst/Corona 404
92 Ridgewood/Maspeth 405
93 Rego Park/Forest Hills 406
94 Flushing/Whitestone 407
95 Hillcrest/Fresh Meadows 408
96 Ozone Park/Woodhaven 409
97 S. Ozone Park/Howard Beach 410
98 Bayside/Little Neck 411
99 Jamaica/Hollis 412
100 Queens Village 413
101 Rockaway/Broad Channel 414
S T A T E N I S L A N D 106 St. George/Stapleton 501
107 South Beach/Willowbrook 502
108 Tottenville/Great Kills 503
M A N H A T T A N 72 Financial District 301
73 Greenwich Village/Soho 302
74 Lower East Side/Chinatown 303
75 Clinton/Chelsea 304
76 Midtown 305
77 Stuyvesant Town/Turtle Bay 306
78 Upper West Side 307
79 Upper East Side 308
80 Morningside Heights/Hamilton 309
81 Central Harlem 310
82 East Harlem 311
83 Washington Heights/Inwood 312
113 | THE FU
RMA
N C
ENTER FO
R REAL ESTA
TE & U
RBAN
POLIC
Y
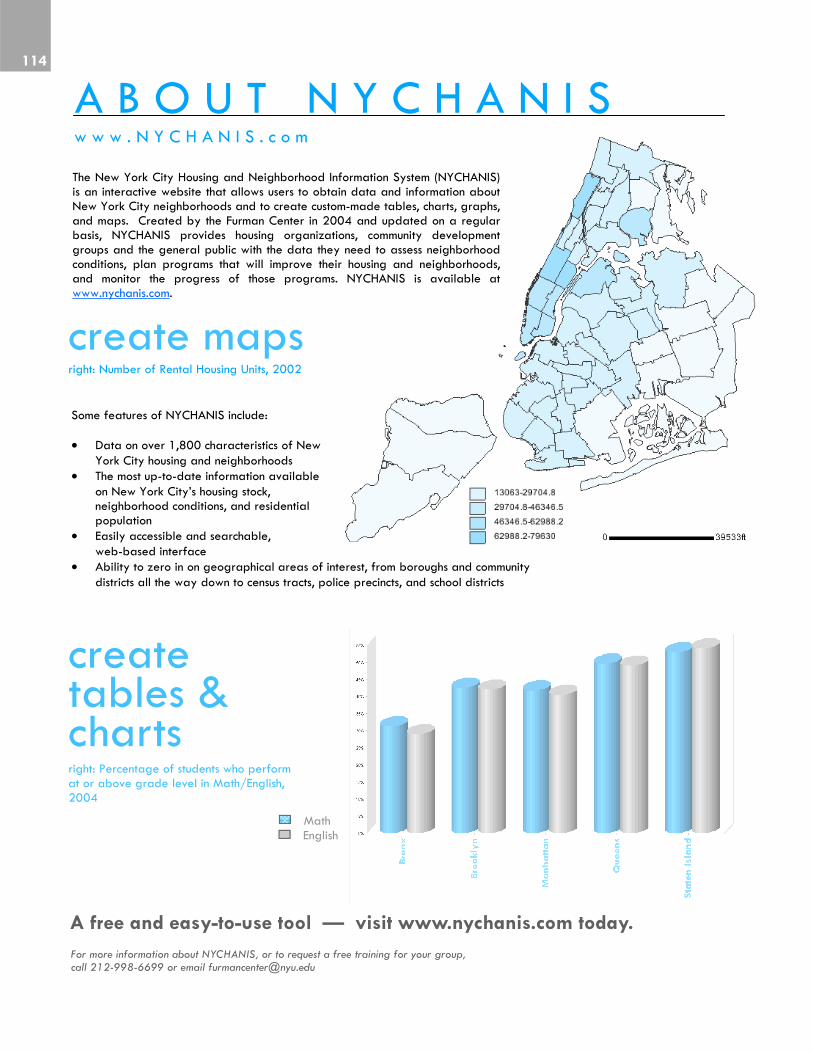
A B O U T N Y C H A N I S w w w . N Y C H A N I S . c o m
A free and easy-to-use tool — visit www.nychanis.com today.
Some features of NYCHANIS include: • Data on over 1,800 characteristics of New
York City housing and neighborhoods • The most up-to-date information available
on New York City’s housing stock, neighborhood conditions, and residential population
• Easily accessible and searchable, web-based interface
• Ability to zero in on geographical areas of interest, from boroughs and community districts all the way down to census tracts, police precincts, and school districts
For more information about NYCHANIS, or to request a free training for your group, call 212-998-6699 or email [email protected]
create tables & charts
right: Percentage of students who perform at or above grade level in Math/English, 2004
Math English
The New York City Housing and Neighborhood Information System (NYCHANIS) is an interactive website that allows users to obtain data and information about New York City neighborhoods and to create custom-made tables, charts, graphs, and maps. Created by the Furman Center in 2004 and updated on a regular basis, NYCHANIS provides housing organizations, community development groups and the general public with the data they need to assess neighborhood conditions, plan programs that will improve their housing and neighborhoods, and monitor the progress of those programs. NYCHANIS is available at www.nychanis.com.
create maps right: Number of Rental Housing Units, 2002
114
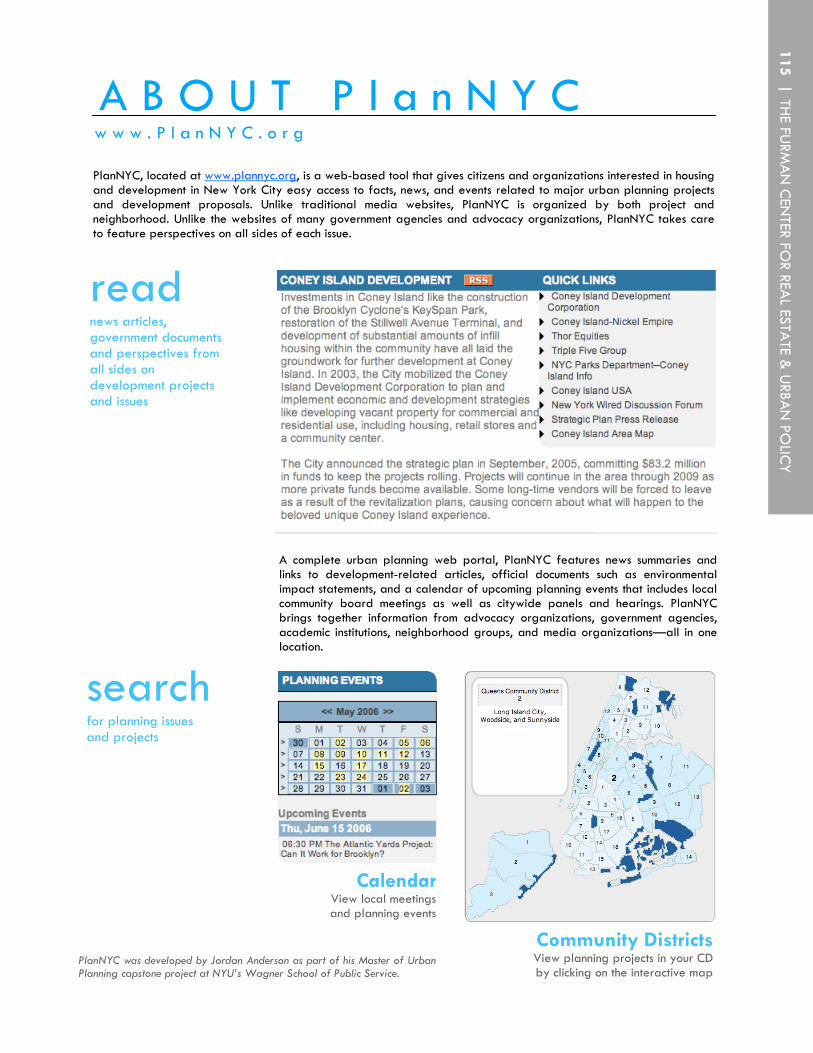
A B O U T P l a n N Y C PlanNYC, located at www.plannyc.org, is a web-based tool that gives citizens and organizations interested in housing and development in New York City easy access to facts, news, and events related to major urban planning projects and development proposals. Unlike traditional media websites, PlanNYC is organized by both project and neighborhood. Unlike the websites of many government agencies and advocacy organizations, PlanNYC takes care to feature perspectives on all sides of each issue.
search
for planning issues and projects
w w w . P l a n N Y C . o r g
PlanNYC was developed by Jordan Anderson as part of his Master of Urban Planning capstone project at NYU’s Wagner School of Public Service.
read
news articles, government documents and perspectives from all sides on development projects and issues
A complete urban planning web portal, PlanNYC features news summaries and links to development-related articles, official documents such as environmental impact statements, and a calendar of upcoming planning events that includes local community board meetings as well as citywide panels and hearings. PlanNYC brings together information from advocacy organizations, government agencies, academic institutions, neighborhood groups, and media organizations—all in one location.
Calendar View local meetings and planning events
Community Districts View planning projects in your CD by clicking on the interactive map
115 | THE FU
RMA
N C
ENTER FO
R REAL ESTA
TE & U
RBAN
POLIC
Y

A B O U T T H E F U R M A N C E N T E R
Since its founding in 1994, the Furman Center for Real Estate and Urban Policy has become the leading academic research center in New York City devoted to the public policy aspects of land use, real estate development and housing. The Furman Center is dedicated to the following three missions: Providing objective academic and empirical research on the legal and public policy issues involving land use, real estate, housing and urban affairs in the United States, with a particular focus on New York City. At present, our research focuses particularly on measuring the impacts public and private investments such as housing, schools, amenities and changes in services have on neighborhood property values and other measures of neighborhood quality; Promoting frank and productive discussions among elected and appointed officials, leaders of the real estate industry, leaders of non-profit housing and community development organizations, scholars, faculty and students about critical issues in land use, real estate and urban policy; Presenting essential data and analysis about the state of New York City’s housing and neighborhoods to all those involved in land use, real estate development, community economic development, housing, urban economics and urban policy. For more information, please contact us at: Furman Center for Real Estate and Urban Policy New York University School of Law 40 Washington Square South, Suite 314-H New York, NY 10012-1099 Telephone: 212-998-6713, Fax: 212-995-4341 Web: http://furmancenter.nyu.edu Email: [email protected]
116
Ronald Moelis Principal
L & M Equity Participants, Ltd.
Herbert S. Podell Senior Partner
Podell, Schwartz, Schechter & Banfield LLP
Alan Pomerantz Partner
Weil, Gotshal & Manges LLP
Stephen Ross Chairman and Chief Executive Officer
The Related Companies
Mitchell B. Rutter President
Essex Capital Partners, Ltd.
Larry A. Silverstein President
Silverstein Properties
Carl Weisbrod Executive Vice President
Trinity Real Estate
Mark Willis Executive Vice President JPMorgan Chase & Co.
Leonard Boxer Chair, Real Estate Department Stroock & Stroock & Lavan
Sheri Chromow
Partner Katten Muchin Rosenman LLP
Jay Furman
Principal RD Management LLC
Sarah Gerecke
Chief Executive Director Neighborhood Housing Services
of New York City
Adam Glick President
Jack Parker Corporation
Bernell Grier Chief Operating Officer
Neighborhood Housing Services of New York City
Joseph Lesser
President Loeb Partners Realty
Jonathan Mechanic
Chair, Real Estate Department Fried, Frank, Harris, Shriver & Jacobson LLP
THE FU
RMA
N C
ENTER FO
R REAL ESTATE &
URBA
N PO
LICY
The Furman Center would like to thank the following people,
whose leadership, advice, and support is invaluable:
John Sexton, President, New York University Ricky Revesz, Dean, School of Law, New York University
Ellen Schall, Dean, Robert F. Wagner School of Public Service, New York University
& O u r B o a r d o f A d v i s o r s
Related Documents