EVALUATION OF FATIGUE CRACKING IN 1-65 MOBILE DELTA CROSSING BRIDGES Volume IV: Executive Summary Project Number ST 2019-16 by J. Michael Stallings Thomas E. Cousins sponsored by The State of Alabama Highway Department Montgomery, Alabama December 1993

Welcome message from author
This document is posted to help you gain knowledge. Please leave a comment to let me know what you think about it! Share it to your friends and learn new things together.
Transcript

EVALUATION OF FATIGUE CRACKING IN 1-65 MOBILE DELTA CROSSING BRIDGES
Volume IV: Executive Summary Project Number ST 2019-16
by
J. Michael Stallings Thomas E. Cousins
sponsored by
The State of Alabama Highway Department Montgomery, Alabama
December 1993

ACKNOWLEDGEMENT
The material contained herein was obtained in connection with a research project,
"Evaluation of Fatigue Cracking in 1-65 Mobile Delta Crossing Bridges" (ST-2019-16),
conducted by the Highway Research Center at Auburn University. The research project was
sponsored by the State of Alabama Highway Department. The traffic control, test load vehicles,
bridge inspection vehicles and operators were provided by the Alabama Highway Department's
Ninth Division and Maintenance Bureau. The interest, cooperation, and assistance of many
personnel from the Alabama Highway Department is gratefully acknowledged. The assistance of
graduate students Bradley P. Christopher, Charles B. Reid, Richard K. Rotto, and Scott K.
Rutland during the instrumentation. field testing. data reduction, and report preparation portions of
this project is also gratefully acknowledged.
DISCLAIMER
The contents of this report reflect the views of the authors who are responsible for the
facts and accuracy of the data presented herein. The contents do not necessarily reflect the
o'fficial views or policies of the State of Alabama Highway Department or Auburn University. The
report does not constitute a standard, specification, or regulation.
~~----...... --.. ----- --....... ---~

ABSTRACT
The 1-65 Mobile Delta Crossing Bridges constitute a six mile section (northbound and
southbound) of interstate highway over the Mobile River delta plains located approximately 20
miles north of Mobile, Alabama. The bridges consist of precast concrete spans, steel plate
girder spans, and twin steel tied arch spans. In 1990 and 1991, Alabama Highway
Department bridge inspectors discovered fatigue cracks at connections of floorbeams and
floortrusses to the plate girders. The fatigue cracks were found to be the result of out-of-plane
distortion of the girder web. Field measurements of the fatigue stresses at the connections
were made before and after various repairs were perform to evaluate the effectiveness of the
repairs. Bridge inspectors also found cracked (failed) welds at filler plates between the
double angles of the floortruss members along the tied arch spans. These cracks were found
to result from impacted rust between the filler plates and the angles .. Field measurements of
the traffic loading stresses were made, and the potential for future fatigue cracking at the filler
plate welds was evaluated. Recommendations for repair and maintenance of the bridges
were made.
This volume is the fourth in a series. The other volumes in the series are:
EVALUATION OF FATIGUE CRACKING IN 1-65 MOBILE DELTA CROSSING BRIDGES, Volume I: Floorbeam-Girder Connections
EVALUATION OF FATIGUE CRACKING IN 1-65 MOBILE DELTA CROSSING BRIDGES, Volume II: Filler Plate Weld Cracks
EVALUATION OF FATIGUE CRACKING IN 1-65 MOBILE DELTA CROSSING BRIDGES, Volume III: Floortruss-Girder Connections
Volume I: Evaluation of Fatigue Cracking in 1-65 Mobile Delta Crossing Bridges - Floorbeam-Girder Connections
TABLE OF CONTENTS
Chapter 1 INTRODUCTION BACKGROUND BRIDGE DESCRIPTION LOCATIONS AND EXTENT OF CRACKING RIGID AlTACHMENT REPAIR PROJECT OBJECTIVES METHODOLOGY AND SCOPE OF REPORT
Chapter 2 LITERATURE REVIEW 12 FATIGUE CRACKING AT FLOORBEAM CONNECTION PLATES LABORATORY TESTS INSTRUMENTATION CYCLE COUNTING METHODS EFFECTIVE STRESS RANGE
Chapter 3 TEST LOCATIONS 33
Chapter 4 INSTRUMENTATION AND DATA ACQUISITION 42 WORKING ENVIRONMENT INSTRUMENTATION DATA ACQUISITION
Chapter 5 DATA COLLECTION AND REDUCTION 62 CALIBRATION TESTS RANDOM TRUCK TESTS DATA REDUCTION
Chapter 6 RESULTS AT PIER FLOORBEAM CONNECTIONS 77 BEHAVIOR AT TEST LOCATIONS WEB GAP STRESSES FROM STATIC TESTS EFFECTIVE STRESS RANGES FROM TRUCK TRAFFIC
Chapter 7 EVALUATION OF CRACKING AND REPAIR METHODS 104 CAUSE OF FATIGUE CRACK INITIATION ASSESSMENT OF HOLE DRILLING AS A REPAIR METHOD EFFECTIVENESS OF THE POSITIVE AlTACHMENT RETROFIT
Chapter 8 RESULTS AT FLOORBEAM CONNECTIONS AWAY FROM PIERS 132 RESULTS AT FLOORBEAM TWO RESULTS AT FLOORBEAM THREE
ii
Volume I: Evaluation of Fatigue Cracking in 1-65 Mobile Delta Crossing Bridges - Floorbeam-Girder Connections
TABLE OF CONTENTS (continued)
Chapter 9 CONCLUSIONS AND RECOMMENDATIONS SUMMARY AND CONCLUSIONS RECOMMENDATIONS
REFERENCES
APPENDICES A. S7-5 TABULATED RANDOM TRUCK HISTOGRAM DATA B. S7-9 TABULATED RANDOM TRUCK HISTOGRAM DATA C. S5-2 TABULATED RANDOM TRUCK HISTOGRAM DATA D. S7-12 TABULATED RANDOM TRUCK HISTOGRAM DATA
iii
151
155
158
Figure 1.
Figure 2.
Figure 3.
Figure 4.
Figure 5.
Figure 6.
Figure 7.
Figure 8.
Figure 9.
Figure 10.
Figure 11.
Figure 12.
Figure 13.
Figure 14.
Figure 15.
Figure 16.
Figure 17.
Figure 18.
Figure 19.
Volume I: Evaluation of Fatigue Cracking in 1-65 Mobile Delta Crossing Bridges - Floorbeam-Girder Connections
LIST OF FIGURES
Floorbeam-Girder Detail at a Girder Support
Illustration of Out-of-Plane Behavior in Web Gap Region (from Fisher et al. 1990)
Typical Crack Found at Floorbeam Connection Plate Details
Positive Attachment Retrofit Detail
Positive Attachment Retrofit Detail (Section B from Figure 4)
Out-of-Plane Bending Test Setup (from Fisher et al. 1979b)
Test Setup for Distortion-Induced Web Gap Fatigue Cracking (from Keating and Fisher 1987)
History of Web Gap Fatigue Cracking (from Keating and Fisher 1987)
Out-of-Plane Bending Test Setup for Third Series of Tests (from Fisher et al. 1990)
Defined Crack Length, ar (from Fisher et al. 1990)
Typical Web Gap Region Gage Arrangements
Illustration of Peak-to-Peak Method
Four Test Locations on Mobile Delta Crossing Bridges
Position of Test Piers on the Continuous Spans
Cross-Section of Bridges Illustrating Transverse Floorbeams
Location of Web Gap Regions on Cross-Section
Typical Web Gap Region: (a) Elevation of Inside Face of Girder; (b) Section View
Work Platform
Reach-all Truck
iv
EAG.E
4
5
6
8
9
15
18
19
20
23
26
30
34
35
37
37
41
43
43

Figure 20.
Figure 21.
Figure 22.
Figure 23.
Figure 24.
Figure 25.
Figure 26.
Figure 27.
Figure 28.
Figure 29.
Figure 30.
Figure 31.
Figure 32.
Figure 33.
Figure 34.
Figure 35.
Volume I: Evaluation of Fatigue Cracking in 1-65 Mobile Delta Crossing Bridges - Floorbeam-Girder Connections
LIST OF FIGURES (continued)
Numbering and Locations of Strain Gages on Girder Web
Numbering and Modified Locations of Strain Gages on Girder Web
Numbering and Locations of In-Plane Bending Gages on Girder
Numbering and Locations of Strain Gages on Floorbeam and Stringers
LVDT Arrangement at Pier Floorbeam
LVDT Arrangement at First Floorbeam South of Pier
LVDT Arrangement at Second Floorbeam South of Pier
Environmental Chamber
Generator with Hangers Attached
Trucks Used for Calibration Tests: (a) Dump Truck; (b) Sand Spreader; (c) Lowboy
Test Lanes A, B, and C Used for Calibration Tests
Dump Truck Positions Over Floorbeams During Static Tests
Lowboy Positions Over Floorbeams During Static Tests
Typical Truck Crossing Record (400 Samples/sec)
Truck Crossing Shown in Figure 34 Compressed by Averaging Every 25 Scans
Bottom Flange Strain Measured on the Outside Girder at Pier (a) S7-5 for Lowboy in the Outside Lane at 60 mph, (b) S7-5 for Dump Truck in the Outside Lane at 58 mph, (c) S5-2 for Lowboy in the Outside Lane at 65 mph, (d) S5-2 for Dump Truck in the Outside Lane at 60 mph
v
46
46
48
48
56
57
57
60
60
67
67
70
70
75
75
79
Figure 36.
Figure 37.
Figure 38.
Figure 39.
Figure 40.
Figure 41.
Figure 42.
Figure 43.
Figure 44.
Figure 45.
Figure 46.
Figure 47.
Figure 48.
Volume I: Evaluation of Fatigue Cracking in 1-65 Mobile Delta Crossing Bridges - Floorbeam-Girder Connections
LIST OF FIGURES (continued)
Web Gap Displacement Measured on the Inside Girder at Pier (a) S7-5 for Lowboy in the Outside Lane at 60 mph, (b) 57-5 for Dump Truck in the Outside Lane at 58 mph, (c) S5-2 for Lowboy in the Outside Lane at 65 mph, (d) S5-2 for Dump Truck in the Outside Lane at 60 mph
Response of Gages IN 1 and IN2 on the Inside Girder at Pier S7-5 During Lowboy Crawl Pass in the Outside Lane
Response of Gages IN 1 and IN2 on the Inside Girder at Pier S7-5 During Lowboy Fast Pass in the Outside Lane
Response of Gages IN 1 and IN2 on the Inside Girder at Pier S7-9 During Lowboy Crawl Pass in the Outside Lane
Response of Gages IN 1 and IN2 on the Inside Girder at Pier S7-9 During Lowboy Fast Pass in the Outside Lane
Response of Gages ON1 and IS2 on the Inside Girder at Pier S7-12 During Lowboy Crawl Pass in the Outside Lane
Response of Gages ON1 and IS2 on the Inside Girder at Pier S7-12 During Lowboy Fast Pass in the Outside Lane
Static Stress Distribution on Outside Girder at Pier S7-5 (84 in. Girder) Before Retrofit with Dump Truck in Outside Lane (Worst Case)
Static Stress Distribution on Inside Girder at Pier S7-5 (84 in. Girder) Before Retrofit with Dump Truck in Outside Lane (Worst Case)
Static Stress Distribution on Outside Girder at Pier S5-2 (84 in. Girder) Before Retrofit with Dump Truck in Outside Lane (Worst Case)
Static Stress Distribution on Inside Girder at Pier S7-12 (96 in. Girder) Before Retrofit with Dump Truck in Outside Lane (Worst Case)
Static Stress Distribution on Outside Girder Pier S7-9 (96 in. Girder) Before Retrofit with Lowboy in Outside Lane (Worst Case)
Static Stress Distribution on Inside Girder of Pier S7-9 (96 in. Girder) Before Retrofit with Lowboy in Outside Lane (Worst Case)
vi
81
84
84
85
85
86
86
88
88
89
89
90
90

Figure 49.
Figure 50.
Figure 51.
Figure 52.
Figure 53.
Figure 54.
Figure 55.
Figure 56.
Figure 57.
Figure 58.
Figure 59.
Figure 60.
Figure 61.
Figure 62.
Volume I: Evaluation of Fatigue Cracking in 1-65 Mobile Delta Crossing Bridges - Floorbeam-Girder Connections
LIST OF FIGURES (continued)
Histogram of Extrapolated Random Data at the End of the Inside Connection Plate Weld on Outside Girder of Pier 87-5 Before Retrofit
Histogram of Extrapolated Random Data at the Inside Web-Flange Weld Toe on Outside Girder of Pier 87-5 Before Retrofit
Histogram of Extrapolated Random Data at the Outside Web-Flange Weld Toe on Outside Girder of Pier 87-5 Before Retrofit
Histogram of Extrapolated Random Data at the End of the Inside Connection Plate Weld on Inside Girder of Pier 87-5 Before Retrofit
Histogram of Extrapolated Random Data at the Inside Web-Flange Weld Toe on Inside Girder of Pier 87-5 Before Retrofit
Histogram of Extrapolated Random Data at the Outside Web-Flange Weld Toe on Inside Girder of Pier 87-5 Before Retrofit
Histogram of Extrapolated Random Data at the End of the Inside Connection Plate Weld on Outside Girder of Pier 85-2 Before Retrofit
Histogram of Extrapolated Random Data at the Inside Web-Flange Weld Toe on Outside Girder of Pier 85-2 Before Retrofit
Histogram of Extrapolated Random Data at the End of the Inside Connection Plate Weld on Outside Girder of Pier 87-9 Before Retrofit
Histogram of Extrapolated Random Truck at the Inside Web-Flange Weld Toe on Outside Girder of Pier 87-9 Before Retrofit
Histogram of Extrapolated Random Truck at the Outside Web-Flange Weld Toe on Outside Girder of Pier 87-9 Before Retrofit
Histogram of Extrapolated Random Data at the End of the Inside Connection Plate Weld on Inside Girder of Pier 87-9 Before Retrofit
Histogram of Extrapolated Random Truck at the Inside Web-Flange Weld Toe on Inside Girder of Pier 87-9 Before Retrofit
Histogram of Extrapolated Random Truck at the Outside Web-Flange Weld Toe on Inside Girder of Pier 87-9 Before Retrofit
vii
93
93
94
94
95
95
96
96
97
97
98
98
99
99
Figure 63.
Figure 64.
Figure 65.
Figure 66.
Figure 67.
Figure 68.
Figure 69.
Figure 70.
Figure 71.
Figure 72.
Figure 73.
Figure 74.
Figure 75.
Volume I: Evaluation of Fatigue Cracking in 1-65 Mobile Delta Crossing Bridges - Floorbeam-Girder Connections
LIST OF FIGURES (continued)
Histogram of Extrapolated Random Data at the End of the Inside Connection Plate Weld on Inside Girder of Pier S7 -12 Before Retrofit 100
Histogram of Extrapolated Random Truck at the Inside Web-Flange Weld Toe on Inside Girder of Pier S5-2 Before Retrofit 100
Fatigue Data Reported by Fisher et al. (1990) Illustrating the Fatigue Resistance of Connection Plate Details Subjected to Out-of-Plane Distortions 105
Static Stress Distribution on Outside Girder at Pier S7 -5 (84 in. Girder) After Retrofit with Dump Truck in Outside Lane (Worst Case) 110
Static Stress Distribution on Inside Girder at Pier S7-5 (84 in. Girder) After Retrofit with Dump Truck in Outside Lane (Worst Case) 110
Static Stress Distribution on Outside Girder at Pier S7-9 (96 in. Girder) After Retrofit with Dump Truck in Outside Lane (Worst Case) 111
Static Stress Distribution on Inside Girder of Pier S7-9 (96 in. Girder) After Retrofit with Dump Truck in Outside Lane (Worst Case) 111
Before and After Retrofit Strain Responses for Gage OS1 on the Outside Girder of Pier S7-5 for the Lowboy Fast Run in the Outside Lane 113
Before and After Retrofit Strain Responses for Gage IN1 on the Inside Girder of Pier S7-5 for the Lowboy Fast Run in the Inside Lane 113
Before and After Retrofit Strain Responses for Gage IN1 on the Outside Girder of Pier S7-9 for the Lowboy Fast Run in the Outside Lane 114
Before and After Retrofit Strain Responses for Gage IN 1 on the Inside Girder of Pier S7-9 for the Lowboy Fast Run in the Outside Lane 114
Histogram of Out-of-Plane Displacement of the Outside Girder Web Gap at Pier S7-5 Before Retrofit 119
Histogram of Out-of-Plane Displacement of the Outside Girder Web Gap at Pier S7 -5 After Retrofit 119
viii

Volume I: Evaluation of Fatigue Cracking in 1-65 Mobile Delta Crossing Bridges - Floorbeam-Girder Connections
LIST OF FIGURES (continued)
Figure 76. Histogram of Out-of-Plane Displacement of the Inside Girder Web Gap at Pier 87-5 Before Retrofit
Figure 77. Histogram of Out-of-Plane Displacement of the Inside Girder Web Gap at Pier 87-5 After Retrofit
Figure 78. Histogram of Out-of-Plane Displacement of the Inside Girder Web Gap at Pier 87-9 Before Retrofit
Figure 79. Histogram of Out-of-Plane Displacement of the Inside Girder Web Gap at Pier 87 -9 After Retrofit
Figure 80. Histogram of Out-of-Plane Displacement of the Outside Girder Web Gap at Pier 87-9 Before Retrofit
Figure 81. Histogram of the Random Data for Gage 081 on the Outside Girder at 87-5 Before Retrofit
Figure 82. Histogram of the Random Data for Gage 081 on the Outside Girder at 87-5 After Retrofit
Figure 83. Histogram of the Random Data for Gage 182 on ,the Outside Girder at 87-5 Before Retrofit
Figure 84. Histogram of the Random Data for Gage 182 on the Outside Girder at 87-5 After Retrofit
Figure 85. Histogram of the Random Data for Gage 081 on the Inside Girder at 87-5 Before Retrofit
Figure 86. Histogram of the Random Data for Gage 081 on the Inside Girder at 87-5 After Retrofit
Figure 87. Histogram of the Random Data for Gage 182 on the Inside Girder at 87-5 Before Retrofit
Figure 88. Histogram of the Random Data for Gage 182 on the Inside Girder at 87-5 After Retrofit
Figure 89. Histogram of the Random Data for Gage 081 on the Outside Girder at 87-9 Before Retrofit
ix
120
120
121
121
122
122
123
123
124
124
125
125
126
126
Volume I: Evaluation of Fatigue Cracking in 1-65 Mobile Delta Crossing Bridges - Floorbeam-Girder Connections
LIST OF FIGURES (continued)
Figure 90. Histogram of the Random Data for Gage OS1 on the Outside Girder at S7 -9 After Retrofit 127
Figure 91. Histogram of the Random Data for Gage IS2 on the Outside Girder at S7 -9 Before Retrofit 127
Figure 92. Histogram of the Random Data for Gage IS2 on the Outside Girder at S7 -9 After Retrofit 128
Figure 93. Histogram of the Random Data for Gage OS1 on the Inside Girder at S7 -9 Before Retrofit 128
Figure 94. Histogram of the Random Data for Gage OS1 on the Inside Girder at S7 -9 After Retrofit 129
Figure 95. Histogram of the Random Data for Gage IS2 on the Inside Girder at S7 -9 Before Retrofit 129
Figure 96. Histogram of the Random Data for Gage IS2 on the Inside Girder at S7 -9 After Retrofit 130
Figure 97. Static Stress Distribution for Outside Girder at Pier S5-2 Floorbeam Two with Dump Truck in Outside Lane (Worst Case) 133
Figure 98. Static Stress Distribution for Inside Girder at Pier S7 -12 Floorbeam Two with Dump Truck in Outside Lane (Worst Case) 133
Figure 99. Histogram of Extrapolated Random Data at the Outside Web-Flange Weld on the Outside Girder at Pier S5-2 Floorbeam Two 134
Figure 100. Histogram of Extrapolated Random Data at the Outside Web-Flange Weld Toe on the Inside Girder at Pier S7-12 Floorbeam Two 134
Figure 101. Histogram of Extrapolated Random Data at the Location of the Floorbeam Two Connection Plate Weld on the Outside Face of the Girder at S5-2 141
Figure 102. Histogram of Extrapolated Random Data at the Location of Floorbeam Two Connection Plate Weld on the Outside Face of the Girder at S7-12 141
x
Volume I: Evaluation of Fatigue Cracking in 1-65 Mobile Delta Crossing Bridges - Floorbeam-Girder Connections
LIST OF FIGURES (continued)
Figure 103. Histogram ot the Out-ot-Plane Displacements Recorded at Pier S5-2 Floorbeam Two 142
Figure 104. Histogram ot the Out-ot-Plane Displacements Recorded at Pier S7 -12 Floorbeam Two 142
Figure 105. Static Stress Distribution tor Outside Girder at Pier S5-2 Floorbeam Three with Lowboy in Outside Lane 148
Figure 106. Static Stress Distribution tor Inside Girder at Pier S7 -12 Floorbeam Three with the Lowboy in the Outside Lane 148
Figure 107. Histogram ot Out-ot-Plane Displacements at Pier S5-2 Floorbeam Three 149
Figure 108. Histogram ot the Out-ot-Plane Displacements at Pier S7-12 Floorbeam Three 149
xi
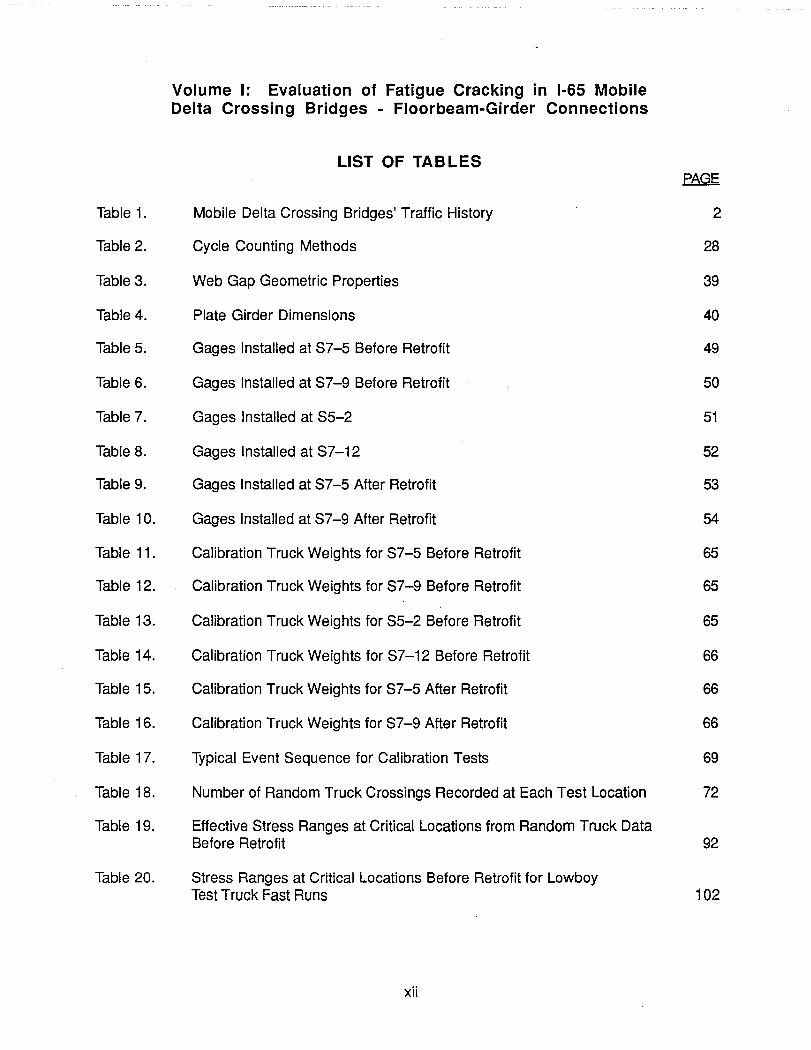
Table 1.
Table 2.
Table 3.
Table 4.
Table 5.
Table 6.
Table 7.
Table 8.
Table 9.
Table 10.
Table 11.
Table 12.
Table 13.
Table 14.
Table 15.
Table 16.
Table 17.
Table 18.
Table 19.
Table 20.
Volume I: Evaluation of Fatigue Cracking in 1-65 Mobile Delta Crossing Bridges - Floorbeam-Girder Connections
LIST OF TAB LES
Mobile Delta Crossing Bridges' Traffic History
Cycle Counting Methods
Web Gap Geometric Properties
Plate Girder Dimensions
Gages Installed at 87-5 Before Retrofit
Gages Installed at 87-9 Before Retrofit
Gages Installed at 85-2
Gages Installed at 87-12
Gages Installed at 87-5 After Retrofit
Gages Installed at 87-9 After Retrofit
Calibration Truck Weights for 87-5 Before Retrofit
Calibration Truck Weights for 87-9 Before Retrofit
Calibration Truck Weights for 85-2 Before Retrofit
Calibration Truck Weights for 87-12 Before Retrofit
Calibration Truck Weights for 87-5 After Retrofit
Calibration Truck Weights for 87-9 After Retrofit
Typical Event 8equence for Calibration Tests
Number of Random Truck Crossings Recorded at Each Test Location
Effective 8tress Ranges at Critical Locations from Random Truck Data Before Retrofit
8tress Ranges at Critical Locations Before Retrofit for Lowboy Test Truck Fast Runs
xii
2
28
39
40
49
50
51
52
53
54
65
65
65
66
66
66
69
72
92
102

Table 21.
Table 22.
Table 23.
Table 24.
Table 25.
Table 26.
Table 27.
Table 28.
Volume I: Evaluation of Fatigue Cracking in 1-65 Mobile Delta Crossing Bridges - Floorbeam-Girder Connections
LIST OF TABLES (continued)
Static Calibration Test Results Before and After Positive Attachment
Average and Standard Deviation of Out-of-Plane Displacements for Random Data at S7 -5 Before and After the Positive Attachment 'Retrofit
Effective Stress Ranges at Gages OS1 and IS2 for Random Data Before and After Retrofit
Static Calibration Test Results at Floorbeam Two for Test Trucks over Floorbeam Two
Stress Ranges at Critical Locations for Lowboy Test Truck
Effective Stress Ranges at Critical Locations at Floorbeam Two
Static Calibration Test Results at Floorbeam Three for Test Trucks over Floorbeam Two
Static Calibration Test Results at Floorbeam Three for Test Trucks over Floorbeam Three
xiii
PAGE
115
116
118
136
137
140
145
146
Volume II: Evaluation of Fatigue Cracking in 1-65 Mobile Delta Crossing Bridges - Filler Plate Weld Cracks
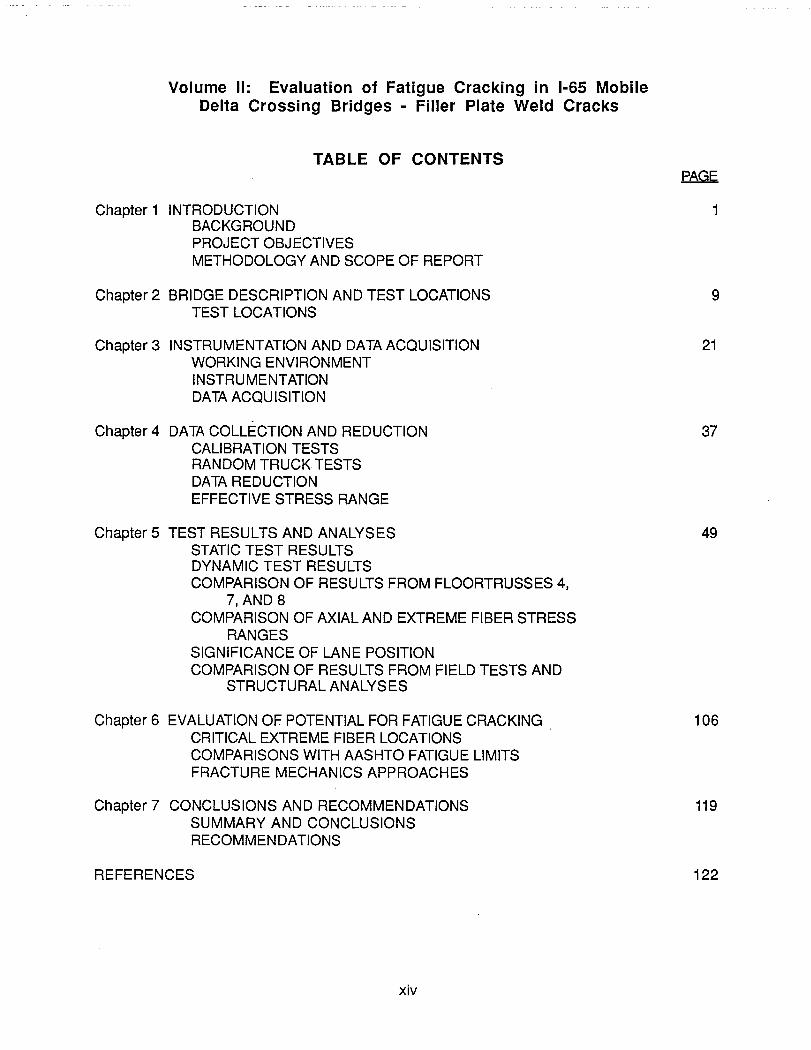
TABLE OF CONTENTS
Chapter 1 INTRODUCTION BACKGROUND PROJECT OBJECTIVES METHODOLOGY AND SCOPE OF REPORT
Chapter 2 BRIDGE DESCRIPTION AND TEST LOCATIONS TEST LOCATIONS
Chapter 3 INSTRUMENTATION AND DATA ACQUISITION WORKING ENVIRONMENT INSTRUMENTATION DATA ACQU ISITION
Chapter 4 DATA COLLECTION AND REDUCTION CALIBRATION TESTS RANDOM TRUCK TESTS DATA REDUCTION EFFECTIVE STRESS RANGE
Chapter 5 TEST RESULTS AND ANALYSES STATIC TEST RESULTS DYNAMIC TEST RESULTS COMPARISON OF RESULTS FROM FLOORTRUSSES 4,
7, AND 8 COMPARISON OF AXIAL AND EXTREME FIBER STRESS
RANGES SIGNIFICANCE OF LANE POSITION COMPARISON OF RESULTS FROM FIELD TESTS AND
STRUCTURAL ANALYSES
Chapter 6 EVALUATION OF POTENTIAL FOR FATIGUE CRACKING. CRITICAL EXTREME FIBER LOCATIONS COMPARISONS WITH AASHTO FATIGUE LIMITS FRACTURE MECHANICS APPROACHES
Chapter 7 CONCLUSIONS AND RECOMMENDATIONS SUMMARY AND CONCLUSIONS RECOMMENDATIONS
REFERENCES
xiv
9
21
37
49
106
119
122

Figure 1.
Figure 2.
Figure 3.
Figure 4.
Figure 5.
Figure 6.
Figure 7.
Figure 8.
Figure 9.
Figure 10.
Figure 11.
Figure 12.
Figure 13.
Figure 14.
Figure 15.
Figure 16.
Figure 17.
Figure 18.
Volume II: Evaluation of Fatigue Cracking in 1-65 Mobile Delta Crossing Bridges - Filler Plate Weld Cracks
LIST OF FIGURES
Typical Double Angle with Filler Plates
Filler Plate Weld Crack
Filler Plate Weld Crack and Solidified Rust
Fatigue Resistance of Category C Details (from Keating and Fisher 1986)
Typical Floortruss Section
Mobile Delta River Crossing Bridges
2
3
4
8
10
13
Elevation View of Southbound Arch Span (Looking from Northbound Lane) 14
Identification Scheme for Floortruss Members (Looking South)
Existing Filler Plate Weld Crack Locations (denoted by letters): (a) Floortruss 4; (b) Floortruss 8 (Looking South)
Plan View of Work Platforms at Floortruss Test Location
Gage Locations on Bottom Chord Members
Bottom Chord Gage Location Details (See Figure 11): (a) Detail A; (b) Section B-B
Instrumented Diagonal Members
Gage Locations on Diagonal Members
Gage Location Details for Members 02, 03, 04, and 05: (a) Detail C (See Figure 14); (b) Section C1-C1
Gage Location Details for Members 01 and 06: (a) Detail D (See Figure 14); (b) Section 01-01
Environmental Chamber
Plan View of Trucks Used for Calibration Tests: (a) 3-Axle; (b) 5-Axle
xv
17
18
22
25
26
28
29
30
31
35
39

Figure 19.
Figure 20.
Figure 21.
Figure 22.
Figure 23.
Figure 24.
Figure 25.
Figure 26.
Figure 27.
Figure 28.
Figure 29.
Figure 30.
Figure 31.
Figure 32.
Figure 33.
Figure 34.
.Figure 35.
Figure 36.
Figure 37.
Figure 38.
Volume II: Evaluation of Fatigue Cracking in 1-65 Mobile Delta Crossing Bridges - Filler Plate Weld Cracks
LIST OF FIGURES (continued)
Test Lanes A, B, and C Used for Calibration Tests
Plan View of Southbound Lanes with Static Calibration Truck Positions P1 through P7
Alignment of Test Trucks for Static Tests: (a) 3-Axle Truck; (b) 5-Axle Truck
Illustration of Peak to Peak Method
Axial Stress in Member 01 of Floortruss 4 with Test Trucks in Slow Lane
Axial Stress in Member 01 of Floortruss 8 with Test Trucks in Slow Lane
Axial Stress in Member 01 of Floortruss 4 with Test Trucks in Fast Lane
Axial Stress in Member 01 of Floortruss 8 with Test Trucks in Fast Lane
Axial Stress in Member 02 of Floortruss 4 with Test Trucks in Slow Lane
Axial Stress in Member 02 of Floortruss 8 with Test Trucks in Slow Lane
Axial Stress in Member 02 of Floortruss 4 with Test Trucks in Fast Lane
Axial Stress in Member 02 of Floortruss 8 with Test Trucks in Fast Lane
Axial Stress in Member 05 of Floortruss 4 with Test Trucks in Slow Lane
Axial Stress in Member 05 of Floortruss 8 with Test Trucks in Slow Lane
Axial Stress in Member 05 of Floortruss 4 with Test Trucks in Fast Lane
Axial Stress in Member 05 of Floortruss 8 with Test Trucks in Fast Lane
Axial Stress in Member 06 of Floortruss 4 with Test Trucks in Slow Lane
Axial Stress in Member 06 of Floortruss 8 with Test Trucks in Slow Lane
Axial Stress in Member 06 of Floortruss 4 with Test Trucks in Fast Lane
Axial Stress in Member'06 of Floortruss 8 with Test Trucks in Fast Lane
xvi
39
43
43
46
50
50
51
51
52
52
53
53
54
54
55
55
56
56
57
57
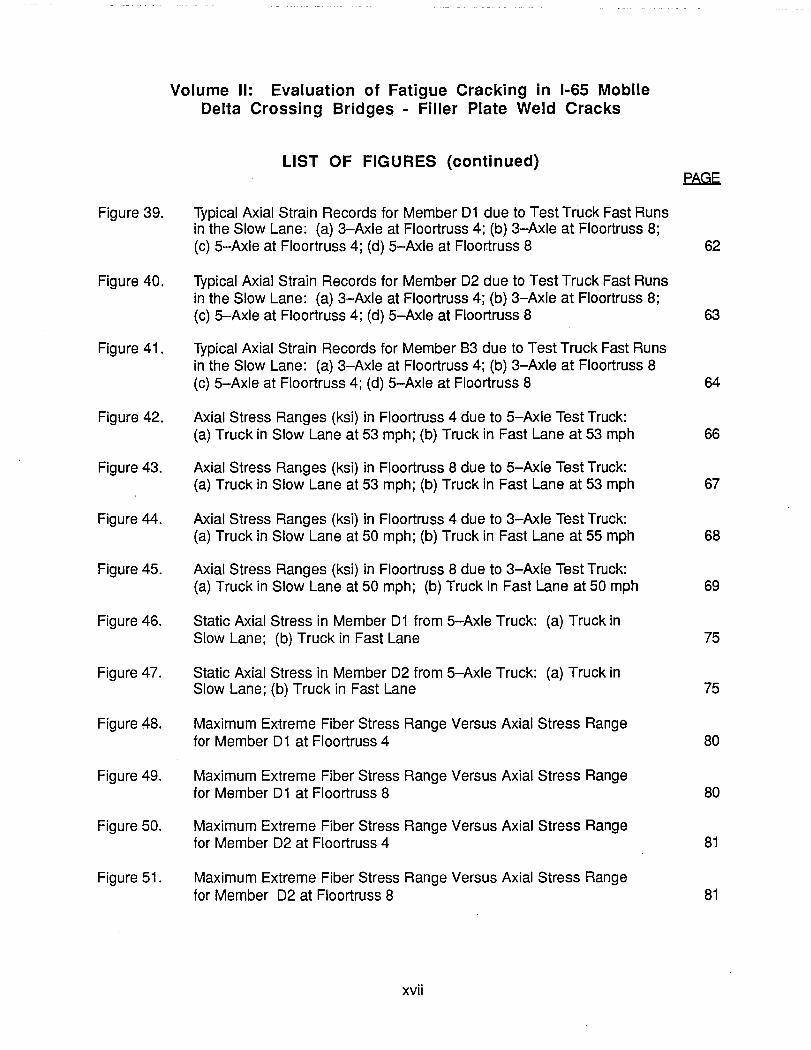
Figure 39.
Figure 40.
Figure 41.
Figure 42.
Figure 43.
Figure 44.
Figure 45.
Figure 46.
Figure 47.
Figure 48.
Figure 49.
Figure 50.
Figure 51.
Volume II: Evaluation of Fatigue Cracking in 1-65 Mobile Delta Crossing Bridges - Filler Plate Weld Cracks
LIST OF FIGURES (continued)
Typical Axial Strain Records for Member 01 due to Test Truck Fast Runs in the Slow Lane: (a) 3-Axle at Floortruss 4; (b) 3-Axle at Floortruss 8; (c) 5-Axle at Floortruss 4; (d) 5-Axle at Floortruss 8
Typical Axial Strain Records for Member 02 due to Test Truck Fast Runs in the Slow Lane: (a) 3-Axle at Floortruss 4; (b) 3-Axle at Floortruss 8; (c) 5-Axle at Floortruss 4; (d) 5-Axle at Floortruss 8
Typical Axial Strain Records for Member 83 due to Test Truck Fast Runs in the Slow Lane: (a) 3-Axle at Floortruss 4; (b) 3-Axle at Floortruss 8 (c) 5-Axle at Floortruss 4; (d) 5-Axle at Floortruss 8
Axial Stress Ranges (ksi) in Floortruss 4 due to 5-Axle Test Truck: (a) Truck in Slow Lane at 53 mph; (b) Truck in Fast Lane at 53 mph
Axial Stress Ranges (ksi) in Floortruss 8 due to 5-Axle Test Truck: (a) Truck in Slow Lane at 53 mph; (b) Truck in Fast Lane at 53 mph
Axial Stress Ranges (ksi) in Floortruss 4 due to 3-Axle Test Truck: (a) Truck in Slow Lane at 50 mph; (b) Truck in Fast Lane at 55 mph
Axial Stress Ranges (ksi) in Floortruss 8 due to 3-Axle Test Truck: (a) Truck in Slow Lane at 50 mph; (b) Truck in Fast Lane at 50 mph
Static Axial Stress in Member 01 from 5-Axle Truck: (a) Truck in Slow Lane; (b) Truck in Fast Lane
Static Axial Stress in Member 02 from 5-Axle Truck: (a) Truck in Slow Lane; (b) Truck in Fast Lane
Maximum Extreme Fiber Stress Range Versus Axial Stress Range for Member 01 at Floortruss 4
Maximum Extreme Fiber Stress Range Versus Axial Stress Range for Member 01 at Floortruss 8
Maximum Extreme Fiber Stress Range Versus Axial Stress Range for Member 02 at Floortruss 4
Maximum Extreme Fiber Stress Range Versus Axial Stress Range for Member 02 at Floortruss 8
xvii
~
62
63
64
66
67
68
69
75
75
80
80
81
81
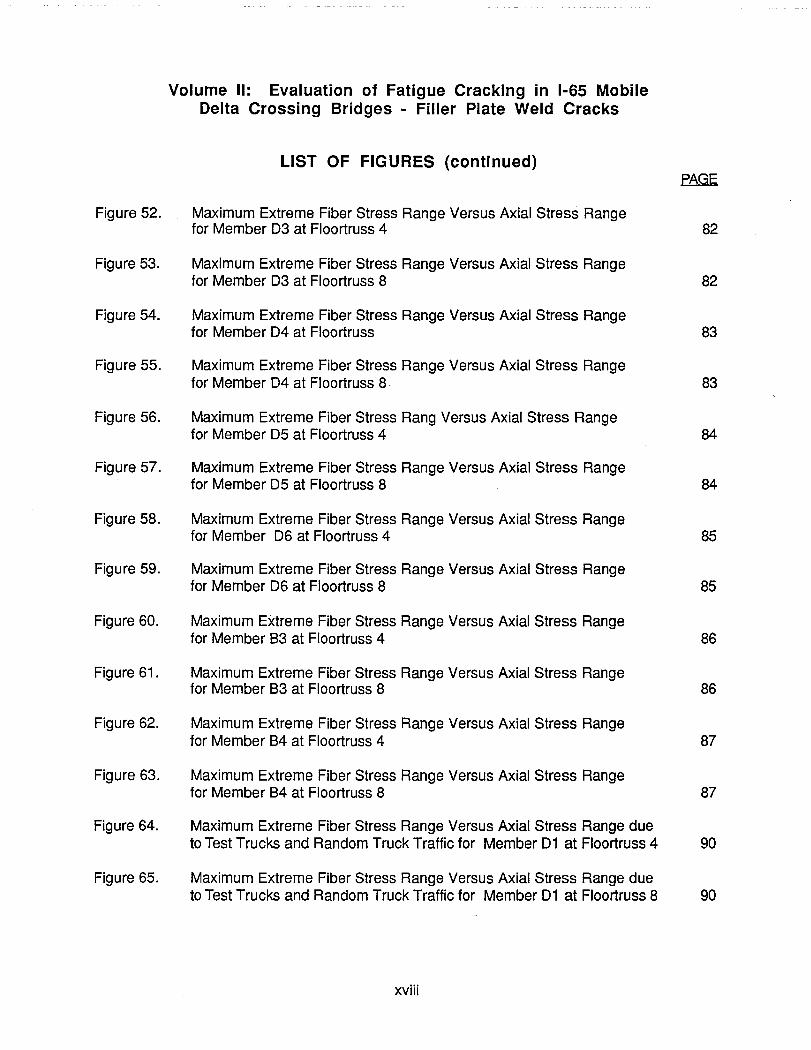
Figure 52.
Figure 53.
Figure 54.
Figure 55.
Figure 56.
Figure 57.
Figure 58.
Figure 59.
Figure 60.
Figure 61.
Figure 62.
Figure 63.
Figure 64.
Figure 65.
Volume II: Evaluation of Fatigue Cracking in 1-65 Mobile Delta Crossing Bridges - Filler Plate Weld Cracks
LIST OF FIGURES (continued)
Maximum Extreme Fiber Stress Range Versus Axial Stress Range for Member 03 at Floortruss 4
Maximum Extreme Fiber Stress Range Versus Axial Stress Range for Member 03 at Floortruss 8
Maximum Extreme Fiber Stress Range Versus Axial Stress Range for Member 04 at Floortruss
Maximum Extreme Fiber Stress Range Versus Axial Stress Range for Member 04 at Floortruss 8·
Maximum Extreme Fiber Stress Rang Versus Axial Stress Range for Member 05 at Floortruss 4
Maximum Extreme Fiber Stress Range Versus Axial Stress Range for Member 05 at Floortruss 8
Maximum Extreme Fiber Stress Range Versus Axial Stress Range for Member 06 at Floortruss 4
Maximum Extreme Fiber Stress Range Versus Axial Stress Range for Member 06 at Floortruss 8
Maximum Extreme Fiber Stress Range Versus Axial Stress Range for Member 83 at Floortruss 4
Maximum Extreme Fiber Stress Range Versus Axial Stress Range for Member 83 at Floortruss 8
Maximum Extreme Fiber Stress Range Versus Axial Stress Range for Member 84 at Floortruss 4
Maximum Extreme Fiber Stress Range Versus Axial Stress Range for Member 84 at Floortruss 8
Maximum Extreme Fiber Stress Range Versus Axial Stress Range due to Test Trucks and Random Truck Traffic for Member 01 at Floortruss 4
Maximum Extreme Fiber Stress Range Versus Axial Stress Range due to Test Trucks and Random Truck Traffic for Member 01 at Floortruss 8
xviii
82
82
83
83
84
84
85
85
86
86
87
87
90
90
Figure 66.
Figure 67.
Figure 68.
Figure 69.
Figure 70.
Figure 71.
Figure 72.
Figure 73.
Figure 74.
Figure 75.
Figure 76.
Figure 77.
Figure 78.
Figure 79.
Volume II: Evaluation of Fatigue Cracking in 1-65 Mobile Delta Crossing Bridges - Filler Plate Weld Cracks
LIST OF FIGURES (continued)
Maximum Extreme Fiber Stress Range Versus Axial Stress Range due to Test Trucks and Random Truck Traffic for Member 02 at Floortruss 4
Maximum Extreme Fiber Stress Range Versus Axial Stress Range due to Test Trucks and Random Truck Traffic for Member 02 at Floortruss 8
Maximum Extreme Fiber Stress Range Versus Axial Stress Range due to Test Trucks and Random Truck Traffic for Member 03 at Floortruss 4
Maximum Extreme Fiber Stress Range Versus Axial Stress Range due to Test Trucks and Random Truck Traffic for Member 03 at Floortruss 8
Maximum Extreme Fiber Stress Range Versus Axial Stress Range due to Test Trucks and Random Truck Traffic for Member 04 at Floortruss 4
Maximum Extreme Fiber Stress Range Versus Axial Stress Range due to Test Trucks and Random Truck Traffic for Member 04 at Floortruss 8
Maximum Extreme Fiber Stress Range Versus Axial Stress Range due to Test Trucks and Random Truck Traffic for Member 05 at Floortruss 4
Maximum Extreme Fiber Stress Range Versus Axial Stress Range due to Test Trucks and Random Truck Traffic for Member 05 at Floortruss 8
Maximum Extreme Fiber Stress Range Versus Axial Stress Range due to Test Trucks and Random Truck Traffic for Member 06 at Floortruss 4
Maximum Extreme Fiber Stress Range Versus Axial Stress Range due to Test Trucks and Random Truck Traffic for Member 06 at Floortruss 8
Maximum Extreme Fiber Stress Range Versus Axial Stress Range due to Test Trucks and Random Truck Traffic for Member 83 at Floortruss 4
Maximum Extreme Fiber Stress Range Versus Axial Stress Range due to Test Trucks and Random Truck Traffic for Member 83 at Floortruss 8
Maximum Extreme Fiber Stress Range Versus Axial Stress Range due to Test Trucks and Random Truck Traffic for Member 84 at Floortruss 4
Maximum Extreme Fiber Stress Range Versus Axial Stress Range due to Test Trucks and Random Truck Traffic for Member 84 at Floortruss 8
xix
91
91
92
92
93
93
94
94
95
95
96
96
97
97
Figure 80.
Figure 81.
Figure 82.
Volume II: Evaluation of Fatigue Cracking in 1-65 Mobile Delta Crossing Bridges - Filler Plate Weld Cracks
LIST OF FIGURES (continued)
Critical Extreme Fiber Locations at Floortrusses 4 and 8 (Looking South) 108
Possible Fatigue Crack Locations 113
Assumed Notch Geometry at End of Weld 114
xx
Table 1.
Table 2.
Table 3.
Table 4.
Table 5.
Table 6.
Table 7.
Table 8.
Table 9.
Table 10.
Table 11.
Table 12.
Table 13.
Table 14.
Table 15.
Table 16.
Table 17.
Volume II: Evaluation of Fatigue Cracking in 1-65 Mobile Delta Crossing Bridges - Filler Plate Weld Cracks
LIST OF TAB LES
Traffic History of the Mobile Delta Crossing Bridges
Floortruss Member Sizes
Filler Plate Weld Cracks at Test Locations
Gages Installed on Diagonal Members
Gages Installed on Bottom Chord Members
Calibration Truck Weights for Quarter-Span Test Location
Calibration Truck Weights for Mid-8pan Test Location
Typical Event Sequence for Calibration Tests
Static Axial Stresses for Test Trucks Parked Directly Over the Gaged Floortruss
Axial and Maximum Extreme Fiber Stress Ranges due to 3-Axle Test Truck Fast Runs in the Slow Lane
Axial and Maximum Extreme Fiber Stress Ranges due to 3-Axle Test Truck Fast Runs in the Fast Lane
Axial and Maximum Extreme Fiber Stress Ranges due to 5-Axle Test Truck Fast Runs in the Slow Lane
Axial and Maximum Extreme Fiber Stress Ranges due to 5-Axle Test Truck Fast Runs in the Fast Lane
Impact Effect of 5-Axle Test Truck in Slow Lane
Stress Ranges at the Neutral Axis of Members 01 and D2 for 5-Axle Test Truck
Stress Ranges at the Neutral Axis of Members 01 and D2 for 3-Axle Test Truck
Effective Stress Ranges at the Neutral Axis of Members 01 and D2 (Based on 250 Random Trucks)
xxi
PAGE
11
15
19
33
33
40
40
42
60
71
71
72
72
73
77
77
77
Table 18.
Table 19.
Table 20.
Table 21.
Table 22.
Table 23.
Table 24.
Table 25.
Table 26.
Table 27.
Volume II: Evaluation of Fatigue Cracking in 1-65 Mobile Delta Crossing Bridges - Filler Plate Weld Cracks
LIST OF TABLES (continued)
Comparison of Measured and Calculated Static Axial Stresses due to 5-Axle Truck in Slow Lane over the Gaged Floortruss
Comparison of Measured and Calculated Static Axial Stresses due to 5-Axle Truck in Fast Lane over the Gaged Floortruss
Comparison of Measured and Calculated Static Axial Stresses due to 3-Axle Truck in Slow Lane over the Gaged Floortruss
Comparison of Measured and Calculated Static Axial Stresses due to 3-Axle Truck in Fast Lane over the Gaged Floortruss
Comparison of Measured and Calculated Dynamic Axial Stresses due to 5-Axle Truck in Slow Lane
Comparison of Measured and Calculated Dynamic Axial Stresses due to 5-Axle Truck in Fast Lane
Comparison of Measured and Calculated Dynamic Axial Stresses due to 3-Axle Truck in Slow Lane
Comparison of Measured and Calculated Dynamic Axial Stresses due to 3-Axle Truck in Fast Lane
Effective Stress Ranges at Extreme Fiber Locations
Maximum Stress Ranges at Extreme Fiber Critical Locations
xxii
100
100
101
101
103
103
104
104
107
109
Volume III: Evaluation of Fatigue Cracking in 1-65 Mobile Delta Crossing Bridges - Floortruss-Girder Connections
TABLE OF CONTENTS
Chapter 1 INTRODUCTION BACKGROUND BRIDGE DESCRIPTION LOCATIONS AND EXTENT OF CRACKING PROJECT OBJECTIVES METHODOLOGY AND SCOPE OF REPORT
1
Chapter 2 LITERATURE REVIEW 11 ASSESSMENT OF RETROFIT TYPES STATISTICAL REVIEW
Chapter 3 SELECTION OF RETROFIT PROCEDURE 31
Chapter 4 TEST LOCATIONS 37
Chapter 5 INSTRUMENTATION AND DATA ACQUISITION 49 WORKING ENVIRONMENT INSTRUMENTATION TRANSDUCER POSITIONS DATA ACQUISITION
Chapter 6 DATA COLLECTION AND REDUCTION 82 CALIBRATION TESTS RANDOM TRUCK TESTS DATA REDUCTION EFFECTIVE STRESS RANGE
Chapter 7 RESULTS AT FLOORTRUSS CONNECTIONS BEFORE RETROFIT 102 BEHAVIOR AT TEST LOCATIONS STRESSES FROM STATIC TESTS . CRITICAL LOCATIONS AND CALCULATION OF WEB GAP STRESSES EFFECTIVE STRESS RANGES FROM TRUCK TRAFFIC OUT-OF-PLANE DISPLACEMENTS POTENTIAL FOR CRACKING
Chapter 8 RESULTS AT CONNECTIONS AFTER RETROFIT 174 BEHAVIOR AT TEST LOCATION WEB GAP STRESSES FROM STATIC TESTS EFFECTIVE STRESS RANGES FROM TRUCK TRAFFIC OUT-O~-PLANE DISPLACEMENTS EFFECTIVENESS OF RETROFITS
xxiii
Volume III: Evaluation of Fatigue Cracking in 1-65 Mobile Delta Crossing Bridges - Floortruss-Girder Connections
TABLE OF CONTENTS
Chapter 9 CONCLUSIONS AND RECOMMENDATIONS SUMMARY AND CONCLUSIONS RECOMMENDATIONS
REFERENCES
xxiv
229
234

Figure 1.
Figure 2.
Figure 3.
Figure 4.
Figure 5.
Figure 6.
Figure 7.
Figure 8.
Figure 9.
Figure 10.
Figure 11.
Figure 12.
Figure 13.
Figure 14.
Figure 15.
Volume III: Evaluation of Fatigue Cracking in 1-65 Mobile Delta Crossing Bridges - Floortruss-Girder Connections
LIST OF FIGURES
Typical Floortruss-Girder Connection Not at Pier
Illustration of Out-of-Plane Distortion: (a) In the Web Gap Region; (b) Due to Deflections of the Transverse Floortruss
Typical Fatigue Cracks Found at Floortruss-Girder Connections
Examples of Friction Type Retrofits: (a) Wedges; (b) Compressed Plates
Exaniples of Rigid Attachment Type Retrofits: (a) Welded; (b) Through Bolted
Examples of Rigid Attachment Type Retrofits: (a) Studded; (b) Bracketed Through a Hole in the Girder Web
Examples of Loosening Type Retrofits: (a) Slotted Web; (b) Lengthened Web Gap
Basic Welded Retrofit Detail Chosen for Investigation by Koob et al. (1985)
Basic Studded Retrofit Detail Chosen for Investigation by Koob et al. (1985)
Basic Lengthened Web Gap Retrofit Detail Chosen for Investigation by Koob et al. (1985)
Idealized Histograms Illustrating Common Shapes of Frequency Distributions: (a) Uniform; (b) U-Shaped; (c) Reverse J-Shaped; (d) Bell-Shaped; (e) Skewed Right
Relative Values of Mode, Median, and Mean for Differing Shapes of Frequency Distributions: (a) Symmetrical; (b) Skewed Right; (c) Skewed Left
Shape and Characteristics of Rayleigh Probability Density Curves
Varying Degrees of Correlation: (a) Zero Correlation; (b) Low Correlation; (c) Moderate Correlation; (d) High Correlation
Typical Retrofit Procedure for Connection Plate Slot Retrofit
xxv
EOOE
4
6
8
13
15
16
19
20
21
22
24
27
28
30
33
Figure 16.
Figure 17.
Figure 18.
Figure 19.
Figure 20.
Figure 21.
Figure 22.
Figure 23.
Figure 24.
Figure 25.
Figure 26.
Figure 27.
Figure 28.
Figure 29.
Volume III: Evaluation of Fatigue Cracking in 1-65 Mobile Delta Crossing Bridges - Floortruss-Girder Connections
LIST OF FIGURES (continued)
Ten Inch Slot in the Connection Plate and Position of the Three Bolts Removed for the Second Trial Retrofit
Six Inch Slot in the Connection Plate and Position of the Two Bolts Removed for the Second Trial Retrofit
Floortruss-Girder Test Locations on Mobile Delta Crossing Bridges
Position of Test Piers Along the Respective Continuous Spans
Plan View Showing Connections Tested Before and After Retrofit Along the Respective Single Spans of Each Continuous Span
Cross-Section of Bridges at Floortruss-G.irder Connections Away From Piers (Looking North)
Typical Web Gap Region at Floortruss-Girder Connections Away From Piers: (a) Elevation of Inside Face of Girder; (b) Section View Looking in the Longitudinal Direction of the Bridge
Plan View. (with Concrete Deck Removed) of Work Platforms and Scaffolds Used at Pier S3-11 Test Locations
Plan View (with Concrete Deck Removed) of Work Platforms and Scaffolds Used at Pier S3-11 Test Locations
Typical LVDT Arrangement at Floortruss-Girder Connection
Numbering and Locations of Strain Gages on Girder Web Before Retrofit
Numbering and Locations of Strain Gages on Girder Web After Retrofit at the Outside Girder Connection of the First Floortruss South of Pier S3-11
Numbering and Locations of Strain Gages on Girder Web After Retrofit at the Outside Girder Connection of the Second Floortruss North of Pier S3-4
Numbe~ing and Locations of Strain Gages on the Connection Plate Before Retrofit
xxvi
34
35
38
39
41
43
44
50
51
57
59
61
62
63
Figure 30.
Figure 31.
Figure 32.
Figure 33.
Figure 34.
Figure 35.
Figure 36.
Figure 37.
Figure 38.
Figure 39.
Figure 40.
Figure 41.
Figure 42.
Figure 43.
Volume III: Evaluation of Fatigue Cracking in 1-65 Mobile Delta Crossing Bridges - Floortruss-Girder Connections
LIST OF FIGURES (continued)
Numbering and Locations of Strain Gages on the Connection Plate at the Outside Girder Connection of the First Floortruss South of Pier S3-11 After Retrofit 65
Numbering and Locations of Strain Gages on the Connection Plate at the Outside Girder Connection of the Second Floortruss North of Pier S3-4 After Retrofit 66
Typical Gage and Fill Plate Locations on Floortruss Members at Pier S3-11 Locations (Looking North) 68
Typical Gage and Fill Plate Locations on Floortruss Members at Pier S3-4 Locations (Looking North) 70
Gage Locations on the Neutral Axes of the Truss Members: (a) Top Chord; (b) End Diagonal; (c) Bottom Chord 71
Numbering and Locations of In-Plane Bending Gages on Girder Flanges 72
Environmental Chamber 80
Trucks Used for Calibration Tests: (a) 3-Axle Truck (Dump Truck); (b) 5-Axle Truck (Lowboy) 85
Test Lanes A, B, and C Used for Calibration Tests (Looking South at Southbound Lanes) 85
Span Positions Used for Static Calibration Tests at Pier S3-11 Locations 91
Span Positions Used for Static Calibration Tests at Pier S3-4 Locations 91
Truck Axle Positioning for Static Calibration Tests: (a) 3-Axle Truck (Dump Truck); (b) 5-Axle Truck (Lowboy) 92
Illustration of Peak-to~Peak Method 97
Typical Distribution of Horizontal Stress in the Connection Plate (at the Outside Girder of the First Floortruss South of Pier S3-11 Before Retrofit) 107
xxvii

Figure 44.
Figure 45.
Figure 46.
Figure 47.
Figure 48.
Figure 49.
Figure 50.
Figure 51.
Figure 52.
Figure 53.
Figure 54.
Figure 55.
Volume III: Evaluation of Fatigue Cracking in 1-65 Mobile Delta Crossing Bridges - Floortruss-Girder Connections
LIST OF FIGURES (continued)
Interaction of Connection Plate and Girder Web Plate: (a) Idealized Distribution of Horizontal Stress in Connection Plate; (b) Distortion in Web Gap Region 109
Static Stress Distribution on Outside Girder at the First Floortruss South of Pier S3-11 (106 in. Girder) Before Retrofit with 3-Axle Truck in Outside Lane 111
Static Stress Distribution on Inside Girder at the First Floortruss South of Pier S3-11 (106 in. Girder) Before Retrofit with 3-Axle Truck in Outside Lane 111
Static Stress Distribution on Outside Girder at the Second Floortruss South of Pier S3-11 (106 in. Girder) Before Retrofit with 3-Axle Truck in Outside Lane 112
Static Stress Distribution on Outside Girder at the First Floortruss North of Pier S3-4 (126 in. Girder) Before Retrofit with 3-Axle Truck in Outside Lane 112 .
Static Stress Distribution on Outside Girder at the Second Floortruss North of Pier S3-4 (126 in. Girder) Before Retrofit with 3-Axle Truck in Outside Lane 113
Static Stress Distribution on Inside Girder at the Second Floortruss North of Pier S3-4 (126 in. Girder) Before Retrofit with 3-Axle Truck in Outside Lane 113
Static Axial Stress in End Diagonals of the First Floortruss South of Pier S3-11 Before Retrofit with 3-Axle Truck in Lane A or C 115
Static Axial Stress in End Diagonals of the Second Floortruss North of Pier S3-4 Before Retrofit with 3-Axle Truck in Lane A or C 115
Static Stress at the Outside Web-Flange Weld at the First Floortruss South of Pier S3-11 Before Retrofit with 3-Axle Truck in Lane A or C 116
Static Stress at the Outside Web-Flange Weld at the Second Floortruss North of Pier S3-4 Before Retrofit with 3-Axle Truck in Lane A or C 116
Static Stress at the Top of the Connection Plate Weld at the First Floortruss South of Pier S3-11 Before Retrofit with 3-Axle Truck in Lane A or C 117
xxviii

Figure 56.
Figure 57.
Figure 58.
Figure 59.
Figure 60.
Figure 61. (
Figure 62.
Figure 63.
Figure 64.
Figure 65.
Figure 66.
Figure 67.
Volume III: Evaluation of Fatigue Cracking in 1-65 Mobile Delta Crossing Bridges - Floortruss-Girder Connections
LIST OF FIGURES (continued)
Static Stress at the Top of the Connection Plate Weld at the Second Floortruss North of Pier S3-4 Before Retrofit with 3-Axle Truck in Lane A or C 117
Gage ON1 Strain Record that Contributed to the Maximum Extrapolated Stress Range Measured for Random Trucks 126
Gage ON2 Strain Record that Contributed to the Maximum Extrapolated Stress Range Measured for Random Trucks 126
Web Plate Stress Ranges at the Top of the Connection Plate Weld on the Outside Girder at the First Floortruss South of Pier S3-11 Before Retrofit 129
Web Plate Stress Ranges at the Outside Web-Flange Weld Toe on the Outside Girder at the First Floortruss South of Pier S3-11 Before Retrofit 129
Web Plate Stress Ranges at the Top of the Connection Plate Weld on the Inside Girder at the First Floortruss South of Pier S3-11 Before Retrofit 130
Web Plate Stress Ranges at the Outside Web-Flange Weld Toe on the Inside Girder at the First Floortruss South of Pier S3-11 Before Retrofit 130
Web Plate Stress Ranges at the Top of the Connection Plate Weld on the Outside Girder at the Second Floortruss South of Pier S3-11 Before Retrofit 131
Web Plate Stress Ranges at the Outside Web-Flange Weld Toe on the Outside Girder at the Second Floortruss South of Pier S3-11 Before Retrofit 131
Web Plate Stress Ranges at the Top of the Connection Plate Weld on the Outside Girder at the First Floortruss North of Pier S3-4 Before Retrofit 132
Web Plate Stress Ranges at the Outside Web-Flange Weld Toe on the Outside Girder at the First Floortruss North of Pier S3-4 Before Retrofit 132
Web Plate Stress Ranges at the Top of the Connection Plate Weld on the Outside Girder at the Second Floortruss North of Pier S3-4 Before Retrofit 133
xxix
Figure 68.
Figure 69.
Figure 70.
Figure 71.
Figure 72.
Figure 73.
Figure 74.
Figure 75.
Figure 76.
Figure 77.
Figure 78.
Figure 79.
Figure 80.
Volume III: Evaluation of Fatigue Cracking in 1-65 Mobile Delta Crossing Bridges - Floortruss-Girder Connections
LIST OF FIGURES (continued)
Web Plate Stress Ranges at the Outside Web-Flange Weld Toe on the Outside Girder at the Second Floortruss North of Pier S3-4 Before Retrofit 133
Web Plate Stress Ranges at the Top of the Connection Plate Weld on the Inside Girder at the Second Floortruss North of Pier S3-4 Before Retrofit 134
Web Plate Stress Ranges at the Outside Web-Flange Weld Toe on the Inside Girder at the Second Floortruss North of Pier S3-4 Before Retrofit 134
Out-of-Plane Displacement Ranges at the Outside Girder at the First Floortruss South of Pier S3-11 Before Retrofit 146
Out-of-Plane Displacement Ranges at the Inside Girder at the First Floortruss South of Pier S3-11 Before Retrofit 146
Out-of-Plane Displacement Ranges at the Outside Girder at the Second Floortruss South of Pier S3-11 Before Retrofit 147
Out-of-Plane Displacement Ranges at the Outside Girder at the First Floortruss North of Pier S3-4 Before Retrofit 147
Out-of-Plane Displacement Ranges at the Outside Girder at the Second Floortruss North of Pier S3-4 Before Retrofit 148
Out-of-Plane Displacement Ranges at the Inside Girder at the Second Floortruss North of Pier S3-4 Before Retrofit 148
Web Plate Stress Range at the Top of the Connection Plate Weld Versus Out-of-Plane Displacement Range at the Outside Girder of the First Floortruss South of Pier S3-11 Before Retrofit 149
Web Plate Stress Range at the Outside Web-Flange Weld Toe Versus Out-of-Plane Displacement Range at the Outside Girder of the First Floortruss South of Pier S3-11 Before Retrofit 149
Web Plate Stress Range at the Top of the Connection Plate Weld Versus Out-of-Plane Displacement Range at the Inside Girder of the First Floortruss South of Pier S3-11 Before Retrofit 150
Web PI~te Stress Range at the Outside Web-Flange Weld Toe Versus Out-of-Plane Displacement Range at the Inside Girder of the First Floortruss South of Pier S3-11 Before Retrofit 150
xxx
Figure 81.
Figure 82.
Figure 83.
Figure 84.
Figure 85.
Figure 86.
. Figure 87.
Figure 88.
Figure 89.
Figure 90.
Figure 91.
Volume III: Evaluation of Fatigue Cracking in 1-65 Mobile Delta Crossing Bridges - Floortruss-Girder Connections
LIST OF FIGURES (continued)
Web Plate Stress Range at the Top of the Connection Plate Weld Versus Out-ot-Plane Displacement Range at the Outside Girder of the Second Floortruss South of Pier S3-11 Before Retrofit
Web Plate Stress Range at the Outside Web-Flange Weld Toe Versus Out-ot-Plane Displacement Range at the Outside Girder of the Second Floortruss South of Pier S3-11 Before Retrofit
Web Plate Stress Range at the Top of the Connection Plate Weld Versus Out-of-Plane Displacement Range at the Outside Girder of the First Floortruss North of Pier S3-4 Before Retrofit
Web Plate Stress Range at the Outside Web-Flange Weld Toe Versus Out-ot-Plane Displacement Range at the Outside Girder of the First Floortruss North of Pier S3-4 Before Retrofit
Web Plate Stress Range at the Top of the Connection Plate Weld Versus Out-of-Plane Displacement Range at the Outside Girder ot the Second Floortruss North of Pier S3-4 Before Retrofit
Web Plate Stress Range at the Outside Web-Flange Weld Toe Versus Out-ot-Plane Displacement Range at the Outside Girder of the Second Floortruss North of Pier S3-4 Before Retrofit
Web Plate Stress Range at the Top of the Connection Plate Weld Versus Out-ot-Plane Displacement Range at the Inside Girder of the Second Floortruss North ot Pier S3-4 Betore Retrofit
Web Plate Stress Range at the Outside Web-Flange Weld Toe Versus Out-of-Plane Displacement Range at the Inside Girder of the Second Floortruss North ot Pier S3-4 Before Retrofit
Stress Ranges at the NS 1 Gage on the Connection Plate at the Outside Girder of the Second Floortruss North of Pier S3-4 Before Retrofit
Vertical Force Component Range in the End Diagonal Versus Out-of-Plane Displacement Range at the Outside Girder of the First Floortruss South of Pier S3-11 Before Retrofit
Vertical ,Force Component Range in the End Diagonal Versus Out-of-Plane Displacement Range at the Inside Girder of the First Floortruss South of Pier S3-11 Betore Retrotit
xxxi
E8Gf.
151
151
152
152
153
153
154
154
159
161
161

Volume III: Evaluation of Fatigue Cracking in 1-65 Mobile Delta Crossing Bridges - Floortruss-Girder Connections
LIST OF FIGURES (continued)
Figure 92. Vertical Force Component Range in the End Diagonal Versus Out-of-Plane Displacement Range at the Outside Girder of the Second Floortruss South of Pier S3-11 Before Retrofit
Figure 93. Vertical Force Component Range in the End Diagonal Versus Out-of-Plane Displacement Range at the Outside Girder of the First Floortruss North of Pier S3-4 Before Retrofit
Figure 94. Vertical Force Component Range in the End Diagonal Versus Out-of-Plane Displacement Range at the Outside Girder of the Second Floortruss North of Pier S3-4 Before Retrofit
Figure 95. Vertical Force Component Range in the End Diagonal Versus Out-of-Plane Displacement Range at the Inside Girder of the Second Floortruss North of Pier S3-4 Before Retrofit
Figure 96. Effective Stress Ranges at Floortruss-Girder Connections Transposed on Laboratory Results From Fatigue Tests of Transverse Connections by Fisher et al. (1990)
Figure 97. Typical Distribution of Horizontal Stress in the 10 Inch Slotted Connection Plate
Figure 98. Typical Distribution of Horizontal Stress in the 10 Inch Slotted Connection Plate with the Top Three Bolts Removed
Figure 99. Typical Distribution of Horizontal Stress in the 6 Inch Slotted Connection Plate
Figure 100. Typical Distribution of Horizontal Stress in the 6 Inch Slotted Connection Plate with the Top Two Bolts Removed
Figure 101. Static Stress Distribution at the 10 Inch Slotted Connection with 3-Axle Test Truck in Outside Lane
Figure 102. Static Stress Distribution at the 6 Inch Slotted Connection with 3-Axle Test Truck in Outside Lane
Figure 103. Web Plate Stress Ranges at the Outside Web-Flange Weld Toe at the 10 Inch Slotted Connection Before Retrofit
xxxii
162
162
163
163
171
177
177
178
178
184
185
198

Volume III: Evaluation of Fatigue Cracking in 1-65 Mobile Delta Crossing Bridges - Floortruss-Girder Connections
LIST OF FIGURES (continued)
Figure 104. Web Plate Stress Ranges at the Outside Web-Flange Weld Toe at the 10 Inch Slotted Connection After Retrofit
Figure 105. Web Plate Stress Ranges at the Outside Web-Flange Weld Toe at the 6 Inch Slotted Connection Before Retrofit
Figure 106. Web Plate Stress Ranges at the Outside Web-Flange Weld Toe at the 6 Inch Slotted Connection After Retrofit
Figure 107. Web Plate Stress Ranges at the Top of the 10 Inch Slotted Connection Plate to Web Weld
Figure 108. Web Plate Stress Ranges at the Top of the 6 Inch Slotted Connection Plate to Web Weld
Figure 109. Web Plate Stress Ranges at the Side of the 10 Inch Slotted Connection Plate to Web Weld
Figure 110. Web Plate Stress Ranges at the Side of the 6 Inch Slotted Connection Plate to Web Weld
Figure 111. Out-of-Plane Displacement Ranges at the 10 Inch Slotted Connection Before Retrofit
Figure 112. Out-of-Plane Displacement Ranges at the 10 Inch Slotted Connection After Retrofit
Figure 113. Out-of-Plane Displacement Ranges at the 6 Inch Slotted Connection Before Retrofit
Figure 114. Out-of-Plane Displacement Ranges at the 6 Inch Slotted Connection After Retrofit
Figure 115. Web Plate Stress Range at the Outside Web-Flange Weld Toe Versus Out-of-Plane Displacement Range at the 10 Inch Slotted Connection After Retrofit
Figure 116. Web Plate Stress Range at the Outside Web-Flange Weld Toe Versus Out-of-Plane Displacement Range at the 6 Inch Slotted Connection After Retrofit
xxxiii
198
199
199
200
200
201
201
211
211
213
213
214
214
Volume III: Evaluation of Fatigue Cracking in 1-65 Mobile Delta Crossing Bridges - Floortruss-Girder Connections
LIST OF FIGURES (continued)
Figure 117. Web Plate Stress Range at the Top of the 10 Inch Slotted Connection Plate to Web Weld Versus Out-of-Plane Displacement Range After Retrofit 217
Figure 118. Web Plate Stress Range at the Top ot the 6 Inch Slotted Connection Plate to Web Weld Versus Out-ot-Plane displacement Range After Retrofit 215
Figure 119. Web Plate Stress Range at the Side of the 10 Inch Slotted Connection Plate to Web Weld Versus Out-of-Plane Displacement Range After Retrofit 216
Figure 120. Web Plate Stress Range at the Side of the 6 Inch Slotted Connection Plate to Web Weld Versus Out-of-Plane Displacement Range After Retrofit 216
Figure 121. Vertical Force Component Range in the End Diagonal Versus Out-ot-Plane Displacement Range at the 10 Inch Slotted Connection After Retrofit 220
Figure 122. Vertical Force Component Range in the End Diagonal Versus Out-of-Plane Displacement Range at the 6 Inch Slotted Connection After Retrofit 220
xxxiv
Table 1.
Table 2.
Table 3.
Table 4.
Table 5.
Table 6.
Table 7.
Table 8.
Table 9.
Table 10.
Table 11.
Table 12.
Table 13.
Table 14.
Table 15.
Table 16.
Table 17.
Table 18.
Volume III: Evaluation of Fatigue Cracking in 1-65 Mobile Delta Crossing Bridges - Floortruss-Girder Connections
LIST OF TABLES
Traffic History of the Mobile Delta Crossing Bridges
Web Gap Geometries and Crack Lengths
Plate Girder Dimensions
Floortruss Member Double-Angle Dimensions
Gages Installed at Pier S3-11 Locations Before Retrofit
Gages Installed at Pier S3-4 Locations Before Retrofit
Gages Installed at the Outside Girder Connection of the First Floortruss South of Pier S3-11 After Retrofit
Gage Installed at the Outside Girder Connection of the Second Floortruss North of Pier S3-4 After Retrofit
Calibration Truck Weights for S3-11 Before Retrofit
Calibration Truck Weights for S3-4 Before Retrofit
Calibration Truck Weights for S3-11 After Retrofit
Calibration Truck Weights for S3-4 After Retrofit
Typical Event Sequence for Calibration Tests
Effective Stress Ranges at Critical Locations for Random Truck Data Before Retrofit
Fatigue Limit Exceedance Rates at Critical Locations for Random Truck Data Before Retrofit
Stress and Displacement Ranges at Critical Locations for 5-Axle Test Truck Fast Runs (Typical Loading) Before Retrofit
Stress and Displacement Ranges at Critical Locations for 3-Axle Test Truck Fast Runs Before Retrofit
Displac'ement Range Statistics at Test Locations for Random Truck Data Before Retrofit
xxxv
2
45
47
48
74
75
76
77
86
86
88
88
89
124
137
140
141
144
Table 19.
Table 20.
Table 21.
Table 22.
Table 23.
Table 24.
Table 25.
Table 26.
Table 27.
Table 28.
Table 29.
Table 30.
Volume III: Evaluation of Fatigue Cracking in 1-65 Mobile Delta Crossing Bridges - Floortruss-Girder Connections
LIST OF TABLES (continued)
Regression Analyses of Critical Location Stress Ranges Versus Displacement Ranges for Random Truck Data Before Retrofit
Regression Analyses of Vertical Force Ranges in End Diagonals Versus Displacement Ranges for Random Truck Data Before Retrofit
Static Stresses and Displacements at the 10 Inch Slotted Connection, Before and After Retrofits with Truck Directly Above Floortruss
Static Stresses and Displacements at the 6 Inch Slotted Connection, Before and After Retrofits with Truck Directly Above Floortruss
Percentage Change a of Static Stresses and Displacements at Critical Locations After Retrofit at the 10 Inch Slotted Connection with Trucks Directly Above Floortruss
Percentage Change a of Static Stresses and Displacements at Critical Locations After Retrofit at the 6 Inch Slotted Connection with Trucks Directly Above Floortruss
Effective Stress Ranges at Critical Locations for Random Truck Data Before and After Retrofit
Percentage Change a of Effective Stress Ranges at Critical Locations After Retrofit for Random Truck Data at the 10 and 6 Inch Slot Locations
Stress and Displacement Ranges at Critical Locations at the 10 Inch Slotted Connection for Test Truck Fast Runs, Before and After Retrofit
Stress and Displacement Ranges at Critical Locations at the 6 Inch Slotted Connection for Test Truck Fast Runs, Before and After Retrofit
Percentage Change a of Stress and Displacement Ranges at Critical Locations After Retrofit at the 10 Inch Slotted Connection for Test Truck. Fast Runs
Percentage Change a of Stress and Displacement Ranges at Critical Locations After Retrofit at the 6 Inch Slotted Connection for Test Truck Fast Runs
xxxvi
157
164
181
182
190
191
194
195
203
204
205
206

Table 31.
Table 32.
Table 33.
Table 34.
Volume III: Evaluation of Fatigue Cracking in 1-65 Mobile Delta Crossing Bridges - Floortruss-Girder Connections
LIST OF TABLES (continued)
Stress and Displacement Ranges for Estimated Side-by-Side Test Truck Fast Runs at Critical Locations at the 10 and 6 Inch Slotted Connections with Fully Bolted Connection Plates
Displacement Range Statistics at Test Locations Before and After Retrofit for Random Truck Data
Regression Analyses of Critical Location Stress Ranges Versus Displacement Ranges for Random Truck Data Before and After Retrofit
Regression Analyses of Vertical Force Ranges in End Diagonals Versus Displacement Ranges for Random Truck Data Before and After Retrofit
xxxvii
208
210
217
221

Volume IV: Evaluation of Fatigue Cracking in 1-65 Mobile Delta Crossing Bridges - Executive Summary
TABLE OF CONTENTS
INTRODUCTION
FLOORBEAM-GIRDER CONNECTIONS Rigid Attachment Repair Summary and Conclusions Recommendations
FLOORTRUSS-GIRDER CONNECTIONS Selection of a Retrofit Procedure Summary and Conclusions Recommendations
FILLER PLATE WELD CRACKS Evaluation Methodology Summary and Conclusions Recommendations
REFERENCES
xxxviii
2
9
~5
19
Figure 1.
Figure 2.
Figure 3.
Figure 4.
Figure 5.
Figure 6.
Figure 7.
Volume IV: Evaluation of Fatigue Cracking in 1-65 Mobile Delta Crossing Bridges - Executive Summary
LIST OF FIGURES
Floorbeam-Girder Connection: (a) Section through Plate Girder at Support; (b) Out-ot-Plane Distortion ot Web Gap
Typical Fatigue Cracks Found at Floorbeam-Girder Connections
Rigid Attachment ot Connection Plate to Girder Flange: (a) Section through Plate Girder; (b) Section through Floorbeam Knee Brace
Section through Plate Girder at Floortruss-Girder Connection
Typical Fatigue Cracks Found. at Floortruss-Girder Connections
Connection Plate Slot Detail
Typical Filler Plate Weld Crack
xxxix
3
5
6
10
10
12
16

INTRODUCTION
The 1-65 Mobile Delta Crossing Bridges constitute a six mile section (northbound and
southbound) of interstate highway over the Mobile River delta plains located approximately 20
miles north of Mobile, Alabama. The bridges consist of three basic types: precast concrete
spans, steel plate girder spans, and twin steel tied arch spans. The steel plate girder spans
are made of two main girders which span in the direction of the roadway with transverse
members spaced at 25 ft between the girders. The transverse member types vary based on
the depth of the main girders and are either built-up floorbeams or floortrusses. Three
stringers span continuously across the top of the transverse floorbeams or floortrusses. The
top flange of the girders and stringers support the composite concrete deck. At the tied
arches, the stringers and deck are supported by transverse floortrusses. These floortrusses
are spaced at 50 ft and span between the tie girders of an arch on each side of the roadway.
All steel in the plate girder spans and the tied arch spans is ASTM A588 Grade 50W
weathering steel.
The bridges were constructed in the early 1980's and were opened to traffic in 1983.
The traffic history indicates that approximately 5 million heavy commercial vehicles (3 or more
axles) had crossed each bridge span by the end of 1993. In 1990 and 1991, Alabama
Highway Department (AHD) bridge inspectors discovered fatigue cracks in the girder webs at
floorbeam-girder connections at six locations. All these locations were at girder supports at
piers along the steel plate girder spans. Fatigue cracks were also discovered in welds at five
floortruss-girder connections not at piers. Because the plate girder spans are a two-girder
fracture critical system, there was considerable motivation for providing effective repairs to the
fatigue cracks. The connection details where the fatigue problems were identified are also
repeated a large number of times along the bridges. There are 192 floorbeam-girder
connections at piers like the ones where fatigue cracking was found and 768 additional
similar connections not at piers. There are also 144 floortruss-girder connections not at piers
of the type where the fatigue cracking of the welds was found. Because of the repetition of the
details and the possibility of wide spread fatigue problems in the future, efficient repair
methods were desirable.
1

A connection repair was designed by the AHD for use at the floorbeam-girder
connections. The repair was originally considered for possible use as a preventative
maintenance measure at all 192 floorbeam-girder connections at piers. However, because of
the large expense of performing the repair and because the effectiveness of the repair could
not be guaranteed, field testing of the repair was necessary. The goal of the field tests, which
were a part of this research project, was to evaluate the stress conditions which caused the
fatigue cracking and to evaluate the effectiveness of the AHD repair method.
The fatigue cracks at the floortruss-girder connections were short cracks through the
ends of the fillet welds between the stiffener-connection plate and the girder web. An obvious
short term solution to this problem was to simply grind out the cracked welds. However, the
cracking was suspected to be an early indication of more serious girder web cracking that
might occur in the future. One objective of the project reported here was to evaluate the stress
conditions that caused the cracks and recommend an appropriate repair method.
A third problem was also identified at the floortrusses of the tied arch spans. A number
of welds at spacer plates in the double angle floortruss members were found to be cracked.
These cracks were parallel to the applied stress on the members and did not pose an
immediate threat. However, the possibility of future cracking in the tension members was a
concern. One maintenance strategy considered by the AHD was to remove the filler plates
and grind out the welds. However, this option would be very expensive and was possibly
unnecessary. For the tension members alone this would require the removal of approximately
960 filler plates. A prime objective of the project reported here was to measure the traffic
loading stresses in the floortruss tension members and to address whether it is necessary to
remove the filler plates from these members and grind out the welds:
FLOORBEAM-GIRDER CONNECTIONS
The steel plate girder bridges with transverse floorbeams span across the Tensaw
River, Miffin Lake, Middle River, and Little Lizard Creek. These are three and four span
continuous sections with plate girder web depths of either 84 in. or 96 in. The floorbeam
girder connections at the girder supports are made of a vertical connection plate welded to the
girder web and bolted to the floorbeam (see Figure 1). The connection plate on the inside and
2

DETAILA
I--__ -~-.L-I .... :....J-- Plate Girder Web
Floorbeam -~
Connection Plate
(a)
Flange
Conn. PI.
DETAIL A
(b)
Transverse Stiffener
Girder Support
Pier
Web Gap
Figure '1. Floorbeam-Girder Connection: (a) Section through Plate Girder at Support; (b) Out-of-Plane Distortion of Web Gap
3
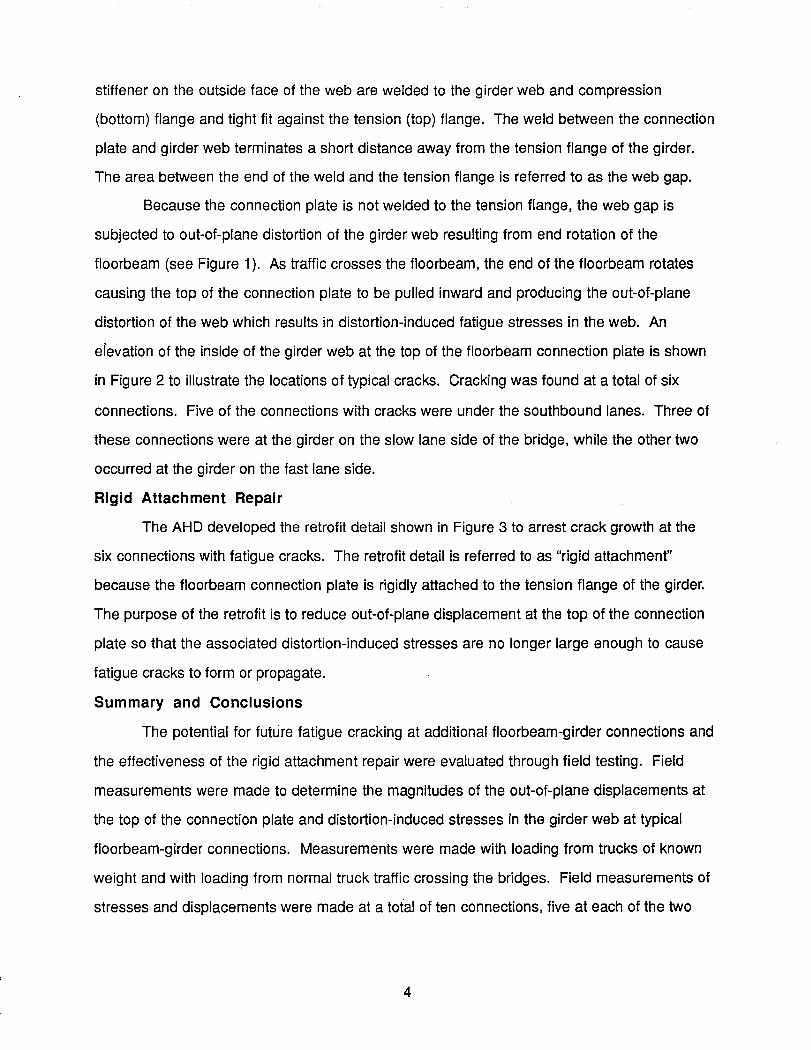
stiffener on the outside face of the web are welded to the girder web and compression
(bottom) flange and tight fit against the tension (top) flange. The weld between the connection
plate and girder web terminates a short distance away from the tension flange of the girder.
The area between the end of the weld and the tension flange is referred to as the web gap.
Because the connection plate is not welded to the tension flange, the web gap is
subjected to out-of-plane distortion of the girder web resulting from end rotation of the
floorbeam (see Figure 1). As traffic crosses the floorbeam, the end of the floorbeam rotates
causing the top of the connection plate to be pulled inward and producing the out-of-plane
distortion of the web which results in distortion-induced fatigue stresses in the web. An
efevation of the inside of the girder web at the top of the floorbeam connection plate is shown
in Figure 2 to illustrate the locations of typical cracks. Cracking was found at a total of six
connections. Five of the connections with cracks were under the southbound lanes. Three of
these connections were at the girder on the slow lane side of the bridge, while the other two
occurred at the girder on the fast lane side.
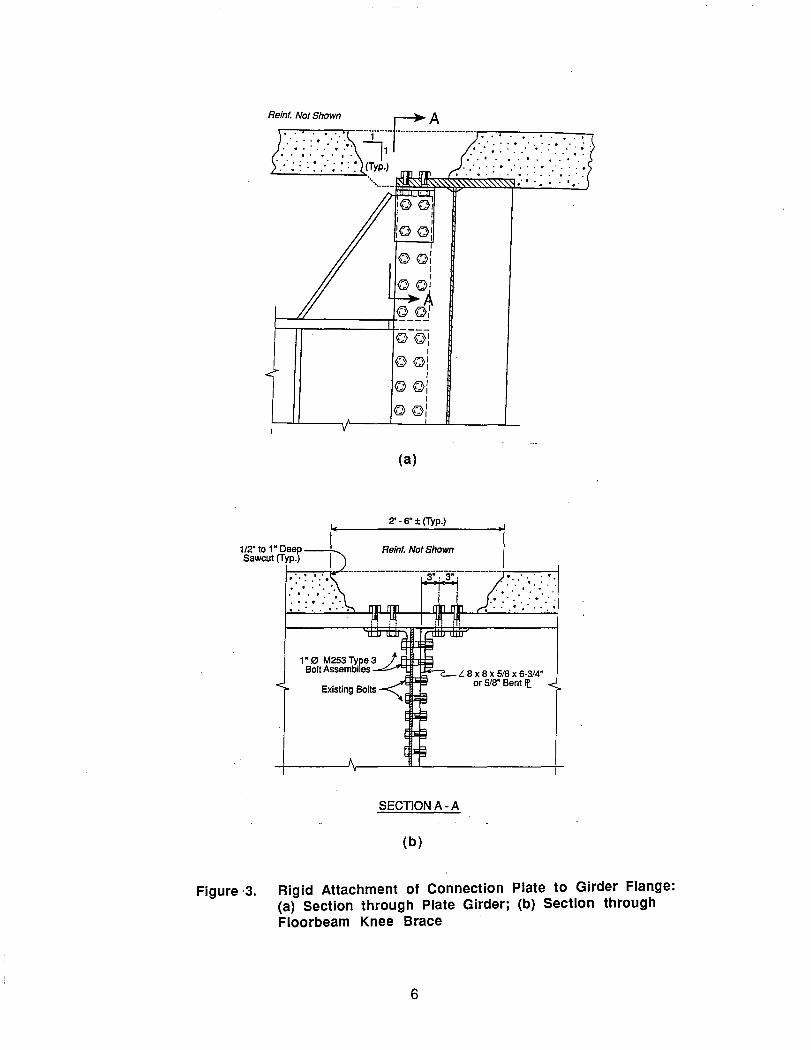
Rigid Attachment Repair
The AHD developed the retrofit detail shown in Figure 3 to arrest crack growth at the
six connections with fatigue cracks. The retrofit detail is referred to as "rigid attachment"
because the floorbeam connection plate is rigidly attached to the tension flange of the girder.
The purpose of the retrofit is to reduce out-of-plane displacement at the top of the connection
plate so that the associated distortion-induced stresses are no longer large enough to cause
fatigue cracks to form or propagate.
Summary and Conclusions
The potential for future fatigue cracking at additional floorbeam-girder connections and
the effectiveness of the rigid attachment repair were evaluated through field testing. Field
measurements were made to determine the magnitudes of the out-of-plane displacements at
the top of the connection plate and distortion-induced stresses in the girder web at typical
floorbeam-girder connections. Measurements were made with loading from trucks of known
weight and with loadin~ from normal truck traffic crossing the bridges. Field measurements of
stresses and displacements were made at a total of ten connections, five at each of the two
4

fatigue crack at Jf web-flange weld
girder tension flange
weld
~--~------~~---
/ fatigue cracks at connection plate weld
~ Q. c: o :a Q) c: c: o (.)
girder web
Figure 2. Typical Fatigue Cracks Found at Floorbeam-Girder Connections
5
Reinf. Not Shown FA ::(·~:>::~-:~E----~<:) ~".: ~ ..... :: .
1/2" to 1" Deep Sawcut (Typ.)
©©: I
©©: I
.©©: I
©©:
(a)
2' - 6" ± (Typ.)
Reinf. Not Shown
. . .. .. .... . .
• ~', e' " • : ••
L 8x8x5/8x6-3/4" or 5/8" Bent If.
. '.'
SECTION A-A
(b)
Figure -3. Rigid Attachment of Connection Plate to Girder Flange: (a) Section through Plate Girder; (b) Section through Floorbeam Knee Brace
6
girder depths. These five connections included three connections at girder supports at piers,
one connection at the first floorbeam away from the pier, and one connection at the second
floorbeam away from the pier. The field measurements were compared to results of laboratory
tests performed by other researchers to assess the potential for future fatigue cracking at
similar connections along the bridge. Measurements were also made at four of these
floorbeam-girder connections after the rigid attachment retrofit was performed. These
measurements provided direct comparisons for evaluating the effectiveness of the rigid
attachment retrofit.
The field test data indicated that only two of the six connections tested at pier
floorbeam locations experienced distortion-induced stress ranges large enough to cause
fatigue cracking. One of the connections was at an 84 in. girder, and one was at a 96 in.
girder. Given the fact that cracks have been detected at the piers at four locations along 84 in.
girders and one location along 96 in. girders, and that low stress conditions were found at four
of the connections tested, it appears that significantly different stress conditions exist at the
pier floorbeam connections along the bridges. No pattern was identified that clearly indicates
which locations along the bridges are most likely to experience cracking in the future. The test
results do indicate that cracking is not likely to occur at all pier floorbeam locations. The small
number of connections chosen for field tests does not allow an accurate estimate of
percentage of connections at which cracking will occur. However, it appears that cracking can
be expected at approximately one-third of the pier f100rbeam connections.
Both of the connections tested at the first floorbeam away from pier supports had high
distortion-induced stresses. The stress ranges occurring at both connections were high
enough to eventually caus~ fatigue cracking. Cracking can be expected in the future at
connections at the first floorbeam away from the pier.
The connection details tested at the second floorbeam away from the pier had very
small distortion-induced stresses. Fatigue cracking is very unlikely to occur at any such
locations in the future.
Since the plat~ girders of a two girder system are considered fracture critical members,
the possibility of the web cracks turning and propagating into the tension flange is of interest.
7
The field measurements indicate that for all the details tested, the in-plane stress ranges in the
tension flange were very small (below 1.0 ksi) at the piers and first floorbeams away from the
piers. Therefore, the initiation of a web gap crack and growth to a critical length into the
tension flange is not likely to occur in a short period of time. Hence, bridge inspections are not
necessary at times shorter than the normal two year inspection interval.
An evaluation of the effectiveness of the rigid attachment retrofit was performed by
comparing distortion-induced stress ranges and displacements in uncracked connections
before and after the retrofit was performed. The comparisons indicated that the positive
attachment retrofit is an effective repair method. The retrofit was installed at one pier location
where previous measurements indicated that fatigue cracking would eventually occur. The
retrofit reduced the out-of-place displacement of the connection plate and distortion-induced
stresses by approximately 70%. This was a large enough reduction in distortion-induced
stresses to conclude that fatigue cracking will not occur at that location in the future. Based on
the field test results, the positive attachment retrofit was judged to be an effective measure to
prevent cracking and an effective repair method for connections where distortion-induced
fatigue cracks have formed.
Recommendations
Due to the low in-plane stress ranges measured in the tension flanges at all the test
locations, web-gap cracking resulting from out-of-plane bending at the floorbeam-girder
connections does not pose as great an emergency as once suspected. Furthermore, the
distortion-induced stress conditions at the various test locations were shown to vary
significantly. These findings indicate that performing the positive attachment retrofit to prevent
future cracking is unwarranted. Instead, the results of this project indicate that floorbeam
girder connections with web gap cracking should be repaired on an as needed basis. The
normal two year inspection cycle will be sufficient for identifying new occurrences of web gap
cracks. When cracks are found as a result of inspection, the crack tips should be removed by
drilling a one inch diameter hole at each crack to temporarily arrest the growth of the cracks.
This period of arrest will allow all the connections with web gap cracking found in two
8

consecutive inspections to be repaired by rigid attachment at the same time. However, it is not
recommended that hole drilling be used to delay rigid attachment for more than three years.
FLOORTRUSS-GIRDER CONNECTIONS
The deepest plate girder spans along the Mobile Delta Crossing Bridges have
transverse floortrusses supporting the stringers and deck instead of built up floorbeams.
Floortrusses were used at girder web depths of 106 in., 126 in. and 148 in. The floortruss
girder connection is composed of a vertical stiffener-connection plate that is welded to the
plate girder web and bottom flange and bolted to the floortruss through a trapezoidal gusset
plate (see Figure 4). The floortruss connection plates are welded to the girder web and the
compression flange (bottom flange) and are tight fit to the tension flange (top flange) in the
negative moment regions of the main girders near the pier supports. The connection plate to
girder web welds terminate a short distance from the girder tension flange plate which creates
a web gap similar to the one described at the floorbeam-girder connection. This web gap
region also experiences distortion-induced fatigue stresses which result from out-of-plane
displacement at the top of the connection plate.
Fatigue cracks were found by AHD bridge inspectors at floortruss-girder connection
web gaps through the top of the connection plate to web welds as shown in Figure 5. The
cracks had not propagated from the weld throats into the web plate, and therefore, did not
pose an immediate threat to the bridge integrity. However, this type of crack is likely to
eventually propagate into the girder web. The crack could then turn perpendicular to the in
plane bending stress in the girder web and become a much more significant problem.
Cracking was discovered at a total of five floortruss-girder connections. Unlike the cracking of
the floorbeam-girder connections, all cracks were located at connections not at girder
supports. All cracks found were in the negative moment region of the girders in the web gap
near the tension flange at connections one and two floortrusses away from the girder
supports. Three of the five connections with fatigue cracking were chosen for investigation
through field measurements. In addition, three connections with no fatigue cracks were also
chosen for investigation.
9
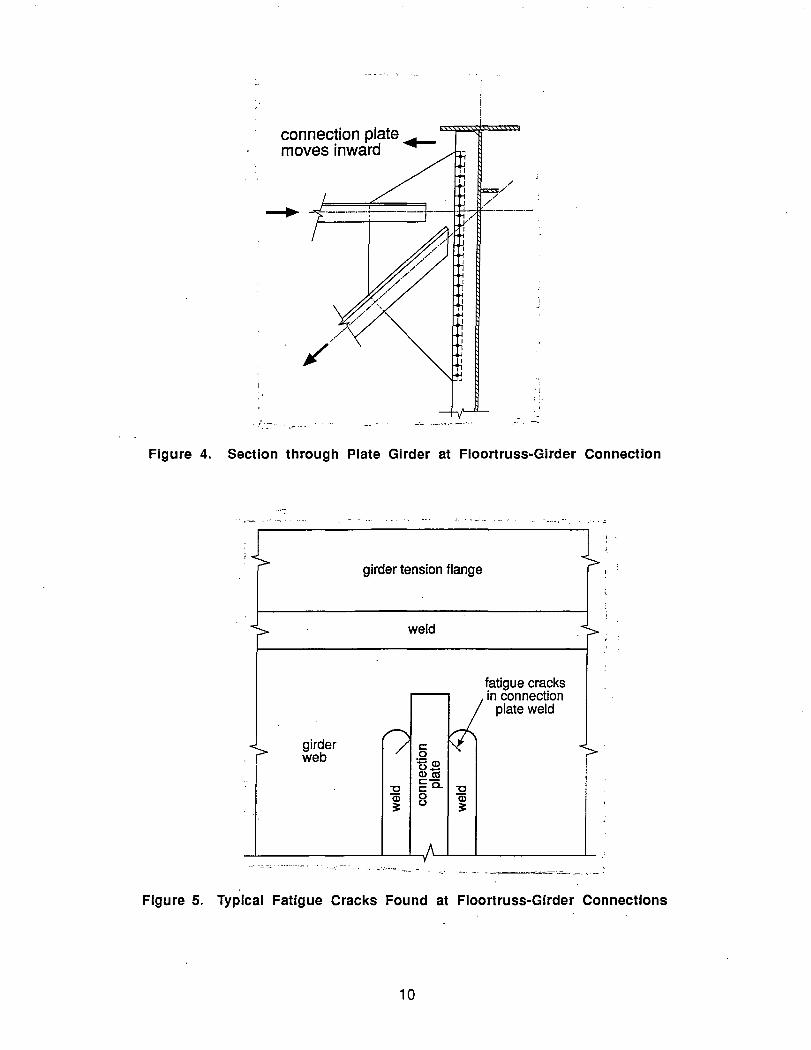
connection plate ~ moves inward
' .. :- ._-, ,-- ,-.
: ~.
Figure 4. Section through Plate Girder at Floortruss-Girder Connection
girder web
girder tension flange
weld
fatigue cracks in connection
plate weld
Figure 5. Typical Fatigue Cracks Found at Floortruss-Girder Connections
10
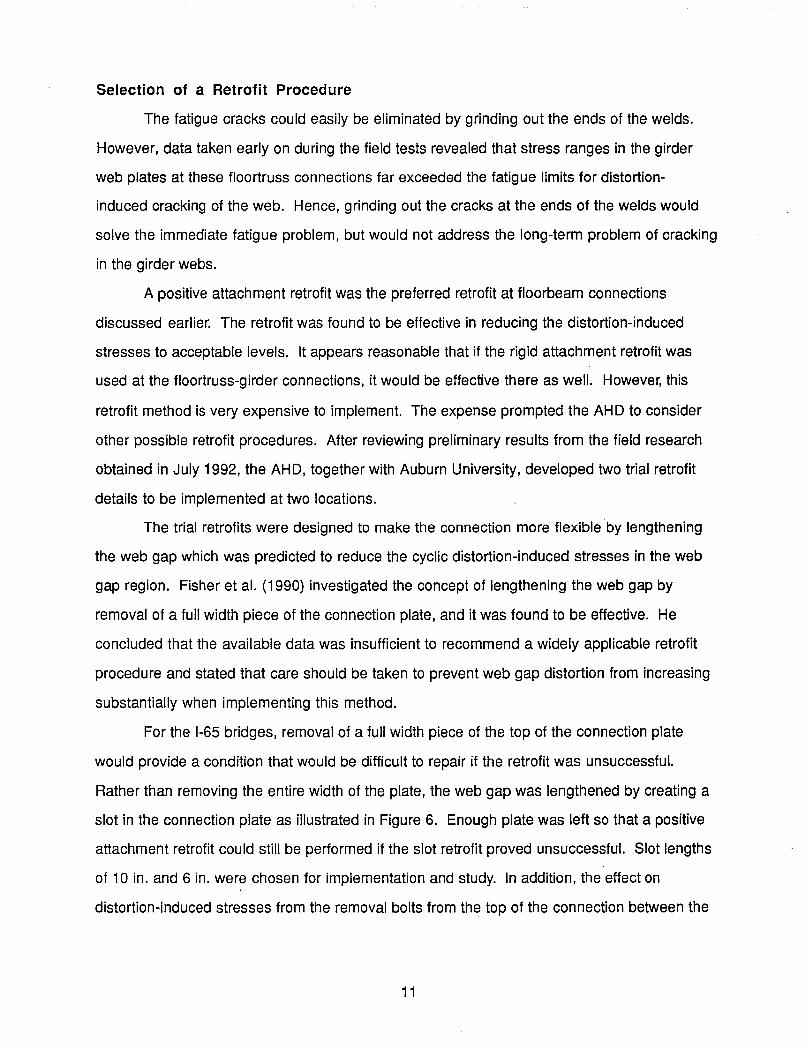
Selection of a Retrofit Procedure
The fatigue cracks could easily be eliminated by grinding out the ends of the welds.
However, data taken early on during the field tests revealed that stress ranges in the girder
web plates at these floortruss connections far exceeded the fatigue limits for distortion
induced cracking of the web. Hence, grinding out the cracks at the ends of the welds would
solve the immediate fatigue problem, but would not address the long-term problem of cracking
in the girder webs.
A positive attachment retrofit was the preferred retrofit at floorbeam connections
discussed earlier. The retrofit was found to be effective in reducing the distortion-induced
stresses to acceptable levels. It appears reasonable that if the rigid attachment retrofit was
used at the floortruss-girder connections, it would be effective there as well. However, this
retrofit method is very expensive to implement. The expense prompted the AHD to consider
other possible retrofit procedures. After reviewing preliminary results from the field research
obtained in July 1992, the AHD, together with Auburn University, developed two trial retrofit
details to be implemented at two locations.
The trial retrofits were designed to make the connection more flexible by lengthening
the web gap which was predicted to reduce the cyclic distortion-induced stresses in the web
gap region. Fisher et al. (1990) investigated the concept of lengthening the web gap by
removal of a full width piece of the connection plate, and it was found to be effective. He
concluded that the available data was insufficient to recommend a widely applicable retrofit
procedure and stated that care should be taken to prevent web gap distortion from increasing
substantially when implementing this method.
For the 1-65 bridges, removal of a full width piece of the top of the connection plate
would provide a condition that would be difficult to repair if the retrofit was unsuccessful.
Rather than removing the entire width of the plate, the web gap was lengthened by creating a
slot in the connection plate as illustrated in Figure 6. Enough plate was left so that a positive
attachment retrofit could still be performed if the slot retrofit proved unsuccessful. Slot lengths
of 10 in. and 6 in. were chosen for implementation and study. In addition, the effect on
distortion-induced stresses from the removal bolts from the top of the connection between the
11

connection plate
flame-cut edge for ___ -+_~ plate removal
flame-cut to edge of connection plate weld
truss top chord
o
o
o
web-flange weld
portion of connection plate and weld ground smooth with web face
(all cut edges to be ground smooth)
connection plate to web weld
web plate
A325 high strength bolts (23) 7/8" dia. @ 3" c.c.
Figure 6. Connection Plate Slot Detail
12
trapezoidal gusset plate and the stiffener/connection plate was investigated. Two bolts were
removed at the connection with the 6 in. slot, and three bolts were removed at the connection
with the 10 in. slot. Field measurements were made at both these connections after the slot
was cut with all connection plate bolts in place and with selected bolts removed.
Summary and Conclusions
Evaluating the potential for future fatigue cracking at additional floortruss-girder
connections through field testing was one objective of the research. Stress and displacement
measurements were taken at six floortruss-girder connection details. These connections were
located one and two floortrusses away from the girder supports at two different girder depths.
The field tests verified that the stress ranges occurring in the connection plate to web welds
were high enough at all six connections test~d to eventually cause fatigue cracking. The field
tests also revealed that all six floortruss-girder connections tested experienced distortion
induced stress ranges sufficient to cause fatigue cracking in the girder webs. Based on the
field test results, fatigue cracking in the connection plate to web welds and girder webs can be
expected to eventually occur at a large percentage of floortruss-girder connections along the
plate girder spans.
Some significant variations in the stress conditions were found at the floortruss-girder
connections tested. Overall the 106 in. girder connections consistently experienced more
severe stress conditions than the 126 in. girder connections. Based on this result, it is
estimated that the stress conditions at the 148 in. girders are less severe than at the smaller
girder depths. The distortion-induced stresses in the girder webs were also higher than
expected. The field measurements indicate that heavy side-by-side trucks can cause yielding
of the web in the web gap at the floortruss girder connections of the 106 in. girders. To reduce
the distortion-induced stresses and improve the fatigue performance of the floortruss-girder
connections, the lengthened web gap retrofit was designed, implemented and tested.
The 6 in. slot retrofit was judged to be ineffective. The 6 in. slot produced only modest
changes in the distortion-induced stress conditions. The removal of bolts from the
connections was also found to be ineffective at both slot lengths. The removal of bolts
13
produced both increases and decreases in stresses at various critical locations. In most cases
the changes were less than 6%.
Overall, the 10 in. slot retrofit was judged to be successful. The 10 in. slot retrofit was
effective in reducing the stress ranges at critical locations by approximately 50 to 75% while
limiting the out-of-plane displacements to an acceptable level. The 10 in. slot retrofit will not
eliminate all possibility of fatigue cracking at the floortruss-girder connections, but the
reductions in stress ranges at the slot correspond to an increase in remaining fatigue life by
factors of 27 to 64.
Recom mendations
The field test results indicate that the distortion-induced stresses at the floortruss-girder
connections are very high at the 106 in. girders. The use of a slot retrofit similar to the one
tested in this project is recommended as a preventative maintenance measure at the
floortruss-girder connections along the 106 in. girders. A slot of the type shown in Figure 6
with a total length of 12 in. is recommended for floortruss-girder connections away from the
girder supports in the negative moment regions. This small increase in slot length, from 10 in.
to 12 in., beyond the length used in the field tests will enhance the performance of the retrofit
without significantly increasing the out-of-plane displacement of the connection. The slot will
eliminate the possibility of yielding in the web gaps and will significantly increase the
remaining fatigue life of the connections. Based on the less severe stress conditions
measured at the 126 in. girders, the need for preventative measures at the 126 in. and 148 in.
girders is not as great as at the 106 in. girders.
The stresses in the connection plate weld at the top of the connection plate were found
to be above the fatigue limit. Weld cracks of the type already found by AHD bridge inspectors
can be expected in the future and will probably be common at all girder depths. As originally
mentioned in the project proposal, simply grinding out the weld cracks is a viable repair.
Although the repair will not be permanent, several years may pass before the weld cracks re
initiate. Considering the large distortion-induced stresses occurring at the floortruss-girder
connections, the slotted connection plate retrofit is recommended instead of simply grinding
14
out the weld cracks. This will provide a significant increase in fatigue life without significantly
increasing the repair costs relative to grinding out the weld cracks.
The slotted connection plate retrofit in combination with drilling holes aUhe crack tips is
recommended as a repair for distortion-induced web cracking at the floortruss-girder
connections. For example, this combination is recommended when web cracking occurs at
connections where the slot was not used as a preventative measure. Although there is no
proof that this will provide a permanent repair, this method should prevent re-initiation of
cracks for several years.
FILLER PLATE WELD CRACKS
Bridge inspectors discovered filler plate weld cracks in numerous double angle tension
and compression members of the floortrusses of the tied arch spans. A typical filler plate weld
crack is shown in Figure 7. The ends of the filler plates are attached to the back to back legs
of the double angles with groove welds. The welds are approximately two inches long and
are ground flush with the ends of the filler plates. The double angles and filler plates were
made of unpainted A588 weathering steel and were susceptible to corrosion. The normal
weathering, or corrosion, of the A588 steel caused rust to build up between the double angle
legs and filler plates. Built up corrosion products in restricted areas, called "pack rust", can
generate pressures of up to 10 ksi (Kulicki et al. 1990). By considering an internal pressure of
10 ksi over the area between the double angle and filler plate and making a generous
estimate of the typical weld throat size, the force on the weld at each end of the filler plate was
calculated to be approximately three times the capacity of the weld. Thus, the confined rust is
considered to be the cause of the filler plate weld cracks in the double angle members at the
tied arch spans.
The weld cracks created by the "pack rust" are parallel to the applied stress on the
double angles and have not propagated into the angles and pose no immediate threat to the
integrity of the trusses. However, the possibility of future cracking in the tension members was
a concern prior to this project. The goal of the project reported here was to measure the traffic
loading stresses in the floortruss tension members and to address whether it is necessary to
remove the filler plates from these members and grind out the welds.
15

Figure 7. Typical Filler Plate Weld Crack
16

Evaluation Methodology
Field measurements of stresses in the floortruss tension members were made at
quarter-span and mid-span locations along the arch span with loading from trucks of known
weight and with loading from the normal truck traffic crossing the bridges.
The field measurements were compared to the fatigue limit for the filler plate weld
details. Stresses in the filler plate weld details of the double angle members at the tied arch
span can be classified under Stress Category C (AASHTO 1991). This category applies to the
base metal with longitudinal loading at fillet and groove welded attachments less than or
equal to two inches in length. The allowable fatigue stress range, or fatigue limit, for a
Category C detail with redundant load paths and subjected to over two million cycles is 10 ksi.
For fatigue cracking to occur in the double angle tension members very near the filler plate
welds, the area around the weld details would have to experience stress ranges from traffic
loading greater than 10 ksi. Along with the comparison of the field test data to the AASHTO
fatigue limit, fracture mechanics approaches were applied to draw conclusions about whether
fatigue cracking will pose a problem at the tied arch span. Fracture mechanics methods were
used to predict the fatigue limit and to estimate a tolerable crack size and fatigue life for the
floortruss double angle members at the tied arch span.
Summary and Conclusions
Practically all of the field measurements of stresses were made at two floortrusses
along the arch span. Some measurements were made at a third floortruss for comparison
purposes. The difference in stresses measured at the various floortrusses was found to be
minimal. Thus, the measured stresses were concluded to be representative of those occurring
in all the floortrusses.
Based on field test data, the four outer diagonal members were found to be the highest
stressed members in the floortrusses. For these four critical members, the maximum extreme
fiber stress ranges were 15 to 20 percent higher than the axial stress ranges. These
percentage increases in stresses due to bending were found to be unaffected by truck weight
or lane position. Stresses found in the four critical members using a general planar frame
17
computer program were consistently higher yet comparable in most cases to the measured
stresses.
The highest stress range found through field testing was 4.4 ksi. This worst case value
is less than half the design AASHTO fatigue limit of 10 ksi for the filler plate weld details. The
conditions existing after the filler plate welds have cracked (failed) are not considered to be
significantly worse than the as-designed conditions. These comparisons indicate that fatigue
cracking is not likely to occur at the filler plate welds regardless of whether or not the welds fail
due to the pack rust.
Estimations and predictions concerning the double angle tension members based on
fracture mechanics principles also indicate that fatigue cracking is not a threat to the integrity
of the tied arch span floortrusses. Estimates of the fatigue-crack-initiation threshold indicate
that fatigue cracking will not occur. Also, fatigue life calculations indicate that if fatigue cracks
do initiate in the angles at the filler plate welds, these cracks will grow at a sufficiently slow
rate to be found in the normal two year bridge inspections.
Therefore, based on the comparisons of maximum measured stress range to the
fatigue limit and the results from the fracture mechanics calculations, fatigue cracking in the
double angle tension members near the filler plate weld cracks is not problem.
Recommendations
Because of the conclusion that the development of fatigue cracking in the tension
members of the tied arch span floortrusses is not a problem, removing the filler plates from
those members and grinding out the welds is not necessary. However, if weld cracks become
severe enough to cause consecutive filler plates to break completely away from a
compression member, buckling in that member is possible. Hence, for compression members
having two or more consecutive failed filler plate welds, replacement of the filler plates using a
new filler plate and a single high strength bolt is recommended.
18

REFERENCES
American Association of State Highway and Transportation Officials (1992). Standard Specifications fQr Highway Bridges, 15 Edition, Washington, D.C.
Fisher, J.W., Jin, J., Wagner, D.C., and Yen, B.T. (1990). "Distortion Induced Cracking in Steel Bridge Members," Final Report. ATLSS No. 90-07. NCHRP No. 12-28(6}.
Kulicki, J.M., Prucz, Z., Sorgenfrei, D.F., Martz, D.R., and Young, W.T. (1990). "Guidelines for Evaluating Corrosion Effects in Existing Steel Bridges." Transportation Research Record ~, National Research Council, Washington, D.C., 7-19.
19
Related Documents