Spokane Valley-Rathdrum Prairie Aqui Water Demand Foreca Presented by: Mike Hermanson Water Resources Specialist Spokane County Utilities Spokane River Forum Conference May 23, 2011

Spokane Valley-Rathdrum Prairie Aquifer Water Demand Forecasts Presented by: Mike Hermanson Water Resources Specialist Spokane County Utilities Spokane.
Dec 24, 2015
Welcome message from author
This document is posted to help you gain knowledge. Please leave a comment to let me know what you think about it! Share it to your friends and learn new things together.
Transcript

Spokane Valley-Rathdrum Prairie AquiferWater Demand Forecasts
Presented by:
Mike HermansonWater Resources Specialist
Spokane County Utilities
Spokane River Forum ConferenceMay 23, 2011

Background
• 2010 Spokane River Forum Water Demand Presentations
– Idaho Future Demand Study Draft Results presentation
– Spokane County Water Demand Model presentation of project goals, objectives, concepts.

Presentation Overview
• Spokane County Water Demand Model• Idaho Future Demand Study• Study Compatibility

Spokane County Water Demand Model
County Forecast
PublicSupply
Self Supply Residential
Self SupplyIndustry
Agricultural
CommercialIndustrial
UrbanIrrigation
Public-SupplyAgriculture
Single Family
Multi-Family
Non RevenueWater
Residence& Yard
SmallAgriculture
ThermoelectricPower
Golf Courses
Large Industry
Livestock
IrrigatedAcres
• Segregated by Water Use Sector– each subsector has a unique submodel, or way of calculating
water demand

Spokane County Water Demand Model• Segregated
Spatially– 487 separate
forecast units– A unique water
demand calculation is done for each forecast unit

• Segregated in monthly increments
Spokane County Water Demand Model
0
100
200
300
400
500
600
700
2010
2040
CFS(
cubi
c fee
t pje
r sec
ond)
SVRP Aquifer Monthly Water Demand 2010 & 2040

County Forecast
PublicSupply
Self Supply Residential
Self SupplyIndustry
Agricultural
CommercialIndustrial
UrbanIrrigation
Public-SupplyAgriculture
Single Family
Multi-Family
Non RevenueWater
Residence& Yard
SmallAgriculture
ThermoelectricPower
Golf Courses
Large Industry
Livestock
IrrigatedAcres
Each forecast unit can have different inputs into each sub model
• Disaggregated Model– In each forecast unit(487) there is a calculation for
each submodel (13) for each month 12– 75,972 water demand calculations per year
0
100
200
300
400
500
600
700
2010
2040
CFS(
cubi
c fee
t pje
r sec
ond)
SVRP Aquifer Monthly Water Demand 2010 & 2040
Water demand calculation for each month
Spokane County Water Demand Model

• Developed and runs in Excel 2007
– Series of interconnected spreadsheets and formulas
Spokane County Water Demand Model
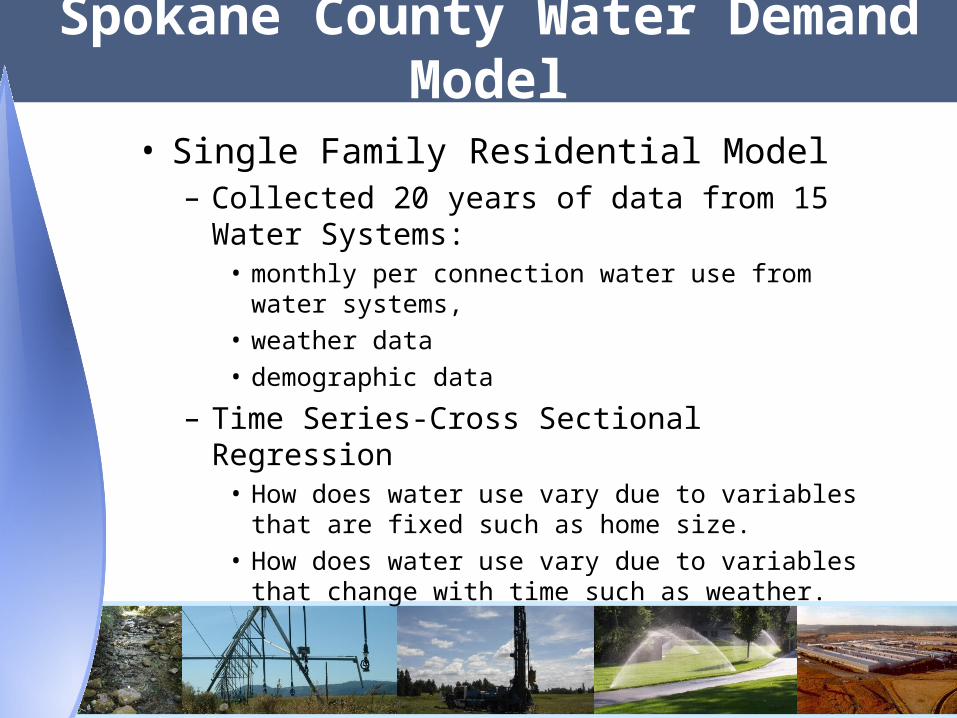
• Single Family Residential Model– Collected 20 years of data from 15 Water Systems:
• monthly per connection water use from water systems, • weather data• demographic data
– Time Series-Cross Sectional Regression• How does water use vary due to variables that are fixed
such as home size.• How does water use vary due to variables that change with
time such as weather.
Spokane County Water Demand Model
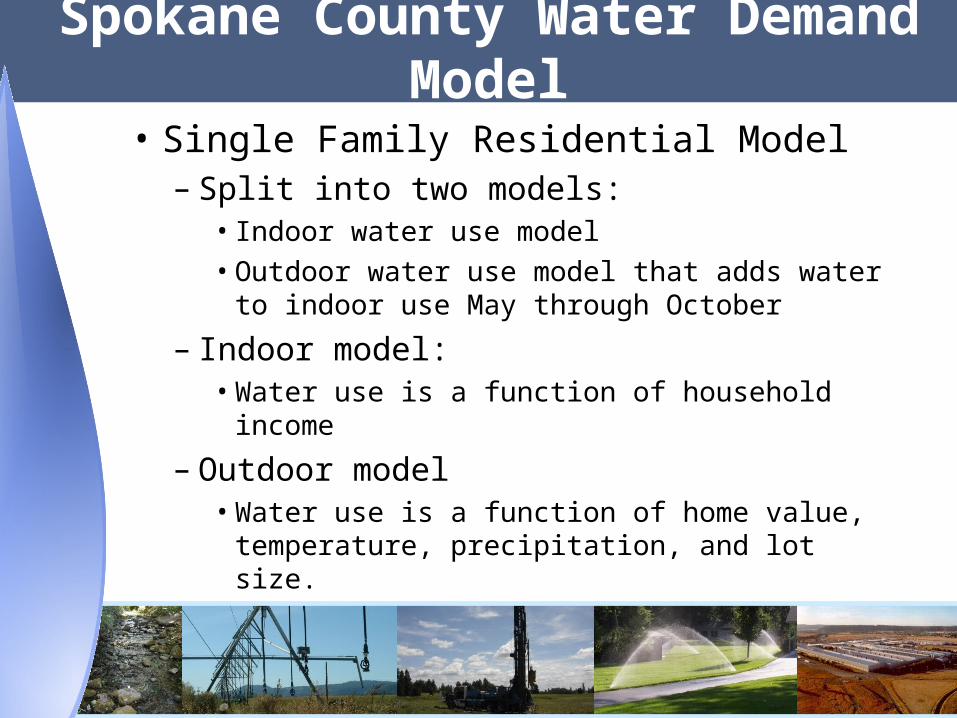
• Single Family Residential Model– Split into two models:
• Indoor water use model• Outdoor water use model that adds water to
indoor use May through October – Indoor model:
• Water use is a function of household income– Outdoor model
• Water use is a function of home value, temperature, precipitation, and lot size.
Spokane County Water Demand Model

Variables Scenario 1 Scenario 2Household Income 30,000$ 80,000$ Assessed Value 144,000$ 252,179$ Average Max Temp
May 68 68June 75.13 72July 85.45 82August 83.06 85September 76.67 73October 60 52.26
Total PrecipMay 0.93 1June 1.18 2July 0.48 0.48August 0.74 1September 0.51 0.01October 2.33 2
Averag Lot Size > 0.6 acres 0 0City of Spokane Water Service 0 0
Jan Feb Mar Apr May Jun Jul Aug Sep Oct Nov DecScenario 1 143 143 143 143 545 704 1022 936 752 403 143 143Scenario 2 226 226 226 226 1040 1201 1775 1952 1348 558 226 226
0
500
1000
1500
2000
2500
Jan
Feb
Mar
Apr
May Jun Jul
Aug
Sep
Oct
Nov Dec
Gal
lons
per
day
per
con
necti
onMonth
Single Family-Public Supply
Scenario 1
Scenario 2
Indoor model r2 = 0.55Outdoor model r2 = 0.74
Spokane County Water Demand ModelSingle Family Residential Model - Example

Sector Modeled Reported Relative % Difference
Total Production 41,895 41,530 0.88 %
Single Family Residential 15,920 15,617 1.92%
Multi Family Residential 3,996 4,102 -2.62%
Total Residential 19,916 19,719 0.99%
Commercial/Industrial 9,528 9,798 -2.79%
Total Non Residential 10,758 10,118 6.13%
Non Revenue 3,433 3,500 -1.92%
Annual Public Water System Use: Modeled vs. Reported
Reported in millions of gallons per year
Spokane County Water Demand Model

• Impact of weather on water use
300
400
500
600
700
800
90019
98
1999
2000
2001
2002
2003
2004
2005
2006
2007
2008
Ann
ual A
vera
ge G
PD
SCWD#3 WSA 2
Actual
Modeled
300
400
500
600
700
800
900
2002
2003
2004
2005
2006
2007
2008
2009
Ann
ual A
vera
ge G
PD
City of Spokane
Actual
Modeled
300
400
500
600
700
800
900
1998
1999
2000
2001
2002
2003
2004
2005
2006
2007
2008
Ann
ual A
vera
ge G
PD
SCWD#3 WSA 3
Actual
Modeled
300
400
500
600
700
800
900
1991
1992
1993
1994
1995
1996
1997
1998
1999
2000
2001
2002
2003
2004
2005
2006
2007
2008
2009
Ann
ual A
vera
ge G
PD
Whitworth Water District
Actual
Modeled
Spokane County Water Demand Model

• Demand from SVRP Aquifer from Spokane County
Spokane County Water Demand Model

• Demand from SVRP Aquifer
Reported in billions of gallons per year
Year Water Demand
2010 53.86
2015 56.44
2020 59.70
2025 62.63
2030 65.71
2035 68.79
2040 71.87
Change 18.01
% Growth 33%
Spokane County Water Demand Model

• Monthly Demand from SVRP Aquifer from Spokane County
0
100
200
300
400
500
600
700
2010
2040
CFS(
cubi
c fee
t pje
r sec
ond)
SVRP Aquifer Monthly Water Demand 2010 & 2040
156 CFS difference
Spokane County Water Demand Model

• Conservation and Weather– Conservation efforts can be
masked by changes in weather
Spokane County Water Demand Model
-
5
10
15
20
25
30
35
40
2010 2015 2020 2025 2030 2035 2040
2005 weather
2006 weather 5% conservation
20 year average weather
2006 weatherBillio
ns o
f Gal
lons
per
year
Forecast Year
Comparison of Conservation and Weather on Water Demand
-
5
10
15
20
25
30
35
40
2010 2015 2020 2025 2030 2035 2040
2005 weather
2006 weather 5% conservation
20 year average weather
2006 weatherBillio
ns o
f Gal
lons
per
year
Forecast Year
Comparison of Conservation and Weather on Water Demand
no conservation
no conservation
no conservation

Idaho Future Demand Study• Includes an estimate of current and future use by water use
sector on an annual basis:– Public Water Systems– Self Supplied Domestic– Self Supplied Commercial & Industrial– Agriculture
• Separates Irrigation and Non-Irrigation Use

• Evaluates consumptive vs. non consumptive use
• Range of population & employment growth scenarios
• Detailed analysis of conservation scenarios• Evaluation of potential climate change impacts
Idaho Future Demand Study

WA & ID Study Compatibility• Water Use by Sector
Water Use Sector WA IDPublic Water Systems 135,132 34,430
Self Supplied Domestic 411 8,800
Self Supplied Commercial/Industrial 20,988 4,220
Agriculture 5,555 24,700
Total 162,086 72,150
Values in annual acre feetValues are total use

• Aquifer Total Demand
WA & ID Demand
Idaho scenario – medium growth & no conservation
-
20
40
60
80
100
120
2010 2015 2020 2025 2030 2035 2040
Idaho Demand
Washington Demand
SVRP Aquifer Total Annual Water Demand Projections

• Additional Work that would enhance compatibility– Idaho:
• evaluate demand on a monthly basis– Washington:
• Utilize model to:– Develop alternate conservation scenarios– Develop alternate growth scenarios– Estimate consumptive/non consumptive use
WA & ID Demand
Related Documents