1 SPM Anatomy toolbox Version 1.5 The combination of functional imaging and probabilistic cytoarchitecture Manual Author: Simon Eickhoff Institut for Medicine (IME); Research Center Jülich Leo-Brandt-Str. 5; 52425 Juelich, Germany Phone + 49 2461-61-5219 / Fax + 49 2461-61-2820 e-mail: [email protected] / [email protected]

Welcome message from author
This document is posted to help you gain knowledge. Please leave a comment to let me know what you think about it! Share it to your friends and learn new things together.
Transcript
1
SPM Anatomy toolbox
Version 1.5
The combination of functional imaging and probabilistic cytoarchitecture
Manual
Author:
Simon Eickhoff Institut for Medicine (IME); Research Center Jülich
Leo-Brandt-Str. 5; 52425 Juelich, Germany Phone + 49 2461-61-5219 / Fax + 49 2461-61-2820
e-mail: [email protected] / [email protected]
2
Anatomical probability maps provided wuth the current release
Amygdala (superficial, latero-basal and centro-medial complex)
• Amunts,K. et al., (2005). Anat. Embryol. (Berl) 210, 343-352.
Hippocampus
• Amunts,K. et al., (2005). Anat. Embryol. (Berl) 210, 343-352.
BA 17 and BA 18 (V1 / V2)
• Amunts,K et al., (2000). Neuroimage. 11, 66-84.
Broca’s region (Area 44 / Area 45)
• Amunts,K. et al., (1999). J. Comp Neurol. 412, 319-341.
Fiber tracts
• Burgel,U. et al., (2006). Neuroimage 29, 1092-1105.
• Burgel,U. et al., (1999) Neuroimage. 10(5), 489-99.
Anterior IPS (Areas hIP1 and hIP2)
• Choi,H.J. et al., (2006). J Comp Neurol. 495(1), 53-69.
Parietal operculum / SII (Areas OP 1 – OP 4)
• Eickhoff,S.B et al., (2006). Cereb. Cortex 16, 254-267.
• Eickhoff,S.B et al., (2006). Cereb. Cortex 16, 268-279.
Premotor cortex (Area 6)
• Geyer,S. (2003). The Microstructural Border Between the Motor and the Cognitive Domain in the Human Cerebral Cortex (Wien: Springer).
Motor cortex (Areas 4a and 4p)
• Geyer,S. et al., (1996). Nature 382, 805-807.
Primary somatosensory cortex (Areas 3a, 3b, 1)
• Geyer,S. et al., (1999). Neuroimage. 10, 63-83.
• Geyer,S. et al., (2000). Neuroimage. 11, 684-696.
Primary somatosensory cortex (Areas 2)
• Grefkes,C. et al., (2001). Neuroimage. 14, 617-631.
hOC5 (V5 / MT+)
• Malikovic,A., et al., (2007). Cereb. Cortex 17, 562-574.
• Wilms,M. et al., (2005). Anat. Embryol. (Berl) 210, 485-495.
Primary auditory cortex (Areass TE 1.0, TE 1.1 and TE 1.2)
• Morosan,P. et al., Neuroimage 13, 684-701.
3
Getting started
Installation Copy or extract the whole folder “Anatomy” into the SPM toolbox directory. The folder “Toolbox/Anatomy” should now contain all m-files, some Analyze images as well as a subfolder named “PMaps”, containing the probabilistic cytoarchitectonic. This will allow you to start the program directly from the SPM user interface via the toolbox button on the GUI. Start the toolbox Via GUI:
Click on toolbox and then select “Anatomy” from the drop-down menu. Via command line:
Make sure that the directory of the m-files is included in the MATLAB search path. Then type “Anatomy” in the MATLAB prompt.
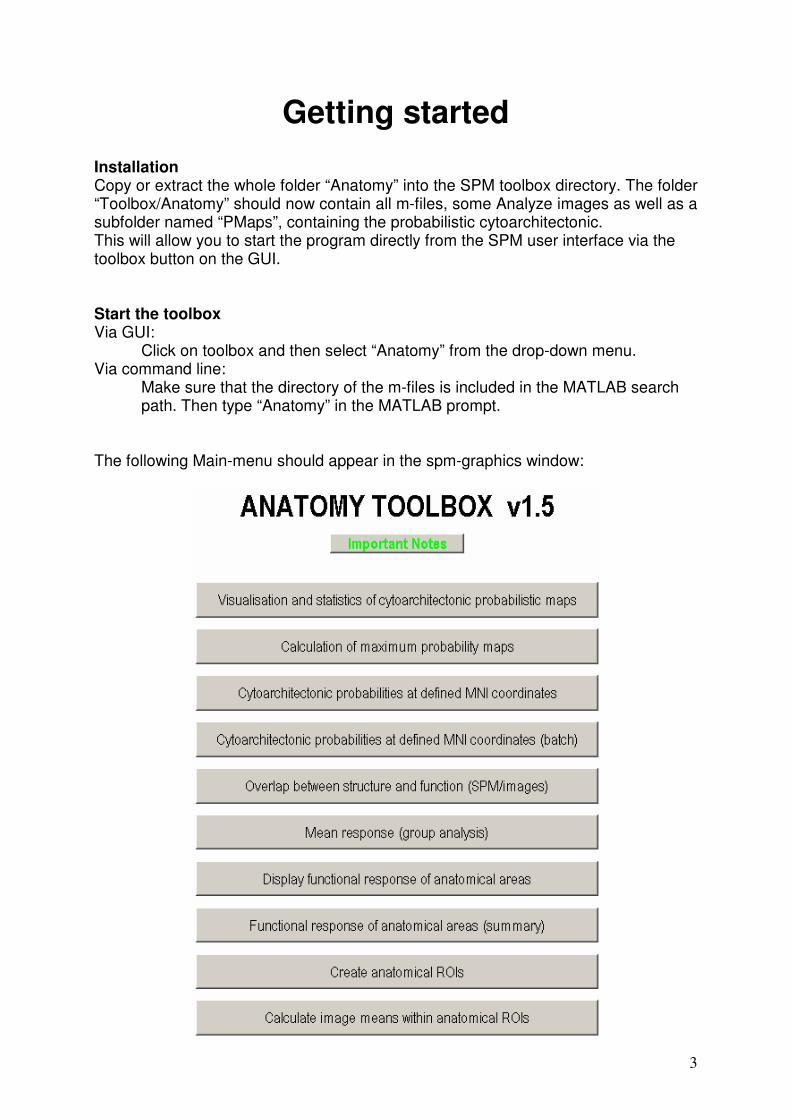
The following Main-menu should appear in the spm-graphics window:
4
The Main menu
Visualization and statistics of cytoarchitectonic probabilistic maps Individual probabilistic maps can be superimposed on orthogonal sections of the reference brain (colin27, i.e. the MNI single subject template). The program further shows information on the probabilistic maps, e.g. by quantifying the volume of the area’s representation at different probabilities as well as the mean coordinates and their range.
Calculation of maximum probability maps
For the combination with functional data, the different probabilistic maps have to be combined into a summary map, called maximum probability map (MPM). This option allows you to create summary maps from any desired set of cytoarchitectonic probabilistic maps.
Cytoarchitectonic coordinates at defined MNI coordinates This is the “quick check” option, where you can enter a set of stereotaxic coordinates (either MNI space, as used by spm, or anatomical coordinates, where the origin is defined by the anterior commisure). The program will then show you the location of this voxel in the orthogonal sections of the MPM and give information which cytoarchitectonic areas are found at that position and how high their probabilities are.
Cytoarchitectonic coordinates at defined MNI coordinates (batch)
This script allows having several points automatically labelled at once without the graphical interface. All (MNI) coordinates to be labelled have to be provided in a text-file, the results will also be outputted into a new file.
Overlap between structure and function (SPM/images)
The “core” of the SPM Anatomy toolbox: The correlation between structure and function is described in terms of cluster labeling, extend of activation labeling and local maxima labeling. The functional information can either be computed on-line via the SPM contrast manager or entered as a (thresholded) volume data set.
Mean response (group analysis)
The results of the functional group analysis are displayed similar to the option “overlap…”. This script however calculates the mean percent signal change in a group of subjects. The % signal change can be shown for a single voxel, a functional cluster of activation, all voxel of a functional cluster which are located in a specified anatomical area or all voxel assigned to a cytoarchitectonic area in the MPM.
Display functional response of anatomical areas
Instead of the functional results, the voxel included in the definition of the anatomical area are displayed. The mean percent signal change can be calculated for all voxel assigned to a cytoarchitectonic area in the MPM of for a subset of these voxel, which shows the highest probability for that area. The definition is hereby restricted to the core of the respective area.
5
Display functional response of anatomical areas (summary)
This option calculates the % signal change for a group of areas at once. The results are displayed simultaneously in a set of box-plot diagrams. This allows an easy comparison of the functional response of different architectonic areas.
Create anatomical ROIs Using this tool, regions of interest (ROI) masks can be created from the cytoarchitectonic maps. These region masks, which are stored as analyze images, are based on the volume assignments in the MPM.
Calculate image means within anatomical ROIs
This function allows calculating the mean values of an arbitrary number of input images within anatomically defined ROIs. For each area, the individual mean values of the corresponding voxel in each input image as well as the overall grand average are calculated.
6
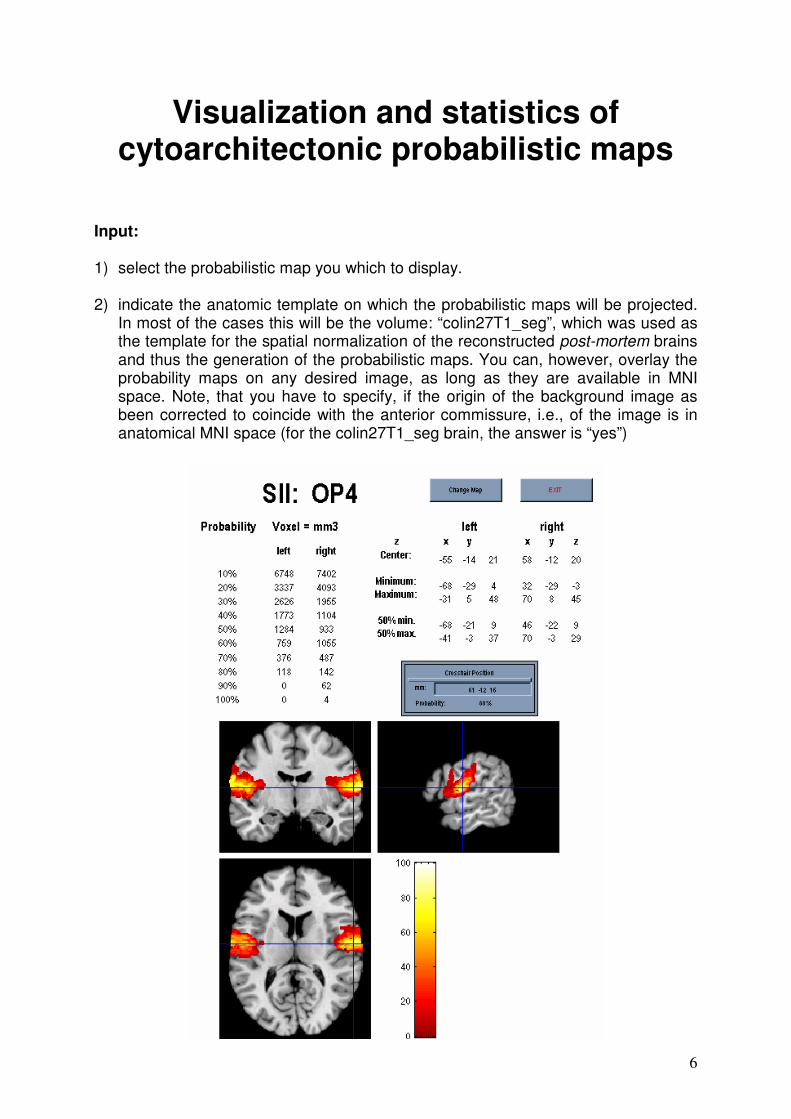
Visualization and statistics of cytoarchitectonic probabilistic maps
Input:
1) select the probabilistic map you which to display. 2) indicate the anatomic template on which the probabilistic maps will be projected.
In most of the cases this will be the volume: “colin27T1_seg”, which was used as the template for the spatial normalization of the reconstructed post-mortem brains and thus the generation of the probabilistic maps. You can, however, overlay the probability maps on any desired image, as long as they are available in MNI space. Note, that you have to specify, if the origin of the background image as been corrected to coincide with the anterior commissure, i.e., of the image is in anatomical MNI space (for the colin27T1_seg brain, the answer is “yes”)
7
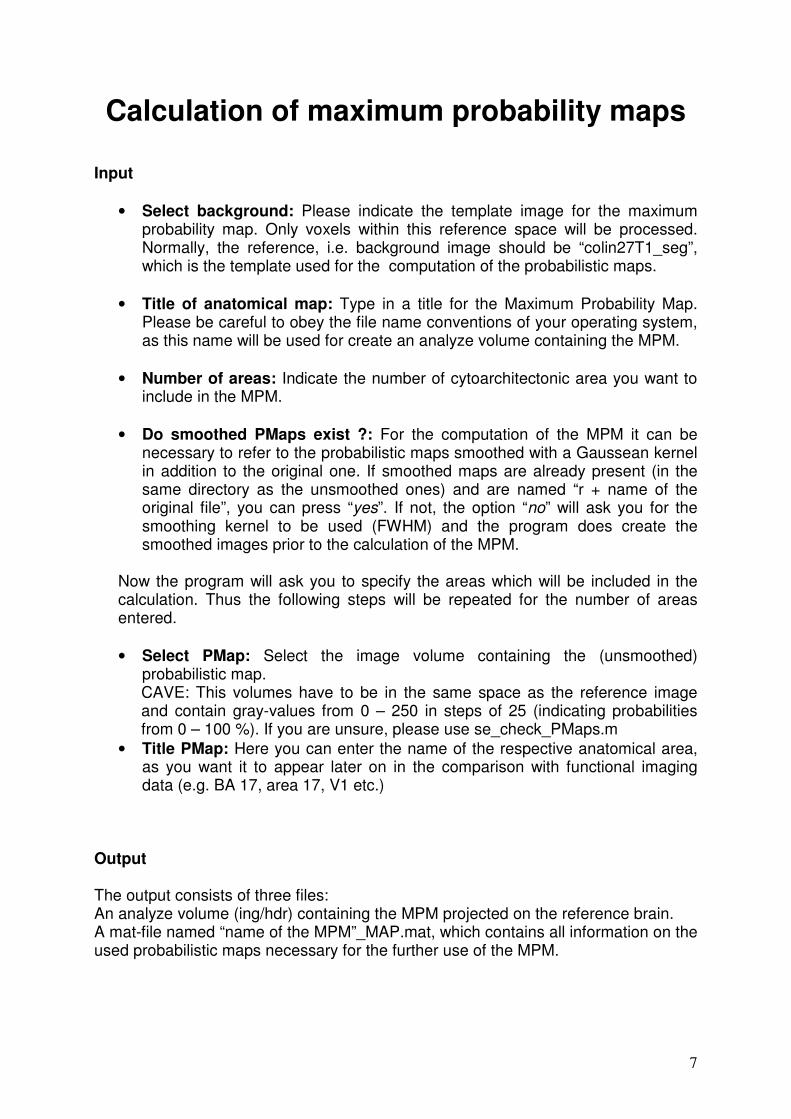
Calculation of maximum probability maps Input
• Select background: Please indicate the template image for the maximum probability map. Only voxels within this reference space will be processed. Normally, the reference, i.e. background image should be “colin27T1_seg”, which is the template used for the computation of the probabilistic maps.
• Title of anatomical map: Type in a title for the Maximum Probability Map. Please be careful to obey the file name conventions of your operating system, as this name will be used for create an analyze volume containing the MPM.
• Number of areas: Indicate the number of cytoarchitectonic area you want to include in the MPM.
• Do smoothed PMaps exist ?: For the computation of the MPM it can be necessary to refer to the probabilistic maps smoothed with a Gaussean kernel in addition to the original one. If smoothed maps are already present (in the same directory as the unsmoothed ones) and are named “r + name of the original file”, you can press “yes”. If not, the option “no” will ask you for the smoothing kernel to be used (FWHM) and the program does create the smoothed images prior to the calculation of the MPM.
Now the program will ask you to specify the areas which will be included in the calculation. Thus the following steps will be repeated for the number of areas entered.
• Select PMap: Select the image volume containing the (unsmoothed) probabilistic map. CAVE: This volumes have to be in the same space as the reference image and contain gray-values from 0 – 250 in steps of 25 (indicating probabilities from 0 – 100 %). If you are unsure, please use se_check_PMaps.m
• Title PMap: Here you can enter the name of the respective anatomical area, as you want it to appear later on in the comparison with functional imaging data (e.g. BA 17, area 17, V1 etc.)
Output The output consists of three files: An analyze volume (ing/hdr) containing the MPM projected on the reference brain. A mat-file named “name of the MPM”_MAP.mat, which contains all information on the used probabilistic maps necessary for the further use of the MPM.
8
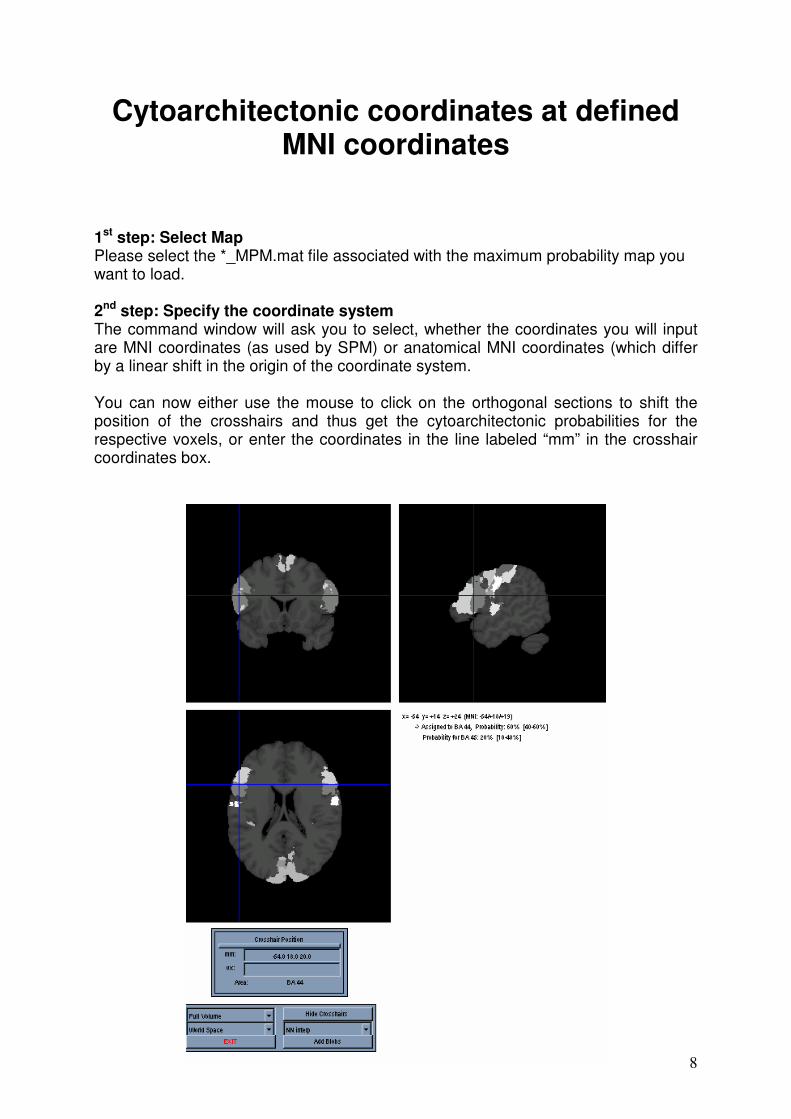
Cytoarchitectonic coordinates at defined MNI coordinates
1st step: Select Map Please select the *_MPM.mat file associated with the maximum probability map you want to load. 2nd step: Specify the coordinate system The command window will ask you to select, whether the coordinates you will input are MNI coordinates (as used by SPM) or anatomical MNI coordinates (which differ by a linear shift in the origin of the coordinate system. You can now either use the mouse to click on the orthogonal sections to shift the position of the crosshairs and thus get the cytoarchitectonic probabilities for the respective voxels, or enter the coordinates in the line labeled “mm” in the crosshair coordinates box.

9
Cytoarchitectonic coordinates at defined MNI coordinates
1st step: Select Map Please select the *_MPM.mat file associated with the maximum probability map you want to load. 2nd step: Select input text-file The input file for this routine has to be a plaintext-file (*.txt), containing coordinates for one individual point per line. Each line should hence consist of 3 numerical entries coding the x, y and z coordinates of the point in MNI (world) space. 3rd step: Specify the coordinate system The command window will ask you to select, whether the coordinates in the file represent MNI coordinates (as used by SPM) or anatomical MNI coordinates (which differ by a linear shift in the origin of the coordinate system. 4th step: Specify output file Please provide the name of the output file (which has to differ from the input filename) to which the results are written. If no extension is given, “.txt” is added to the filename.

10
Overlap between structure and function (SPM/images) 1st step: Select Map Please select the *_MPM.mat file associated with the maximum probability map you want to load. The MPM will now appear in three orthogonal sections, which you can move through using the mouse to change the position of the crosshairs. 2nd step: Press “Add blobs” 3rd step: Specify in the command window, whether you want to define the functional activations using the SPM contrast manager (press SPM) or use an image volume, which contains the activations to be superimposed (press image). If you chose to overlay an image, you will be prompted for the following information Premultiply by: You can specify a scalar which will be multiplied to each and every voxel value. The default is 1, that is, to use the original image values High threshold: All voxels, whose image-values (after pre-multiplication) are below the specified threshold are set to 0. Extend threshold: All clusters, which (after thresholding) are smaller than the extend filter are displayed by the toolbox. IMPORTANT: After selecting the image to be displayed or calculating and thresholding the relevant contrast, the following prompt will appear in the command window: Is the origin corrected to AC: yes / no
• If your data is preprocessed in SPM using the standard MNI templates and is thus located in the original MNI space, you will have to press no. This will cause the program to correct for the linear shift in the reference space. Otherwise there will be a mismatch between the space of the anatomical maps (where the origin is located on the anterior commisure) and the functional activations (origin located more caudal and superior).
• If your data is normalized to the colin27 brain in anatomical space, you can press yes.

11
The functional data will now be displayed on the MPM. You can either select a functional activation by clicking on it or by using the upper drop-down menu, which allows you to select the individual activation clusters directly. One a functional cluster is selected, you can use the lower drop-down menu, to move the cross-hairs to the locations of the maxima within this cluster.
12
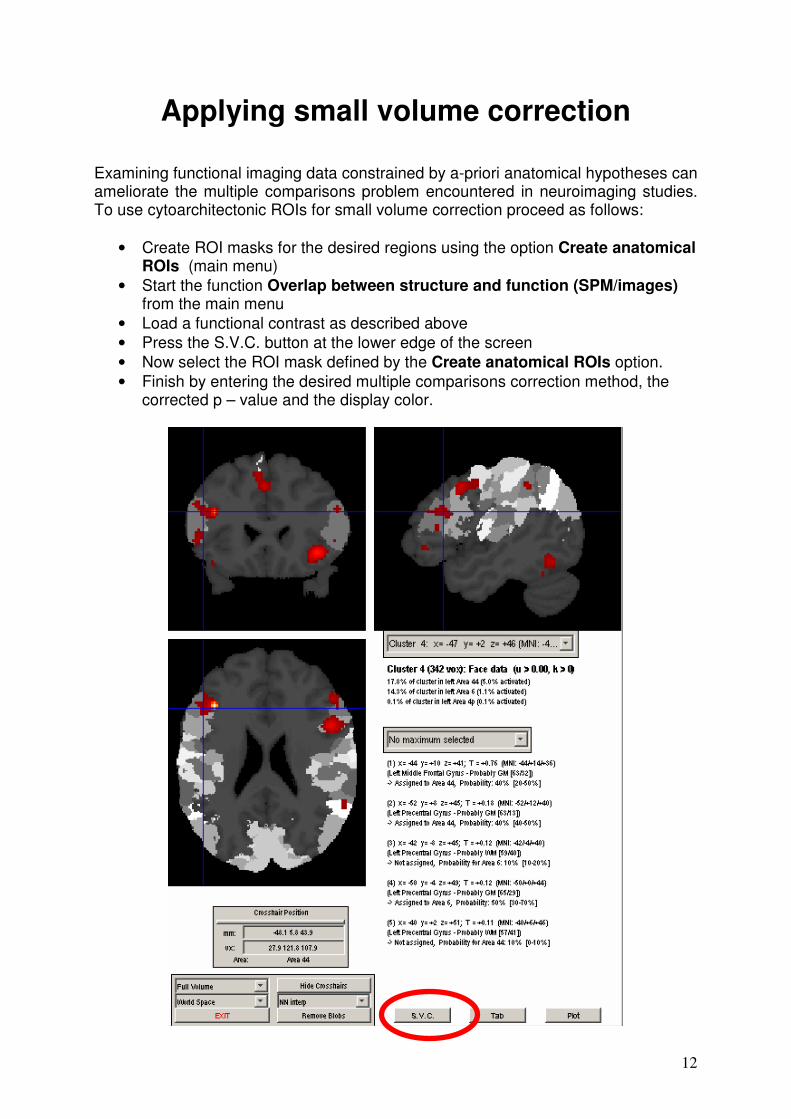
Applying small volume correction Examining functional imaging data constrained by a-priori anatomical hypotheses can ameliorate the multiple comparisons problem encountered in neuroimaging studies. To use cytoarchitectonic ROIs for small volume correction proceed as follows:
• Create ROI masks for the desired regions using the option Create anatomical ROIs (main menu)
• Start the function Overlap between structure and function (SPM/images) from the main menu
• Load a functional contrast as described above
• Press the S.V.C. button at the lower edge of the screen
• Now select the ROI mask defined by the Create anatomical ROIs option.
• Finish by entering the desired multiple comparisons correction method, the corrected p – value and the display color.
13
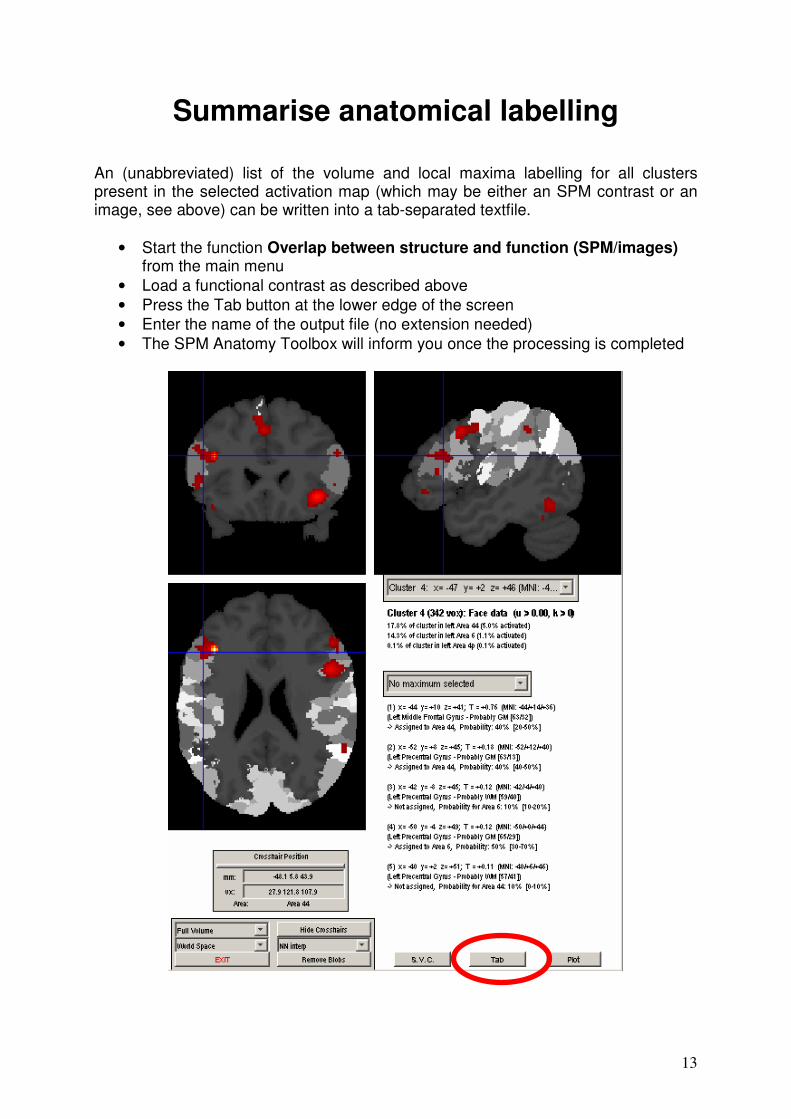
Summarise anatomical labelling An (unabbreviated) list of the volume and local maxima labelling for all clusters present in the selected activation map (which may be either an SPM contrast or an image, see above) can be written into a tab-separated textfile.
• Start the function Overlap between structure and function (SPM/images) from the main menu
• Load a functional contrast as described above
• Press the Tab button at the lower edge of the screen
• Enter the name of the output file (no extension needed)
• The SPM Anatomy Toolbox will inform you once the processing is completed
14
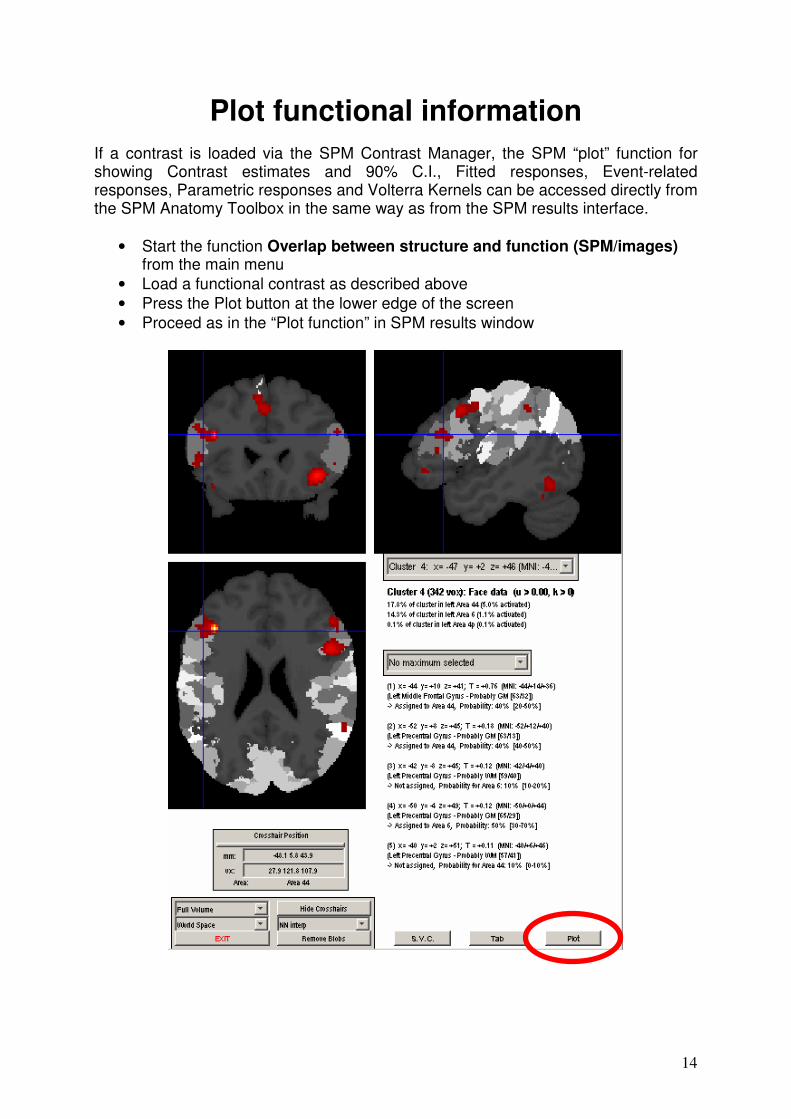
Plot functional information
If a contrast is loaded via the SPM Contrast Manager, the SPM “plot” function for showing Contrast estimates and 90% C.I., Fitted responses, Event-related responses, Parametric responses and Volterra Kernels can be accessed directly from the SPM Anatomy Toolbox in the same way as from the SPM results interface.
• Start the function Overlap between structure and function (SPM/images) from the main menu
• Load a functional contrast as described above
• Press the Plot button at the lower edge of the screen
• Proceed as in the “Plot function” in SPM results window

15
Mean response (group analysis) 1st step: Select Map Please select the *_MPM.mat file associated with the maximum probability map you want to load, which will then appear in the orthogonal sections. 2nd step: Press “Add blobs” In the command window, you will now be asked, if you want to “Load an existing group ?”
• If you have already set up the .mat file containing all information about the subjects, you can press “yes”. The program will then load the data on the individual subjects and ask you to specify the second level analysis, you want to project on the MPM (similar to the overlap between structure and function using the contrast manger).
• If you have not yet specified a group of subjects, you will have to select “no”. This brings you to the routine for the definition of the group of subjects included in the group analysis:
o First, please enter the number of subjects in the command window. o Then select the SPM.mat file for every subject, which describes its
first level analysis. o One you have completed all subjects, you will be asked to specify the
second level analysis. Please use the SPM contrast manager to compute the contrast you want to display and select whether the data has to be corrected for the difference between the original MNI space used in SPM and the anatomical MNI space of the architectonic data as described above.
In the graphics window, you can now select clusters and maxima as described for the option “Overlap between structure and function (SPM/images)”. Additionally, you have two push-buttons at the bottom of the screen, labeled “Info” and “% signal change”. Info: This option brings you back to the probabilistic anatomical information for the selected cluster. % signal change: When calling this option, you will be asked in the command window to specify the criteria for selecting the voxel for which the percent signal change will be computed:
16
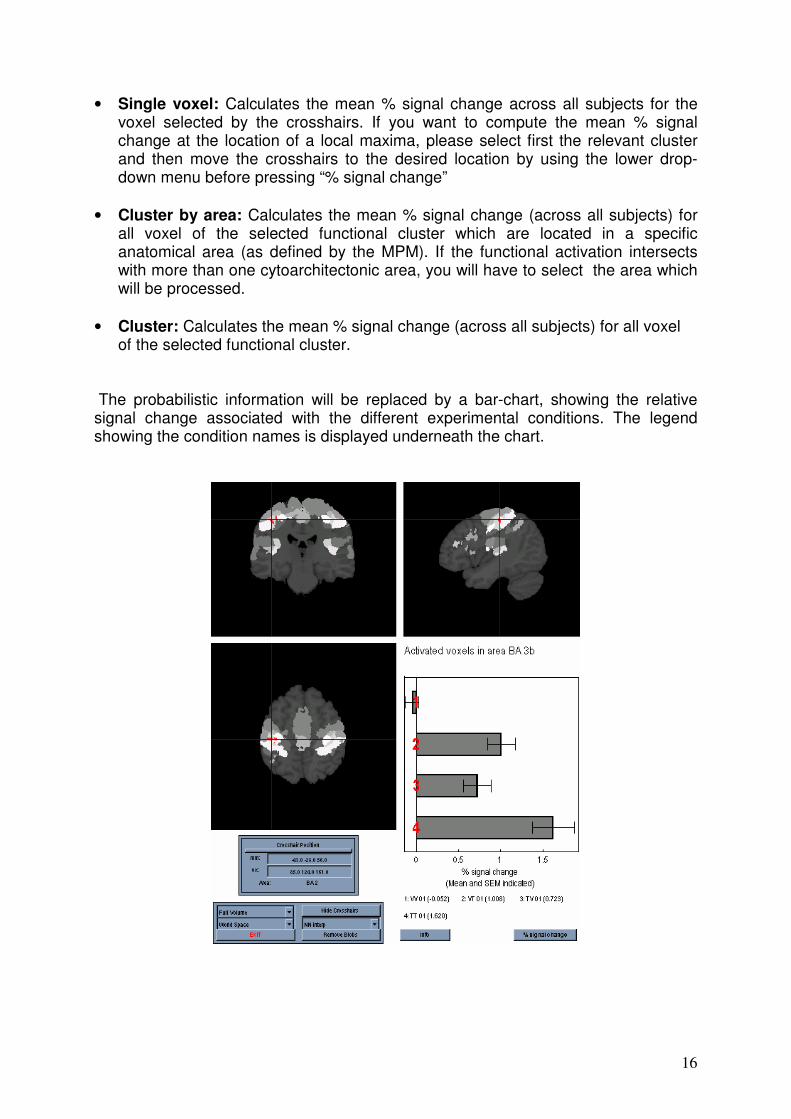
• Single voxel: Calculates the mean % signal change across all subjects for the voxel selected by the crosshairs. If you want to compute the mean % signal change at the location of a local maxima, please select first the relevant cluster and then move the crosshairs to the desired location by using the lower drop-down menu before pressing “% signal change”
• Cluster by area: Calculates the mean % signal change (across all subjects) for all voxel of the selected functional cluster which are located in a specific anatomical area (as defined by the MPM). If the functional activation intersects with more than one cytoarchitectonic area, you will have to select the area which will be processed.
• Cluster: Calculates the mean % signal change (across all subjects) for all voxel of the selected functional cluster.
The probabilistic information will be replaced by a bar-chart, showing the relative signal change associated with the different experimental conditions. The legend showing the condition names is displayed underneath the chart.
17
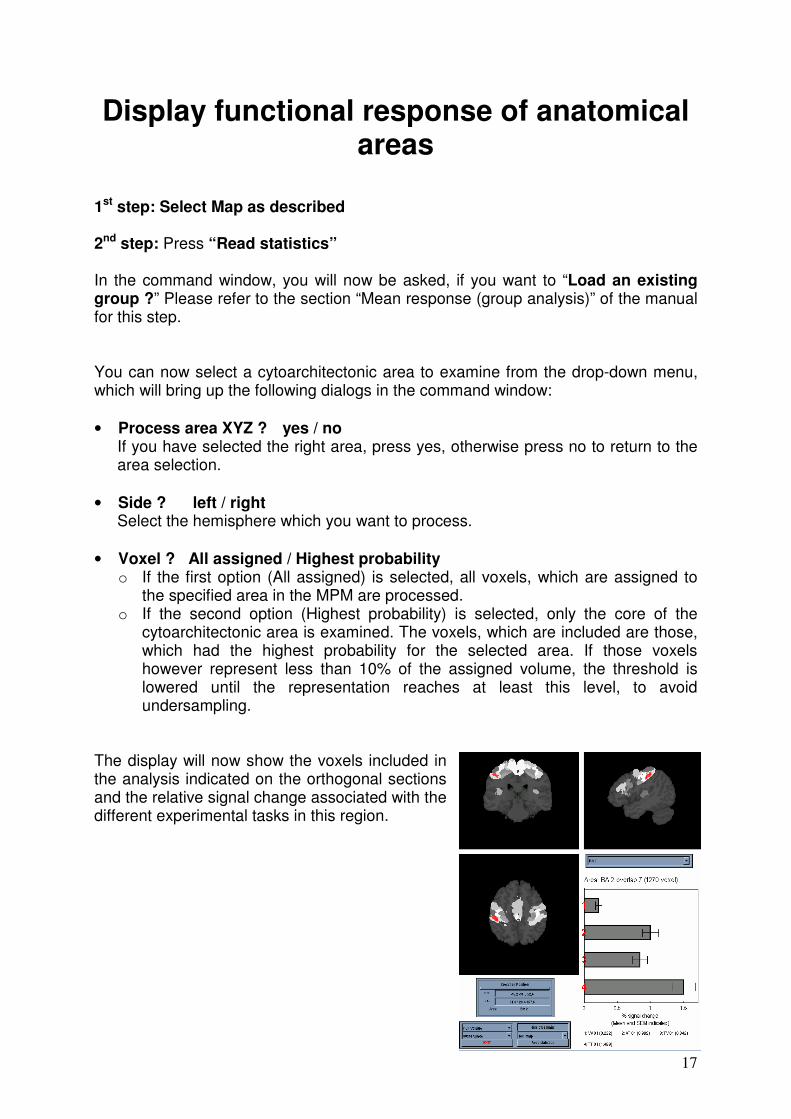
Display functional response of anatomical areas
1st step: Select Map as described 2nd step: Press “Read statistics” In the command window, you will now be asked, if you want to “Load an existing group ?” Please refer to the section “Mean response (group analysis)” of the manual for this step. You can now select a cytoarchitectonic area to examine from the drop-down menu, which will bring up the following dialogs in the command window:
• Process area XYZ ? yes / no If you have selected the right area, press yes, otherwise press no to return to the area selection.
• Side ? left / right Select the hemisphere which you want to process.
• Voxel ? All assigned / Highest probability o If the first option (All assigned) is selected, all voxels, which are assigned to
the specified area in the MPM are processed. o If the second option (Highest probability) is selected, only the core of the
cytoarchitectonic area is examined. The voxels, which are included are those, which had the highest probability for the selected area. If those voxels however represent less than 10% of the assigned volume, the threshold is lowered until the representation reaches at least this level, to avoid undersampling.
The display will now show the voxels included in the analysis indicated on the orthogonal sections and the relative signal change associated with the different experimental tasks in this region.
18
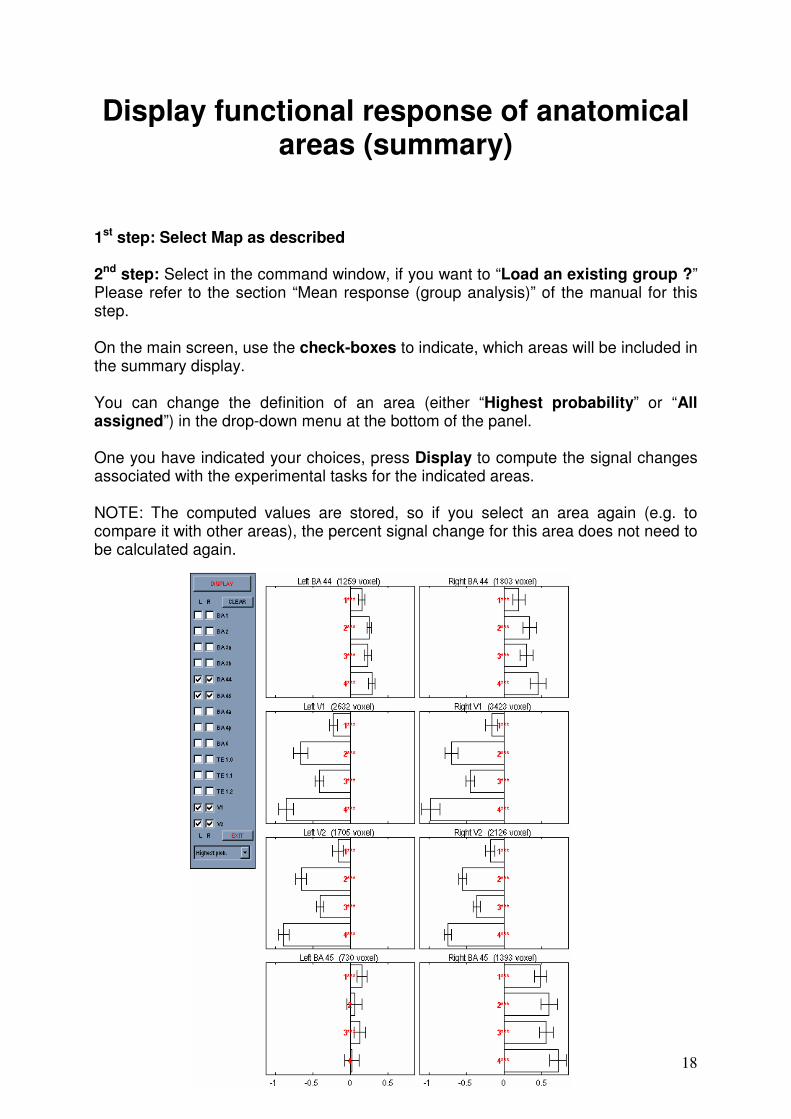
Display functional response of anatomical areas (summary)
1st step: Select Map as described 2nd step: Select in the command window, if you want to “Load an existing group ?” Please refer to the section “Mean response (group analysis)” of the manual for this step. On the main screen, use the check-boxes to indicate, which areas will be included in the summary display. You can change the definition of an area (either “Highest probability” or “All assigned”) in the drop-down menu at the bottom of the panel. One you have indicated your choices, press Display to compute the signal changes associated with the experimental tasks for the indicated areas. NOTE: The computed values are stored, so if you select an area again (e.g. to compare it with other areas), the percent signal change for this area does not need to be calculated again.
19
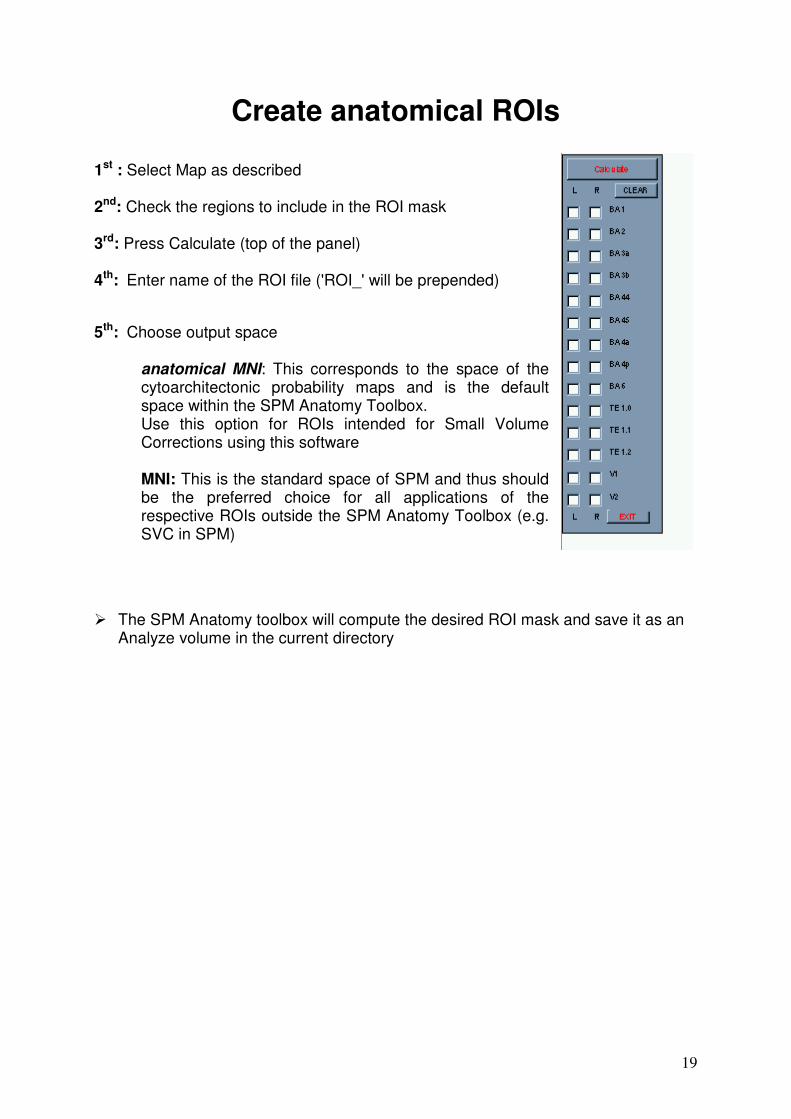
Create anatomical ROIs
1st : Select Map as described
2nd: Check the regions to include in the ROI mask
3rd: Press Calculate (top of the panel)
4th: Enter name of the ROI file ('ROI_' will be prepended)
5th: Choose output space
anatomical MNI: This corresponds to the space of the cytoarchitectonic probability maps and is the default space within the SPM Anatomy Toolbox. Use this option for ROIs intended for Small Volume Corrections using this software MNI: This is the standard space of SPM and thus should be the preferred choice for all applications of the respective ROIs outside the SPM Anatomy Toolbox (e.g. SVC in SPM)
� The SPM Anatomy toolbox will compute the desired ROI mask and save it as an
Analyze volume in the current directory

20
Calculate image means within anatomical ROIs
1st : Select Map as described above
2nd: Check the cytoarchitectonic regions to analysed
3rd: Press Calculate (top of the panel)
4th: Select the images to calculate ROI means from (there is no restriction on the number of input images; the images may have different orientations. 5th: Enter a name for the output file
� For each image the SPM Anatomy toolbox will now compute the mean voxel
value within each of the selected cytoarchitectonic areas. The results are written in the current working directory in .txt and .mat format.
21
Articles describing the SPM Anatomy Toolbox
Main reference (probabilistic combination of structural and functional data)
Eickhoff SB, Stephan KE, Mohlberg H, Grefkes C, Fink GR, Amunts K, Zilles K A new SPM toolbox for combining probabilistic cytoarchitectonic maps and functional
imaging data NeuroImage, 25(4):1325-35 (2005)
MPM evaluation and use as a priori information (ROI analyses)
Eickhoff SB, Heim S, Zilles K, Amunts K Testing anatomically specified hypotheses in functional imaging using
cytoarchitectonic maps NeuroImage 32(2): 570-582 (2006)
Distribution based labelling and review of concepts
Eickhoff SB, Paus T, Caspers S, Grosbras MH, Evans A, Zilles K, Amunts K Assignment of functional activations to probabilistic cytoarchitectonic areas revisited
NeuroImage, 36(3): 511-521 (2007)
Related Documents


