Welcome message from author
This document is posted to help you gain knowledge. Please leave a comment to let me know what you think about it! Share it to your friends and learn new things together.
Transcript


Experience and Developments in Fabrication of MOX Fuel at Advanced Fuel Fabrication Facility
R B Bhatt Advanced fuel fabrication facility
Nuclear Recycle Board
R. B. Bhatt is the recipient of the Homi Bhabha Science & Technology Award for the year 2016
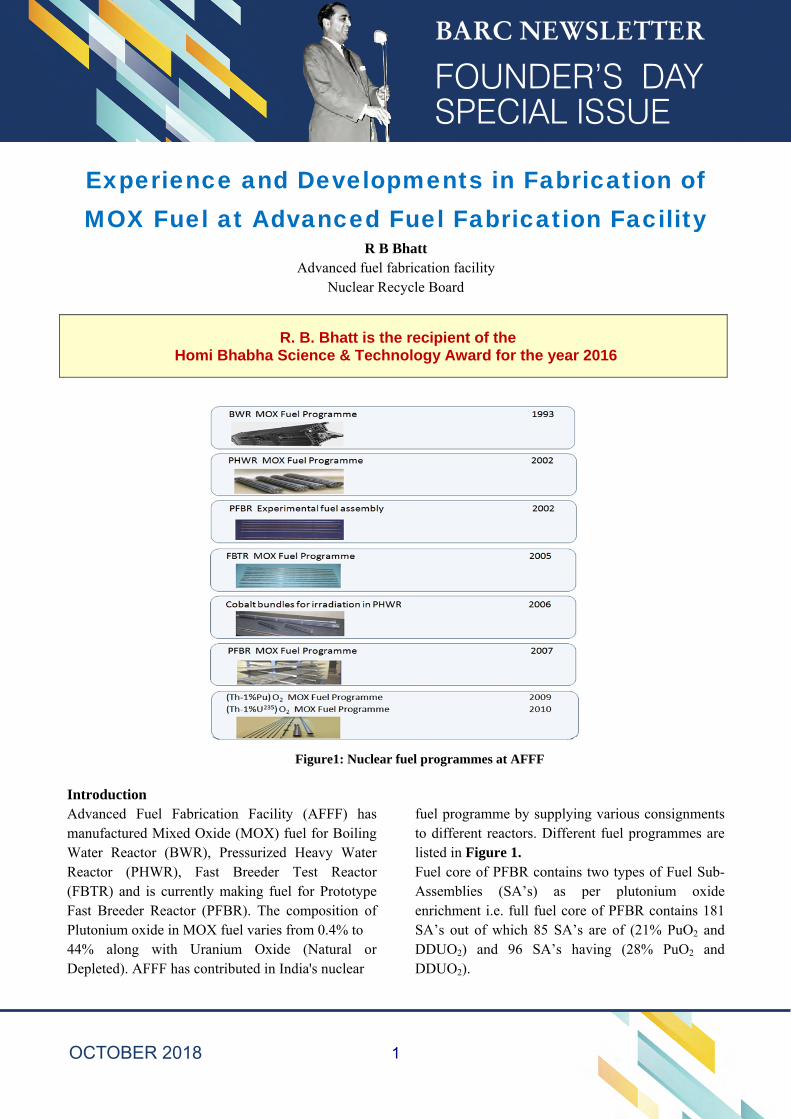
Figure1: Nuclear fuel programmes at AFFF Introduction Advanced Fuel Fabrication Facility (AFFF) has manufactured Mixed Oxide (MOX) fuel for Boiling Water Reactor (BWR), Pressurized Heavy Water Reactor (PHWR), Fast Breeder Test Reactor (FBTR) and is currently making fuel for Prototype Fast Breeder Reactor (PFBR). The composition of Plutonium oxide in MOX fuel varies from 0.4% to 44% along with Uranium Oxide (Natural or Depleted). AFFF has contributed in India's nuclear
fuel programme by supplying various consignments to different reactors. Different fuel programmes are listed in Figure 1. Fuel core of PFBR contains two types of Fuel Sub-Assemblies (SA’s) as per plutonium oxide enrichment i.e. full fuel core of PFBR contains 181 SA’s out of which 85 SA’s are of (21% PuO2 and DDUO2) and 96 SA’s having (28% PuO2 and DDUO2).
1
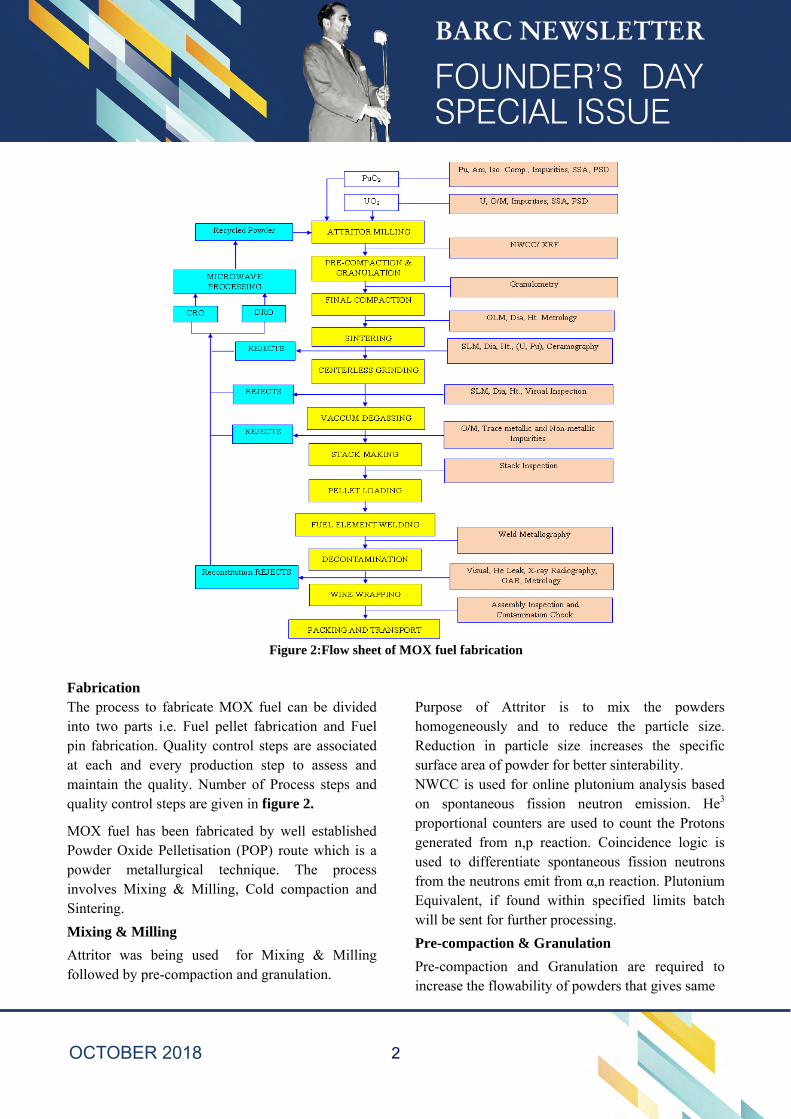
Figure 2:Flow sheet of MOX fuel fabrication Fabrication The process to fabricate MOX fuel can be divided into two parts i.e. Fuel pellet fabrication and Fuel pin fabrication. Quality control steps are associated at each and every production step to assess and maintain the quality. Number of Process steps and quality control steps are given in figure 2.
MOX fuel has been fabricated by well established Powder Oxide Pelletisation (POP) route which is a powder metallurgical technique. The process involves Mixing & Milling, Cold compaction and Sintering.
Mixing & Milling
Attritor was being used for Mixing & Milling followed by pre-compaction and granulation.
Purpose of Attritor is to mix the powders homogeneously and to reduce the particle size. Reduction in particle size increases the specific surface area of powder for better sinterability. NWCC is used for online plutonium analysis based on spontaneous fission neutron emission. He3 proportional counters are used to count the Protons generated from n,p reaction. Coincidence logic is used to differentiate spontaneous fission neutrons from the neutrons emit from α,n reaction. Plutonium Equivalent, if found within specified limits batch will be sent for further processing.
Pre-compaction & Granulation
Pre-compaction and Granulation are required to increase the flowability of powders that gives same
2
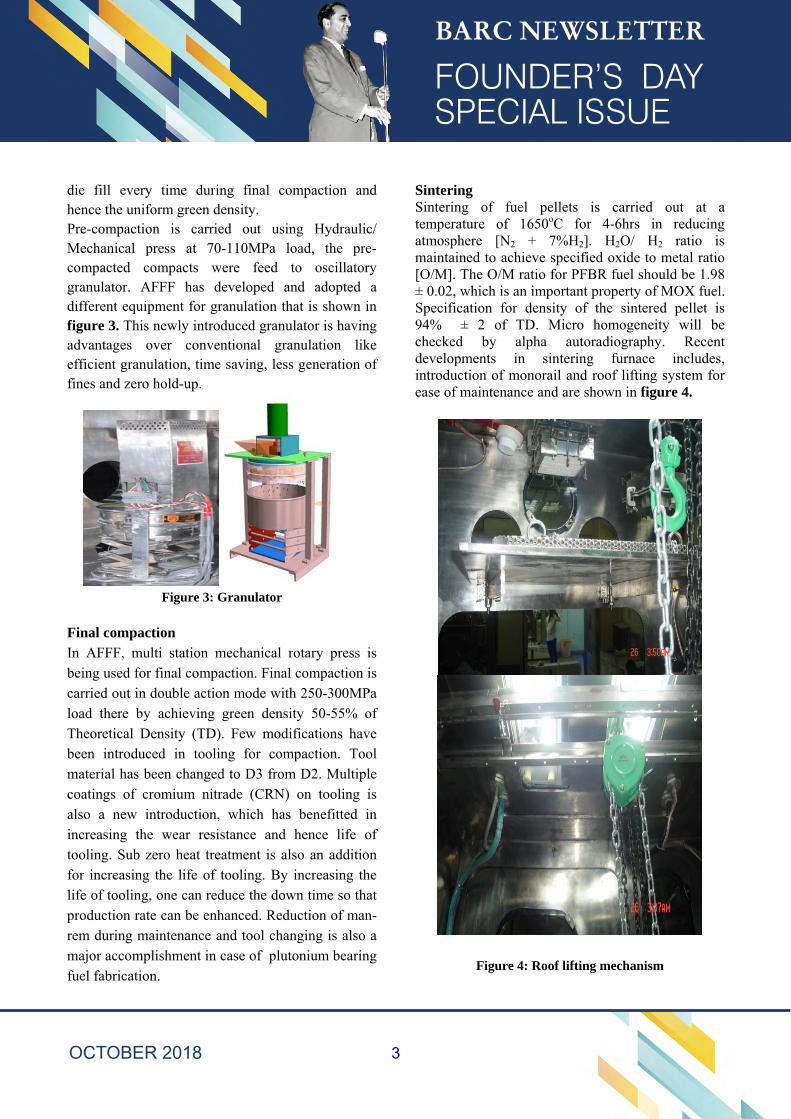
die fill every time during final compaction and hence the uniform green density. Pre-compaction is carried out using Hydraulic/ Mechanical press at 70-110MPa load, the pre-compacted compacts were feed to oscillatory granulator. AFFF has developed and adopted a different equipment for granulation that is shown in figure 3. This newly introduced granulator is having advantages over conventional granulation like efficient granulation, time saving, less generation of fines and zero hold-up.
Figure 3: Granulator
Final compaction In AFFF, multi station mechanical rotary press is being used for final compaction. Final compaction is carried out in double action mode with 250-300MPa load there by achieving green density 50-55% of Theoretical Density (TD). Few modifications have been introduced in tooling for compaction. Tool material has been changed to D3 from D2. Multiple coatings of cromium nitrade (CRN) on tooling is also a new introduction, which has benefitted in increasing the wear resistance and hence life of tooling. Sub zero heat treatment is also an addition for increasing the life of tooling. By increasing the life of tooling, one can reduce the down time so that production rate can be enhanced. Reduction of man-rem during maintenance and tool changing is also a major accomplishment in case of plutonium bearing fuel fabrication.
Sintering Sintering of fuel pellets is carried out at a temperature of 1650oC for 4-6hrs in reducing atmosphere [N2 + 7%H2]. H2O/ H2 ratio is maintained to achieve specified oxide to metal ratio [O/M]. The O/M ratio for PFBR fuel should be 1.98 ± 0.02, which is an important property of MOX fuel. Specification for density of the sintered pellet is 94% ± 2 of TD. Micro homogeneity will be checked by alpha autoradiography. Recent developments in sintering furnace includes, introduction of monorail and roof lifting system for ease of maintenance and are shown in figure 4.
Figure 4: Roof lifting mechanism
3
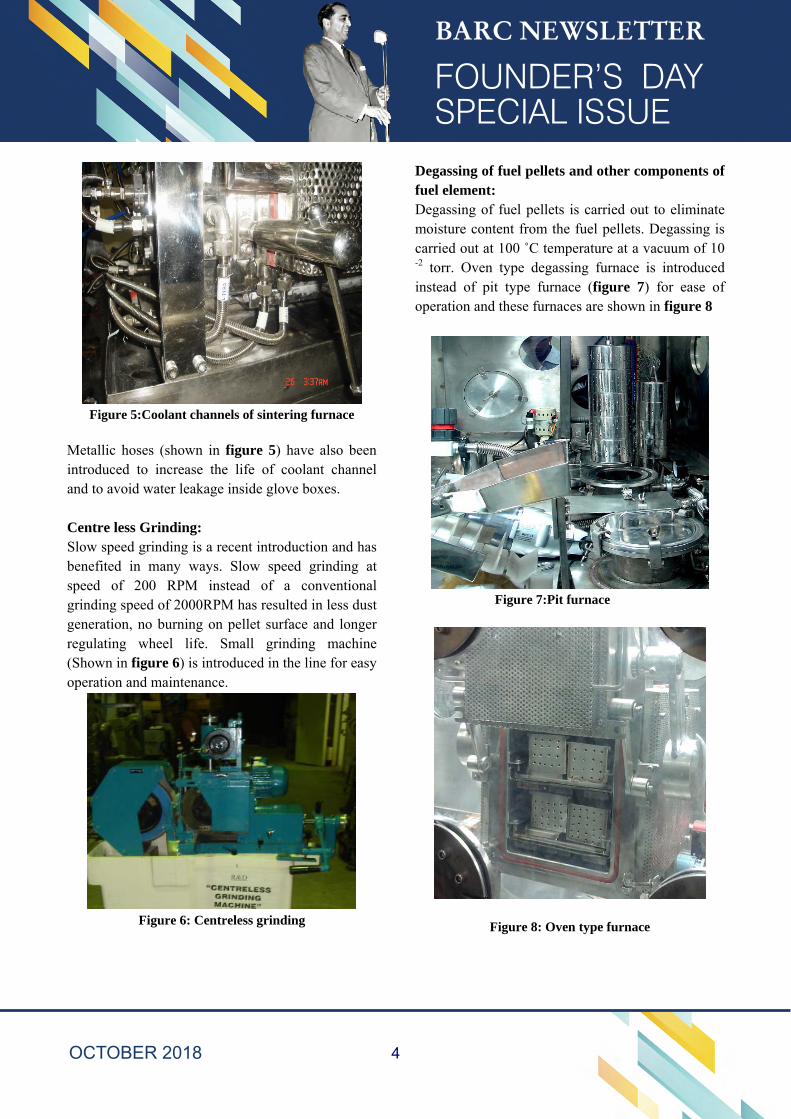
Figure 5:Coolant channels of sintering furnace
Metallic hoses (shown in figure 5) have also been introduced to increase the life of coolant channel and to avoid water leakage inside glove boxes.
Centre less Grinding: Slow speed grinding is a recent introduction and has benefited in many ways. Slow speed grinding at speed of 200 RPM instead of a conventional grinding speed of 2000RPM has resulted in less dust generation, no burning on pellet surface and longer regulating wheel life. Small grinding machine (Shown in figure 6) is introduced in the line for easy operation and maintenance.
Figure 6: Centreless grinding
Degassing of fuel pellets and other components of fuel element: Degassing of fuel pellets is carried out to eliminate moisture content from the fuel pellets. Degassing is carried out at 100 ˚C temperature at a vacuum of 10 -2 torr. Oven type degassing furnace is introduced instead of pit type furnace (figure 7) for ease of operation and these furnaces are shown in figure 8
Figure 7:Pit furnace
Figure 8: Oven type furnace
4
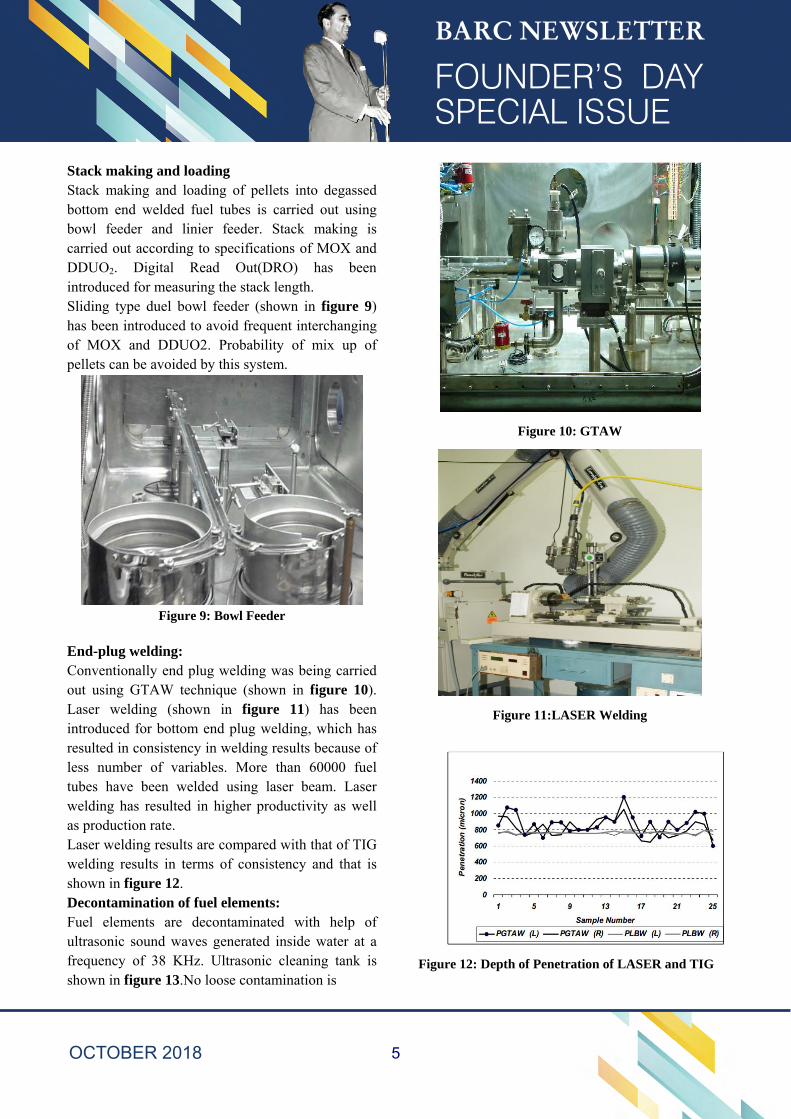
Stack making and loading Stack making and loading of pellets into degassed bottom end welded fuel tubes is carried out using bowl feeder and linier feeder. Stack making is carried out according to specifications of MOX and DDUO2. Digital Read Out(DRO) has been introduced for measuring the stack length. Sliding type duel bowl feeder (shown in figure 9) has been introduced to avoid frequent interchanging of MOX and DDUO2. Probability of mix up of pellets can be avoided by this system.
Figure 9: Bowl Feeder
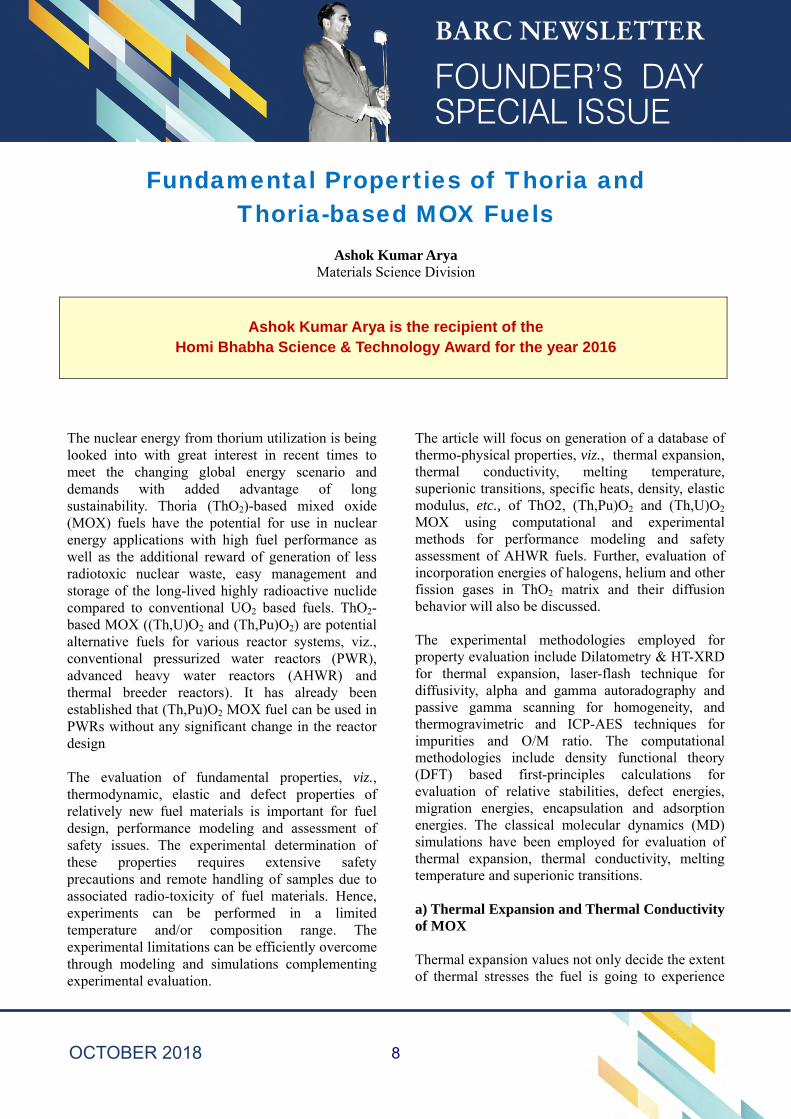
End-plug welding: Conventionally end plug welding was being carried out using GTAW technique (shown in figure 10). Laser welding (shown in figure 11) has been introduced for bottom end plug welding, which has resulted in consistency in welding results because of less number of variables. More than 60000 fuel tubes have been welded using laser beam. Laser welding has resulted in higher productivity as well as production rate. Laser welding results are compared with that of TIG welding results in terms of consistency and that is shown in figure 12. Decontamination of fuel elements: Fuel elements are decontaminated with help of ultrasonic sound waves generated inside water at a frequency of 38 KHz. Ultrasonic cleaning tank is shown in figure 13.No loose contamination is
Figure 10: GTAW
Figure 11:LASER Welding
Figure 12: Depth of Penetration of LASER and TIG
5
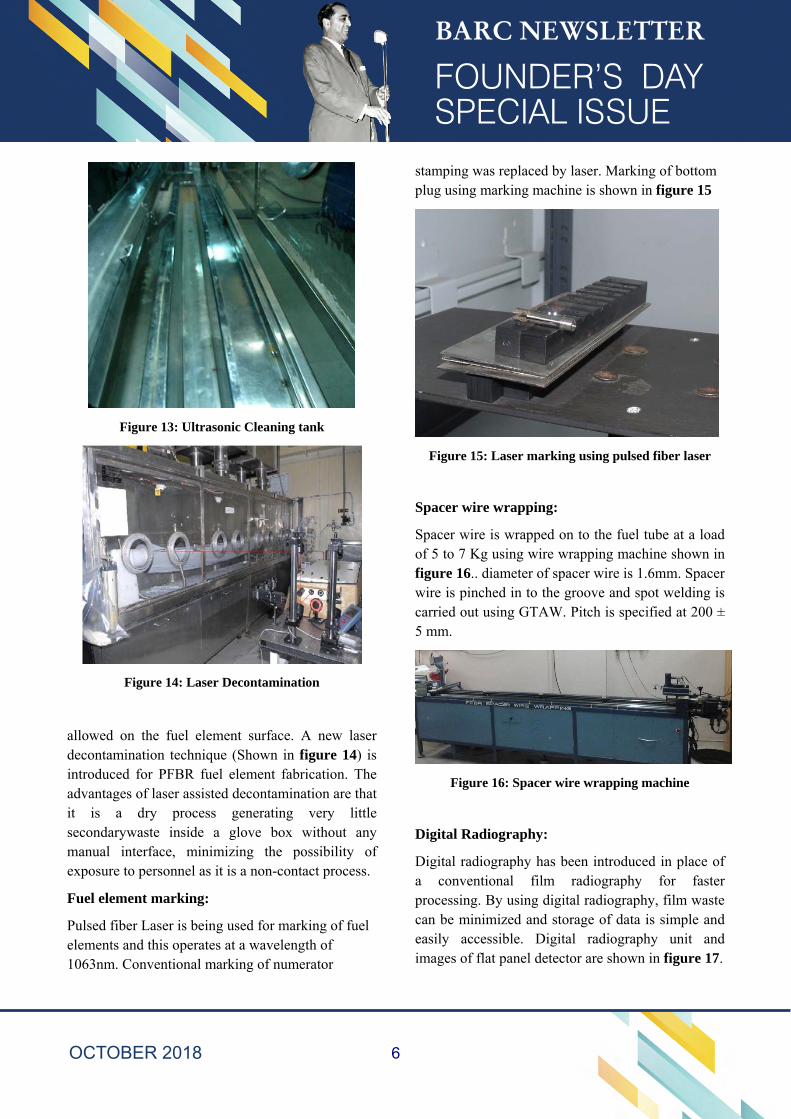
Figure 13: Ultrasonic Cleaning tank
Figure 14: Laser Decontamination
allowed on the fuel element surface. A new laser decontamination technique (Shown in figure 14) is introduced for PFBR fuel element fabrication. The advantages of laser assisted decontamination are that it is a dry process generating very little secondarywaste inside a glove box without any manual interface, minimizing the possibility of exposure to personnel as it is a non-contact process.
Fuel element marking:
Pulsed fiber Laser is being used for marking of fuel elements and this operates at a wavelength of 1063nm. Conventional marking of numerator
stamping was replaced by laser. Marking of bottom plug using marking machine is shown in figure 15
Figure 15: Laser marking using pulsed fiber laser
Spacer wire wrapping:
Spacer wire is wrapped on to the fuel tube at a load of 5 to 7 Kg using wire wrapping machine shown in figure 16.. diameter of spacer wire is 1.6mm. Spacer wire is pinched in to the groove and spot welding is carried out using GTAW. Pitch is specified at 200 ± 5 mm.
Figure 16: Spacer wire wrapping machine
Digital Radiography:
Digital radiography has been introduced in place of a conventional film radiography for faster processing. By using digital radiography, film waste can be minimized and storage of data is simple and easily accessible. Digital radiography unit and images of flat panel detector are shown in figure 17.
6
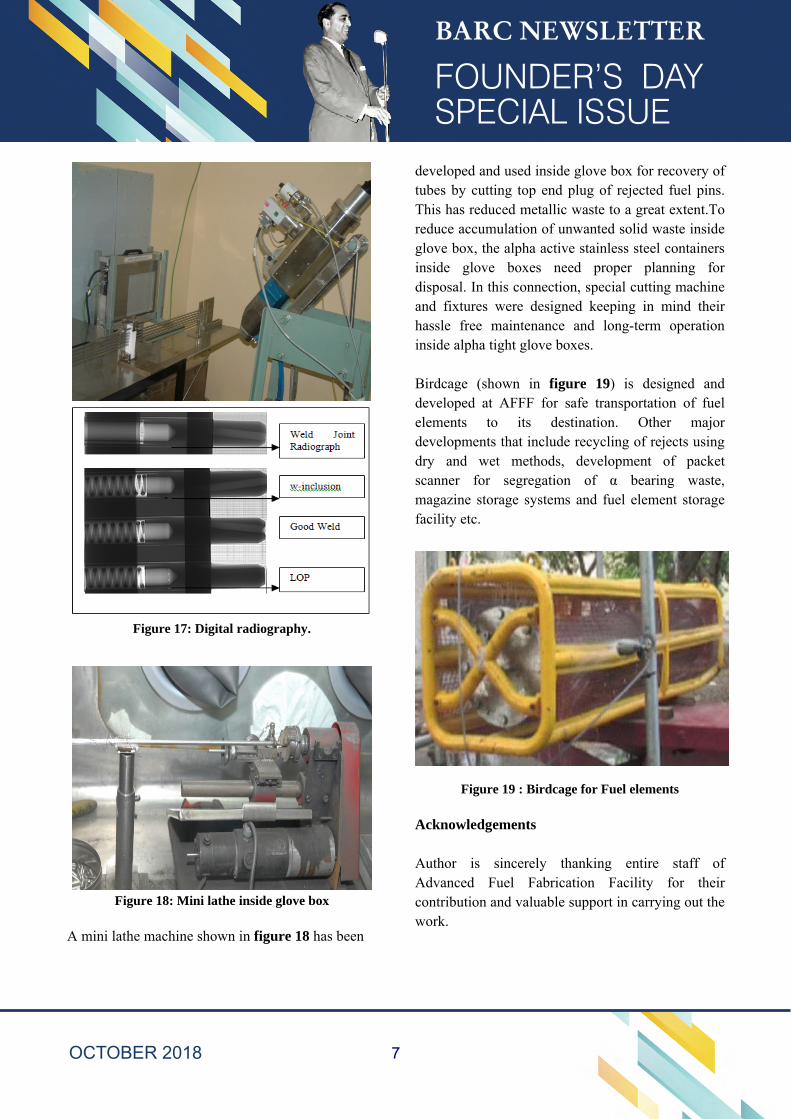
Figure 17: Digital radiography.
Figure 18: Mini lathe inside glove box
A mini lathe machine shown in figure 18 has been
developed and used inside glove box for recovery of tubes by cutting top end plug of rejected fuel pins. This has reduced metallic waste to a great extent.To reduce accumulation of unwanted solid waste inside glove box, the alpha active stainless steel containers inside glove boxes need proper planning for disposal. In this connection, special cutting machine and fixtures were designed keeping in mind their hassle free maintenance and long-term operation inside alpha tight glove boxes. Birdcage (shown in figure 19) is designed and developed at AFFF for safe transportation of fuel elements to its destination. Other major developments that include recycling of rejects using dry and wet methods, development of packet scanner for segregation of α bearing waste, magazine storage systems and fuel element storage facility etc.
Figure 19 : Birdcage for Fuel elements Acknowledgements Author is sincerely thanking entire staff of Advanced Fuel Fabrication Facility for their contribution and valuable support in carrying out the work.
7
Fundamental Properties of Thoria and Thoria-based MOX Fuels
Ashok Kumar Arya
Materials Science Division
Ashok Kumar Arya is the recipient of the Homi Bhabha Science & Technology Award for the year 2016
The nuclear energy from thorium utilization is being looked into with great interest in recent times to meet the changing global energy scenario and demands with added advantage of long sustainability. Thoria (ThO2)-based mixed oxide (MOX) fuels have the potential for use in nuclear energy applications with high fuel performance as well as the additional reward of generation of less radiotoxic nuclear waste, easy management and storage of the long-lived highly radioactive nuclide compared to conventional UO2 based fuels. ThO2-based MOX ((Th,U)O2 and (Th,Pu)O2) are potential alternative fuels for various reactor systems, viz., conventional pressurized water reactors (PWR), advanced heavy water reactors (AHWR) and thermal breeder reactors). It has already been established that (Th,Pu)O2 MOX fuel can be used in PWRs without any significant change in the reactor design The evaluation of fundamental properties, viz., thermodynamic, elastic and defect properties of relatively new fuel materials is important for fuel design, performance modeling and assessment of safety issues. The experimental determination of these properties requires extensive safety precautions and remote handling of samples due to associated radio-toxicity of fuel materials. Hence, experiments can be performed in a limited temperature and/or composition range. The experimental limitations can be efficiently overcome through modeling and simulations complementing experimental evaluation.
The article will focus on generation of a database of thermo-physical properties, viz., thermal expansion, thermal conductivity, melting temperature, superionic transitions, specific heats, density, elastic modulus, etc., of ThO2, (Th,Pu)O2 and (Th,U)O2 MOX using computational and experimental methods for performance modeling and safety assessment of AHWR fuels. Further, evaluation of incorporation energies of halogens, helium and other fission gases in ThO2 matrix and their diffusion behavior will also be discussed. The experimental methodologies employed for property evaluation include Dilatometry & HT-XRD for thermal expansion, laser-flash technique for diffusivity, alpha and gamma autoradography and passive gamma scanning for homogeneity, and thermogravimetric and ICP-AES techniques for impurities and O/M ratio. The computational methodologies include density functional theory (DFT) based first-principles calculations for evaluation of relative stabilities, defect energies, migration energies, encapsulation and adsorption energies. The classical molecular dynamics (MD) simulations have been employed for evaluation of thermal expansion, thermal conductivity, melting temperature and superionic transitions. a) Thermal Expansion and Thermal Conductivity of MOX Thermal expansion values not only decide the extent of thermal stresses the fuel is going to experience
8
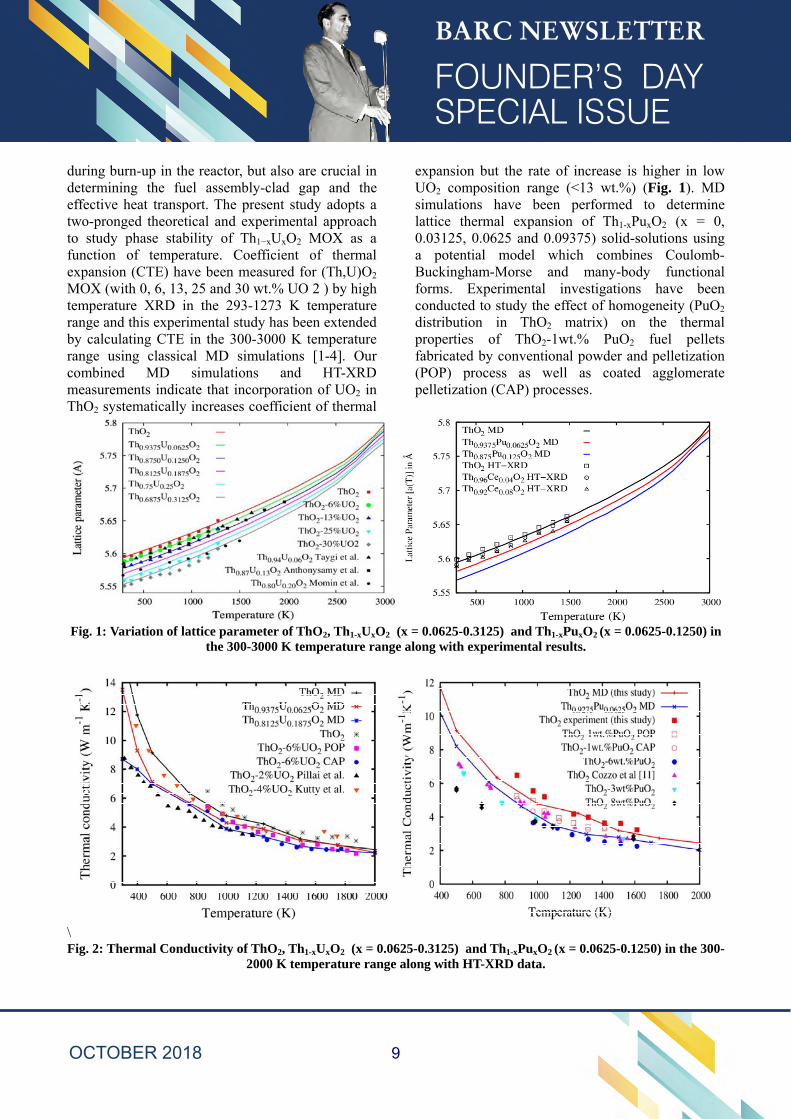
during burn-up in the reactor, but also are crucial in determining the fuel assembly-clad gap and the effective heat transport. The present study adopts a two-pronged theoretical and experimental approach to study phase stability of Th1−xUxO2 MOX as a function of temperature. Coefficient of thermal expansion (CTE) have been measured for (Th,U)O2 MOX (with 0, 6, 13, 25 and 30 wt.% UO 2 ) by high temperature XRD in the 293-1273 K temperature range and this experimental study has been extended by calculating CTE in the 300-3000 K temperature range using classical MD simulations [1-4]. Our combined MD simulations and HT-XRD measurements indicate that incorporation of UO2 in ThO2 systematically increases coefficient of thermal
expansion but the rate of increase is higher in low UO2 composition range (<13 wt.%) (Fig. 1). MD simulations have been performed to determine lattice thermal expansion of Th1-xPuxO2 (x = 0, 0.03125, 0.0625 and 0.09375) solid-solutions using a potential model which combines Coulomb-Buckingham-Morse and many-body functional forms. Experimental investigations have been conducted to study the effect of homogeneity (PuO2 distribution in ThO2 matrix) on the thermal properties of ThO2-1wt.% PuO2 fuel pellets fabricated by conventional powder and pelletization (POP) process as well as coated agglomerate pelletization (CAP) processes.
Fig. 1: Variation of lattice parameter of ThO2, Th1-xUxO2 (x = 0.0625-0.3125) and Th1-xPuxO2 (x = 0.0625-0.1250) in the 300-3000 K temperature range along with experimental results.
\ Fig. 2: Thermal Conductivity of ThO2, Th1-xUxO2 (x = 0.0625-0.3125) and Th1-xPuxO2 (x = 0.0625-0.1250) in the 300-
2000 K temperature range along with HT-XRD data.
9
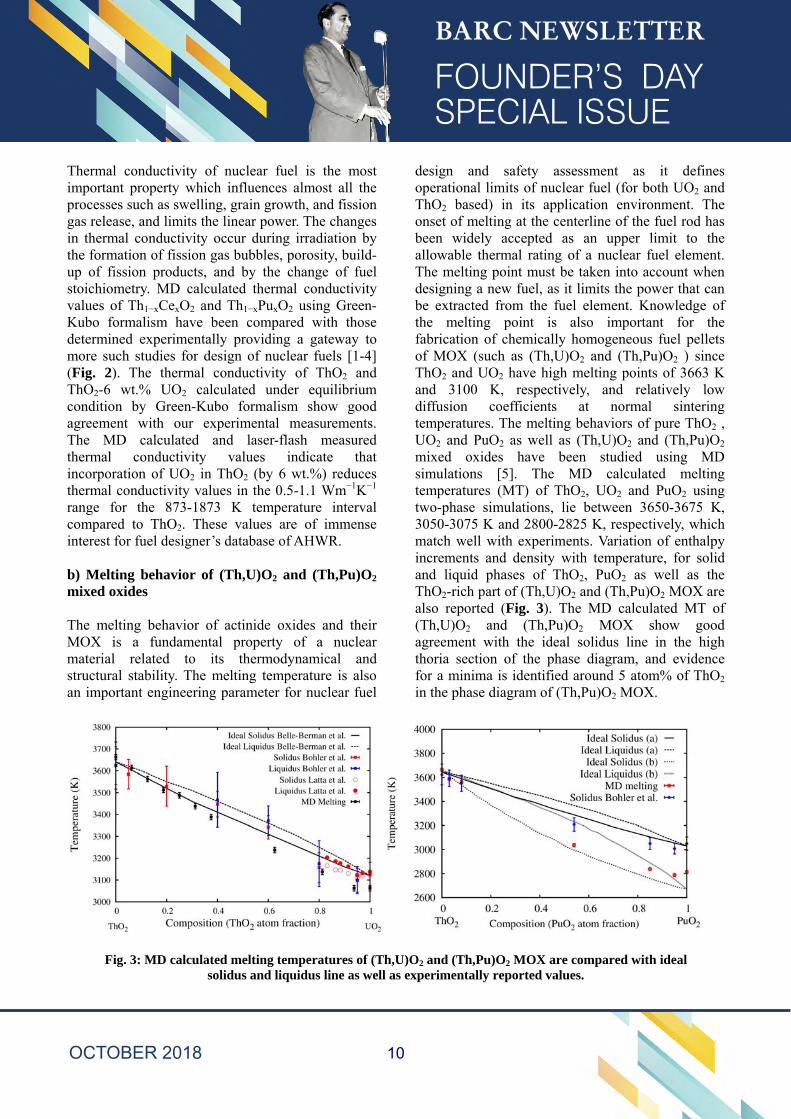
Thermal conductivity of nuclear fuel is the most important property which influences almost all the processes such as swelling, grain growth, and fission gas release, and limits the linear power. The changes in thermal conductivity occur during irradiation by the formation of fission gas bubbles, porosity, build-up of fission products, and by the change of fuel stoichiometry. MD calculated thermal conductivity values of Th1−xCexO2 and Th1−xPuxO2 using Green-Kubo formalism have been compared with those determined experimentally providing a gateway to more such studies for design of nuclear fuels [1-4] (Fig. 2). The thermal conductivity of ThO2 and ThO2-6 wt.% UO2 calculated under equilibrium condition by Green-Kubo formalism show good agreement with our experimental measurements. The MD calculated and laser-flash measured thermal conductivity values indicate that incorporation of UO2 in ThO2 (by 6 wt.%) reduces thermal conductivity values in the 0.5-1.1 Wm−1K−1 range for the 873-1873 K temperature interval compared to ThO2. These values are of immense interest for fuel designer’s database of AHWR. b) Melting behavior of (Th,U)O2 and (Th,Pu)O2 mixed oxides The melting behavior of actinide oxides and their MOX is a fundamental property of a nuclear material related to its thermodynamical and structural stability. The melting temperature is also an important engineering parameter for nuclear fuel
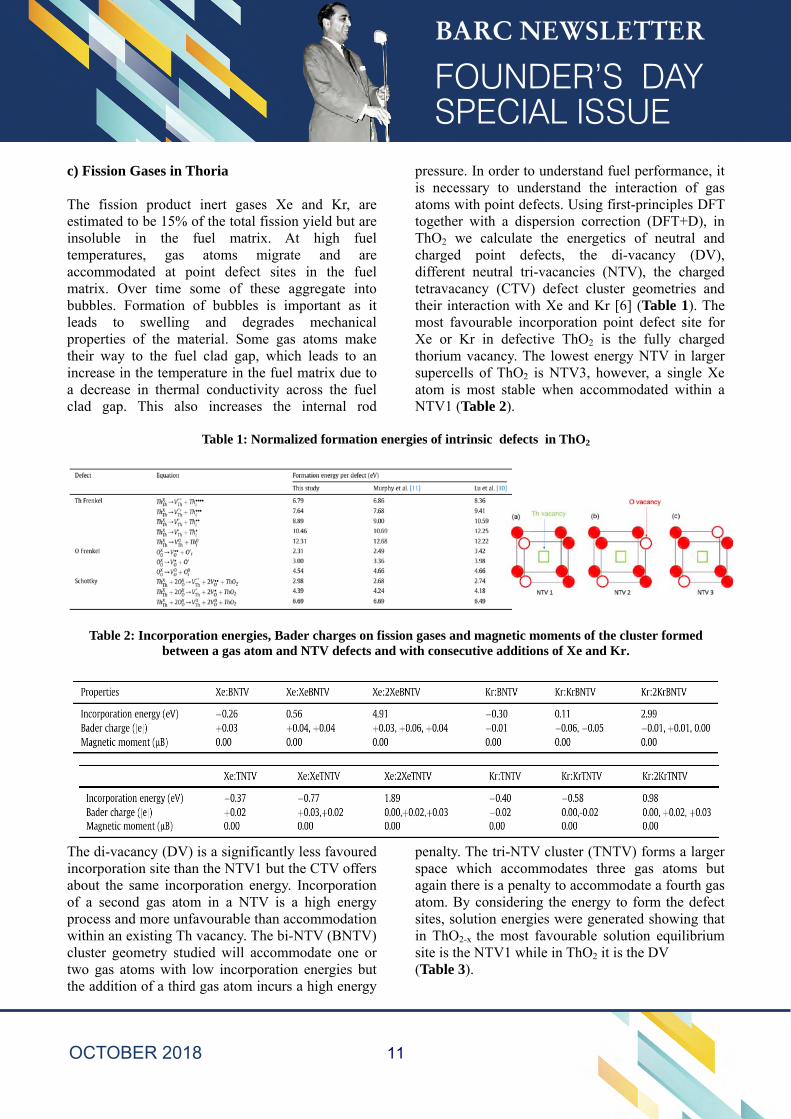
design and safety assessment as it defines operational limits of nuclear fuel (for both UO2 and ThO2 based) in its application environment. The onset of melting at the centerline of the fuel rod has been widely accepted as an upper limit to the allowable thermal rating of a nuclear fuel element. The melting point must be taken into account when designing a new fuel, as it limits the power that can be extracted from the fuel element. Knowledge of the melting point is also important for the fabrication of chemically homogeneous fuel pellets of MOX (such as (Th,U)O2 and (Th,Pu)O2 ) since ThO2 and UO2 have high melting points of 3663 K and 3100 K, respectively, and relatively low diffusion coefficients at normal sintering temperatures. The melting behaviors of pure ThO2 , UO2 and PuO2 as well as (Th,U)O2 and (Th,Pu)O2 mixed oxides have been studied using MD simulations [5]. The MD calculated melting temperatures (MT) of ThO2, UO2 and PuO2 using two-phase simulations, lie between 3650-3675 K, 3050-3075 K and 2800-2825 K, respectively, which match well with experiments. Variation of enthalpy increments and density with temperature, for solid and liquid phases of ThO2, PuO2 as well as the ThO2-rich part of (Th,U)O2 and (Th,Pu)O2 MOX are also reported (Fig. 3). The MD calculated MT of (Th,U)O2 and (Th,Pu)O2 MOX show good agreement with the ideal solidus line in the high thoria section of the phase diagram, and evidence for a minima is identified around 5 atom% of ThO2 in the phase diagram of (Th,Pu)O2 MOX.
Fig. 3: MD calculated melting temperatures of (Th,U)O2 and (Th,Pu)O2 MOX are compared with ideal
solidus and liquidus line as well as experimentally reported values.
10
c) Fission Gases in Thoria The fission product inert gases Xe and Kr, are estimated to be 15% of the total fission yield but are insoluble in the fuel matrix. At high fuel temperatures, gas atoms migrate and are accommodated at point defect sites in the fuel matrix. Over time some of these aggregate into bubbles. Formation of bubbles is important as it leads to swelling and degrades mechanical properties of the material. Some gas atoms make their way to the fuel clad gap, which leads to an increase in the temperature in the fuel matrix due to a decrease in thermal conductivity across the fuel clad gap. This also increases the internal rod
pressure. In order to understand fuel performance, it is necessary to understand the interaction of gas atoms with point defects. Using first-principles DFT together with a dispersion correction (DFT+D), in ThO2 we calculate the energetics of neutral and charged point defects, the di-vacancy (DV), different neutral tri-vacancies (NTV), the charged tetravacancy (CTV) defect cluster geometries and their interaction with Xe and Kr [6] (Table 1). The most favourable incorporation point defect site for Xe or Kr in defective ThO2 is the fully charged thorium vacancy. The lowest energy NTV in larger supercells of ThO2 is NTV3, however, a single Xe atom is most stable when accommodated within a NTV1 (Table 2).
Table 1: Normalized formation energies of intrinsic defects in ThO2
Table 2: Incorporation energies, Bader charges on fission gases and magnetic moments of the cluster formed
between a gas atom and NTV defects and with consecutive additions of Xe and Kr.
The di-vacancy (DV) is a significantly less favoured incorporation site than the NTV1 but the CTV offers about the same incorporation energy. Incorporation of a second gas atom in a NTV is a high energy process and more unfavourable than accommodation within an existing Th vacancy. The bi-NTV (BNTV) cluster geometry studied will accommodate one or two gas atoms with low incorporation energies but the addition of a third gas atom incurs a high energy
penalty. The tri-NTV cluster (TNTV) forms a larger space which accommodates three gas atoms but again there is a penalty to accommodate a fourth gas atom. By considering the energy to form the defect sites, solution energies were generated showing that in ThO2-x the most favourable solution equilibrium site is the NTV1 while in ThO2 it is the DV (Table 3).
11
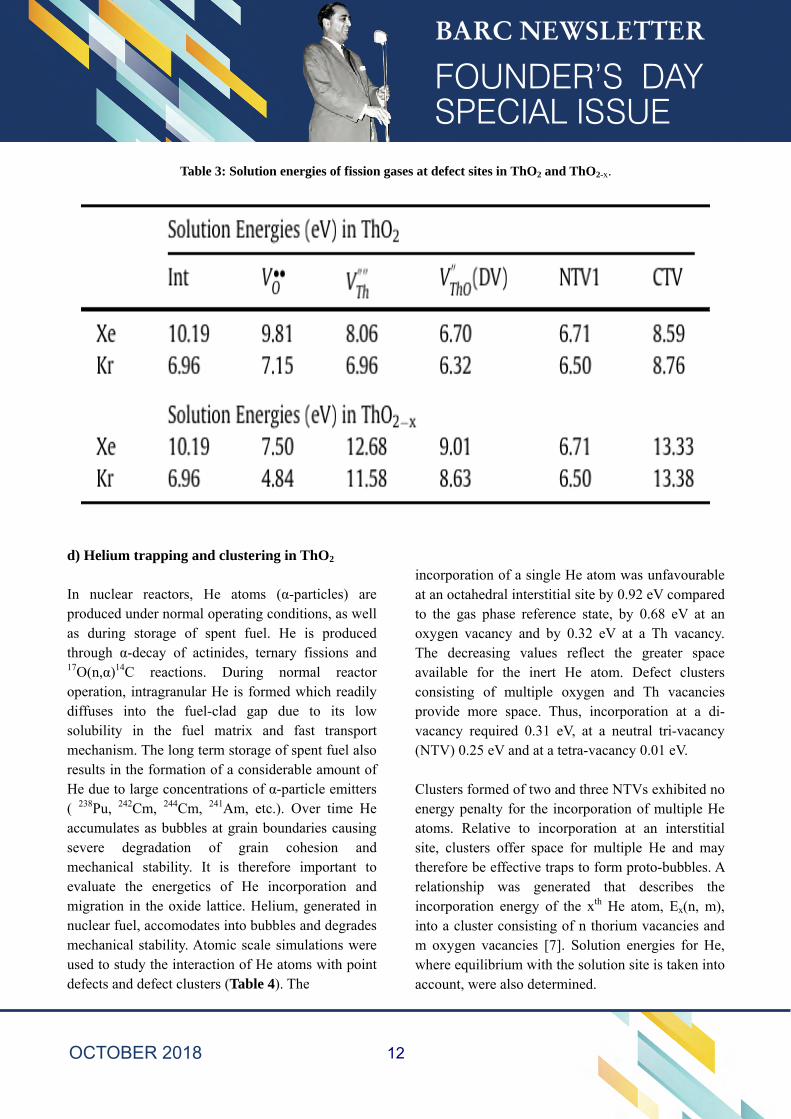
Table 3: Solution energies of fission gases at defect sites in ThO2 and ThO2-x.
d) Helium trapping and clustering in ThO2 In nuclear reactors, He atoms (α-particles) are produced under normal operating conditions, as well as during storage of spent fuel. He is produced through α-decay of actinides, ternary fissions and 17O(n,α)14C reactions. During normal reactor operation, intragranular He is formed which readily diffuses into the fuel-clad gap due to its low solubility in the fuel matrix and fast transport mechanism. The long term storage of spent fuel also results in the formation of a considerable amount of He due to large concentrations of α-particle emitters ( 238Pu, 242Cm, 244Cm, 241Am, etc.). Over time He accumulates as bubbles at grain boundaries causing severe degradation of grain cohesion and mechanical stability. It is therefore important to evaluate the energetics of He incorporation and migration in the oxide lattice. Helium, generated in nuclear fuel, accomodates into bubbles and degrades mechanical stability. Atomic scale simulations were used to study the interaction of He atoms with point defects and defect clusters (Table 4). The
incorporation of a single He atom was unfavourable at an octahedral interstitial site by 0.92 eV compared to the gas phase reference state, by 0.68 eV at an oxygen vacancy and by 0.32 eV at a Th vacancy. The decreasing values reflect the greater space available for the inert He atom. Defect clusters consisting of multiple oxygen and Th vacancies provide more space. Thus, incorporation at a di-vacancy required 0.31 eV, at a neutral tri-vacancy (NTV) 0.25 eV and at a tetra-vacancy 0.01 eV. Clusters formed of two and three NTVs exhibited no energy penalty for the incorporation of multiple He atoms. Relative to incorporation at an interstitial site, clusters offer space for multiple He and may therefore be effective traps to form proto-bubbles. A relationship was generated that describes the incorporation energy of the xth He atom, Ex(n, m), into a cluster consisting of n thorium vacancies and m oxygen vacancies [7]. Solution energies for He, where equilibrium with the solution site is taken into account, were also determined.
12
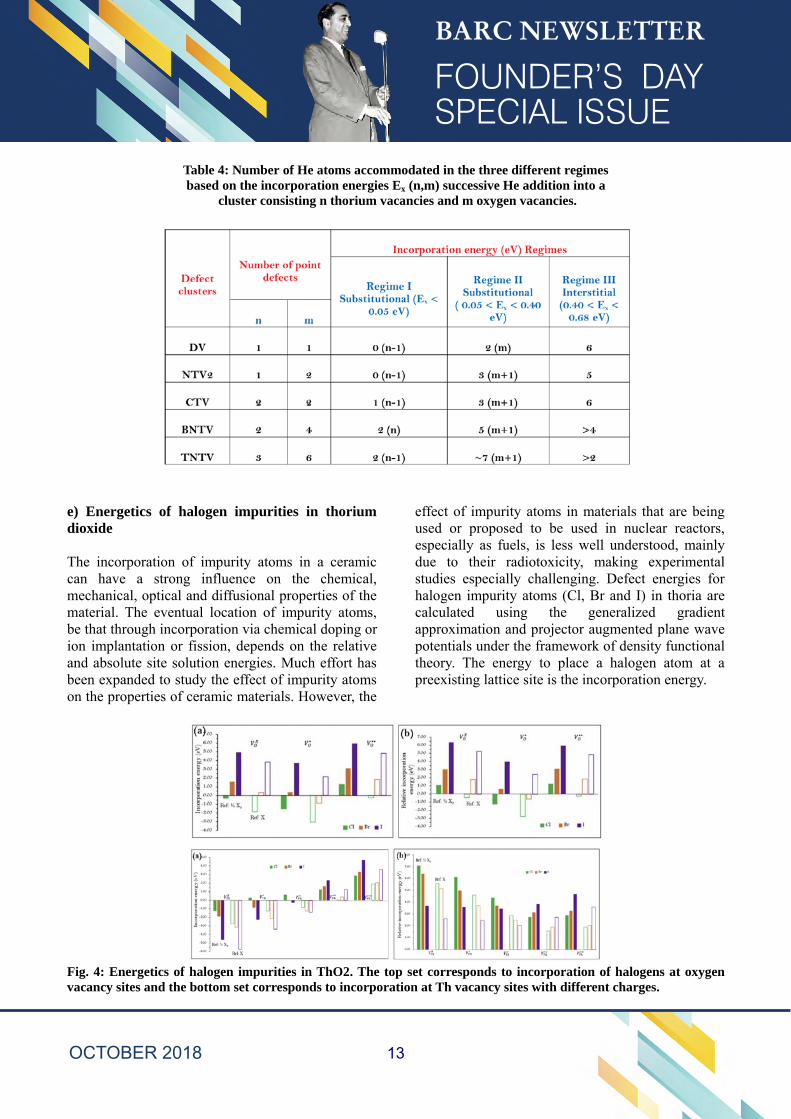
Table 4: Number of He atoms accommodated in the three different regimes based on the incorporation energies Ex (n,m) successive He addition into a
cluster consisting n thorium vacancies and m oxygen vacancies.
e) Energetics of halogen impurities in thorium dioxide The incorporation of impurity atoms in a ceramic can have a strong influence on the chemical, mechanical, optical and diffusional properties of the material. The eventual location of impurity atoms, be that through incorporation via chemical doping or ion implantation or fission, depends on the relative and absolute site solution energies. Much effort has been expanded to study the effect of impurity atoms on the properties of ceramic materials. However, the
effect of impurity atoms in materials that are being used or proposed to be used in nuclear reactors, especially as fuels, is less well understood, mainly due to their radiotoxicity, making experimental studies especially challenging. Defect energies for halogen impurity atoms (Cl, Br and I) in thoria are calculated using the generalized gradient approximation and projector augmented plane wave potentials under the framework of density functional theory. The energy to place a halogen atom at a preexisting lattice site is the incorporation energy.
Fig. 4: Energetics of halogen impurities in ThO2. The top set corresponds to incorporation of halogens at oxygen vacancy sites and the bottom set corresponds to incorporation at Th vacancy sites with different charges.
13
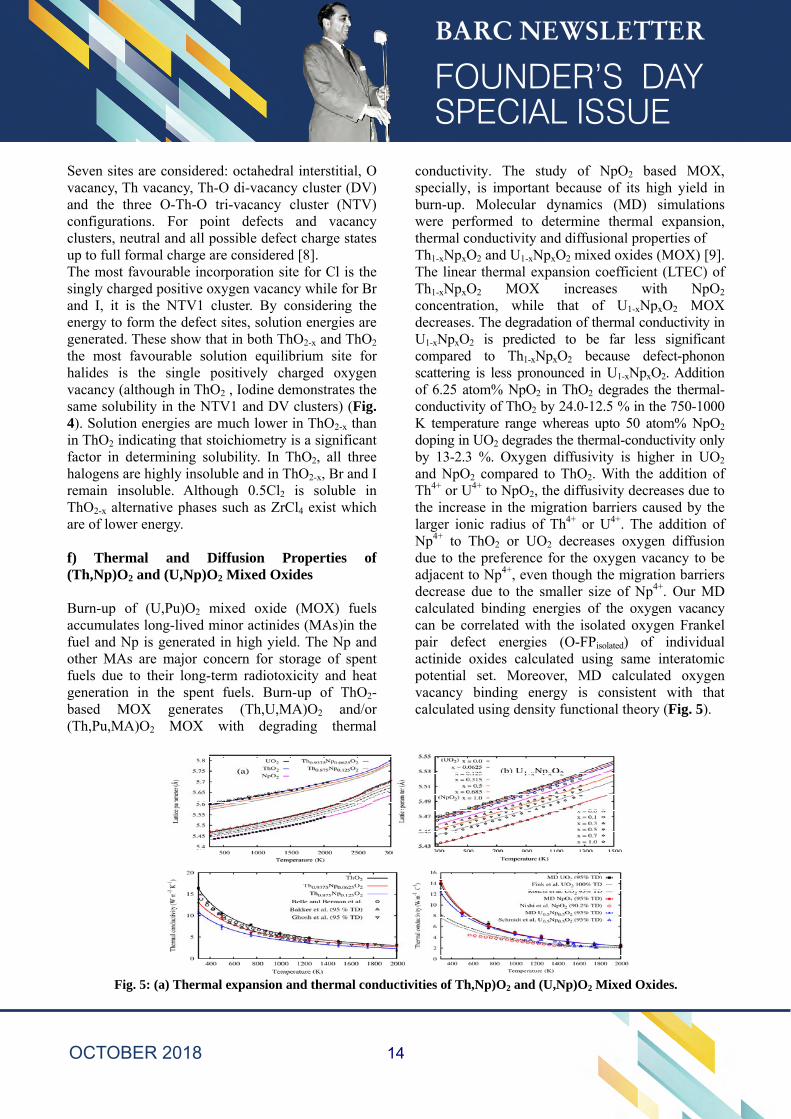
Seven sites are considered: octahedral interstitial, O vacancy, Th vacancy, Th-O di-vacancy cluster (DV) and the three O-Th-O tri-vacancy cluster (NTV) configurations. For point defects and vacancy clusters, neutral and all possible defect charge states up to full formal charge are considered [8]. The most favourable incorporation site for Cl is the singly charged positive oxygen vacancy while for Br and I, it is the NTV1 cluster. By considering the energy to form the defect sites, solution energies are generated. These show that in both ThO2-x and ThO2 the most favourable solution equilibrium site for halides is the single positively charged oxygen vacancy (although in ThO2 , Iodine demonstrates the same solubility in the NTV1 and DV clusters) (Fig. 4). Solution energies are much lower in ThO2-x than in ThO2 indicating that stoichiometry is a significant factor in determining solubility. In ThO2, all three halogens are highly insoluble and in ThO2-x, Br and I remain insoluble. Although 0.5Cl2 is soluble in ThO2-x alternative phases such as ZrCl4 exist which are of lower energy. f) Thermal and Diffusion Properties of (Th,Np)O2 and (U,Np)O2 Mixed Oxides Burn-up of (U,Pu)O2 mixed oxide (MOX) fuels accumulates long-lived minor actinides (MAs)in the fuel and Np is generated in high yield. The Np and other MAs are major concern for storage of spent fuels due to their long-term radiotoxicity and heat generation in the spent fuels. Burn-up of ThO2-based MOX generates (Th,U,MA)O2 and/or (Th,Pu,MA)O2 MOX with degrading thermal
conductivity. The study of NpO2 based MOX, specially, is important because of its high yield in burn-up. Molecular dynamics (MD) simulations were performed to determine thermal expansion, thermal conductivity and diffusional properties of Th1-xNpxO2 and U1-xNpxO2 mixed oxides (MOX) [9]. The linear thermal expansion coefficient (LTEC) of Th1-xNpxO2 MOX increases with NpO2 concentration, while that of U1-xNpxO2 MOX decreases. The degradation of thermal conductivity in U1-xNpxO2 is predicted to be far less significant compared to Th1-xNpxO2 because defect-phonon scattering is less pronounced in U1-xNpxO2. Addition of 6.25 atom% NpO2 in ThO2 degrades the thermal-conductivity of ThO2 by 24.0-12.5 % in the 750-1000 K temperature range whereas upto 50 atom% NpO2 doping in UO2 degrades the thermal-conductivity only by 13-2.3 %. Oxygen diffusivity is higher in UO2 and NpO2 compared to ThO2. With the addition of Th4+ or U4+ to NpO2, the diffusivity decreases due to the increase in the migration barriers caused by the larger ionic radius of Th4+ or U4+. The addition of Np4+ to ThO2 or UO2 decreases oxygen diffusion due to the preference for the oxygen vacancy to be adjacent to Np4+, even though the migration barriers decrease due to the smaller size of Np4+. Our MD calculated binding energies of the oxygen vacancy can be correlated with the isolated oxygen Frankel pair defect energies (O-FPisolated) of individual actinide oxides calculated using same interatomic potential set. Moreover, MD calculated oxygen vacancy binding energy is consistent with that calculated using density functional theory (Fig. 5).
Fig. 5: (a) Thermal expansion and thermal conductivities of Th,Np)O2 and (U,Np)O2 Mixed Oxides.
14

g) Trapping of volatile fission products by C60 Gaseous effluents, generated during processing of spent fuel, contain radioactive volatile species including alkali metals, halogens and noble gases. Among these, species such as iodine and strontium can be concentrated by the body, increasing the radio-toxic impact. To minimize the hazard, radioactive species should be removed through either physical or chemical capture before the effluent is discharged to the atmosphere.Carbon based filters provide important safety barriers that remove volatile fission products from gas streams. The capacity and efficiency of a filter to trap fission products depends upon the strength of the interaction between the fission products and the filter material. In this study, we apply density functional theory together with a dispersion correction (DFT+D) to predict structures and energies of volatile fission product atoms and
molecules trapped by buckminsterfullerene (C60) [10]. Endohedral encapsulation energies and exohedral association energies show that Rb and Cs are strongly trapped as ions, each transferring approximately one electron to C60. Kr and Xe are weakly trapped atoms with Xe showing a preference for exohedral association and Kr for endohedral encapsulation (Fig. 6). A dimer will not form inside the cage of C60 for any species because there is insufficient volume, as evidenced by the distortion introduced by the dimer. Br, I and Te, while strongly trapped as atoms (and assuming charge from C60 ) are thermodynamically more stable as neutral covalently bonded Br2, I2 and Te2 molecules, weakly trapped through van der Waals forces, exohedrally. Heteronuclear CsBr and CsI were also considered. Both molecules were non-bonded to C60 with similar association energies to those exhibited by Br2, I2 and Te2.
Fig. 6: Initial configurations considered for the FPs: (a) absorbed in C60 endohedrally, (b) exohedrally adjacent to a six membered ring, (c) a five membered ring, (d) a C-C bond between two hexagons, (e) a C-C bond between an hexagon and a pentagon and (f) a C on the fullerene cage. The table shows encapsulation or association energies for the fission atoms interacting with C60.
15
References:
[1] “Thermal expansion and thermal conductivity of (Th,U)O2 mixed oxides: A molecular dynamics and experimental study”, P.S. Ghosh, P.S. Somayajulu,
K. Krishnan, N. Pathak, A. Arya, G.K. Dey, J. Alloys Compds., 650 (2015) 165-177.
[2] "Thermal expansion and thermal conductivity of (Th,Pu)O2 mixed oxides: A molecular dynamics and experimental study"; P.S. Somayajulu, P.S. Ghosh, A. Arya, K.V. Vrinda Devi, D.B. Sathe, J. Banerjee, K.B. Khan, G.K. Dey, B.K. Dutta; Journal of Alloys and Compounds, 664 (2016) 291-303.
[3] "Experimental and molecular dynamics study of thermo-physical and transport properties of ThO2-5wt.% CeO2 mixed oxides"; P.S. Somayajulu, P.S. Ghosh, J. Banerjee, K.L.N.C. Babu, K.M. Danny, B.P. Mandal, T. Mahata, P. Sengupta, S.K. Sali, A. Arya; Journal of Nuclear Materials, 467 (2015) 644-659.
[4] "Thermal expansion and thermal conductivity of (Th,Ce)O2 mixed oxides: A molecular dynamics and experimental study"; P.S. Ghosh, P.S. Somayajulu, A. Arya, G.K. Dey, B.K. Dutta; J. Alloys Compds, 638 (2015) 172–181.
[5] "Melting Behaviour of (Th,U)O2 and (Th,Pu)O2 Mixed Oxides"; P.S. Ghosh, N. Kuganathan, C.O.T. Galvin, A. Arya, G.K. Dey, B.K. Dutta, R.W. Grimes, Journal of Nuclear Materials, 479 (2016) 112.
[6] “Fission gas in thoria”, N. Kuganathan, Partha S. Ghosh, Conor O.T. Galvin, Ashok K. Arya, Bijon K. Dutta, Gautam K. Dey, Robin W. Grimes, Journal of Nuclear Materials, 485 (2017) 47-55.
[7] “Helium Trapping and Clustering in Thorium Dioxide”, N. Kuganathan, P.S. Ghosh, A. Arya and R.W. Grimes, Journal of Nuclear Materials, 507 (2018) 288-296.
[8] “Energetics of Halogen Impurity in Thorium Dioxides”, N. Kuganathan, P.S. Ghosh, A. Arya, G.K. Dey and R.W. Grimes, Journal of Nuclear Materials, 495 (2017) 192-201.
[9] “Thermal and Diffusional Properties of (U,Np)O2 and (Th,Np)O2 Mixed Oxides”, P.S. Ghosh, N. Kuganathan, A. Arya and R.W. Grimes, J. Nucl. Mater, (submitted) 2018.
[10] “Thermodynamical Stability of Volatile Fission Products Interacting C60 fullerene cage”, N. Kuganathan, A. Arya, Michael J. D. Rushton, and Robin W. Grimes, Carbon, 132, (2018) 477-485.
[11] “A computational study on the superionic behaviour of ThO2”, P. S. Ghosh, A. Arya, G. K. Dey, N. Kuganathan and R. W. Grimes, Physical Chemistry and Chemical Physics, 18 (2016) 31494-31504.
Acknowledgements
The author acknowledges the support and help of his co-workers P.S. Ghosh, P.S. Somayajulu and G.K. Dey from BARC, and N. Kuganathan and R. Grimes from Imerial College, London, UK. The author is also thankful to Computer Division, BARC for providing the supercomputing facility. The support and encouragement from Dr. Madangopal Krishnan, Associate Director, Materials Group are also gratefully acknowledged.
16
Process Development for the Synthesis and Fabrication of Ceramic Solid Breeder Materials and Characterization D. Mandal Alkali Materials & Metal Division
D. Mandal is the recipient of the
Homi Bhabha Science & Technology Award for the year 2016
1.0 Introduction In the first generation fusion reactors, fusion of two hydrogen isotopes viz., deuterium and tritium is considered. Fusion of a deuterium (H ) and a tritium (H ) nucleus produces an alpha particle (He ) and a neutron (n ), as shown in reaction 1. Energy equivalent to 17.62 mega electron Volts (MeV) is released through the loss of mass in the fusion process [1-3]. H + H → (He + 3.52 MeV)+ (n + 14.1 MeV) (1) Naturally occurring hydrogen contains 0.014 mass % of deuterium and different technologies are available to separate deuterium from the compounds of hydrogen viz., ammonia, hydrogen sulfide etc. Whereas, natural hydrogen contains insignificant amount ( 7. 0 x 10 mass%) of H and the technology to separate it from natural hydrogen has not yet developed. Tritium can be produced by scattering Lithium-6 ( ) atoms with thermal neutrons through reaction [3-4] as shown in reaction 2 [1].
Li + n → (He + 2.1 MeV)+ (H + 2.7 MeV) (2) Lithium-based ceramics, enriched in Li isotope viz., lithium oxide (Li O), lithium aluminates (LiAlO ), lithium zirconate (Li ZrO ), lithium-titanate (Li TiO ), and lithiumortho-silicate (Li SiO ) are considered as solid breeder materials by ITER
(acronym: International Thermonuclear Experimental Reactor) [5]. One of the research directions to make the reaction 1 feasible for the sustainable fusion is based on blanket engineering concept using Li-based ceramics. These ceramics in pebble form will be contained in the annulus (blanket) surrounding the core of the fusion reactor to produce tritium according to the reaction 2 [1-4]. Li TiO and Li SiO are well accepted solid breeder materials for the Test Blanket Module (TBM) of ITER DEMO as well as for the future fusion reactors due to their attractive properties viz., high lithium density, high thermal stability, low temperature tritium release, high thermal conductivity as compared to other lithium-based compounds [6-8]. Both Li TiO and Li SiO in pebble forms and with certain properties are not occurring naturally. Hence, it was felt necessary to develop a process to synthesize and fabricate pebbles of these materials with certain properties. Till date, much work has been done on the synthesis, fabrication and characterization of Li TiO and Li SiO pebbles, tritium release behavior etc. [1-16]. Various investigators have proposed different methods [1, 2, 8]. The most commonly adopted methods are: mixing of lithium and titanium oxides (for Li TiO ) or silica (for Li SiO ) and followed by compaction and sintering [11], wet process [12] and sol-gel process [13]. The sol-gel and the wet process are the most preferred methods for Li TiO pebble fabrication, but these processes generate lots of effluents, which
17
(a) (b)
need treatments [13]. In the wet process, chilled acetone media is used for the pebble fabrication from a paste of Li TiO in aqueous Poly-Vinyl Alcohol (PVA) solution. These pebbles are heated at 650 C for 6 ℎ and sintered at 1400 C for 4 ℎ [13]. For synthesis and fabrication of Li SiO pebbles spray melting process is the process studied by many of the investigators [14–16] which is very energy intensive. An improved and general process has been developed at Alkali Material & Metal Division, Bhabha Atomic Research Centre, Mumbai to synthesize and fabricate pebbles of Li TiO and Li SiO . The process consumes less energy and produces no waste, except . Effect of presence of excess lithium on the microstructure of Li TiO and Li SiO were also investigated. Moreover, a process has also been developed for the recovery of lithium from spent/irradiated Li TiO and Li SiO pebbles. These are discussed in this paper. 2.0 Synthesis & Fabrication of Pebbles of Solid Breeder Materials 2.1 Synthesis of : Li CO and TiO powder were taken in 1:1 mole ratio and milled in a planetary ball mill for 5ℎ. The milled powder was
classified in a vibratory sieve shaker. Particles < 45 µm were separated and oversize were re-cycled to the ball mill. The homogeneously mixed powders were put in alumina crucibles and kept in a muffle furnace. The temperature was increased to 750 C in 2 ℎ and constant temperature was maintained for 6 ℎ for the reaction of Li CO and TiO to produce Li TO and CO according to reaction 3. Carbon-di-oxide (CO ), is the only waste produced in the process and it goes off from the system leaving solid product, Li TO . The product was cooled and ground to 45 µm in planetary ball mill. The process has been discussed in details somewhere else [1, 2] and the kinetic data for the reaction of Li CO and TiO to produce Li TiO has been discussed in details somewhere else [17].
Li CO + TiO → Li TiO + CO (3) 2.2 Synthesis of : Li SiO was synthesized in the similar process mentioned above by the reaction of mixture of Li CO and silica (SiO ) powder in 2:1 mole ratio, and milled in a planetary ball mill for 5 h to produce a homogeneous mixture of particles of size <45 μm.
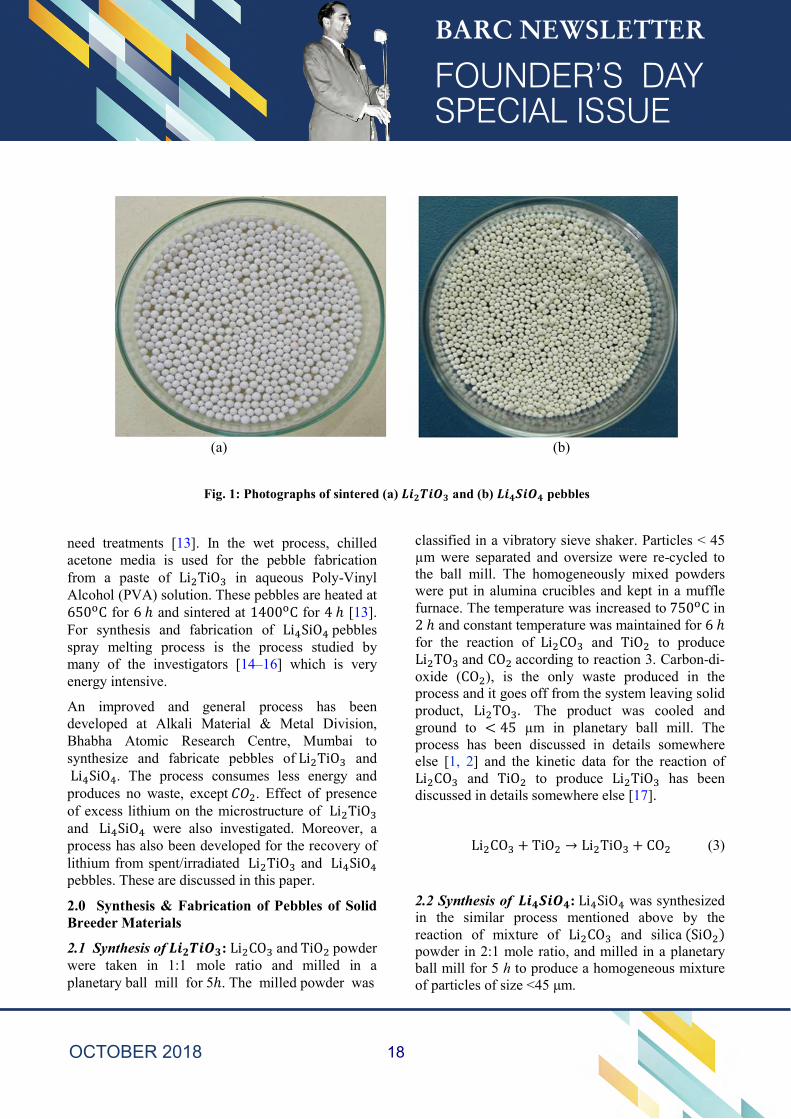
Fig. 1: Photographs of sintered (a) and (b) pebbles
18
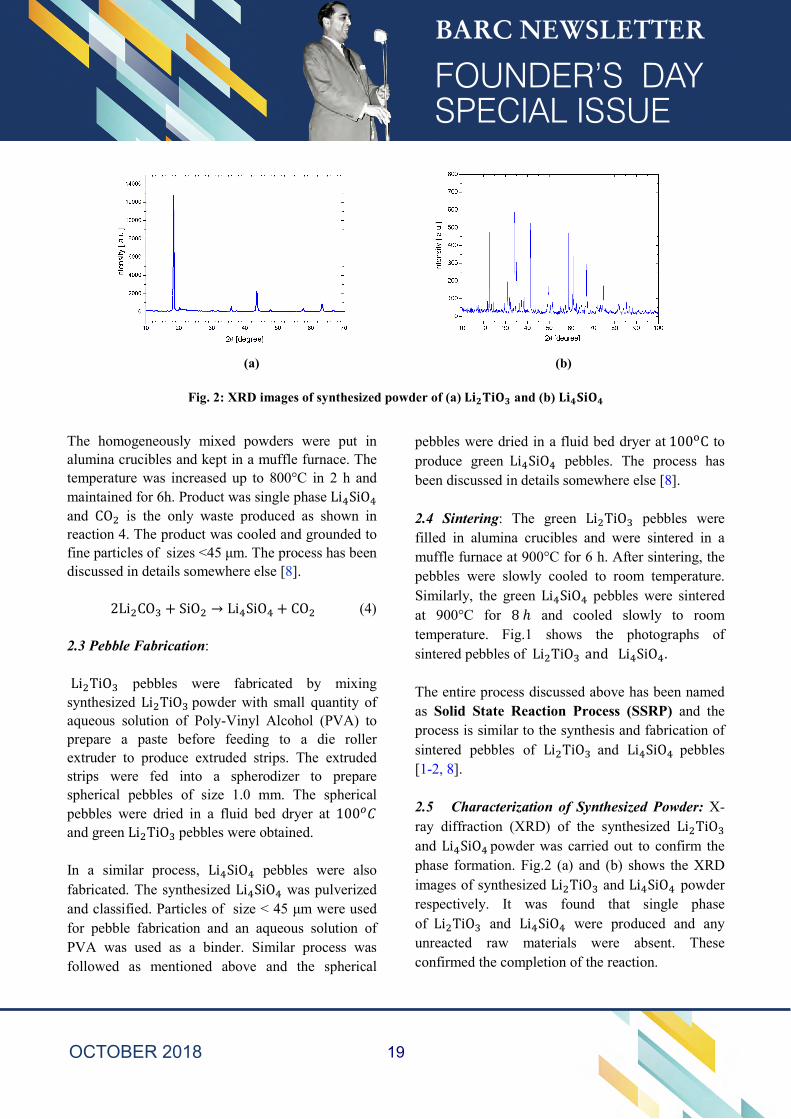
(a) (b) Fig. 2: XRD images of synthesized powder of (a) and (b)
The homogeneously mixed powders were put in alumina crucibles and kept in a muffle furnace. The temperature was increased up to 800°C in 2 h and maintained for 6h. Product was single phase Li SiO and CO is the only waste produced as shown in reaction 4. The product was cooled and grounded to fine particles of sizes <45 μm. The process has been discussed in details somewhere else [8].
2Li CO + SiO → Li SiO + CO (4) 2.3 Pebble Fabrication: Li TiO pebbles were fabricated by mixing synthesized Li TiO powder with small quantity of aqueous solution of Poly-Vinyl Alcohol (PVA) to prepare a paste before feeding to a die roller extruder to produce extruded strips. The extruded strips were fed into a spherodizer to prepare spherical pebbles of size 1.0 mm. The spherical pebbles were dried in a fluid bed dryer at 100 and green Li TiO pebbles were obtained. In a similar process, Li SiO pebbles were also fabricated. The synthesized Li SiO was pulverized and classified. Particles of size < 45 μm were used for pebble fabrication and an aqueous solution of PVA was used as a binder. Similar process was followed as mentioned above and the spherical
pebbles were dried in a fluid bed dryer at 100 C to produce green Li SiO pebbles. The process has been discussed in details somewhere else [8]. 2.4 Sintering: The green Li TiO pebbles were filled in alumina crucibles and were sintered in a muffle furnace at 900°C for 6 h. After sintering, the pebbles were slowly cooled to room temperature. Similarly, the green Li SiO pebbles were sintered at 900°C for 8 ℎ and cooled slowly to room temperature. Fig.1 shows the photographs of sintered pebbles of Li TiO and Li SiO . The entire process discussed above has been named as Solid State Reaction Process (SSRP) and the process is similar to the synthesis and fabrication of sintered pebbles of Li TiO and Li SiO pebbles [1-2, 8]. 2.5 Characterization of Synthesized Powder: X-ray diffraction (XRD) of the synthesized Li TiO and Li SiO powder was carried out to confirm the phase formation. Fig.2 (a) and (b) shows the XRD images of synthesized Li TiO and Li SiO powder respectively. It was found that single phase of Li TiO and Li SiO were produced and any unreacted raw materials were absent. These confirmed the completion of the reaction.
19
(a) (b) (c) (d)
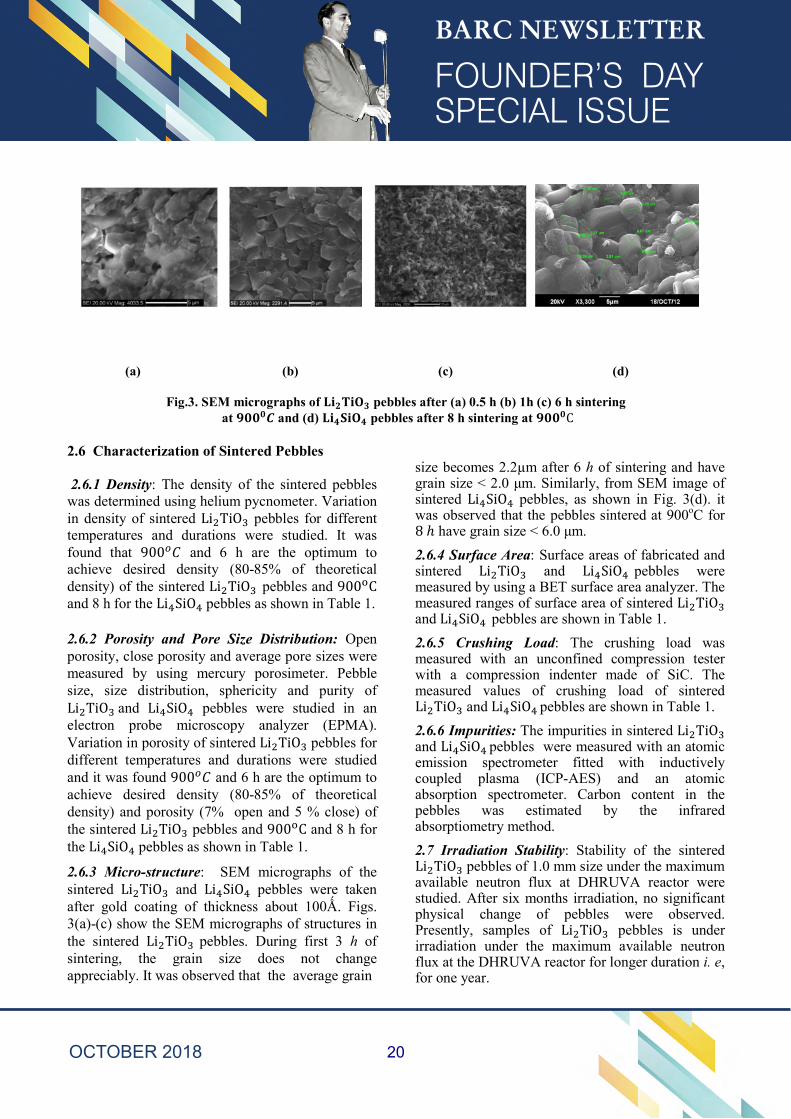
Fig.3. SEM micrographs of pebbles after (a) 0.5 h (b) 1h (c) 6 h sintering at and (d) pebbles after 8 h sintering at C
2.6 Characterization of Sintered Pebbles 2.6.1 Density: The density of the sintered pebbles was determined using helium pycnometer. Variation in density of sintered Li TiO pebbles for different temperatures and durations were studied. It was found that 900 and 6 h are the optimum to achieve desired density (80-85% of theoretical density) of the sintered Li TiO pebbles and 900 C and 8 h for the Li SiO pebbles as shown in Table 1. 2.6.2 Porosity and Pore Size Distribution: Open porosity, close porosity and average pore sizes were measured by using mercury porosimeter. Pebble size, size distribution, sphericity and purity of Li TiO and Li SiO pebbles were studied in an electron probe microscopy analyzer (EPMA). Variation in porosity of sintered Li TiO pebbles for different temperatures and durations were studied and it was found 900 and 6 h are the optimum to achieve desired density (80-85% of theoretical density) and porosity (7% open and 5 % close) of the sintered Li TiO pebbles and 900 C and 8 h for the Li SiO pebbles as shown in Table 1. 2.6.3 Micro-structure: SEM micrographs of the sintered Li TiO and Li SiO pebbles were taken after gold coating of thickness about 100Ǻ. Figs. 3(a)-(c) show the SEM micrographs of structures in the sintered Li TiO pebbles. During first 3 h of sintering, the grain size does not change appreciably. It was observed that the average grain
size becomes 2.2µm after 6 h of sintering and have grain size < 2.0 μm. Similarly, from SEM image of sintered Li SiO pebbles, as shown in Fig. 3(d). it was observed that the pebbles sintered at 900oC for 8 ℎ have grain size < 6.0 μm. 2.6.4 Surface Area: Surface areas of fabricated and sintered Li TiO and Li SiO pebbles were measured by using a BET surface area analyzer. The measured ranges of surface area of sintered Li TiO and Li SiO pebbles are shown in Table 1. 2.6.5 Crushing Load: The crushing load was measured with an unconfined compression tester with a compression indenter made of SiC. The measured values of crushing load of sintered Li TiO and Li SiO pebbles are shown in Table 1. 2.6.6 Impurities: The impurities in sintered Li TiO and Li SiO pebbles were measured with an atomic emission spectrometer fitted with inductively coupled plasma (ICP-AES) and an atomic absorption spectrometer. Carbon content in the pebbles was estimated by the infrared absorptiometry method. 2.7 Irradiation Stability: Stability of the sintered Li TiO pebbles of 1.0 mm size under the maximum available neutron flux at DHRUVA reactor were studied. After six months irradiation, no significant physical change of pebbles were observed. Presently, samples of Li TiO pebbles is under irradiation under the maximum available neutron flux at the DHRUVA reactor for longer duration i. e, for one year.
20
10 20 30 40 50 60 70 80 900
500
1000
1500
2000
2500
3000Li:Ti = 1:1
2 [degree]
Intensi
ty [a.u
]
Li2TiO3
a 20 30 40 50 60 70 80 90 1000
500
1000
1500
2000
2500
3000
2 [degree]
Intensi
ty [ a.u
]
Excess Li : 5 % Li2TiO3
b 10 20 30 40 50 60 70 80 90 100
0
500
1000
1500
2000
Intensi
ty [ a.u
. ]
2 [degree]
Excess Li : 10% Li2TiO3
c
10 20 30 40 50 60 70 80 90 100
0
500
1000
1500
2000
2500
3000
2 [degree]
Intensi
ty [ a.u
. ]
Excess Li : 15%
#
Li2CO3# Li2TiO3
d10 20 30 40 50 60 70 80 90 100
0
500
1000
1500
2000
2500
3000
Li2CO3
#
2 [degree]
Intensi
ty [ a.u
. ]
Excess Li : 20%
#
Li2TiO3
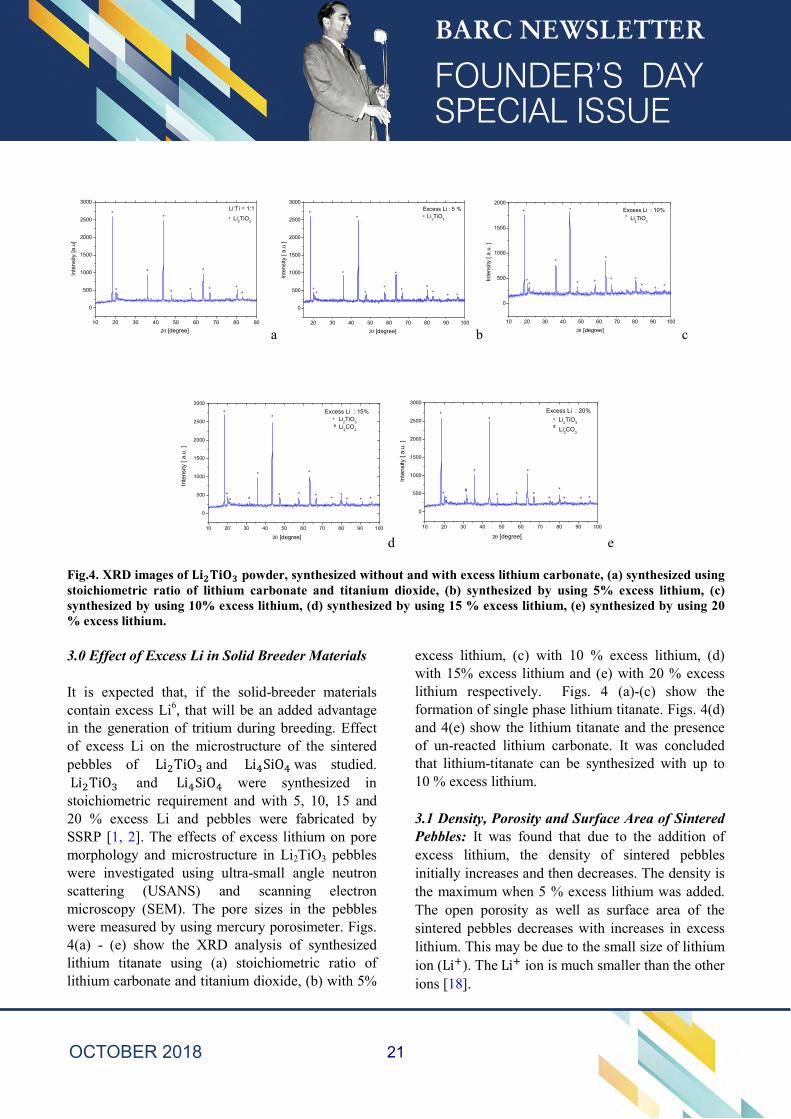
e Fig.4. XRD images of powder, synthesized without and with excess lithium carbonate, (a) synthesized using stoichiometric ratio of lithium carbonate and titanium dioxide, (b) synthesized by using 5% excess lithium, (c) synthesized by using 10% excess lithium, (d) synthesized by using 15 % excess lithium, (e) synthesized by using 20 % excess lithium. 3.0 Effect of Excess Li in Solid Breeder Materials It is expected that, if the solid-breeder materials contain excess Li6, that will be an added advantage in the generation of tritium during breeding. Effect of excess Li on the microstructure of the sintered pebbles of Li TiO and Li SiO was studied. Li TiO and Li SiO were synthesized in stoichiometric requirement and with 5, 10, 15 and 20 % excess Li and pebbles were fabricated by SSRP [1, 2]. The effects of excess lithium on pore morphology and microstructure in Li2TiO3 pebbles were investigated using ultra-small angle neutron scattering (USANS) and scanning electron microscopy (SEM). The pore sizes in the pebbles were measured by using mercury porosimeter. Figs. 4(a) - (e) show the XRD analysis of synthesized lithium titanate using (a) stoichiometric ratio of lithium carbonate and titanium dioxide, (b) with 5%
excess lithium, (c) with 10 % excess lithium, (d) with 15% excess lithium and (e) with 20 % excess lithium respectively. Figs. 4 (a)-(c) show the formation of single phase lithium titanate. Figs. 4(d) and 4(e) show the lithium titanate and the presence of un-reacted lithium carbonate. It was concluded that lithium-titanate can be synthesized with up to 10 % excess lithium. 3.1 Density, Porosity and Surface Area of Sintered Pebbles: It was found that due to the addition of excess lithium, the density of sintered pebbles initially increases and then decreases. The density is the maximum when 5 % excess lithium was added. The open porosity as well as surface area of the sintered pebbles decreases with increases in excess lithium. This may be due to the small size of lithium ion (Li ). The Li ion is much smaller than the other ions [18].
21
(a) (b) (c) (d) (e)
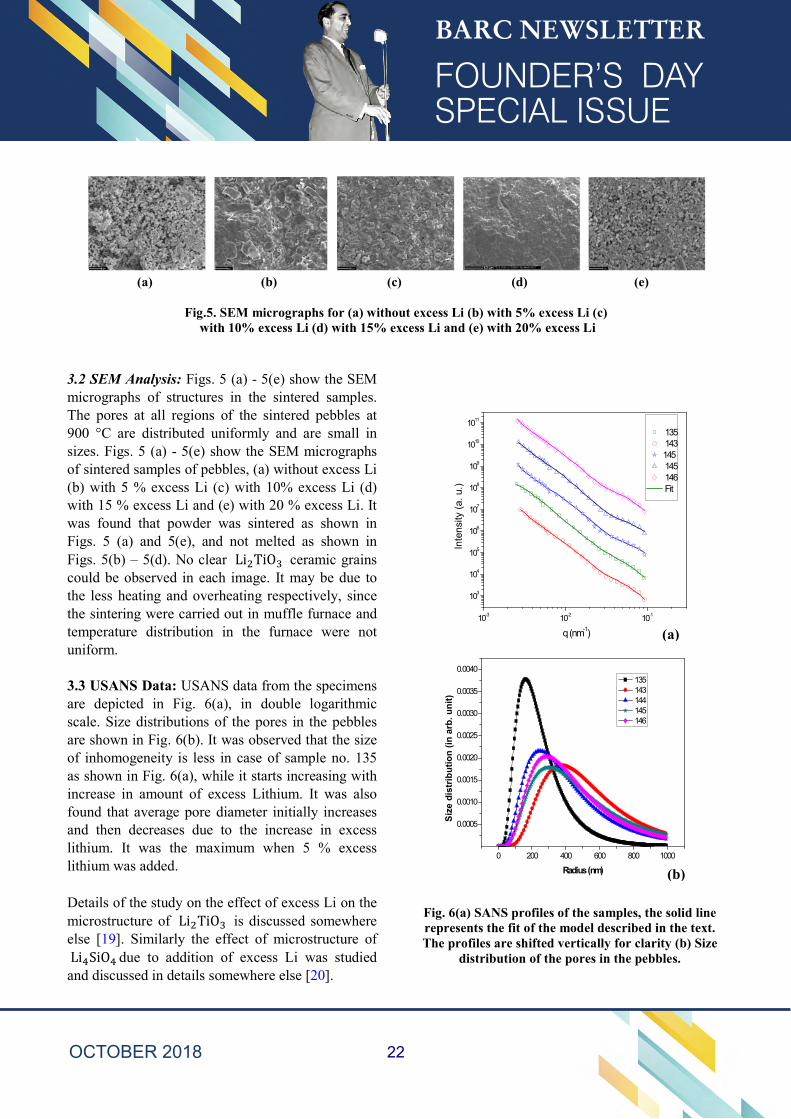
Fig.5. SEM micrographs for (a) without excess Li (b) with 5% excess Li (c) with 10% excess Li (d) with 15% excess Li and (e) with 20% excess Li
3.2 SEM Analysis: Figs. 5 (a) - 5(e) show the SEM micrographs of structures in the sintered samples. The pores at all regions of the sintered pebbles at 900 °C are distributed uniformly and are small in sizes. Figs. 5 (a) - 5(e) show the SEM micrographs of sintered samples of pebbles, (a) without excess Li (b) with 5 % excess Li (c) with 10% excess Li (d) with 15 % excess Li and (e) with 20 % excess Li. It was found that powder was sintered as shown in Figs. 5 (a) and 5(e), and not melted as shown in Figs. 5(b) – 5(d). No clear Li TiO ceramic grains could be observed in each image. It may be due to the less heating and overheating respectively, since the sintering were carried out in muffle furnace and temperature distribution in the furnace were not uniform. 3.3 USANS Data: USANS data from the specimens are depicted in Fig. 6(a), in double logarithmic scale. Size distributions of the pores in the pebbles are shown in Fig. 6(b). It was observed that the size of inhomogeneity is less in case of sample no. 135 as shown in Fig. 6(a), while it starts increasing with increase in amount of excess Lithium. It was also found that average pore diameter initially increases and then decreases due to the increase in excess lithium. It was the maximum when 5 % excess lithium was added. Details of the study on the effect of excess Li on the microstructure of Li TiO is discussed somewhere else [19]. Similarly the effect of microstructure of Li SiO due to addition of excess Li was studied and discussed in details somewhere else [20].
10-3 10-2 10-1
103
104
105
106
107
108
109
1010
1011 135 143145 145 146 Fit
Intensi
ty (a. u
.)
q (nm-1)
0 200 400 600 800 1000
0.00050.00100.00150.00200.00250.00300.00350.0040
135 143 144 145 146
Size d
istrib
ution
(in ar
b. un
it)
Radius (nm) Fig. 6(a) SANS profiles of the samples, the solid line represents the fit of the model described in the text. The profiles are shifted vertically for clarity (b) Size
distribution of the pores in the pebbles.
(a)
(b)
22
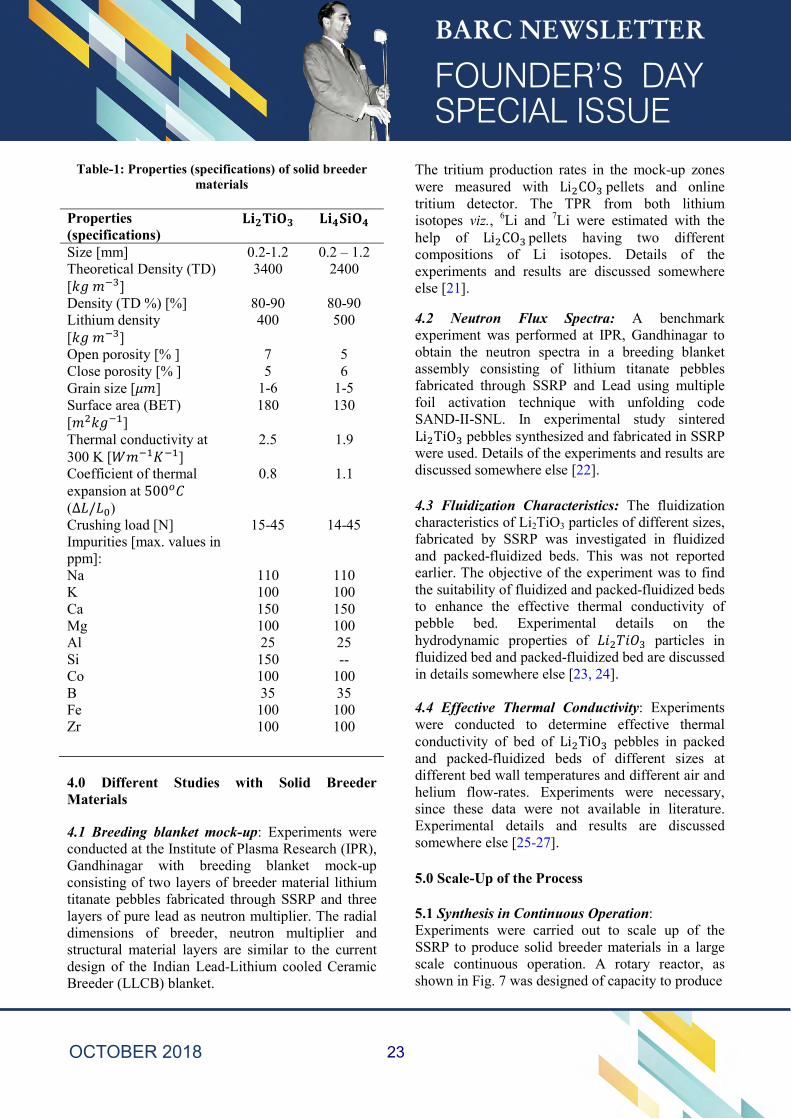
Table-1: Properties (specifications) of solid breeder materials
4.0 Different Studies with Solid Breeder Materials 4.1 Breeding blanket mock-up: Experiments were conducted at the Institute of Plasma Research (IPR), Gandhinagar with breeding blanket mock-up consisting of two layers of breeder material lithium titanate pebbles fabricated through SSRP and three layers of pure lead as neutron multiplier. The radial dimensions of breeder, neutron multiplier and structural material layers are similar to the current design of the Indian Lead-Lithium cooled Ceramic Breeder (LLCB) blanket.
The tritium production rates in the mock-up zones were measured with Li CO pellets and online tritium detector. The TPR from both lithium isotopes viz., 6Li and 7Li were estimated with the help of Li CO pellets having two different compositions of Li isotopes. Details of the experiments and results are discussed somewhere else [21]. 4.2 Neutron Flux Spectra: A benchmark experiment was performed at IPR, Gandhinagar to obtain the neutron spectra in a breeding blanket assembly consisting of lithium titanate pebbles fabricated through SSRP and Lead using multiple foil activation technique with unfolding code SAND-II-SNL. In experimental study sintered Li TiO pebbles synthesized and fabricated in SSRP were used. Details of the experiments and results are discussed somewhere else [22]. 4.3 Fluidization Characteristics: The fluidization characteristics of Li2TiO3 particles of different sizes, fabricated by SSRP was investigated in fluidized and packed-fluidized beds. This was not reported earlier. The objective of the experiment was to find the suitability of fluidized and packed-fluidized beds to enhance the effective thermal conductivity of pebble bed. Experimental details on the hydrodynamic properties of particles in fluidized bed and packed-fluidized bed are discussed in details somewhere else [23, 24]. 4.4 Effective Thermal Conductivity: Experiments were conducted to determine effective thermal conductivity of bed of Li TiO pebbles in packed and packed-fluidized beds of different sizes at different bed wall temperatures and different air and helium flow-rates. Experiments were necessary, since these data were not available in literature. Experimental details and results are discussed somewhere else [25-27]. 5.0 Scale-Up of the Process 5.1 Synthesis in Continuous Operation: Experiments were carried out to scale up of the SSRP to produce solid breeder materials in a large scale continuous operation. A rotary reactor, as shown in Fig. 7 was designed of capacity to produce
Properties (specifications) Size [mm] 0.2-1.2 0.2 – 1.2 Theoretical Density (TD) [ ]
3400 2400 Density (TD %) [%] 80-90 80-90 Lithium density [ ]
400 500 Open porosity [% ] 7 5 Close porosity [% ] 5 6 Grain size [ ] 1-6 1-5 Surface area (BET) [ ]
180 130 Thermal conductivity at 300 K [ ]
2.5 1.9 Coefficient of thermal expansion at 500 (∆ / )
0.8 1.1
Crushing load [N] 15-45 14-45 Impurities [max. values in ppm]: Na 110 110 K 100 100 Ca 150 150 Mg 100 100 Al 25 25 Si 150 -- Co 100 100 B 35 35 Fe 100 100 Zr 100 100
23
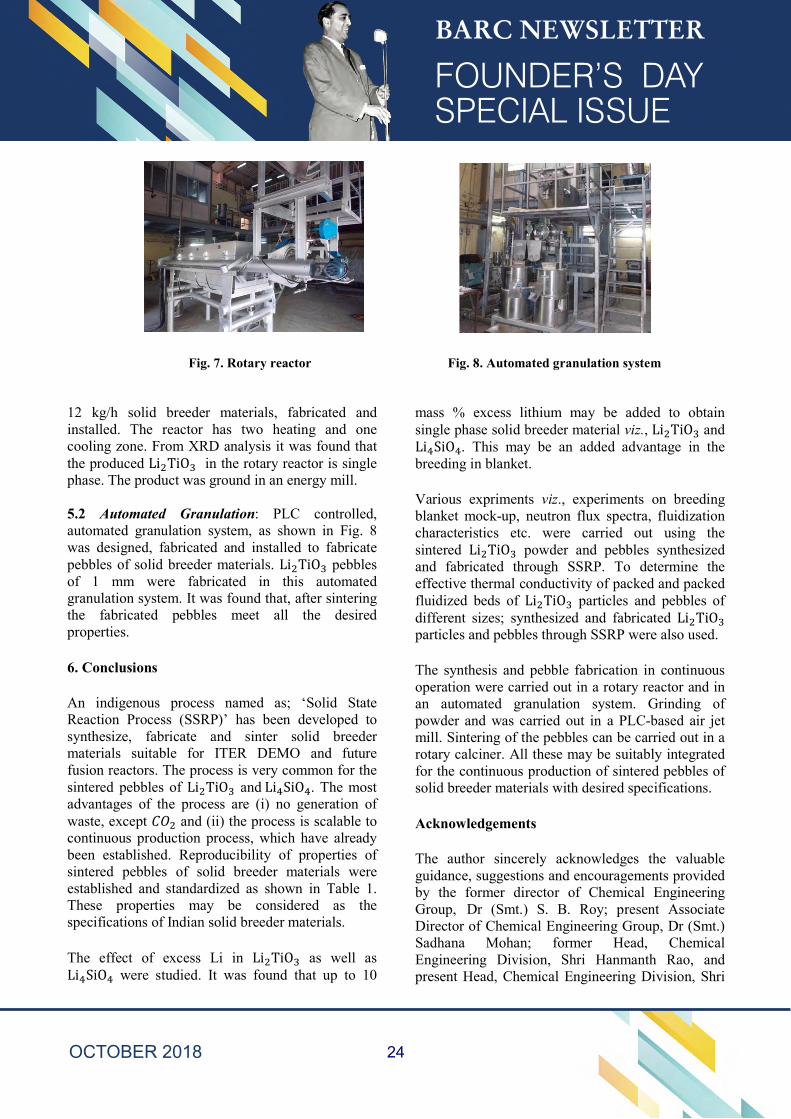
Fig. 7. Rotary reactor Fig. 8. Automated granulation system
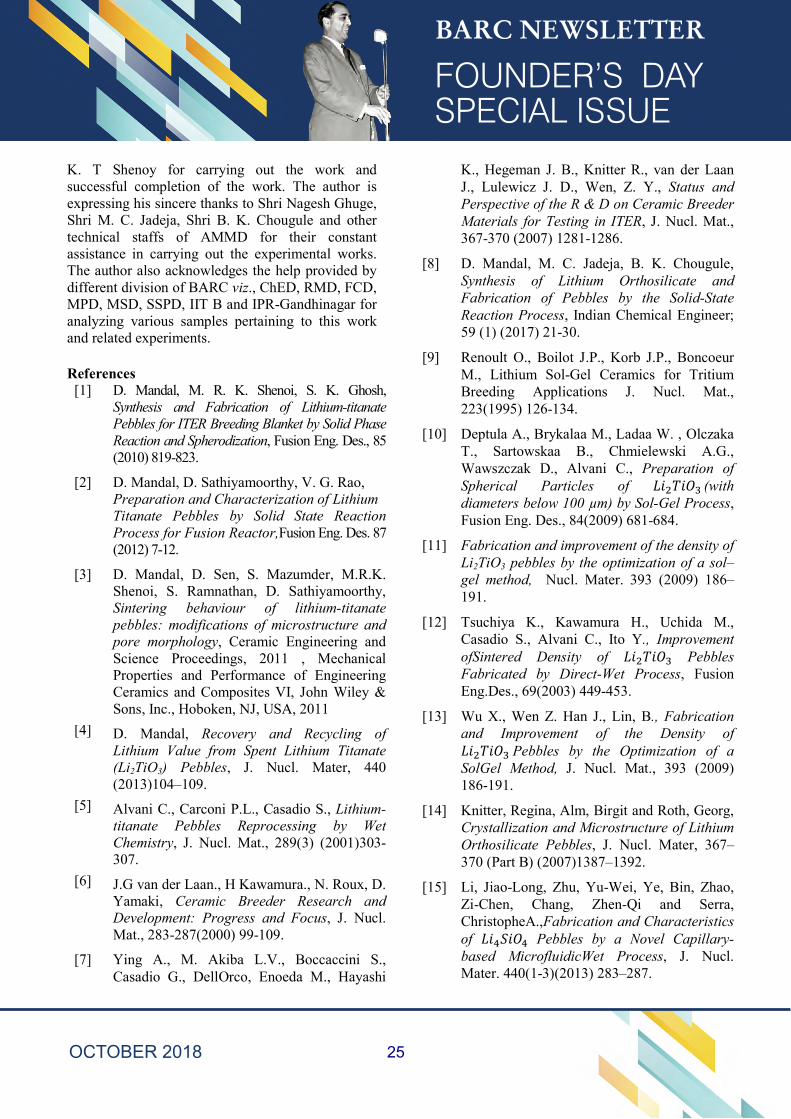
12 kg/h solid breeder materials, fabricated and installed. The reactor has two heating and one cooling zone. From XRD analysis it was found that the produced Li TiO in the rotary reactor is single phase. The product was ground in an energy mill. 5.2 Automated Granulation: PLC controlled, automated granulation system, as shown in Fig. 8 was designed, fabricated and installed to fabricate pebbles of solid breeder materials. Li TiO pebbles of 1 mm were fabricated in this automated granulation system. It was found that, after sintering the fabricated pebbles meet all the desired properties. 6. Conclusions An indigenous process named as; ‘Solid State Reaction Process (SSRP)’ has been developed to synthesize, fabricate and sinter solid breeder materials suitable for ITER DEMO and future fusion reactors. The process is very common for the sintered pebbles of Li TiO and Li SiO . The most advantages of the process are (i) no generation of waste, except and (ii) the process is scalable to continuous production process, which have already been established. Reproducibility of properties of sintered pebbles of solid breeder materials were established and standardized as shown in Table 1. These properties may be considered as the specifications of Indian solid breeder materials. The effect of excess Li in Li TiO as well as Li SiO were studied. It was found that up to 10
mass % excess lithium may be added to obtain single phase solid breeder material viz., Li TiO and Li SiO . This may be an added advantage in the breeding in blanket. Various expriments viz., experiments on breeding blanket mock-up, neutron flux spectra, fluidization characteristics etc. were carried out using the sintered Li TiO powder and pebbles synthesized and fabricated through SSRP. To determine the effective thermal conductivity of packed and packed fluidized beds of Li TiO particles and pebbles of different sizes; synthesized and fabricated Li TiO particles and pebbles through SSRP were also used. The synthesis and pebble fabrication in continuous operation were carried out in a rotary reactor and in an automated granulation system. Grinding of powder and was carried out in a PLC-based air jet mill. Sintering of the pebbles can be carried out in a rotary calciner. All these may be suitably integrated for the continuous production of sintered pebbles of solid breeder materials with desired specifications. Acknowledgements The author sincerely acknowledges the valuable guidance, suggestions and encouragements provided by the former director of Chemical Engineering Group, Dr (Smt.) S. B. Roy; present Associate Director of Chemical Engineering Group, Dr (Smt.) Sadhana Mohan; former Head, Chemical Engineering Division, Shri Hanmanth Rao, and present Head, Chemical Engineering Division, Shri
24
K. T Shenoy for carrying out the work and successful completion of the work. The author is expressing his sincere thanks to Shri Nagesh Ghuge, Shri M. C. Jadeja, Shri B. K. Chougule and other technical staffs of AMMD for their constant assistance in carrying out the experimental works. The author also acknowledges the help provided by different division of BARC viz., ChED, RMD, FCD, MPD, MSD, SSPD, IIT B and IPR-Gandhinagar for analyzing various samples pertaining to this work and related experiments. References [1] D. Mandal, M. R. K. Shenoi, S. K. Ghosh,
Synthesis and Fabrication of Lithium-titanate Pebbles for ITER Breeding Blanket by Solid Phase Reaction and Spherodization, Fusion Eng. Des., 85 (2010) 819-823.
[2] D. Mandal, D. Sathiyamoorthy, V. G. Rao, Preparation and Characterization of Lithium Titanate Pebbles by Solid State Reaction Process for Fusion Reactor,Fusion Eng. Des. 87 (2012) 7-12.
[3] D. Mandal, D. Sen, S. Mazumder, M.R.K. Shenoi, S. Ramnathan, D. Sathiyamoorthy, Sintering behaviour of lithium-titanate pebbles: modifications of microstructure and pore morphology, Ceramic Engineering and Science Proceedings, 2011 , Mechanical Properties and Performance of Engineering Ceramics and Composites VI, John Wiley & Sons, Inc., Hoboken, NJ, USA, 2011
[4] D. Mandal, Recovery and Recycling of Lithium Value from Spent Lithium Titanate (Li2TiO3) Pebbles, J. Nucl. Mater, 440 (2013)104–109.
[5] Alvani C., Carconi P.L., Casadio S., Lithium-titanate Pebbles Reprocessing by Wet Chemistry, J. Nucl. Mat., 289(3) (2001)303-307.
[6] J.G van der Laan., H Kawamura., N. Roux, D. Yamaki, Ceramic Breeder Research and Development: Progress and Focus, J. Nucl. Mat., 283-287(2000) 99-109.
[7] Ying A., M. Akiba L.V., Boccaccini S., Casadio G., DellOrco, Enoeda M., Hayashi
K., Hegeman J. B., Knitter R., van der Laan J., Lulewicz J. D., Wen, Z. Y., Status and Perspective of the R & D on Ceramic Breeder Materials for Testing in ITER, J. Nucl. Mat., 367-370 (2007) 1281-1286.
[8] D. Mandal, M. C. Jadeja, B. K. Chougule, Synthesis of Lithium Orthosilicate and Fabrication of Pebbles by the Solid-State Reaction Process, Indian Chemical Engineer; 59 (1) (2017) 21-30.
[9] Renoult O., Boilot J.P., Korb J.P., Boncoeur M., Lithium Sol-Gel Ceramics for Tritium Breeding Applications J. Nucl. Mat., 223(1995) 126-134.
[10] Deptula A., Brykalaa M., Ladaa W. , Olczaka T., Sartowskaa B., Chmielewski A.G., Wawszczak D., Alvani C., Preparation of Spherical Particles of (with diameters below 100 µm) by Sol-Gel Process, Fusion Eng. Des., 84(2009) 681-684.
[11] Fabrication and improvement of the density of Li2TiO3 pebbles by the optimization of a sol–gel method, Nucl. Mater. 393 (2009) 186–191.
[12] Tsuchiya K., Kawamura H., Uchida M., Casadio S., Alvani C., Ito Y., Improvement ofSintered Density of Pebbles Fabricated by Direct-Wet Process, Fusion Eng.Des., 69(2003) 449-453.
[13] Wu X., Wen Z. Han J., Lin, B., Fabrication and Improvement of the Density of Pebbles by the Optimization of a SolGel Method, J. Nucl. Mat., 393 (2009) 186-191.
[14] Knitter, Regina, Alm, Birgit and Roth, Georg, Crystallization and Microstructure of Lithium Orthosilicate Pebbles, J. Nucl. Mater, 367–370 (Part B) (2007)1387–1392.
[15] Li, Jiao-Long, Zhu, Yu-Wei, Ye, Bin, Zhao, Zi-Chen, Chang, Zhen-Qi and Serra, ChristopheA.,Fabrication and Characteristics of Pebbles by a Novel Capillary-based MicrofluidicWet Process, J. Nucl. Mater. 440(1-3)(2013) 283–287.
25
[16] Feng, Y.J., Feng, K.M., Cao, Q.X., Hub, J. and Tang, H., Fabrication and Characterization of Pebbles by Melt Spraying Method, Fusion Eng. Des., 87(2012) 753–756.
[17] D. Mandal, Reaction Kinetics for the Synthesis of Lithium-Titanate ( ) by Solid State Reaction, ARPN J. Sc. & Tech., 4 (2) (2014) 59-66.
[18] J. D. Lee, Concise Inorganic Chemistry, 4th ed., Chapman & Hall, 1991.
[19] D. Mandal, M. C. Jadeja, D. Sen, S. Mazumder, Effect of Excess Lithium on Sintering Behaviour of Lithium-Titanate Pebbles: Modifications of Microstructure and Pore Morphology, Fusion Eng. Des., 112 (2016), 520-526.
[20] D. Mandal, M. C. Jadeja, N. S. Ghuge, D. Sen, S. Mazumder, Modifications of Microstructure and Pore Morphology in Lithium-Orthosilicate Pebbles, Due to the Addition of Excess Lithium, Fusion Eng. Des., 112 (2016), 613-620.
[21] Shrichand Jakhar, M. Abhang, S. Tiwari, R. Makwana, V. Chaudhari, H.L. Swami, C. Danani, C.V.S. Rao, T.K. Basu, D. Mandal, Sonali Bhade, R.V. Kolekar, P.J. Reddy, R. Bhattacharyay, P. Chaudhuri, Tritium breeding mock-up experiments containing lithium titanate ceramic pebbles and lead irradiated with DT neutrons, Fusion Eng. Des. 95 (2015) 50-58.
[22] Shrichand Jakhar, M. Abhang, S. Tiwari, R. Makwana, V. Chaudhari, H.L. Swami, C. Danani, C.V.S. Rao, T.K. Basu, D. Mandal, Neutron flux spectra investigations in breeding blanket assembly containing lithium titanate and Lead irradiated with DT neutrons, Fusion Eng. Des. 100 (2015) 619-628.
[23] D. Mandal, D. Sathiyamoorthy, D.V.Khakhar, Fluidization characteristics of lithium-titanate in gas-solid fluidized bed, Fusion Eng. Des., 86 (4-5) (2011) 393-398.
[24] D. Mandal, M. Vinjamur, D. Sathiyamoorthy, Hydrodynamics of beds of small particles in the voids of coarse particles, Powder Technol. 235 (2013) 256-262.
[25] D. Mandal, D. Sathiyamoorthy, M. Vinjamur, Experimental Measurement of Effective Thermal Conductivity of Packed Lithium-Titanate Pebble Bed, Fusion Eng. Des. 87 (2012) 67-76.
[26] D. Mandal, N. Kulkarni, S. Gosavi, C.S. Mathpati, Experimental investigation of effective thermal conductivity of packed lithium-titanate pebble bed with external heat source and flow of helium, Fusion Eng. Des, 115 (2017) 56–66.
[27] D. Mandal, D. Sathiyamoorthy, M. Vinjamur, Heat Transfer Characteristics of Lithium-Titanate Particles in Gas-Solid Packed Fluidized Bed, Fusion Sci. Technol. 62(1) (2012) 150-156.
26
Study Of Reactions Involving Weakly Bound Stable Projectiles
Satyaranjan Santra Nuclear Physics Division
Satyaranjan Santra is the recipient of the
Homi Bhabha Science & Technology Award for the year 2016
1. Introduction
The study of reactions involving weakly bound stable projectiles like 6,7Li and 9Be provides a great opportunity to simulate studies involving light radioactive ion beams because of their similarities in binding energies of the valence particles and “core+valence” cluster structures1-4. Due to low breakup threshold of these projectiles, they are very prone to breaking into their cluster constituents. So, compared to the reactions involving strongly bound projectiles, these reactions will always be accompanied additionally with projectile breakup channels. The presence of different breakup modes in these reactions and their possible effects on elastic and fusion cross sections makes the reaction dynamics study very interesting.
Projectile dissociation in the field of a target nucleus is a topic of continued interest because of its application to the determination of radiative capture cross section of astrophysical interest. In the absence of nuclear or higher order Coulomb effects on the reaction, the astrophysical S factor can be extracted for low relative energies. Understanding the reaction mechanisms of weakly bound projectiles and the coupling of their breakup on various channels is very important, especially in the context of the increasing number of the radioactive ion beam facilities and the quest for super heavy elements by the fusion of nuclei near the drip line.
Measurements involving the projectiles 6,7Li, 6He with α + x cluster structure show significantly larger cross sections for the inclusive alpha particle production5–10 compared to the production of the complementary fragment ‘x’. This indicates that there are mechanisms other than ‘α + x’ breakup responsible for the inclusive production of particles. Exclusive measurements of particles are essential to delineate different processes leading to such a large inclusive cross section and to understand the effect of projectile breakup on other channels.
2. Non-capture breakup cross sections:
With the above motivations, we have carried out a series of measurements involving all the three projectiles on several target nuclei of medium to heavy masses. Majority of these work during last 5 years focused on the exclusive measurements of two breakup fragments in coincidence to investigate the possible breakup modes. During the process, many new breakup channels have been found through which significant breakup cross sections have been measured, particularly in the reactions 6Li+112Sn and 7Li+112Sn.
For exclusive measurements, where the coincidence yield is expected to be very low, a large area Si-Strip-Detector Array with an angular coverage of ~100 degree has been setup as shown in Fig. 1. The strip detector array consists of ten strip detectors, each of which has 16 horizontal and 16 vertical
27
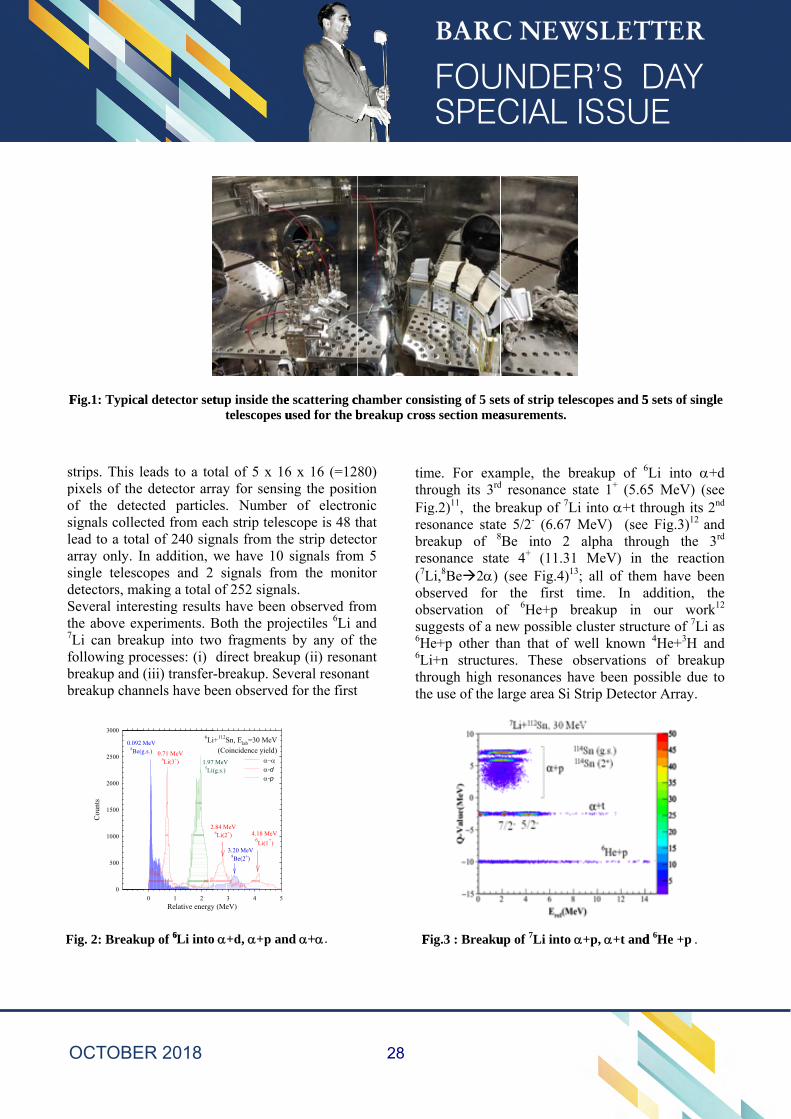
F
sposlasdSth7
fbb
Fig.1: Typica
strips. This lpixels of the of the detecsignals collecead to a tota
array only. Isingle telescdetectors, maSeveral interhe above exLi can break
following probreakup and breakup chan
Fig. 2:
Cou
nts
0
500
1000
1500
2000
2500
3000
0.092 M8Be(g
al detector set
eads to a todetector arr
cted particlected from eaal of 240 sign addition, wopes and 2
aking a total esting result
xperiments. Bkup into twocesses: (i) (iii) transfer-
nnels have be
Breakup of 6
6Li+
Relative energy0 1 2
MeVg.s.) 0.71 MeV
6Li(3+) 1.97 5Li(
2.
tup inside thetelescopes u
tal of 5 x 16ray for sensies. Number
ach strip telesgnals from thwe have 10
signals froof 252 signa
ts have been Both the projo fragmentsdirect breaku-breakup. Seeen observed
6
+112Sn, Elab=30 MeV(Coincidence yield)
y (MeV)3 4 5
-d-p
MeV(g.s.)
.84 MeV6Li(2+) 4.18 MeV
6Li(1
+)
3.20 MeV8Be(2+)
e scattering cused for the b
6 x 16 (=12ing the positr of electroscope is 48 t
he strip detecsignals fromm the moni
als. observed fr
jectiles 6Li a by any of up (ii) reson
everal resonad for the first
chamber consbreakup cros
80) tion onic that ctor m 5 itor
rom and the
nant ant t
timthrFigresbreres(7Lobobsug6H6Lthrthe
Li into α+d, α+p and α+α F
sisting of 5 sess section mea
me. For exarough its 3rd
g.2)11, the bsonance stateakup of 8
sonance statLi,8Be2) bserved for bservation oggests of a n
He+p other thi+n structurrough high re use of the l
Fig.3 : Breaku
ts of strip telasurements.
ample, the bd resonance breakup of 7Le 5/2- (6.67
8Be into 2 te 4+ (11.31(see Fig.4)1
the first of 6He+p bnew possible han that of res. These resonances hlarge area Si
up of 7Li into
escopes and 5
breakup of state 1+ (5.6
Li into +t tMeV) (seealpha thro
1 MeV) in 13; all of thetime. In a
breakup in cluster strucwell knownobservations
have been poStrip Detect
+p, +t and
5 sets of singl
6Li into +65 MeV) (sethrough its 2e Fig.3)12 anough the 3
the reactioem have beeaddition, th
our workcture of 7Li an 4He+3H ans of breakuossible due ttor Array.
d 6He +p
le
+d ee nd
nd 3rd on en he k12 as nd up to
. .
28
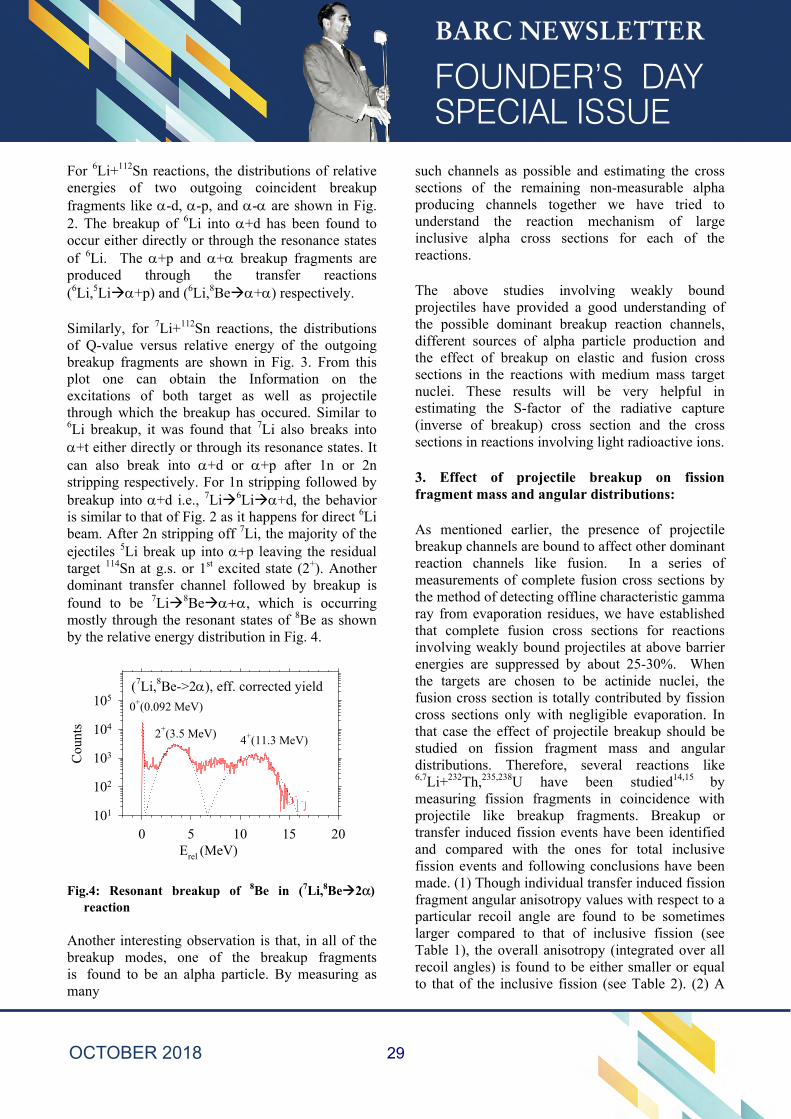
For 6Li+112Sn reactions, the distributions of relative energies of two outgoing coincident breakup fragments like -d, -p, and - are shown in Fig. 2. The breakup of 6Li into +d has been found tooccur either directly or through the resonance statesof 6Li. The +p and + breakup fragments areproduced through the transfer reactions(6Li,5Li+p) and (6Li,8Be+) respectively.
Similarly, for 7Li+112Sn reactions, the distributions of Q-value versus relative energy of the outgoing breakup fragments are shown in Fig. 3. From this plot one can obtain the Information on the excitations of both target as well as projectile through which the breakup has occured. Similar to 6Li breakup, it was found that 7Li also breaks into +t either directly or through its resonance states. It can also break into +d or +p after 1n or 2n stripping respectively. For 1n stripping followed by breakup into +d i.e., 7Li6Li+d, the behavior is similar to that of Fig. 2 as it happens for direct 6Li beam. After 2n stripping off 7Li, the majority of the ejectiles 5Li break up into +p leaving the residual target 114Sn at g.s. or 1st excited state (2+). Another dominant transfer channel followed by breakup is found to be 7Li8Be, which is occurring mostly through the resonant states of 8Be as shown by the relative energy distribution in Fig. 4.
0+(0.092 MeV)
2+(3.5 MeV)4+(11.3 MeV)
Erel (MeV)0 5 10 15 20
Cou
nts
101
102
103
104
105(7Li,8Be->2), eff. corrected yield
Fig.4: Resonant breakup of 8Be in (7Li,8Be2α) reaction
Another interesting observation is that, in all of the breakup modes, one of the breakup fragments is found to be an alpha particle. By measuring as many
such channels as possible and estimating the cross sections of the remaining non-measurable alpha producing channels together we have tried to understand the reaction mechanism of large inclusive alpha cross sections for each of the reactions.
The above studies involving weakly bound projectiles have provided a good understanding of the possible dominant breakup reaction channels, different sources of alpha particle production and the effect of breakup on elastic and fusion cross sections in the reactions with medium mass target nuclei. These results will be very helpful in estimating the S-factor of the radiative capture (inverse of breakup) cross section and the cross sections in reactions involving light radioactive ions.
3. Effect of projectile breakup on fissionfragment mass and angular distributions:
As mentioned earlier, the presence of projectile breakup channels are bound to affect other dominant reaction channels like fusion. In a series of measurements of complete fusion cross sections by the method of detecting offline characteristic gamma ray from evaporation residues, we have established that complete fusion cross sections for reactions involving weakly bound projectiles at above barrier energies are suppressed by about 25-30%. When the targets are chosen to be actinide nuclei, the fusion cross section is totally contributed by fission cross sections only with negligible evaporation. In that case the effect of projectile breakup should be studied on fission fragment mass and angular distributions. Therefore, several reactions like 6,7Li+232Th,235,238U have been studied14,15 by measuring fission fragments in coincidence with projectile like breakup fragments. Breakup or transfer induced fission events have been identified and compared with the ones for total inclusive fission events and following conclusions have been made. (1) Though individual transfer induced fission fragment angular anisotropy values with respect to a particular recoil angle are found to be sometimes larger compared to that of inclusive fission (see Table 1), the overall anisotropy (integrated over all recoil angles) is found to be either smaller or equal to that of the inclusive fission (see Table 2). (2) A
+
29

huge effect is observed on the peak to valley ratio of the mass distribution (see Fig.5) and width of folding angle distribution (see Fig. 6) compared to the ones involving strongly bound projectiles. (3) Contribution of incomplete fusion-fission cross sections could be disentangled from the complete fusion-fission.
In the comparison plot of Fig.5, the peak to valley ratios of the fission fragment mass distributions for
6,7Li+238U reactions are found to be much larger than the ones involving p- and n-induced reactions on similar targets especially at lower excitation energies. The FWHM of the fission fragment folding angle distributions at different excitation energies for the present systems have been found to have a different behavior (see Fig. 6) as compared to the reactions involving 14N and 16O.
Table 1: Individual transfer induced fission fragment angular anisotropy with respect to particular recoil angle.
Energy (MeV) Anisotropy
(α- gated)
Anisotropy
(d- gated)
Anisotropy
(p- gated)
Anisotropy
(inclusive)
28 1.26 ∓ 0.04 1.13 ∓ 0.04
32 1.16 ∓ 0.04 1.21 ∓ 0.09 1.20 ∓ 0.24 1.12 ∓ 0.04
36 1.20 ∓ 0.04 1.30 ∓ 0.08 1.36 ∓ 0.08 1.27 ∓ 0.04
Table 2: Individual transfer induced fission fragment angular anisotropy with respect to all recoil angles combined.
Energy (MeV) Aniso.
(α- gated)
Aniso.
(d- gated)
Aniso.
(p- gated)
Aniso.
(inclusive)
28 1.19 ∓ 0.04 1.13 ∓ 0.04
32 1.12 ∓ 0.04 1.18 ∓ 0.09 1.19 ∓ 0.24 1.12 ∓ 0.04
36 1.19 ∓ 0.04 1.29 ∓ 0.08 1.35 ∓ 0.08 1.27 ∓ 0.04
30
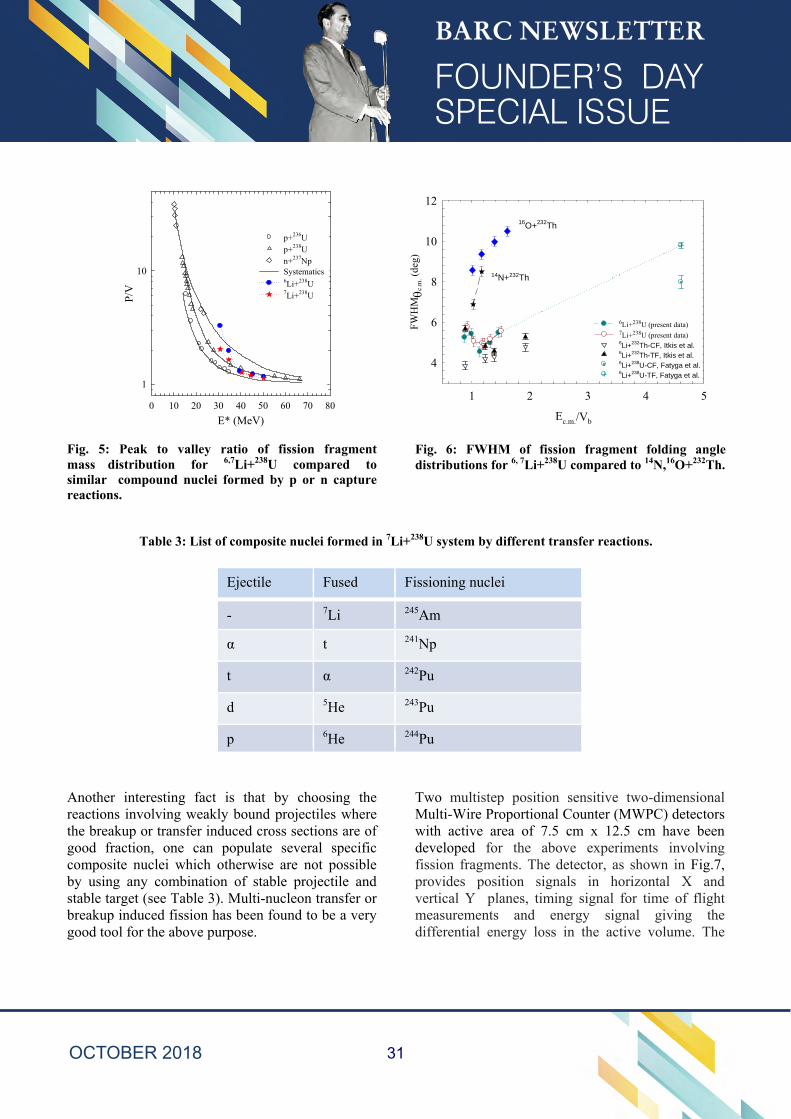
Fig. 5: Peak to valley ratio of fission fragment mass distribution for 6,7Li+238U compared to similar compound nuclei formed by p or n capture reactions.
Table 3: List of composite nuclei formed in 7Li+238U system by different transfer reactions.
Ejectile Fused Fissioning nuclei
- 7Li 245Am
α t 241Np
t α 242Pu
d 5He 243Pu
p 6He 244Pu
Another interesting fact is that by choosing the reactions involving weakly bound projectiles where the breakup or transfer induced cross sections are of good fraction, one can populate several specific composite nuclei which otherwise are not possible by using any combination of stable projectile and stable target (see Table 3). Multi-nucleon transfer or breakup induced fission has been found to be a very good tool for the above purpose.
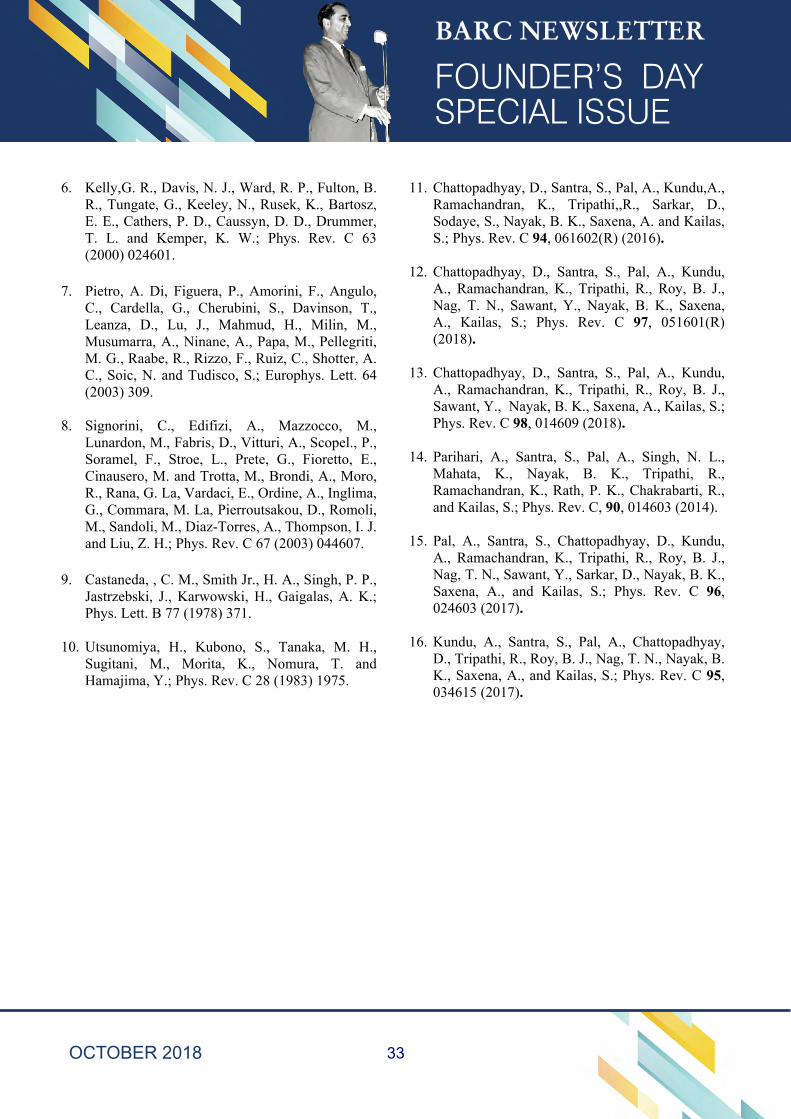
Two multistep position sensitive two-dimensional Multi-Wire Proportional Counter (MWPC) detectors with active area of 7.5 cm x 12.5 cm have been developed for the above experiments involving fission fragments. The detector, as shown in Fig.7, provides position signals in horizontal X and vertical Y planes, timing signal for time of flight measurements and energy signal giving the differential energy loss in the active volume. The
E* (MeV)0 10 20 30 40 50 60 70 80
P/V
1
10
p+236U p+238U n+237Np Systematics6Li+238U7Li+238U
Ec.m./Vb
Fig. 6: FWHM of fission fragment folding angle distributions for 6, 7Li+238U compared to 14N,16O+232Th.
1 2 3 4 5
FW
HMc
.m. (
deg)
4
6
8
10
12
6Li+238U (present data)7Li+238U (present data)6Li+232Th-CF, Itkis et al. 6Li+232Th-TF, Itkis et al.6Li+238U-CF, Fatyga et al. 6Li+238U-TF, Fatyga et al.
16O+232Th
14N+232Th
31
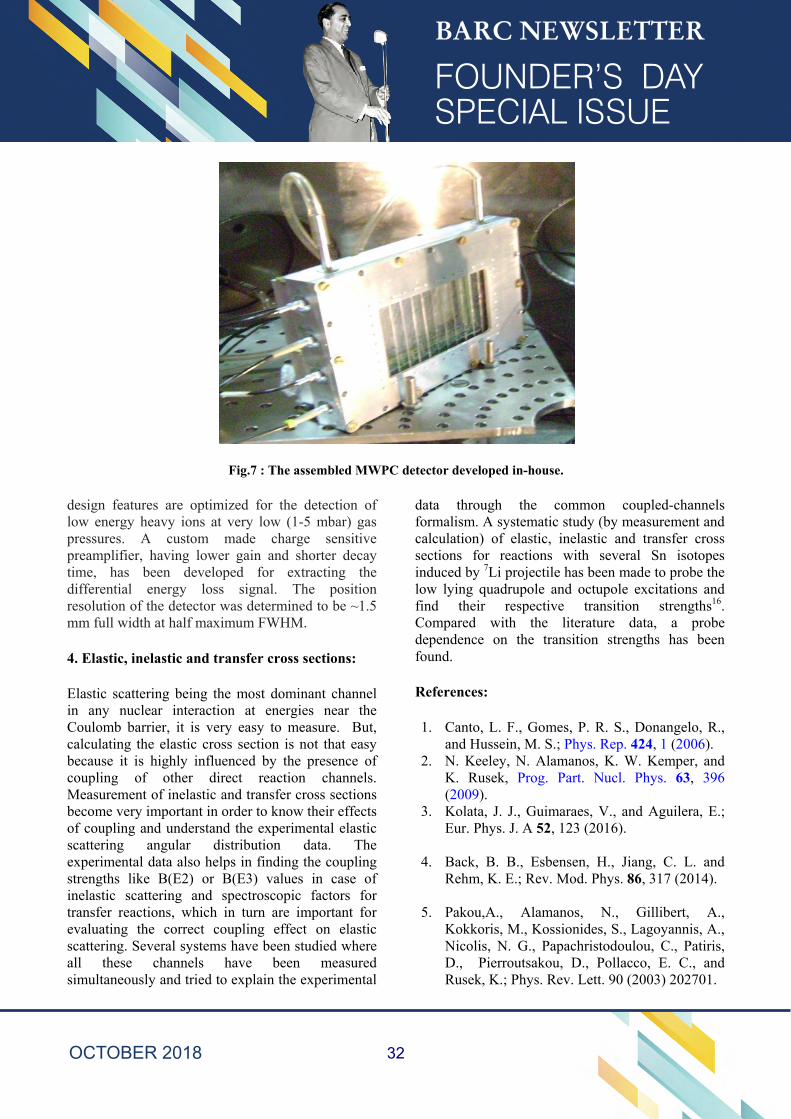
Fig.7 : The assembled MWPC detector developed in-house.
design features are optimized for the detection of low energy heavy ions at very low (1-5 mbar) gas pressures. A custom made charge sensitive preamplifier, having lower gain and shorter decay time, has been developed for extracting the differential energy loss signal. The position resolution of the detector was determined to be ~1.5 mm full width at half maximum FWHM.
4. Elastic, inelastic and transfer cross sections:
Elastic scattering being the most dominant channel in any nuclear interaction at energies near the Coulomb barrier, it is very easy to measure. But, calculating the elastic cross section is not that easy because it is highly influenced by the presence of coupling of other direct reaction channels. Measurement of inelastic and transfer cross sections become very important in order to know their effects of coupling and understand the experimental elastic scattering angular distribution data. The experimental data also helps in finding the coupling strengths like B(E2) or B(E3) values in case of inelastic scattering and spectroscopic factors for transfer reactions, which in turn are important for evaluating the correct coupling effect on elastic scattering. Several systems have been studied where all these channels have been measured simultaneously and tried to explain the experimental
data through the common coupled-channels formalism. A systematic study (by measurement and calculation) of elastic, inelastic and transfer cross sections for reactions with several Sn isotopes induced by 7Li projectile has been made to probe the low lying quadrupole and octupole excitations and find their respective transition strengths16. Compared with the literature data, a probe dependence on the transition strengths has been found.
References:
1. Canto, L. F., Gomes, P. R. S., Donangelo, R.,and Hussein, M. S.; Phys. Rep. 424, 1 (2006).
2. N. Keeley, N. Alamanos, K. W. Kemper, andK. Rusek, Prog. Part. Nucl. Phys. 63, 396(2009).
3. Kolata, J. J., Guimaraes, V., and Aguilera, E.;Eur. Phys. J. A 52, 123 (2016).
4. Back, B. B., Esbensen, H., Jiang, C. L. andRehm, K. E.; Rev. Mod. Phys. 86, 317 (2014).
5. Pakou,A., Alamanos, N., Gillibert, A.,Kokkoris, M., Kossionides, S., Lagoyannis, A.,Nicolis, N. G., Papachristodoulou, C., Patiris,D., Pierroutsakou, D., Pollacco, E. C., andRusek, K.; Phys. Rev. Lett. 90 (2003) 202701.
32
6. Kelly,G. R., Davis, N. J., Ward, R. P., Fulton, B.R., Tungate, G., Keeley, N., Rusek, K., Bartosz,E. E., Cathers, P. D., Caussyn, D. D., Drummer,T. L. and Kemper, K. W.; Phys. Rev. C 63(2000) 024601.
7. Pietro, A. Di, Figuera, P., Amorini, F., Angulo,C., Cardella, G., Cherubini, S., Davinson, T.,Leanza, D., Lu, J., Mahmud, H., Milin, M.,Musumarra, A., Ninane, A., Papa, M., Pellegriti,M. G., Raabe, R., Rizzo, F., Ruiz, C., Shotter, A.C., Soic, N. and Tudisco, S.; Europhys. Lett. 64(2003) 309.
8. Signorini, C., Edifizi, A., Mazzocco, M.,Lunardon, M., Fabris, D., Vitturi, A., Scopel., P.,Soramel, F., Stroe, L., Prete, G., Fioretto, E.,Cinausero, M. and Trotta, M., Brondi, A., Moro,R., Rana, G. La, Vardaci, E., Ordine, A., Inglima,G., Commara, M. La, Pierroutsakou, D., Romoli,M., Sandoli, M., Diaz-Torres, A., Thompson, I. J.and Liu, Z. H.; Phys. Rev. C 67 (2003) 044607.
9. Castaneda, , C. M., Smith Jr., H. A., Singh, P. P.,Jastrzebski, J., Karwowski, H., Gaigalas, A. K.;Phys. Lett. B 77 (1978) 371.
10. Utsunomiya, H., Kubono, S., Tanaka, M. H.,Sugitani, M., Morita, K., Nomura, T. andHamajima, Y.; Phys. Rev. C 28 (1983) 1975.
11. Chattopadhyay, D., Santra, S., Pal, A., Kundu,A.,Ramachandran, K., Tripathi,,R., Sarkar, D.,Sodaye, S., Nayak, B. K., Saxena, A. and Kailas,S.; Phys. Rev. C 94, 061602(R) (2016).
12. Chattopadhyay, D., Santra, S., Pal, A., Kundu,A., Ramachandran, K., Tripathi, R., Roy, B. J.,Nag, T. N., Sawant, Y., Nayak, B. K., Saxena,A., Kailas, S.; Phys. Rev. C 97, 051601(R)(2018).
13. Chattopadhyay, D., Santra, S., Pal, A., Kundu,A., Ramachandran, K., Tripathi, R., Roy, B. J.,Sawant, Y., Nayak, B. K., Saxena, A., Kailas, S.;Phys. Rev. C 98, 014609 (2018).
14. Parihari, A., Santra, S., Pal, A., Singh, N. L.,Mahata, K., Nayak, B. K., Tripathi, R.,Ramachandran, K., Rath, P. K., Chakrabarti, R.,and Kailas, S.; Phys. Rev. C, 90, 014603 (2014).
15. Pal, A., Santra, S., Chattopadhyay, D., Kundu,A., Ramachandran, K., Tripathi, R., Roy, B. J.,Nag, T. N., Sawant, Y., Sarkar, D., Nayak, B. K.,Saxena, A., and Kailas, S.; Phys. Rev. C 96,024603 (2017).
16. Kundu, A., Santra, S., Pal, A., Chattopadhyay,D., Tripathi, R., Roy, B. J., Nag, T. N., Nayak, B.K., Saxena, A., and Kailas, S.; Phys. Rev. C 95,034615 (2017).
33
Technologies for Preservation of Fruits & Product Development
Dr. S. Gautam
Food Technology Division
Dr. S. Gautam is the recipient of the
Homi Bhabha Science & Technology Award for the year 2016
India is ranked second in production of fruits following China. In the year 2014-15 total production of fruits was around 87 million tons, which increased to around 91 million tons in 2015-16. India is the biggest producer of banana and mango and second largest producer of lime, in the world. Many of these fruits have been found to possess excellent functional and nutraceuticals potentials. As per FAO close to 40% of India’s fresh fruit produce is lost after harvest. Cold storage facilities are available for only 10% of India’s perishable produce. Food wastage too contributes to the significant wastage of man hours, fuel, electricity as well as fresh water used in irrigation.
Factors affecting post-harvest losses of perishables like fruits & vegetables Among the total agricultural produce wasted every year, nearly 2/3 comprises of fruits & vegetables. There are various factors those result in post-harvest losses of perishables like fruits & vegetables. Some of these are insufficient packaging & cold chain storage facilities; lack of backward-forward integration amongst farmers, researchers, marketing channel and consumers, lack of technological awareness and interventions, and a large number of intermediates involved in food supply chain. Humidity and temperature control as well as level of hygiene during storage, transportation and marketing are key factors to reduce post-harvest losses. There is also limit of maximum storage period of such produce because they undergo senescence during storage which further invites
microbial contaminations leading to spoilage. Therefore such produce should be property sorted during storage and sold at retail level before its qualities start deteriorating. Besides, manual processing should be reduced to the best possible level and automation should be promoted. Farmers need to be trained regarding all these critical issues and they need to follow the guidelines for the best output. Shelf life extension of litchi Litchi is a delicious fruit and is rich source of health promoting phytochemicals such as phenols, flavonoids and Vitamin C. It is an exotic; non-climacteric (ripens on tree itself) fruit of South East Asian origin. India is the second largest producer of litchi after China, involving an area of around 62000 ha and a total annual production of around 0.5 million tones. In India, states of Bihar, Bengal, Jharkhand, Tripura, Uttarakhand, Assam and Punjab dominate in litchi production. Litchi is also being grown in subtropical Asia, Israel, USA, Mexico, Australia, and South-Africa. Most litchi fruits produced in Asia are marketed locally, with some regional exports to other Asian and gulf countries, and some parts of Europe. Besides the fact that India accounts for about one-fifth (around 22%) of the global production, it manages to export merely 1% of its total production. The major quality issues affecting litchi trade are pericarp (peel) browning and fruit deterioration that culminate cumulatively into significant economic loss. Once plucked harvested litchi fruits quickly lose their pinkish-red
34
colour and become brown resulting in an unmarketable appearance with a shelf life of less than 72 h at ambient temperature. Rotting and decay due to microbial spoilage is another major postharvest problem of litchi fruit. Postharvest losses of litchi are estimated to be 20–30% of the harvested fruit and can reach as high as 50%. Process development To address this concern, a technology was developed at BARC by which processed litchi can be preserved up to 45-60 days at low temperature (4±2C), and controlled relative humidity (55-60%) while retaining its nutritional, sensory, functional and colour qualities. This treatment is essentially based on mild rinsing of plucked litchi fruits using three solutions containing GRAS (Generally Recognized As Safe) food preservatives, which help in retaining these quality attributes. Principle of the process This dip treatment methodology is helpful in overcoming the peel browning problem. The enzyme that is known to catalyze the browning reaction in pericarp that is polyphenol oxidase (PPO) has been found to be reduced by 85% by dip processing. Besides, the treatment is also helpful in significantly retaining the major colour pigments (anthocyanins) such as cyanidin-3-O-rutinoside and cyanidin-3-O-glucoside by 82% and 97%, respectively. Further, the microbial spoilage is also prevented due to reduction in microbial load to below detectable level in processed fruits. Shelf life of processed litchi fruits when stored at 4-6°C and 55-60% RH could be extended up to 45-60 days, whereas, unprocessed fruits get spoiled within 15 days under similar storage condition. Interestingly, no significant ingress of the dip chemicals in the fruit pulp has been noticed. Besides, residual sulfur and chlorine contents have also been found to be negligible. Processed fruits retained the acceptable nutritional and sensory qualities during storage. Safety of the process Litchi fruit treatment process involves three sequential dip processes, which has approval of the
competent institutions. The first treatment has been approved by the Directorate of Plant Protection, Quarantine & Storage, Department of Agriculture & Cooperation, Ministry of Agriculture, Government of India [National Standards for Phytosanitary Measures (NSPM-15), May 2005] and rest two combination surface wash treatments, which involves three different chemicals have been approved as additive by the Food Safety and Standards Authority of India (FSSAI) as per the Gazette notification of regulations titled “Food Safety and Standards (Food Products Standards and Food Additives) Seventh Amendment Regulations, 2016 dated 5th September, 2016. Technology demonstration & automation Technology was successfully demonstrated to farmers and entrepreneurs at Bordi, Dahanu, Maharashtra in 2012 and also at National Research Centre on Litchi (NRCL), Mushahri, Muzaffarpur, Bihar in 2016. At NRCL besides the farmers academia and press were also present during technology demonstration. For implementing litchi technology automation, a prototype machine of throughput 10 kg/h was designed and got developed through a manufacturer primarily for technology demonstration. The facility is currently located at Food Technology Division, BARC. Commercial deployment For further large scale deployment of litchi technology BARC-DAE and National Research Centre on Litchi (NRCL)-ICAR mutually agreed to set up a high throughput machine of 1 ton/ hr capacity for treatment of litchi fruits at NRCL, Muzaffurpur, Bihar for litchi fruit preservation. MoU was signed on 26th October, 2016 between BARC-DAE and NRCL-ICAR and the plant was subsequently successfully commissioned. Litchi was also processed at BARC and successful market trial was completed at Mumbai markets. So far BARC litchi technology has been transferred to thirteen firms/ institutions including an international firm. This includes a MoU with Government of Bihar for large scale deployment of BARC litchi technology.
35
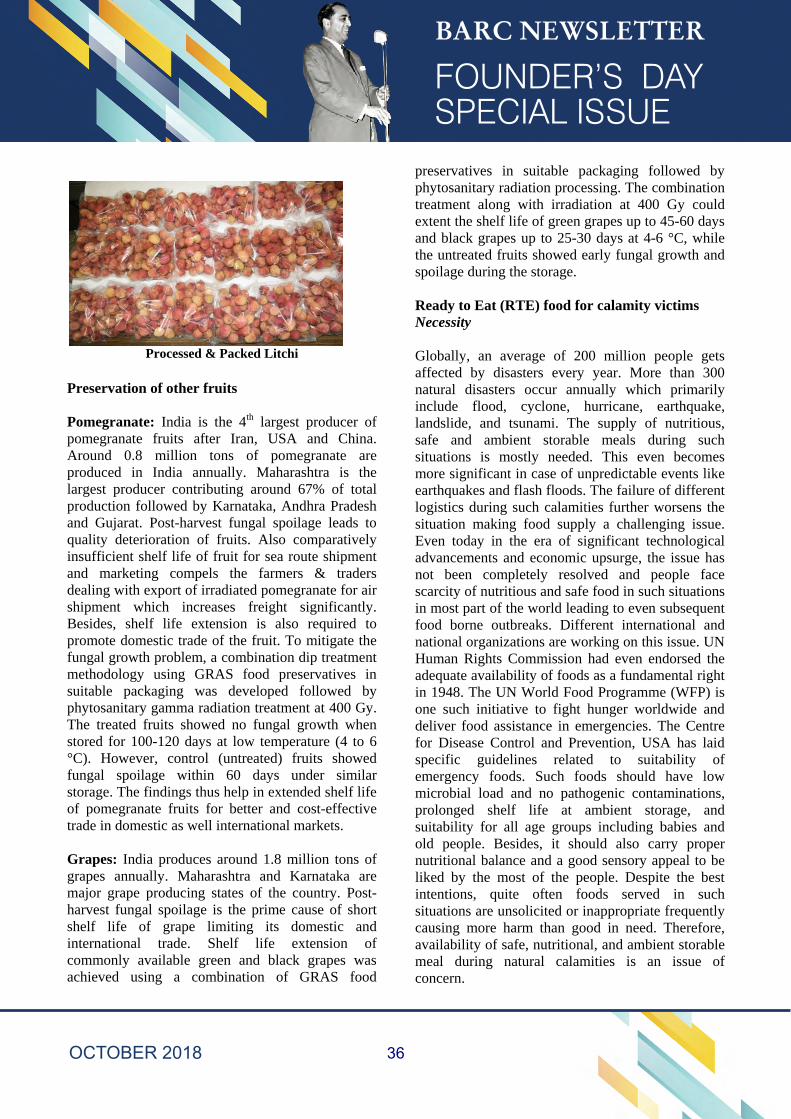
Processed & Packed Litchi
Preservation of other fruits Pomegranate: India is the 4th largest producer of pomegranate fruits after Iran, USA and China. Around 0.8 million tons of pomegranate are produced in India annually. Maharashtra is the largest producer contributing around 67% of total production followed by Karnataka, Andhra Pradesh and Gujarat. Post-harvest fungal spoilage leads to quality deterioration of fruits. Also comparatively insufficient shelf life of fruit for sea route shipment and marketing compels the farmers & traders dealing with export of irradiated pomegranate for air shipment which increases freight significantly. Besides, shelf life extension is also required to promote domestic trade of the fruit. To mitigate the fungal growth problem, a combination dip treatment methodology using GRAS food preservatives in suitable packaging was developed followed by phytosanitary gamma radiation treatment at 400 Gy. The treated fruits showed no fungal growth when stored for 100-120 days at low temperature (4 to 6 °C). However, control (untreated) fruits showed fungal spoilage within 60 days under similar storage. The findings thus help in extended shelf life of pomegranate fruits for better and cost-effective trade in domestic as well international markets. Grapes: India produces around 1.8 million tons of grapes annually. Maharashtra and Karnataka are major grape producing states of the country. Post-harvest fungal spoilage is the prime cause of short shelf life of grape limiting its domestic and international trade. Shelf life extension of commonly available green and black grapes was achieved using a combination of GRAS food
preservatives in suitable packaging followed by phytosanitary radiation processing. The combination treatment along with irradiation at 400 Gy could extent the shelf life of green grapes up to 45-60 days and black grapes up to 25-30 days at 4-6 °C, while the untreated fruits showed early fungal growth and spoilage during the storage. Ready to Eat (RTE) food for calamity victims Necessity Globally, an average of 200 million people gets affected by disasters every year. More than 300 natural disasters occur annually which primarily include flood, cyclone, hurricane, earthquake, landslide, and tsunami. The supply of nutritious, safe and ambient storable meals during such situations is mostly needed. This even becomes more significant in case of unpredictable events like earthquakes and flash floods. The failure of different logistics during such calamities further worsens the situation making food supply a challenging issue. Even today in the era of significant technological advancements and economic upsurge, the issue has not been completely resolved and people face scarcity of nutritious and safe food in such situations in most part of the world leading to even subsequent food borne outbreaks. Different international and national organizations are working on this issue. UN Human Rights Commission had even endorsed the adequate availability of foods as a fundamental right in 1948. The UN World Food Programme (WFP) is one such initiative to fight hunger worldwide and deliver food assistance in emergencies. The Centre for Disease Control and Prevention, USA has laid specific guidelines related to suitability of emergency foods. Such foods should have low microbial load and no pathogenic contaminations, prolonged shelf life at ambient storage, and suitability for all age groups including babies and old people. Besides, it should also carry proper nutritional balance and a good sensory appeal to be liked by the most of the people. Despite the best intentions, quite often foods served in such situations are unsolicited or inappropriate frequently causing more harm than good in need. Therefore, availability of safe, nutritional, and ambient storable meal during natural calamities is an issue of concern.
36
RTE food A product called Stuffed Baked Food (SBF) consisting of dough prepared from multigrain (predominantly wheat) flour using controlled yeast fermentation, and stuffing with roasted dehusked chick pea flour with blend of spices and salt was developed. The stuffed lobe was convection baked, vacuum packaged in LDPE and gamma irradiated at 15 kGy. The product had shelf life of 8 months at ambient storage while retaining the quality attributes. SBF does not require refrigeration storage and cooking prior to consumption. The microbial load was found to be below detection level. Nutritional quality was found to be adequate and antioxidant capacity was retained. The SBF can also be very useful for other target groups like defense personals located at remote places, school lunch program, expeditions and astronauts. Safety study Wholesomeness and safety of the radiation technology was endorsed by international organizations and statutory bodies such as World Health Organization, Food & Agricultural Organization, International Atomic Energy Agency, the Codex Alimentarius Commission, World Trade Organization, United States Department of Agriculture, Food Standards Australia & New Zealand, and Food Safety and Standards Authority of India (FSSAI). Still many people have reservations and apprehensions in adopting this technology mostly due to fear of its impact on genetic material and therefore future generations. The issue was addressed and found that even after exclusive use of various irradiated foods (at different doses) including SBF to bacteria grown up to 3000 generations, no change in its genetic material was noticed. Further long-term exposure studies in human lymphoblast TK6 (thymidine kinase) cell line by sub-culturing up to 150 generations followed by mutation analysis, did not exhibit any induced mutation when analyzed at regular time intervals through comprehensive molecular approaches such as comet assay,
micronucleus assay, restriction digestion, RAPD analysis as well as DNA sequencing. The findings thus endorsed the genotoxic safety of the radiation treated foods, and therefore should be able to generate confidence in consumers, entrepreneurs, and researchers in this promising and upcoming technology having potential of greater socioeconomic implications. Safety studies pertaining to radiation treated foods had been done primarily by US army in early sixties also, but advanced molecular tools were not developed in those days to address the concern in much depth. Technology transfer SBF technology has been so far transferred to two private firms for commercial deployment. The product has also been evaluated and liked by various NDRF (National Disaster Response Force) units. Conclusion Although India is one of the important fruit and vegetable producing countries in the world, due to various reasons as mentioned above, the huge production is not contributing to the socio-economic state of the farmers primarily due to significant post-harvest losses. There is the utmost need of technological developments and their scale-up at commercial level which can help in ensuring better post-harvest preservation of such commodities either in raw or processed form. Besides, there is also need to deploy radiation treated foods at domestic level to serve various purposes. Primarily it can be promoted as need based and subsequently confidence build –up among the stakeholders including consumers would eventually lead to its large scale deployment for the benefits of the society. Acknowledgements The consistent help and support from members of Food Science & Safety Section, Food Technology Division, BARC is duly acknowledged.
37
Bibliography 1. Evaluating critical casual factors for post-
harvest losses (PHL) in the fruit and vegetables supply chain in India using the DEMATEL approach. Gardas, B. B., Raut R. K., and Narkhede, B. J. Cleaner Production, 2018, 199: 47-61.
2. Food Processing by Irradiation—–An effective technology for food safety and security. Gautam, S., and Tripathi J. Ind. J. Experiment. Biol., 2016, 54: 700-707.
3. Fruits and Vegetables as Dietary Sources of Antimutagens. Gautam, S., Saxena S., and Kumar S. J Food Chem Nanotechnol, 2016, 2(3): 96- 113.
4. Development of Ambient Storable Meal for Calamity Victims and Other Targets Employing Radiation Processing and Evaluation of its Nutritional, Organoleptic, and Safety Parameters. Kumar, S., Saxena, S., Verma J., and Gautam S. LWT - Food Science and Technology, 2016, 69:409-416.
5. Inhibition of pericarp browning and shelf life extension of litchi by combination dip treatment and radiation processing. Kumar S., Mishra B.B., Saxena S., Bandyopadhyay N., More V., Wadhawan S., Hajare S. N., Gautam S., and Sharma A. Food Chemistry, 2012, 131, 1223-1232.
6. Browning of litchi fruit pericarp: Role of
polyphenol oxidase, peroxidae, phenylalanine ammonia lyase, and effect of gamma radiation. Mishra B. B., Kumar S., Wadhawan S., Hajare S. N., Saxena S., More V., Gautam S., and Sharma A. Journal of Food Biochemistry, 2012, 36(5): 604-12.
7. Antioxidant and radioprotective properties of commercially grown litchi (Litchi chinensis) from India. Saxena S., Hajare S. N., More V., Kumar S., Wadhawan S., Mishra B. B. Parte M.N., Gautam S., and Sharma A. Food Chemistry, 2011, 126, 39–45.
8. Radiation processing of litchi for meeting phytosanitory requirements. Gautam, S., Saxena, S., Kumar, S., Hajare, S. N., Wadhawan, S., More, V. S., Mishra, B. B., Parte, M.N., and Sharma A. In: Thematic volume from the proceedings of International Conference on Peaceful Uses of Atomic Energy- 2009, New Delhi, Eds. D’Souza, S. F., and Sharma, A. 2011,135-142.
9. Quality profile of litchi (Litchi chinensis) cultivars from India and effect of radiation processing. Hajare, S N., Saxena S, Kumar S, Wadhawan S, More V, Mishra B B, Parte M N, Gautam S, and Sharma Radiation Physics and Chemistry, 2010, 79, 994–1004.
38
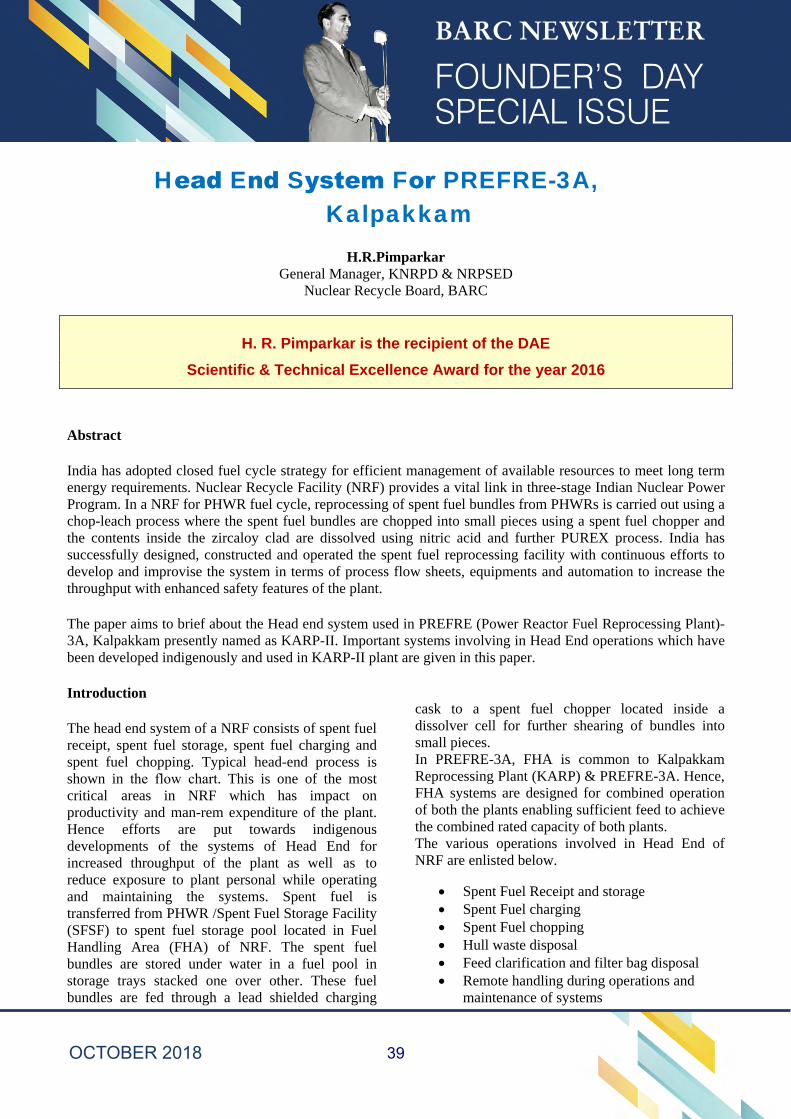
Head End System For PREFRE-3A, Kalpakkam
H.R.Pimparkar General Manager, KNRPD & NRPSED
Nuclear Recycle Board, BARC
H. R. Pimparkar is the recipient of the DAE
Scientific & Technical Excellence Award for the year 2016
Abstract
India has adopted closed fuel cycle strategy for efficient management of available resources to meet long term energy requirements. Nuclear Recycle Facility (NRF) provides a vital link in three-stage Indian Nuclear Power Program. In a NRF for PHWR fuel cycle, reprocessing of spent fuel bundles from PHWRs is carried out using a chop-leach process where the spent fuel bundles are chopped into small pieces using a spent fuel chopper and the contents inside the zircaloy clad are dissolved using nitric acid and further PUREX process. India has successfully designed, constructed and operated the spent fuel reprocessing facility with continuous efforts to develop and improvise the system in terms of process flow sheets, equipments and automation to increase the throughput with enhanced safety features of the plant.
The paper aims to brief about the Head end system used in PREFRE (Power Reactor Fuel Reprocessing Plant)-3A, Kalpakkam presently named as KARP-II. Important systems involving in Head End operations which have been developed indigenously and used in KARP-II plant are given in this paper.
Introduction
The head end system of a NRF consists of spent fuel receipt, spent fuel storage, spent fuel charging and spent fuel chopping. Typical head-end process is shown in the flow chart. This is one of the most critical areas in NRF which has impact on productivity and man-rem expenditure of the plant. Hence efforts are put towards indigenous developments of the systems of Head End for increased throughput of the plant as well as to reduce exposure to plant personal while operating and maintaining the systems. Spent fuel is transferred from PHWR /Spent Fuel Storage Facility (SFSF) to spent fuel storage pool located in Fuel Handling Area (FHA) of NRF. The spent fuel bundles are stored under water in a fuel pool in storage trays stacked one over other. These fuel bundles are fed through a lead shielded charging
cask to a spent fuel chopper located inside a dissolver cell for further shearing of bundles into small pieces. In PREFRE-3A, FHA is common to Kalpakkam Reprocessing Plant (KARP) & PREFRE-3A. Hence, FHA systems are designed for combined operation of both the plants enabling sufficient feed to achieve the combined rated capacity of both plants. The various operations involved in Head End of NRF are enlisted below.
Spent Fuel Receipt and storage Spent Fuel charging Spent Fuel chopping Hull waste disposal Feed clarification and filter bag disposal Remote handling during operations and
maintenance of systems
39

Pool Bridge for Spent Fuel Receipt and storage
Activities involved in Spent fuel receipt and storage operations are common for both KARP and PREFRE-3A. These activities are:
a. Handling of shipping cask using FHA EOT crane,
b. Handling of fuel bundle storage cage using FHA EOT crane,
c. Handling of fuel bundle trays for its storage in pool using tray handling tool and pool bridge hoist.
For fuel receipt and its storage, the existing equipments / system of KARP such as Shipping Cask, its handling yoke, FHA EOT crane, fuel pool etc are being used to cater PREFRE-3A requirements. A new pool bridge is designed and implemented to take care of additional handling of spent fuel trays and spent fuel bundles for loading of Charging cask for KARP and PREFRE-3A.
The pool bridge is used to cater the services required for underwater handling of spent fuel bundles in storage pool. It is used for removal of fuel trays
from cage and their storage in fuel pool, loading of empty trays to cage, loading of fuel bundles to charging cask, etc. In order to cater to these operations, pool bridge is equipped with tools for fuel tray handling, individual fuel bundle handling tongs and multiple tong system (ten tong system) for handling more than one bundle at a time.
Pool bridge has its own drive mechanism with electric motor, gear box with rack and pinion arrangement for precise control of Long Travel (LT) motion. Safety interlocks have been provided to avoid unintended operational requirements. The tongs for handling spent fuel bundle has gravity fail safe design to cater the failure of compressed air supply for its actuation.
For combined operational requirement of PREFRE-3A and KARP, pool bridge has special design features like ten tong system on both the sides of pool bridge with optimum reaches, adjustable positioning of the ten tong system, load cell with comparator to detect the imbalance/ skew of the ten tong system avoiding damage to the fuel bundles, etc. Implementation of New pool bridge has resulted in increased throughput for head end operations.
40
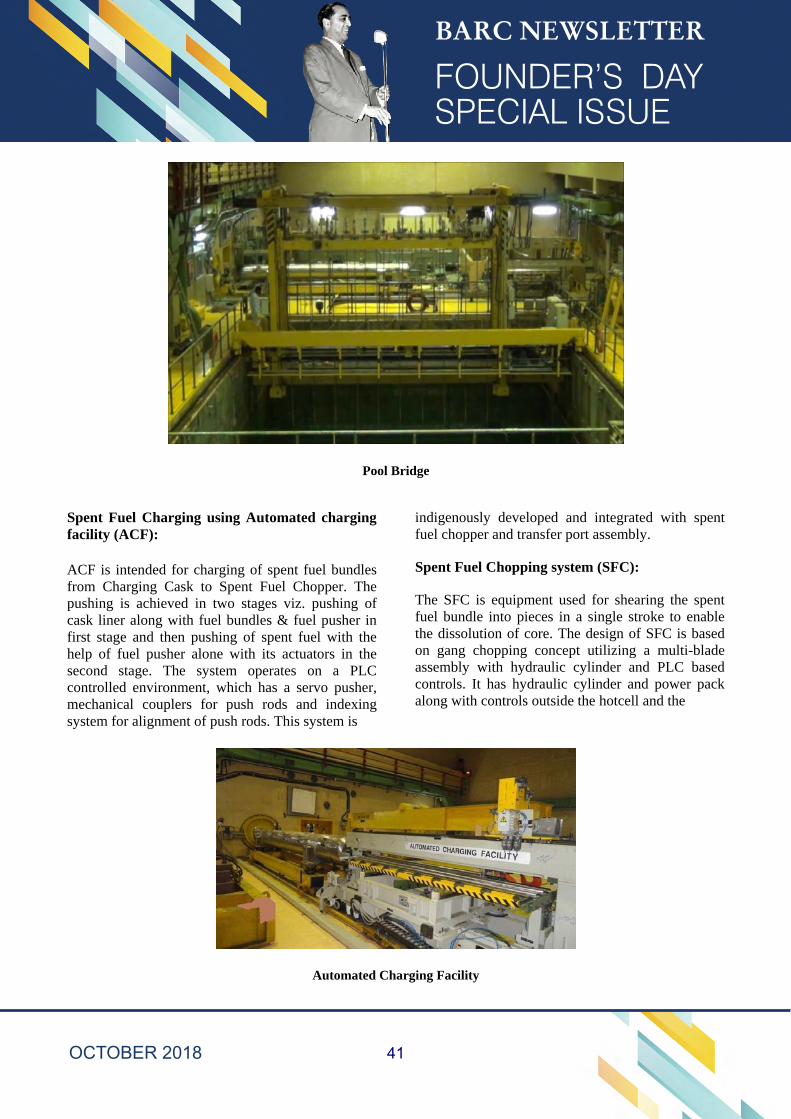
Pool Bridge
Spent Fuel Charging using Automated charging facility (ACF):
ACF is intended for charging of spent fuel bundles from Charging Cask to Spent Fuel Chopper. The pushing is achieved in two stages viz. pushing of cask liner along with fuel bundles & fuel pusher in first stage and then pushing of spent fuel with the help of fuel pusher alone with its actuators in the second stage. The system operates on a PLC controlled environment, which has a servo pusher, mechanical couplers for push rods and indexing system for alignment of push rods. This system is
indigenously developed and integrated with spent fuel chopper and transfer port assembly.
Spent Fuel Chopping system (SFC):
The SFC is equipment used for shearing the spent fuel bundle into pieces in a single stroke to enable the dissolution of core. The design of SFC is based on gang chopping concept utilizing a multi-blade assembly with hydraulic cylinder and PLC based controls. It has hydraulic cylinder and power pack along with controls outside the hotcell and the
Automated Charging Facility
41
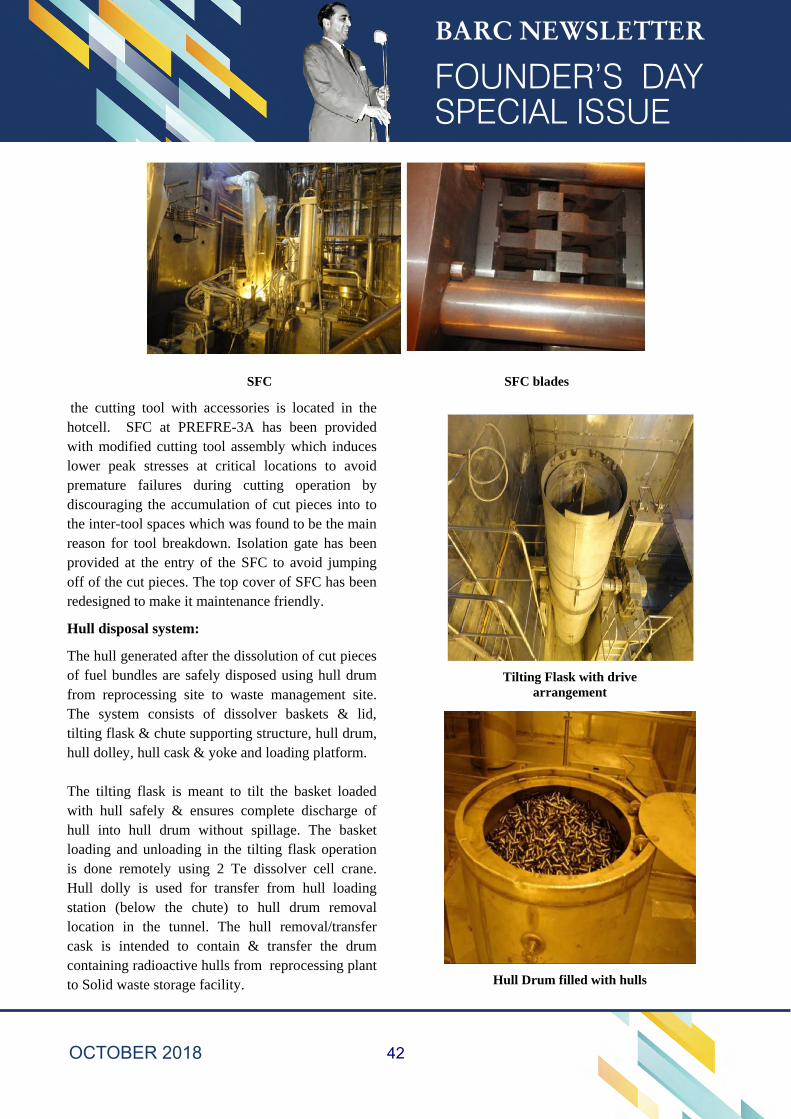
SFC SFC blades
the cutting tool with accessories is located in the hotcell. SFC at PREFRE-3A has been provided with modified cutting tool assembly which induces lower peak stresses at critical locations to avoid premature failures during cutting operation by discouraging the accumulation of cut pieces into to the inter-tool spaces which was found to be the main reason for tool breakdown. Isolation gate has been provided at the entry of the SFC to avoid jumping off of the cut pieces. The top cover of SFC has been redesigned to make it maintenance friendly.
Hull disposal system:
The hull generated after the dissolution of cut pieces of fuel bundles are safely disposed using hull drum from reprocessing site to waste management site. The system consists of dissolver baskets & lid, tilting flask & chute supporting structure, hull drum, hull dolley, hull cask & yoke and loading platform.
The tilting flask is meant to tilt the basket loaded with hull safely & ensures complete discharge of hull into hull drum without spillage. The basket loading and unloading in the tilting flask operation is done remotely using 2 Te dissolver cell crane. Hull dolly is used for transfer from hull loading station (below the chute) to hull drum removal location in the tunnel. The hull removal/transfer cask is intended to contain & transfer the drum containing radioactive hulls from reprocessing plant to Solid waste storage facility.
Tilting Flask with drive arrangement
Hull Drum filled with hulls
42
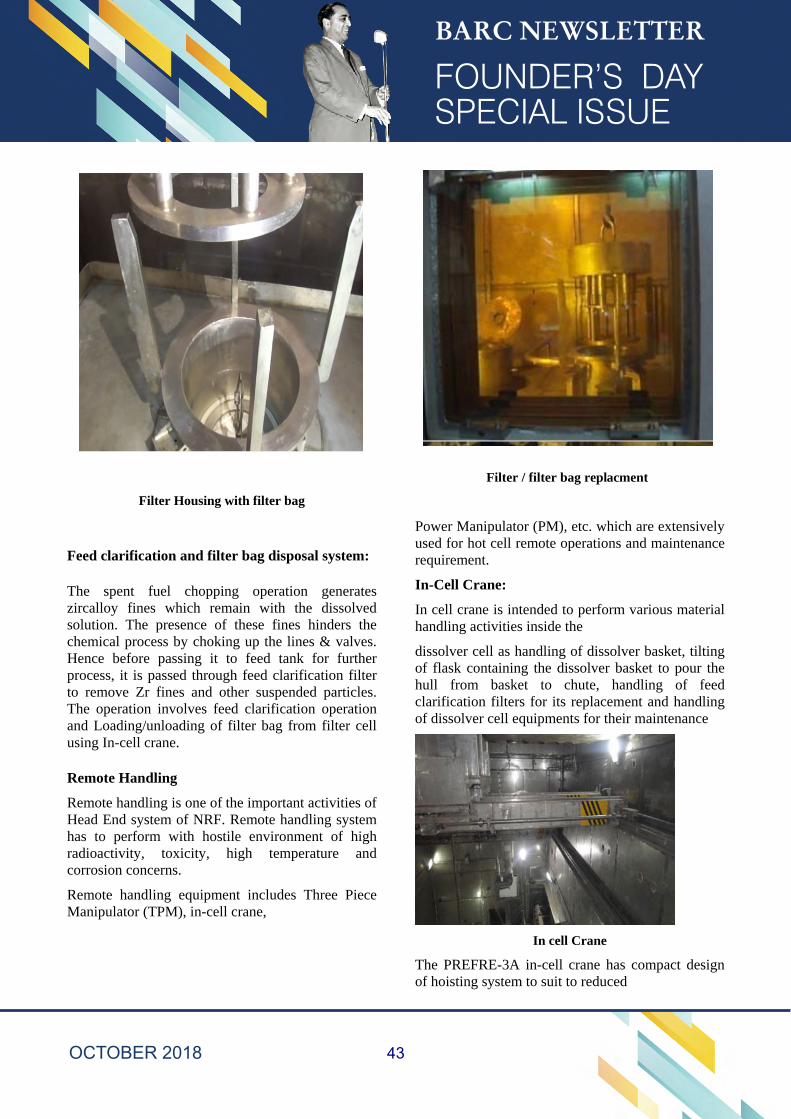
Filter / filter bag replacment
Filter Housing with filter bag
Feed clarification and filter bag disposal system:
The spent fuel chopping operation generates zircalloy fines which remain with the dissolved solution. The presence of these fines hinders the chemical process by choking up the lines & valves. Hence before passing it to feed tank for further process, it is passed through feed clarification filter to remove Zr fines and other suspended particles. The operation involves feed clarification operation and Loading/unloading of filter bag from filter cell using In-cell crane.
Remote Handling
Remote handling is one of the important activities of Head End system of NRF. Remote handling system has to perform with hostile environment of high radioactivity, toxicity, high temperature and corrosion concerns.
Remote handling equipment includes Three Piece Manipulator (TPM), in-cell crane,
Power Manipulator (PM), etc. which are extensively used for hot cell remote operations and maintenance requirement.
In-Cell Crane:
In cell crane is intended to perform various material handling activities inside the
dissolver cell as handling of dissolver basket, tilting of flask containing the dissolver basket to pour the hull from basket to chute, handling of feed clarification filters for its replacement and handling of dissolver cell equipments for their maintenance
In cell Crane
The PREFRE-3A in-cell crane has compact design of hoisting system to suit to reduced
43
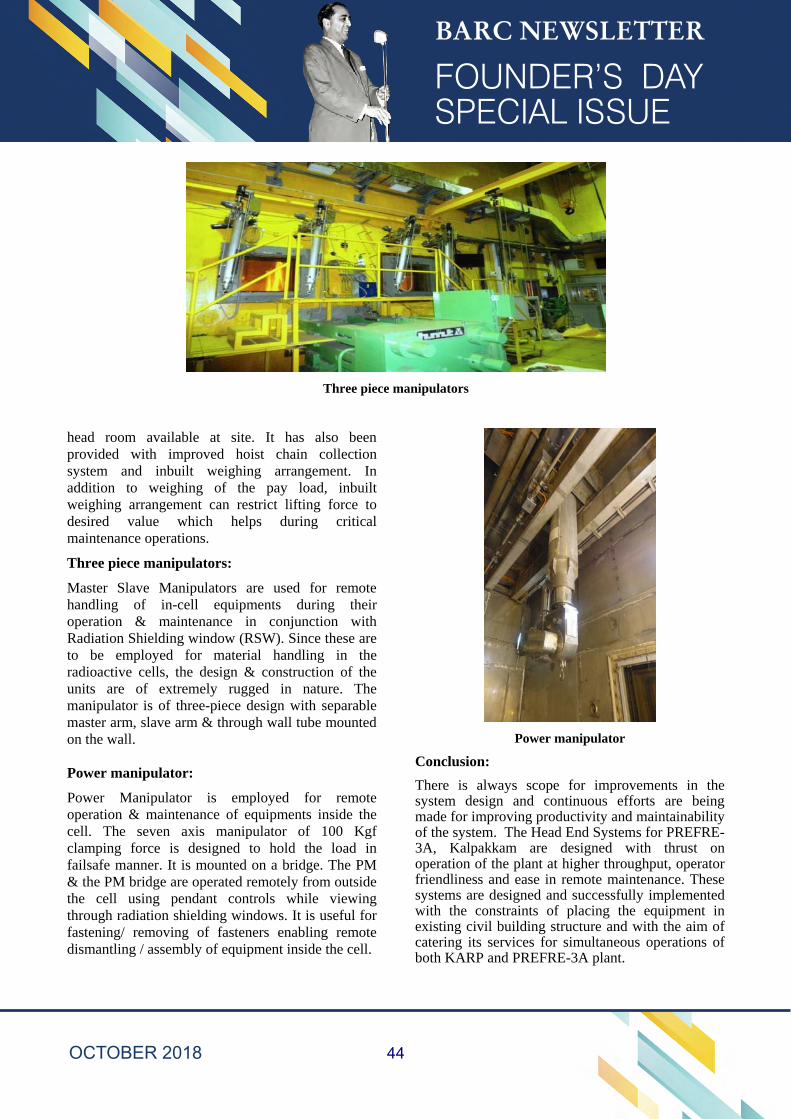
Three piece manipulators
head room available at site. It has also been provided with improved hoist chain collection system and inbuilt weighing arrangement. In addition to weighing of the pay load, inbuilt weighing arrangement can restrict lifting force to desired value which helps during critical maintenance operations.
Three piece manipulators:
Master Slave Manipulators are used for remote handling of in-cell equipments during their operation & maintenance in conjunction with Radiation Shielding window (RSW). Since these are to be employed for material handling in the radioactive cells, the design & construction of the units are of extremely rugged in nature. The manipulator is of three-piece design with separable master arm, slave arm & through wall tube mounted on the wall.
Power manipulator:
Power Manipulator is employed for remote operation & maintenance of equipments inside the cell. The seven axis manipulator of 100 Kgf clamping force is designed to hold the load in failsafe manner. It is mounted on a bridge. The PM & the PM bridge are operated remotely from outside the cell using pendant controls while viewing through radiation shielding windows. It is useful for fastening/ removing of fasteners enabling remote dismantling / assembly of equipment inside the cell.
Power manipulator
Conclusion:
There is always scope for improvements in the system design and continuous efforts are being made for improving productivity and maintainability of the system. The Head End Systems for PREFRE-3A, Kalpakkam are designed with thrust on operation of the plant at higher throughput, operator friendliness and ease in remote maintenance. These systems are designed and successfully implemented with the constraints of placing the equipment in existing civil building structure and with the aim of catering its services for simultaneous operations of both KARP and PREFRE-3A plant.
44
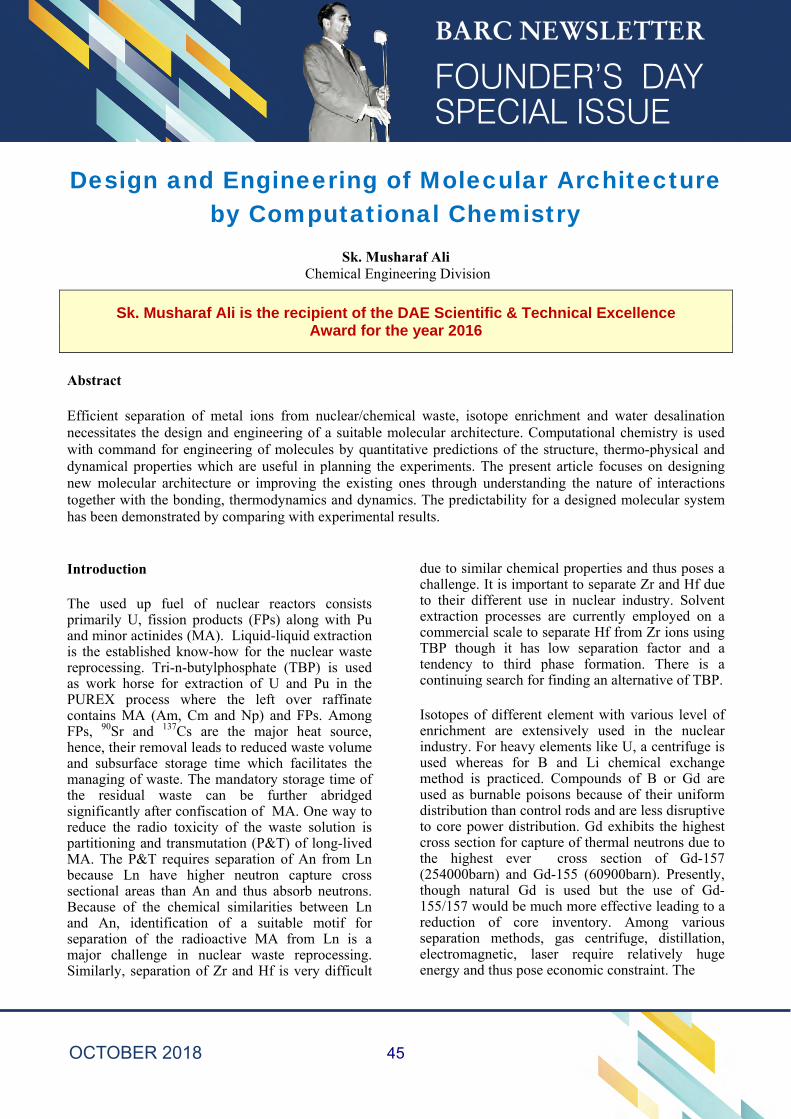
Design and Engineering of Molecular Architecture by Computational Chemistry
Sk. Musharaf Ali Chemical Engineering Division
Sk. Musharaf Ali is the recipient of the DAE Scientific & Technical Excellence Award for the year 2016
Abstract
Efficient separation of metal ions from nuclear/chemical waste, isotope enrichment and water desalination necessitates the design and engineering of a suitable molecular architecture. Computational chemistry is used with command for engineering of molecules by quantitative predictions of the structure, thermo-physical and dynamical properties which are useful in planning the experiments. The present article focuses on designing new molecular architecture or improving the existing ones through understanding the nature of interactions together with the bonding, thermodynamics and dynamics. The predictability for a designed molecular system has been demonstrated by comparing with experimental results.
Introduction
The used up fuel of nuclear reactors consists primarily U, fission products (FPs) along with Pu and minor actinides (MA). Liquid-liquid extraction is the established know-how for the nuclear waste reprocessing. Tri-n-butylphosphate (TBP) is used as work horse for extraction of U and Pu in the PUREX process where the left over raffinate contains MA (Am, Cm and Np) and FPs. Among FPs, 90Sr and 137Cs are the major heat source, hence, their removal leads to reduced waste volume and subsurface storage time which facilitates the managing of waste. The mandatory storage time of the residual waste can be further abridged significantly after confiscation of MA. One way to reduce the radio toxicity of the waste solution is partitioning and transmutation (P&T) of long-lived MA. The P&T requires separation of An from Ln because Ln have higher neutron capture cross sectional areas than An and thus absorb neutrons. Because of the chemical similarities between Ln and An, identification of a suitable motif for separation of the radioactive MA from Ln is a major challenge in nuclear waste reprocessing. Similarly, separation of Zr and Hf is very difficult
due to similar chemical properties and thus poses a challenge. It is important to separate Zr and Hf due to their different use in nuclear industry. Solvent extraction processes are currently employed on a commercial scale to separate Hf from Zr ions using TBP though it has low separation factor and a tendency to third phase formation. There is a continuing search for finding an alternative of TBP.
Isotopes of different element with various level of enrichment are extensively used in the nuclear industry. For heavy elements like U, a centrifuge is used whereas for B and Li chemical exchange method is practiced. Compounds of B or Gd are used as burnable poisons because of their uniform distribution than control rods and are less disruptive to core power distribution. Gd exhibits the highest cross section for capture of thermal neutrons due to the highest ever cross section of Gd-157 (254000barn) and Gd-155 (60900barn). Presently, though natural Gd is used but the use of Gd-155/157 would be much more effective leading to a reduction of core inventory. Among various separation methods, gas centrifuge, distillation, electromagnetic, laser require relatively huge energy and thus pose economic constraint. The
45
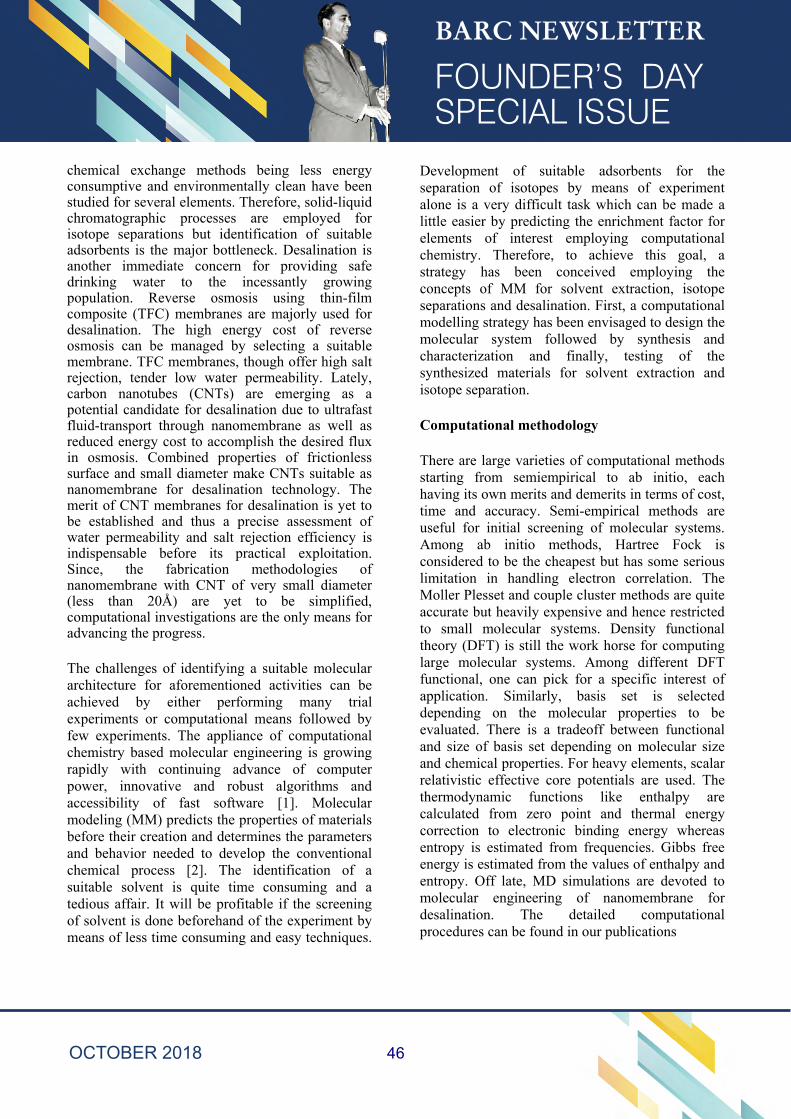
chemical exchange methods being less energy consumptive and environmentally clean have been studied for several elements. Therefore, solid-liquid chromatographic processes are employed for isotope separations but identification of suitable adsorbents is the major bottleneck. Desalination is another immediate concern for providing safe drinking water to the incessantly growing population. Reverse osmosis using thin-film composite (TFC) membranes are majorly used for desalination. The high energy cost of reverse osmosis can be managed by selecting a suitable membrane. TFC membranes, though offer high salt rejection, tender low water permeability. Lately, carbon nanotubes (CNTs) are emerging as a potential candidate for desalination due to ultrafast fluid-transport through nanomembrane as well as reduced energy cost to accomplish the desired flux in osmosis. Combined properties of frictionless surface and small diameter make CNTs suitable as nanomembrane for desalination technology. The merit of CNT membranes for desalination is yet to be established and thus a precise assessment of water permeability and salt rejection efficiency is indispensable before its practical exploitation. Since, the fabrication methodologies of nanomembrane with CNT of very small diameter (less than 20Å) are yet to be simplified, computational investigations are the only means for advancing the progress.
The challenges of identifying a suitable molecular architecture for aforementioned activities can be achieved by either performing many trial experiments or computational means followed by few experiments. The appliance of computational chemistry based molecular engineering is growing rapidly with continuing advance of computer power, innovative and robust algorithms and accessibility of fast software [1]. Molecular modeling (MM) predicts the properties of materials before their creation and determines the parameters and behavior needed to develop the conventional chemical process [2]. The identification of a suitable solvent is quite time consuming and a tedious affair. It will be profitable if the screening of solvent is done beforehand of the experiment by means of less time consuming and easy techniques.
Development of suitable adsorbents for the separation of isotopes by means of experiment alone is a very difficult task which can be made a little easier by predicting the enrichment factor for elements of interest employing computational chemistry. Therefore, to achieve this goal, a strategy has been conceived employing the concepts of MM for solvent extraction, isotope separations and desalination. First, a computational modelling strategy has been envisaged to design the molecular system followed by synthesis and characterization and finally, testing of the synthesized materials for solvent extraction and isotope separation.
Computational methodology
There are large varieties of computational methods starting from semiempirical to ab initio, each having its own merits and demerits in terms of cost, time and accuracy. Semi-empirical methods are useful for initial screening of molecular systems. Among ab initio methods, Hartree Fock is considered to be the cheapest but has some serious limitation in handling electron correlation. The Moller Plesset and couple cluster methods are quite accurate but heavily expensive and hence restricted to small molecular systems. Density functional theory (DFT) is still the work horse for computing large molecular systems. Among different DFT functional, one can pick for a specific interest of application. Similarly, basis set is selected depending on the molecular properties to be evaluated. There is a tradeoff between functional and size of basis set depending on molecular size and chemical properties. For heavy elements, scalar relativistic effective core potentials are used. The thermodynamic functions like enthalpy are calculated from zero point and thermal energy correction to electronic binding energy whereas entropy is estimated from frequencies. Gibbs free energy is estimated from the values of enthalpy and entropy. Off late, MD simulations are devoted to molecular engineering of nanomembrane for desalination. The detailed computational procedures can be found in our publications
46
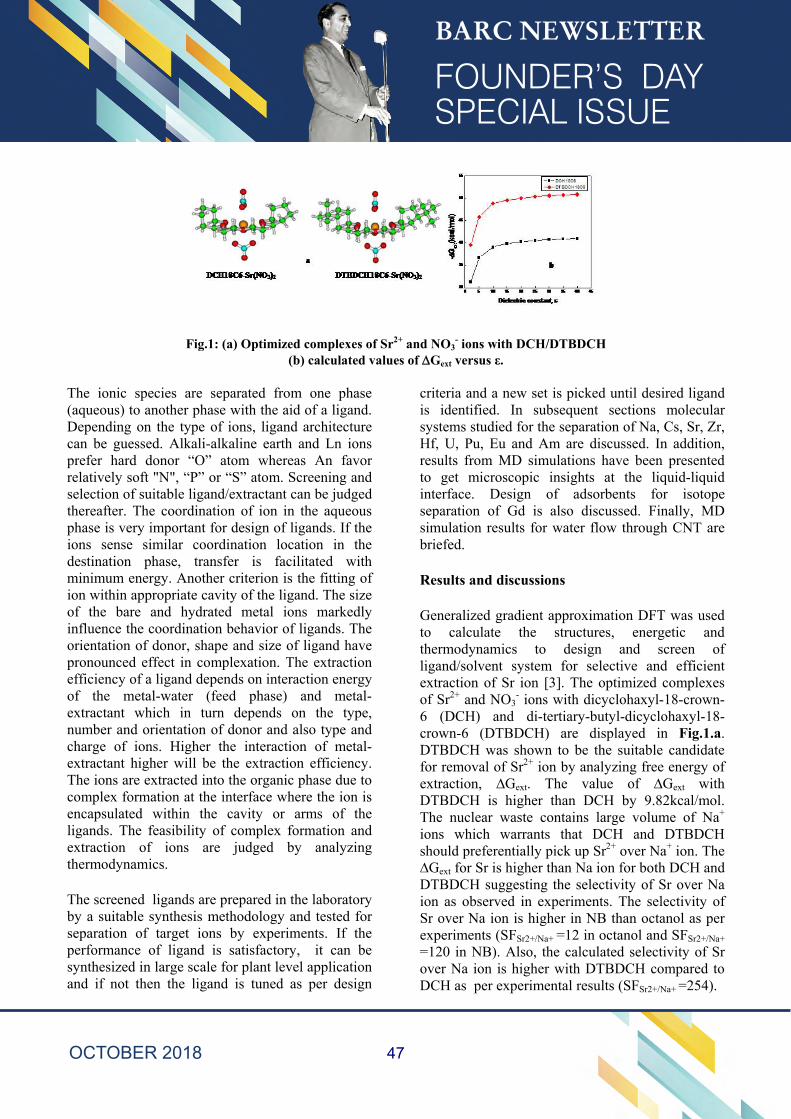
Fig.1: (a) Optimized complexes of Sr2+ and NO3- ions with DCH/DTBDCH
(b) calculated values of Gext versus ε.
The ionic species are separated from one phase (aqueous) to another phase with the aid of a ligand. Depending on the type of ions, ligand architecture can be guessed. Alkali-alkaline earth and Ln ions prefer hard donor “O” atom whereas An favor relatively soft "N", “P” or “S” atom. Screening and selection of suitable ligand/extractant can be judged thereafter. The coordination of ion in the aqueous phase is very important for design of ligands. If the ions sense similar coordination location in the destination phase, transfer is facilitated with minimum energy. Another criterion is the fitting of ion within appropriate cavity of the ligand. The size of the bare and hydrated metal ions markedly influence the coordination behavior of ligands. The orientation of donor, shape and size of ligand have pronounced effect in complexation. The extraction efficiency of a ligand depends on interaction energy of the metal-water (feed phase) and metal-extractant which in turn depends on the type, number and orientation of donor and also type and charge of ions. Higher the interaction of metal-extractant higher will be the extraction efficiency. The ions are extracted into the organic phase due to complex formation at the interface where the ion is encapsulated within the cavity or arms of the ligands. The feasibility of complex formation and extraction of ions are judged by analyzing thermodynamics.
The screened ligands are prepared in the laboratory by a suitable synthesis methodology and tested for separation of target ions by experiments. If the performance of ligand is satisfactory, it can be synthesized in large scale for plant level application and if not then the ligand is tuned as per design
criteria and a new set is picked until desired ligand is identified. In subsequent sections molecular systems studied for the separation of Na, Cs, Sr, Zr, Hf, U, Pu, Eu and Am are discussed. In addition, results from MD simulations have been presented to get microscopic insights at the liquid-liquid interface. Design of adsorbents for isotope separation of Gd is also discussed. Finally, MD simulation results for water flow through CNT are briefed.
Results and discussions
Generalized gradient approximation DFT was used to calculate the structures, energetic and thermodynamics to design and screen of ligand/solvent system for selective and efficient extraction of Sr ion [3]. The optimized complexes of Sr2+ and NO3
- ions with dicyclohaxyl-18-crown-6 (DCH) and di-tertiary-butyl-dicyclohaxyl-18-crown-6 (DTBDCH) are displayed in Fig.1.a. DTBDCH was shown to be the suitable candidate for removal of Sr2+ ion by analyzing free energy of extraction, ∆Gext. The value of ∆Gext with DTBDCH is higher than DCH by 9.82kcal/mol. The nuclear waste contains large volume of Na+ ions which warrants that DCH and DTBDCH should preferentially pick up Sr2+ over Na+ ion. The ∆Gext for Sr is higher than Na ion for both DCH and DTBDCH suggesting the selectivity of Sr over Na ion as observed in experiments. The selectivity of Sr over Na ion is higher in NB than octanol as per experiments (SFSr2+/Na+
=12 in octanol and SFSr2+/Na+
=120 in NB). Also, the calculated selectivity of Sr over Na ion is higher with DTBDCH compared to DCH as per experimental results (SFSr2+/Na+
=254).
47
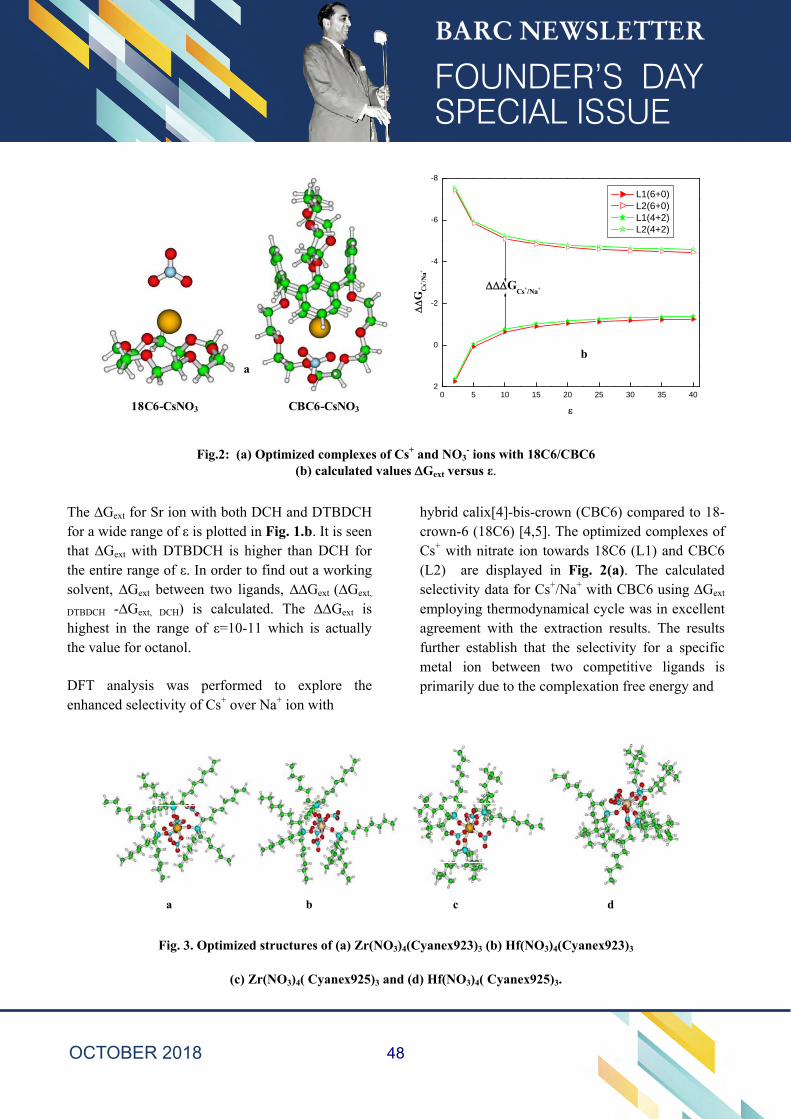
Fig.2: (a) Optimized complexes of Cs+ and NO3- ions with 18C6/CBC6
(b) calculated values Gext versus ε.
The ∆Gext for Sr ion with both DCH and DTBDCH for a wide range of ε is plotted in Fig. 1.b. It is seen that ∆Gext with DTBDCH is higher than DCH for the entire range of ε. In order to find out a working solvent, ∆Gext between two ligands, ∆∆Gext (∆Gext,
DTBDCH -∆Gext, DCH) is calculated. The ∆∆Gext is highest in the range of ε=10-11 which is actually the value for octanol.
DFT analysis was performed to explore the enhanced selectivity of Cs+ over Na+ ion with
hybrid calix[4]-bis-crown (CBC6) compared to 18-crown-6 (18C6) [4,5]. The optimized complexes of Cs+ with nitrate ion towards 18C6 (L1) and CBC6 (L2) are displayed in Fig. 2(a). The calculated selectivity data for Cs+/Na+ with CBC6 using ∆Gext employing thermodynamical cycle was in excellent agreement with the extraction results. The results further establish that the selectivity for a specific metal ion between two competitive ligands is primarily due to the complexation free energy and
Fig. 3. Optimized structures of (a) Zr(NO3)4(Cyanex923)3 (b) Hf(NO3)4(Cyanex923)3
(c) Zr(NO3)4( Cyanex925)3 and (d) Hf(NO3)4( Cyanex925)3.
0 5 10 15 20 25 30 35 402
0
-2
-4
-6
-8
GCs+/Na+
GC
s+ /Na+
L1(6+0) L2(6+0) L1(4+2) L2(4+2)
18C6-CsNO3 CBC6-CsNO3
ab
a b c d
48
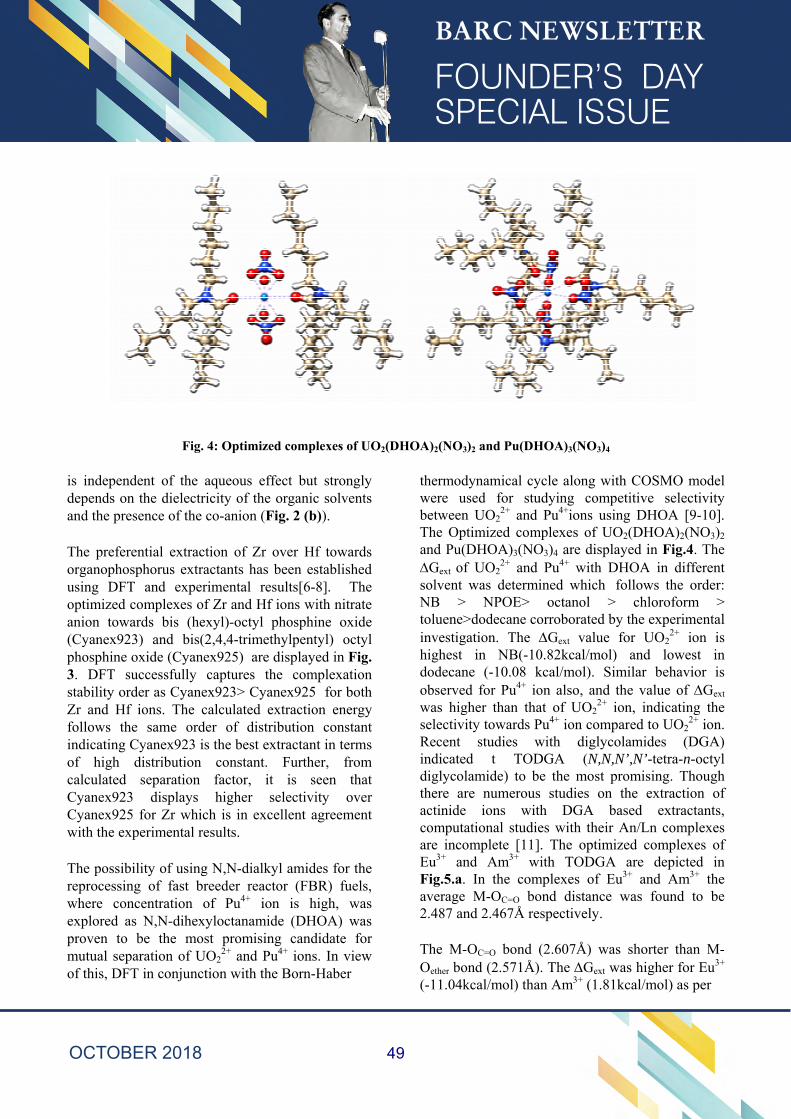
Fig. 4: Optimized complexes of UO2(DHOA)2(NO3)2 and Pu(DHOA)3(NO3)4
is independent of the aqueous effect but strongly depends on the dielectricity of the organic solvents and the presence of the co-anion (Fig. 2 (b)).
The preferential extraction of Zr over Hf towards organophosphorus extractants has been established using DFT and experimental results[6-8]. The optimized complexes of Zr and Hf ions with nitrate anion towards bis (hexyl)-octyl phosphine oxide (Cyanex923) and bis(2,4,4-trimethylpentyl) octyl phosphine oxide (Cyanex925) are displayed in Fig. 3. DFT successfully captures the complexation stability order as Cyanex923> Cyanex925 for both Zr and Hf ions. The calculated extraction energy follows the same order of distribution constant indicating Cyanex923 is the best extractant in terms of high distribution constant. Further, from calculated separation factor, it is seen that Cyanex923 displays higher selectivity over Cyanex925 for Zr which is in excellent agreement with the experimental results.
The possibility of using N,N-dialkyl amides for the reprocessing of fast breeder reactor (FBR) fuels, where concentration of Pu4+ ion is high, was explored as N,N-dihexyloctanamide (DHOA) was proven to be the most promising candidate for mutual separation of UO2
2+ and Pu4+ ions. In view of this, DFT in conjunction with the Born-Haber
thermodynamical cycle along with COSMO model were used for studying competitive selectivity between UO2
2+ and Pu4+ions using DHOA [9-10]. The Optimized complexes of UO2(DHOA)2(NO3)2 and Pu(DHOA)3(NO3)4 are displayed in Fig.4. The Gext of UO2
2+ and Pu4+ with DHOA in different solvent was determined which follows the order: NB > NPOE> octanol > chloroform > toluene>dodecane corroborated by the experimental investigation. The Gext value for UO2
2+ ion is highest in NB(-10.82kcal/mol) and lowest in dodecane (-10.08 kcal/mol). Similar behavior is observed for Pu4+ ion also, and the value of Gext was higher than that of UO2
2+ ion, indicating the selectivity towards Pu4+ ion compared to UO2
2+ ion. Recent studies with diglycolamides (DGA) indicated t TODGA (N,N,N’,N’-tetra-n-octyl diglycolamide) to be the most promising. Though there are numerous studies on the extraction of actinide ions with DGA based extractants, computational studies with their An/Ln complexes are incomplete [11]. The optimized complexes of Eu3+ and Am3+ with TODGA are depicted in Fig.5.a. In the complexes of Eu3+ and Am3+ the average M-OC=O bond distance was found to be 2.487 and 2.467Å respectively.
The M-OC=O bond (2.607Å) was shorter than M-Oether bond (2.571Å). The Gext was higher for Eu3+ (-11.04kcal/mol) than Am3+ (1.81kcal/mol) as per
49
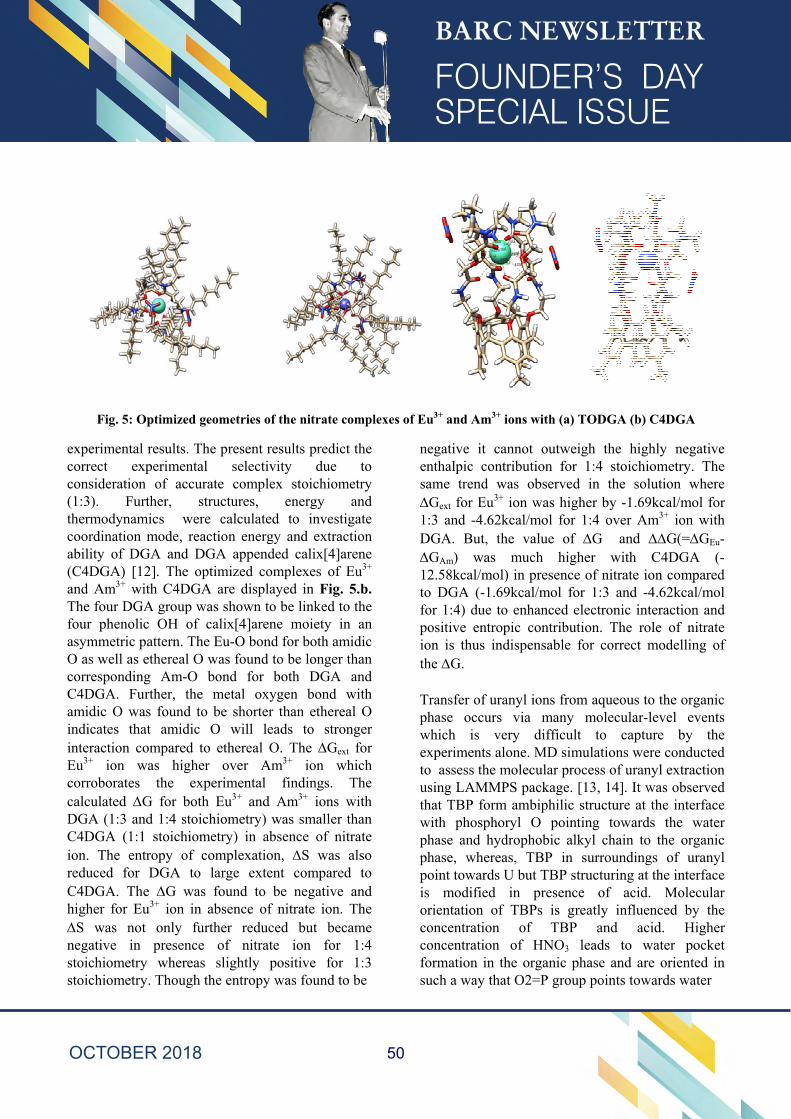
Fig. 5: Optimized geometries of the nitrate complexes of Eu3+ and Am3+ ions with (a) TODGA (b) C4DGA
experimental results. The present results predict the correct experimental selectivity due to consideration of accurate complex stoichiometry (1:3). Further, structures, energy and thermodynamics were calculated to investigate coordination mode, reaction energy and extraction ability of DGA and DGA appended calix[4]arene (C4DGA) [12]. The optimized complexes of Eu3+ and Am3+ with C4DGA are displayed in Fig. 5.b. The four DGA group was shown to be linked to the four phenolic OH of calix[4]arene moiety in an asymmetric pattern. The Eu-O bond for both amidic O as well as ethereal O was found to be longer than corresponding Am-O bond for both DGA and C4DGA. Further, the metal oxygen bond with amidic O was found to be shorter than ethereal O indicates that amidic O will leads to stronger interaction compared to ethereal O. The Gext for Eu3+ ion was higher over Am3+ ion which corroborates the experimental findings. The calculated G for both Eu3+ and Am3+ ions with DGA (1:3 and 1:4 stoichiometry) was smaller than C4DGA (1:1 stoichiometry) in absence of nitrate ion. The entropy of complexation, S was also reduced for DGA to large extent compared to C4DGA. The G was found to be negative and higher for Eu3+ ion in absence of nitrate ion. The S was not only further reduced but became negative in presence of nitrate ion for 1:4 stoichiometry whereas slightly positive for 1:3 stoichiometry. Though the entropy was found to be
negative it cannot outweigh the highly negative enthalpic contribution for 1:4 stoichiometry. The same trend was observed in the solution where Gext for Eu3+ ion was higher by -1.69kcal/mol for 1:3 and -4.62kcal/mol for 1:4 over Am3+ ion with DGA. But, the value of G and G(=GEu-GAm) was much higher with C4DGA (-12.58kcal/mol) in presence of nitrate ion compared to DGA (-1.69kcal/mol for 1:3 and -4.62kcal/mol for 1:4) due to enhanced electronic interaction and positive entropic contribution. The role of nitrate ion is thus indispensable for correct modelling of the G.
Transfer of uranyl ions from aqueous to the organic phase occurs via many molecular-level events which is very difficult to capture by the experiments alone. MD simulations were conducted to assess the molecular process of uranyl extraction using LAMMPS package. [13, 14]. It was observed that TBP form ambiphilic structure at the interface with phosphoryl O pointing towards the water phase and hydrophobic alkyl chain to the organic phase, whereas, TBP in surroundings of uranyl point towards U but TBP structuring at the interface is modified in presence of acid. Molecular orientation of TBPs is greatly influenced by the concentration of TBP and acid. Higher concentration of HNO3 leads to water pocket formation in the organic phase and are oriented in such a way that O2=P group points towards water
50
Fig. 6. Snapshot of uranyl complexation with TBPs and NO3
- species for neutral interface. UO22+ and
NO3- are denoted by yellow and blue color, whereas
red and green balls respectively represent the O(O=P) and P of TBP.
pool and alkyl chain to the organic phase resulting a micelle like structure of TBPs around water droplet. None of the TBPs are observed to migrate towards the water phase due to poor water solubility. Extraction of water is increased with increase in the concentration of TBP. The extracted uranyl complexes are found to be attached by 1-3 water molecules only, which indicates that water extraction to the organic phase is favored not only by uranyl extraction but also from TBPs exchange from the interface to the bulk organic phase. The percentage extraction of water is increased with HNO3 from 1M to 3M after that it remains nearly constant. In the case of neutral interface, extracted water form a micro emulsion with mixed TBP and water phase, known as the third phase. The first sphere coordination of uranyl ion depends on the interfacial conditions and their location with respect to the interface. From simulation trajectories, it was noticed that uranyl ions at the interface are not separated but form loose bound clusters, in which each uranyl ion is coordinated by NO3
-/TBP/H2O, some of which are shared by more than two uranyl ions (Fig. 6). The possible complexes of UO2
2+ with TBPs are: 1:1, 1: 2, 1:3, 1:4 and 1:5 adducts of UO2
2+:TBP.
Isotope effects are of quantum mechanical cause and hence QESC is the only means to comprehend the fractionation of isotope. DFT analysis was performed to design and screen the suitable functionalized resins for isotopic enrichment of Gd [15, 16]. The main input required for estimation of the separation factor (α) is vibrational frequency of hydrated Gd3+ ion and Gd3+-crown ether complex. The calculated IR spectrum of Gd3+ and crown ether are plotted in Fig. 7. The results show that the separation factor with DB18C6 is higher than B18C6 and DCH. The calculated separation factor for 152/160 pair for Gd3+-DCH (=1.0012) was in good agreement with experimental results (=1.002) which confirms the acceptability of present methods. In view of its comparatively higher , DB18C6 is considered to be the most promising for isotopic enrichment of Gd. But, to get considerable amount of enriched isotopes, crown ether should be grafted on solid matrix and then separation can be carried out in chromatography mode. Hence, DB18C6 was functionalized with chloromethylated polystyrene (CMPS) resin. Further, experiments were conducted and the separation factor was found to be in good agreement with the calculated results and thus hold promise for the future isotopic enrichment technology.
The ultrafast water transport through CNT(6,6) (Fig. 8.a) has triggered immense interest on nanomembrane for desalination. The MD study reveals that entropy, enthalpy and free energy as the driving force for water inside CNT[17-20]. The absolute values of entropy and enthalpy of free energy are calculated using two phase thermodynamic (2PT) method. The nanopores of CNT were found to be rapidly filled with water and no empty-filled transitions inside CNT was observed during simulation. The average number of water inside CNT were found to be ~5 (Fig.8.b). The velocity autocorrelation function (VACFs) for bulk water and in CNT are given in Fig. 8.c.. The decay of VACFs of confined fluids was significantly different from bulk with much longer decay time. For confined fluids, depth of minima was larger than bulk indicating restricted motion in
51
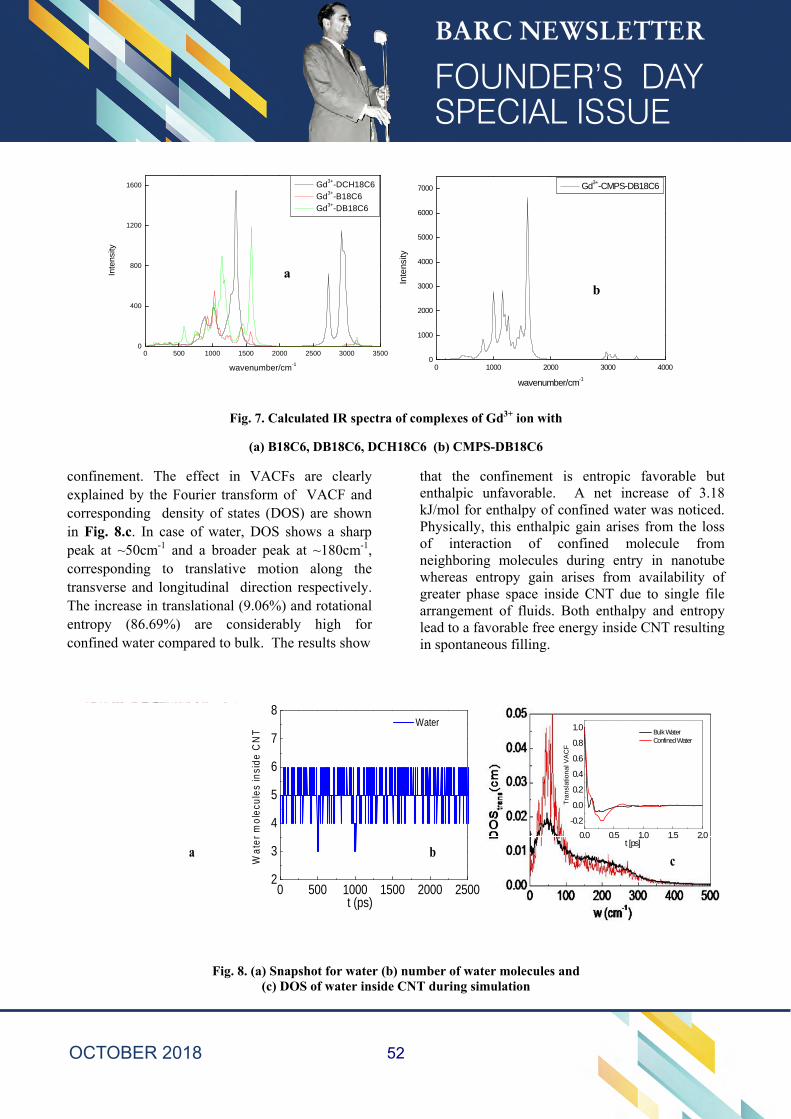
]
Fig. 7. Calculated IR spectra of complexes of Gd3+ ion with
(a) B18C6, DB18C6, DCH18C6 (b) CMPS-DB18C6
confinement. The effect in VACFs are clearly explained by the Fourier transform of VACF and corresponding density of states (DOS) are shown in Fig. 8.c. In case of water, DOS shows a sharp peak at ~50cm-1 and a broader peak at ~180cm-1, corresponding to translative motion along the transverse and longitudinal direction respectively. The increase in translational (9.06%) and rotational entropy (86.69%) are considerably high for confined water compared to bulk. The results show
that the confinement is entropic favorable but enthalpic unfavorable. A net increase of 3.18 kJ/mol for enthalpy of confined water was noticed. Physically, this enthalpic gain arises from the loss of interaction of confined molecule from neighboring molecules during entry in nanotube whereas entropy gain arises from availability of greater phase space inside CNT due to single file arrangement of fluids. Both enthalpy and entropy lead to a favorable free energy inside CNT resulting in spontaneous filling.
Fig. 8. (a) Snapshot for water (b) number of water molecules and (c) DOS of water inside CNT during simulation
0 500 1000 1500 2000 2500 3000 35000
400
800
1200
1600
Inte
nsi
ty
wavenumber/cm-1
Gd3+-DCH18C6
Gd3+-B18C6
Gd3+-DB18C6
0 1000 2000 3000 40000
1000
2000
3000
4000
5000
6000
7000
Inte
nsity
wavenumber/cm-1
Gd3+-CMPS-DB18C6
ab
0 500 1000 1500 2000 25002
3
4
5
6
7
8
Wa
ter
mo
lecu
les
insi
de C
NT
t (ps)
Water
a b0.0 0.5 1.0 1.5 2.0
-0.2
0.0
0.2
0.4
0.6
0.8
1.0
Tra
nsl
atio
na
l VA
CF
t [ps]
Bulk Water Confined Water
c
52
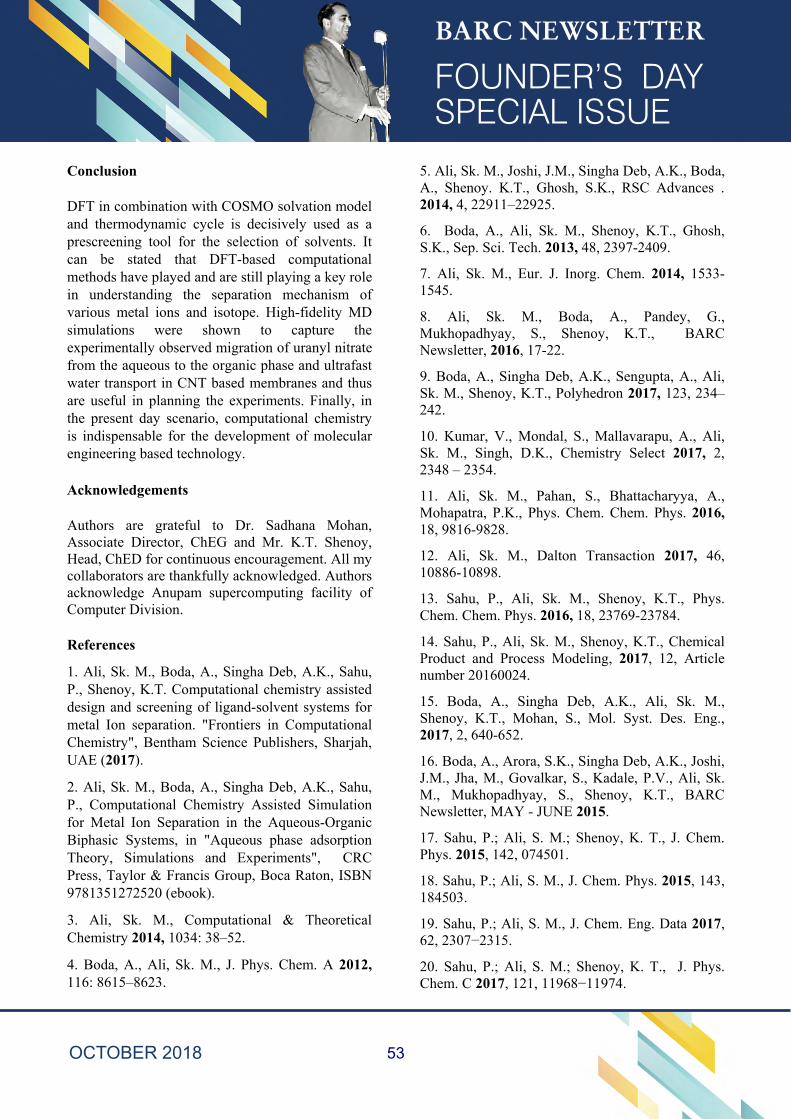
Conclusion
DFT in combination with COSMO solvation model and thermodynamic cycle is decisively used as a prescreening tool for the selection of solvents. It can be stated that DFT-based computational methods have played and are still playing a key role in understanding the separation mechanism of various metal ions and isotope. High-fidelity MD simulations were shown to capture the experimentally observed migration of uranyl nitrate from the aqueous to the organic phase and ultrafast water transport in CNT based membranes and thus are useful in planning the experiments. Finally, in the present day scenario, computational chemistry is indispensable for the development of molecular engineering based technology.
Acknowledgements
Authors are grateful to Dr. Sadhana Mohan, Associate Director, ChEG and Mr. K.T. Shenoy, Head, ChED for continuous encouragement. All my collaborators are thankfully acknowledged. Authors acknowledge Anupam supercomputing facility of Computer Division.
References
1. Ali, Sk. M., Boda, A., Singha Deb, A.K., Sahu, P., Shenoy, K.T. Computational chemistry assisted design and screening of ligand-solvent systems for metal Ion separation. "Frontiers in Computational Chemistry", Bentham Science Publishers, Sharjah, UAE (2017).
2. Ali, Sk. M., Boda, A., Singha Deb, A.K., Sahu, P., Computational Chemistry Assisted Simulation for Metal Ion Separation in the Aqueous-Organic Biphasic Systems, in "Aqueous phase adsorption Theory, Simulations and Experiments", CRC Press, Taylor & Francis Group, Boca Raton, ISBN 9781351272520 (ebook).
3. Ali, Sk. M., Computational & Theoretical Chemistry 2014, 1034: 38–52.
4. Boda, A., Ali, Sk. M., J. Phys. Chem. A 2012, 116: 8615–8623.
5. Ali, Sk. M., Joshi, J.M., Singha Deb, A.K., Boda, A., Shenoy. K.T., Ghosh, S.K., RSC Advances . 2014, 4, 22911–22925.
6. Boda, A., Ali, Sk. M., Shenoy, K.T., Ghosh, S.K., Sep. Sci. Tech. 2013, 48, 2397-2409.
7. Ali, Sk. M., Eur. J. Inorg. Chem. 2014, 1533-1545.
8. Ali, Sk. M., Boda, A., Pandey, G., Mukhopadhyay, S., Shenoy, K.T., BARC Newsletter, 2016, 17-22.
9. Boda, A., Singha Deb, A.K., Sengupta, A., Ali, Sk. M., Shenoy, K.T., Polyhedron 2017, 123, 234–242.
10. Kumar, V., Mondal, S., Mallavarapu, A., Ali, Sk. M., Singh, D.K., Chemistry Select 2017, 2, 2348 – 2354.
11. Ali, Sk. M., Pahan, S., Bhattacharyya, A., Mohapatra, P.K., Phys. Chem. Chem. Phys. 2016, 18, 9816-9828.
12. Ali, Sk. M., Dalton Transaction 2017, 46, 10886-10898.
13. Sahu, P., Ali, Sk. M., Shenoy, K.T., Phys. Chem. Chem. Phys. 2016, 18, 23769-23784.
14. Sahu, P., Ali, Sk. M., Shenoy, K.T., Chemical Product and Process Modeling, 2017, 12, Article number 20160024.
15. Boda, A., Singha Deb, A.K., Ali, Sk. M., Shenoy, K.T., Mohan, S., Mol. Syst. Des. Eng., 2017, 2, 640-652.
16. Boda, A., Arora, S.K., Singha Deb, A.K., Joshi, J.M., Jha, M., Govalkar, S., Kadale, P.V., Ali, Sk. M., Mukhopadhyay, S., Shenoy, K.T., BARC Newsletter, MAY - JUNE 2015.
17. Sahu, P.; Ali, S. M.; Shenoy, K. T., J. Chem. Phys. 2015, 142, 074501.
18. Sahu, P.; Ali, S. M., J. Chem. Phys. 2015, 143, 184503.
19. Sahu, P.; Ali, S. M., J. Chem. Eng. Data 2017, 62, 2307−2315.
20. Sahu, P.; Ali, S. M.; Shenoy, K. T., J. Phys. Chem. C 2017, 121, 11968−11974.
53
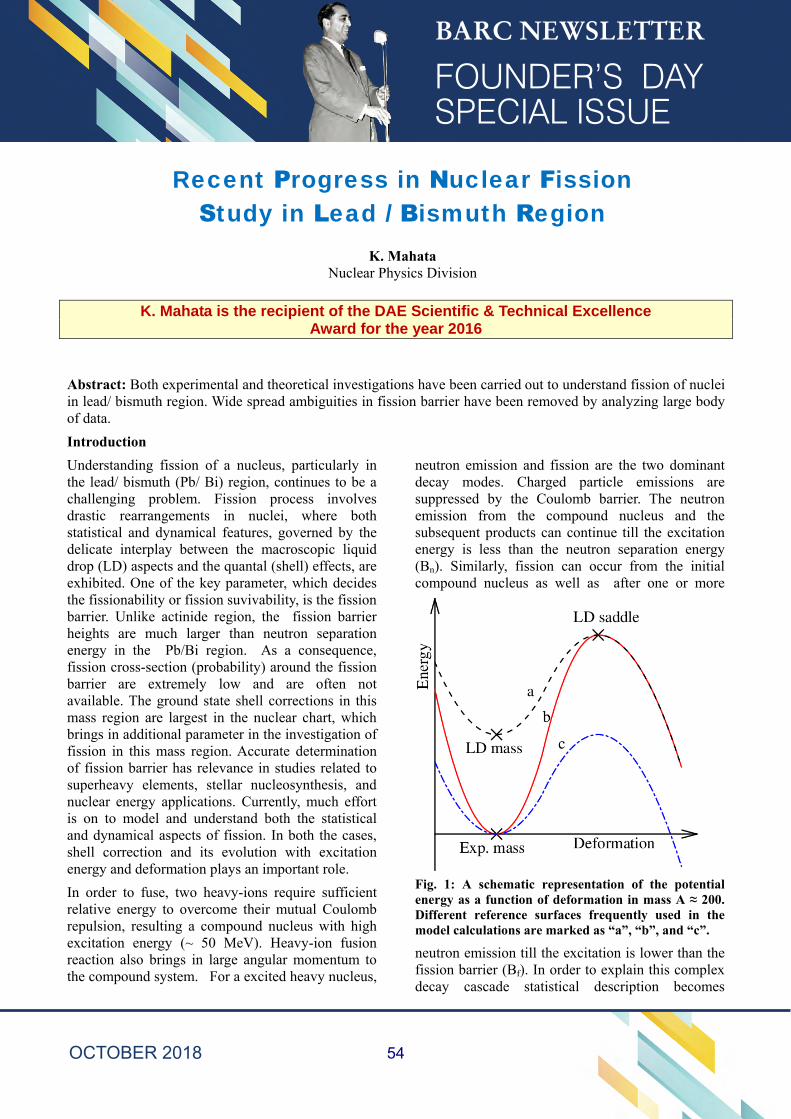
Recent Progress in Nuclear Fission Study in Lead / Bismuth Region
K. MahataNuclear Physics Division
K. Mahata is the recipient of the DAE Scientific & Technical ExcellenceAward for the year 2016
Abstract: Both experimental and theoretical investigations have been carried out to understand fission of nuclei in lead/ bismuth region. Wide spread ambiguities in fission barrier have been removed by analyzing large body of data.
Introduction
Understanding fission of a nucleus, particularly in the lead/ bismuth (Pb/ Bi) region, continues to be a challenging problem. Fission process involves drastic rearrangements in nuclei, where both statistical and dynamical features, governed by the delicate interplay between the macroscopic liquid drop (LD) aspects and the quantal (shell) effects, are exhibited. One of the key parameter, which decides the fissionability or fission suvivability, is the fission barrier. Unlike actinide region, the fission barrier heights are much larger than neutron separation energy in the Pb/Bi region. As a consequence, fission cross-section (probability) around the fission barrier are extremely low and are often not available. The ground state shell corrections in this mass region are largest in the nuclear chart, which brings in additional parameter in the investigation of fission in this mass region. Accurate determination of fission barrier has relevance in studies related to superheavy elements, stellar nucleosynthesis, and nuclear energy applications. Currently, much effort is on to model and understand both the statistical and dynamical aspects of fission. In both the cases, shell correction and its evolution with excitation energy and deformation plays an important role.
In order to fuse, two heavy-ions require sufficient relative energy to overcome their mutual Coulomb repulsion, resulting a compound nucleus with high excitation energy (~ 50 MeV). Heavy-ion fusion reaction also brings in large angular momentum to the compound system. For a excited heavy nucleus,
neutron emission and fission are the two dominant decay modes. Charged particle emissions are suppressed by the Coulomb barrier. The neutron emission from the compound nucleus and the subsequent products can continue till the excitation energy is less than the neutron separation energy (Bn). Similarly, fission can occur from the initial compound nucleus as well as after one or more
Fig. 1: A schematic representation of the potential energy as a function of deformation in mass A ≈ 200. Different reference surfaces frequently used in the model calculations are marked as “a”, “b”, and “c”.
neutron emission till the excitation is lower than the fission barrier (Bf). In order to explain this complex decay cascade statistical description becomes
54
essential. According to the statistical model of compound nucleus decay, all possible decays are intrinsically equally likely and are governed by factors such as the relative density of levels (phase space) and transmission coefficients. The relative decay width (probability) can be approximately written as Γf/Γn = exp[-(Bf-Bn)/T], where T is the temperature.
Although a number of studies have been made, there are still ambiguities in choosing various model parameters, particularly related to the shell correction and its damping, in interpreting the experimental observables [1-5]. It is well recognized that the cumulative fission probability in the heavy-ion induced reaction with excitation energy (E*) in the range 40 – 60 MeV is not sensitive to the correlated variation of the statistical model (SM) parameters, namely the fission barrier (Bf) and the ratio of the level density parameter at the saddle point to that at the equilibrium deformation (af/an).
Prescription for fission barrier and level density
In literature, three different options (See Fig. 1): (a) the liquid drop mass (MLD) and liquid drop fission barrier (BLD ), (b) the experimental mass (Mexp = MLD + ∆n) along with a damping of the shell correction at the ground state (∆n) with excitation energy and shell corrected fission barrier (BLD − ∆n ), and (c) the experimental mass and liquid drop fission barrier are used. Option (a) can be used at sufficiently high energy, when microscopic corrections are expected to wash out. This option uses the liquid drop potential energy for the equilibrium deformation as well as for the saddle deformation. Option (b) should be used for intermediate excitation energy, where the microscopic corrections are expected to be weaker than those at the ground state but not washed out completely. Option (c) is often used in the analysis of fission at intermediate and high excitation energy. This option is often considered by many as a purely macroscopic calculation, which is not true.
Based on option “b”, we proposed following consistent prescription to incorporate shell correction in the fission barrier and level densities
at equilibrium as well as saddle deformation [2]. The fission barrier can be expressed as
Bf(J) = BLD(J) –∆n + ∆n , ------------ (1)
Here, BLD(J),∆n and ∆ f are the macroscopic liquid drop barrier, shell correction at the ground state and shell correction at the saddle deformation, respectively. It should be noted that the negative ground state shell correction in this mass region increases the height of fission barrier significantly.
Shell corrections in the Fermi gas model level density prescription can be incorporated through the level density parameter (a) as
ax = ãx [1 + (∆x /Ux )(1 − e−ηUx )], ------------- (2)
with x = n and f for equilibrium and saddle deformation, respectively. Here, the ãx and η are the asymptotic liquid drop values of the level density parameters and shell damping parameter, respectively. The available excitation energy at the equilibrium deformation is obtained by subtracting the rotational energy and pairing energy from the total excitation energy.
Analysis of fission excitation function and pre-fission neutron multiplicity data
Using the above prescription several experimental fission excitation function and pre-fission neutron multiplicity data as well as partial evaporation residue (ER) excitation functions in heavy-ion induced reactions were analyzed [2-3]. It was found that the heavy-ion induced fission and ER excitation functions, available at excitation energies above 40 MeV, are not sensitive to the correlated variation of the fission barrier and level density parameters [1-2]. However, the neutron multiplicity was found to be very sensitive to the above correlated variation. Therefore, neutron multiplicity was used along with fission and ER excitation functions to constrain the model parameters. It was observed that the fission excitation functions and the pre-fission neutron multiplicity data could be explained simultaneously only if ~ 75% of the ground state shell correction is retained at the saddle point. As a result the fission barrier heights become much smaller (~ 12 MeV for 210Po) than those obtained from the light-ion induced fission data (~ 22 MeV for 210Po) [6].
55
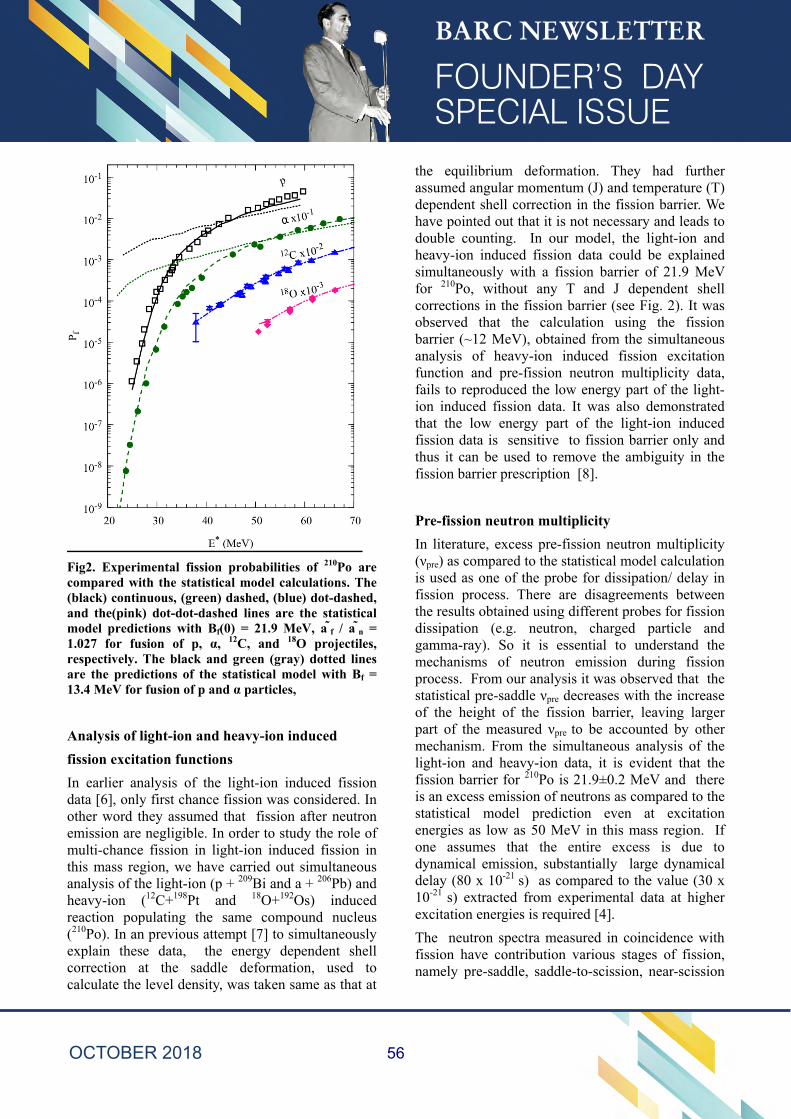
Fig2. Experimental fission probabilities of 210Po are compared with the statistical model calculations. The (black) continuous, (green) dashed, (blue) dot-dashed, and the(pink) dot-dot-dashed lines are the statistical model predictions with Bf(0) = 21.9 MeV, a f / a n = 1.027 for fusion of p, α, 12C, and 18O projectiles, respectively. The black and green (gray) dotted lines are the predictions of the statistical model with Bf = 13.4 MeV for fusion of p and α particles,
Analysis of light-ion and heavy-ion induced
fission excitation functions
In earlier analysis of the light-ion induced fission data [6], only first chance fission was considered. In other word they assumed that fission after neutron emission are negligible. In order to study the role of multi-chance fission in light-ion induced fission in this mass region, we have carried out simultaneous analysis of the light-ion (p + 209Bi and a + 206Pb) and heavy-ion (12C+198Pt and 18O+192Os) induced reaction populating the same compound nucleus (210Po). In an previous attempt [7] to simultaneously explain these data, the energy dependent shell correction at the saddle deformation, used to calculate the level density, was taken same as that at
the equilibrium deformation. They had further assumed angular momentum (J) and temperature (T) dependent shell correction in the fission barrier. We have pointed out that it is not necessary and leads to double counting. In our model, the light-ion and heavy-ion induced fission data could be explained simultaneously with a fission barrier of 21.9 MeV for 210Po, without any T and J dependent shell corrections in the fission barrier (see Fig. 2). It was observed that the calculation using the fission barrier (~12 MeV), obtained from the simultaneous analysis of heavy-ion induced fission excitation function and pre-fission neutron multiplicity data, fails to reproduced the low energy part of the light-ion induced fission data. It was also demonstrated that the low energy part of the light-ion induced fission data is sensitive to fission barrier only and thus it can be used to remove the ambiguity in the fission barrier prescription [8].
Pre-fission neutron multiplicity
In literature, excess pre-fission neutron multiplicity (νpre) as compared to the statistical model calculation is used as one of the probe for dissipation/ delay in fission process. There are disagreements between the results obtained using different probes for fission dissipation (e.g. neutron, charged particle and gamma-ray). So it is essential to understand the mechanisms of neutron emission during fission process. From our analysis it was observed that the statistical pre-saddle νpre decreases with the increase of the height of the fission barrier, leaving larger part of the measured νpre to be accounted by other mechanism. From the simultaneous analysis of the light-ion and heavy-ion data, it is evident that the fission barrier for 210Po is 21.9±0.2 MeV and there is an excess emission of neutrons as compared to the statistical model prediction even at excitation energies as low as 50 MeV in this mass region. If one assumes that the entire excess is due to dynamical emission, substantially large dynamical delay (80 x 10-21 s) as compared to the value (30 x 10-21 s) extracted from experimental data at higher excitation energies is required [4].
The neutron spectra measured in coincidence with fission have contribution various stages of fission, namely pre-saddle, saddle-to-scission, near-scission
56
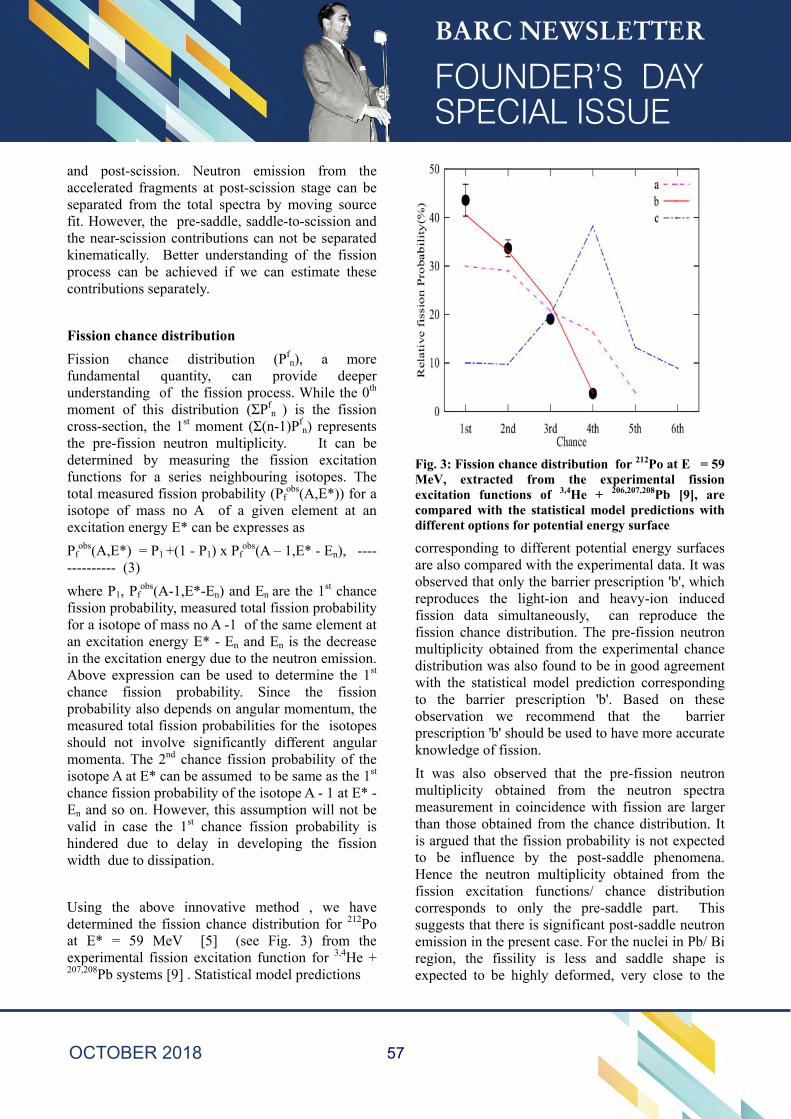
and post-scission. Neutron emission from the accelerated fragments at post-scission stage can be separated from the total spectra by moving source fit. However, the pre-saddle, saddle-to-scission and the near-scission contributions can not be separated kinematically. Better understanding of the fission process can be achieved if we can estimate these contributions separately.
Fission chance distribution
Fission chance distribution (Pfn), a more
fundamental quantity, can provide deeper understanding of the fission process. While the 0th moment of this distribution (ΣPf
n ) is the fission cross-section, the 1st moment (Σ(n-1)Pf
n) represents the pre-fission neutron multiplicity. It can be determined by measuring the fission excitation functions for a series neighbouring isotopes. The total measured fission probability (Pf
obs(A,E*)) for a isotope of mass no A of a given element at an excitation energy E* can be expresses as
Pfobs(A,E*) = P1 +(1 - P1) x Pf
obs(A – 1,E* - En), -------------- (3)
where P1, Pfobs(A-1,E*-En) and En are the 1st chance
fission probability, measured total fission probability for a isotope of mass no A -1 of the same element at an excitation energy E* - En and En is the decrease in the excitation energy due to the neutron emission. Above expression can be used to determine the 1st chance fission probability. Since the fission probability also depends on angular momentum, the measured total fission probabilities for the isotopes should not involve significantly different angular momenta. The 2nd chance fission probability of the isotope A at E* can be assumed to be same as the 1st chance fission probability of the isotope A - 1 at E* - En and so on. However, this assumption will not be valid in case the 1st chance fission probability is hindered due to delay in developing the fission width due to dissipation.
Using the above innovative method , we have determined the fission chance distribution for 212Po at E* = 59 MeV [5] (see Fig. 3) from the experimental fission excitation function for 3,4He + 207,208Pb systems [9] . Statistical model predictions
Fig. 3: Fission chance distribution for 212Po at E = 59 MeV, extracted from the experimental fission excitation functions of 3,4He + 206,207,208Pb [9], are compared with the statistical model predictions with different options for potential energy surface
corresponding to different potential energy surfaces are also compared with the experimental data. It was observed that only the barrier prescription 'b', which reproduces the light-ion and heavy-ion induced fission data simultaneously, can reproduce the fission chance distribution. The pre-fission neutron multiplicity obtained from the experimental chance distribution was also found to be in good agreement with the statistical model prediction corresponding to the barrier prescription 'b'. Based on these observation we recommend that the barrier prescription 'b' should be used to have more accurate knowledge of fission.
It was also observed that the pre-fission neutron multiplicity obtained from the neutron spectra measurement in coincidence with fission are larger than those obtained from the chance distribution. It is argued that the fission probability is not expected to be influence by the post-saddle phenomena. Hence the neutron multiplicity obtained from the fission excitation functions/ chance distribution corresponds to only the pre-saddle part. This suggests that there is significant post-saddle neutron emission in the present case. For the nuclei in Pb/ Bi region, the fissility is less and saddle shape is expected to be highly deformed, very close to the
57
scission point. Hence saddle-to-scission motion is expected to be fast and not expected to contribute to neutron multiplicity significantly, indicating significant near-scission emission in fission of nuclei in the PB/ Bi region.
Summary & Conclusion
Several measurements of fission excitation functions and pre-fission neutron multiplicity in the Pb/ Bi region have been carried out. In order to interpret the data, we have proposed a consistent prescription to incorporate shell correction and its damping with excitation energy in the fission barrier and level densities. Through the analysis of large body of data, we have removed the ambiguity in the fission barrier prescription. Using a innovative method, we have determined the fission chance distribution and pre-saddle neutron multiplicity for 212Po nucleus at 59 MeV. Our study indicate significant contribution of scission neutrons, which is difficult to infer and largely ignored in the study of fission of excited nuclei.
Acknowledgment
The author gratefully acknowledges the suggestions and advice of S. Kailas and S. S. Kapoor.
References
1. K. Mahata et al., Nuclear Physics A 720, 209 (2003).
2. K. Mahata et al., Physics Review C 74, 041301R (2006).
3. K. S. Golda et al., Nuclear Physics A 913, 157 (2013).
4. K. Mahata et al., Physics Review C 92, 034602 (2015).
5. K. Mahata et al., Physics Review C 95, 054616 (2017)
6. L. G. Moretto, K. X. Jing, R. Gatti, G. J. Wozniak, and R. P. Schmitt, Phys. Rev. Lett. 75, 4186 (1995).
7. A. D’Arrigo, G. Gardiana, M. Herman, A. V. Ignatyuk, and A. Taccone, J. Phys. G: Nucl. Part. Phys. 20, 365 (1994).
8. K. Mahata, Pramana 85, 281 (2015).
9. K. Jing, Ph.D. thesis, University of California at Berkeley, 1999 (LBNL-43410).
58
59
60
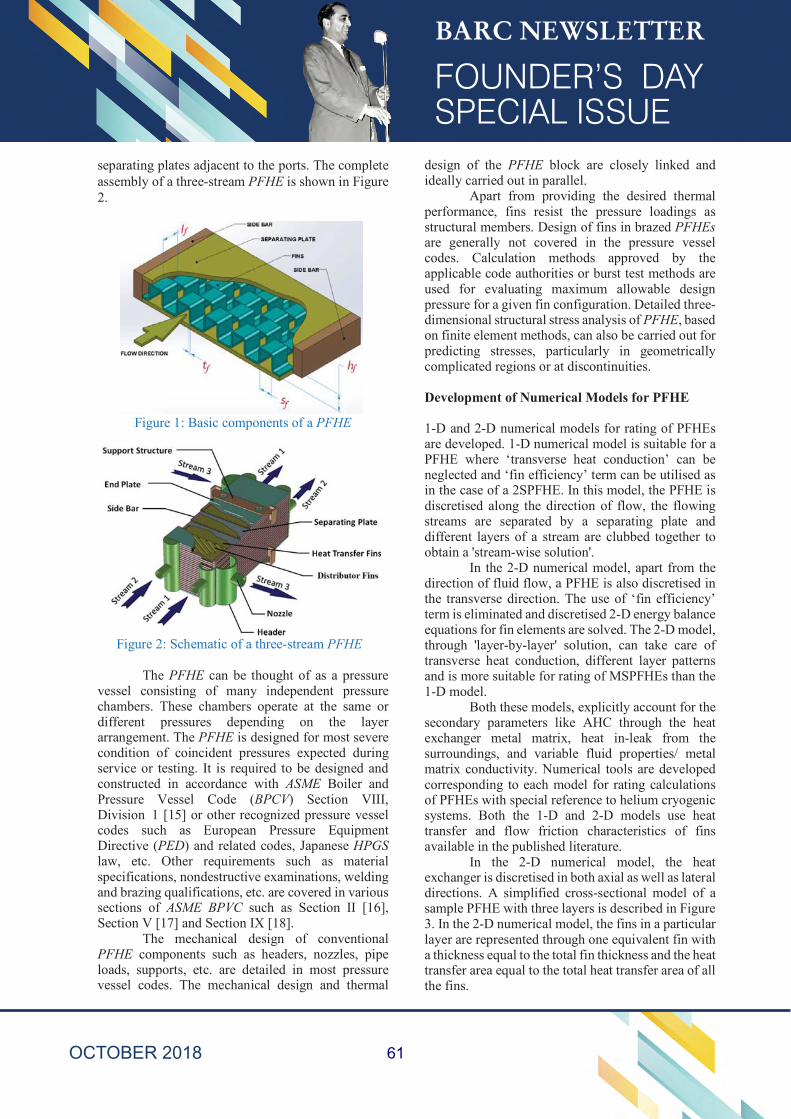
61
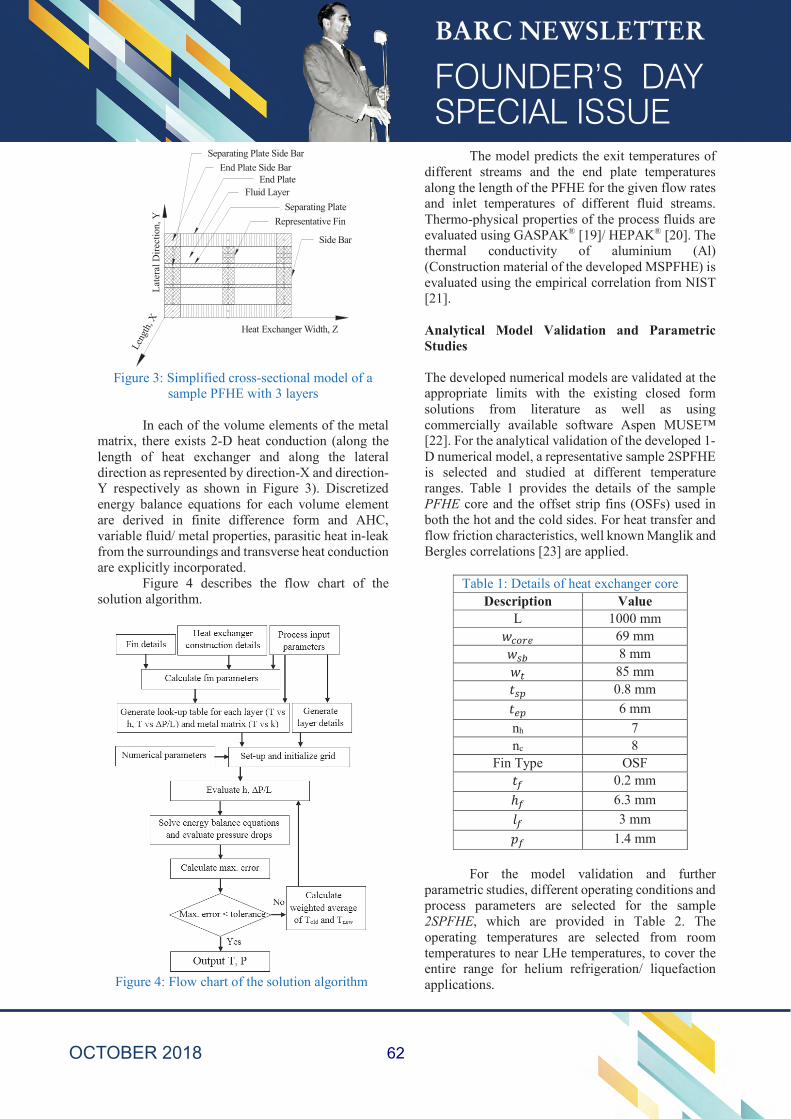
62
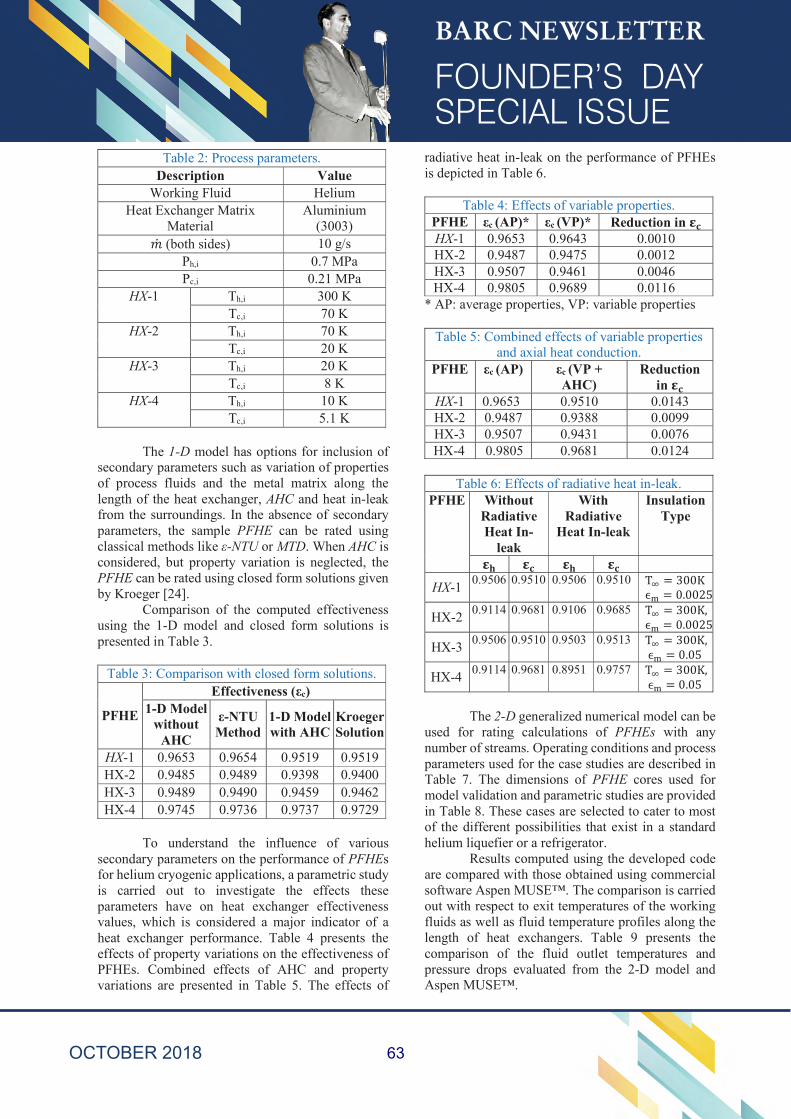
63
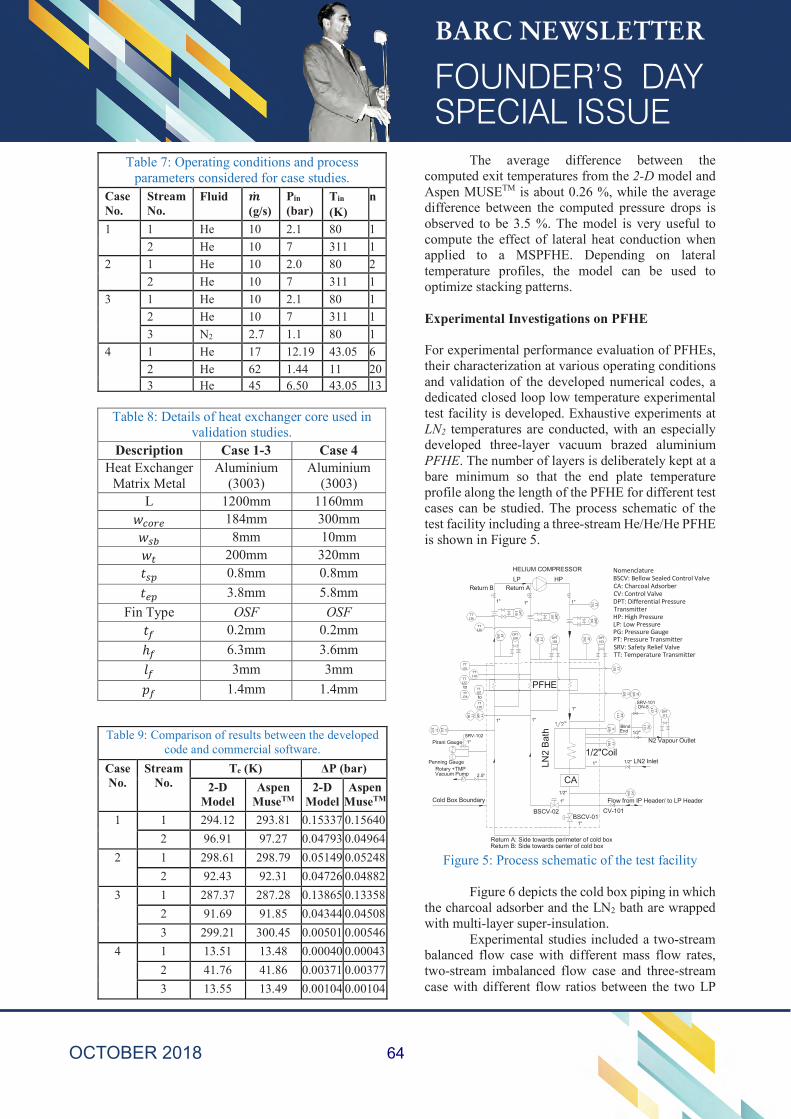
64

65
66
67
68
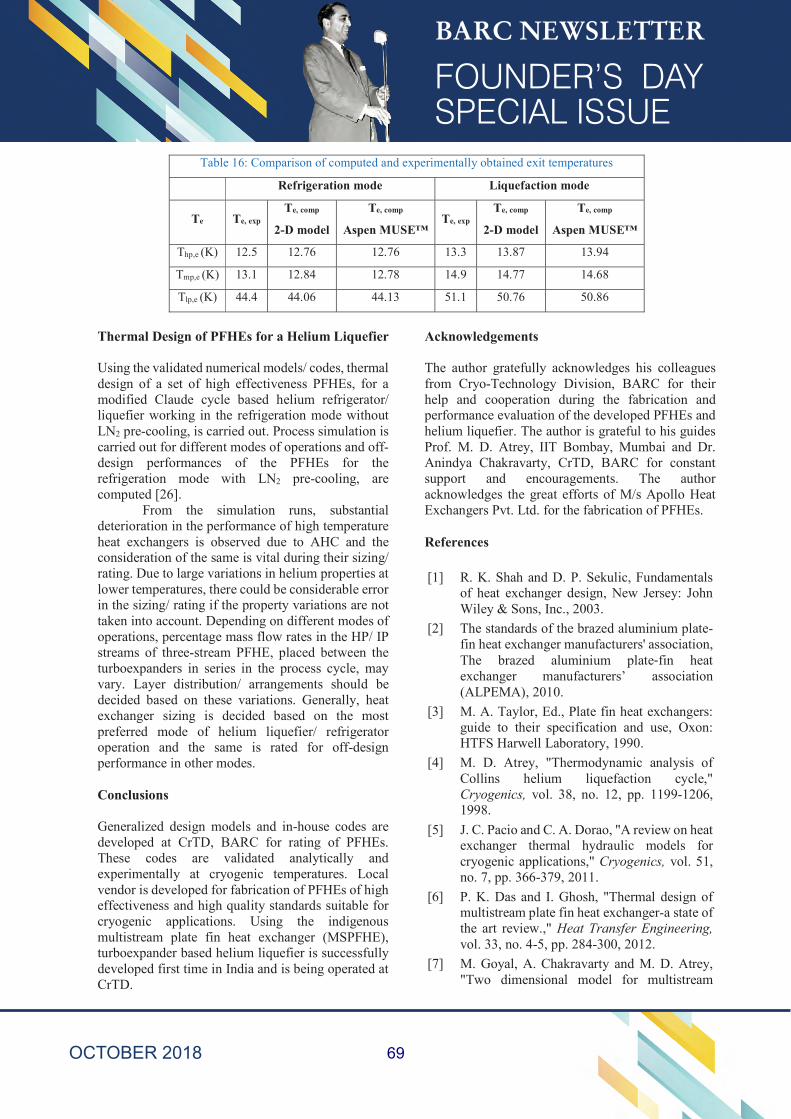
69
70
Microstructural Evolution During Joining of Stainless Steel to Zircaloy and Titanium
Arijit Laik
Materials Science Division
Arijit Laik is the recipient of the DAE Scientific & Technical Excellence Award for the year 2016
Abstract The microstructure and the constituent phases at the interface play a major role in deciding the mechanical properties of dissimilar material joints. The final microstructure results from different reactions and phase evolution that occur near the joint interface during the process of joining. It has been shown here, how the microstructural evolution during two types of dissimilar materials joining, namely, diffusion bonding of stainless steel 304 L to Zircaloy-4 and vacuum brazing of stainless steel 304 L to titanium grade 2 has been delineated using detailed characterisation of the interface. 1. Introduction: The quest for enhanced performance of engineering components has ever increased the complexity of their design and has necessitated the use of combination of different classes of materials. Dissimilar metal joints find applications in a variety of major technological fields such as nuclear, aerospace, petrochemical, thermal power, cryogenics and micro-electronics [1,2]. Zirconium based alloys have been a natural choice for the in-core structural material of thermal reactors such as pressurized water reactors (PWR), boiling water reactors (BWR) and pressurized heavy water reactors (PHWR), essentially because of the unique combination of the desired properties such as such as, low neutron absorption cross-section, adequate mechanical properties, excellent corrosion properties. Whereas, the out-of-core components are usually made of stainless steel (SS) primarily due to its corrosion resistance property. Hence, joints between Zr-based components and SS are often needed at various locations of nuclear reactors [3]. Unfortunately, joining Zr-based alloys and SS using conventional fusion welding is not a viable option, due to segregation of chemical species, generation of stress concentrated regions and formation of brittle intermetallics at the interface, which impair the mechanical properties as well as corrosion resistance of the joints [4].
These problems are overcome to a large extent by adopting solid state diffusion bonding process. In a recent study, the methodology for joining SS 304L and Zircaloy-4 was developed through diffusion bonding technique [3]. The bonding parameters such as temperature, time and compressive stress were optimised with respect to the bond strength. Titanium and its alloys find wide range of applications in various sectors such as aerospace, chemical, biomedical, and nuclear due to its unique combination of properties such as high specific strength and excellent corrosion resistance [5,6]. The range of application of these materials, in combination with other structural materials, such as stainless steels (SS), is greatly enhanced by the appropriate selection of joining techniques. Dissimilar materials joints between stainless steel and titanium are widely used in the aerospace engineering, heat exchangers in chemical and petrochemical industries, sub-assemblies in nuclear reactors, and nuclear fuel reprocessing plants, particularly in the dissolver assembly for reprocessing of spent nuclear fuel [7-10]. Brazing is widely employed in joining dissimilar materials. Vacuum brazing with Ag-based filler metals is an accepted choice for joining Ti alloys and SS for applications at ambient to moderately high temperatures. However, development of a successful brazing technique requires identifying
71
the chemical reactions undergoing at the interfaces and understanding the mechanisms of these reactions, which can be used to optimize the bonding conditions, and hence achieve the desirable properties [11,12]. In-depth experimental investigations were carried out in both the abovementioned areas with the objective of developing clear insight to the mechanisms of the chemical and microstructural changes at the interface that lead to successful joining of the two materials. The microstructural evolution that the interfaces undergo during the process of bonding has been delineated. 2. Materials and Methods In the case of diffusion bonding of SS 304L to Zircaloy-4, pieces of the two materials of dimensions 15 mm × 15 mm with thickness of about 4 mm were used for the experiments. The faying surfaces of both SS and Zircaloy-4 pieces were prepared by conventional grinding and polishing up to 1 μm diamond finish. The SS pieces were provided with Ni coating of 20 μm thickness by the process of electroplating. Ti was used as an interlayer in the form of 40 μm thick foil. Diffusion bonding was carried out in a hot press under vacuum of the order of 5× 10⁻⁵ mbar. Samples were kept one upon the other in a way that the faying surfaces were in contact with each other and the order of arrangement of samples during bonding was SS/Ni/Ti/Zircaloy-4. The bonding experiments were carried out in the temperature range of 800 °C - 900 °C for bonding time between 30 min and 90 min, under a compressive pressure of 20 MPa. Experiments on brazing of SS 304L and titanium grade 2 were carried out using foils of Ag-28 wt.% Cu alloy (Ag-28Cu), commercially known as Cusil.
The Ti and SS pieces were clamped together with the brazing alloy foil between them, in a vacuum brazing furnace, with a load of 10 kg to keep them in place. The furnace was maintained at about 5 X 10⁻⁵ mbar vacuum. The details of the experiments has been explained elsewhere [3, 12]. Specimens from the cross-section of the diffusion bonded and brazed joints were prepared using standard metallographic techniques and were subsequently etched to reveal the microstructure. Detailed characterization of the joints was carried out using a field emission scanning electron microscope (FESEM) with energy dispersive spectrometers (EDS), electron probe microanalyser (EPMA), transmission electron microscope (TEM), X-ray diffraction (XRD) and microhardness tester. The shear strengths of the joints were determined using a custom made fixture in a universal testing machine (UTM). 3. Results and Discussion 3.1 Microstructural evolution at the SS-Zircaloy Interface Examination of the microstructure of the joint interface revealed a layered structure in the diffusion zone (DZ) with no pores, cracks and discontinuities in all the cases. The thickness of the DZ at 850 °C was found to be 66 μm and 85 μm for bonding durations 30 min and 60 min, respectively. While, the DZ thickness was 70 μm and 63 μm for bonding conditions 900 °C-30 min and 800 °C-60 min, respectively. The interface between SS 304L and Zircaloy-4 bonded at 800 °C for 60 min is shown in Fig. 1(a). The chemical compositions obtained at different regions of reaction zone, marked in Fig. 1(a), are shown in Table 1.
Table 1: Chemical compositions (in at.%) of different phase layers, formed across the interface of SS 304L/Zircaloy-4 joint bonded at 800 °C for 60 min, marked on Fig. 1(a) [3].
Point number Zr Fe Ni Cr Sn Ti Phase identity
1 1.1 64.6 10.9 22.7 0.4 0.3 γ-Fe 2 0 1.5 96.9 0.9 0.4 0.3 Ni 3 1.2 0 74.4 0.3 0.9 23.2 Ni3Ti 4 1.3 0.5 45.5 0.3 1.2 51.2 NiTi 5 16.2 0 0 0 0.7 83.1 α-(Ti, Zr) 6 88.7 1.2 1.0 0 1.9 7.2 α-(Zr, Ti)
72
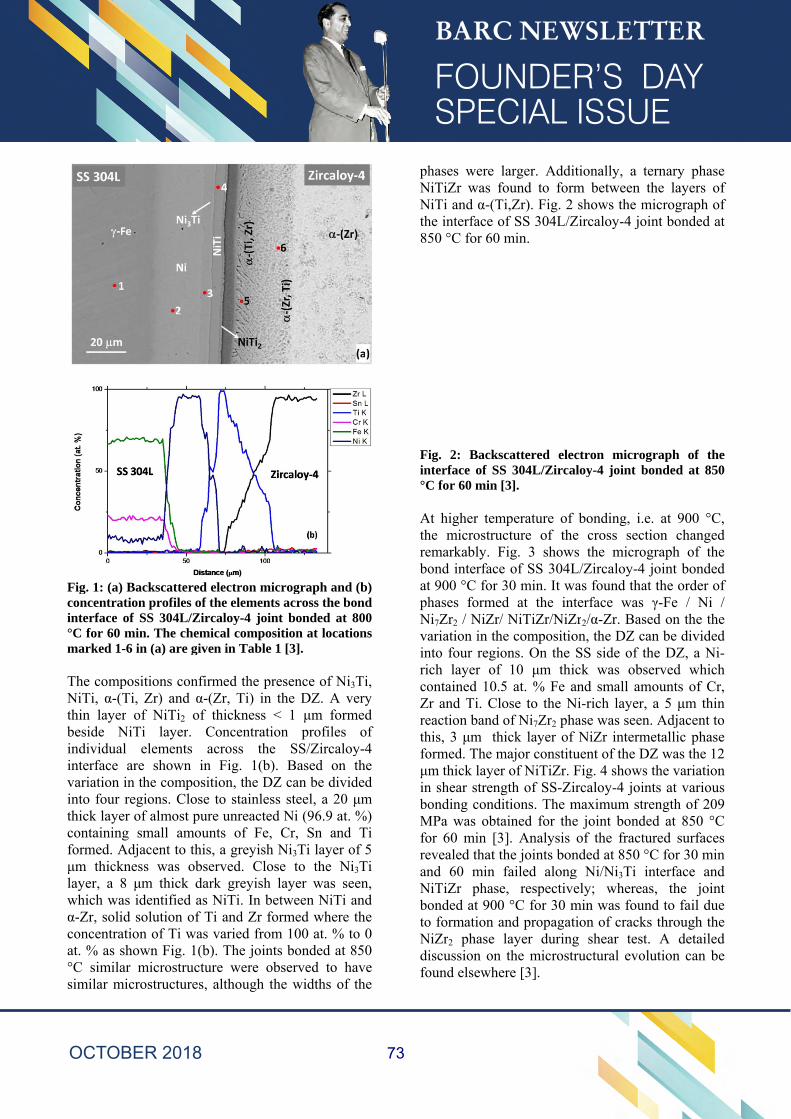
Fcin°m TNthbininvinthcfμlwαca°s
Fig. 1: (a) Bacconcentrationnterface of S
°C for 60 minmarked 1-6 in
The composiNiTi, α-(Ti, hin layer of
beside NiTindividual enterface are
variation in thnto four reghick layer of
containing smformed. Adjaμm thicknesayer, a 8 μm
which was idα-Zr, solid soconcentrationat. % as show°C similar msimilar micro
ckscattered en profiles of thSS 304L/Zircn. The chemicn (a) are given
itions confirmZr) and α-(Zf NiTi2 of ti layer. Celements ace shown in he compositiions. Close f almost puremall amounacent to this,s was obsem thick darkdentified as Nolution of Tin of Ti was vwn Fig. 1(b)microstructurostructures, a
electron micrhe elements a
caloy-4 joint cal compositin in Table 1
med the presZr, Ti) in ththickness <
Concentrationcross the Fig. 1(b).
ion, the DZ to stainless e unreacted Nnts of Fe, C a greyish Nrved. Close k greyish laNiTi. In betwi and Zr formvaried from . The joints re were obsalthough the
rograph and (across the bobonded at 8ion at locatio[3].
sence of Ni3The DZ. A ve
1 μm formn profiles
SS/ZircaloyBased on tcan be dividsteel, a 20 μNi (96.9 at. %Cr, Sn and Ni3Ti layer of
to the Ni3
ayer was seeween NiTi anmed where t100 at. % tobonded at 8erved to ha
e widths of t
(b) nd
800 ons
Ti, ery
med of
y-4 the ded μm %) Ti f 5 3Ti en, nd the o 0 50
ave the
phNNth85
Fiin°C AthreboatphNvainricoZrrethfoμminboMforeanNbotoNdifo
hases were NiTiZr was fNiTi and α-(The interface o50 °C for 60
ig. 2: Backsnterface of SSC for 60 min
At higher temhe microstruemarkably. Fond interfacet 900 °C for hases forme
Ni7Zr2 / NiZr/ariation in thnto four regioch layer ofontained 10.r and Ti. Cl
eaction band his, 3 μm thormed. The mm thick layer
n shear strenonding cond
MPa was obtor 60 min [3evealed that tnd 60 min
NiTiZr phaseonded at 900o formation a
NiZr2 phase iscussion onound elsewhe
larger. Addifound to forTi,Zr). Fig. 2of SS 304L/Zmin.
scattered eleS 304L/Zirca[3].
mperature ofucture of thFig. 3 showe of SS 304L30 min. It w
ed at the in/ NiTiZr/NiZ
he compositioons. On the
f 10 μm thi5 at. % Fe alose to the Nof Ni7Zr2 ph
hick layer ofmajor constitr of NiTiZr. gth of SS-Zi
ditions. The mained for th3]. Analysis the joints bonfailed along
e, respectiv0 °C for 30 mand propagatlayer durin
n the microstere [3].
itionally, a trm between 2 shows the mZircaloy-4 jo
ectron microaloy-4 joint b
f bonding, i.he cross secws the microL/Zircaloy-4
was found thanterface wasZr2/α-Zr. Bason, the DZ cSS side of t
ick was obsand small am
Ni-rich layerhase was seenf NiZr intermtuent of the DFig. 4 showsircaloy-4 joimaximum ste joint bondof the fract
nded at 850 g Ni/Ni3Ti
vely; whereamin was foution of crackg shear testtructural evo
ternary phasthe layers o
micrograph ooint bonded a
ograph of thbonded at 85
e. at 900 °Cction changeograph of th4 joint bondeat the order o γ-Fe / Ni sed on the thcan be dividethe DZ, a Nserved whicmounts of Cr, a 5 μm thin. Adjacent tmetallic phasDZ was the 1s the variatioints at varioutrength of 20ded at 850 °tured surface°C for 30 miinterface anas, the join
und to fail duks through tht. A detaile
olution can b
se of of at
he 50
C, ed he ed of
/ he ed
Ni-ch
Cr, in to se 12 on us 09 C es in nd nt ue he ed be
73
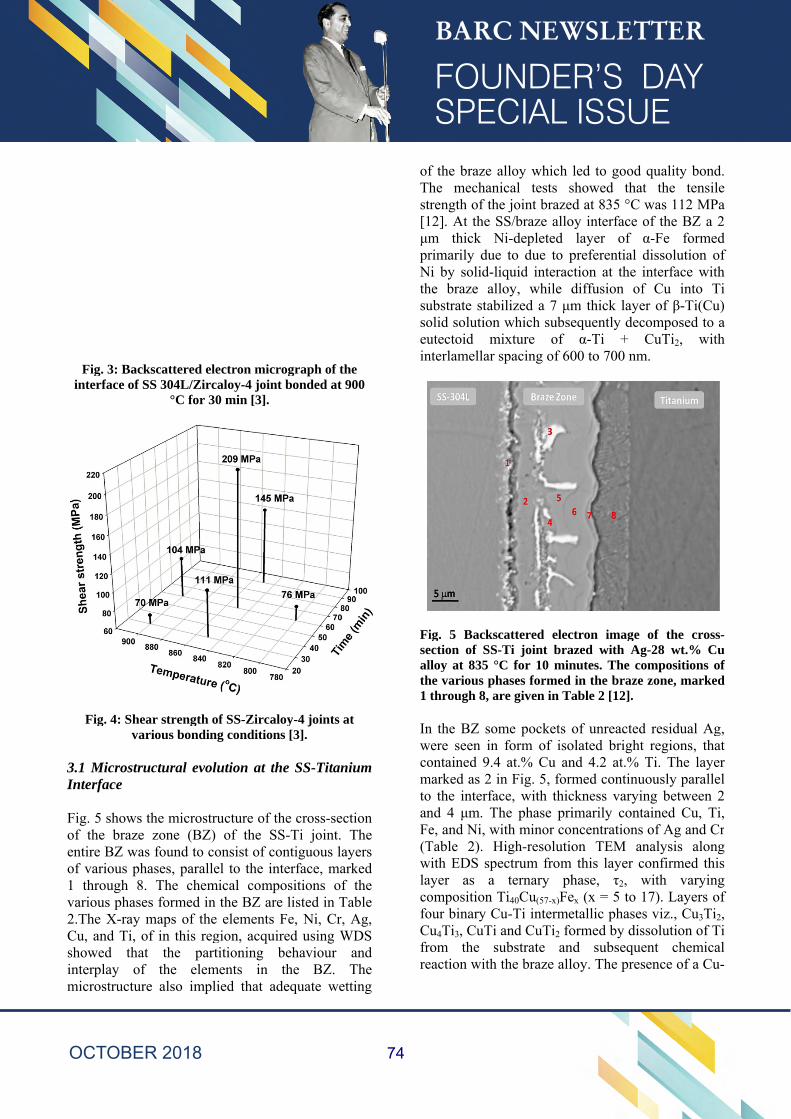
3I Foeo1v2Csinm
Fig. 3: Bacinterface of S
Fig. 4: Sheva
3.1 MicrostrInterface
Fig. 5 shows of the brazeentire BZ waof various ph1 through 8various phase2.The X-ray Cu, and Ti, oshowed thanterplay of
microstructur
kscattered elSS 304L/Zirc
°C for 3
ear strength oarious bondin
ructural evol
the microstre zone (BZ)as found to chases, paralle. The chemes formed inmaps of the
of in this regat the partf the elemre also impl
lectron microcaloy-4 joint b0 min [3].
of SS-Zircalong conditions
lution at the
ructure of the) of the SSonsist of conel to the inte
mical compon the BZ are e elements Fgion, acquiretitioning be
ments in thlied that ade
ograph of the bonded at 90
oy-4 joints at [3].
e SS-Titaniu
e cross-secti-Ti joint. Tntiguous layeerface, mark
ositions of tlisted in Tab
Fe, Ni, Cr, Aed using WDehaviour ahe BZ. Tequate wettin
00
um
on The ers
ked the ble
Ag, DS nd
The ng
ofThst[1μmprNthsusoeuin
Fisealth1 InwcomtoanFe(TwlacofoCfrre
f the braze ahe mechanitrength of the12]. At the Sm thick Nrimarily due
Ni by solid-lihe braze allubstrate stabolid solution utectoid mnterlamellar s
ig. 5 Backscection of SS-lloy at 835 °Che various phthrough 8, ar
n the BZ somwere seen in ontained 9.4
marked as 2 ino the interfacnd 4 μm. The, and Ni, wiTable 2). H
with EDS speayer as a omposition Tour binary Cu
Cu4Ti3, CuTi rom the sueaction with
alloy which ical tests se joint braze
SS/braze alloNi-depleted e to due to piquid interacloy, while dilized a 7 μmwhich subse
mixture of spacing of 60
cattered elec-Ti joint braC for 10 min
hases formed re given in Ta
me pockets oform of iso at.% Cu ann Fig. 5, formce, with thiche phase priith minor con
High-resolutioectrum from
ternary phTi40Cu(57-x)Feu-Ti intermeand CuTi2 foubstrate anthe braze all
led to good showed thatd at 835 °C
oy interface olayer of α
preferential dction at the idiffusion ofm thick layeequently decα-Ti +
00 to 700 nm
ctron image azed with Agnutes. The coin the braze
able 2 [12].
of unreactedolated brightnd 4.2 at.% med continuckness varyinimarily contncentrations on TEM anthis layer c
hase, τ2, wex (x = 5 to 1etallic phasesormed by disnd subsequeloy. The pres
quality bondt the tensilwas 112 MPof the BZ a α-Fe formedissolution ointerface witf Cu into Ter of β-Ti(Cucomposed to CuTi2, wit
m.
of the crosg-28 wt.% Compositions o
zone, marke
d residual Agt regions, thaTi. The laye
uously paralleng between tained Cu, T
of Ag and Cnalysis alon
confirmed thwith varyin17). Layers os viz., Cu3Tissolution of Tent chemicasence of a Cu
d. le
Pa 2
ed of th Ti u) a
th
s-Cu of ed
g, at er el 2
Ti, Cr ng is
ng of i2, Ti al u-
74
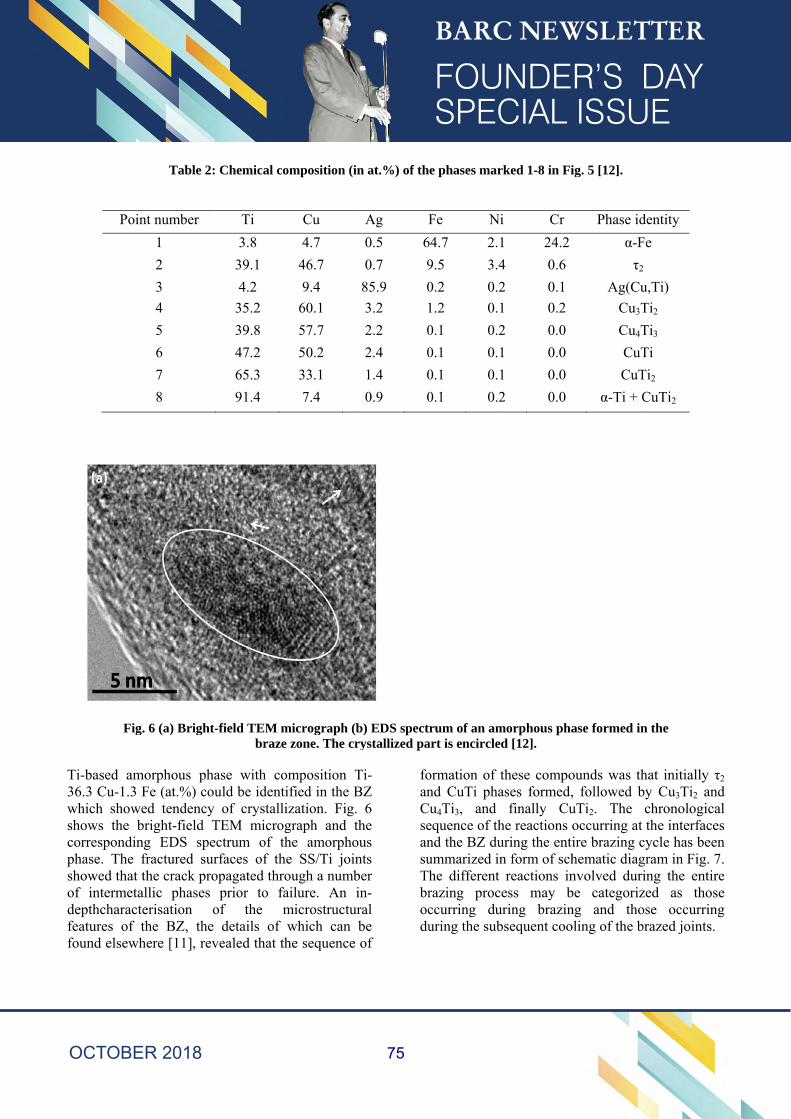
T3wscpsodff
Poin
Fig.
Ti-based am36.3 Cu-1.3 Fwhich showeshows the bcorrespondinphase. The fshowed that tof intermetadepthcharactefeatures of tfound elsewh
Table 2:
nt number
1
2
3
4
5
6
7
8
. 6 (a) Bright
morphous phaFe (at.%) coued tendency
bright-field Tng EDS spefractured surthe crack pro
allic phases erisation othe BZ, the here [11], rev
: Chemical co
Ti
3.8
39.1
4.2
35.2
39.8
47.2
65.3
91.4
-field TEM mbraze
ase with could be identi of crystalliTEM microgectrum of thrfaces of thopagated thro
prior to faof the m
details of vealed that th
omposition (in
Cu
4.7
46.7
9.4
60.1
57.7
50.2
33.1
7.4
micrograph (be zone. The cr
omposition Tified in the Bization. Fig.graph and the amorphoe SS/Ti joinough a numbailure. An imicrostructurwhich can he sequence
n at.%) of th
Ag F
0.5 6
0.7 9
85.9 0
3.2 1
2.2 0
2.4 0
1.4 0
0.9 0
b) EDS spectrystallized pa
Ti-BZ 6 the ous nts ber in-ral be of
foanCseansuThbrocdu
e phases mar
Fe Ni
64.7 2.1
9.5 3.4
0.2 0.2
1.2 0.1
0.1 0.2
0.1 0.1
0.1 0.1
0.1 0.2
rum of an amart is encircle
ormation of tnd CuTi pha
Cu4Ti3, and equence of thnd the BZ duummarized inhe different razing procccurring duuring the sub
rked 1-8 in Fi
i Cr
1 24.2
4 0.6
2 0.1
1 0.2
2 0.0
1 0.0
1 0.0
2 0.0
morphous phad [12].
these compoases formed,
finally Cuhe reactions uring the entin form of schreactions in
cess may buring brazinbsequent coo
ig. 5 [12].
Phase id
α-F
τ2
Ag(Cu
Cu3T
Cu4T
CuT
CuT
α-Ti + C
ase formed in
ounds was th, followed buTi2. The occurring at ire brazing chematic diagnvolved duribe categorizng and thooling of the b
dentity
Fe
u,Ti)
Ti2
Ti3
Ti
Ti2
CuTi2
n the
hat initially τby Cu3Ti2 anchronologicathe interface
cycle has beegram in Fig. 7ing the entirzed as thosose occurrinbrazed joints.
τ2 nd al es en 7. re se ng
75
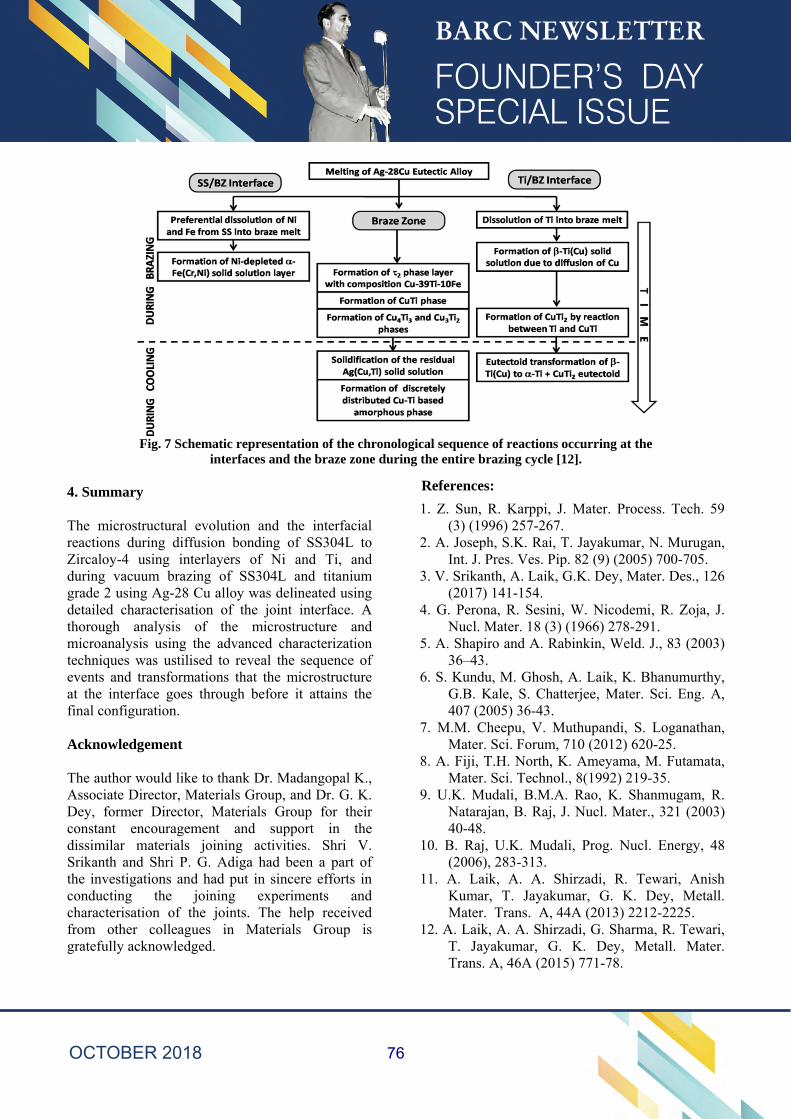
Fig. 7 Schematic representation of the chronological sequence of reactions occurring at the interfaces and the braze zone during the entire brazing cycle [12].
4. Summary
The microstructural evolution and the interfacial reactions during diffusion bonding of SS304L to Zircaloy-4 using interlayers of Ni and Ti, and during vacuum brazing of SS304L and titanium grade 2 using Ag-28 Cu alloy was delineated using detailed characterisation of the joint interface. A thorough analysis of the microstructure and microanalysis using the advanced characterization techniques was ustilised to reveal the sequence of events and transformations that the microstructure at the interface goes through before it attains the final configuration.
Acknowledgement
The author would like to thank Dr. Madangopal K., Associate Director, Materials Group, and Dr. G. K. Dey, former Director, Materials Group for their constant encouragement and support in the dissimilar materials joining activities. Shri V. Srikanth and Shri P. G. Adiga had been a part of the investigations and had put in sincere efforts in conducting the joining experiments and characterisation of the joints. The help received from other colleagues in Materials Group is gratefully acknowledged.
References:
1. Z. Sun, R. Karppi, J. Mater. Process. Tech. 59(3) (1996) 257-267.
2. A. Joseph, S.K. Rai, T. Jayakumar, N. Murugan,Int. J. Pres. Ves. Pip. 82 (9) (2005) 700-705.
3. V. Srikanth, A. Laik, G.K. Dey, Mater. Des., 126(2017) 141-154.
4. G. Perona, R. Sesini, W. Nicodemi, R. Zoja, J.Nucl. Mater. 18 (3) (1966) 278-291.
5. A. Shapiro and A. Rabinkin, Weld. J., 83 (2003)36–43.
6. S. Kundu, M. Ghosh, A. Laik, K. Bhanumurthy,G.B. Kale, S. Chatterjee, Mater. Sci. Eng. A,407 (2005) 36-43.
7. M.M. Cheepu, V. Muthupandi, S. Loganathan,Mater. Sci. Forum, 710 (2012) 620-25.
8. A. Fiji, T.H. North, K. Ameyama, M. Futamata,Mater. Sci. Technol., 8(1992) 219-35.
9. U.K. Mudali, B.M.A. Rao, K. Shanmugam, R.Natarajan, B. Raj, J. Nucl. Mater., 321 (2003)40-48.
10. B. Raj, U.K. Mudali, Prog. Nucl. Energy, 48(2006), 283-313.
11. A. Laik, A. A. Shirzadi, R. Tewari, AnishKumar, T. Jayakumar, G. K. Dey, Metall.Mater. Trans. A, 44A (2013) 2212-2225.
12. A. Laik, A. A. Shirzadi, G. Sharma, R. Tewari,T. Jayakumar, G. K. Dey, Metall. Mater.Trans. A, 46A (2015) 771-78.
76
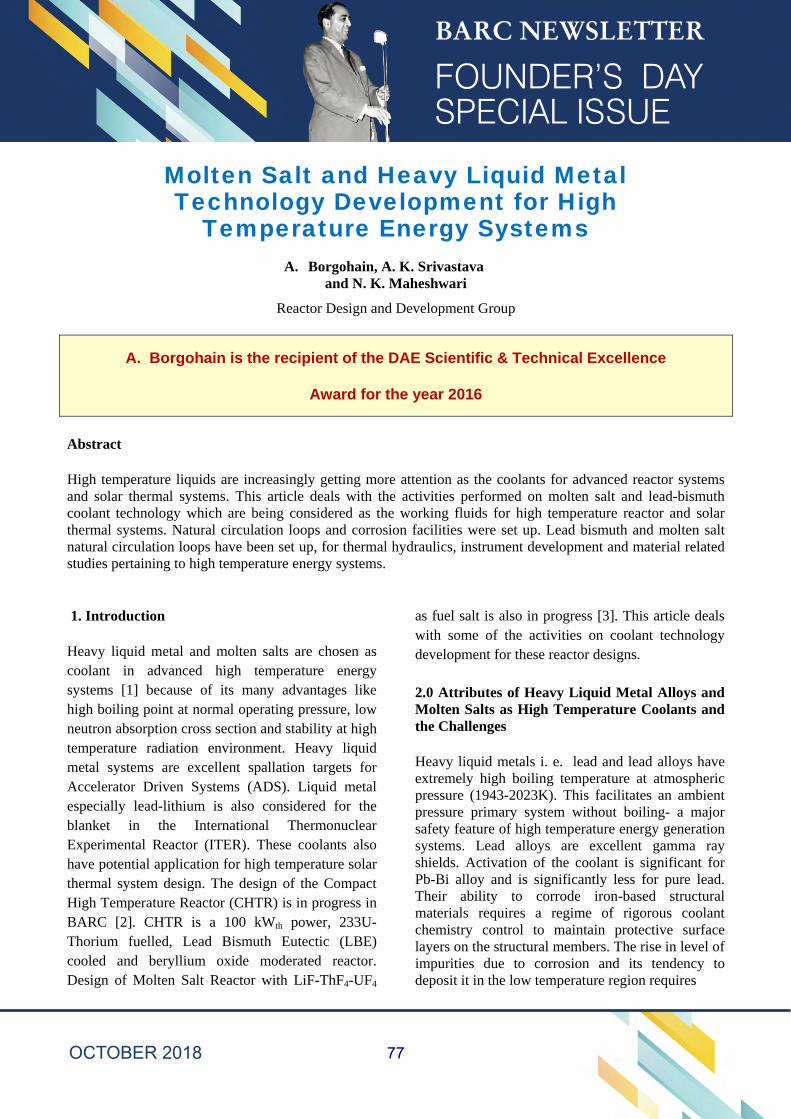
Molten Salt and Heavy Liquid Metal Technology Development for High
Temperature Energy Systems A. Borgohain, A. K. Srivastava
and N. K. Maheshwari
Reactor Design and Development Group
A. Borgohain is the recipient of the DAE Scientific & Technical Excellence
Award for the year 2016
Abstract
High temperature liquids are increasingly getting more attention as the coolants for advanced reactor systems and solar thermal systems. This article deals with the activities performed on molten salt and lead-bismuth coolant technology which are being considered as the working fluids for high temperature reactor and solar thermal systems. Natural circulation loops and corrosion facilities were set up. Lead bismuth and molten salt natural circulation loops have been set up, for thermal hydraulics, instrument development and material related studies pertaining to high temperature energy systems.
1. Introduction
Heavy liquid metal and molten salts are chosen as coolant in advanced high temperature energy systems [1] because of its many advantages like high boiling point at normal operating pressure, low neutron absorption cross section and stability at high temperature radiation environment. Heavy liquid metal systems are excellent spallation targets for Accelerator Driven Systems (ADS). Liquid metal especially lead-lithium is also considered for the blanket in the International Thermonuclear Experimental Reactor (ITER). These coolants also have potential application for high temperature solar thermal system design. The design of the Compact High Temperature Reactor (CHTR) is in progress in BARC [2]. CHTR is a 100 kWth power, 233U-Thorium fuelled, Lead Bismuth Eutectic (LBE) cooled and beryllium oxide moderated reactor. Design of Molten Salt Reactor with LiF-ThF4-UF4
as fuel salt is also in progress [3]. This article deals with some of the activities on coolant technology development for these reactor designs.
2.0 Attributes of Heavy Liquid Metal Alloys and Molten Salts as High Temperature Coolants and the Challenges
Heavy liquid metals i. e. lead and lead alloys have extremely high boiling temperature at atmospheric pressure (1943-2023K). This facilitates an ambient pressure primary system without boiling- a major safety feature of high temperature energy generation systems. Lead alloys are excellent gamma ray shields. Activation of the coolant is significant for Pb-Bi alloy and is significantly less for pure lead. Their ability to corrode iron-based structural materials requires a regime of rigorous coolant chemistry control to maintain protective surface layers on the structural members. The rise in level of impurities due to corrosion and its tendency to deposit it in the low temperature region requires
77
Table 1. Major Parameters of the High Temperature Coolant loops
Sl No
Major Parameters
Loops
LML KTL MSNCL MAFL
1 Working fluid LBE LBE KNO3-NaNO3 (60-40 wt%)
Eutectic mixture of LiF-ThF4
2 Max. Operating temperature (o C)
500 1100 550 750
3 Power (kW) 6 2 3 1
4 Line size and height (mm)
15NB/ 3500 15 NB/2500 15 NB/ 3500 15 NB/ 1200
continuous filtration in the coolant circuit. In Lead Bismuth Eutectic (LBE), the generation of radioactive polonium (Po-210, t1/2=138.3 days) which is very toxic and troublesome in the event of leakage owing to its tendency to scatter through the available volume. Technologies have been developed somewhere for effective removal of polonium from contaminated surfaces and from the atmosphere.
Like heavy liquid metals, molten salts are also used as the coolant for high temperature applications due to its good thermo-physical properties. Nitrate based salts are widely used in solar thermal power plants as heat transfer medium and thermal storage material. The inertness to air and moisture compared to other high temperature liquids and low cost make the nitrate salt as popular for solar application. Fluoride based salts are preferred in molten salt reactor systems for its good neutronic and thermo-physical properties at high temperature. Good solubility of nuclear fuel elements in fluoride salt is the major reason for selecting it as the circulating medium in liquid fuel reactor systems. But the fluoride salts are corrosive in presence of impurities like moisture, oxides, etc. Effective redox control is required for molten fluoride salts, to reduce the corrosion rate.
The liquid metal systems and molten salt require measurement technologies especially adapted to
them. Instrumentation for measurement of different parameters like dissolved oxygen concentration, pressure drop and low flow rate at high temperature are required to be developed.
4.0 Activities on LBE and Molten Salts
4.1 High temperature test loops
The experimental studies on the natural circulation behaviour of these high temperature coolants are very limited. Natural circulation studies in different coolants were carried out in four experimental loops. Two liquid metal natural circulation loops i.e. Liquid Metal Loop (LML) and Kilo Temperature Loop (KTL) were commissioned in BARC for thermal hydraulic analysis, instrumentation testing/development and material compatibility related studies at high temperature. Lead Bismuth Eutectic (LBE) was used as the working fluid. High temperature instrumentations like level sensor, oxygen sensor, etc. are developed for application in LBE environment. Online chemistry control technique was developed and implemented in the loop for safe operation of the loops. For molten salt related studies, two molten salt loops were made: Molten Salt Natural Circulation Loop (MSNCL) and Molten Active Fluoride Salt Loop (MAFL). Since MAFL contains ThF4 based salt, the radiation dose rate mapping was carried out before operating the loop [4]. Table 1 gives the brief about the natural circulation loops discussed in the paper.
78
T1cwhep
SKrsLthnth
F
F
The schemati1. In LML, ecarried out wwith air and heat exchanexperimentalpower levels.
Similarly thKTL, MSNCrange of tempsteady state nLML and KThe data. Fig
natural circuheoretical co
Fig 2: Compar
8.50
102
103
104
105
Re ss
Cor KTL LML
(a)
Fig 1. Schema
ic of all the fexperimentalwith heater pwater as thenger. Steadl studies are.
he natural cCL and MAF
perature andnatural circuTL and com
gure 3 showsulation expeodes for MAF
rison of corre
results KT
0x105 8.50x10⁷
Gr
rrrelation, (Vijayan, 2002L L
atic of high te
four loops arl natural circpower levelse secondary dy state e carried o
circulation eL were carri
d power. Figuulation exper
mparison of cs the results eriments andFL.
elation with th
TL and LML.
8.50x10⁹ 8.50x
r/NG
2)
(b)
emperature l
re shown in culation studs varying frcoolants of and transiut at differ
experiments ied out for wure 2 shows rimental datacorrelation w
of steady std prediction
he experimen
x1011 8.50x1
)
loops (a) LML
Fig dies rom the
ient rent
in wide
the a of with tate
of
ntal
F
4.De
Thcoaredesucexanbode
L, (b) KTL, (
ig 3: Steady sand comp
.2 Instruevelopment
he developmmponents like essential fsign. The hiccessfully opchangers ared water in s
oth discrete veloped and
(c)
(c) MSNCL a
state natural cparison with t
umentation
ment and teske heat exchfor high temigh temperatperated in Le also develecondary sid
and continsuccessfully
and (d) MAFL
circulation resheoretical pre
and
ting of highhanger, pumpmperature coture valves aLBE loops. Dloped and tede [5]. In insnuous level y used, [6].
L
sults of MAFLedictions
Componen
h temperaturps and valveoolant systemare tested anDifferent heaested with astrumentation
sensors ar
(d)
L
nt
re es m nd at
air n, re
79
Fig. 4 In-house developed oxygen sensor Fig. 5 Variation of temperature and EMF with time
An oxygen sensor was developed to measure dissolved oxygen level in LBE. The oxygen sensor consists of a one-end closed Yttria Stabilized Zirconia (YSZ) tube as solid electrolyte. Bismuth and Bismuth oxide is used as reference electrode. The sensor has been tested in a separate test set up [7] before installation in the loop. Figure 4 shows the oxygen sensor used in the loop. Figure 5 shows the variation of emf of the sensor during operation of the loop.
4.2 Molten salt preparation and characterisation
Preparation of Nitrate salts and FLiNaK (Fluorides of Lithium Sodium and Potassium) salt was done by mixing the powders of individual components in required proportion in an inert medium and melting with controlled heating. To prepare the eutectic mixtures of LiF-ThF4 and LiF-ThF4-UF4 salts, special procedure was to be developed by removing the moisture from the salt systematically. The procedure was developed in collaboration with different groups within BARC. The procedure is briefed by Srivastava et al. [8]. The chemical characterisation of the salt was done in Chemical Engineering Group, BARC and thermo physical property evaluation is done in Chemistry Division of BARC. Figure 6 shows mixture ThF4-LiF4 salt prepared for MAFL operation and corrosion studies. Figure 7 shows the heat capacity of the LiF-ThF4-UF4 salt evaluated by drop calorimetry [9].
Fig. 6 LiF-ThF4 salt prepared in BARC [8]
Fig. 7 Evaluation of Heat Capacity of LiF-ThF4-UF4 salt [9]
0 5000 10000 15000 20000 25000200
250
300
350
400
450
500
EMF
Temperature (oC)
EM
F (
mV
),
Ar+H2
gas injection
Te
mp
era
ture
(o C
)Time (sec)
200 300 400 500 600 700 800 900
200
400
600
800
HT-H
298
(J/
g)
T /°C
(liquid)
H = 107 kJ/g
(solid)
LiF-78 mole %ThF4- 20 mole %UF4-2 mole %
Fuel Salt
T(melting) = 550°C
80
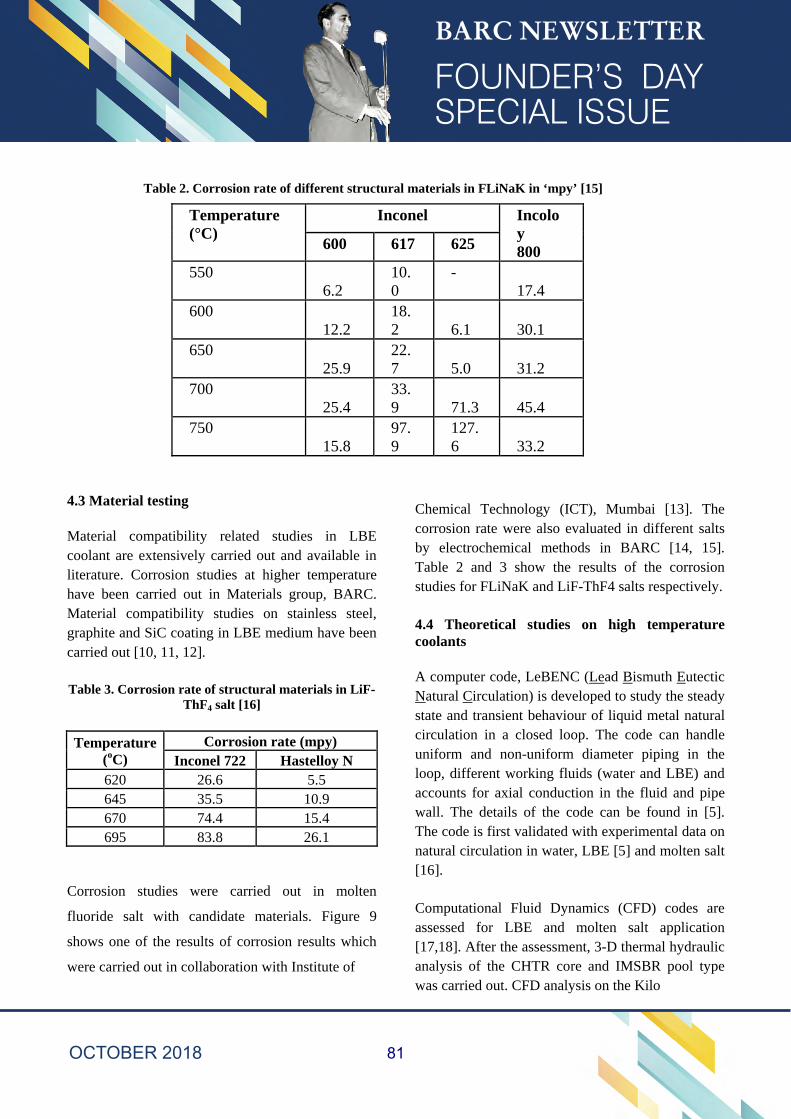
Table 2. Corrosion rate of different structural materials in FLiNaK in ‘mpy’ [15]
Temperature (°C)
Inconel Incoloy 800 600 617 625
550 6.2
10.0
- 17.4
600 12.2
18.2 6.1 30.1
650 25.9
22.7 5.0 31.2
700 25.4
33.9 71.3 45.4
750 15.8
97.9
127.6 33.2
4.3 Material testing
Material compatibility related studies in LBE coolant are extensively carried out and available in literature. Corrosion studies at higher temperature have been carried out in Materials group, BARC. Material compatibility studies on stainless steel, graphite and SiC coating in LBE medium have been carried out [10, 11, 12].
Table 3. Corrosion rate of structural materials in LiF-ThF4 salt [16]
Temperature (oC)
Corrosion rate (mpy) Inconel 722 Hastelloy N
620 26.6 5.5 645 35.5 10.9 670 74.4 15.4 695 83.8 26.1
Corrosion studies were carried out in molten
fluoride salt with candidate materials. Figure 9
shows one of the results of corrosion results which
were carried out in collaboration with Institute of
Chemical Technology (ICT), Mumbai [13]. The corrosion rate were also evaluated in different salts by electrochemical methods in BARC [14, 15]. Table 2 and 3 show the results of the corrosion studies for FLiNaK and LiF-ThF4 salts respectively.
4.4 Theoretical studies on high temperature coolants
A computer code, LeBENC (Lead Bismuth Eutectic Natural Circulation) is developed to study the steady state and transient behaviour of liquid metal natural circulation in a closed loop. The code can handle uniform and non-uniform diameter piping in the loop, different working fluids (water and LBE) and accounts for axial conduction in the fluid and pipe wall. The details of the code can be found in [5]. The code is first validated with experimental data on natural circulation in water, LBE [5] and molten salt [16].
Computational Fluid Dynamics (CFD) codes are assessed for LBE and molten salt application [17,18]. After the assessment, 3-D thermal hydraulic analysis of the CHTR core and IMSBR pool type was carried out. CFD analysis on the Kilo
81
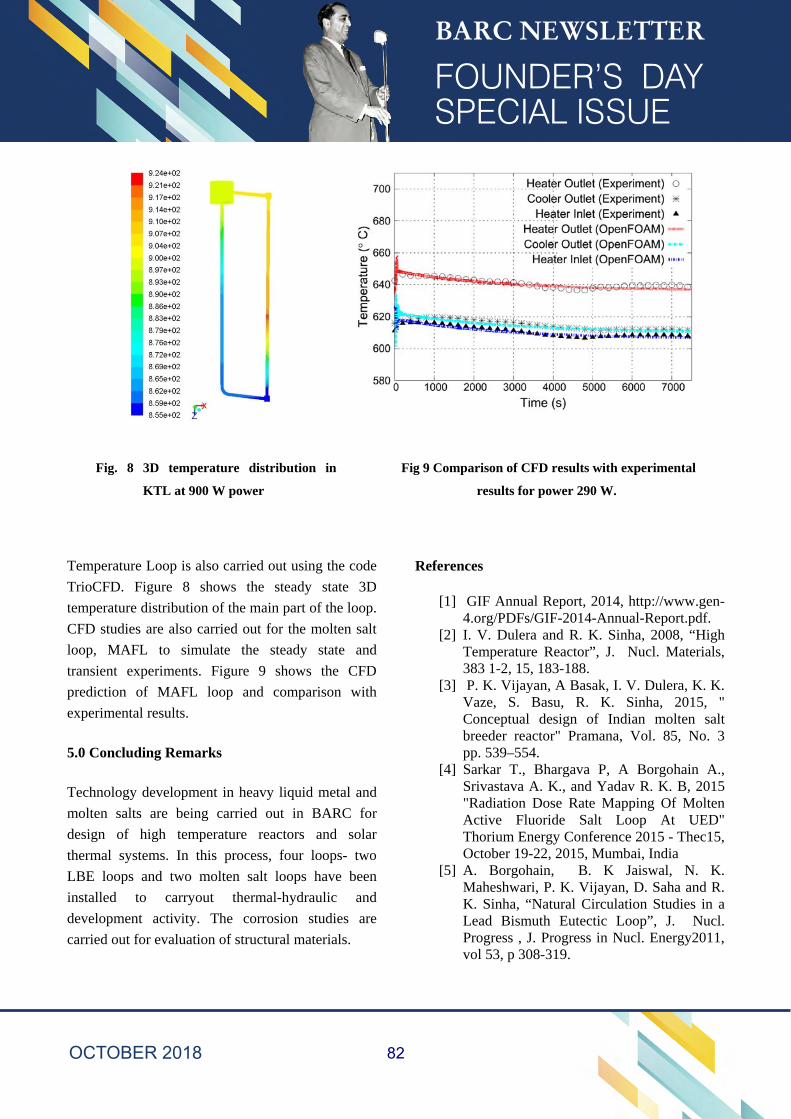
Fig. 8 3D temperature distribution in
KTL at 900 W power
Fig 9 Comparison of CFD results with experimental
results for power 290 W.
Temperature Loop is also carried out using the code
TrioCFD. Figure 8 shows the steady state 3D
temperature distribution of the main part of the loop.
CFD studies are also carried out for the molten salt
loop, MAFL to simulate the steady state and
transient experiments. Figure 9 shows the CFD
prediction of MAFL loop and comparison with
experimental results.
5.0 Concluding Remarks
Technology development in heavy liquid metal and
molten salts are being carried out in BARC for
design of high temperature reactors and solar
thermal systems. In this process, four loops- two
LBE loops and two molten salt loops have been
installed to carryout thermal-hydraulic and
development activity. The corrosion studies are
carried out for evaluation of structural materials.
References
[1] GIF Annual Report, 2014, http://www.gen-4.org/PDFs/GIF-2014-Annual-Report.pdf.
[2] I. V. Dulera and R. K. Sinha, 2008, “High Temperature Reactor”, J. Nucl. Materials, 383 1-2, 15, 183-188.
[3] P. K. Vijayan, A Basak, I. V. Dulera, K. K. Vaze, S. Basu, R. K. Sinha, 2015, " Conceptual design of Indian molten salt breeder reactor" Pramana, Vol. 85, No. 3 pp. 539–554.
[4] Sarkar T., Bhargava P, A Borgohain A., Srivastava A. K., and Yadav R. K. B, 2015 "Radiation Dose Rate Mapping Of Molten Active Fluoride Salt Loop At UED" Thorium Energy Conference 2015 - Thec15, October 19-22, 2015, Mumbai, India
[5] A. Borgohain, B. K Jaiswal, N. K. Maheshwari, P. K. Vijayan, D. Saha and R. K. Sinha, “Natural Circulation Studies in a Lead Bismuth Eutectic Loop”, J. Nucl. Progress , J. Progress in Nucl. Energy2011, vol 53, p 308-319.
82
[6] S. S. Jana, A. Borgohain, N.K. Maheshwari and P. K. Vijayan, “Development of level measuring sensor for high temperature applications”, Symposium on Advanced Measurements Techniques & instrumentation (SMTI-2011), Mumbai, Feb 02-04, 2011.
[7] A. Borgohain, N. K. Maheshwari, P. K. Vijayan, D. Saha and R. K. Sinha, 2008, “Development of High Temperature Oxygen Sensor for Lead Bismuth Eutectic”, Proc. Discussion meet on Electro Analytical Techniques & their applications”, ISEAC Munnar, Kerala, Feb 25-28.
[8] A. K. Srivastava, R. Chouhan, A. Borgohain, S. S. Jana, N. K.Maheshwari, D.S. Pilkhwal, A. Rama Rao, K. N. Hareendhran, S. Chowdhury, K. B. Modi, S. K. Raut and S. C. Parida, 2017, An experimental and theoretical study to support development of molten salt breeder reactor, Journal of Nuclear Engineering and Radiation Science, Journal of Nuclear Engineering and Radiation Science, Vol. 3 / 031007-1.
[9] S. Phapale, A N. Shirsat, S. Kolay, M. Basu, R. Mishra, A. Borgohain and A. K. Srivastava, K. N. Hareendran and R. Kumar, "Determination of Eutectic Composition and Heat Capacities of Fuel Salt (LiF-ThF4-UF4) and Blanket Salt (LiF-ThF4) Mixtures", Thorium Energy Conference 2015, October 12- 15, 2015, Mumbai, India.
[10] C.M. Das and R. Fotedar, “Experiences on Lead-Bismuth Loops”, 2008, Workshop on Steel and Fabrication Technologies for Fusion Programme (WSFT-08), Institute for Plasma Research, Ahmedabad.
[11] A. K. Sengupta, R. K. Bhagat, A. Laik, G.B. Kale, T. Jarvis, S. Majumdar and H.S. Kamath’ 2006, “Out of Pile Chemical Compatibility of Pb-Bi Eutectic Alloy with Gaphite”, International Journal for Materials Research, 97, 834-837.
[12] P. Chakraborty, R.K. Fotedar and N. Krishnamurthy and P. K. Pradhan, "Compatibility of Silicon Carbide with
Lead-Bismuth Eutectic - The Effect of Oxygen Ingress", BARC Newsletter, Founder’s Day Special Issue October 2013.
[13] C. S. Sona, B. D. Gajbhiye, P. V. Hule, A. W. Patwardhan, C. S. Mathpati, A. Borgohain and N. K. Maheshwari, “High temperature corrosion studies in molten salt-FLiNaK”, J. Corrosion Engineering, Science and Technology Vol 49, No 4, (2014),287-295.
[14] S.J. Keny, V.K. Gupta, A.G. Kumbhar, S. Rangarajan, M. R. Daitkar, N.K. Maheshwari, P.K. Vijayan, B.N. Jagatap, Corrosion aspects of compatible alloys in molten salt (FLiNaK) medium for Indian MSR program in the temperature range of 550-750 oC using electrochemical technique, Thorium Energy Conference, October 12-15, 2015, Mumbai, India.
[15] K. K. Bairwa, V. S. Tripathi, S. J. Keny, D. B. Naik, A. K. Srivastava, A. Borgohain, K. B. Modi and R. Kumar, Electrochemical Corrosion Evaluation of Structural Materials in the Blanket Salt of Indian Molten Salt Reactor (IMSR), ISMC2018 conference, July, 2018.
[16] A.K. Srivastava, A. Borgohain, S.S. Jana, R.K. Bagul, R.R. Singh, N.K. Maheshwari, D.G. Belokar and P.K. Vijayan, 2014, "Experimental and Theoretical Studies in Molten Salt Natural Circulation Loop (MSNCL)" BARC Report - BARC/2014/E/016.
[17] A. Borgohain, B. K Jaiswal, N. K. Maheshwari, P. K. Vijayan, D. Saha and R. K. Sinha, 2011, “CFD Analysis on Heat Transfer in Low Prandtl Number Fluid Flows”, 14th International Topical Meeting on Nuclear Reactor Thermal hydraulics, NURETH-14, September 25-30, 2011,Toronto, Ontario, Canada.
[18] A.K.Srivastava, A.M.Vaidya, N.K.Maheshwari, P.K.Vijayan, 2013, Heat transfer and pressure drop characteristics of molten fluoride salt in circular pipe, Applied Thermal Engineering, Volume 61, Issue 2, Pages 198-205.
83
Founder’s Day Special Issue October2018 8 NEWSLETTER
Development of Electromagnetic Manufacturing Equipment
P.C. SarojPulse Power System Section,
Accelerator & Pulse Power Division
P.C. Saroj is the recipient of the DAE Scientific & Technical Excellence
Award for the year 2016
Abstract:
Accelerator and Pulse Power Division, BARC has taken up the indigenous design and development of Electromagnetic Manufacturing Equipment (EME) for cold electromagnetic welding of D9 and SS316L(N) plug with helium leak rate better than 4 x 10⁻⁹ mbar- l/s for Prototype Fast Breeder Reactor (PFBR). In magnetic pulse welding process forming and welding are achieved without physical contact between tool and job piece, and hence has merit over the conventional processes such as brazing and TIG welding. EME with energy 40 kJ/70 kJ/180 kJ, have been designed and developed using indigenous components and have been successfully commissioned for this purpose. Other objective is to empower Indian engineering industry and research institute with the technology of the energy storage capacitor bank and other accessories so that they can deploy this technology widely for industrial and research applications. This article presents the design aspects and challenges, developed in house energy storage capacitor bank details, test results and – EM weldments results thus achieved.
Introduction:
Electromagnetic Manufacturing process is technology for shaping and joining of metals based on electromagnetic Forming and Welding as shown in Fig. 1. It is a non- contact technique which involves acceleration of metal forms (sheets or tubes) with the help of electromagnetic forces, causing them to impact with each other at high velocity. This techniques is based on Lorentz force to achieve the required goal. The force is generated when a high voltage charged capacitor bank discharges through coil placed in proximity of work
piece. The force developed is on the account of interaction of induced current in the work piece with magnetic field produced by the coil. This sophisticated technique has many advantages such as reproducibility, no tool mark, high strength joint, high speed of operation, ease of automation and require no preparatory procedures etc. Since the bond is achieved by impact/pressure, this method is ideally suited for joining/welding of dissimilar metals [13] with large difference in their melting points.
84
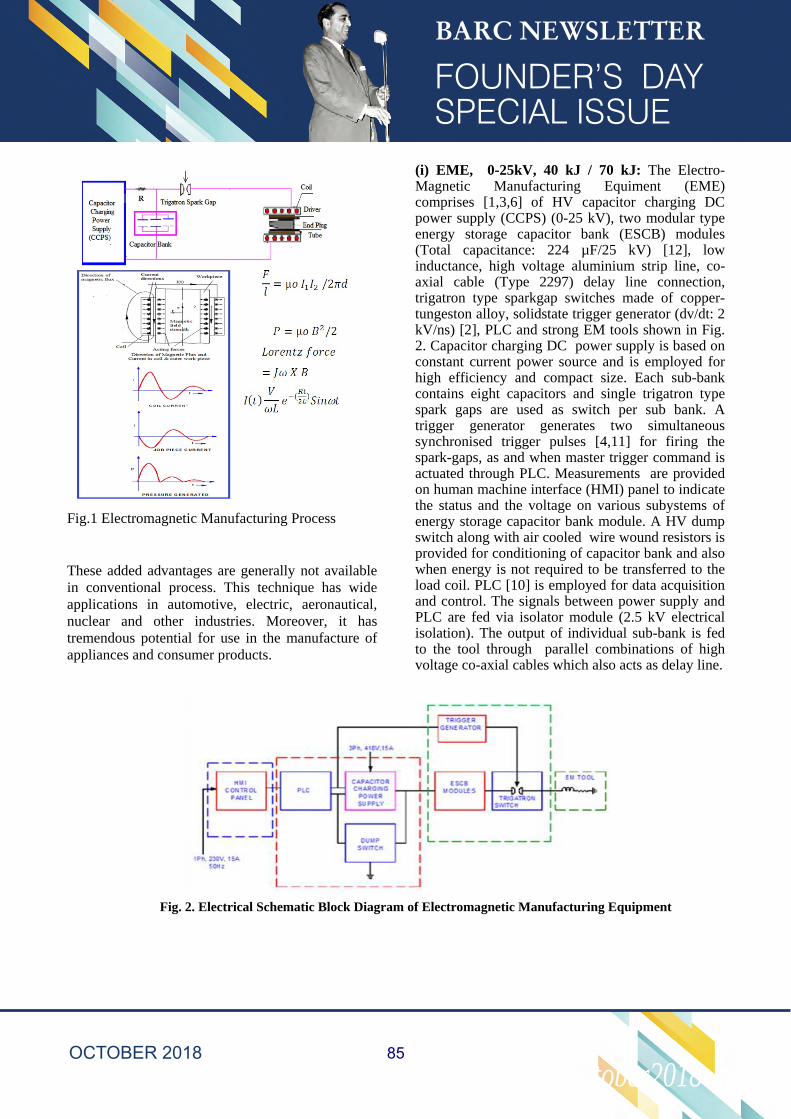
Founder’s Day Special Issue October2018 8 NEWSLETTER
Fig.1 Electromagnetic Manufacturing Process
These added advantages are generally not available in conventional process. This technique has wide applications in automotive, electric, aeronautical, nuclear and other industries. Moreover, it has tremendous potential for use in the manufacture of appliances and consumer products.
(i) EME, 0-25kV, 40 kJ / 70 kJ: The Electro-Magnetic Manufacturing Equiment (EME)comprises [1,3,6] of HV capacitor charging DCpower supply (CCPS) (0-25 kV), two modular typeenergy storage capacitor bank (ESCB) modules(Total capacitance: 224 µF/25 kV) [12], lowinductance, high voltage aluminium strip line, co-axial cable (Type 2297) delay line connection,trigatron type sparkgap switches made of copper-tungeston alloy, solidstate trigger generator (dv/dt: 2kV/ns) [2], PLC and strong EM tools shown in Fig.2. Capacitor charging DC power supply is based onconstant current power source and is employed forhigh efficiency and compact size. Each sub-bankcontains eight capacitors and single trigatron typespark gaps are used as switch per sub bank. Atrigger generator generates two simultaneoussynchronised trigger pulses [4,11] for firing thespark-gaps, as and when master trigger command isactuated through PLC. Measurements are providedon human machine interface (HMI) panel to indicatethe status and the voltage on various subystems ofenergy storage capacitor bank module. A HV dumpswitch along with air cooled wire wound resistors isprovided for conditioning of capacitor bank and alsowhen energy is not required to be transferred to theload coil. PLC [10] is employed for data acquisitionand control. The signals between power supply andPLC are fed via isolator module (2.5 kV electricalisolation). The output of individual sub-bank is fedto the tool through parallel combinations of highvoltage co-axial cables which also acts as delay line.
Fig. 2. Electrical Schematic Block Diagram of Electromagnetic Manufacturing Equipment
85
Founder’s Day Special Issue October2018 8 NEWSLETTER
All the racks are properly grounded from safety consideration against electrical shocks, equipment failure and are EMC compitible. Single point grounding topology is adopted to reduce the ground loop and associated electromagnetic interference. All high voltage racks are made up of heavy gauge metal (generally MS) from safety point of view also the doors and panels have been bonded to the cabinet with heavy duty straps. Detail studies and measurements have been carried out to evaluate the trend in Acoustic Noise impacts [7] in relation to the various energy levels employed for the EM process and evaluation of frequency spectra for high frequency components of noise. The impact sound was found to be more for higher energies but it never exceeded the limit of 140 dB, as stipulated by regulatory bodies. The 70kJ/ 40kJ EME technology has been transferred to M/s Artech Welders Pvt. Ltd., Pune and to M/s ECIL, Hyderabad through TTCD, BARC and work contract route, respectively. The EME has been sucessfully commissioned by them at their factory. Discharge current waveform under short circuit condition and photograph of 40kJ, 70kJ EME are given in Fig. 3, 4& 5.
Fig. 3. Short circuit current waveform of 70kJ (Vc: 13kV, Isc: 255k A, fsc: 21.8kHz)
Fig. 4. Photograph of 40 kJ EME
The specifications of the 40 kJ/70 kJ, EME are given in table- 1.
Table1. Specifications of 40 kJ/70 kJ, EME
Fig. 5. Photograph of 70 kJ EME
86
ADMIN
New Stamp
Founder’s Day Special Issue October2018 8 NEWSLETTER
(ii). EME, 0-75kV, 180 kJ at IPR:
The EME at IPR, Gandhinagar consist of 4 sub banks, each comprising of 4 energy storage capacitors (4µF/75kV each) for high frequency operation. The frequency is selected such that the current skin depth in the job piece is less compared to job thickness. Under this condition appreciable amount of magnetic field is confined within the tube. The system has been tested up to 25kV, 600kA using single turn Maraging steel coil and several experiments have been conducted for EM welding of D9 tube to SS316L plug using multi-turn coils at IPR, Gandhinagar, Gujarat by APPD.
Each sub bank has its own trigatron pressurized spark gap switch mounted above the low inductance strip line of the sub bank assembly. In order to reduce the spark gap switch inductance and increase the charge handling capability, switches are triggered in parallel using a single trigger generator. For transits time isolation, six numbers of parallel; 2.5 m long, high voltage and high current discharge co-axial cables are used per sub- bank as shown in electrical schematic Fig. 6.. The parallel combinations of the delay line cables are used to further reduce the system inductance.
Fig. 6. Electrical Schematic of 75 kV, 180 kJ (Max.) EME
87
Founder’s Day Special Issue October2018 8 NEWSLETTER
The specifications of the 180 kJ, EME is given in Table 2.
Discharge current waveform are given below in Fig.7 indicating the current through sub banks and magnetic field.
The photograph of 180 kJ EME is shown below in Fig. 8 (a) and Fig. 8 (b). The photograph indicating energy storage capacitor bank, capacitor charging DC power supply, PLC unit and EM tool assembly.
Fig. 7. Charging Voltage: 20 kV, Current of 1 & 4: 264 kA (Yellow) 2 & 3: 240 kA (Green) Total current (blue): 504 kA, B field (Measured): 24 T, Frequency: 62 kHz
CCPS
PLC Control
Fig.8 (a) Photograph of Capacitor bank charging power supply & PLC unit
Tool
Cap. Bank
Fig. 8 (b) Photograph of 180 kJ energy storage capacitor bank and EM Tool
88
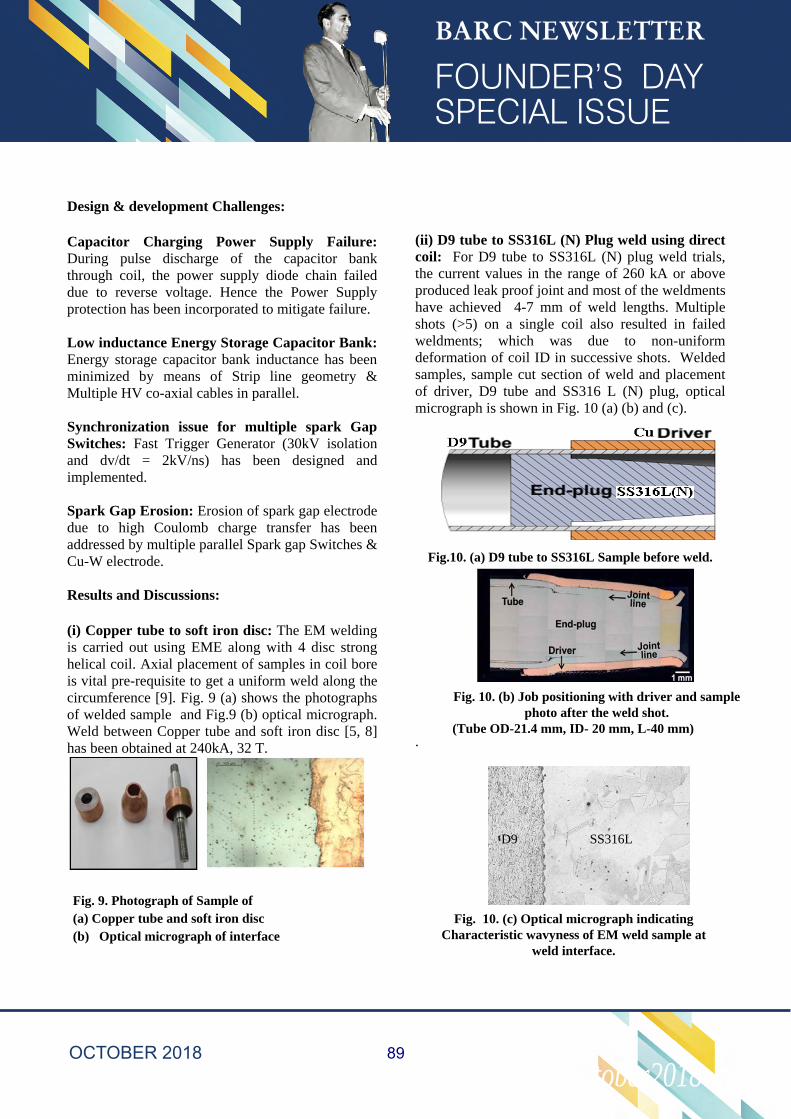
Founder’s Day Special Issue October2018 8 NEWSLETTER
Design & development Challenges:
Capacitor Charging Power Supply Failure: During pulse discharge of the capacitor bank through coil, the power supply diode chain failed due to reverse voltage. Hence the Power Supply protection has been incorporated to mitigate failure. Low inductance Energy Storage Capacitor Bank: Energy storage capacitor bank inductance has been minimized by means of Strip line geometry & Multiple HV co-axial cables in parallel. Synchronization issue for multiple spark Gap Switches: Fast Trigger Generator (30kV isolation and dv/dt = 2kV/ns) has been designed and implemented. Spark Gap Erosion: Erosion of spark gap electrode due to high Coulomb charge transfer has been addressed by multiple parallel Spark gap Switches & Cu-W electrode. Results and Discussions:
(i) Copper tube to soft iron disc: The EM welding is carried out using EME along with 4 disc strong helical coil. Axial placement of samples in coil bore is vital pre-requisite to get a uniform weld along the circumference [9]. Fig. 9 (a) shows the photographs of welded sample and Fig.9 (b) optical micrograph. Weld between Copper tube and soft iron disc [5, 8] has been obtained at 240kA, 32 T.
(ii) D9 tube to SS316L (N) Plug weld using direct coil: For D9 tube to SS316L (N) plug weld trials, the current values in the range of 260 kA or above produced leak proof joint and most of the weldments have achieved 4-7 mm of weld lengths. Multiple shots (>5) on a single coil also resulted in failed weldments; which was due to non-uniform deformation of coil ID in successive shots. Welded samples, sample cut section of weld and placement of driver, D9 tube and SS316 L (N) plug, optical micrograph is shown in Fig. 10 (a) (b) and (c).
Fig.10. (a) D9 tube to SS316L Sample before weld. .
D9 SS316L
Fig. 9. Photograph of Sample of (a) Copper tube and soft iron disc (b) Optical micrograph of interface
Fig. 10. (c) Optical micrograph indicating Characteristic wavyness of EM weld sample at
weld interface.
Fig. 10. (b) Job positioning with driver and sample photo after the weld shot.
(Tube OD-21.4 mm, ID- 20 mm, L-40 mm)
89
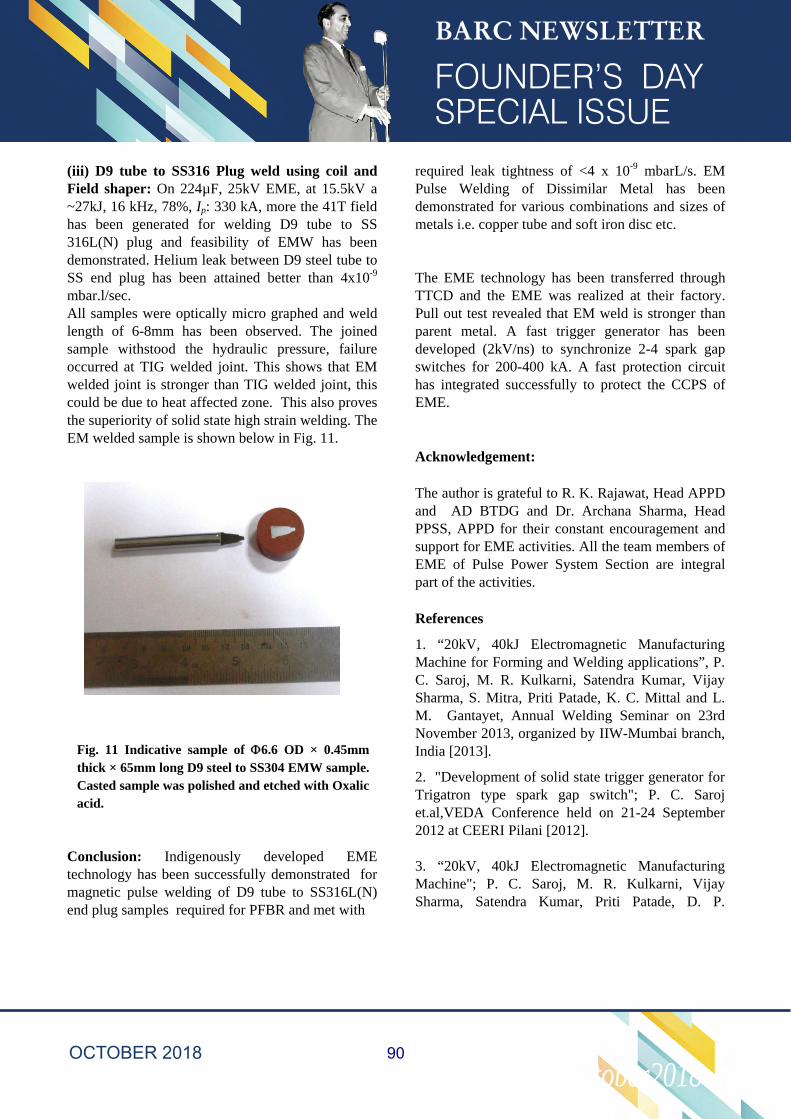
Founder’s Day Special Issue October2018 8 NEWSLETTER
(iii) D9 tube to SS316 Plug weld using coil and Field shaper: On 224µF, 25kV EME, at 15.5kV a ~27kJ, 16 kHz, 78%, Ip: 330 kA, more the 41T field has been generated for welding D9 tube to SS 316L(N) plug and feasibility of EMW has been demonstrated. Helium leak between D9 steel tube to SS end plug has been attained better than 4x10⁻⁹
mbar.l/sec. All samples were optically micro graphed and weld length of 6-8mm has been observed. The joined sample withstood the hydraulic pressure, failure occurred at TIG welded joint. This shows that EM welded joint is stronger than TIG welded joint, this could be due to heat affected zone. This also proves the superiority of solid state high strain welding. The EM welded sample is shown below in Fig. 11.
Conclusion: Indigenously developed EME technology has been successfully demonstrated for magnetic pulse welding of D9 tube to SS316L(N) end plug samples required for PFBR and met with
required leak tightness of <4 x 10⁻⁹ mbarL/s. EM Pulse Welding of Dissimilar Metal has been demonstrated for various combinations and sizes of metals i.e. copper tube and soft iron disc etc. The EME technology has been transferred through TTCD and the EME was realized at their factory. Pull out test revealed that EM weld is stronger than parent metal. A fast trigger generator has been developed (2kV/ns) to synchronize 2-4 spark gap switches for 200-400 kA. A fast protection circuit has integrated successfully to protect the CCPS of EME.
Acknowledgement:
The author is grateful to R. K. Rajawat, Head APPD and AD BTDG and Dr. Archana Sharma, Head PPSS, APPD for their constant encouragement and support for EME activities. All the team members of EME of Pulse Power System Section are integral part of the activities.
References
1. “20kV, 40kJ Electromagnetic Manufacturing Machine for Forming and Welding applications”, P. C. Saroj, M. R. Kulkarni, Satendra Kumar, Vijay Sharma, S. Mitra, Priti Patade, K. C. Mittal and L. M. Gantayet, Annual Welding Seminar on 23rd November 2013, organized by IIW-Mumbai branch, India [2013].
2. "Development of solid state trigger generator for Trigatron type spark gap switch"; P. C. Saroj et.al,VEDA Conference held on 21-24 September 2012 at CEERI Pilani [2012]. 3. “20kV, 40kJ Electromagnetic Manufacturing Machine"; P. C. Saroj, M. R. Kulkarni, Vijay Sharma, Satendra Kumar, Priti Patade, D. P.
Fig. 11 Indicative sample of 6.6 OD × 0.45mm thick × 65mm long D9 steel to SS304 EMW sample. Casted sample was polished and etched with Oxalic acid.
90
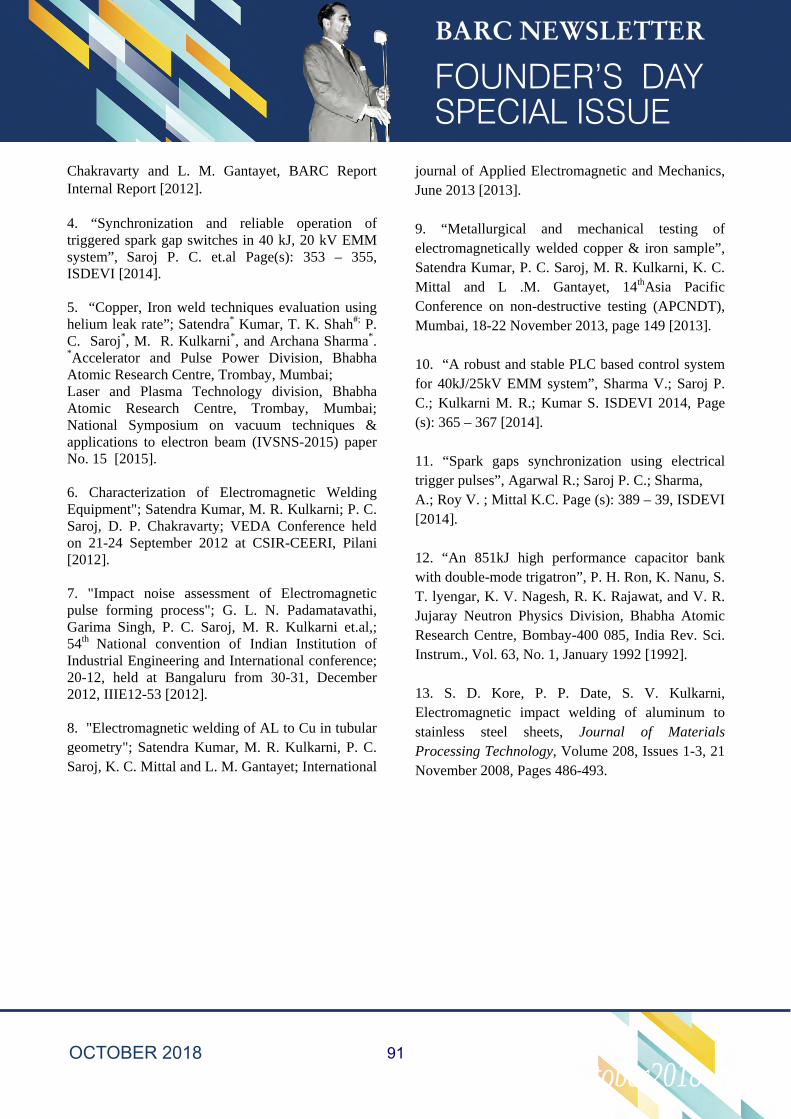
Founder’s Day Special Issue October2018 8 NEWSLETTER
Chakravarty and L. M. Gantayet, BARC Report Internal Report [2012]. 4. “Synchronization and reliable operation of triggered spark gap switches in 40 kJ, 20 kV EMM system”, Saroj P. C. et.al Page(s): 353 – 355, ISDEVI [2014]. 5. “Copper, Iron weld techniques evaluation using helium leak rate”; Satendra* Kumar, T. K. Shah#; P. C. Saroj*, M. R. Kulkarni*, and Archana Sharma*. *Accelerator and Pulse Power Division, Bhabha Atomic Research Centre, Trombay, Mumbai; Laser and Plasma Technology division, Bhabha Atomic Research Centre, Trombay, Mumbai; National Symposium on vacuum techniques & applications to electron beam (IVSNS-2015) paper No. 15 [2015]. 6. Characterization of Electromagnetic Welding Equipment"; Satendra Kumar, M. R. Kulkarni; P. C. Saroj, D. P. Chakravarty; VEDA Conference held on 21-24 September 2012 at CSIR-CEERI, Pilani [2012]. 7. "Impact noise assessment of Electromagnetic pulse forming process"; G. L. N. Padamatavathi, Garima Singh, P. C. Saroj, M. R. Kulkarni et.al,; 54th National convention of Indian Institution of Industrial Engineering and International conference; 20-12, held at Bangaluru from 30-31, December 2012, IIIE12-53 [2012]. 8. "Electromagnetic welding of AL to Cu in tubular geometry"; Satendra Kumar, M. R. Kulkarni, P. C. Saroj, K. C. Mittal and L. M. Gantayet; International
journal of Applied Electromagnetic and Mechanics, June 2013 [2013]. 9. “Metallurgical and mechanical testing of electromagnetically welded copper & iron sample”, Satendra Kumar, P. C. Saroj, M. R. Kulkarni, K. C. Mittal and L .M. Gantayet, 14thAsia Pacific Conference on non-destructive testing (APCNDT), Mumbai, 18-22 November 2013, page 149 [2013]. 10. “A robust and stable PLC based control system for 40kJ/25kV EMM system”, Sharma V.; Saroj P. C.; Kulkarni M. R.; Kumar S. ISDEVI 2014, Page (s): 365 – 367 [2014]. 11. “Spark gaps synchronization using electrical trigger pulses”, Agarwal R.; Saroj P. C.; Sharma, A.; Roy V. ; Mittal K.C. Page (s): 389 – 39, ISDEVI [2014]. 12. “An 851kJ high performance capacitor bank with double-mode trigatron”, P. H. Ron, K. Nanu, S. T. lyengar, K. V. Nagesh, R. K. Rajawat, and V. R. Jujaray Neutron Physics Division, Bhabha Atomic Research Centre, Bombay-400 085, India Rev. Sci. Instrum., Vol. 63, No. 1, January 1992 [1992]. 13. S. D. Kore, P. P. Date, S. V. Kulkarni, Electromagnetic impact welding of aluminum to stainless steel sheets, Journal of Materials Processing Technology, Volume 208, Issues 1-3, 21 November 2008, Pages 486-493.
91
Radiation Processed Functional Polymers For Societal Applications Virendra Kumar, Narender K. Goel, Nilanjal Misra,
Swarnima Rawat, Shubhangi A. Shelkar, Lalit Varshney
Radiation Technology Development Division
Abstract Radiation processing of polymers using ionizing radiation (gamma rays, electron beams, plasma) offers environment friendly, efficient and versatile tools for the bulk as well as surface modification of polymeric materials, for a range of target applications. Here we present some of our recent developments of radiation proces1sed polymeric materials for environmental and healthcare applications. Radiation grafted functional polymer adsorbents based treatment setups were designed and fabricated for the remediation of pollutants (dyes, toxic metal ions) from water bodies and tested on pilot scale. Robust and recyclable catalytic systems were also developed via immobilization of enzymes and metal nanoparticles on radiation grafted functional polymer supports. Antibacterial cotton fabric was another product developed via Gamma radiation induced grafting process.
1. Introduction Applications of polymers are manifold and cover a wide range of fields, from industry, healthcare, environment, sensors to agriculture. Although majority of the polymers exhibit good thermo-mechanical properties, their inert nature require certain modifications in their properties according to tailor-made specifications designed for newer target applications. Radiation technologies based on ionizing radiation (gamma rays, electron beams, plasma) offer environment friendly, efficient and versatile means for surface modification of polymeric materials, wherein new functionalities and novel characteristics can be imparted to polymers. Radiation grafting is an efficient surface modification process for existing polymers [1,2]. This article will cover some of our recent advances made in the field of design and fabrication of radiation grafted functional polymeric materials for environmental and healthcare applications.
1.1 Radiation processing of polymers
Radiation processing is a versatile tool for modification of bulk as well surface properties of polymers. Depending on the applications, mainly four processes are used for radiation processing of polymers, as presented in figure 1. i) Radiation grafting ii) Radiation curing, iii) Radiation crosslinking and iv) Radiation degradation. Radiation crosslinking and radiation degradation lead to bulk modification of polymers, whereas radiation grafting and radiation curing processes are used for surface modification of polymers. Based on these four processes, a large number of applications of radiation processed polymers have been generated, including industrial, environmental, healthcare and agricultural applications. However, this article will only cover some of the important applications of radiation grafting process.
Virendra Kumar is the recipient of the DAE Scientific & Technical Excellence
Award for the year 2016
92
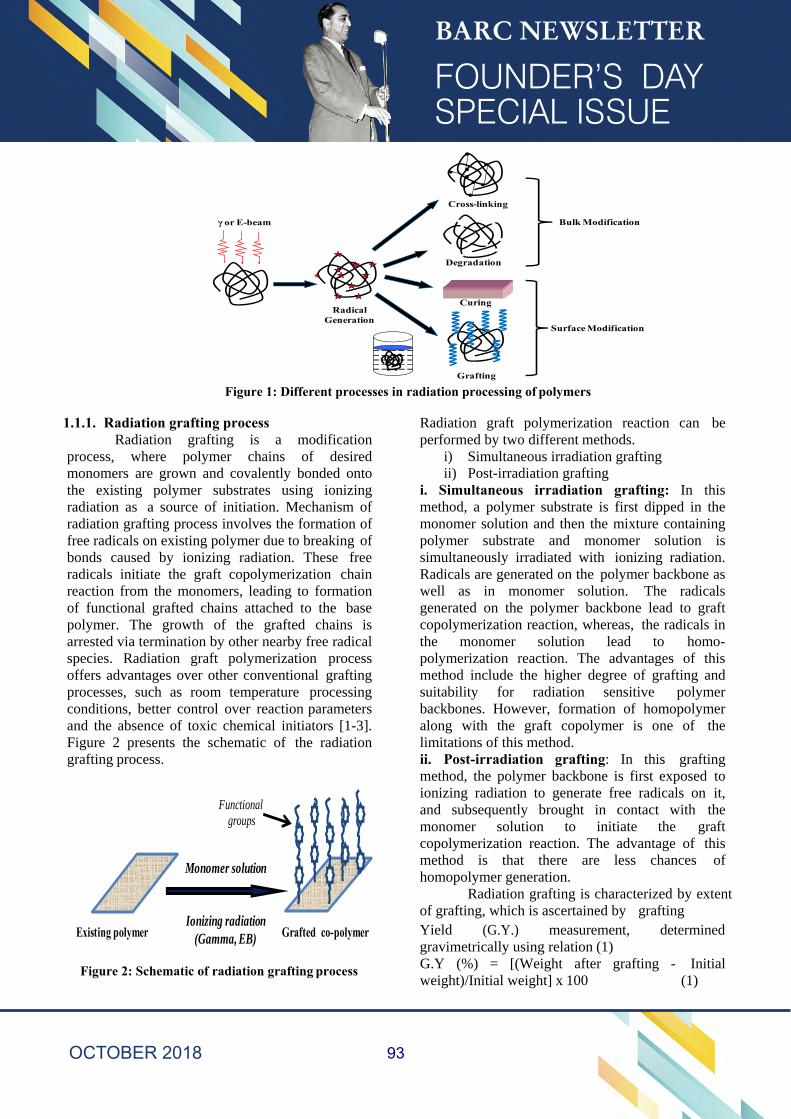
Figure 1: Different processes in radiation processing of polymers
1.1.1. Radiation grafting process Radiation grafting is a modification
process, where polymer chains of desired monomers are grown and covalently bonded onto the existing polymer substrates using ionizing radiation as a source of initiation. Mechanism of radiation grafting process involves the formation of free radicals on existing polymer due to breaking of bonds caused by ionizing radiation. These free radicals initiate the graft copolymerization chain reaction from the monomers, leading to formation of functional grafted chains attached to the base polymer. The growth of the grafted chains is arrested via termination by other nearby free radical species. Radiation graft polymerization process offers advantages over other conventional grafting processes, such as room temperature processing conditions, better control over reaction parameters and the absence of toxic chemical initiators [1-3]. Figure 2 presents the schematic of the radiation grafting process.
Radiation graft polymerization reaction can be performed by two different methods.
i) Simultaneous irradiation graftingii) Post-irradiation grafting
i. Simultaneous irradiation grafting: In thismethod, a polymer substrate is first dipped in themonomer solution and then the mixture containingpolymer substrate and monomer solution issimultaneously irradiated with ionizing radiation.Radicals are generated on the polymer backbone aswell as in monomer solution. The radicalsgenerated on the polymer backbone lead to graftcopolymerization reaction, whereas, the radicals inthe monomer solution lead to homo-polymerization reaction. The advantages of thismethod include the higher degree of grafting andsuitability for radiation sensitive polymerbackbones. However, formation of homopolymeralong with the graft copolymer is one of thelimitations of this method.ii. Post-irradiation grafting: In this graftingmethod, the polymer backbone is first exposed toionizing radiation to generate free radicals on it,and subsequently brought in contact with themonomer solution to initiate the graftcopolymerization reaction. The advantage of thismethod is that there are less chances ofhomopolymer generation.
Radiation grafting is characterized by extent of grafting, which is ascertained by grafting Yield (G.Y.) measurement, determined gravimetrically using relation (1)
Figure 2: Schematic of radiation grafting process G.Y (%) = [(Weight after grafting - Initialweight)/Initial weight] x 100 (1)
Polymer
Radical Generation
Degradation
Cross-linking
γ or E-beam Bulk Modification
Surface Modification
Grafting
Curing
Existing polymer Grafted co-polymer
Monomer solution
Ionizing radiation(Gamma, EB)
Functional groups
93
2. Applications of radiation grafted functionalpolymers
2.1 Functional adsorbents for remediation of pollutants from water
2.1.1. Treatment of dye waste water: Uncontrolled disposal of coloured dyes from textiles, leather and printing industries into water streams adversely affects the quality of water bodies. This causes environmental pollution and poses serious health risks to human being as well as aquatic life [4,5]. Of late, increased public concern and strict regulation enforcement have forced these industries to treat dye effluents before discharging into the environment, and to look for more efficient and economically viable options to treat these effluents. Physico-chemical methods, such as adsorption, coagulation, precipitation, filtration, ozone treatment, chemical oxidation, photo-catalytic processes, biological treatment and ionizing radiation degradation have been proposed for dye effluent treatment [6]. However, adsorption has been found to be a comparatively simple, effective and efficient process that avoids generation of toxic degradation by- products.
We have developed a range of functional adsorbents (cationic and anionic) via radiation grafting process, which were employed for
removal of acidic and basic dyes from textile waste water systems. For example, Quaternary ammonium groups containing monomers, such as 2- (Methacryloyloxy) ethyltrimethylammonium chloride and Vinylbenzyltrimethylammonium chloride were used for fabrication of cationic type of adsorbents using cotton cellulose fabric (low cost and abundant polymer) as the base polymer, for removal of acid dyes from textile dye waste water [7,8]. On the other hand, Sodium styrene sulfonate and acrylic acid were used to fabricate anionic type of cellulosic adsorbents for removal of basic dyes from wastewater [9]. These adsorbents were tested for removal of textile dyes from simulated and actual dye wastewater in batch as well as column process. Equilibrium adsorption studies and adsorption kinetic were studied and analyzed using different adsorption isotherms and kinetic models. Breakthrough curves were established for textile dyes using lab scale fixed bed column system packed with radiation grafted cellulose adsorbent (Figure 3). Radiation grafted cellulosic adsorbents based portable treatment setups and a pilot scale facility have been designed and fabricated at RTDD, BARC for the treatment of textile d y e waste water (Figure 4).
Figure 3. Schematic of fixed bed packed column system and breakthrough curve for Basic Red 29 (BR29) dye
P‐1
Pump
Bed packed Column
Feed solution
Fraction collector
Spectrophotometer
Adsorbent
0 1000 2000 3000
0.0
0.5
1.0
1.5Elution
Washing
Treated Volume (mL)
Cta
/C0
Adsorption
0
5
10
15
20
25
Cte /C
0
Breakthrough curve(a)
94
Figure 4. Radiation grafted cellulose based pilot plant waste water treatment setup
2.1.2. Functional adsorbents for removal of toxic metal ions: Ground water pollution severely affects soil, plants, humans and animals, and poses serious health and environmental issues. In some parts of India, ground water has been reported to be contaminated with toxic metal ions, such as Arsenic, Chromium, Uranium, Cadmium, etc. [10]. Polymeric adsorbents, functionalized with suitable chemical groups (ionic or chelating), in the forms of resins, beads, gels, or membranes have potential applications in removal of these metal ions from water bodies. For example, Amidoxime (AO) functionalized polymer adsorbent was found to be quite suitable for uranium removal [11].
We have developed Amidoxime-g-polypropylene (AO-g-PP) adsorbent via electron beam induced post irradiation grafting process, where polyacrylonitrile chains were grafted onto non-woven poly(propylene) matrices, followed by chemical conversion of nitrile groups to amidoxime groups by reaction with hydroxylamine under optimized conditions, and subsequently, employed for recovery of uranium from seawater [12,13]. The schematic of the fabrication of AO-g-PP adsorbents via EB induced grafting process is presented in figure 5. The adsorbent could be regenerated and recycled for several cycles without significant attrition losses. The adsorbent was also employed for removal of
heavy metal ions including Co2+, Ni2+, Mn2+, and
Cd2+ from aqueous solutions [12-14]. Polyacrylic acidgrafted PES beads were also fabricated via gamma radiation induced mutual irradiation grafting process and employed for removal of heavy metal ions from industrial wastewater. Recently, we have fabricated water treatment systems based on radiation grafted anion-exchange cellulose adsorbent for remediation of Arsenic and Chromium from ground water.
Figure 5. Amidoximated PP adsorbents via EB induced post-irradiation grafting process
EB irradiation
..... ............... ........ .............
PP sheet
Chemical
Treatment Grafted film for U uptake
95
Figure 6: Schematic diagram of radiation induced epoxy functionalization of polymer and covalent immobilization of enzyme on to poly(EPMA)-g-polymer support.
2.2 Enzyme–immobilized-polymer based biocatalytic system Enzymes are the biocatalysts bearing excellent
properties, such as high selectivity and specificity that may facilitate their efficiency in performing the most complex chemical processes under the most benign experimental and environmental conditions. However, use of free and soluble enzyme system is limited due to issues related to their cost, reusability, stability, sensitivity to various denaturants and difficulty of application in continuous reactors [15]. To overcome these limitations, use of immobilized enzyme systems has now taken precedence over free enzyme systems. Immobilization of enzymes not only affords enhanced stability and reduction of inhibition, but also enhances the thermal stability of the enzyme, broadens the pH range of enzyme activity and enables recovery of the product with greater purity. At the same time, separation and reusability of the enzyme becomes feasible, which is extremely essential when using expensive or scarcely produced enzymes [16]. One of the approaches used to achieve immobilization of enzymes is the use of functionalized polymer support matrices. The immobilization strategies include physical adsorption, entrapment, and covalent binding [17]. In order to achieve covalent immobilization of enzymes onto polymer supports, radiation induced grafting of desired functional groups onto polymer surfaces has been carried out to introduce functionality to the
the otherwise inert polymer surfaces [18,19].
Epoxy functionalized polymer supports have been developed via radiation grafting of 2,3- epoxypropyl methacrylate (EPMA) onto polymer (PP, PES) supports. Subsequently, industrially and environmentally relevant enzymes, namely Horseradish peroxidise (HRP) and Laccase were covalently immobilized onto poly(EPMA)-g- PEP/PP supports via single step-room temperature coupling reaction of amine groups of enzyme with the epoxy groups of grafted poly(EPMA) chains (Figure 6) [18,19]. Immobilization of laccase on poly(EPMA)-g-PES beads showed improved storage stability. In addition, the immobilized laccase system could be used repeatedly without significant compromise on the activity of the enzyme up to 10 cycles over a period of 5 days. Similarly, the immobilized HRP on poly(EPMA)-g- PP support was observed to show higher thermal stability compared to the free enzyme. The laccase immobilized EPMA-g-PES bead system was successfully employed to degrade acid Red 1 (AR1) dye in aqueous solution. Room temperature incubation of the immobilized laccase system with AR1 dye (~10ppm) resulted in ~88% degradation of the dye over a period of 15 days, and could be repeatedly used. Similarly, a recyclable catalase-immobilised Poly(EPMA)-g- Cellulose based biocatalytic system has also been fabricated using radiation grafting process [20]. Catalase-immobilized-poly(EPMA)-g-cellulose
96
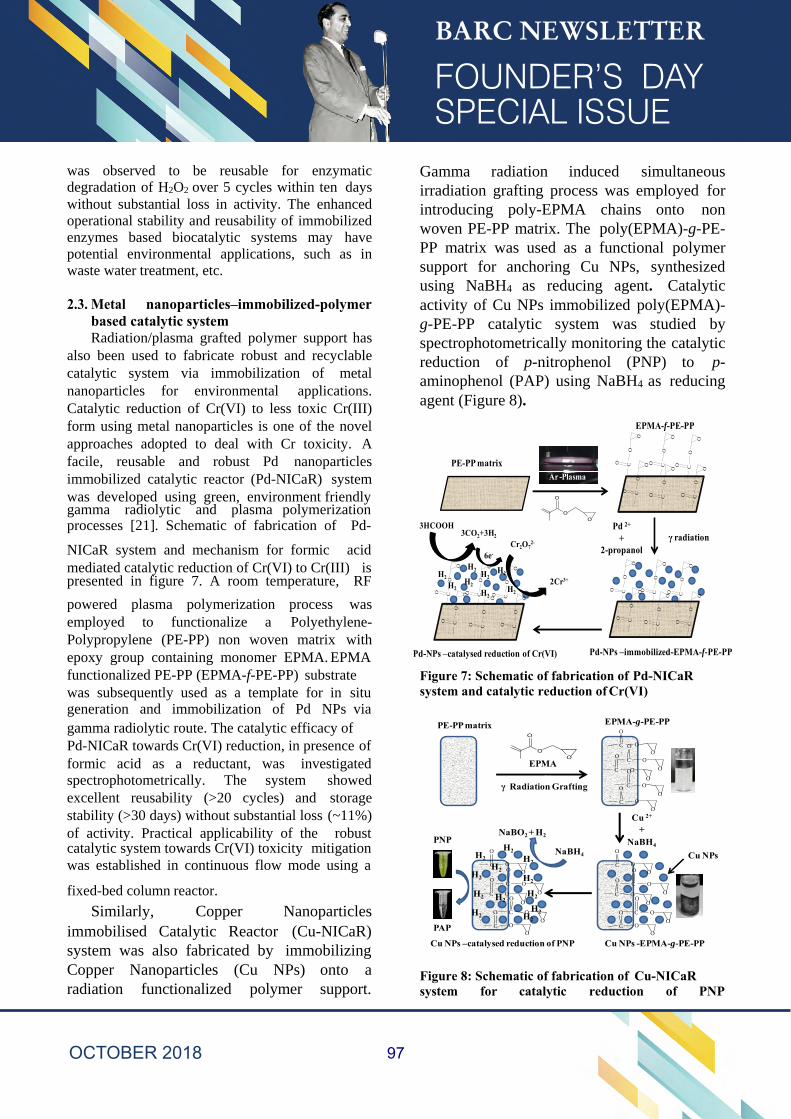
was observed to be reusable for enzymatic degradation of H2O2 over 5 cycles within ten days without substantial loss in activity. The enhanced operational stability and reusability of immobilized enzymes based biocatalytic systems may have potential environmental applications, such as in waste water treatment, etc.
2.3. Metal nanoparticles–immobilized-polymer based catalytic system Radiation/plasma grafted polymer support has
also been used to fabricate robust and recyclable catalytic system via immobilization of metal nanoparticles for environmental applications. Catalytic reduction of Cr(VI) to less toxic Cr(III) form using metal nanoparticles is one of the novel approaches adopted to deal with Cr toxicity. A facile, reusable and robust Pd nanoparticles immobilized catalytic reactor (Pd-NICaR) system was developed using green, environment friendly gamma radiolytic and plasma polymerization
Gamma radiation induced simultaneous irradiation grafting process was employed for introducing poly-EPMA chains onto non woven PE-PP matrix. The poly(EPMA)-g-PE- PP matrix was used as a functional polymer support for anchoring Cu NPs, synthesized using NaBH4 as reducing agent. Catalytic activity of Cu NPs immobilized poly(EPMA)- g-PE-PP catalytic system was studied byspectrophotometrically monitoring the catalyticreduction of p-nitrophenol (PNP) to p- aminophenol (PAP) using NaBH4 as reducingagent (Figure 8).
processes [21]. Schematic of fabrication of Pd-
NICaR system and mechanism for formic acid mediated catalytic reduction of Cr(VI) to Cr(III) is presented in figure 7. A room temperature, RF
powered plasma polymerization process was employed to functionalize a Polyethylene- Polypropylene (PE-PP) non woven matrix with epoxy group containing monomer EPMA. EPMA functionalized PE-PP (EPMA-f-PE-PP) substrate was subsequently used as a template for in situ generation and immobilization of Pd NPs via
Figure 7: Schematic of fabrication of Pd-NICaR system and catalytic reduction of Cr(VI)
gamma radiolytic route. The catalytic efficacy of Pd-NICaR towards Cr(VI) reduction, in presence of formic acid as a reductant, was investigated spectrophotometrically. The system showed excellent reusability (>20 cycles) and storage stability (>30 days) without substantial loss (~11%) of activity. Practical applicability of the robust catalytic system towards Cr(VI) toxicity mitigation was established in continuous flow mode using a
fixed-bed column reactor.
Similarly, Copper Nanoparticles immobilised Catalytic Reactor (Cu-NICaR) system was also fabricated by immobilizing Copper Nanoparticles (Cu NPs) onto a radiation functionalized polymer support.
Figure 8: Schematic of fabrication of Cu-NICaR system for catalytic reduction of PNP
O O
Pd-NPs –immobilized-EPMA-f-PE-PP
EPMA-f-PE-PP
Pd 2+
+ 2-propanol
γ radiation
Ar -Plasma
CO
O
O
CO
O
O
CO
O
O
CO
O
O
CO
O
OCO
O
O
CO
O
O
CO O
O
O
CO
O
CO
O
O
CO
O
OCO
O
O
PE-PP matrix
O
O
O
CO
O
O
CO
O
CO
O
CO
O
O
CO
O
OCO
O
O
3HCOOH3CO2+3H2
2Cr3+
Cr2O72-
6e-
H2
H2H2
H2H2H2
H2
H2
P d-NPs –catalysed reduction of Cr(VI)
O
Cu NPs -EPMA-g-PE-PP
EPMA-g-PE-PP
Cu 2+
+NaBH4
PE-PP matrix
O
O
O
O
Cu NPs –catalysed reduction of PNP
Ar -Plasma γ Radiation Grafting
C
O
OO
C
O
O
O
C
O
OO
C
O
O
O
C
O
O
O
EPMA
C
O
OO
C
O
O
O
C
O
O
C
O
O
O
C
O
O
O
NaBO2 + H2PNP
H2
H2H2
H2
NaBH4O
OO
C
O
O
O
O
PAP C O
C
O
O
O
C
O
O
O
H2
H2
CH2
H2 H2
H2
H2
H2
Cu NPs
97
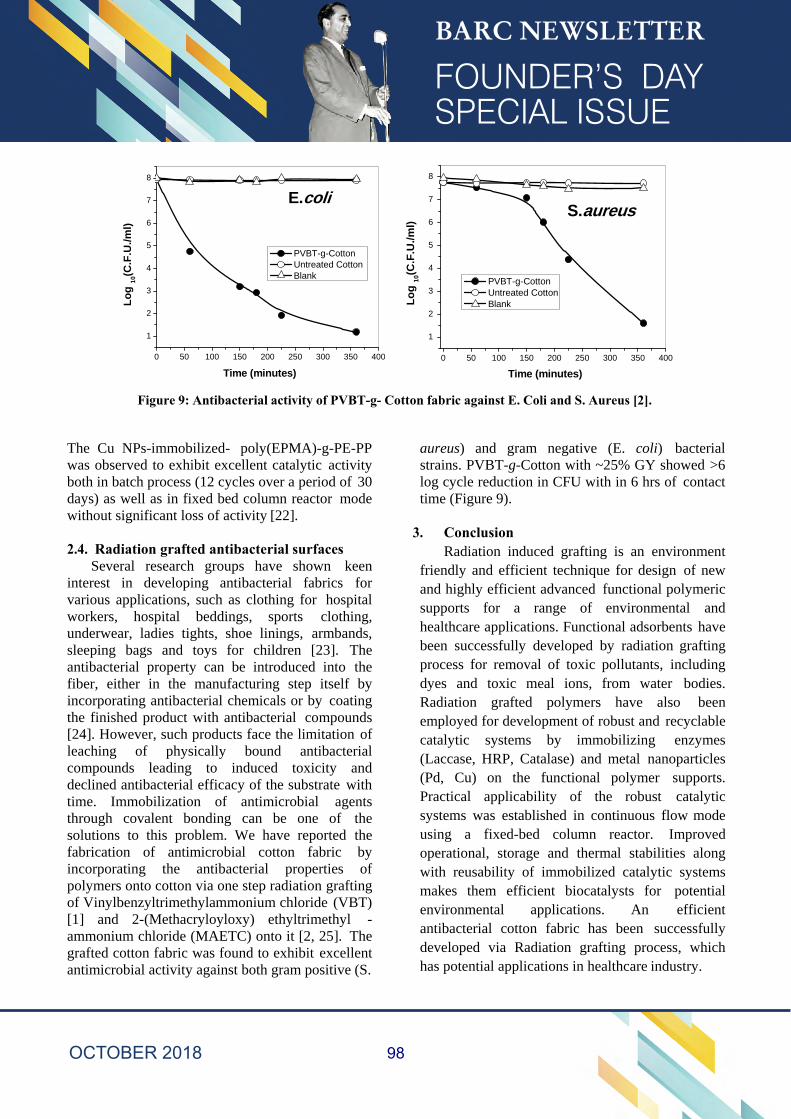
Figure 9: Antibacterial activity of PVBT-g- Cotton fabric against E. Coli and S. Aureus [2].
The Cu NPs-immobilized- poly(EPMA)-g-PE-PP was observed to exhibit excellent catalytic activity both in batch process (12 cycles over a period of 30 days) as well as in fixed bed column reactor mode without significant loss of activity [22].
2.4. Radiation grafted antibacterial surfaces Several research groups have shown keen
interest in developing antibacterial fabrics for various applications, such as clothing for hospital workers, hospital beddings, sports clothing, underwear, ladies tights, shoe linings, armbands, sleeping bags and toys for children [23]. The antibacterial property can be introduced into the fiber, either in the manufacturing step itself by incorporating antibacterial chemicals or by coating the finished product with antibacterial compounds [24]. However, such products face the limitation of leaching of physically bound antibacterial compounds leading to induced toxicity and declined antibacterial efficacy of the substrate with time. Immobilization of antimicrobial agents through covalent bonding can be one of the solutions to this problem. We have reported the fabrication of antimicrobial cotton fabric by incorporating the antibacterial properties of polymers onto cotton via one step radiation grafting of Vinylbenzyltrimethylammonium chloride (VBT) [1] and 2-(Methacryloyloxy) ethyltrimethyl -ammonium chloride (MAETC) onto it [2, 25]. Thegrafted cotton fabric was found to exhibit excellentantimicrobial activity against both gram positive (S.
aureus) and gram negative (E. coli) bacterial strains. PVBT-g-Cotton with ~25% GY showed >6 log cycle reduction in CFU with in 6 hrs of contact time (Figure 9).
3. ConclusionRadiation induced grafting is an environment
friendly and efficient technique for design of new and highly efficient advanced functional polymeric supports for a range of environmental and healthcare applications. Functional adsorbents have been successfully developed by radiation grafting process for removal of toxic pollutants, including dyes and toxic meal ions, from water bodies. Radiation grafted polymers have also been employed for development of robust and recyclable catalytic systems by immobilizing enzymes (Laccase, HRP, Catalase) and metal nanoparticles (Pd, Cu) on the functional polymer supports. Practical applicability of the robust catalytic systems was established in continuous flow mode using a fixed-bed column reactor. Improved operational, storage and thermal stabilities along with reusability of immobilized catalytic systems makes them efficient biocatalysts for potential environmental applications. An efficient antibacterial cotton fabric has been successfully developed via Radiation grafting process, which has potential applications in healthcare industry.
0 50 100 150 200 250 300 350 400
1
2
3
4
5
6
7
8
Time (minutes)
Lo
g 1
0(C.F
.U./m
l)
E.coli
PVBT-g-Cotton Untreated Cotton Blank
0 50 100 150 200 250 300 350 400
1
2
3
4
5
6
7
8
S.aureus
Time (minutes)
Lo
g 10
(C.F
.U./m
l)
PVBT-g-Cotton Untreated Cotton Blank
98
References
1. Kumar, V., Misra, N., Goel, N.K., Thakar, R., Gupta J., Varshney, L. RSC Adv., 2016, 6, 2974-2981.
2. Kumar, V., Bhardwaj, Y.K., Rawat, K.P., Sabharwal, S., Radiat. Phys. Chem, 2005, 73, 175-182.
3. Kumar, V., Misra, N., Paul, J., Dhanawade, B.R., Varshney, L., Polymer, 2014, 55, 2652- 2660.
4. Klemola, K.; Pearson, J.; Liesivuori, A.V. J.; Seppä, P.L., Autex Res. J. 2007, 7, 224–230.
5. Figueiredo, S.A.; Boaventura, R. A.; Loureoro, J.M., Sep. Purif. Technol. 2000, 20,129-141.
6. Rai, H.S.; Bhattacharyya, M.S.; Singh, J.; Bansal, T.K.; Vats, P.; Banerjee, U.C., Crit. Rev. Env. Sci. Tec. 2005, 35, 219-238.
7. Kumar V, Goel N. K., Bhardwaj Y. K., Sabharwal S., Varshney L., Sep. Sci. Technol., 2012,47(13), 1937-1947.
8. Goel N.K., Kumar V., Misra N., Varshney L., Carbohyd. Polym., 2015, 132 (5), 444- 451.
9. Kumar V., Goel N.K., Misra N., Varshney L., International Conference on state-of-the- art Radiation Processing (NICSTAR 2015), March 4-6, 2015, Mumbai.
10. Srinivas Ch., Ravi Shankar P., Venkateshwar, C., Satyanarayana Rao, M.S., Reddy R.R.. 2000. Poll. Res., 19(2):285-289
11. Katragadda S., Gesser H.D. and Chow A., Talanta, 1997, 45, 257–263.
12. Kumar V., Bhardwaj Y. K., Tirumalesh K., Chaudhari C.V., Goel N. K., Biswal J., Sabharwal S., Sep. Sci. Technol., 2006, 41, 3123-3139.
13. Das S. , Pandey A. K., Athwale A., Kumar V, Bhardwaj Y. K., Sabharwal S., Manchanda V. K., Desalination, 2008, 232, 243-253.
14. Zhang A., Asakura T. and Uchiyama G., React. Funct. Polym., 2003, 57, 67–76.
15. Gomez J. L., Bodalo A., Gomez E., Bastida J., Hidalgo A. M., Gomez M., Enzyme Microb. Technol. 2006, 39, 1016–22.
16. Datta S., Christena L. R., Rajaram Y. R. S., Biotechnology, 2013, 3, 1–9.
17. Mateo C., Palomo J. M., Fernandez-Lorente G., Guisan J. M., Fernandez-Lafuente R., Enzyme Microb. Technol. 2007, 40, 1451–63.
18. Kumar V., Misra N., Paul J., Dhanawade B. R., Varshney L., Polymer, 2014, 55(11), 2652-60.
19. Misra, N., Kumar, V., Goel, N.K., Varshney,L., Polymer, 2014, 55(23), 6017- 24.
20. Misra N., Goel N. K., Shelkar S. A., Varshney L., Kumar V., J. Mol. Catal. B Enzym., 2016, 133, S172–S178
21. Misra N., Kumar V., Rawat S., Goel N.K., Shelkar S.A., Jagannath, Singhal R.K., Varshney L, , 2018, 25(16), 1
22. Rawat S., Misra N., Kumar V., Shelkar S. A., Goel N.K., Singhal R.K., Varshney L., Advanced Materials Letters, 2018 (In print)
23. Reyerouck, G., Hugo, W.B., Russel, A.D., 1992. Evaluation of antibacterial and antifungal efficiency. In: Russel, A.D., Hugo,W.B., Ayliffe, G.A.J. (Eds.), Principles and Practice of Disinfection, Preservation and Sterilization. Blackwell Scientific Publications, Oxford, pp. 124–148.
24. Gottenbos, B., Van der Mei, H.C., Klatter, F., Nieqwenhuis, P., Busscher, H.J., Biomaterials, 2002, 23, 1417–1423.
25. Goel N. K., Rao M.S., Kumar V., Bhardwaj Y. K., Chaudhari C. V., Dubey K. A., Sabharwal S., Radiat. Phys. Chem., 2009, 78(6), 399-406.
Environ. Sci. Pollut. Res. 6101-110
99

Design Considerations and Challenges in Development of Control Console and Output Controller C & I Systems for Compact LWRs
Abhishek Bhardwaj System Engineering Section
Control Instrumentation Division
Abhishek Bhardwaj is the recipient of the DAE
Scientific & Technical Excellence Award for the year 2016
Abstract:
Indigenous development of C&I (control and instrumentation) systems for LWR, involved many design challenges due to stringent environment specification coupled with requirement of compact hardware design with high availability and high reliability. This required a different approach to design methodology compared to conventional C&I systems.
This paper describes key challenges and design features to overcome them, in particular design features for sub-systems for which the author was responsible, namely, Control Consoles, Output Controllers and Emergency control devices. This paper describes features provided in C&I to increase availability and reliability.
This paper also describes Integrated Test Facility and its simulation scheme, which became key platform for validating C&I requirement. The author brings out design consideration in successful setup of Integrated test facility.
Introduction
C&I for compact LWR is a complex distributed control system (5000 I/Os; 106 types of electronic modules housed in 40 racks) which performs protection and control functions for a nuclear reactor plant.
It is broadly split into two parts-
a) Reactor Control & Protection System, b) Plant Process Control System
Total C&I is a mix of computer based and non-computer system. These are configured using common set of custom-developed C&I hardware. The designs are targeted for high reliability, quality and very low fault recovery time without affecting plant working. This required modular redundancy and extensive online & offline diagnosis for individual modules, sensor actuators and their field cabling.
Safety class IA/IB systems incorporate typical features like galvanic isolation, fault tolerance, failsafe output generation, physical separation among logic processing channels, on line testability
100
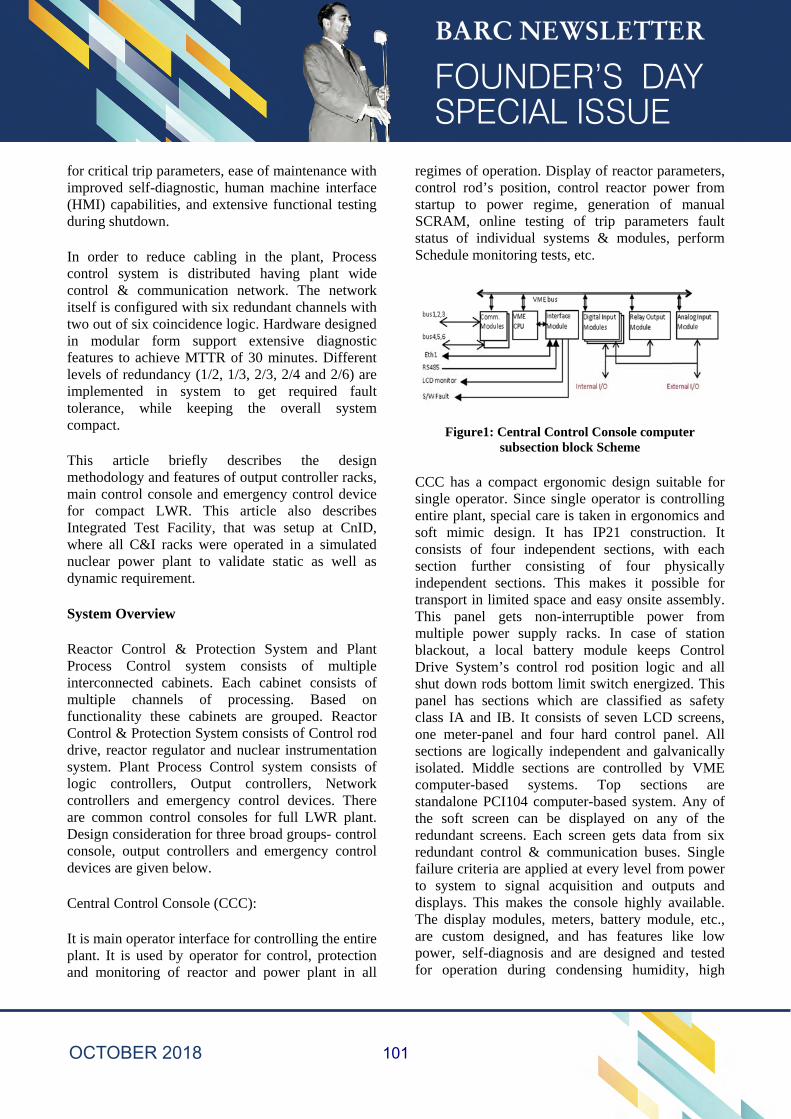
for critical trip parameters, ease of maintenance with improved self-diagnostic, human machine interface (HMI) capabilities, and extensive functional testing during shutdown.
In order to reduce cabling in the plant, Process control system is distributed having plant wide control & communication network. The network itself is configured with six redundant channels with two out of six coincidence logic. Hardware designed in modular form support extensive diagnostic features to achieve MTTR of 30 minutes. Different levels of redundancy (1/2, 1/3, 2/3, 2/4 and 2/6) are implemented in system to get required fault tolerance, while keeping the overall system compact.
This article briefly describes the design methodology and features of output controller racks, main control console and emergency control device for compact LWR. This article also describes Integrated Test Facility, that was setup at CnID, where all C&I racks were operated in a simulated nuclear power plant to validate static as well as dynamic requirement.
System Overview
Reactor Control & Protection System and Plant Process Control system consists of multiple interconnected cabinets. Each cabinet consists of multiple channels of processing. Based on functionality these cabinets are grouped. Reactor Control & Protection System consists of Control rod drive, reactor regulator and nuclear instrumentation system. Plant Process Control system consists of logic controllers, Output controllers, Network controllers and emergency control devices. There are common control consoles for full LWR plant. Design consideration for three broad groups- control console, output controllers and emergency control devices are given below.
Central Control Console (CCC):
It is main operator interface for controlling the entire plant. It is used by operator for control, protection and monitoring of reactor and power plant in all
regimes of operation. Display of reactor parameters, control rod’s position, control reactor power from startup to power regime, generation of manual SCRAM, online testing of trip parameters fault status of individual systems & modules, perform Schedule monitoring tests, etc.
Figure1: Central Control Console computer subsection block Scheme
CCC has a compact ergonomic design suitable for single operator. Since single operator is controlling entire plant, special care is taken in ergonomics and soft mimic design. It has IP21 construction. It consists of four independent sections, with each section further consisting of four physically independent sections. This makes it possible for transport in limited space and easy onsite assembly. This panel gets non-interruptible power from multiple power supply racks. In case of station blackout, a local battery module keeps Control Drive System’s control rod position logic and all shut down rods bottom limit switch energized. This panel has sections which are classified as safety class IA and IB. It consists of seven LCD screens, one meter-panel and four hard control panel. All sections are logically independent and galvanically isolated. Middle sections are controlled by VME computer-based systems. Top sections are standalone PCI104 computer-based system. Any of the soft screen can be displayed on any of the redundant screens. Each screen gets data from six redundant control & communication buses. Single failure criteria are applied at every level from power to system to signal acquisition and outputs and displays. This makes the console highly available. The display modules, meters, battery module, etc., are custom designed, and has features like low power, self-diagnosis and are designed and tested for operation during condensing humidity, high
101

Figure2: Output Controller Device block scheme
ambient, high shock and vibration conditions. Special care is taken in battery module to isolate input and output in case of battery overheat or other faults. It uses custom design multistage filters for EMI/EMC compliance.
Emergency Control Console
This is IA safety classified system. This compact panel is used, during certain common cause failure, where Central Control Console is not available. This control panel is manned only in such emergency conditions. Under normal scenario this panel can be used for monitoring important parameters of reactor. Activation of this console automatically trips the reactor and activates cooling. It consists of diverse hardware and computer-based sections. Hardware section have passive interfaces directly to control rod drive system. The computer-based system is PCI104 based system which communicates using six redundant control & communication networks. The computer-based section has 100% redundancy. This ensures high reliability. The panel has IP55 construction without any fan. It gets power from two
different power supply racks and uses multistage filters for EMI/EMC.
Output Controller Device
This is IA safety classified computer-based system which gets equipment command information from six control & communication networks. The panel has IP55 construction without any fan. It gets power from two different power supply racks and uses multistage filters for EMI/EMC. It has three channels for input logic processing and voting and two channels for output generation. These mix redundancies provide required availability and reliability figures while keeping the hardware compact. Each processing channel is configured using custom VME bus-based IO cards, watch dog timers and control bus interface modules. All modules are designed specifically for ultra-low power consumption and operate in stringent environment condition. These processing channels perform soft input and output voting via a dual-redundant dedicated local control & communication network.
102
All modules have jumper less design for easy maintenance. The output stages are provided for two channels and are configured in one-out of-two hardware logic. These are non-bus relay-based modules with online individual fuse monitoring. The health and local temperature of output stage is monitored by a microcontroller-based module. This system monitoring module communicates to host VME via isolated RS232. This system monitoring module along with output stage modules provide online testability feature of short-circuit, open-circuit and low earth isolation detection of control cable of individual equipment. These field diagnostics are initiated by operator at central control console and test results for individual output is presented to operator.
Each such rack controls about 50 equipment. There are four such racks. Certain important equipment are controlled by multiple rack in one out of two configuration.
Emergency logic control device
These consist of relay logic modules powered by 27V derived directly from 3 phase generator power. It automatically generates emergency core cooling control signals in case of total loss of power supply to all computer-based systems. These are safety class IA devices. Two such device sets with identical functionality are configured as one-out of-two logic. The detection of failure of computer-based system is detected using health signals, which are passed through two-out of- three logic. The health signals are fail safe by design. Once activated, this module self energizes one lamp on central control console to indicate emergency action to operator.
Design considerations
Environment qualification
High ambient temperature The controller racks are IP55 sealed, without fans, and they must work in high ambient temperature. The components are all industrial grade components. With these constraints and the high module density in the racks, it was a challenging
design task to keep hot spots below acceptable limit, for an acceptable MTBF. This goal was achieved by strict power budgeting and design of racks & modules for transport of heat by direct conduction to the rack body. All significant heat generating components on PCB conducts heat directly to PCB thermal pins, which are connected to thermal planes of PCB. Heat from these planes are transported through wedge lock to module guide channels, which have good thermal path to rack’s side heatsink. With this mechanism hotspots could be reduced. To verify design survivability all module types are operated at 70°C local ambient for 48 Hours.
Mechanical consideration
The survivability of electronic hardware was achieved by restricting components to have resonance in test range. PCBs were designed with stiffeners to avoid PCB track failure due to diaphragm type oscillation. Connectors and module cages were specially developed with spring loading to allow certain freedom of motion with no loss of electrical contact. Additionally, jumper less design ensured no loss of configuration information during shock. All configuration settings are done with wiring on rack side connectors. Even base address settings for VME or other intelligent boards were done at rack side mating connector. For modules having COTS and mechanically soft assembly, additional local shock absorbers were placed. Battery used in console were glass matt-soaked electrolyte type which have good shock resistance. For LCD screens soft gaskets and shock mounts provide sufficient dampening.
EMI/EMC
For radiated noise susceptibility and emission cable with single or double screen were used. While routing of wire bunches inside rack power, communication and other wire bunches were kept apart. Thin wire mesh screen is used sandwiched with polycarbonate sheets for all window cutouts.
For conducted noise multi stage filtering for common mode as well as differential noise was used.
103
Diagnostics and Testability
The console enables extensive health check of all plant sensors & actuators, field cablings and also provides module level fault status for all control system racks. These significantly increase the availability of plant and enable the operator to do preventive maintenance. For functional and plant level logic checks online and offline testability is performed by operator using CCC. Online checks cover important reactor parameters and verifies functionality of trip system without tripping the plant. This is performed as a finite impulse test. Offline tests, also referred as schedule monitoring are initiated from soft mimics of console. These are performed in reactor shutdown state. Every trip condition and field output continuity & isolation test of output controllers can be checked during schedule monitoring tests. The field tests Redundancy built into system is also checked by schedule monitoring. In schedule monitoring, important field signals and trip conditions can be simulated.
Development lifecycle
Regulatory guidelines require that components and modules be of a quality that is consistent with minimum maintenance requirements and low failure rates, and safety system equipment be designed, manufactured, inspected, installed, tested, operated, and maintained in accordance with a prescribed quality assurance program.
Quality of C&I system is ensured by systematic design approach, with preparation of necessary documents like System requirements, architecture
design, hardware and software requirements, detailed design documents, test plan and procedures, test reports and quality surveillance.
Conclusion
C&I of compact LWR is indigenously designed, developed, and tested for their requirements. All environment qualifications were successfully completed for developed racks and modules at manufacturer’s premises. Modules of Output controller rack were subjected to accelerated life testing and confirm required reliability and operational life.
Acknowledgement
The author is thankful to Shri D Das (Associate Director(E), E & IG), Shri PP Marathe (Head CnID, BARC), and Smt A Mayya (Head SES, CnID) for their continuous encouragement and extensive support in development of control consoles and output controller racks and its electronic modules.
Reference
1. “Life Estimation of Electronic Subassembly by multiple Accelarated Life Tests”; Diana Denice, Manoj Kumar, Abhishek Bhardwaj, P.P. Marathe, Y.K. Taly, Proc. of ICQRITITM 2012 (Int. Conf. on Quality, Reliability, Infocom Technology and Industrial Technology Management), Delhi (2012).
2. IEC 60529, Degree of protection provided by enclosures (IP code), 2001-02.
104
Development of TRANPIN – A Whole Core Pin-by-Pin Transport Theory Code
Suhail Ahmad Khan and Umasankari Kannan Reactor Physics Design Division
Suhail Ahmad Khan is the recipient of the DAE Young Applied Scientist/Technology
Award for the year 2016
Abstract
The reactor physics calculations are traditionally performed in two steps. First, the heterogeneous fuel assembly (FA) is treated in detail in multigroup formalism. Few group homogenized parameters of FA are generated as a result of this calculation. This FA calculation is performed with reflective boundary condition. These parameters are used to perform core calculations using traditional finite difference or nodal methods employing diffusion theory. This averaging of the individual FA cell and neutronics properties assumes zero flux gradient at assembly surface and does not account for the non-linear neighbouring effects appearing in the operating reactors. Due to the availability of high speed computational resources, development of high fidelity accurate models for whole core pin–by–pin calculation has become feasible. For this purpose, a core simulation method, based solely on transport theory, has been developed and a new transport theory code TRANPIN has been developed to perform the whole core pin-by-pin calculation in 2D hexagonal geometry. TRANPIN uses the interface current method to perform pin-by-pin core calculations. TRANPIN has been validated against 2D whole core benchmark problems. The present paper describes the brief theory and features of TRANPIN. The computational challenges in TRANPIN are also described. The brief results obtained using TRANPIN are presented. Introduction The reactor physics calculations of nuclear reactor core are traditionally performed in two steps. First, the isolated heterogeneous fuel assembly (FA) is treated in detail using multi group transport theory. This calculation is performed with reflective boundary or zero leakage current boundary condition. Few group homogenized parameters of FA are generated as a result of this calculation. These parameters are used to perform core calculations using traditional finite difference or nodal methods employing diffusion theory as shown in Fig. 1(a). This averaging of the individual FA cell and neutronics properties assumes zero flux gradient at assembly interfaces which is not a true representation as the fuel assemblies in operating reactors are invariably of different enrichments with UOX or MOX type, different fuel burnup and
may contain water rod/control absorber rod cells, burnable absorbers of gadolinium or boron type. The few-group homogenized parameters depend on non-local history effects such as the fuel burnup which is strongly dependent on the spatial neutron spectrum history as well as non–linear neighbor effects arising due to changes in the intra–assembly and intra–group spatial flux gradients caused by changes in the neighboring fuel assemblies or cells such as control rod insertion etc. [1]. Also, the pin level flux distribution and hot spot thereof are lost in final core calculation and the core results represent average core behavior only. In the recent times, there is a phenomenal improvement in computer processing power. This has encouraged the development of accurate models for whole core pin–by–pin calculation. A core simulation method that is based solely on
105
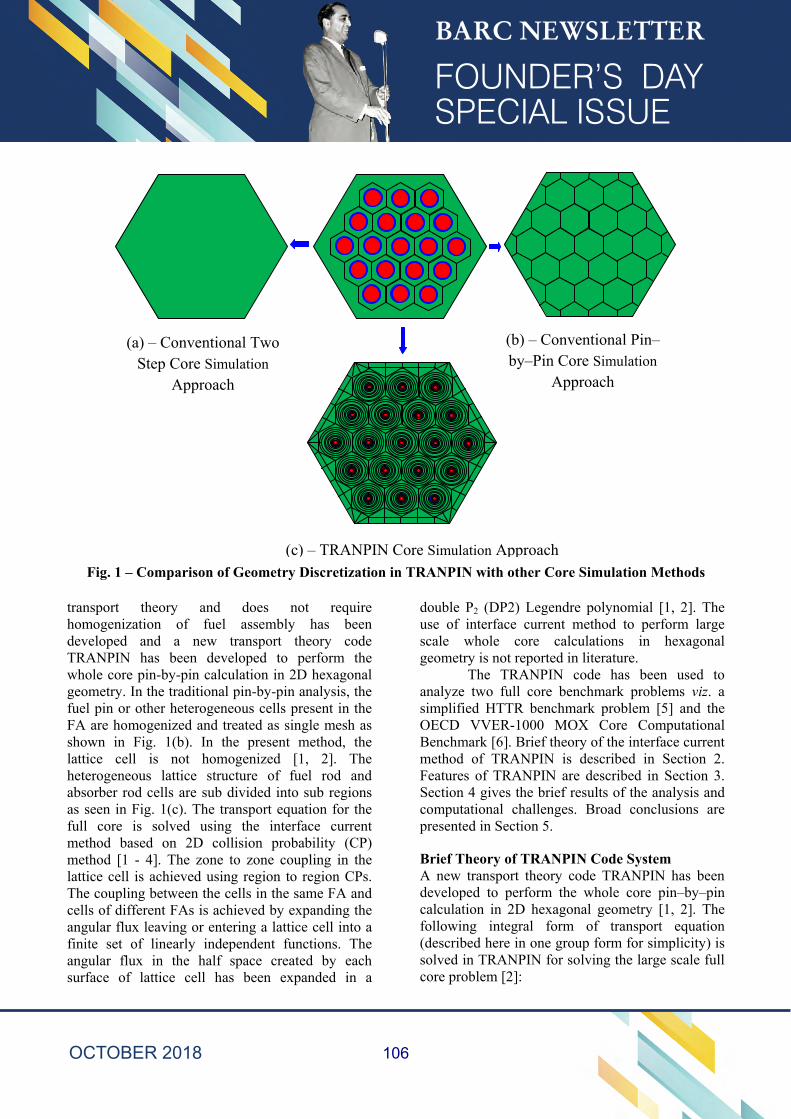
Fig. 1 – Comparison of Geometry Discretization in TRANPIN with other Core Simulation Methods transport theory and does not require homogenization of fuel assembly has been developed and a new transport theory code TRANPIN has been developed to perform the whole core pin-by-pin calculation in 2D hexagonal geometry. In the traditional pin-by-pin analysis, the fuel pin or other heterogeneous cells present in the FA are homogenized and treated as single mesh as shown in Fig. 1(b). In the present method, the lattice cell is not homogenized [1, 2]. The heterogeneous lattice structure of fuel rod and absorber rod cells are sub divided into sub regions as seen in Fig. 1(c). The transport equation for the full core is solved using the interface current method based on 2D collision probability (CP) method [1 - 4]. The zone to zone coupling in the lattice cell is achieved using region to region CPs. The coupling between the cells in the same FA and cells of different FAs is achieved by expanding the angular flux leaving or entering a lattice cell into a finite set of linearly independent functions. The angular flux in the half space created by each surface of lattice cell has been expanded in a
double P2 (DP2) Legendre polynomial [1, 2]. The use of interface current method to perform large scale whole core calculations in hexagonal geometry is not reported in literature. The TRANPIN code has been used to analyze two full core benchmark problems viz. a simplified HTTR benchmark problem [5] and the OECD VVER-1000 MOX Core Computational Benchmark [6]. Brief theory of the interface current method of TRANPIN is described in Section 2. Features of TRANPIN are described in Section 3. Section 4 gives the brief results of the analysis and computational challenges. Broad conclusions are presented in Section 5.
Brief Theory of TRANPIN Code System A new transport theory code TRANPIN has been developed to perform the whole core pin–by–pin calculation in 2D hexagonal geometry [1, 2]. The following integral form of transport equation (described here in one group form for simplicity) is solved in TRANPIN for solving the large scale full core problem [2]:
(a) – Conventional Two Step Core Simulation
Approach
(b) – Conventional Pin–by–Pin Core Simulation
Approach
(c) – TRANPIN Core Simulation Approach
106
, , ′ ′ ′ . (1)
where is an arbitrary point on the line passing through in the direction on the surface S bounding the volume V, where boundary conditions will be applied and ′ – ′ . τ and are the optical distances between and ′ and between and respectively. The total source density for a group of energy E is isotropic and defined as
′ ′ , ′ ′ ′ , ′ . (2)
The equation for scalar flux is obtained by integrating Eq. (1) over all angles. This gives
. , ′ ′. (3)
where , is the incoming angular flux at surface S.
The outgoing flux at surface S can be obtained from Eq. (1) as it is valid at any point. The outgoing flux is given by
′ , , ′ ′ ′ . (4)
For a given incoming angular flux to region under consideration, the system of Eqs. (3) and (4) gives an exact description of the flux distribution inside the region as well as the outgoing angular flux. In order to solve these equations, some numerical approximations are required for the scalar fluxes inside the cells and for the angular fluxes leaving and entering the cell surfaces.
The scalar flux inside the cells can be expanded into a set of linearly independent functions. In TRANPIN, the flat flux approximation for the scalar flux is used i.e. the flux inside each zone is assumed constant. The angular flux at the cell surface has been expanded into properly orthonormalized double P2 expansion functions [1, 2]. Using these approximations, Eqs. (3) & (4), for group ‘g’ (the group index ‘g’ is omitted for simplicity), when discretized over a region
consisting of NV zones and NS surfaces reduces to a set of linear flux and current equations
∑ ∑ , ∑ (5)
, ∑ ∑ , ∑ . (6)
, ∑ ∑ , . (7) The summation over ν in above equations represents the order of expansion of angular flux at pincell boundary.
Here is the total source in region i, is the self scattering cross section within the group and Si is the fission and scattering source in a group given by
∑ ∑ . (8)
gives the probability of a neutron emitted uniformly and isotropically in region i and having its first collision in region j and gives the probability of neutron entering through surface α in mode ν and having first collision in region j. is the probability that neutrons emitted uniformly and isotropically in region i will escape through surface α in mode ν and is the probability that neutrons entering through surface β in mode μ will be transmitted through the cell and out through surface α in mode ν without making a collision. The detailed expressions for these probabilities for DP2 expansion can be seen in [1] & [2].
For solving Eqs. (5) to (7) for whole core, the four CP matrices appearing in these equations need to be calculated. A big advantage of the present approach is that it is not required to calculate these CP matrices for all the lattice cells present in the problem domain. First, FA cells within the core and reflector are identified which are materially distinct. Within each FA cell, unique lattice cells are identified by differentiating on the basis of the geometric shape or material present in cells. Four types of CP matrices (as required in Eqs. 5 & 6) are calculated for each of the unique lattice cells in
107
each identified FA cell using Carlvik’s method. Eq. (7) describes the continuity and boundary condition to link the lattice cells through the interface currents. This describes the linking between the lattice cells of same FA as well as the cells of different FAs. This is achieved in the form of a relation between the average outgoing current on surface and the average incoming current on a different surface . In matrix form this can be written as
. (9)
The elements of matrix A can be written as
. (10)
where is the reflection coefficient at surface . is zero except for those surfaces, belonging to
neighboring cells, that share a common area with surface . The albedo boundary condition at the surface belonging to the lattice cells located at the reflector boundary is achieved by setting 0. The discretized flux and outgoing current Eqs (5) to (7) in TRANPIN are solved in a multigroup formalism using the inner-outer iteration scheme.
Salient Features of TRANPIN
TRANPIN performs the whole core calculation without any geometric distortion of the problem. The geometry is modeled exactly up to single lattice cell. The geometric discretization at lattice cell level is very flexible i.e. the discretization of different regions such as fuel, clad and associated coolant in the lattice cell can be performed externally. The methodology incorporated in TRANPIN uses advanced numerical methods which make use of the inherent configuration symmetries to reduce the amount of calculations and computational time. This is illustrated in the calculation of collision probabilities. First the materially and geometrically distinct fuel assemblies are sorted in the whole core. The collision probabilities are only calculated for geometrically and materially distinct lattice cells identified within these distinct fuel assemblies. Also symmetry, reciprocity relations and
transformation laws are used to further reduce the collision probability computations. TRANPIN has the capability to model variable pitch within the fuel assembly i.e. the lattice cells with non uniform pitch can be linked using interface currents. TRANPIN has been written in FORTRAN 90 and uses advanced modular structure of the language. All the routines in the TRANPIN make extensive use of features such as dynamic memory allocation, modular attributes, array operations, user defined data structures and derived types. The code is compact and modular. It is amenable for augmenting different calculation algorithms as may be identified through validation exercise of a variety of benchmark problems.
Brief Numerical Results using TRANPIN
TRANPIN has been used to study two whole core benchmark problems in 2D geometry i) a simplified high temperature test reactor (HTTR) benchmark problem [5] and ii) OECD VVER-1000 MOX Core Computational Benchmark [6]. The details of these benchmarks are described in [5] and [6].
Table 1 gives the comparison of Eigen-value obtained using TRANPIN with benchmark value in all rods in (ARI) condition using DP2 expansion of angular flux. The benchmark provides the 6-group, transport corrected macroscopic cross section library for all the required materials. The geometric discretization used for lattice cells in fuel block and control block is described in [1] & [2]. The results are obtained using a convergence criterion of 10-7 for multiplication factor and 10-5 for flux respectively. The results are obtained using 32 azimuthal angles and a ray separation of 0.0396 cm. Gauss-Legendre quadrature is used for angular integration of collision probability integrals. The result shows a fairly good comparison and shows an absolute deviation of 0.009. Table – 2 gives the block average fission density distribution for 1/6th core. The numbering scheme of blocks in the core, as described in benchmark, is shown in Fig. 2. The block average fission density compares well and shows a maximum relative deviation of 1.02% for block 5. The %RMS deviation is seen to be 0.463%
108
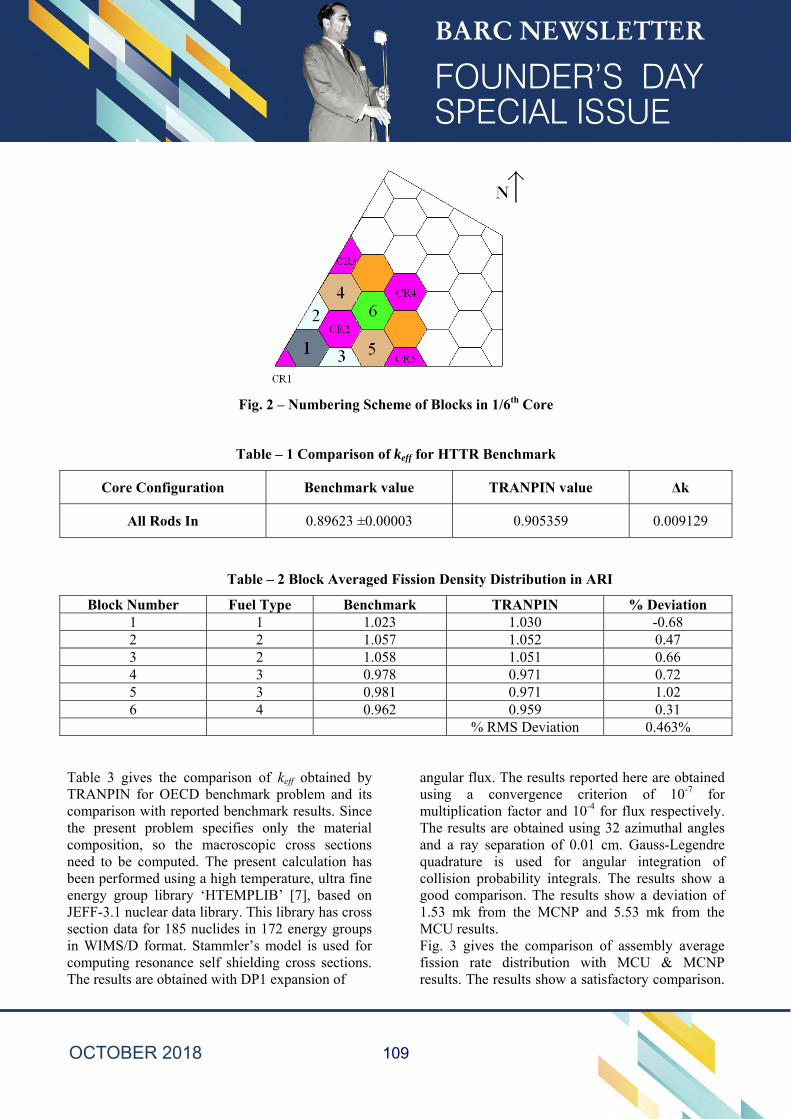
Fig. 2 – Numbering Scheme of Blocks in 1/6th Core
Table – 1 Comparison of keff for HTTR Benchmark
Core Configuration Benchmark value TRANPIN value Δk
All Rods In 0.89623 ±0.00003 0.905359 0.009129
Table – 2 Block Averaged Fission Density Distribution in ARI
Block Number Fuel Type Benchmark TRANPIN % Deviation 1 1 1.023 1.030 -0.68 2 2 1.057 1.052 0.47 3 2 1.058 1.051 0.66 4 3 0.978 0.971 0.72 5 3 0.981 0.971 1.02 6 4 0.962 0.959 0.31 % RMS Deviation 0.463%
Table 3 gives the comparison of keff obtained by TRANPIN for OECD benchmark problem and its comparison with reported benchmark results. Since the present problem specifies only the material composition, so the macroscopic cross sections need to be computed. The present calculation has been performed using a high temperature, ultra fine energy group library ‘HTEMPLIB’ [7], based on JEFF-3.1 nuclear data library. This library has cross section data for 185 nuclides in 172 energy groups in WIMS/D format. Stammler’s model is used for computing resonance self shielding cross sections. The results are obtained with DP1 expansion of
angular flux. The results reported here are obtained using a convergence criterion of 10-7 for multiplication factor and 10-4 for flux respectively. The results are obtained using 32 azimuthal angles and a ray separation of 0.01 cm. Gauss-Legendre quadrature is used for angular integration of collision probability integrals. The results show a good comparison. The results show a deviation of 1.53 mk from the MCNP and 5.53 mk from the MCU results. Fig. 3 gives the comparison of assembly average fission rate distribution with MCU & MCNP results. The results show a satisfactory comparison.
109
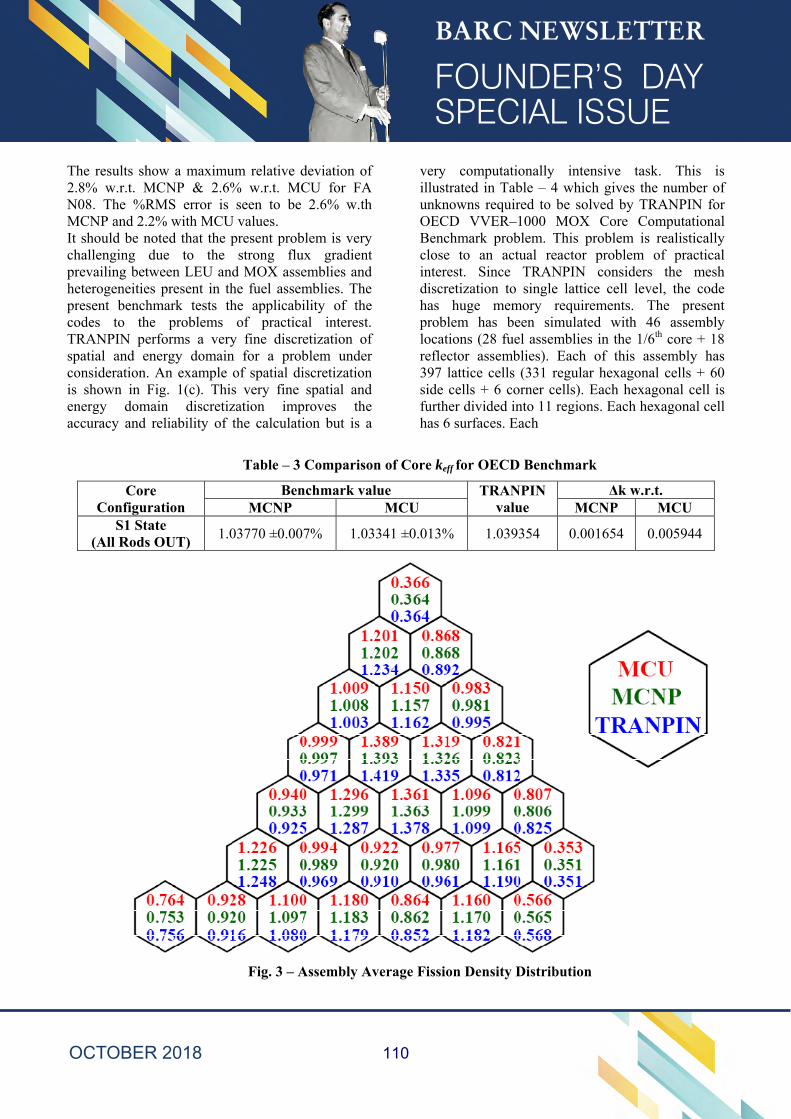
The results show a maximum relative deviation of 2.8% w.r.t. MCNP & 2.6% w.r.t. MCU for FA N08. The %RMS error is seen to be 2.6% w.th MCNP and 2.2% with MCU values. It should be noted that the present problem is very challenging due to the strong flux gradient prevailing between LEU and MOX assemblies and heterogeneities present in the fuel assemblies. The present benchmark tests the applicability of the codes to the problems of practical interest. TRANPIN performs a very fine discretization of spatial and energy domain for a problem under consideration. An example of spatial discretization is shown in Fig. 1(c). This very fine spatial and energy domain discretization improves the accuracy and reliability of the calculation but is a
very computationally intensive task. This is illustrated in Table – 4 which gives the number of unknowns required to be solved by TRANPIN for OECD VVER–1000 MOX Core Computational Benchmark problem. This problem is realistically close to an actual reactor problem of practical interest. Since TRANPIN considers the mesh discretization to single lattice cell level, the code has huge memory requirements. The present problem has been simulated with 46 assembly locations (28 fuel assemblies in the 1/6th core + 18 reflector assemblies). Each of this assembly has 397 lattice cells (331 regular hexagonal cells + 60 side cells + 6 corner cells). Each hexagonal cell is further divided into 11 regions. Each hexagonal cell has 6 surfaces. Each
Table – 3 Comparison of Core keff for OECD Benchmark
Core Configuration
Benchmark value TRANPIN value
Δk w.r.t. MCNP MCU MCNP MCU
S1 State (All Rods OUT) 1.03770 ±0.007% 1.03341 ±0.013% 1.039354 0.001654 0.005944
Fig. 3 – Assembly Average Fission Density Distribution
110
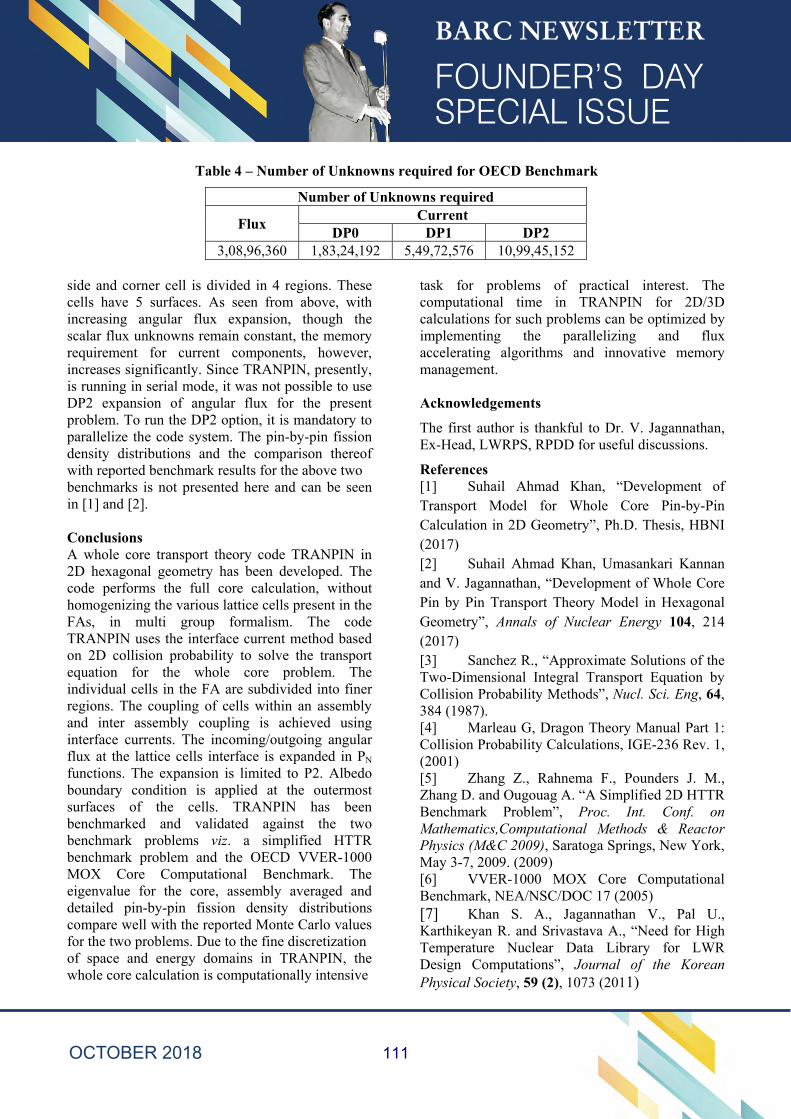
Table 4 – Number of Unknowns required for OECD Benchmark
Number of Unknowns required
Flux Current DP0 DP1 DP2
3,08,96,360 1,83,24,192 5,49,72,576 10,99,45,152 side and corner cell is divided in 4 regions. These cells have 5 surfaces. As seen from above, with increasing angular flux expansion, though the scalar flux unknowns remain constant, the memory requirement for current components, however, increases significantly. Since TRANPIN, presently, is running in serial mode, it was not possible to use DP2 expansion of angular flux for the present problem. To run the DP2 option, it is mandatory to parallelize the code system. The pin-by-pin fission density distributions and the comparison thereof with reported benchmark results for the above two benchmarks is not presented here and can be seen in [1] and [2]. Conclusions A whole core transport theory code TRANPIN in 2D hexagonal geometry has been developed. The code performs the full core calculation, without homogenizing the various lattice cells present in the FAs, in multi group formalism. The code TRANPIN uses the interface current method based on 2D collision probability to solve the transport equation for the whole core problem. The individual cells in the FA are subdivided into finer regions. The coupling of cells within an assembly and inter assembly coupling is achieved using interface currents. The incoming/outgoing angular flux at the lattice cells interface is expanded in PN functions. The expansion is limited to P2. Albedo boundary condition is applied at the outermost surfaces of the cells. TRANPIN has been benchmarked and validated against the two benchmark problems viz. a simplified HTTR benchmark problem and the OECD VVER-1000 MOX Core Computational Benchmark. The eigenvalue for the core, assembly averaged and detailed pin-by-pin fission density distributions compare well with the reported Monte Carlo values for the two problems. Due to the fine discretization of space and energy domains in TRANPIN, the whole core calculation is computationally intensive
task for problems of practical interest. The computational time in TRANPIN for 2D/3D calculations for such problems can be optimized by implementing the parallelizing and flux accelerating algorithms and innovative memory management. Acknowledgements
The first author is thankful to Dr. V. Jagannathan, Ex-Head, LWRPS, RPDD for useful discussions.
References [1] Suhail Ahmad Khan, “Development of Transport Model for Whole Core Pin-by-Pin Calculation in 2D Geometry”, Ph.D. Thesis, HBNI (2017) [2] Suhail Ahmad Khan, Umasankari Kannan and V. Jagannathan, “Development of Whole Core Pin by Pin Transport Theory Model in Hexagonal Geometry”, Annals of Nuclear Energy 104, 214 (2017) [3] Sanchez R., “Approximate Solutions of the Two-Dimensional Integral Transport Equation by Collision Probability Methods”, Nucl. Sci. Eng, 64, 384 (1987). [4] Marleau G, Dragon Theory Manual Part 1: Collision Probability Calculations, IGE-236 Rev. 1, (2001) [5] Zhang Z., Rahnema F., Pounders J. M., Zhang D. and Ougouag A. “A Simplified 2D HTTR Benchmark Problem”, Proc. Int. Conf. on Mathematics,Computational Methods & Reactor Physics (M&C 2009), Saratoga Springs, New York, May 3-7, 2009. (2009) [6] VVER-1000 MOX Core Computational Benchmark, NEA/NSC/DOC 17 (2005) [7] Khan S. A., Jagannathan V., Pal U., Karthikeyan R. and Srivastava A., “Need for High Temperature Nuclear Data Library for LWR Design Computations”, Journal of the Korean Physical Society, 59 (2), 1073 (2011)
111
Advances in X-ray & neutron imaging: Developments and Applications
Ashish Kumar Agrawal, B.Singh, Y. S. Kashyap, Mayank Shukla, S.C. Gadkari
Technical Physics Division
Ashish Kumar Agrawal is the recipient of the DAE Young Applied Scientist/Technology Award for the year 2016
We have designed, developed, installed and commissioned two novel facilities for X-ray & neutron imaging - an X-ray imaging beamline (BL-4)at Indus-2 synchrotron source and a neutron imaging beamline at CIRUS reactor (now shifted at DRUVA reactor).These facilities are implemented with several advanced imaging techniques such as phase contrast imaging; diffraction enhanced imaging, micro tomography etc. to achieve new milestones in image quality to offer solutions to various problems related to microstructure and density mapping in material,, bio-medical, agriculture and engineering research. Both of these facilities have been applied to several problems of departmental interest and utilized by external users for various technologically relevant applications.
Introduction
Conventionally X-ray & Neutron based imaging techniques such as radiography& computed tomography are quite popularly used in non-destructive testing, clinical diagnostics, and security applications. However, when applied to various research problems in materials, bio-medical science and engineering, they pose several limitations in terms of resolution & contrast. With the emergence of novel technologies in X-ray & neutron sources, innovative designs in their optics and development of new imaging detectors, several new techniques are being proposed in X-ray & neutron imaging with new modes ofcontrast and much higher resolution. Enormous photon flux densities & coherence offered by synchrotron X-ray sources has led to a paradigm shift in X-ray imaging [1]. Similarly reactor based thermal neutrons were used for high-resolution digital radiography, tomography and phase contract imaging with the design of unique collimation and detector instrumentations. In this report, we have discussed design features of these imaging
facilities, their characteristics, techniques and some important applications.
Development of Synchrotron based X-ray imaging beamline
Third generation synchrotron sources has led to revolutionary advances in X-ray imaging. Their high brilliance, coherence and energy tunability allow faster image acquisition with better sensitivity and higher resolution.Advanced techniques developed atsynchrotronsuch as allow phase contrast & diffraction enhanced imaging, holo-tomographycoherent diffraction imaging, dark field imaging, fluorescence imaging,real-time and In-situ imaging are being applied to solve a variety of problems in material science and biology. Internal microstructure of advanced materials such as composites, foams, biomaterials etc. can be visualized and quantified to optimize their fabrication and study mechanical or transport properties through structure property relation.In view of immense interests and applications of synchrotron based X-ray imaging;we have designed, developed, installed and commissioned an X-ray imaging beamline at Indus-2 synchrotron
112
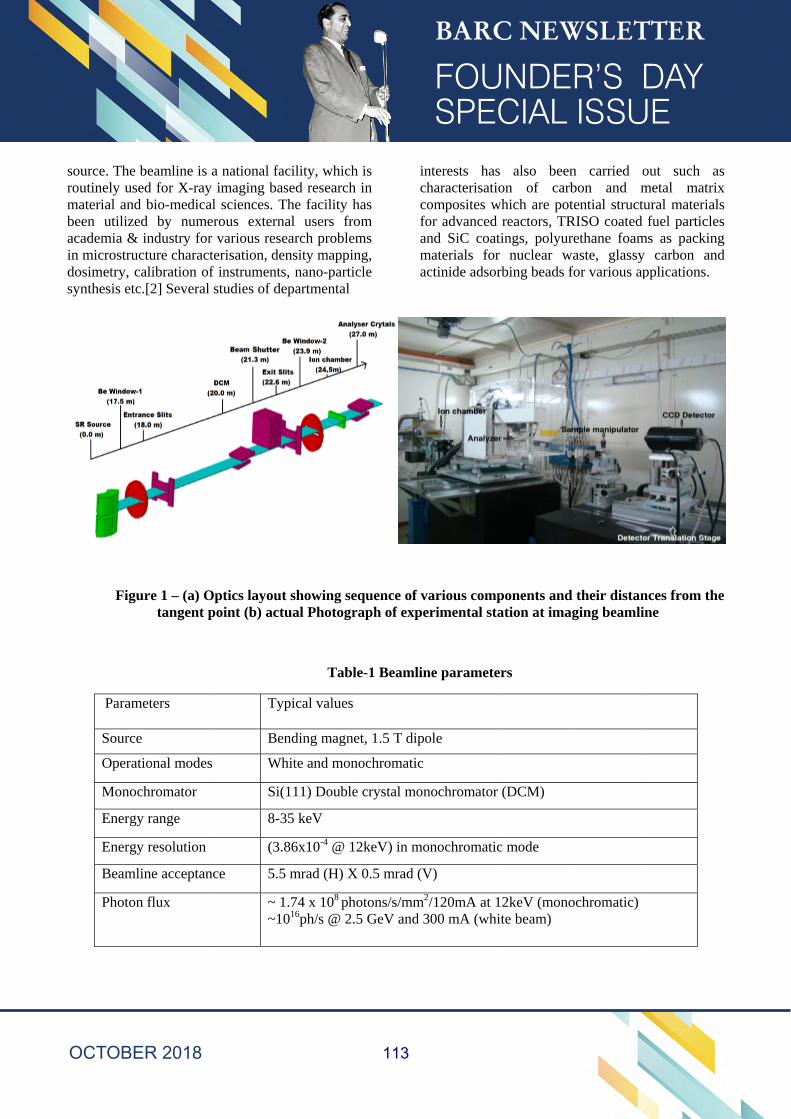
srmbainds
source. The broutinely usematerial and been utilizedacademia & n microstruc
dosimetry, casynthesis etc.
Figu
Parame
Source
Operati
Monoc
Energy
Energy
Beamli
Photon
beamline is aed for X-ray
bio-medicald by numerindustry for
cture charactealibration of .[2] Several s
ure 1 – (a) Otangent p
eters
ional modes
hromator
y range
y resolution
ine acceptanc
n flux
a national facimaging bas
l sciences. Trous externavarious reseerisation, den
f instrumentsstudies of de
ptics layoutpoint (b) actu
Typ
Ben
Wh
Si(
8-3
(3.8
ce 5.5
~ 1~10
cility, whichsed research
The facility hal users froearch problemnsity mappin, nano-partic
epartmental
t showing seual Photogr
Table
pical values
nding magne
hite and mon
111) Double
5 keV
86x10-4 @ 12
mrad (H) X
.74 x 108 pho016ph/s @ 2.5
h is in
has om ms ng, cle
inchcofoanmac
quence of vaaph of expe
e-1 Beamlin
et, 1.5 T dipo
nochromatic
e crystal mon
2keV) in mo
X 0.5 mrad (V
otons/s/mm2/5 GeV and 3
nterests has haracterisatioomposites wor advanced nd SiC coat
materials for ctinide adsor
arious comprimental sta
ne paramete
ole
nochromator
onochromatic
V)
/120mA at 100 mA (whi
also beenon of carb
which are potreactors, TRings, polyur
nuclear wrbing beads f
ponents andation at ima
rs
(DCM)
c mode
2keV (monote beam)
n carried obon and mtential structuRISO coated rethane foam
waste, glassyfor various ap
d their distanging beamli
ochromatic)
out such ametal matriural materiafuel particle
ms as packiny carbon anpplications.
nces from thine
as ix ls es ng nd
he
113
Beamline Design and special features
Indus-2 is a 2.5 GeV, 300 mA third generation synchrotron sources,at Raja Ramanna Centre of Advanced Technology, Indore, India with a critical wavelength of 2 Å. The imaging beamline is installed at its 100 port of bending magnet section (DP-2, BL-4) synchrotron source. The beamline is designed to operate in monochromatic and white beam mode. Important beamline parameters are summarized in Table 1. The optical layout of the beamline and the distances of its major components from the source are shown in the Figure-1. The beamline consists of optics hutch, experimental station, and control room. The optics hutch consists of all components required for beam shaping, diagnostics and energy tunability. Beryllium (Be) windowrestricts the beam divergence to 0.5mrad (V) X 5.5 mrad (H) and reduces its heat-load.ABlade beam position monitor is installed to measure beam position and stability which is followed by a pair of entrance slits for shaping the beam as per the experimental requirements. For selecting the desired energy of monochromatic beam in the energy range (8-35 keV), the beamline uses a double crystal monochromator (DCM) with a pair of Si (111) crystals. DCM has a provision to lower the first crystal to allow passage of the white beam without changing its spectrum. An ionization chamber for online beam intensity monitoring and a fast shutter for controlled irradiation of live samples have also been installed. The beamline implements absorption, in-line & grating based phase contrast, diffraction enhanced imaging in the same experimental station. These techniques can also be utilized for 3D tomographic imaging, real-time imaging and in-situ imaging under external stress applied. The experimental station consists of all the instruments such as translation and rotation stages for sample and detector positioning and alignment, imaging detectors, beam analyser crystals and gratings, vibration free optical tables etcrequired to implement these experiments. Several imaging detector are used to achieve a range of spatial & temporal resolution, field of view, efficiency etc. A micro-CT compression and tensile stage with load cell 500N and 3KN has been installed for in-situ imaging and tomography experiments. All the components in experimental
hutch are installed over a vibration isolated optical table to avoid image smearing due to system instabilities.In-house developed data acquisition software is used to acquire imaging and tomography data for various detectors. All the components of optics hutch and experimental station are controlled remotely. The beamline uses a GPU based multicore computing facility for tomography data reconstruction and visualization[2].
Imaging experiments
Absorption contrast imaging is used to obtain the distribution of the attenuation coefficients for strongly absorbing materials whereas In-line phase contrast imaging, used for electron density mapping is the simplest phase contrast technique requiring only a partially coherent source and high-resolution detector. It is very useful for imaging of weakly absorbing materials and offers improved visibility of layered interfaces with small density gradients. Grating based phase contrast and diffraction enhanced imaging offer even higher sensitivity to small density variation however with increased instrumental complexity i.e.they require utilization of an X-ray diffraction grating and crystal analyser with their precise micro-radian alignment to unwrap the phase modulation introduced by the object in the image. We have implemented and applied all these advanced techniques at imaging beamline. An illustrative example of this is shown in figure-2 (a,b,c) where absorption, phase and dark-field contrast image of TRISO coated fuel particle is shown. The PyC layers of very close material density, which are not clearly distinguished in absorption contrast image, are clearly visible with some fine density variations in phase contrast and dark-field image. Micro-tomography is used for 3D imaging of objects in absorption and phase contrast modes to determine the 3D distribution of linear attenuation coefficient and refractive index respectively. X-ray micro-tomography experiments were carried out on a polyurethane foam sample to study its microstructure. The projection, reconstructed slice and 3D volume rendered image of the sample is shown in Figure-3 (a, b, c).While projection images hardly identify porous microstructure of the sample, tomography reconstructed slice image
114
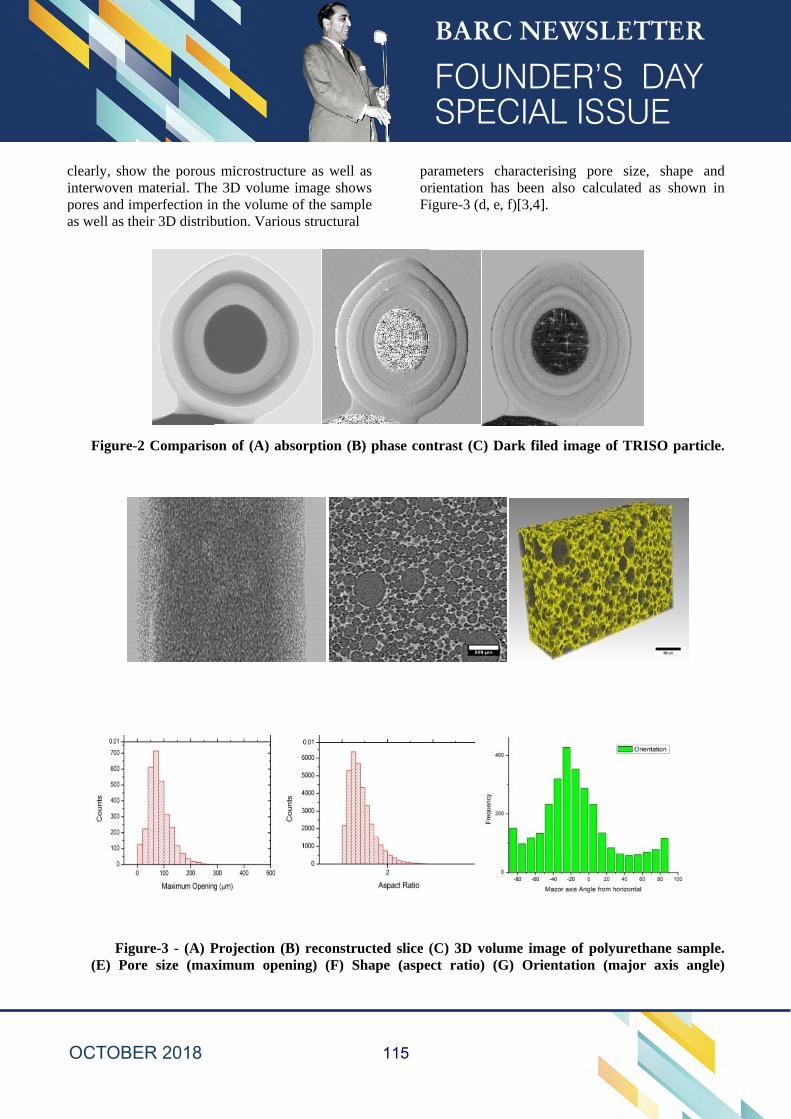
cinpa
clearly, shownterwoven m
pores and imas well as the
Figure-2
Figu(E) Pore
w the porousmaterial. The
mperfection ineir 3D distrib
2 Compariso
re-3 - (A) Pe size (max
s microstructe 3D volumen the volumebution. Vario
on of (A) ab
Projection (Bximum open
ture as well e image showe of the sampous structural
bsorption (B
B) reconstrning) (F) S
as ws ple l
paorFi
B) phase con
ucted slice Shape (aspe
arameters crientation haigure-3 (d, e
ntrast (C) D
(C) 3D voluect ratio) (G
haracterisingas been also, f)[3,4].
Dark filed im
ume image oG) Orientat
g pore sizeo calculated
mage of TRI
of polyurethtion (major
e, shape anas shown i
ISO particl
hane samplr axis angle
nd in
e.
e. e)
115
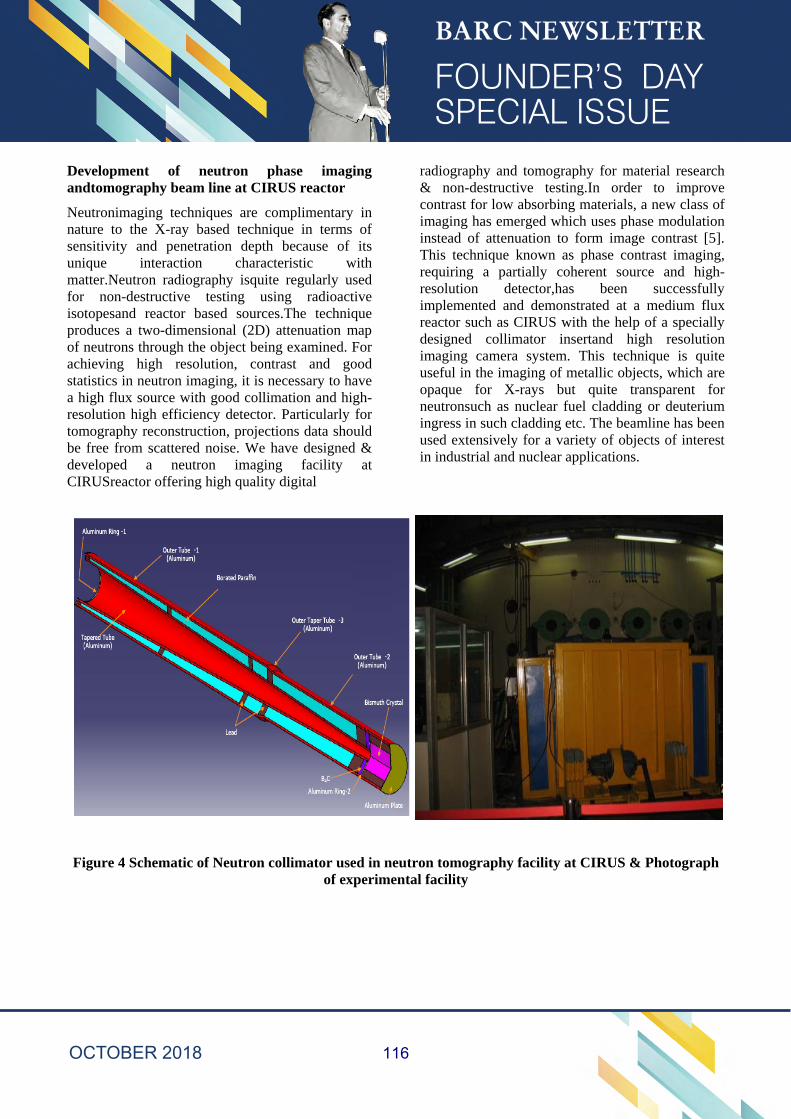
Development of neutron phase imaging andtomography beam line at CIRUS reactor
Neutronimaging techniques are complimentary in nature to the X-ray based technique in terms of sensitivity and penetration depth because of its unique interaction characteristic with matter.Neutron radiography isquite regularly used for non-destructive testing using radioactive isotopesand reactor based sources.The technique produces a two-dimensional (2D) attenuation map of neutrons through the object being examined. For achieving high resolution, contrast and good statistics in neutron imaging, it is necessary to have a high flux source with good collimation and high-resolution high efficiency detector. Particularly for tomography reconstruction, projections data should be free from scattered noise. We have designed & developed a neutron imaging facility at CIRUSreactor offering high quality digital
radiography and tomography for material research & non-destructive testing.In order to improve contrast for low absorbing materials, a new class of imaging has emerged which uses phase modulation instead of attenuation to form image contrast [5]. This technique known as phase contrast imaging, requiring a partially coherent source and high-resolution detector,has been successfully implemented and demonstrated at a medium flux reactor such as CIRUS with the help of a specially designed collimator insertand high resolution imaging camera system. This technique is quite useful in the imaging of metallic objects, which are opaque for X-rays but quite transparent for neutronsuch as nuclear fuel cladding or deuterium ingress in such cladding etc. The beamline has been used extensively for a variety of objects of interest in industrial and nuclear applications.
Figure 4 Schematic of Neutron collimator used in neutron tomography facility at CIRUS & Photograph of experimental facility
116
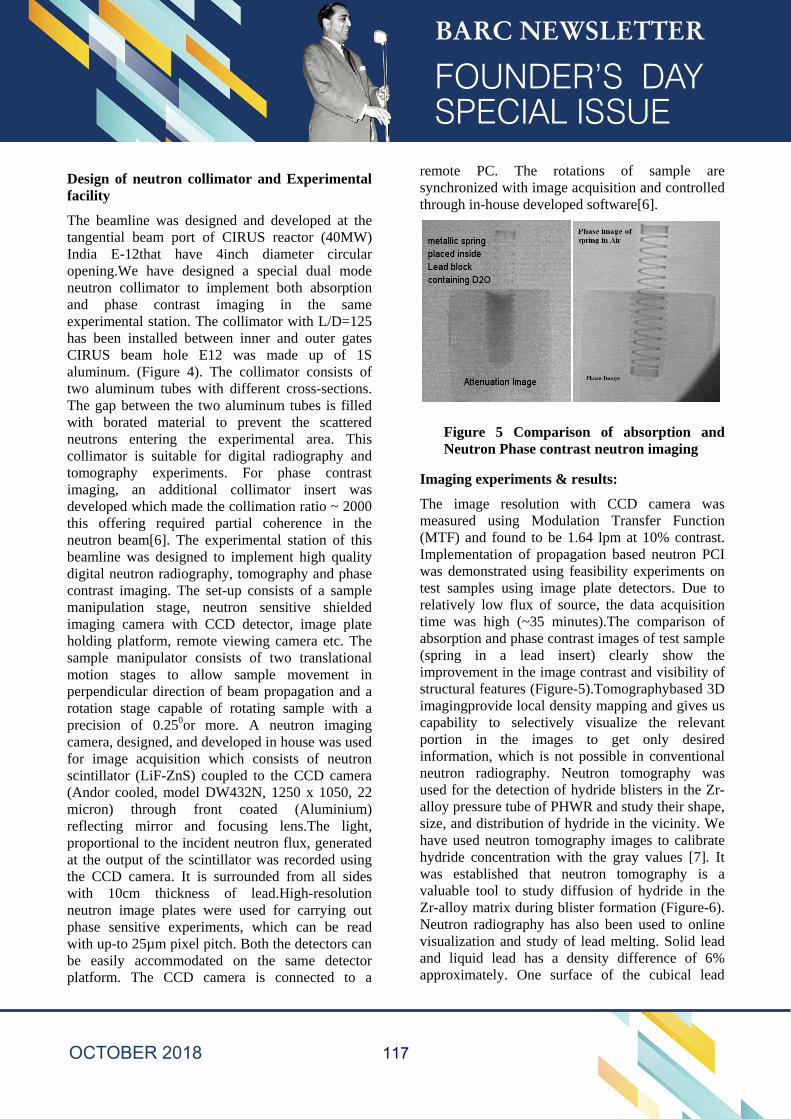
Design of neutron collimator and Experimental facility
The beamline was designed and developed at the tangential beam port of CIRUS reactor (40MW) India E-12that have 4inch diameter circular opening.We have designed a special dual mode neutron collimator to implement both absorption and phase contrast imaging in the same experimental station. The collimator with L/D=125 has been installed between inner and outer gates CIRUS beam hole E12 was made up of 1S aluminum. (Figure 4). The collimator consists of two aluminum tubes with different cross-sections. The gap between the two aluminum tubes is filled with borated material to prevent the scattered neutrons entering the experimental area. This collimator is suitable for digital radiography and tomography experiments. For phase contrast imaging, an additional collimator insert was developed which made the collimation ratio ~ 2000 this offering required partial coherence in the neutron beam[6]. The experimental station of this beamline was designed to implement high quality digital neutron radiography, tomography and phase contrast imaging. The set-up consists of a sample manipulation stage, neutron sensitive shielded imaging camera with CCD detector, image plate holding platform, remote viewing camera etc. The sample manipulator consists of two translational motion stages to allow sample movement in perpendicular direction of beam propagation and a rotation stage capable of rotating sample with a precision of 0.250or more. A neutron imaging camera, designed, and developed in house was used for image acquisition which consists of neutron scintillator (LiF-ZnS) coupled to the CCD camera (Andor cooled, model DW432N, 1250 x 1050, 22 micron) through front coated (Aluminium) reflecting mirror and focusing lens.The light, proportional to the incident neutron flux, generated at the output of the scintillator was recorded using the CCD camera. It is surrounded from all sides with 10cm thickness of lead.High-resolution neutron image plates were used for carrying out phase sensitive experiments, which can be read with up-to 25µm pixel pitch. Both the detectors can be easily accommodated on the same detector platform. The CCD camera is connected to a
remote PC. The rotations of sample are synchronized with image acquisition and controlled through in-house developed software[6].
Figure 5 Comparison of absorption and Neutron Phase contrast neutron imaging
Imaging experiments & results:
The image resolution with CCD camera was measured using Modulation Transfer Function (MTF) and found to be 1.64 lpm at 10% contrast. Implementation of propagation based neutron PCI was demonstrated using feasibility experiments on test samples using image plate detectors. Due to relatively low flux of source, the data acquisition time was high (~35 minutes).The comparison of absorption and phase contrast images of test sample (spring in a lead insert) clearly show the improvement in the image contrast and visibility of structural features (Figure-5).Tomographybased 3D imagingprovide local density mapping and gives us capability to selectively visualize the relevant portion in the images to get only desired information, which is not possible in conventional neutron radiography. Neutron tomography was used for the detection of hydride blisters in the Zr-alloy pressure tube of PHWR and study their shape, size, and distribution of hydride in the vicinity. We have used neutron tomography images to calibrate hydride concentration with the gray values [7]. It was established that neutron tomography is a valuable tool to study diffusion of hydride in the Zr-alloy matrix during blister formation (Figure-6). Neutron radiography has also been used to online visualization and study of lead melting. Solid lead and liquid lead has a density difference of 6% approximately. One surface of the cubical lead
117

bpc
block is heapoint. The conduction as
Figure a
ated from onheat trans
s well as con
6 Radiograpand blister (r
ne side up smission isnvection henc
ph of Zircolrendered gr
Figure 7
to its meltins caused bce a definite
lloy tube conreen) and cal
7Different s
ng by
pathin
ntaining hydlibration of
tages of mel
attern of mehe information the bulk.
dride blisterhydride con
lting phenom
elted portionon about the
rs, 3D volumncentration
mena in lead
n is observedheat transmi
me renderingwith gray v
d
d which giveission proces
g of the tubevalues.
es ss
e
118
References
[1]José Baruchel, Pierre Bleuet, Alberto Bravin, Paola Coan, Enju Lima, Anders Madsen, Wolfgang Ludwig, Petra Pernot, Jean Susini ;Advances in synchrotron hard X-ray based imaging C. R. Physique 9 (2008) 624–641
[2]Eric N. Landis, Denis T. Keane X-ray micro tomography; materials characterization 61 (2010) 1305 – 1316
[3]A. K. Agrawal, B. Singh, Y.S. Kashyap, M. Shukla, P. S. Sarkar, A.Sinha; Design, development and first experiments on the X-ray Imaging Beamline at Indus-2 synchrotron source RRCAT, India, J. Synchrotron Rad. 22, (2015) 1531–1539.
[4] A.K. Agrawal, P.S. Sarkar, B. Singh, Y.S. Kashyap, P.T. Rao, A. Sinha, App. Rad. & Isotopes; Application of X-ray micro-CT for micro-structural charecterisation of APCVD deposited SiC coatings on graphite conduit;108 (2016) 133-142
[5] J. S. Brenizer A review of significant advances in neutron imaging from conception to the present Physics Procedia 43 ( 2013 ) 10 – 20
[6] Yogesh S. Kashyap, Ashish Agrawal, P. S. Sarkar, Mayank Shukla, Tushar Roy and Amar Sinha, Neutron phase contrast imaging beamline at CIRUS, reactor India: Applied Radiation and Isotopes, 70, 625 (2012).
[7]Ashish Agrawal, Yogesh Kashyap, P. S. Sarkar, A. N. Behra, M. Shukla, R. N. Singh, Amar Sinha, J. K. Chakravartty, Study of Hydride blisters in Zr-alloy using Neutron tomography; Journal of Nuclear materials, 421,47,(2012).
119
Development of Microwave Direct Denitration Technology for Recycling of Rejected
(U,Pu)O2 MOX Fuel
G. Singha,c, Pradeep Kumarb,c, S. C. Ahera, P. Purohita, A. G. Kelkara, D. K. Dasd, D. B. Sathea, R. B. Bhatta, P. G. Beherea
a: Advanced Fuel Fabrication Facility (AFFF), NRB, BARC Tarapur b: Integrated Fuel Fabrication Facility (IFFF), BARC, Mumbai
c: Homi Bhabha National Institute (HBNI), Mumbai d: Radio-Metallurgy Division (RMD), BARC, Mumbai
Gitender Singh is the recipient of the DAE Young Applied Scientist / Technology
Award for the year 2016
Abstract
During the manufacturing of (U,Pu)O2 mixed oxide (MOX) fuel for Prototype Fast Breeder Reactor (PFBR), approximately 25% (averaged/ batch) got rejected due to non-conformity to the fuel specifications. This paper reports the development of a novel method for efficient recycling of rejected (U,Pu)O2 fuel by microwave direct denitration technology. Rejected fuel more than 3 tonne was recycled successfully using the developed method during the first core campaign of PFBR MOX consequent to finding impracticality through the more traditional method of thermal oxidation-reduction. The process of recycling, characterization of the recycled powder (sp. surface area, particle size, phase using XRD, O/M, impurities etc.) and that of fuel fabricated (sinter density, fissile homogeneity etc.) are presented in detail.
Keywords: MOX fuel, Recycling, Microwave, Direct denitration, PFBR
Introduction
AFFF, Tarapur is an industrial MOX fuel plant and presently engaged in manufacturing of (U,Pu)O2 fuel for PFBR. The MOX fuel has two compositions as (U,21%Pu)O2 and (U,28%)PuO2. The fuel is manufactured by standard powder-pellet process involving several unit operations like mechanical blending of constituents (Depleted UO2 and PuO2) in an attritor, compaction of blended powder into cylindrical pellets, sintering at 1700 oC in reducing
environment and encapsulation of pellets in clad tubes [1]. The fuel batches are rejected which do not meet the fuel specifications for size, composition, density, PuO2 agglomerates, impurities etc. or owing to unacceptable physical defects. The rejected fuel is further categorized into two distinct classes; a) clean rejected oxide (CRO) and b) dirty rejected oxide (DRO) on the basis of chemical impurity content. The CRO and DRO individually shares nearly 20% and 5% mixed oxide averaged per batch respectively.
120
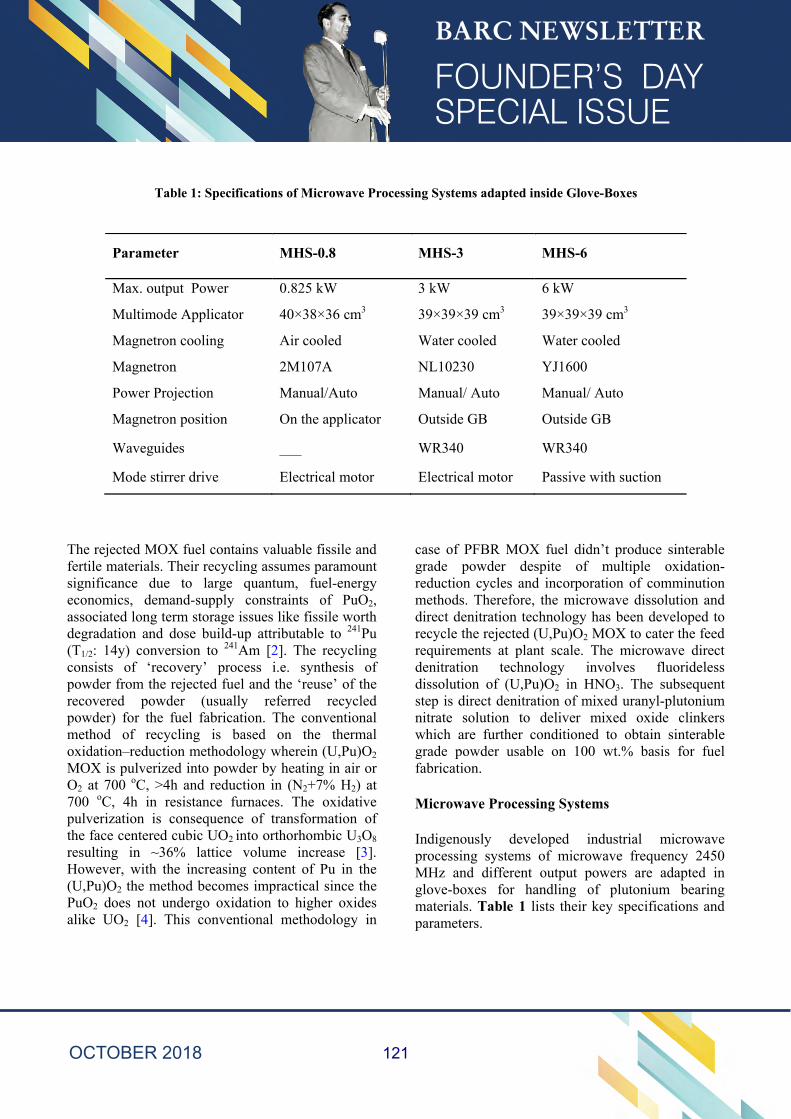
Table 1: Specifications of Microwave Processing Systems adapted inside Glove-Boxes
Parameter MHS-0.8 MHS-3 MHS-6
Max. output Power 0.825 kW 3 kW 6 kW
Multimode Applicator 40×38×36 cm3 39×39×39 cm3 39×39×39 cm3
Magnetron cooling Air cooled Water cooled Water cooled
Magnetron 2M107A NL10230 YJ1600
Power Projection Manual/Auto Manual/ Auto Manual/ Auto
Magnetron position On the applicator Outside GB Outside GB
Waveguides ___ WR340 WR340
Mode stirrer drive Electrical motor Electrical motor Passive with suction
The rejected MOX fuel contains valuable fissile and fertile materials. Their recycling assumes paramount significance due to large quantum, fuel-energy economics, demand-supply constraints of PuO2, associated long term storage issues like fissile worth degradation and dose build-up attributable to 241Pu (T1/2: 14y) conversion to 241Am [2]. The recycling consists of ‘recovery’ process i.e. synthesis of powder from the rejected fuel and the ‘reuse’ of the recovered powder (usually referred recycled powder) for the fuel fabrication. The conventional method of recycling is based on the thermal oxidation–reduction methodology wherein (U,Pu)O2 MOX is pulverized into powder by heating in air or O2 at 700 oC, >4h and reduction in (N2+7% H2) at 700 oC, 4h in resistance furnaces. The oxidative pulverization is consequence of transformation of the face centered cubic UO2 into orthorhombic U3O8 resulting in ~36% lattice volume increase [3]. However, with the increasing content of Pu in the (U,Pu)O2 the method becomes impractical since the PuO2 does not undergo oxidation to higher oxides alike UO2 [4]. This conventional methodology in
case of PFBR MOX fuel didn’t produce sinterable grade powder despite of multiple oxidation-reduction cycles and incorporation of comminution methods. Therefore, the microwave dissolution and direct denitration technology has been developed to recycle the rejected (U,Pu)O2 MOX to cater the feed requirements at plant scale. The microwave direct denitration technology involves fluorideless dissolution of (U,Pu)O2 in HNO3. The subsequent step is direct denitration of mixed uranyl-plutonium nitrate solution to deliver mixed oxide clinkers which are further conditioned to obtain sinterable grade powder usable on 100 wt.% basis for fuel fabrication.
Microwave Processing Systems
Indigenously developed industrial microwave processing systems of microwave frequency 2450 MHz and different output powers are adapted in glove-boxes for handling of plutonium bearing materials. Table 1 lists their key specifications and parameters.
121
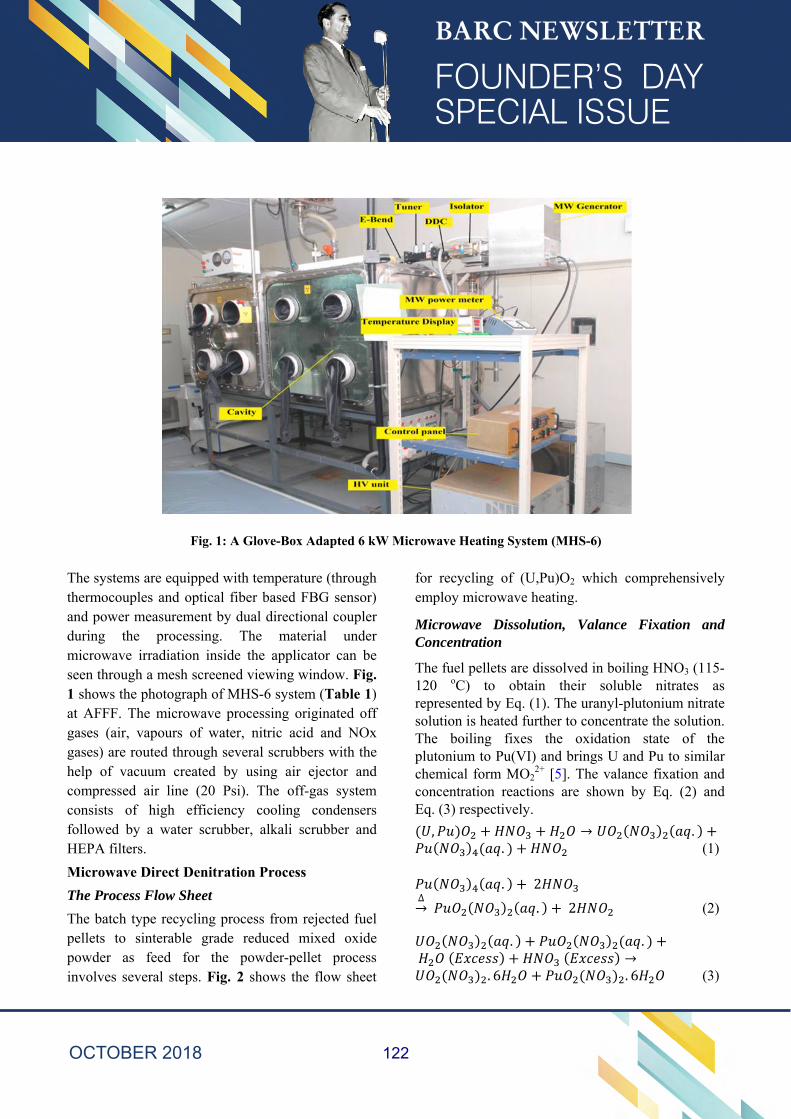
Fig. 1: A Glove-Box Adapted 6 kW Microwave Heating System (MHS-6)
The systems are equipped with temperature (through thermocouples and optical fiber based FBG sensor) and power measurement by dual directional coupler during the processing. The material under microwave irradiation inside the applicator can be seen through a mesh screened viewing window. Fig. 1 shows the photograph of MHS-6 system (Table 1) at AFFF. The microwave processing originated off gases (air, vapours of water, nitric acid and NOx gases) are routed through several scrubbers with the help of vacuum created by using air ejector and compressed air line (20 Psi). The off-gas system consists of high efficiency cooling condensers followed by a water scrubber, alkali scrubber and HEPA filters.
Microwave Direct Denitration Process
The Process Flow Sheet
The batch type recycling process from rejected fuel pellets to sinterable grade reduced mixed oxide powder as feed for the powder-pellet process involves several steps. Fig. 2 shows the flow sheet
for recycling of (U,Pu)O2 which comprehensively employ microwave heating.
Microwave Dissolution, Valance Fixation and Concentration
The fuel pellets are dissolved in boiling HNO3 (115-120 oC) to obtain their soluble nitrates as represented by Eq. (1). The uranyl-plutonium nitrate solution is heated further to concentrate the solution. The boiling fixes the oxidation state of the plutonium to Pu(VI) and brings U and Pu to similar chemical form MO2
2+ [5]. The valance fixation and concentration reactions are shown by Eq. (2) and Eq. (3) respectively.
, → .. (1)
. 2 ∆→ . 2 (2)
. . →
. 6 . 6 (3)
122

Fig. 2: Flow sheet for Recycling of (U,Pu)O2 MOX by Microwave Direct Denitration
Microwave De-hydration and Denitration
The process of partial dehydration of nitrate crystals at 120-300 oC is shown by Eq. (4). Further, the dehydration and denitration occurs concurrently forming uranyl-plutonyl hydroxy nitrate represented
by Eq. (5) [6]. The hydroxy nitrates are decomposed to respective oxides on further heating above 300 oC resulting in UO3 and PuO2 as shown in Eq. (6) and Eq. (7). The temperature-power versus time profile for a batch denitration is shown in Fig. 3.
123
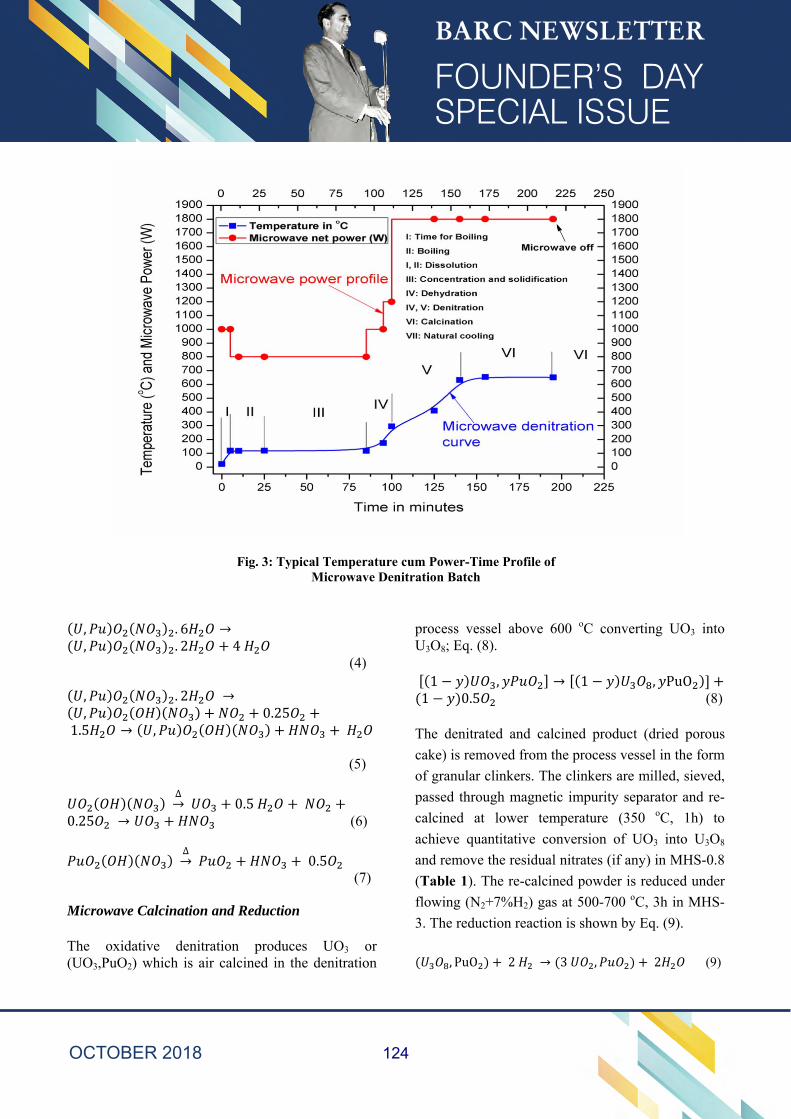
Fig. 3: Typical Temperature cum Power-Time Profile of Microwave Denitration Batch
, . 6 →, . 2 4
(4)
, . 2 →, 0.25
1.5 → , (5)
∆→ 0.5
0.25 → (6)
∆→ 0.5
(7)
Microwave Calcination and Reduction
The oxidative denitration produces UO3 or (UO3,PuO2) which is air calcined in the denitration
process vessel above 600 oC converting UO3 into U3O8; Eq. (8).
1 , → 1 , PuO1 0.5 (8)
The denitrated and calcined product (dried porous
cake) is removed from the process vessel in the form
of granular clinkers. The clinkers are milled, sieved,
passed through magnetic impurity separator and re-
calcined at lower temperature (350 oC, 1h) to
achieve quantitative conversion of UO3 into U3O8
and remove the residual nitrates (if any) in MHS-0.8
(Table 1). The re-calcined powder is reduced under
flowing (N2+7%H2) gas at 500-700 oC, 3h in MHS-
3. The reduction reaction is shown by Eq. (9).
, PuO 2 → 3 , 2 (9)
124
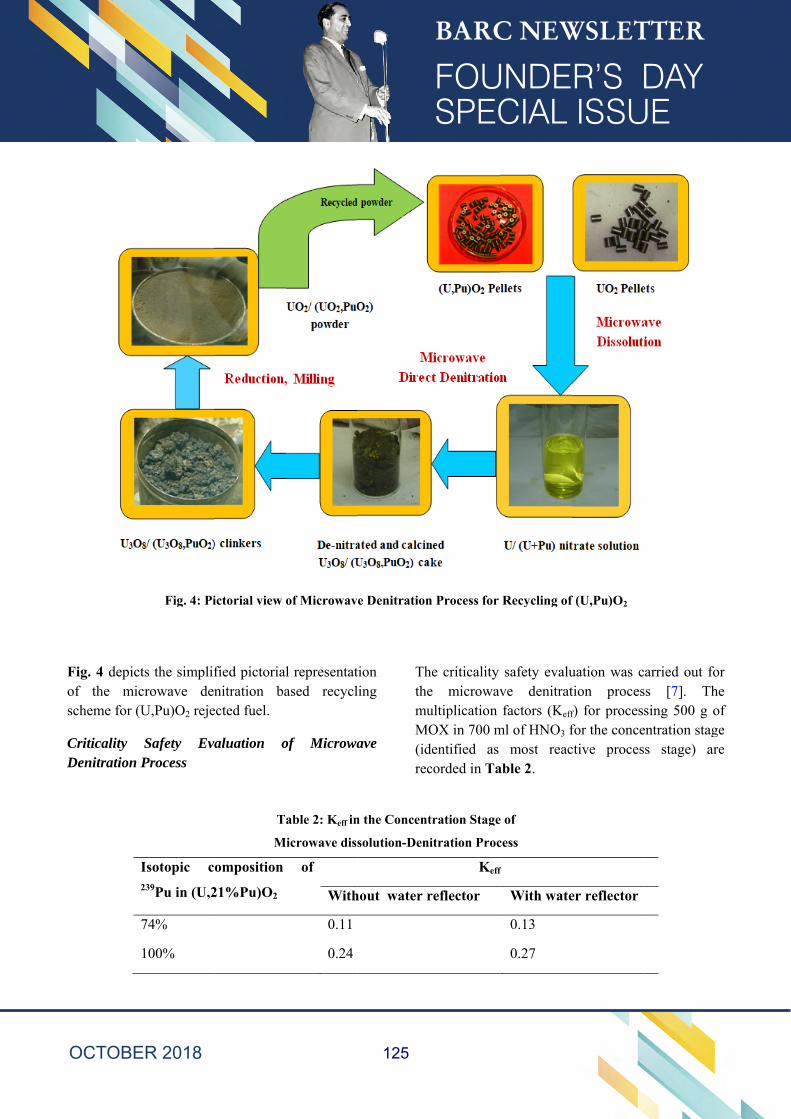
Fos
CD
Fig. 4 depictof the micscheme for (U
Criticality Denitration P
I2
7
1
Fig. 4: Pi
ts the simplifcrowave denU,Pu)O2 reje
Safety EvaProcess
Isotopic c239Pu in (U,2
74%
100%
ictorial view o
fied pictorialnitration ba
ected fuel.
aluation o
T
M
omposition
21%Pu)O2
of Microwav
l representatased recycl
of Microwa
able 2: Keff in
Microwave diss
of
With
0.11
0.24
e Denitration
tion ling
ave
ThthemuMO(idrec
n the Concent
solution-Den
hout water r
n Process for
he criticality e microwavultiplication OX in 700 m
dentified as corded in Ta
tration Stage
itration Proc
Keff
reflector
Recycling of
safety evaluve denitratfactors (Keff
ml of HNO3 fmost reac
able 2.
e of
cess
f
With wate
0.13
0.27
f (U,Pu)O2
uation was ction proces
f) for procesfor the concective proces
er reflector
carried out foss [7]. Thsing 500 g o
entration stagss stage) ar
or he of ge re
125
Table 3: Quantum of Rejected Fuel Recycled
using Microwave Denitration Method
Material Description Quantity (Kg) Linkage to Programme
Deeply Depleted UO2 400 PFBR axial blanket
(U,21%U)O2 910 PFBR MOX, Enrichment-I
(U,28%U)O2 2440 PFBR MOX, Enrichment-II
Fuel Fabrication using Recycled Powder
The microwave denitration based recycling is extensively studied and established to recycle
rejected fuel during PFBR campaign. Table 3 records the quantity of the rejected fuel recycled and reused for fabrication of fuel by powder-pellet process at AFFF.
Table 4: Powder properties during Recycling of
(U,21%Pu)O2 by microwave process
Property Denitrated-
calcined clinkers
Microwave Re-
calcined powder
Microwave
Reduced powder
Chemical Form (U3O8,PuO2) (U3O8,PuO2) (UO2+x,PuO2)
O/M ratio, (M = U+Pu) 2.57 2.52 2.05
Bulk density (gcm-3) 1.0 2.1 2.6
Average particle size (µm) ----- 7-10 7-10
Sp. surface area (m2g-1) ----- 5.23 4.87
126
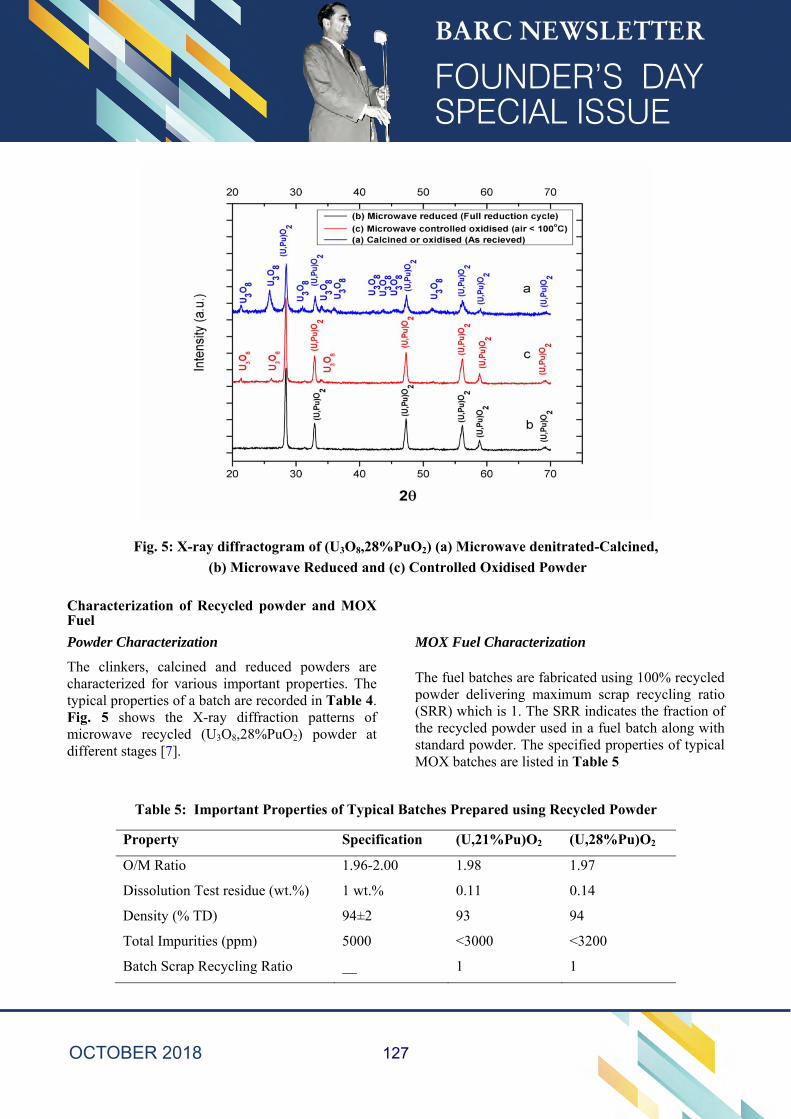
Fig. 5: X-ray diffractogram of (U3O8,28%PuO2) (a) Microwave denitrated-Calcined,
(b) Microwave Reduced and (c) Controlled Oxidised Powder
Characterization of Recycled powder and MOX Fuel
Powder Characterization
The clinkers, calcined and reduced powders are characterized for various important properties. The typical properties of a batch are recorded in Table 4. Fig. 5 shows the X-ray diffraction patterns of microwave recycled (U3O8,28%PuO2) powder at different stages [7].
MOX Fuel Characterization
The fuel batches are fabricated using 100% recycled powder delivering maximum scrap recycling ratio (SRR) which is 1. The SRR indicates the fraction of the recycled powder used in a fuel batch along with standard powder. The specified properties of typical MOX batches are listed in Table 5
Table 5: Important Properties of Typical Batches Prepared using Recycled Powder
Property Specification (U,21%Pu)O2 (U,28%Pu)O2
O/M Ratio 1.96-2.00 1.98 1.97
Dissolution Test residue (wt.%) 1 wt.% 0.11 0.14
Density (% TD) 94±2 93 94
Total Impurities (ppm) 5000 <3000 <3200
Batch Scrap Recycling Ratio __ 1 1
127
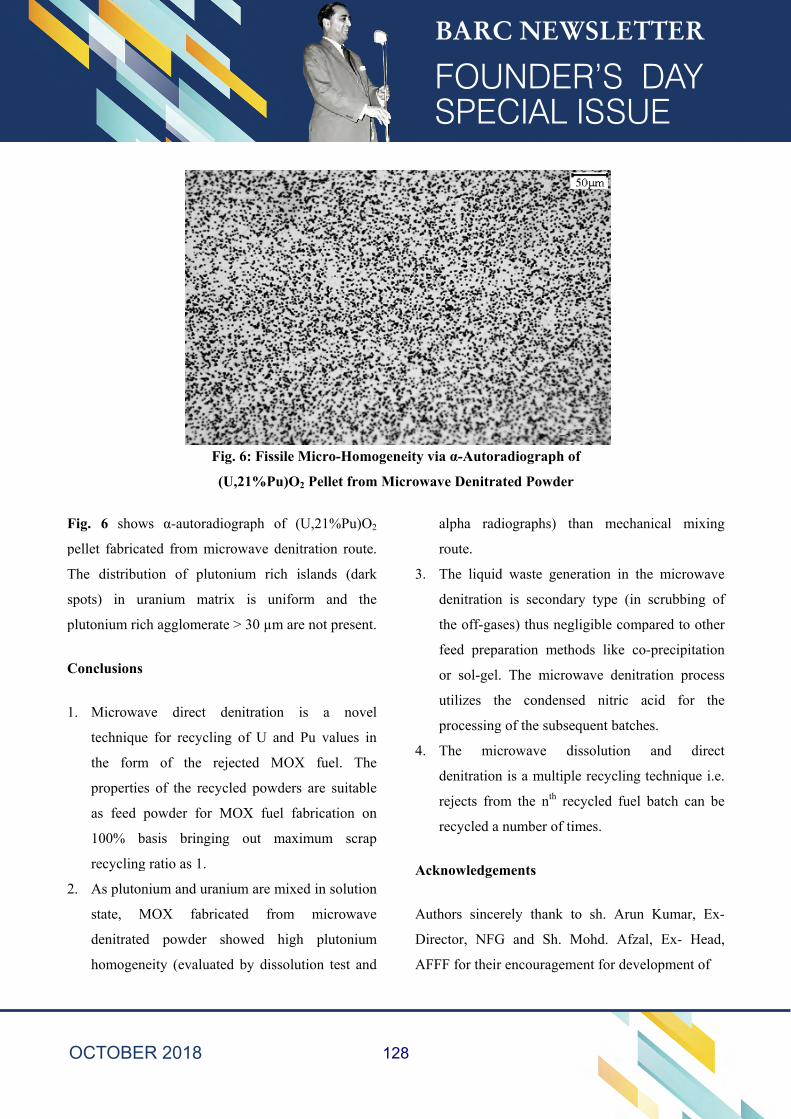
F
p
T
s
p
C
1
2
Fig. 6 show
pellet fabrica
The distribu
spots) in u
plutonium ric
Conclusions
1. Microwa
technique
the form
propertie
as feed
100% b
recycling
2. As pluton
state, M
denitrated
homogen
F
ws α-autorad
ated from m
ution of plu
uranium ma
ch agglomera
ave direct
e for recycli
m of the r
es of the rec
powder for
basis bringi
g ratio as 1.
nium and ura
MOX fabri
d powder
neity (evalua
Fig. 6: Fissil
(U,21%Pu)
diograph of
microwave de
utonium rich
trix is uni
ate > 30 µm
denitration
ing of U an
rejected MO
ycled powde
MOX fuel
ing out ma
anium are mi
icated from
showed hi
ated by disso
le Micro-Ho
)O2 Pellet fr
f (U,21%Pu)
enitration rou
h islands (d
iform and
are not prese
is a no
nd Pu values
OX fuel. T
ers are suita
fabrication
aximum sc
ixed in solut
m microwa
igh plutoni
olution test a
omogeneity v
rom Microw
)O2
ute.
dark
the
ent.
ovel
s in
The
able
on
rap
tion
ave
ium
and
3.
4.
Ac
Au
Di
AF
via α-Autor
wave Denitra
alpha rad
route.
The liquid
denitration
the off-gas
feed prepa
or sol-gel.
utilizes th
processing
The mic
denitration
rejects from
recycled a
cknowledgem
uthors sincer
irector, NFG
FFF for their
adiograph o
ated Powder
diographs) t
d waste gene
n is seconda
ses) thus neg
aration meth
. The micro
he condens
g of the subse
crowave d
n is a multipl
m the nth re
number of ti
ments
rely thank t
G and Sh. M
r encouragem
of
r
than mechan
eration in th
ary type (in
gligible comp
hods like co
owave denitr
ed nitric a
equent batch
dissolution
le recycling
ecycled fuel
imes.
to sh. Arun
Mohd. Afza
ment for deve
nical mixin
he microwav
scrubbing o
pared to othe
o-precipitatio
ration proces
acid for th
es.
and direc
technique i.
batch can b
n Kumar, Ex
al, Ex- Head
elopment of
ng
ve
of
er
on
ss
he
ct
e.
be
x-
d,
128
the Microwave Technology. We record our gratitude
to Dr. Amrit Prakash, RMD for helping in
characterization of the samples. We are indebted to
the collective efforts of colleagues from Microwave
Processing Laboratory, CQCS, FPQC, DDES, E&I
and OFS, AFFF.
References:
1. International Atomic Energy Agency
(IAEA), (2012) TECDOC-1686.
2. E. R. Merz, C. E., Walter, G. M. Pshakin,
(Eds.), (1995), “Mixed Oxide Fuel (Mox)
Exploitation and Destruction in Power
Reactors”, Vol. 2, Springer: 177.
3. R. J. McEachern and P. Taylor, (1998) “A
review of the oxidation of uranium dioxide
at temperatures below 400 oC” J Nucl. Matr.
254: 87-121.
4. David L. Clark et al., “Plutonium” in “The chemistry of actinides and trasnactinide elements” L. R. Morss, N. M. Edelstein, J. Fuger, J. J. Katz (Eds.) 3rd Edition Springer: 813-1264.
5. E. D. Collins, (2011) “Evaluation of co-precipitation processes for the synthesis of mixed oxide fuel feedstock materials”, ORNL, Milestone Report.
6. H. Oshima, (1989), “Development of Microwave Heating Method for Co-conversion of Plutonium-Uranium Nitrate to MOX Powder” J Nucl. Sci. Tech. 26(1)161-166.
7. Arti S. Mhatre et al. (2013) “Criticality Safety Analysis of Wet Recycling of PFBR MOX CRO by Microwave Direct Denitration Process at AFFF”, Internal Report-HDP/RMT/2013/1206.
8. G. Singh et al. (2016) “A novel method for stoichiometric reduction of (U3O8,PuO2) and its controlled oxidation using microwave” J Nucl. Matr., 479: 145-151.
129
Novel Applications of Radiation for Value Addition in Food and Agricultural Commodities
Dr. Sumit Gupta
Food Technology Division
Sumit Gupa is the recipient of the DAE Young Scientist Award for the year 2016
Abstract Novel applications of radiation processing for value addition are discussed. Biodegradable films having mechanical and barrier properties similar to that of commercial PVC cling films were developed using irradiated guar gum. Radiation was also employed to completely depolymerize guar gum and its applications as soluble type of dietary fiber and as wall material for flavor encapsulation were demonstrated. Chemical dosimeter useful for dose range of 350-500 Gy employed for quarantine purpose was developed. Chemometric based methods for rapid determination of microbial quality is also presented. Keywords:Radiation processing, biodegradable films, guar gum, rapid methods for microbiology
1. INTRODUCTION Radiation is a versatile tool having several applications in the area of food and agriculture science. Use of radiation for sprout inhibition in potatoes and onions, shelf life extension of various fruits and vegetables, insect disinfestation of cereals and pulses and microbial decontamination of meat and spices are well demonstrated and documented. Present work focused on applications of radiation processing for value addition of food and agricultural commodities apart from these traditional applications. 2. RESEARCH ACHIEVEMENTS The overall research achievements in this area are summarized under following points: A. Development of Biodegradable and Edible Films from Guar Gum Conventional plastic packaging although offering convenience to consumers and industry, poses great threat to environment because they are non-biodegradable and are derived from a non- renewable petroleum sources. In the past twenty years, the production and use of plastics in the world has increased enormously to about 200 million tons per year, moreover, packaging
constitutes the largest market for plastics, amounting to over 12 million tons per year. One of the alternatives for petroleum derived plastics is the development of packaging material from biopolymers (i.e. protein, polysaccharide and lipid) that are biodegradable, non-toxic and derived from completely renewable resources. Among the biopolymers, polysaccharides are the most widely used for preparation of packaging films. Guar gum (GG) which is a type of galactomannan, derived from endosperm of an annual legume plant Cyamopsistetragonoloba was chosen for development of biodegradable films. It is a hetropolysaccharide of a mannose (i.e. (1-4)-linked β-d-mannopyranose) backbone with galactose side groups ((1-6)-linked α-d-galactopyranose). It is widely used in paper, food and pharmaceutical industries and India accounts for 80 percent of world production of GG. Major limitations in the use of biopolymers as packaging materials are their relatively poor mechanical and barrier properties such as tensile strength and water vapor transmission rate as compared to their non-biodegradable counterparts. Therefore, there is a need for development of technologies which can result in biopolymer based films having physical properties similar to that of commercial polymers.
130
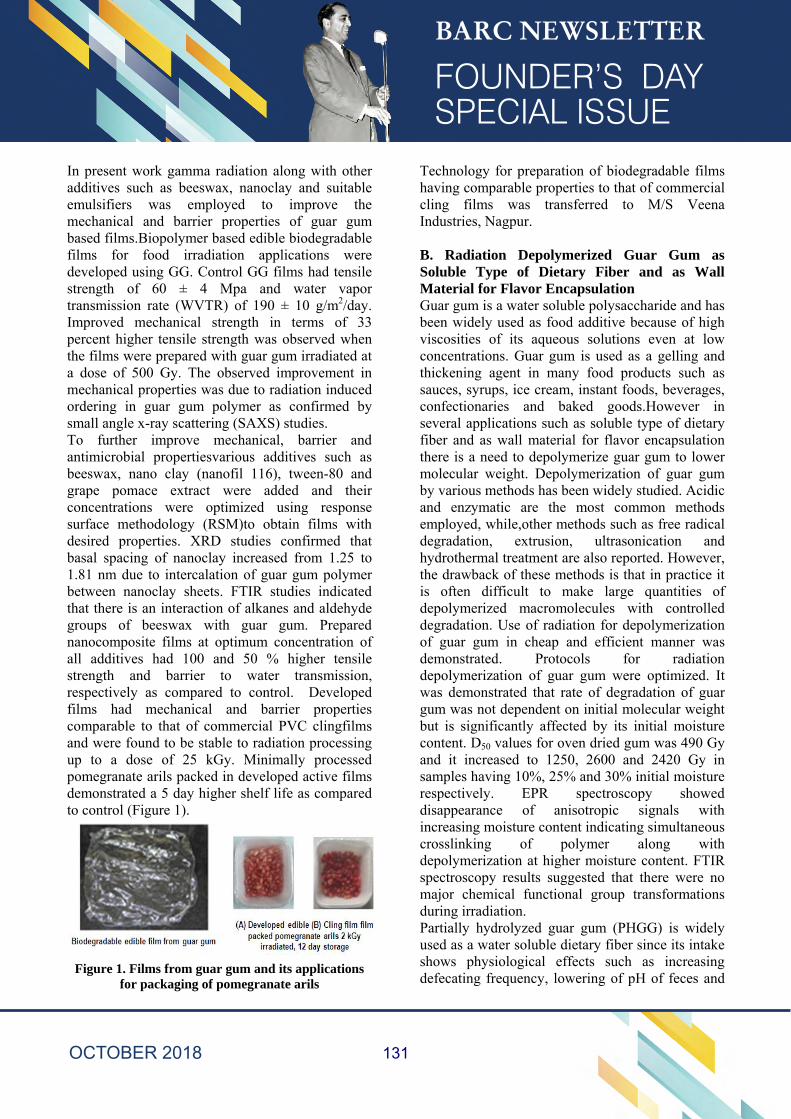
In present work gamma radiation along with other additives such as beeswax, nanoclay and suitable emulsifiers was employed to improve the mechanical and barrier properties of guar gum based films.Biopolymer based edible biodegradable films for food irradiation applications were developed using GG. Control GG films had tensile strength of 60 ± 4 Mpa and water vapor transmission rate (WVTR) of 190 ± 10 g/m2/day. Improved mechanical strength in terms of 33 percent higher tensile strength was observed when the films were prepared with guar gum irradiated at a dose of 500 Gy. The observed improvement in mechanical properties was due to radiation induced ordering in guar gum polymer as confirmed by small angle x-ray scattering (SAXS) studies. To further improve mechanical, barrier and antimicrobial propertiesvarious additives such as beeswax, nano clay (nanofil 116), tween-80 and grape pomace extract were added and their concentrations were optimized using response surface methodology (RSM)to obtain films with desired properties. XRD studies confirmed that basal spacing of nanoclay increased from 1.25 to 1.81 nm due to intercalation of guar gum polymer between nanoclay sheets. FTIR studies indicated that there is an interaction of alkanes and aldehyde groups of beeswax with guar gum. Prepared nanocomposite films at optimum concentration of all additives had 100 and 50 % higher tensile strength and barrier to water transmission, respectively as compared to control. Developed films had mechanical and barrier properties comparable to that of commercial PVC clingfilms and were found to be stable to radiation processing up to a dose of 25 kGy. Minimally processed pomegranate arils packed in developed active films demonstrated a 5 day higher shelf life as compared to control (Figure 1).
Figure 1. Films from guar gum and its applications for packaging of pomegranate arils
Technology for preparation of biodegradable films having comparable properties to that of commercial cling films was transferred to M/S Veena Industries, Nagpur. B. Radiation Depolymerized Guar Gum as Soluble Type of Dietary Fiber and as Wall Material for Flavor Encapsulation Guar gum is a water soluble polysaccharide and has been widely used as food additive because of high viscosities of its aqueous solutions even at low concentrations. Guar gum is used as a gelling and thickening agent in many food products such as sauces, syrups, ice cream, instant foods, beverages, confectionaries and baked goods.However in several applications such as soluble type of dietary fiber and as wall material for flavor encapsulation there is a need to depolymerize guar gum to lower molecular weight. Depolymerization of guar gum by various methods has been widely studied. Acidic and enzymatic are the most common methods employed, while,other methods such as free radical degradation, extrusion, ultrasonication and hydrothermal treatment are also reported. However, the drawback of these methods is that in practice it is often difficult to make large quantities of depolymerized macromolecules with controlled degradation. Use of radiation for depolymerization of guar gum in cheap and efficient manner was demonstrated. Protocols for radiation depolymerization of guar gum were optimized. It was demonstrated that rate of degradation of guar gum was not dependent on initial molecular weight but is significantly affected by its initial moisture content. D50 values for oven dried gum was 490 Gy and it increased to 1250, 2600 and 2420 Gy in samples having 10%, 25% and 30% initial moisture respectively. EPR spectroscopy showed disappearance of anisotropic signals with increasing moisture content indicating simultaneous crosslinking of polymer along with depolymerization at higher moisture content. FTIR spectroscopy results suggested that there were no major chemical functional group transformations during irradiation. Partially hydrolyzed guar gum (PHGG) is widely used as a water soluble dietary fiber since its intake shows physiological effects such as increasing defecating frequency, lowering of pH of feces and
131
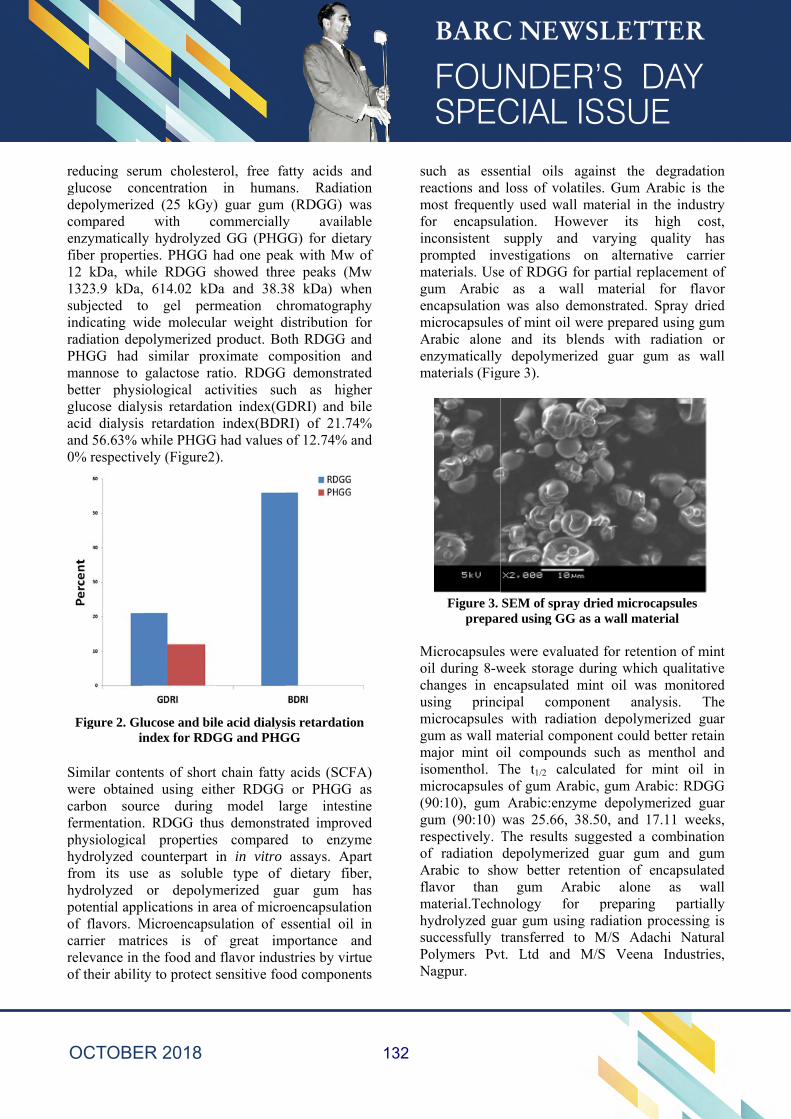
rgdcef11sinrPmbgaa0
Swcfphfhpocro
reducing serglucose condepolymerizecompared enzymaticallyfiber properti12 kDa, wh1323.9 kDa,subjected tondicating w
radiation depPHGG had mannose to better physiglucose dialyacid dialysisand 56.63% w0% respectiv
Figure 2. Glin
Similar contewere obtainecarbon sourfermentation.physiologicalhydrolyzed cfrom its usehydrolyzed potential appof flavors. Mcarrier matrrelevance in tof their abilit
rum cholestencentration ed (25 kGy)
with cy hydrolyzedies. PHGG hile RDGG s 614.02 kDo gel per
wide moleculpolymerized
similar progalactose ra
iological acysis retardatis retardationwhile PHGGely (Figure2
lucose and bilndex for RDG
ents of shorted using eitrce during . RDGG thul propertiescounterpart e as solublor depolym
plications in aMicroencapsurices is ofthe food andty to protect
erol, free fain human
) guar gum commerciallyd GG (PHGhad one peashowed thre
Da and 38.3meation chlar weight dproduct. Bo
oximate comatio. RDGG ctivities sucion index(G
n index(BDRG had values
).
le acid dialysGG and PHG
t chain fatty ther RDGG
model laus demonstras comparedin in vitro le type of merized guarea of microulation of ef great imd flavor indussensitive foo
atty acids anns. Radiati
(RDGG) wy availab
GG) for dietaak with Mw ee peaks (M38 kDa) whhromatograpdistribution foth RDGG anmposition a
demonstratch as high
GDRI) and bRI) of 21.74of 12.74% a
sis retardationGG
acids (SCFAor PHGG
arge intestiated improv
d to enzymassays. Apadietary fib
uar gum hoencapsulatiessential oil
mportance anstries by virtod componen
nd on
was ble ary of
Mw hen hy for nd nd ted her ile
4% nd
n
A) as
ine ved me art er,
has on in nd tue nts
suremfoinprmguenmAenm
Moichusmgumism(9gureofAflmhysuPoN
uch as esseeactions and
most frequentor encapsunconsistent rompted in
materials. Useum Arabic ncapsulation
microcapsulesArabic alonenzymatically
materials (Fig
Figure 3.prepar
Microcapsulesil during 8-whanges in ensing princ
microcapsulesum as wall m
major mint osomenthol. T
microcapsules90:10), gum um (90:10) espectively. f radiation
Arabic to shavor than
material.Techydrolyzed guuccessfully olymers Pv
Nagpur.
ential oils loss of vola
tly used walulation. Ho
supply andvestigations e of RDGG
as a wawas also d
s of mint oil e and its by depolymergure 3).
SEM of sprared using GG
s were evaluweek storagencapsulated
cipal comps with radiamaterial comoil compounThe t1/2 cals of gum Ara
Arabic:enzywas 25.66, The results depolymerizow better r
gum Arnology fouar gum usintransferred
vt. Ltd and
against theatiles. Gum ll material inwever its d varying
on alternfor partial reall material
demonstratedwere prepar
blends with rized guar g
ay dried micrG as a wall ma
uated for retee during whi
mint oil wponent anation depoly
mponent couldnds such as lculated for abic, gum Ayme depoly38.50, and suggested a
zed guar guretention of rabic alon
or preparinng radiation to M/S AdM/S Veen
e degradatioArabic is th
n the industrhigh cos
quality hanative carrieeplacement ol for flavo
d. Spray driered using gum
radiation ogum as wa
ocapsules aterial
ention of minich qualitativ
was monitorenalysis. Thymerized guad better retaimenthol anmint oil i
Arabic: RDGGymerized gua
17.11 weeka combinatioum and gum
encapsulatene as wang partiallprocessing
dachi Naturana Industrie
on he ry st, as er of or ed m or all
nt ve ed he ar in nd in G ar
ks, on m ed all ly is al
es,
132
C. Development of Dosimeter for Food Irradiation Applications Dosimeters are used for accurate monitoring of absorbed radiation dose during food irradiation. They are important for quality control and proper dose planning in food irradiators. Presently there are no routine dosimeters available in dose range of 350-500 Gy which is used for quarantine purposes for food and agro commodities.Therefore, in present work a dosimeter was developed using phenol glycoside having a linear response in wide range from 20 Gy to 25 kGy. Developed dosimeter was found to be especially useful for radiation dose measurements in range of 350 - 500 Gy. A US patent was granted for this invention. D. Chemometrics Based Methods for Rapid Determination of Microbial Quality and Radiation Treatment in Minimally Processed Products Consumption of ready to eat minimally processed fruits and vegetables have increased considerably due to increased consumer convenience these products offer. However, these products have limited shelf life of few days only. Total viable bacterial counts present in products are objective indicator of quality used by regulatory bodies world-wide. Present methods employed to analyze microbial counts are tedious, time consuming and take approximately 36-48 h to provide results. Therefore, there is an urgent need to develop rapid methods for enumerating microbial counts. In present work, rapid instrumental methods for estimating microbial quality was developed employing GCMS and FTIR. Chemometrics based models using artificial neural networks (ANN) and partial least squares regression (PLS-R) were developed correlating instrumental analysis with total microbial counts. Developed models showed good correlation (R > 0.9) and could predict microbial counts for unknown samples within an error of 10%. Using these instrumental techniques microbial quality of minimally processed fruits could be estimated within 15 min as compared to 36 h for traditional methods. 3. CONCLUSION Present work details value addition of guar gum for its use in biodegradable films, soluble type of
dietary fiber and as wall material for flavor encapsulation. Future work should focus on developing methodologies or technologies for preparing biodegradable films using commercially available extrusion process which can aid in industrial scale up for large scale production. Another area of focus would be to develop active and intelligent films i.e. biodegradable films having antimicrobial properties which can be useful for shelf life extension of packaged products and provide consumers information when the packaged product is spoiled in terms of easily identifiable color change. 4. ACKNOWLEDGEMENTS I would like to sincerely thank Dr. Prasad S. Variyar, Head, FFACS, FTD for his valuable guidance and constant encouragement throughout the course of this work. I would also like to extend my gratitude to my colleagues Mrs. VanshikaAdiaini, Dr. SuchandraChatterjee, Dr. Chaturbhuj Saurabh, Dr. ShatabhishaSarkar and Dr. Rekha Singhal, ICT, Mumbai who were part of this work. References Adiani V#, Gupta S. #, Variyar, P. S., Sharma, A. SPME-GCMS integrated with chemometrics as a rapid non-destructive method for predicting microbial quality of minimally processed jackfruit (Artocarpusheterophyllus) bulbs.Post HarvestBiology and Technology, 2014, 98, 34-40.[
#Equal contribution] Gupta, S., Chatterjee, S., Variyar, P.S., Sharma, A. Color indicator dosimeter for measurement of ionizing radiation. US patent no. US20100090128A1 Gupta, S., Saurabh, C. K., Variyar, P. S.,Sharma, A. Comparative analysis of dietary fiber activities of enzymatic and gamma depolymerized guar gum.Food Hydrocolloids, 2015, 48, 49-154. Saurabh C. K., Gupta S., Variyar P. S., Sharma A. Effect of addition of nanoclay, beeswax, tween-80 and glycerol on physicochemical properties of guar gum films. Industrial Crops and Products, 2016, 89, 109-118.
133
Tailored Bi-Functional Polymer for Plutonium Monitoring
Sumana Paul,† Raju V. Shah,† K. Sasi Bhusan,† Ashok K. Pandey,‡ †Fuel Chemistry Division, ‡Radiochemistry Division,
Sumana Paul is the recipient of the DAE Young Scientist Award for the year 2016
ABSTRACT Monitoring of actinides with the sophisticated conventional methods is affected by matrix interferences,
spectral interferences, isobaric interferences, polyatomic interferences and abundance sensitivity problems. To circumvent these limitations, the self-supported disc and membrane supported bi-functional polymer were tailored in the present work for acidity dependent selectivity towards Pu(IV). The bi-functional polymer was found to be better than the polymer containing either phosphate group or sulfonic acid group in terms of higher Pu(IV) sorption efficiency at 3-4M HNO3, selective preconcentration of Pu(IV) in the presence of trivalent actinide like Am(III) and preferential sorption of Pu(IV) in the presence of a large excess of U(VI). The membrane supported bi-functional polymer was used for preconcentration and subsequent quantification of Pu(IV) by alpha spectrometry using absolute efficiency at a fixed geometry. Pu(IV) preconcentrated on a single bi-functional bead was used for determination of Pu isotopic composition by thermal ionization mass spectrometry (TIMS).
INTRODUCTION Various activities involved in the utilization of
nuclear energy are potential sources of radiotoxic contamination of soil, natural waters and biological systems. The actinides are of major concern because of their high degree of radiological toxicity, though they might be present at ultratrace levels. Precise and accurate determination of actinides is also required at different stages of nuclear fuel cycle i.e. input accountability of nuclear fuel, material accounting in dissolver solution, burn–up determination, recovery of precious actinides from radioactive waste and most importantly for nuclear forensic1. In spite of continuous progress in the instrumental methods of analysis, the pretreatment steps such as selective preconcentration of the analyte before its determination are frequently necessary to obtain a good signal and also to reduce the effect of interferences present in the matrix2. The instrumental methods used for quantification of actinides also have the problems of alpha energies overlap (alpha spectrometry), isobaric interferences (ICP-MS), polyatomic interferences (ICP-MS), radiation selectivity (liquid scintillation counting)
and abundance sensitivity interferences3. Therefore, a preconcentration step plays an important role in monitoring of actinides by providing a chemical selectivity in the actinide detection methods. The commonly used separation/ preconcentration methods for actinides are co-precipitation, solvent extraction, ion-exchange, extraction chromatography using TEVA, TRU and/or UTEVA resins etc4-6. However, these methods involve multiple steps with small preconcentration factor and designing of new sorbents with specified properties for quantitative recovery of elements from diverse matrices remains a topical task.
In the present work, an extractive bi-functional polymer, having neutral phosphate and strong acidic sulfonic acid groups, has been developed for the selective preconcentration of Pu(IV) and its subsequent analyses with TIMS and γ-spectrometry. The selection of neutral phosphate group has been based on the coordinating ability of P=O moiety with actinide ions. The sulfonic acid groups have been incorporated in the bi-functional polymer for tuning the selectivity of P=O towards Pu(IV) and also for providing the ion-exchange sites for charge balance. It has also been observed
134
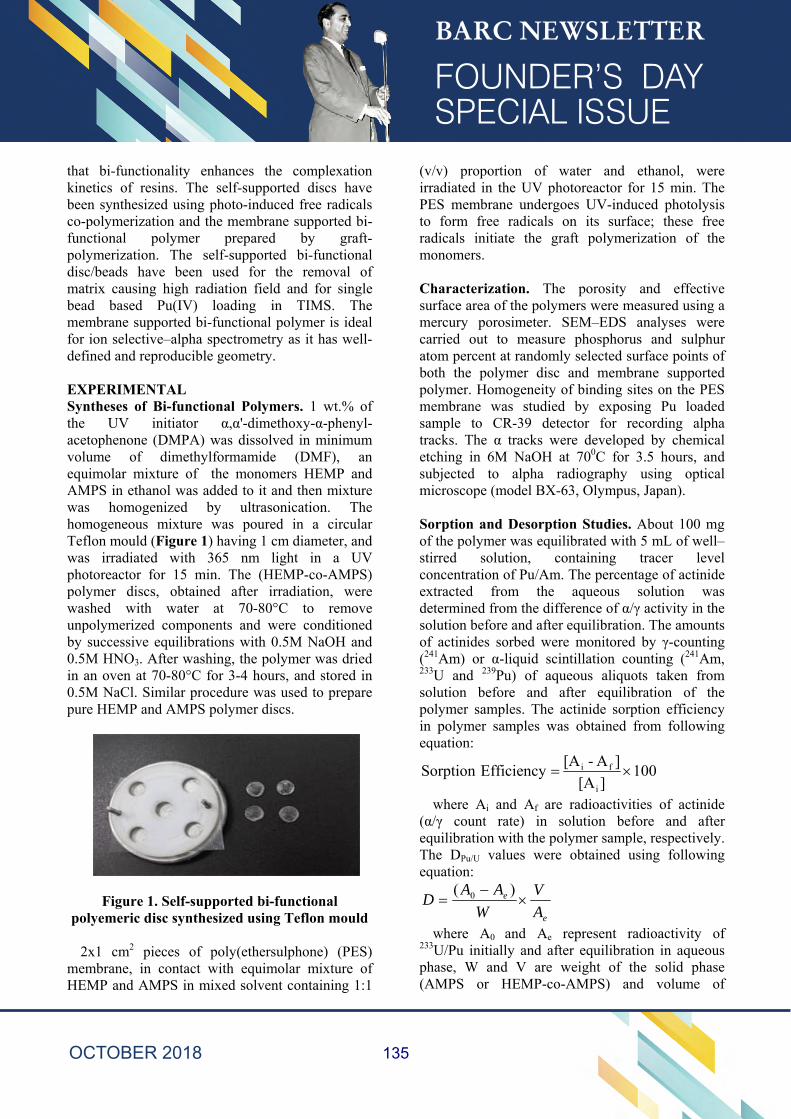
that bi-functionality enhances the complexation kinetics of resins. The self-supported discs have been synthesized using photo-induced free radicals co-polymerization and the membrane supported bi-functional polymer prepared by graft-polymerization. The self-supported bi-functional disc/beads have been used for the removal of matrix causing high radiation field and for single bead based Pu(IV) loading in TIMS. The membrane supported bi-functional polymer is ideal for ion selective–alpha spectrometry as it has well-defined and reproducible geometry.
EXPERIMENTAL Syntheses of Bi-functional Polymers. 1 wt.% of the UV initiator α,α'-dimethoxy-α-phenyl-acetophenone (DMPA) was dissolved in minimum volume of dimethylformamide (DMF), an equimolar mixture of the monomers HEMP and AMPS in ethanol was added to it and then mixture was homogenized by ultrasonication. The homogeneous mixture was poured in a circular Teflon mould (Figure 1) having 1 cm diameter, and was irradiated with 365 nm light in a UV photoreactor for 15 min. The (HEMP-co-AMPS) polymer discs, obtained after irradiation, were washed with water at 70-80°C to remove unpolymerized components and were conditioned by successive equilibrations with 0.5M NaOH and 0.5M HNO3. After washing, the polymer was dried in an oven at 70-80°C for 3-4 hours, and stored in 0.5M NaCl. Similar procedure was used to prepare pure HEMP and AMPS polymer discs.
Figure 1. Self-supported bi-functional polyemeric disc synthesized using Teflon mould
2x1 cm2 pieces of poly(ethersulphone) (PES)
membrane, in contact with equimolar mixture of HEMP and AMPS in mixed solvent containing 1:1
(v/v) proportion of water and ethanol, were irradiated in the UV photoreactor for 15 min. The PES membrane undergoes UV-induced photolysis to form free radicals on its surface; these free radicals initiate the graft polymerization of the monomers.
Characterization. The porosity and effective surface area of the polymers were measured using a mercury porosimeter. SEM–EDS analyses were carried out to measure phosphorus and sulphur atom percent at randomly selected surface points of both the polymer disc and membrane supported polymer. Homogeneity of binding sites on the PES membrane was studied by exposing Pu loaded sample to CR-39 detector for recording alpha tracks. The α tracks were developed by chemical etching in 6M NaOH at 700C for 3.5 hours, and subjected to alpha radiography using optical microscope (model BX-63, Olympus, Japan).
Sorption and Desorption Studies. About 100 mg of the polymer was equilibrated with 5 mL of well–stirred solution, containing tracer level concentration of Pu/Am. The percentage of actinide extracted from the aqueous solution was determined from the difference of α/γ activity in the solution before and after equilibration. The amounts of actinides sorbed were monitored by γ-counting (241Am) or α-liquid scintillation counting (241Am, 233U and 239Pu) of aqueous aliquots taken from solution before and after equilibration of the polymer samples. The actinide sorption efficiency in polymer samples was obtained from following equation:
100][A
]A-[A EfficiencySorption i
fi
where Ai and Af are radioactivities of actinide (α/γ count rate) in solution before and after equilibration with the polymer sample, respectively. The DPu/U values were obtained using following equation:
e
e
A
V
W
AAD
)( 0
where A0 and Ae represent radioactivity of 233U/Pu initially and after equilibration in aqueous phase, W and V are weight of the solid phase (AMPS or HEMP-co-AMPS) and volume of
135
equilibrating aqueous phase, respectively. For studying the time required to obtain optimum sorption of actinides, about 200 mg of the polymer sample was added to 25 mL of aqueous solution containing trace levels of Pu(IV) and the solution was continuously stirred; 10 µL aliquot was taken out at regular intervals from equilibrating solution.
Desorption of Am from the polymers was carried out using 3M HNO3. For Pu, two separate stripping agents, viz. 0.1M HNO3 and 1M NH2OH.HCl, were used. For desorption studies, about 100 mg of polymer sample was first equilibrated with 5 mL of aqueous solution containing trace amount of actinide. After sorption of actinides, the loaded polymer was filtered from the aqueous solution, washed with distilled water and dried using filter papers. The Pu loaded polymer samples were then equilibrated with 5 mL of aqueous solution containing appropriate concentration of the stripping agent.
Analytical Applications. Pu activity in environmental samples were spiked by drying appropriate volumes (25-100 µL) of Pu stock solution under IR lamps to near dryness and then adding the known volumes (5-100 mL) of synthetic urine and seawater/ ground water samples, collected from Mumbai and Kerala state, India, respectively. Soil samples collected from Mumbai were spiked with Pu activity by soaking in very dilute Pu solution and evaporated to near dryness. Acidity of the urine/seawater/ground water samples were adjusted to 3M HNO3, then treated with 20% H2O2 to convert Pu to Pu(IV). Pu was leached from the soil samples by 4M HNO3 containing 1 mL of H2O2. 2x1 cm2 pieces of HEMP-co-AMPS grafted PES membranes were equilibrated for 1 hour with treated aqueous samples, having 5-30 mL volumes, and for 24 hours having 100 mL volume. The membranes were washed thoroughly with water after equilibration, dried and placed directly in front of an ion–implanted alpha detector to record the alpha spectra. The activities (dpm) of Pu loaded in the membrane samples were obtained from the difference in the Pu activity in the solution before and after equilibrating the membrane samples. The amounts of Pu(IV) preconcentrated in the membrane samples were quantified using the absolute counting efficiencies that were obtained by
loading known activities of Pu(IV) in the membrane samples.
For isotopic analyses by TIMS, the PHWR grade Pu (1 µg) in 3M HNO3 medium was equilibrated with a single bead of the HEMP-co-AMPS polymer for 1 hour with continuous stirring. After equilibration, the bead was washed with 3M HNO3, dried under IR and loaded on a high purity rhenium filament for the TIMS analyses. All analyses were performed under static mode of multicollection of Isoprobe-T mass spectrometer using double filament assembly. For comparison with the conventional TIMS analysis with solution loading, the PHWR grade Pu samples were purified form U, Am and other fission products using Dowex 1x8 resin.
RESULTS AND DISCUSSION Physical and Chemical Composition. The self-supported polymer disc is required to have minimum change in dimensions with a sufficient porosity. The swelling ratio of the disc was found to be 1.3 which indicated the structural rigidity of the polymer. This may be attributed to the functional monomer HEMP having three polymerizable double bonds, which would give rise to high degree of crosslinking. The porosity and effective surface area were found to be 0.114 cm3g-1 and 34.33 m2g-1, respectively, which are similar to other functional polymers reported elsewhere. The SEM images indicated that the disc has dense, lamellar structure with no visible micro-pores. The proportions of AMPS and HEMP were obtained by measuring sulphur to phosphorus (S/P) ratio with an EDS analyzer. The EDS analysis confirmed the homogeneous distribution of phosphate and sulfonic acid groups in the disc. The reasonably good agreement of experimental S/P ratio in the bi-functional polymer with the ratio calculated from the proportion of monomers used in the polymerizing solution indicates the equivalent rates of polymerization of HEMP and AMPS monomers. This can be attributed to the presence of methacrylate moiety in both the monomers.
For analytical applications, it is essential to have a thin sorbent for preventing significant loss of α energy and highly reproducible geometry for comparison with a standard. Therefore, bi-functional polymer was grafted on the surface of
136
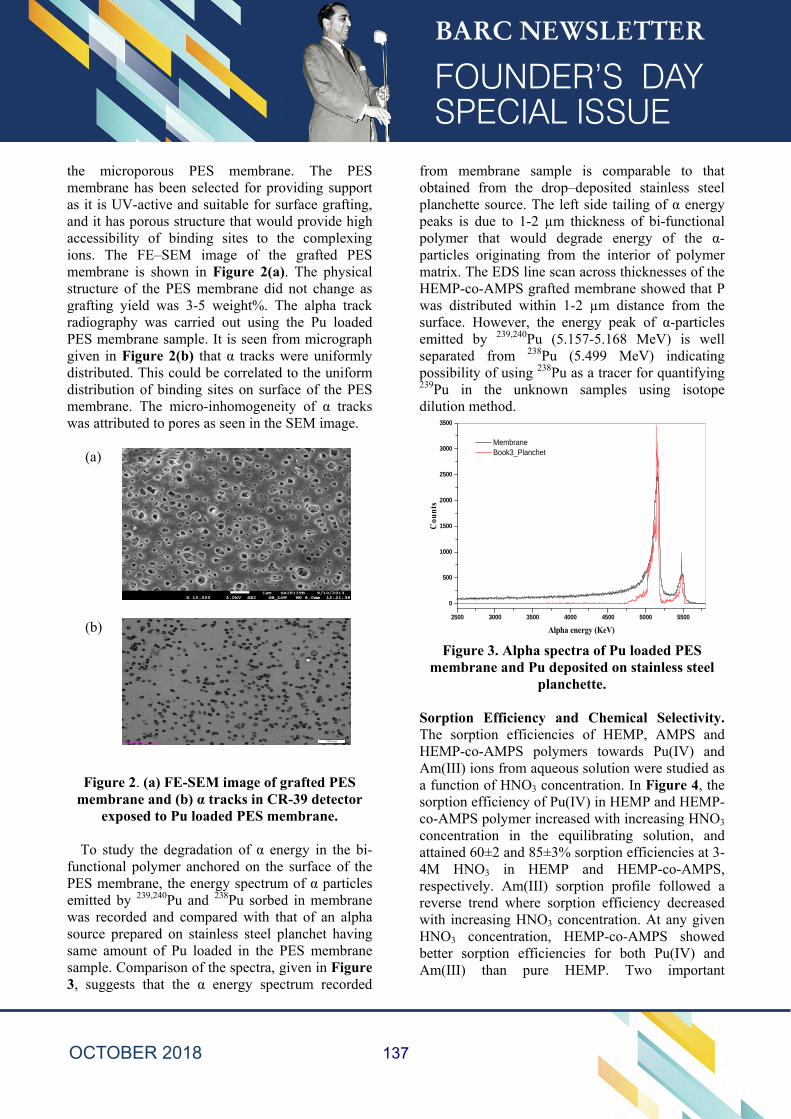
the microporous PES membrane. The PES membrane has been selected for providing support as it is UV-active and suitable for surface grafting, and it has porous structure that would provide high accessibility of binding sites to the complexing ions. The FE–SEM image of the grafted PES membrane is shown in Figure 2(a). The physical structure of the PES membrane did not change as grafting yield was 3-5 weight%. The alpha track radiography was carried out using the Pu loaded PES membrane sample. It is seen from micrograph given in Figure 2(b) that α tracks were uniformly distributed. This could be correlated to the uniform distribution of binding sites on surface of the PES membrane. The micro-inhomogeneity of α tracks was attributed to pores as seen in the SEM image.
(a)
(b)
Figure 2. (a) FE-SEM image of grafted PES membrane and (b) α tracks in CR-39 detector
exposed to Pu loaded PES membrane.
To study the degradation of α energy in the bi-functional polymer anchored on the surface of the PES membrane, the energy spectrum of α particles emitted by 239,240Pu and 238Pu sorbed in membrane was recorded and compared with that of an alpha source prepared on stainless steel planchet having same amount of Pu loaded in the PES membrane sample. Comparison of the spectra, given in Figure 3, suggests that the α energy spectrum recorded
from membrane sample is comparable to that obtained from the drop–deposited stainless steel planchette source. The left side tailing of α energy peaks is due to 1-2 µm thickness of bi-functional polymer that would degrade energy of the α-particles originating from the interior of polymer matrix. The EDS line scan across thicknesses of the HEMP-co-AMPS grafted membrane showed that P was distributed within 1-2 µm distance from the surface. However, the energy peak of α-particles emitted by 239,240Pu (5.157-5.168 MeV) is well separated from 238Pu (5.499 MeV) indicating possibility of using 238Pu as a tracer for quantifying 239Pu in the unknown samples using isotope dilution method.
2500 3000 3500 4000 4500 5000 5500
0
500
1000
1500
2000
2500
3000
3500
Membrane Book3_Planchet
Cou
nts
Alpha energy (KeV) Figure 3. Alpha spectra of Pu loaded PES
membrane and Pu deposited on stainless steel planchette.
Sorption Efficiency and Chemical Selectivity. The sorption efficiencies of HEMP, AMPS and HEMP-co-AMPS polymers towards Pu(IV) and Am(III) ions from aqueous solution were studied as a function of HNO3 concentration. In Figure 4, the sorption efficiency of Pu(IV) in HEMP and HEMP-co-AMPS polymer increased with increasing HNO3 concentration in the equilibrating solution, and attained 60±2 and 85±3% sorption efficiencies at 3-4M HNO3 in HEMP and HEMP-co-AMPS, respectively. Am(III) sorption profile followed a reverse trend where sorption efficiency decreased with increasing HNO3 concentration. At any given HNO3 concentration, HEMP-co-AMPS showed better sorption efficiencies for both Pu(IV) and Am(III) than pure HEMP. Two important
137
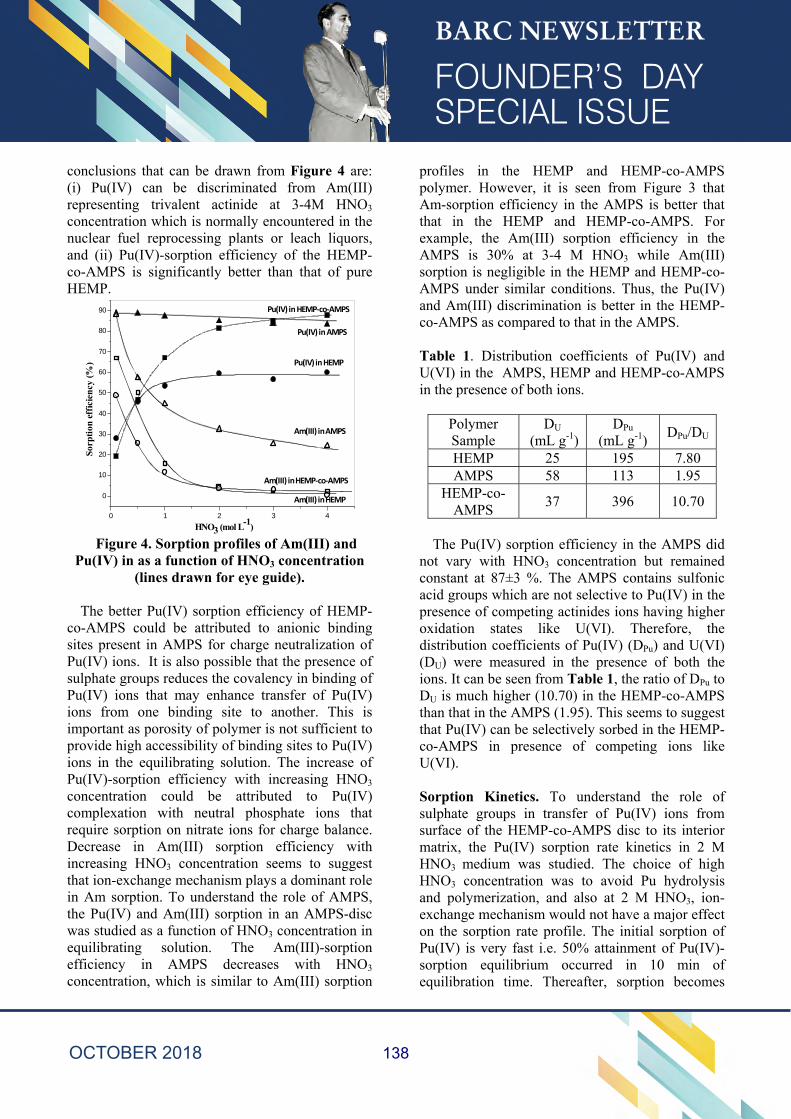
conclusions that can be drawn from Figure 4 are: (i) Pu(IV) can be discriminated from Am(III) representing trivalent actinide at 3-4M HNO3 concentration which is normally encountered in the nuclear fuel reprocessing plants or leach liquors, and (ii) Pu(IV)-sorption efficiency of the HEMP-co-AMPS is significantly better than that of pure HEMP.
0 1 2 3 4
0
10
20
30
40
50
60
70
80
90
Sorp
tion
effic
ienc
y (%
)
HNO3 (mol L-1)
Pu(IV) in HEMP‐co‐AMPS
Pu(IV) in AMPS
Pu(IV) in HEMP
Am(III) in AMPS
Am(III) in HEMP‐co‐AMPS
Am(III) in HEMP
Figure 4. Sorption profiles of Am(III) and
Pu(IV) in as a function of HNO3 concentration (lines drawn for eye guide).
The better Pu(IV) sorption efficiency of HEMP-
co-AMPS could be attributed to anionic binding sites present in AMPS for charge neutralization of Pu(IV) ions. It is also possible that the presence of sulphate groups reduces the covalency in binding of Pu(IV) ions that may enhance transfer of Pu(IV) ions from one binding site to another. This is important as porosity of polymer is not sufficient to provide high accessibility of binding sites to Pu(IV) ions in the equilibrating solution. The increase of Pu(IV)-sorption efficiency with increasing HNO3 concentration could be attributed to Pu(IV) complexation with neutral phosphate ions that require sorption on nitrate ions for charge balance. Decrease in Am(III) sorption efficiency with increasing HNO3 concentration seems to suggest that ion-exchange mechanism plays a dominant role in Am sorption. To understand the role of AMPS, the Pu(IV) and Am(III) sorption in an AMPS-disc was studied as a function of HNO3 concentration in equilibrating solution. The Am(III)-sorption efficiency in AMPS decreases with HNO3 concentration, which is similar to Am(III) sorption
profiles in the HEMP and HEMP-co-AMPS polymer. However, it is seen from Figure 3 that Am-sorption efficiency in the AMPS is better that that in the HEMP and HEMP-co-AMPS. For example, the Am(III) sorption efficiency in the AMPS is 30% at 3-4 M HNO3 while Am(III) sorption is negligible in the HEMP and HEMP-co-AMPS under similar conditions. Thus, the Pu(IV) and Am(III) discrimination is better in the HEMP-co-AMPS as compared to that in the AMPS.
Table 1. Distribution coefficients of Pu(IV) and U(VI) in the AMPS, HEMP and HEMP-co-AMPS in the presence of both ions.
Polymer Sample
DU (mL g-1)
DPu (mL g-1) DPu/DU
HEMP 25 195 7.80 AMPS 58 113 1.95
HEMP-co-AMPS 37 396 10.70
The Pu(IV) sorption efficiency in the AMPS did
not vary with HNO3 concentration but remained constant at 87±3 %. The AMPS contains sulfonic acid groups which are not selective to Pu(IV) in the presence of competing actinides ions having higher oxidation states like U(VI). Therefore, the distribution coefficients of Pu(IV) (DPu) and U(VI) (DU) were measured in the presence of both the ions. It can be seen from Table 1, the ratio of DPu to DU is much higher (10.70) in the HEMP-co-AMPS than that in the AMPS (1.95). This seems to suggest that Pu(IV) can be selectively sorbed in the HEMP-co-AMPS in presence of competing ions like U(VI).
Sorption Kinetics. To understand the role of sulphate groups in transfer of Pu(IV) ions from surface of the HEMP-co-AMPS disc to its interior matrix, the Pu(IV) sorption rate kinetics in 2 M HNO3 medium was studied. The choice of high HNO3 concentration was to avoid Pu hydrolysis and polymerization, and also at 2 M HNO3, ion-exchange mechanism would not have a major effect on the sorption rate profile. The initial sorption of Pu(IV) is very fast i.e. 50% attainment of Pu(IV)-sorption equilibrium occurred in 10 min of equilibration time. Thereafter, sorption becomes
138
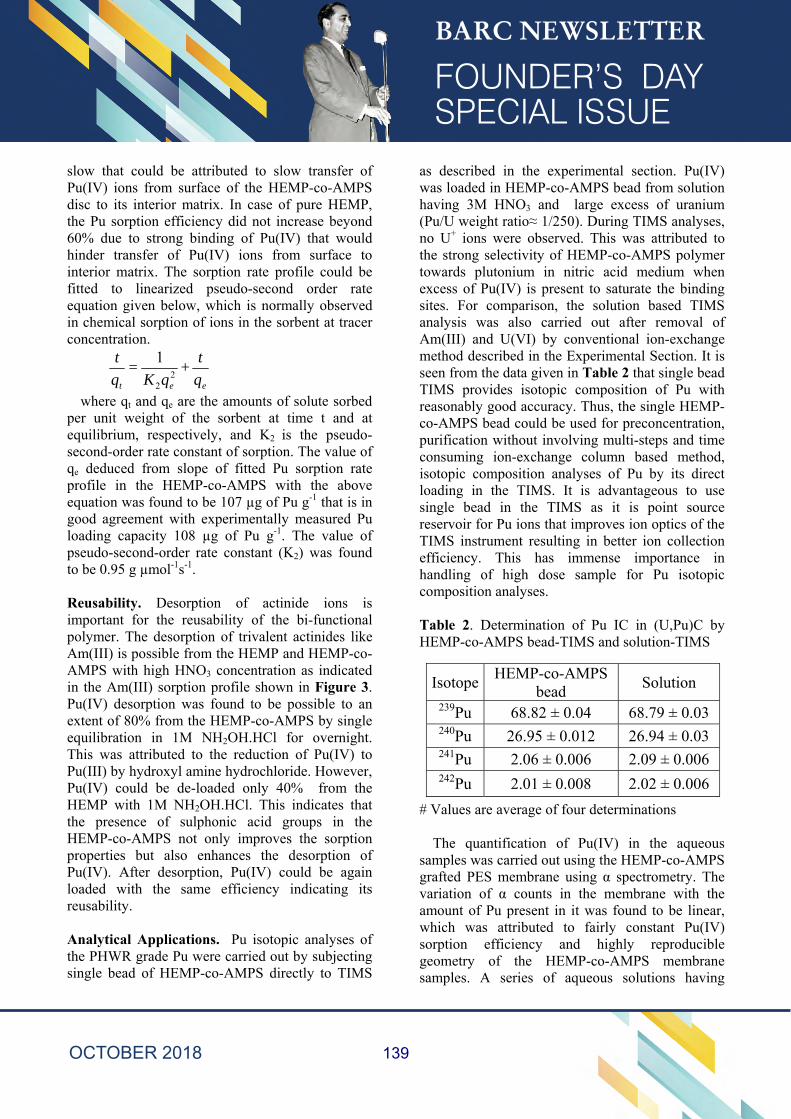
slow that could be attributed to slow transfer of Pu(IV) ions from surface of the HEMP-co-AMPS disc to its interior matrix. In case of pure HEMP, the Pu sorption efficiency did not increase beyond 60% due to strong binding of Pu(IV) that would hinder transfer of Pu(IV) ions from surface to interior matrix. The sorption rate profile could be fitted to linearized pseudo-second order rate equation given below, which is normally observed in chemical sorption of ions in the sorbent at tracer concentration.
eet q
t+
qK=
q
t2
2
1
where qt and qe are the amounts of solute sorbed per unit weight of the sorbent at time t and at equilibrium, respectively, and K2 is the pseudo-second-order rate constant of sorption. The value of qe deduced from slope of fitted Pu sorption rate profile in the HEMP-co-AMPS with the above equation was found to be 107 µg of Pu g-1 that is in good agreement with experimentally measured Pu loading capacity 108 µg of Pu g-1. The value of pseudo-second-order rate constant (K2) was found to be 0.95 g µmol-1s-1.
Reusability. Desorption of actinide ions is important for the reusability of the bi-functional polymer. The desorption of trivalent actinides like Am(III) is possible from the HEMP and HEMP-co-AMPS with high HNO3 concentration as indicated in the Am(III) sorption profile shown in Figure 3. Pu(IV) desorption was found to be possible to an extent of 80% from the HEMP-co-AMPS by single equilibration in 1M NH2OH.HCl for overnight. This was attributed to the reduction of Pu(IV) to Pu(III) by hydroxyl amine hydrochloride. However, Pu(IV) could be de-loaded only 40% from the HEMP with 1M NH2OH.HCl. This indicates that the presence of sulphonic acid groups in the HEMP-co-AMPS not only improves the sorption properties but also enhances the desorption of Pu(IV). After desorption, Pu(IV) could be again loaded with the same efficiency indicating its reusability.
Analytical Applications. Pu isotopic analyses of the PHWR grade Pu were carried out by subjecting single bead of HEMP-co-AMPS directly to TIMS
as described in the experimental section. Pu(IV) was loaded in HEMP-co-AMPS bead from solution having 3M HNO3 and large excess of uranium (Pu/U weight ratio≈ 1/250). During TIMS analyses, no U+ ions were observed. This was attributed to the strong selectivity of HEMP-co-AMPS polymer towards plutonium in nitric acid medium when excess of Pu(IV) is present to saturate the binding sites. For comparison, the solution based TIMS analysis was also carried out after removal of Am(III) and U(VI) by conventional ion-exchange method described in the Experimental Section. It is seen from the data given in Table 2 that single bead TIMS provides isotopic composition of Pu with reasonably good accuracy. Thus, the single HEMP-co-AMPS bead could be used for preconcentration, purification without involving multi-steps and time consuming ion-exchange column based method, isotopic composition analyses of Pu by its direct loading in the TIMS. It is advantageous to use single bead in the TIMS as it is point source reservoir for Pu ions that improves ion optics of the TIMS instrument resulting in better ion collection efficiency. This has immense importance in handling of high dose sample for Pu isotopic composition analyses.
Table 2. Determination of Pu IC in (U,Pu)C by HEMP-co-AMPS bead-TIMS and solution-TIMS
# Values are average of four determinations The quantification of Pu(IV) in the aqueous
samples was carried out using the HEMP-co-AMPS grafted PES membrane using α spectrometry. The variation of α counts in the membrane with the amount of Pu present in it was found to be linear, which was attributed to fairly constant Pu(IV) sorption efficiency and highly reproducible geometry of the HEMP-co-AMPS membrane samples. A series of aqueous solutions having
Isotope HEMP-co-AMPS bead Solution
239Pu 68.82 ± 0.04 68.79 ± 0.03240Pu 26.95 ± 0.012 26.94 ± 0.03
241Pu 2.06 ± 0.006 2.09 ± 0.006242Pu 2.01 ± 0.008 2.02 ± 0.006
139
volume in the range of 5–100 mL were spiked with same amount of Pu tracer, and each solution was equilibrated with 2x1cm2 piece of HEMP-co-AMPS membrane. It was observed that the efficiency of preconcentration was nearly constant when volume of the equilibrating solution was varied from 5–100 mL. However, 100 mL volume requires 24 hours of equilibration as compared 1 hour equilibration of the membrane sample in 5-30 mL samples.
To quantify Pu(IV) preconcentrated in the membrane samples, absolute counting efficiency (α count rate/disintegration rate x100) is required for a fixed geometry of sample in the counting chamber of α spectrometry. Since the size of membrane sample is not a point source, a large surface area detector (450 mm2) was used for α counting. The absolute counting efficiencies for 2x1cm2 membrane sample, 1x1cm2 membrane sample, and planchetted point source sample were found to be 14.8%, 27.9% and 29.7%, respectively. Thus, absolute α-counting efficiency of 1x1 cm2 membrane sample is comparable with that of planchette source, and could be used for quantification of preconcentrated Pu(IV) in its matrix without affecting the count rate significantly.
Table 3. Pu concentration in aqueous samples determined by membrane based alpha spectrometry.
Sample Pu concentration (ppb)
Calculated Measured Synthetic urine 4.11 4.16 ± 0.21
Seawater 0.012 0.011 ± 0.001 Groundwater 0.067 0.065 ± 0.004 Soil sample 0.022 0.019 ± 0.002
The membrane based alpha spectrometry was
applied for the quantitative determinations of Pu in the synthetic urine, ground water, seawater and leach liquor of soil. For determination of sub-ppb level (0.01 ppb) of Pu(IV), the 100 mL sample was equilibrated with the HEMP-co-AMPS membrane for 24 hours. The count rate obtained in the membrane sample was 0.034 counts s-1, and
required 24 hours counting to accumulate sufficient counts above background. The data given in Table 3 seem to suggest that the HEMP-co-AMPS membrane based alpha spectrometry offers good precision and accuracy for quantifying sub-ppb amounts of Pu(IV) in the complex environment samples.
CONCLUSIONS
The bi-functional HEMP-co-AMPS polymer was found to have (i) better Pu(IV) sorption efficiency than HEMP polymer, (ii) better ability to discriminate between Pu(IV) and Am(III) than AMPS polymer in 3-4M HNO3 and (iii) can sorb Pu(IV) selectively in the presence of large excess of U(VI) ions. HEMP-co-AMPS could be made as self-supporting disc or anchored as a thin film on poly(ether sulphone) membrane. The single HEMP-co-AMPS bead based TIMS was used for determination of isotopic composition of PHWR grade Pu in 3-4M HNO3 with minimum sample manipulation and reasonably good accuracy. HEMP-co-AMPS grafted PES membrane was found to be effective for preconcentration of Pu(IV) from high HNO3 concentration, normally encountered in nuclear fuel reprocessing plant waste streams and leach liquors of geological and biological objects, and subsequent quantification with alpha spectrometry. Also secondary waste generated could be minimized since the HEMP-co-AMPS grafted membranes can be regenerated and reused.
REFERENCES 1. J.M. Schwantes, C.R. Orton, R.A. Clark,
Environ. Sci. Technol. 2012, 46, 8621−8627. 2. Y.A. Zolotov, G.I. Tsysin, E.I. Morosanova,
S.G. Dmitrienko, Russ. Chem. Rev. 2005, 74, 37-60.
3. N. Guérin, R. Calmette, T. Johnson, D. Larivière, Anal. Methods 2011, 3, 1560–1567.
4. N. Vajda, A. Törvényi, G. Kis-Benedek, C.K. Kim, B. Bene, Zs. Mácsik, Radiochim. Acta 2009, 97, 395-401.
5. J. Eikenberg, M. Jäggi, H. Beer, M. Rüthi, I. Zumsteg, Appl. Rad. Isotopes 2009, 67, 776-780.
6. P. Thakur, G.P. Mulholland, J. Radioanal. Nucl. Chem. 2011, 288, 499-506.
140
Radiation Chemical Studies of Self-Organized Systems and Their Application in the Templated
Synthesis of Nanomaterials
Apurav Guleria and Soumyakanti Adhikari Radiation & Photochemistry Division
Apurav Guleria is the recipient of the DAE Young Scientist
Award for the year 2016
1. Introduction Microheterogeneity is one of the basic and versatile features of many natural systems, and plays a vital role in directing/influencing the fundamental processes such as electron or charger transfer and also free radical reactions. Therefore, it is pertinent to have a real time information as well as in-depth understanding of such fundamental processes/reactions taking place inside the confined media of naturally occurring self-organized systems [1, 2]. In this endeavour, researchers across the globe have and are being engaged in the design and development of much simplified tailor-made nanoreactors. Nonetheless, these synthetic systems are structurally microheterogeneous and possess inherit compartmentalization, thereby can be employed as model systems to mimic the naturally occurring organized assemblies. Some well-known examples of microheterogeneous media are micelles, microemulsions, vesicles, room temperature ionic liquids (RTILs), cyclodextrins (CDs), and lipid membranes. However, present work comprehends the radiation and photochemical investigation of microemulsions and RTILs.
Microemulsions are thermodynamically stable, isotropic and optically clear dispersions of either ‘water-in-oil (w/o)’ or ‘oil-in-water (o/w)’ stabilized by amphiphiles (or surfactants) [1-3]. These systems possess a well-organized internal structure. Essentially, the water (dispersed phase in w/o microemulsion) confined in the cavity controls the size and shape of the microemulsion, and are characterized by W0, which is defined as the molar
ratio of water to surfactant, W0 = [H2O]/ [surfactant]. In comparison to microemulsions, RTILs are entirely different microheterogeneous systems. RTILs are a class of low temperature molten salts having meting points below 100 °C [4]. RTILs are composed of ions and are different from the conventional organic solvents with respect to their structure and physicochemical properties such as high polarity, negligible vapour pressure, high ionic conductivity, wide electrochemical window and thermal stability.
Taking into account of such dissimilarities in the structural and dynamical aspects, it is of fundamental interest as well as quite intriguing to probe the primary processes (such as electron solvation, free radical reactions etc.) in these two aforementioned microheterogeneous systems. Consequently, after gathering the information from the radiation chemical studies, these systems were further exploited for the templated synthesis of various nanomaterials such as CdSe, SnSe and Se. Interestingly, unique morphologies of these nanomaterials along with tunable optical properties were obtained. All these findings are presented in this paper.
2. Experimental Radiation chemical investigations were carried by using pulse radiolysis setup coupled with transient spectroscopy [3, 4]. The absorbed dose was measured using an air-saturated solution containing 5 × 10⁻² mol dm–3 KSCN assuming G for (SCN)2
.- = 2.6 × 10⁻⁴ m2 J–1 at 475 nm. The kinetic
141
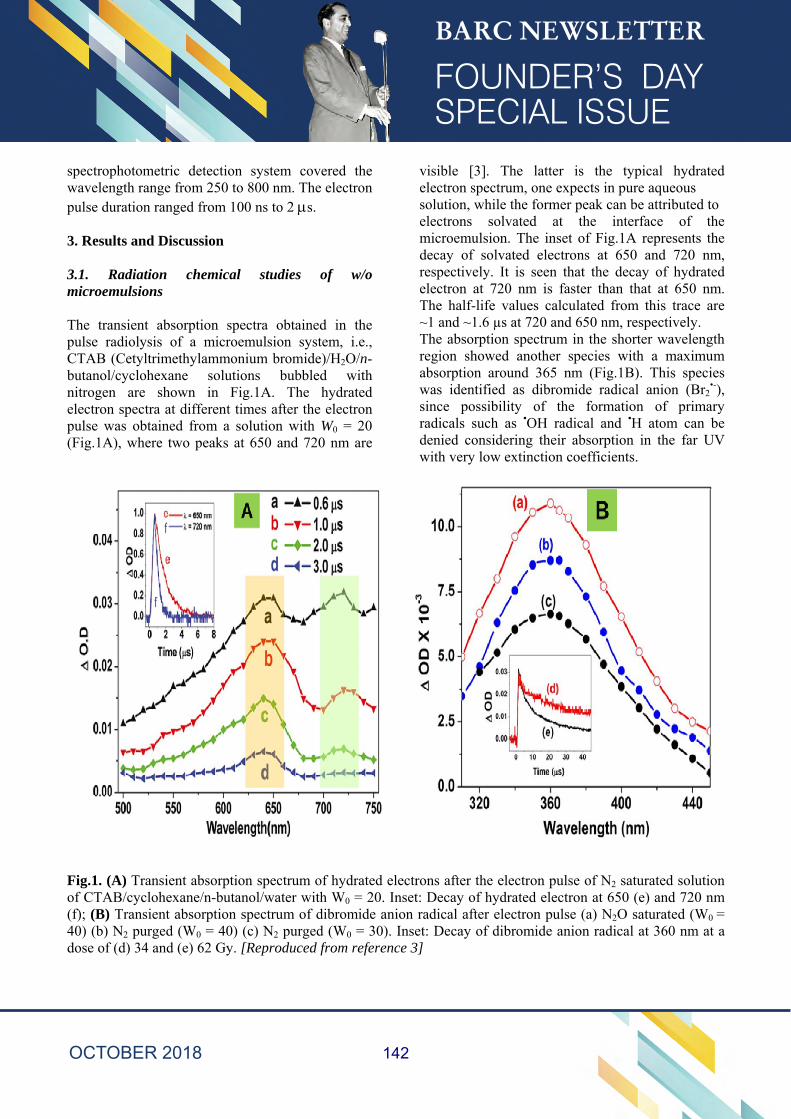
spectrophotometric detection system covered the wavelength range from 250 to 800 nm. The electron pulse duration ranged from 100 ns to 2 s. 3. Results and Discussion 3.1. Radiation chemical studies of w/o microemulsions The transient absorption spectra obtained in the pulse radiolysis of a microemulsion system, i.e., CTAB (Cetyltrimethylammonium bromide)/H2O/n-butanol/cyclohexane solutions bubbled with nitrogen are shown in Fig.1A. The hydrated electron spectra at different times after the electron pulse was obtained from a solution with W0 = 20 (Fig.1A), where two peaks at 650 and 720 nm are
visible [3]. The latter is the typical hydrated electron spectrum, one expects in pure aqueous solution, while the former peak can be attributed to electrons solvated at the interface of the microemulsion. The inset of Fig.1A represents the decay of solvated electrons at 650 and 720 nm, respectively. It is seen that the decay of hydrated electron at 720 nm is faster than that at 650 nm. The half-life values calculated from this trace are ~1 and ~1.6 µs at 720 and 650 nm, respectively. The absorption spectrum in the shorter wavelength region showed another species with a maximum absorption around 365 nm (Fig.1B). This species was identified as dibromide radical anion (Br2
•-), since possibility of the formation of primary radicals such as •OH radical and •H atom can be denied considering their absorption in the far UV with very low extinction coefficients.
Fig.1. (A) Transient absorption spectrum of hydrated electrons after the electron pulse of N2 saturated solution of CTAB/cyclohexane/n-butanol/water with W0 = 20. Inset: Decay of hydrated electron at 650 (e) and 720 nm (f); (B) Transient absorption spectrum of dibromide anion radical after electron pulse (a) N2O saturated (W0 = 40) (b) N2 purged (W0 = 40) (c) N2 purged (W0 = 30). Inset: Decay of dibromide anion radical at 360 nm at a dose of (d) 34 and (e) 62 Gy. [Reproduced from reference 3]
142
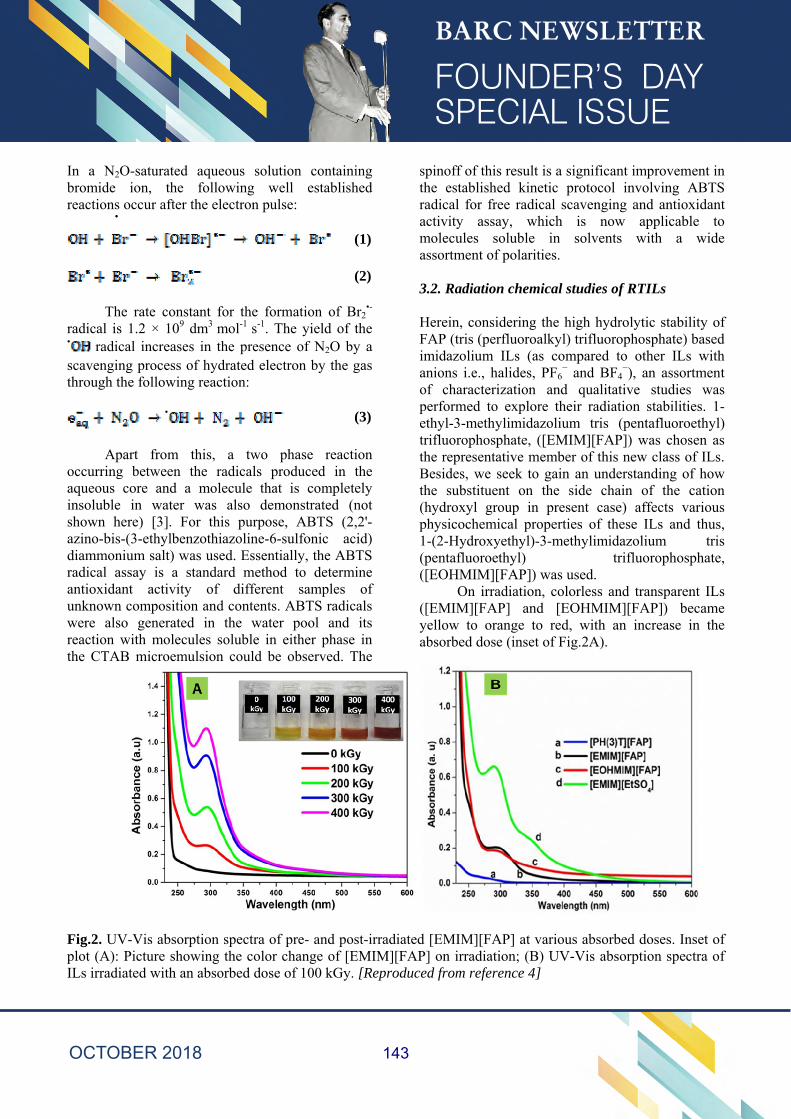
In a N2O-saturated aqueous solution containing bromide ion, the following well established reactions occur after the electron pulse:
•
(1)
(2)
The rate constant for the formation of Br2•-
radical is 1.2 × 10⁹ dm3 mol-1 s-1. The yield of the • radical increases in the presence of N2O by a scavenging process of hydrated electron by the gas through the following reaction:
• (3)
Apart from this, a two phase reaction
occurring between the radicals produced in the aqueous core and a molecule that is completely insoluble in water was also demonstrated (not shown here) [3]. For this purpose, ABTS (2,2'-azino-bis-(3-ethylbenzothiazoline-6-sulfonic acid) diammonium salt) was used. Essentially, the ABTS radical assay is a standard method to determine antioxidant activity of different samples of unknown composition and contents. ABTS radicals were also generated in the water pool and its reaction with molecules soluble in either phase in the CTAB microemulsion could be observed. The
spinoff of this result is a significant improvement in the established kinetic protocol involving ABTS radical for free radical scavenging and antioxidant activity assay, which is now applicable to molecules soluble in solvents with a wide assortment of polarities.
3.2. Radiation chemical studies of RTILs Herein, considering the high hydrolytic stability of FAP (tris (perfluoroalkyl) trifluorophosphate) based imidazolium ILs (as compared to other ILs with anions i.e., halides, PF6
− and BF4−), an assortment
of characterization and qualitative studies was performed to explore their radiation stabilities. 1-ethyl-3-methylimidazolium tris (pentafluoroethyl) trifluorophosphate, ([EMIM][FAP]) was chosen as the representative member of this new class of ILs. Besides, we seek to gain an understanding of how the substituent on the side chain of the cation (hydroxyl group in present case) affects various physicochemical properties of these ILs and thus, 1-(2-Hydroxyethyl)-3-methylimidazolium tris (pentafluoroethyl) trifluorophosphate, ([EOHMIM][FAP]) was used.
On irradiation, colorless and transparent ILs ([EMIM][FAP] and [EOHMIM][FAP]) became yellow to orange to red, with an increase in the absorbed dose (inset of Fig.2A).
Fig.2. UV-Vis absorption spectra of pre- and post-irradiated [EMIM][FAP] at various absorbed doses. Inset of plot (A): Picture showing the color change of [EMIM][FAP] on irradiation; (B) UV-Vis absorption spectra of ILs irradiated with an absorbed dose of 100 kGy. [Reproduced from reference 4]
143
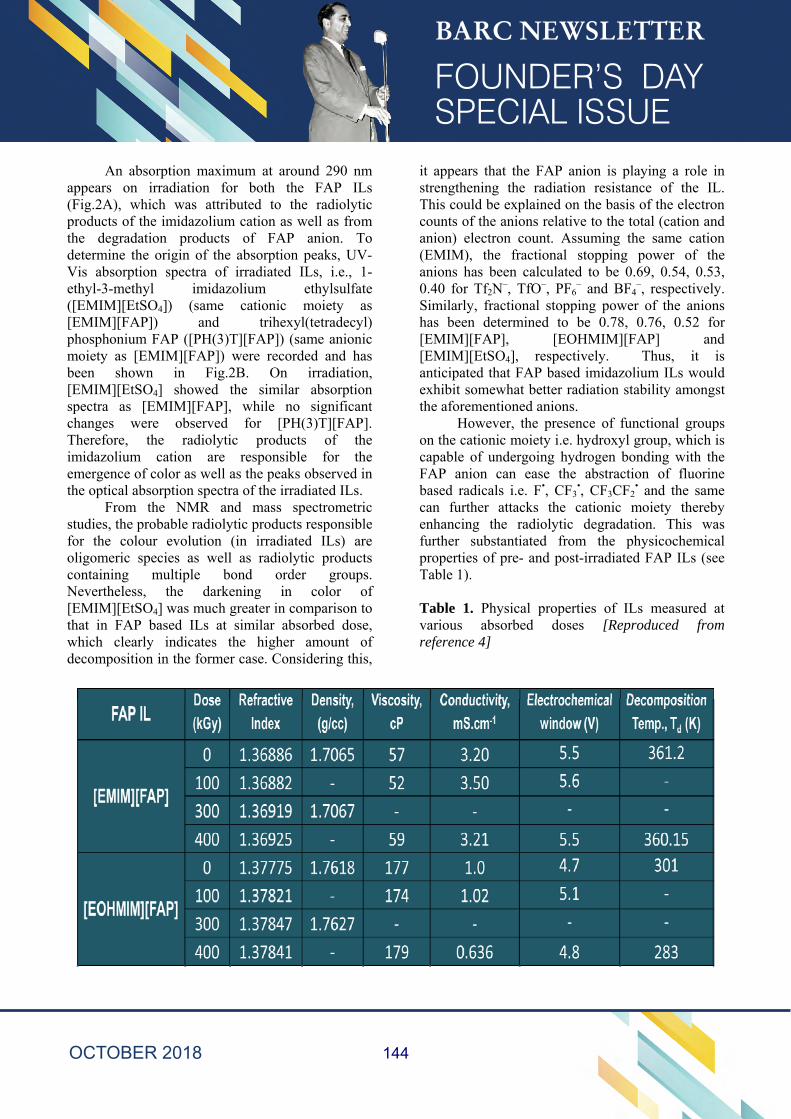
An absorption maximum at around 290 nm appears on irradiation for both the FAP ILs (Fig.2A), which was attributed to the radiolytic products of the imidazolium cation as well as from the degradation products of FAP anion. To determine the origin of the absorption peaks, UV-Vis absorption spectra of irradiated ILs, i.e., 1-ethyl-3-methyl imidazolium ethylsulfate ([EMIM][EtSO4]) (same cationic moiety as [EMIM][FAP]) and trihexyl(tetradecyl) phosphonium FAP ([PH(3)T][FAP]) (same anionic moiety as [EMIM][FAP]) were recorded and has been shown in Fig.2B. On irradiation, [EMIM][EtSO4] showed the similar absorption spectra as [EMIM][FAP], while no significant changes were observed for [PH(3)T][FAP]. Therefore, the radiolytic products of the imidazolium cation are responsible for the emergence of color as well as the peaks observed in the optical absorption spectra of the irradiated ILs.
From the NMR and mass spectrometric studies, the probable radiolytic products responsible for the colour evolution (in irradiated ILs) are oligomeric species as well as radiolytic products containing multiple bond order groups. Nevertheless, the darkening in color of [EMIM][EtSO4] was much greater in comparison to that in FAP based ILs at similar absorbed dose, which clearly indicates the higher amount of decomposition in the former case. Considering this,
it appears that the FAP anion is playing a role in strengthening the radiation resistance of the IL. This could be explained on the basis of the electron counts of the anions relative to the total (cation and anion) electron count. Assuming the same cation (EMIM), the fractional stopping power of the anions has been calculated to be 0.69, 0.54, 0.53, 0.40 for Tf2N
–, TfO–, PF6– and BF4
–, respectively. Similarly, fractional stopping power of the anions has been determined to be 0.78, 0.76, 0.52 for [EMIM][FAP], [EOHMIM][FAP] and [EMIM][EtSO4], respectively. Thus, it is anticipated that FAP based imidazolium ILs would exhibit somewhat better radiation stability amongst the aforementioned anions.
However, the presence of functional groups on the cationic moiety i.e. hydroxyl group, which is capable of undergoing hydrogen bonding with the FAP anion can ease the abstraction of fluorine based radicals i.e. F•, CF3
•, CF3CF2• and the same
can further attacks the cationic moiety thereby enhancing the radiolytic degradation. This was further substantiated from the physicochemical properties of pre- and post-irradiated FAP ILs (see Table 1).
Table 1. Physical properties of ILs measured at various absorbed doses [Reproduced from reference 4]
144
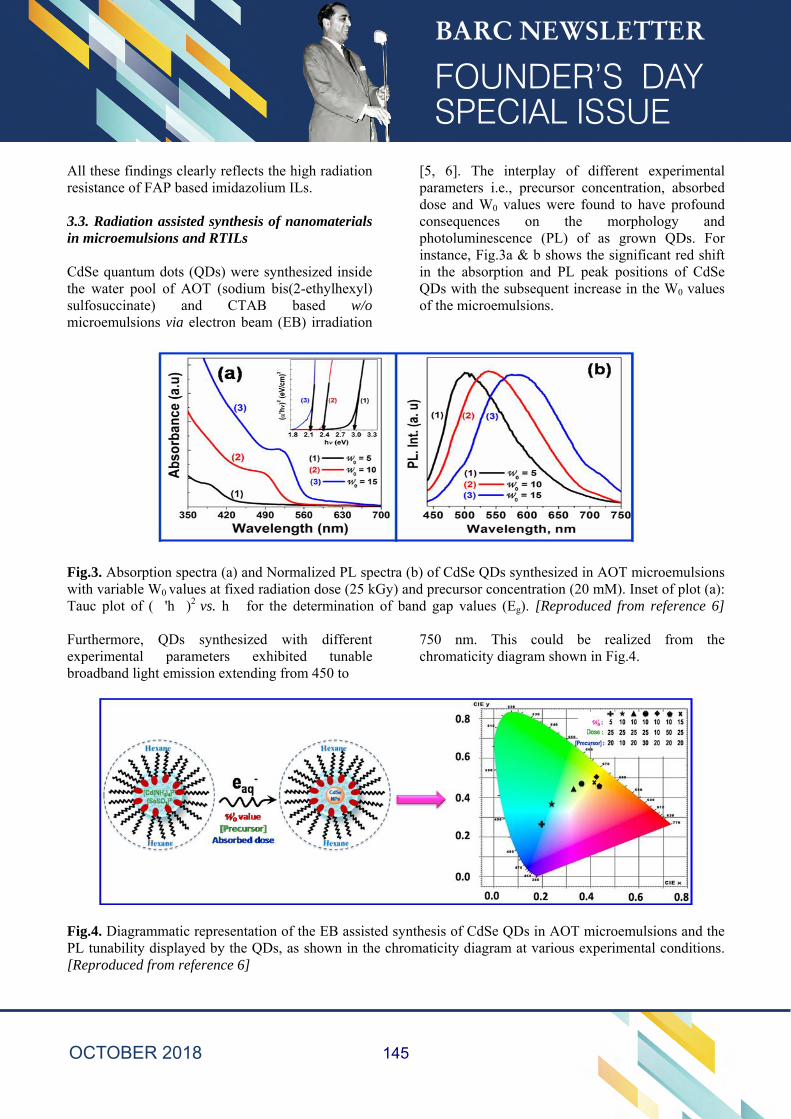
All these findings clearly reflects the high radiation resistance of FAP based imidazolium ILs. 3.3. Radiation assisted synthesis of nanomaterials in microemulsions and RTILs CdSe quantum dots (QDs) were synthesized inside the water pool of AOT (sodium bis(2-ethylhexyl) sulfosuccinate) and CTAB based w/o microemulsions via electron beam (EB) irradiation
[5, 6]. The interplay of different experimental parameters i.e., precursor concentration, absorbed dose and W0 values were found to have profound consequences on the morphology and photoluminescence (PL) of as grown QDs. For instance, Fig.3a & b shows the significant red shift in the absorption and PL peak positions of CdSe QDs with the subsequent increase in the W0 values of the microemulsions.
Fig.3. Absorption spectra (a) and Normalized PL spectra (b) of CdSe QDs synthesized in AOT microemulsions with variable W0 values at fixed radiation dose (25 kGy) and precursor concentration (20 mM). Inset of plot (a): Tauc plot of ('h)2 vs. h for the determination of band gap values (Eg). [Reproduced from reference 6] Furthermore, QDs synthesized with different experimental parameters exhibited tunable broadband light emission extending from 450 to
750 nm. This could be realized from the chromaticity diagram shown in Fig.4.
Fig.4. Diagrammatic representation of the EB assisted synthesis of CdSe QDs in AOT microemulsions and the PL tunability displayed by the QDs, as shown in the chromaticity diagram at various experimental conditions. [Reproduced from reference 6]
145
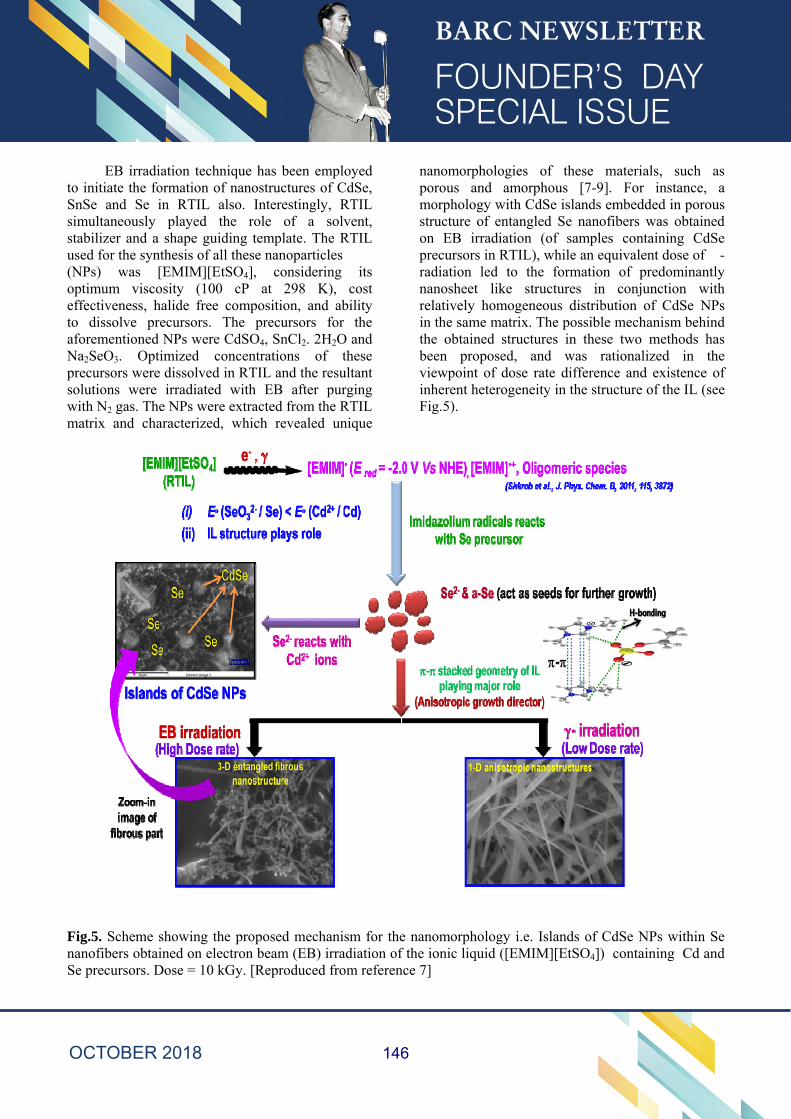
EB irradiation technique has been employed to initiate the formation of nanostructures of CdSe, SnSe and Se in RTIL also. Interestingly, RTIL simultaneously played the role of a solvent, stabilizer and a shape guiding template. The RTIL used for the synthesis of all these nanoparticles (NPs) was [EMIM][EtSO4], considering its optimum viscosity (100 cP at 298 K), cost effectiveness, halide free composition, and ability to dissolve precursors. The precursors for the aforementioned NPs were CdSO4, SnCl2. 2H2O and Na2SeO3. Optimized concentrations of these precursors were dissolved in RTIL and the resultant solutions were irradiated with EB after purging with N2 gas. The NPs were extracted from the RTIL matrix and characterized, which revealed unique
nanomorphologies of these materials, such as porous and amorphous [7-9]. For instance, a morphology with CdSe islands embedded in porous structure of entangled Se nanofibers was obtained on EB irradiation (of samples containing CdSe precursors in RTIL), while an equivalent dose of -radiation led to the formation of predominantly nanosheet like structures in conjunction with relatively homogeneous distribution of CdSe NPs in the same matrix. The possible mechanism behind the obtained structures in these two methods has been proposed, and was rationalized in the viewpoint of dose rate difference and existence of inherent heterogeneity in the structure of the IL (see Fig.5).
Fig.5. Scheme showing the proposed mechanism for the nanomorphology i.e. Islands of CdSe NPs within Se nanofibers obtained on electron beam (EB) irradiation of the ionic liquid ([EMIM][EtSO4]) containing Cd and Se precursors. Dose = 10 kGy. [Reproduced from reference 7]
146
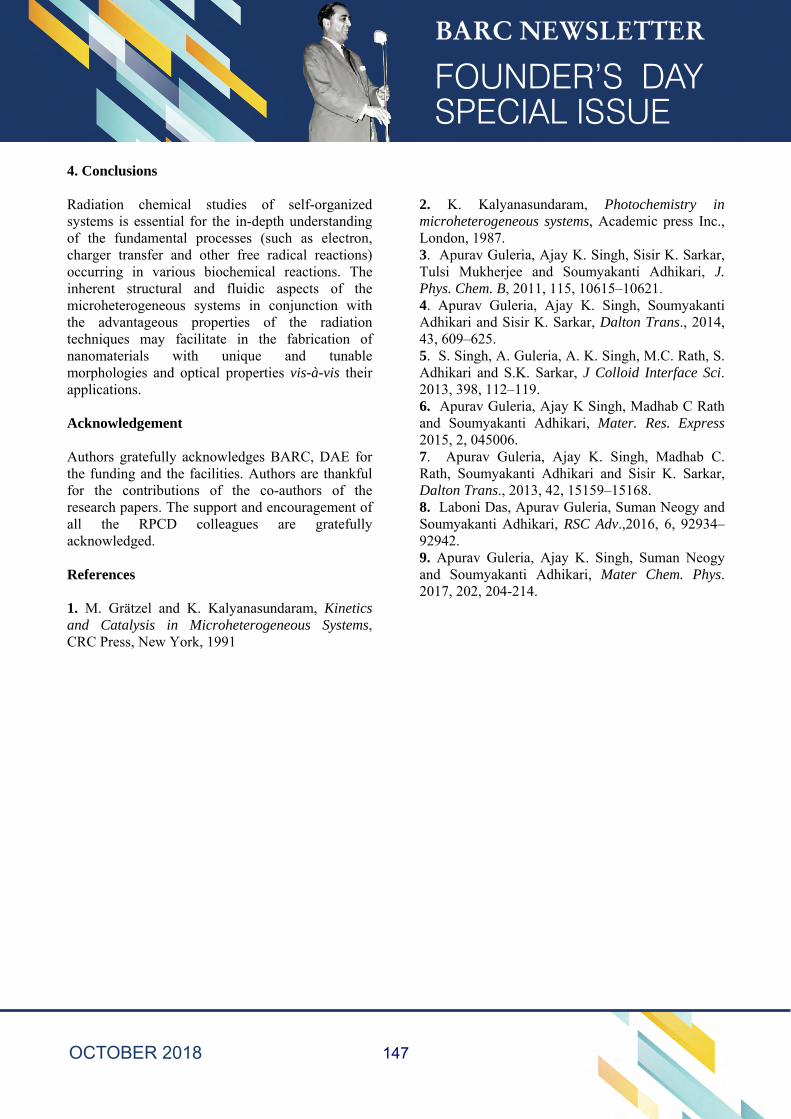
4. Conclusions Radiation chemical studies of self-organized systems is essential for the in-depth understanding of the fundamental processes (such as electron, charger transfer and other free radical reactions) occurring in various biochemical reactions. The inherent structural and fluidic aspects of the microheterogeneous systems in conjunction with the advantageous properties of the radiation techniques may facilitate in the fabrication of nanomaterials with unique and tunable morphologies and optical properties vis-à-vis their applications. Acknowledgement Authors gratefully acknowledges BARC, DAE for the funding and the facilities. Authors are thankful for the contributions of the co-authors of the research papers. The support and encouragement of all the RPCD colleagues are gratefully acknowledged. References 1. M. Grätzel and K. Kalyanasundaram, Kinetics and Catalysis in Microheterogeneous Systems, CRC Press, New York, 1991
2. K. Kalyanasundaram, Photochemistry in microheterogeneous systems, Academic press Inc., London, 1987. 3. Apurav Guleria, Ajay K. Singh, Sisir K. Sarkar, Tulsi Mukherjee and Soumyakanti Adhikari, J. Phys. Chem. B, 2011, 115, 10615–10621. 4. Apurav Guleria, Ajay K. Singh, Soumyakanti Adhikari and Sisir K. Sarkar, Dalton Trans., 2014, 43, 609–625. 5. S. Singh, A. Guleria, A. K. Singh, M.C. Rath, S. Adhikari and S.K. Sarkar, J Colloid Interface Sci. 2013, 398, 112–119. 6. Apurav Guleria, Ajay K Singh, Madhab C Rath and Soumyakanti Adhikari, Mater. Res. Express 2015, 2, 045006. 7. Apurav Guleria, Ajay K. Singh, Madhab C. Rath, Soumyakanti Adhikari and Sisir K. Sarkar, Dalton Trans., 2013, 42, 15159–15168. 8. Laboni Das, Apurav Guleria, Suman Neogy and Soumyakanti Adhikari, RSC Adv.,2016, 6, 92934–92942. 9. Apurav Guleria, Ajay K. Singh, Suman Neogy and Soumyakanti Adhikari, Mater Chem. Phys. 2017, 202, 204-214.
147
Flexible Conducting Polymer Thin Film Devices
Purushottam Jha, P. Veerender, S. P. Koiry, A. K. Chauhan, K. P. Muthe, and S. C. Gadkari
Technical Physics Division
Purushottam Jha is the recipient of the DAE Young Scientist Award for the year 2016
1. Introduction
Over the last one decade commercialisation of organic semiconductor based displays has accelerated the research on flexible organic thin film based devices. There are mainly two types of organic semiconductors: (i) Molecular organic semiconductors (e.g. Pentacene, Phthalocyanins) and (ii) Polymeric organic semiconductors (conducting polymers). Conducting polymers are potential candidates for flexible electronic devices as polymeric chains are packed through weak van der Waals forces and π-π interactions which make them flexible in nature. Also, solution processing over large area would make these devices cheaper than the silicon based technology. Therefore, the research for the deposition of flexible large area conducting polymer thin films are being explored worldwide to study their suitability as flexible sensors, organic field effect transistors (OFET), memory devices, solar cells, organic light emitting diodes (OLED), batteries, supercapacitors, membranes1. Our studies on conducting polymer thin films were mainly aimed at development of toxic gas sensors, organic solar cells, organic field effect transistors and prototype memory devices. For application in flexible devices, simpler fabrication method, long term stability in ambient conditions and change in device properties on bending were investigated. We have fabricated flexible conducting polymer thin films using two strategies: (i) Interfacial polymerisation: polymerisation at air-liquid or liquid-liquid interface (Polypyrrole films were studied with this method), (ii) Solution processing: spin coating/drop casting on flexible substrates.
2. Polypyrrole (PPy) free-standing films Polypyrrole (PPy) is one of the widely studied conducting polymers due to ease of polymerisation, low cost, excellent environmental stability and biocompatibility. For preparation of freestanding films the interfacial polymerisation (IP) method is superior to other methods like electro-polymerisation (EP) (in EP film is deposited on a substrate and peeled off later). In IP method, the polymerisation takes place at a stationary interface of two immiscible phases, with one phase containing monomer and other phase containing oxidant. At the interface monomers and oxidants reacts and the polymerisation takes place through diffusion controlled process. This leads to the slower rate of polymerisation compared to chemical polymerisation under the stirred condition. The polymerisation and films properties are dependent on monomer concentration, oxidant, dopants, solvents and temperature. We have prepared free-standing PPy film using IP and their potential of application as toxic gas sensor2, counter electrode in dye sensitized solar cell3 and memory material4 have been demonstrated. The detailed studies can be found in our previous publications2, 3, 4 and here we will discuss results briefly in following sections: 2.1 Preparation of free-standing polypyrrole films at air-water interface5 and their ammonia gas sensing properties Free-standing PPy nanosheets were prepared by dropping 200 μL solution, consisting of 1 mM 5-(4-hydroxyphenyl)-10,15,20-triphenylporphyrin (TPPOH) and 0.1M pyrrole, to 0.1 M aqueous
148
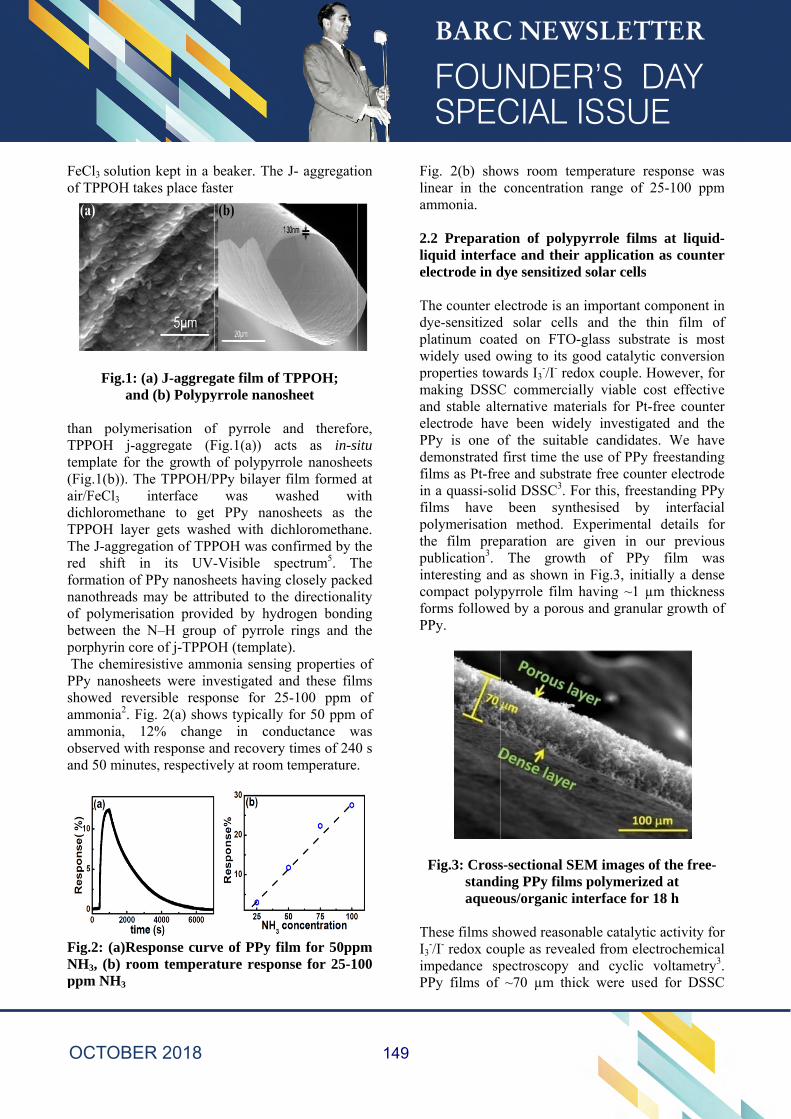
Fo
thTt(adTTrfnobp TPsaaoa
FNp
FeCl3 solutioof TPPOH ta
Fig.1: (and
han polymeTPPOH j-agemplate for
(Fig.1(b)). Thair/FeCl3 dichloromethTPPOH layeThe J-aggregred shift iformation of nanothreads of polymerisbetween the porphyrin corThe chemire
PPy nanosheshowed reveammonia2. Fammonia, 1observed withand 50 minut
Fig.2: (a)ResNH3, (b) rooppm NH3
on kept in a bakes place fas
(a) J-aggregd (b) Polypy
erisation ofggregate (Fthe growth
he TPPOH/Pinterface
hane to geter gets washgation of TPPn its UV-PPy nanoshmay be attri
sation providN–H group
re of j-TPPOesistive ammeets were inversible respoig. 2(a) show12% changh response ates, respectiv
sponse curvom tempera
beaker. The ster
gate film of Tyrrole nanos
f pyrrole aFig.1(a)) acof polypyrro
PPy bilayer fwas w
t PPy nanohed with dicPOH was con-Visible speets having cibuted to theded by hydrp of pyrrole OH (templatemonia sensingvestigated anonse for 25ws typically ge in condand recovery vely at room
ve of PPy filature respon
J- aggregati
TPPOH; sheet
and thereforcts as in-siole nanosheefilm formed ashed wi
osheets as tchloromethannfirmed by t
pectrum5. Tclosely packe directionalirogen bondirings and t
e). g properties nd these film5-100 ppm for 50 ppm
ductance wtimes of 240temperature
lm for 50ppnse for 25-1
on
re, itu ets at
ith the ne. the
The ked ity ing the
of ms of of
was 0 s .
pm 00
Filinam 2.liqel ThdyplwprmanelPPdefilinfilpothpuincofoPP
F
ThI3imPP
ig. 2(b) shonear in the mmonia.
.2 Preparatquid interfalectrode in d
he counter eye-sensitizedlatinum coat
widely used oroperties tow
making DSSCnd stable altlectrode havPy is one oemonstrated lms as Pt-fre
n a quassi-solms have olymerisationhe film prepublication3. nteresting anompact polyorms followePy.
Fig.3: Crossstandiaqueo
hese films sh-/I- redox cou
mpedance spPy films of
ows room teconcentratio
tion of polyace and theidye sensitize
lectrode is ad solar cellted on FTO
owing to its wards I3
-/I- reC commerciternative matve been widof the suitabfirst time th
ee and substrlid DSSC3. F
been synn method. paration are
The growd as shown pyrrole film
ed by a porou
s-sectional Sing PPy film
ous/organic i
howed reasonuple as reveapectroscopy ~70 µm th
emperature ron range of
ypyrrole filmir applicatioed solar cells
an important s and the
O-glass subsgood catalyt
edox couple. ally viable terials for P
dely investigble candidat
he use of PPyrate free couFor this, free
nthesised byExperimenta
e given in wth of PPy
in Fig.3, inim having ~1
us and granu
SEM imagesms polymerizinterface for nable catalytaled from ele
and cyclicick were us
response waf 25-100 ppm
ms at liquidon as countes
component ithin film o
strate is motic conversioHowever, focost effectivt-free counte
gated and thtes. We havy freestandin
unter electrodestanding PPy interfaciaal details foour previouy film waitially a densµm thicknes
ular growth o
s of the free-zed at r 18 h
tic activity foectrochemica voltametryed for DSS
as m
d-er
in of st
on or ve er he ve ng de Py al or us as se ss of
-
or al
y3. C
149
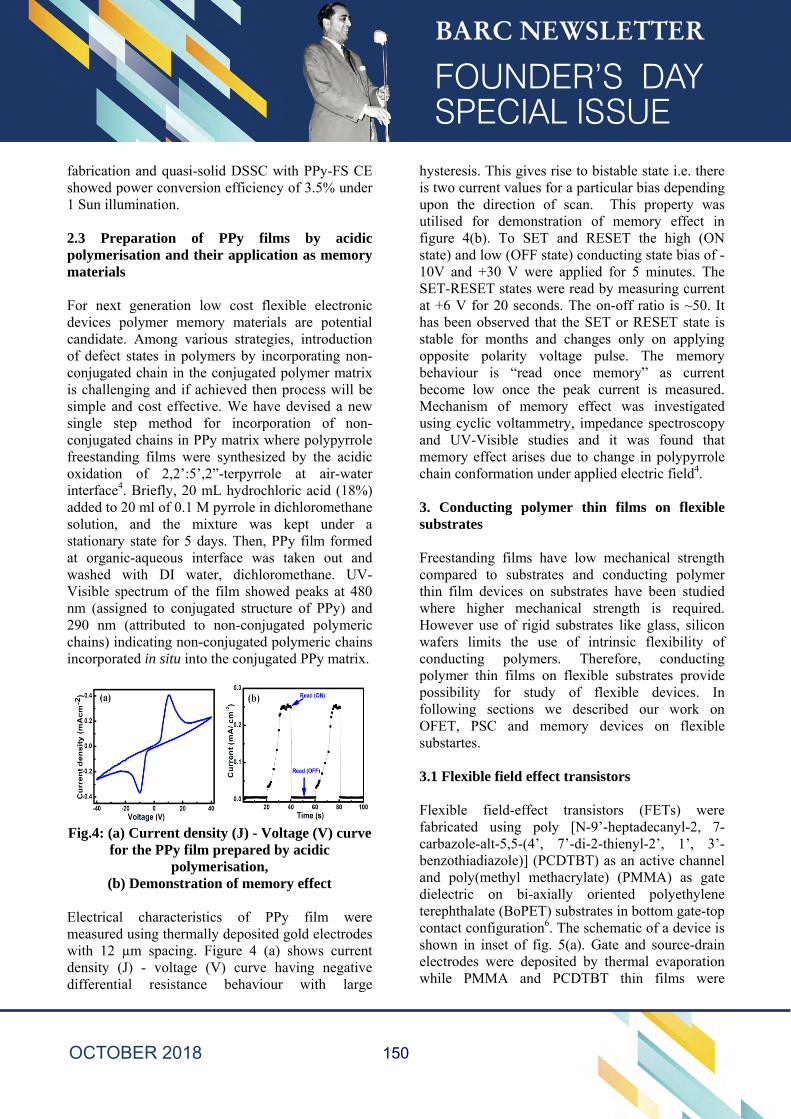
fabrication and quasi-solid DSSC with PPy-FS CE showed power conversion efficiency of 3.5% under 1 Sun illumination. 2.3 Preparation of PPy films by acidic polymerisation and their application as memory materials For next generation low cost flexible electronic devices polymer memory materials are potential candidate. Among various strategies, introduction of defect states in polymers by incorporating non-conjugated chain in the conjugated polymer matrix is challenging and if achieved then process will be simple and cost effective. We have devised a new single step method for incorporation of non-conjugated chains in PPy matrix where polypyrrole freestanding films were synthesized by the acidic oxidation of 2,2’:5’,2”-terpyrrole at air-water interface4. Briefly, 20 mL hydrochloric acid (18%) added to 20 ml of 0.1 M pyrrole in dichloromethane solution, and the mixture was kept under a stationary state for 5 days. Then, PPy film formed at organic-aqueous interface was taken out and washed with DI water, dichloromethane. UV-Visible spectrum of the film showed peaks at 480 nm (assigned to conjugated structure of PPy) and 290 nm (attributed to non-conjugated polymeric chains) indicating non-conjugated polymeric chains incorporated in situ into the conjugated PPy matrix.
Fig.4: (a) Current density (J) - Voltage (V) curve
for the PPy film prepared by acidic polymerisation,
(b) Demonstration of memory effect
Electrical characteristics of PPy film were measured using thermally deposited gold electrodes with 12 µm spacing. Figure 4 (a) shows current density (J) - voltage (V) curve having negative differential resistance behaviour with large
hysteresis. This gives rise to bistable state i.e. there is two current values for a particular bias depending upon the direction of scan. This property was utilised for demonstration of memory effect in figure 4(b). To SET and RESET the high (ON state) and low (OFF state) conducting state bias of -10V and +30 V were applied for 5 minutes. The SET-RESET states were read by measuring current at +6 V for 20 seconds. The on-off ratio is ~50. It has been observed that the SET or RESET state is stable for months and changes only on applying opposite polarity voltage pulse. The memory behaviour is “read once memory” as current become low once the peak current is measured. Mechanism of memory effect was investigated using cyclic voltammetry, impedance spectroscopy and UV-Visible studies and it was found that memory effect arises due to change in polypyrrole chain conformation under applied electric field4. 3. Conducting polymer thin films on flexible substrates Freestanding films have low mechanical strength compared to substrates and conducting polymer thin film devices on substrates have been studied where higher mechanical strength is required. However use of rigid substrates like glass, silicon wafers limits the use of intrinsic flexibility of conducting polymers. Therefore, conducting polymer thin films on flexible substrates provide possibility for study of flexible devices. In following sections we described our work on OFET, PSC and memory devices on flexible substartes. 3.1 Flexible field effect transistors Flexible field-effect transistors (FETs) were fabricated using poly [N-9’-heptadecanyl-2, 7-carbazole-alt-5,5-(4’, 7’-di-2-thienyl-2’, 1’, 3’-benzothiadiazole)] (PCDTBT) as an active channel and poly(methyl methacrylate) (PMMA) as gate dielectric on bi-axially oriented polyethylene terephthalate (BoPET) substrates in bottom gate-top contact configuration6. The schematic of a device is shown in inset of fig. 5(a). Gate and source-drain electrodes were deposited by thermal evaporation while PMMA and PCDTBT thin films were
150
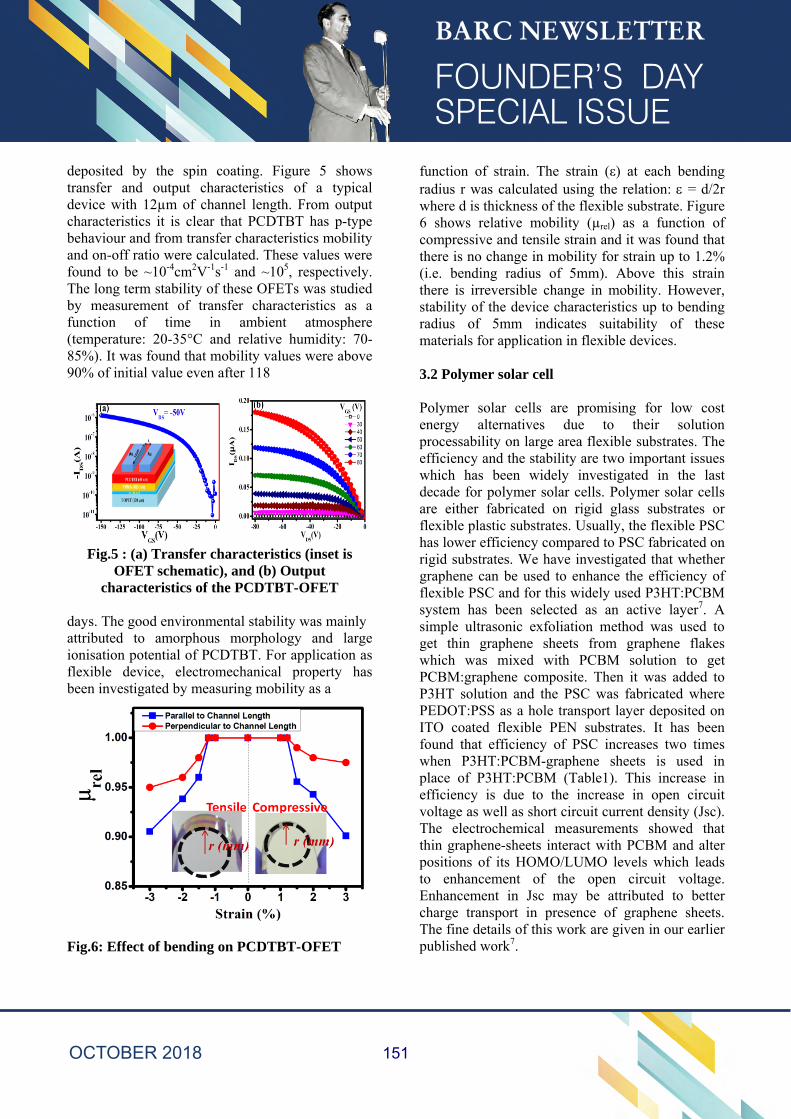
deposited by the spin coating. Figure 5 shows transfer and output characteristics of a typical device with 12µm of channel length. From output characteristics it is clear that PCDTBT has p-type behaviour and from transfer characteristics mobility and on-off ratio were calculated. These values were found to be ~10-4cm2V-1s-1 and ~105, respectively. The long term stability of these OFETs was studied by measurement of transfer characteristics as a function of time in ambient atmosphere (temperature: 20-35°C and relative humidity: 70-85%). It was found that mobility values were above 90% of initial value even after 118
Fig.5 : (a) Transfer characteristics (inset is
OFET schematic), and (b) Output characteristics of the PCDTBT-OFET
days. The good environmental stability was mainly attributed to amorphous morphology and large ionisation potential of PCDTBT. For application as flexible device, electromechanical property has been investigated by measuring mobility as a
Fig.6: Effect of bending on PCDTBT-OFET
function of strain. The strain (ε) at each bending radius r was calculated using the relation: = d/2r where d is thickness of the flexible substrate. Figure 6 shows relative mobility (µrel) as a function of compressive and tensile strain and it was found that there is no change in mobility for strain up to 1.2% (i.e. bending radius of 5mm). Above this strain there is irreversible change in mobility. However, stability of the device characteristics up to bending radius of 5mm indicates suitability of these materials for application in flexible devices. 3.2 Polymer solar cell Polymer solar cells are promising for low cost energy alternatives due to their solution processability on large area flexible substrates. The efficiency and the stability are two important issues which has been widely investigated in the last decade for polymer solar cells. Polymer solar cells are either fabricated on rigid glass substrates or flexible plastic substrates. Usually, the flexible PSC has lower efficiency compared to PSC fabricated on rigid substrates. We have investigated that whether graphene can be used to enhance the efficiency of flexible PSC and for this widely used P3HT:PCBM system has been selected as an active layer7. A simple ultrasonic exfoliation method was used to get thin graphene sheets from graphene flakes which was mixed with PCBM solution to get PCBM:graphene composite. Then it was added to P3HT solution and the PSC was fabricated where PEDOT:PSS as a hole transport layer deposited on ITO coated flexible PEN substrates. It has been found that efficiency of PSC increases two times when P3HT:PCBM-graphene sheets is used in place of P3HT:PCBM (Table1). This increase in efficiency is due to the increase in open circuit voltage as well as short circuit current density (Jsc). The electrochemical measurements showed that thin graphene-sheets interact with PCBM and alter positions of its HOMO/LUMO levels which leads to enhancement of the open circuit voltage. Enhancement in Jsc may be attributed to better charge transport in presence of graphene sheets. The fine details of this work are given in our earlier published work7.
151
Table 1: : Photovoltaic characteristics of PEN-ITO/PEDOT:PSS/Active layer/Al under 1 Sun
3.3 Resistive random memory Here we have designed and synthesized redox active organosilicate film for flexible non-volatile resistive random memory in which there are two current states under an applied electric field8. These films are composed of 5,10, 15, 20-terakis(4-hydroxyphenyl)-21H, 23H -porphine and 5, 10, 15, 20-tetra(4-pyridyl)-21H, 23H -porphine embedded in (3-aminopropyl) trimethoxysilane network. The film was prepared on gold-coated BoPET substrates by sol-gel method. For electrical characterizations, 40nm thick gold was deposited on the film for using as top contact. The current-voltage characteristics of devices, BoPET/gold/ film/gold, have shown hysteresis with two current peaks in opposite direction.
To explore the probable applications of hysteretic I-V characteristics, the memory effect was investigated by write- read- erase- read pulse: -2.5 V (write), 0 V (read), 2.5 V (erase), 0 V (read), respectively (Fig. 7). The corresponding current at each pulse was measured and also the pulse duration was varied from 1 s to 500 s for 200 cycles. A clear distinct two current states (± 6 µA) were observed at the read voltage (0 V) after the write and erase pulses (Fig 7). Moreover, the I-V characteristics show non zero- crossing behaviors, the measurement of open circuit voltage (OCV) could be another way to read/write the information. For this purpose, the OCV was measured with respect to time after applying 2.5 V for 10 s to generate charges in the system. The OCV was found to be ~ 0.8 V which decreased to zero after 3x 10³ s. When applied voltage is -2.5 V, the OCV is ~-0.8 V. Thus OCV could be used for reading a state, and the stability of OCV shows partial nonvolatile characteristics.
All these behaviors of organosilicate film were explained from quasi-reversible oxidation and reduction of moisture that diffuse inside the film and dissociate to ions under applied electric field8. These findings are important for designing new solution processible polymer materials which could found applications in flexible memory, ferroelectric based memory and switchable photovoltaic effects.
Fig.7: Current vs time observed for write- read- erase- read pulse: -2.5 V (write), 0 V (read), 2.5 V (erase), 0 V (read), respectively. Right inset shows the magnified view of current observed and left inset shows the pulse shape. The dotted line shows the difference in read currents between erase and write pulses. 4. Conclusion Flexible conducting polymer thin films (freestanding and on flexible substrates) were prepared. Their suitability for application in toxic gas sensors, OFET, organic solar cells and memory devices has been investigated. Acknowledgement Authors sincerely thank all our TFDS/TPD colleagues for their motivation and support. References 1. S. K. Gupta, P. Jha, Ajay Singh, M. M. Chehimi
and D. K. Aswal, Flexible organic semiconductor thin films, J. Mater. Chem. C, 3 (2015) 8468-8479.
2. P. Jha, N. S. Ramgir, P. K. Sharma, N. Datta, S. Kailasaganapathi, M. Kaur, S. P. Koiry, V.
0 100 200 300 400 500
0.0
0.5
1.0
1.5
Cu
rren
t (m
A)
Time (s)
258 260 262 264
write 2.5 V
Read 0 V
Erase -2.5 V
Read 0 V
-6.4 A6.2 A
Cu
rren
t (A
)
0.0 A
Write (2.5 V)
Read (0 V)
Erase (-2.5 V)
Time (s)
Time (s)
152
Saxena, A. K. Chauhan, A. K. Debnath, Ajay Singh, D. K. Aswal, S. K. Gupta, Charge transport and ammonia sensing properties of flexible polypyrrole nanosheets grown at air–liquid interface, Materials Chemistry and Physics,140 (2013)300-306.
3. P. Veerender, V. Saxena, P. Jha, S. Koiry, A. Gusain, S. Samanta, A. K. Chauhan, D.K. Aswal, and S. K. Gupta, Free-standing polypyrrole films as substrate-free and Pt-free counter electrodes for quasi-solid dye-sensitized solar cells, Org. Electron.,13 (2012)3032-3039.
4. P. Jha, S. P. Koiry, V. Saxena, P. Veerender, A. Gusain, A. K. Chauhan, D. K. Aswal, S. K. Gupta, Incorporation of non-conjugated polymer chain in conjugated polymer matrix: A new single step strategy for free standing non-volatile polymer memory, Organic Electro., 14 (2013)2896-2901.
5. P. Jha, S. P. Koiry, V. Saxena, P. Veerender, A. K. Chauhan, D. K. Aswal, and S. K. Gupta, Growth of Free-Standing Polypyrrole Nanosheets at Air/Liquid Interface Using J-Aggregate of Porphyrin Derivative as in-Situ Template, Macromolecules, 44 (2011) 4583-4585.
6. P. Jha, S. P. Koiry, V. Saxena, P. Veerender, A. Gusain, A. K. Chauhan, D.K. Aswal, S.K. Gupta, Air-stability and bending properties of flexible organic field-effect transistors based on poly [N-9′-heptadecanyl-2, 7-carbazole-alt-5, 5-(4′, 7′-di-2-thienyl-2′, 1′, 3′-benzothiadiazole)], Organic Electro., 14 (2013) 2635-2644.
7. A. K. Chauhan, A. Gusain, P. Jha, S. P. Koiry, V. Saxena, P Veerender, D. K. Aswal, S. K. Gupta, Graphene composite for improvement in the conversion efficiency of flexible poly(3-hexylthiophene): [6, 6] -phenyl C71 butyric acid methyl ester polymer solar cells, Applied Physics Letters, 104 (13) (2014) 133901.
8. S. P. Koiry, P. Jha, V. Putta, V. Saxena, A. K. Chauhan, D. K. Aswal, S. K. Gupta, Memory and ferroelectric photovoltaic effects arising from quasi-reversible oxidation and reduction in porphyrin entrapped aminopropyl-silicate films, Organic Electro., 25 (2015) 143-150.
153
Metastable Materials: Synthesis, Characterization and Property Evaluation
Rakesh Shukla
Chemistry Division, Chemistry Group
Rakesh Shukla is the recipient of the DAE Young Scientist Award for the year 2016
Abstract Material can acquire metastablity due to reasons like unusual valency, unusual coordination, ionic strength i.e. preferences for ionic/covalent/metallic bonding. Synthesis of several metastable and stable materials having perovskite and fluorite related structures have been discussed in this article. Attempts are also made to prepare series of compounds with unusual oxidation state and unusual coordination number, which are expected to have interesting functionalities.
Introduction Recent technological applications demands innovative materials with desired functional properties. Rare-earth based materials are important for various technological applications as they show interesting magnetic, optical, electrical and catalytic behavior [1-4]. Functionality of any materials depends greatly on the preparation method and its subsequent treatment. Material can acquire metastablity due to reasons like unusual valency, unusual coordination, ionic strength i.e. preferences for ionic/covalent/metallic bonding. The thermodynamic stability of a compound is attributed to the global minima of the Gibb’s free energy, whereas, the kinetic and crystallographic stability can stabilize a metastable compound with local thermodynamic minima. The metastable compounds can be isolated by taking care of appropriate conditions. To synthesize these metastable materials a number of soft chemical routes are utilized as these routes also offer better-homogeneity, fine particle-size and superior powder quality. Among the available synthesis methods, Gel-combustion is a non-equilibrium method that can stabilize metastable materials [5]. This technique provides material at a lower temperature, with better powder quality and is also amenable to scaling-up. Below discussed are the few examples mainly Gd2-xCexZr2-xAlxO7 (0.0 ≤ x ≤
2.0) and REInO3 (RE = La, Pr, Nd, Sm Eu, Gd, Y, Dy Ho, Er, Yb), wherein several metastable compounds have been isolated and their structure properties relationship have been discussed. Experimental The samples were mainly synthesized by gel-combustion method using glycine as fuel. Gd2-
xCexZr2-xAlxO7 (0.0 ≤ x ≤ 2.0) compositions were prepared with glycine as a fuel in stoichiometric ratio. To get rid of excess carbon, the powders obtained were calcined at 600 oC for 2 h. In order to reduce Ce4+ to Ce3+
in these compositions, the powders were pelletized, wrapped in tantalum foil, introduced in quartz tube in presence of zirconium sponge and then vacuum sealed online (10-6 mbar). Zirconium sponge acts as oxygen-getter. The tube was then heated at 1050 oC for 24 h. REInO3 were synthesized via gel-combustion method using glycine as fuel in fuel-deficient ratio. In order to compare the role of synthesis, compounds were also prepared by conventional solid state method using three step heating protocol. Result and discussions An example of two system will be discussed i.e. Gd2-xCexZr2-xAlxO7 (0.0 ≤ x ≤ 2.0) and REInO3. Phase evolution studies on the sample were done as a function of composition and temperature. All the
154
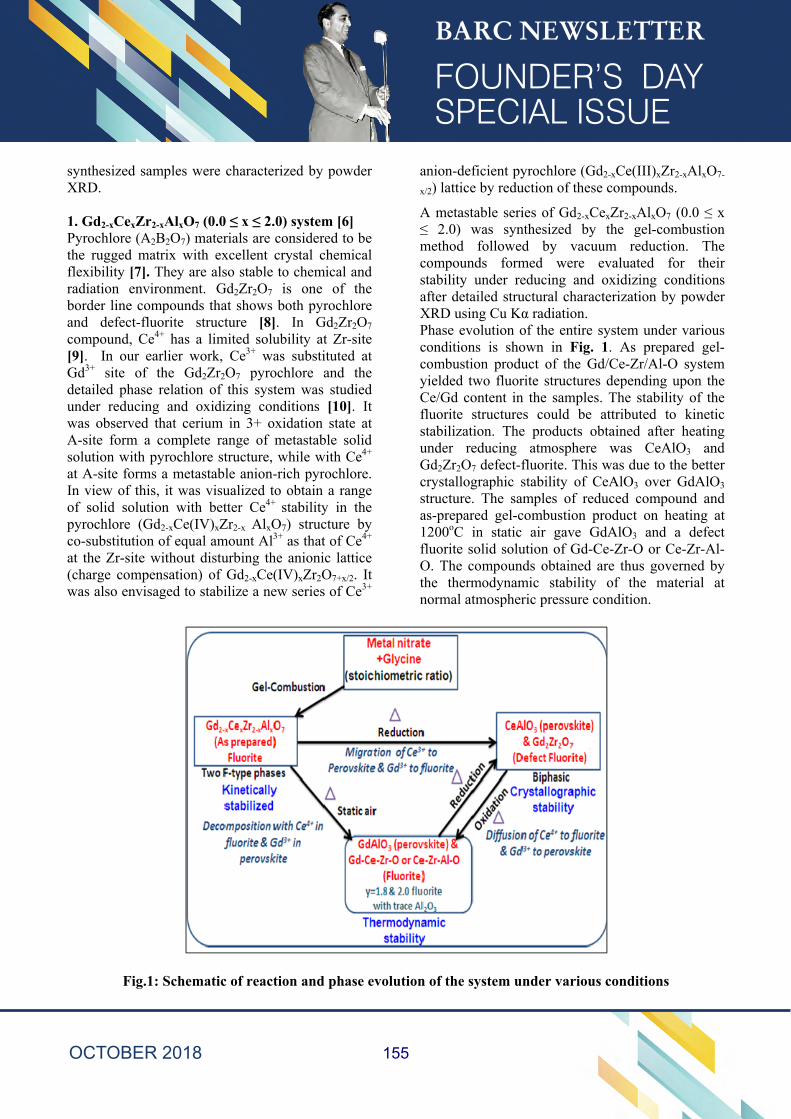
synthesized samples were characterized by powder XRD. 1. Gd2-xCexZr2-xAlxO7 (0.0 ≤ x ≤ 2.0) system [6] Pyrochlore (A2B2O7) materials are considered to be the rugged matrix with excellent crystal chemical flexibility [7]. They are also stable to chemical and radiation environment. Gd2Zr2O7 is one of the border line compounds that shows both pyrochlore and defect-fluorite structure [8]. In Gd2Zr2O7 compound, Ce4+ has a limited solubility at Zr-site [9]. In our earlier work, Ce3+ was substituted at Gd3+ site of the Gd2Zr2O7 pyrochlore and the detailed phase relation of this system was studied under reducing and oxidizing conditions [10]. It was observed that cerium in 3+ oxidation state at A-site form a complete range of metastable solid solution with pyrochlore structure, while with Ce4+ at A-site forms a metastable anion-rich pyrochlore. In view of this, it was visualized to obtain a range of solid solution with better Ce4+ stability in the pyrochlore (Gd2-xCe(IV)xZr2-x AlxO7) structure by co-substitution of equal amount Al3+ as that of Ce4+ at the Zr-site without disturbing the anionic lattice (charge compensation) of Gd2-xCe(IV)xZr2O7+x/2. It was also envisaged to stabilize a new series of Ce3+
anion-deficient pyrochlore (Gd2-xCe(III)xZr2-xAlxO7-
x/2) lattice by reduction of these compounds.
A metastable series of Gd2-xCexZr2-xAlxO7 (0.0 ≤ x ≤ 2.0) was synthesized by the gel-combustion method followed by vacuum reduction. The compounds formed were evaluated for their stability under reducing and oxidizing conditions after detailed structural characterization by powder XRD using Cu Kα radiation. Phase evolution of the entire system under various conditions is shown in Fig. 1. As prepared gel-combustion product of the Gd/Ce-Zr/Al-O system yielded two fluorite structures depending upon the Ce/Gd content in the samples. The stability of the fluorite structures could be attributed to kinetic stabilization. The products obtained after heating under reducing atmosphere was CeAlO3 and Gd2Zr2O7 defect-fluorite. This was due to the better crystallographic stability of CeAlO3 over GdAlO3 structure. The samples of reduced compound and as-prepared gel-combustion product on heating at 1200oC in static air gave GdAlO3 and a defect fluorite solid solution of Gd-Ce-Zr-O or Ce-Zr-Al-O. The compounds obtained are thus governed by the thermodynamic stability of the material at normal atmospheric pressure condition.
Fig.1: Schematic of reaction and phase evolution of the system under various conditions
155
Fluorite solid solution formation of the as-prepared sample was unexpected due to the fact that there is limited solubility of the Al3+ in the defect-fluorite lattice. The stability of the defect-fluorite structure of the as-prepared sample can be attributed to the non-equilibrium method employed and the nano nature of the compound. The as-prepared defect-fluorite sample is a kinetically stabilized metastable phase. Thus it can be noted that by employing a non-equlibrium method and making the sample in the nano-regime it is possible to considerably extend the solubility leading to metastable solid solutions. The decomposition of the metastable fluorite-type samples on heating at 1200 oC in static air can be explained by the tolerance factor concept. Tolerance factor of GdAlO3 is 0.9714 which is very close to the ideal value of 1. Thus among all the possible phases in this system, GdAlO3 is the most stable and hence Gd diffuses out from the nano-crystalline fluorite-type Gd2-
xCexZr2-xAlxO7 and preferentially reacts with Al3+ to form GdAlO3. On the other hand, Ce4+(0.97Å) dissloves in Gd2Zr2O7 forming a defect-fluorite type structure. The formation of fluorite structure instead of pyrochlore can be explained by the effective decrease in the average A-site radius due to incorporation of Ce4+ ion (rA/rB decreases which favors the formation of fluorite-type phase). The concept of crystallographic and entropy stability are one of the major factor that are contributing toward the overall kinetic stability. On reduction of these samples it was observed Ce4+(0.97Å) reduces to Ce3+(1.143Å), under these condition the stability of CeAlO3 is more as the tolerance factor of CeAlO3 is 1.001 and hence Ce diffuses out from the nano-crystalline fluorite-type Gd2-xCexZr2-xAlxO7 / GdAlO3 and preferentially reacts with Al3+ to form CeAlO3. Thus, it could be inferred that the formation of more stable compound in the presence of two competing cations (i.e. Gd3+ and Ce3+) is guided by the crystallographic stability.
2. Hexagonal perovskite related materials [11-13] ABO3 are the most flexible class of materials but are mostly related with perovskite structure. Ideal perovskites are characterized by
corner sharing BO6 octahedra and larger cation with AO8-12 polyhedra. Several structures are adopted by ABO3 compositions such as corundum, bixbyite, ilmenite, perovskites and several interesting hexagonal phases [14]. The stability of perovskites is predicted by tolerance factors i.e (rA+ rO)/ √2(rB+ rO) [14, 15]. If this ratio is close to 1, the structure adopts cubic perovskite modification. If this ratio lies between 0.85 and 1, it prefers lower symmetry modification of perovskite. The hexagonal perovskite related structure exists in the narrow window of tolerance factor between 0.83-0.85. They are layered structures composed of BO5 trigonal bypyramids linked together by AO7 polyhedra. The possibility of improper ferroelectricity, have led to rise of research on these hexagonal compounds [14]. The conventional solid-state synthesis routes yields the thermodynamically stable modifications. The soft chemical routes, on the other hand, have the potential to stabilize the metastable modifications. Role of synthesis route becomes further important if the structural parameters responsible for the phase adopted lie on the borderline. In view of this, synthesis of REInO3 (RE = La, Nd, Pr, Sm Eu, Gd, Tb, Dy Ho, Er) was carried out. The samples were synthesized via gel-combustion method using glycine as fuel in fuel-deficient ratio. In order to compare the role of synthesis, compounds were also prepared by solid state route. Phase relations observed in the systems have been shown in Fig 2. The lower REInO3 (i.e. La-Sm) get stabilized in orthorhombic perovskite modification, the middle REInO3 (Sm-Tb) formed hexagonal perovskite related structure and the higher REInO3 either showed mixed phase (Dy, Ho) or single phasic C-type cubic (Er, Yb) structure. The hexagonal perovskite related structure in REInO3 stabilized with space group P63cm, which is a non-centrosymmetric structure that has a potential to show ferroelectricity. The solid state route yielded a pure single-phasic orthorhombic modification of SmInO3 whereas GC- synthesized SmInO3 crystallized in hexagonal modification.
156
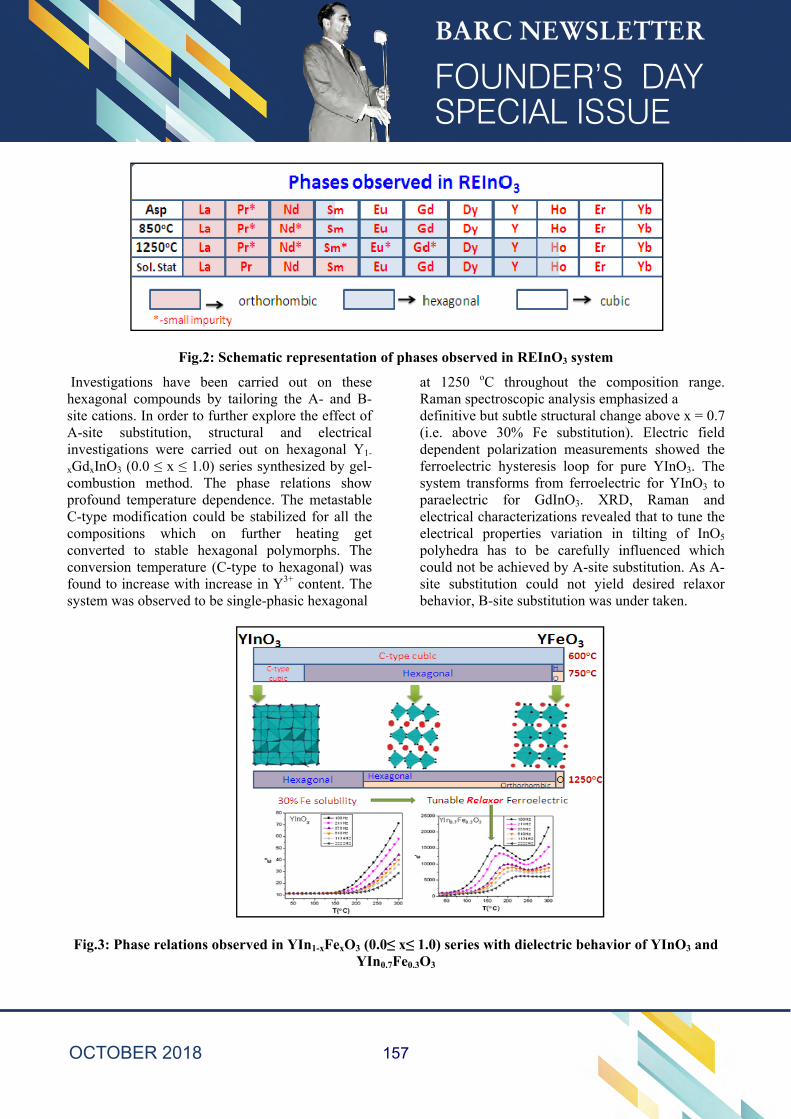
Fig.2: Schematic representation of phases observed in REInO3 system
Investigations have been carried out on these hexagonal compounds by tailoring the A- and B-site cations. In order to further explore the effect of A-site substitution, structural and electrical investigations were carried out on hexagonal Y1-
xGdxInO3 (0.0 ≤ x ≤ 1.0) series synthesized by gel-combustion method. The phase relations show profound temperature dependence. The metastable C-type modification could be stabilized for all the compositions which on further heating get converted to stable hexagonal polymorphs. The conversion temperature (C-type to hexagonal) was found to increase with increase in Y3+ content. The system was observed to be single-phasic hexagonal
at 1250 oC throughout the composition range. Raman spectroscopic analysis emphasized a definitive but subtle structural change above x = 0.7 (i.e. above 30% Fe substitution). Electric field dependent polarization measurements showed the ferroelectric hysteresis loop for pure YInO3. The system transforms from ferroelectric for YInO3 to paraelectric for GdInO3. XRD, Raman and electrical characterizations revealed that to tune the electrical properties variation in tilting of InO5 polyhedra has to be carefully influenced which could not be achieved by A-site substitution. As A-site substitution could not yield desired relaxor behavior, B-site substitution was under taken.
Fig.3: Phase relations observed in YIn1-xFexO3 (0.0≤ x≤ 1.0) series with dielectric behavior of YInO3 and
YIn0.7Fe0.3O3
157
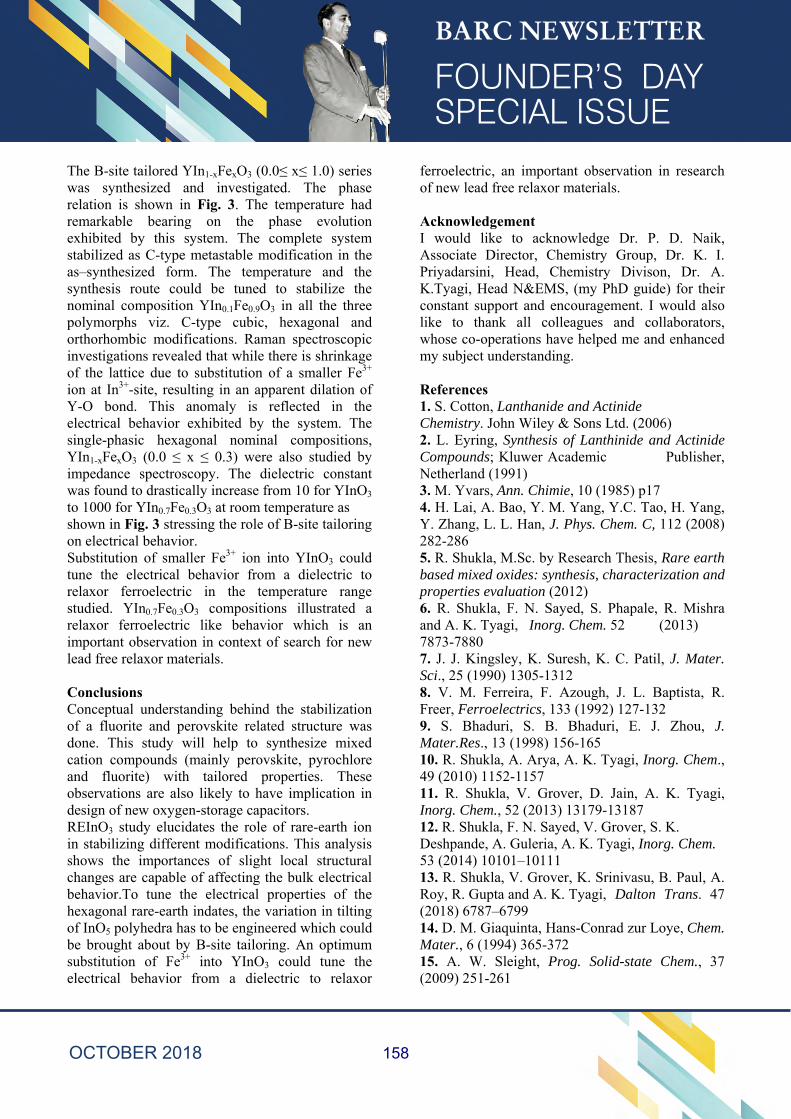
The B-site tailored YIn1-xFexO3 (0.0≤ x≤ 1.0) series was synthesized and investigated. The phase relation is shown in Fig. 3. The temperature had remarkable bearing on the phase evolution exhibited by this system. The complete system stabilized as C-type metastable modification in the as–synthesized form. The temperature and the synthesis route could be tuned to stabilize the nominal composition YIn0.1Fe0.9O3 in all the three polymorphs viz. C-type cubic, hexagonal and orthorhombic modifications. Raman spectroscopic investigations revealed that while there is shrinkage of the lattice due to substitution of a smaller Fe3+ ion at In3+-site, resulting in an apparent dilation of Y-O bond. This anomaly is reflected in the electrical behavior exhibited by the system. The single-phasic hexagonal nominal compositions, YIn1-xFexO3 (0.0 ≤ x ≤ 0.3) were also studied by impedance spectroscopy. The dielectric constant was found to drastically increase from 10 for YInO3 to 1000 for YIn0.7Fe0.3O3 at room temperature as shown in Fig. 3 stressing the role of B-site tailoring on electrical behavior. Substitution of smaller Fe3+ ion into YInO3 could tune the electrical behavior from a dielectric to relaxor ferroelectric in the temperature range studied. YIn0.7Fe0.3O3 compositions illustrated a relaxor ferroelectric like behavior which is an important observation in context of search for new lead free relaxor materials. Conclusions Conceptual understanding behind the stabilization of a fluorite and perovskite related structure was done. This study will help to synthesize mixed cation compounds (mainly perovskite, pyrochlore and fluorite) with tailored properties. These observations are also likely to have implication in design of new oxygen-storage capacitors. REInO3 study elucidates the role of rare-earth ion in stabilizing different modifications. This analysis shows the importances of slight local structural changes are capable of affecting the bulk electrical behavior.To tune the electrical properties of the hexagonal rare-earth indates, the variation in tilting of InO5 polyhedra has to be engineered which could be brought about by B-site tailoring. An optimum substitution of Fe3+ into YInO3 could tune the electrical behavior from a dielectric to relaxor
ferroelectric, an important observation in research of new lead free relaxor materials. Acknowledgement I would like to acknowledge Dr. P. D. Naik, Associate Director, Chemistry Group, Dr. K. I. Priyadarsini, Head, Chemistry Divison, Dr. A. K.Tyagi, Head N&EMS, (my PhD guide) for their constant support and encouragement. I would also like to thank all colleagues and collaborators, whose co-operations have helped me and enhanced my subject understanding. References 1. S. Cotton, Lanthanide and Actinide Chemistry. John Wiley & Sons Ltd. (2006) 2. L. Eyring, Synthesis of Lanthinide and Actinide Compounds; Kluwer Academic Publisher, Netherland (1991) 3. M. Yvars, Ann. Chimie, 10 (1985) p17 4. H. Lai, A. Bao, Y. M. Yang, Y.C. Tao, H. Yang, Y. Zhang, L. L. Han, J. Phys. Chem. C, 112 (2008) 282-286 5. R. Shukla, M.Sc. by Research Thesis, Rare earth based mixed oxides: synthesis, characterization and properties evaluation (2012) 6. R. Shukla, F. N. Sayed, S. Phapale, R. Mishra and A. K. Tyagi, Inorg. Chem. 52 (2013) 7873-7880 7. J. J. Kingsley, K. Suresh, K. C. Patil, J. Mater. Sci., 25 (1990) 1305-1312 8. V. M. Ferreira, F. Azough, J. L. Baptista, R. Freer, Ferroelectrics, 133 (1992) 127-132 9. S. Bhaduri, S. B. Bhaduri, E. J. Zhou, J. Mater.Res., 13 (1998) 156-165 10. R. Shukla, A. Arya, A. K. Tyagi, Inorg. Chem., 49 (2010) 1152-1157 11. R. Shukla, V. Grover, D. Jain, A. K. Tyagi, Inorg. Chem., 52 (2013) 13179-13187 12. R. Shukla, F. N. Sayed, V. Grover, S. K. Deshpande, A. Guleria, A. K. Tyagi, Inorg. Chem. 53 (2014) 10101–10111 13. R. Shukla, V. Grover, K. Srinivasu, B. Paul, A. Roy, R. Gupta and A. K. Tyagi, Dalton Trans. 47 (2018) 6787–6799 14. D. M. Giaquinta, Hans-Conrad zur Loye, Chem. Mater., 6 (1994) 365-372 15. A. W. Sleight, Prog. Solid-state Chem., 37 (2009) 251-261
158
Modeling and Experiments of Annular Two-Phase Flow Under Dryout and Post Dryout Conditions for
Nuclear Reactors
Arnab Dasgupta, D.K. Chandraker, A.K. Nayak Reactor Engineering Division
Arnab Dasgupta is the recipient of the DAE Young Engineer
Award for the year 2016
Abstract This paper provides an overview of the studies carried out for dryout and post dryout phenomena relevant to nuclear reactors with special emphasis on Advanced Heavy Water Reactor (AHWR). It describes the mechanistic model for annular two phase flow and its use for prediction of dryout power. Comparison of predicted dryout power with experimental values is presented for tubes as well as rod bundles. It is seen that the mechanistic model can predict dryout power with reasonable accuracy. The model is also applied for AHWR rod bundle dryout prediction and critical power of AHWR is estimated. The paper also describes the experiments performed for design validation of in-bundle ECCS injection system of AHWR. This is a very unique and novel injection system for which no studies are available in open literature. 1. Introduction Safety is the cornerstone of nuclear reactor engineering. It is the integral feature of design, analysis, construction and operation of nuclear reactors. The thermal hydraulic design of water cooled reactors has to ensure that under no design basis circumstance the nuclear fuel clad should fail leading to release of radioactivity. This is essentially achieved by precluding the occurrence of Critical Heat Flux (CHF) under normal operation and Anticipated Operational Occurrences (AOOs) and limiting the clad surface temperature under Design Basis Events (DBEs). In an operating reactor, there are no instruments available which would detect either the clad surface temperature or Critical Heat Flux (CHF). Thus, the challenge of thermal hydraulics is to evolve methodologies, correlations and analysis techniques of CHF prediction for the whole gamut of operational circumstances in a nuclear reactor. For normal operation and AOOs, the methodology is to evaluate the thermal margin for a nuclear reactor. This refers to a particular power at which the coolant can no longer carry away the nuclear heat efficiently, leading to a substantial and sharp
increase in clad surface temperature. This phenomenon is termed Critical Heat Flux (CHF) in general and the ensuing temperature rise may be moderately high leading to accelerated clad corrosion or high enough to cause local melting of clad. This paper describes the techniques used to arrive at the thermal margin of nuclear reactor with particular application to Advanced Heavy Water Reactor (AHWR). The methodology adopted for DBEs is to first identify the limiting condition and then evaluate the adequacy of safety systems to limit the clad surface temperature below safety limits. This paper describes a similar exercise carried out for AHWR for postulated Loss of Coolant Accident (LOCA) and demonstrates the adequacy of ECC injection. The next section briefly describes the phenomenon of CHF in Boiling Water Reactors (BWRs) and the importance of post dryout heat transfer studies. The studies performed as a part of this work are then detailed in sections 3 (dryout) and 4 (post dryout).
2. Critical heat Flux and Post-dryout heat transfer
The phenomenon of Critical Heat Flux (CHF) was first discovered by Nukiyama (Nukiyama, 1965) in
159
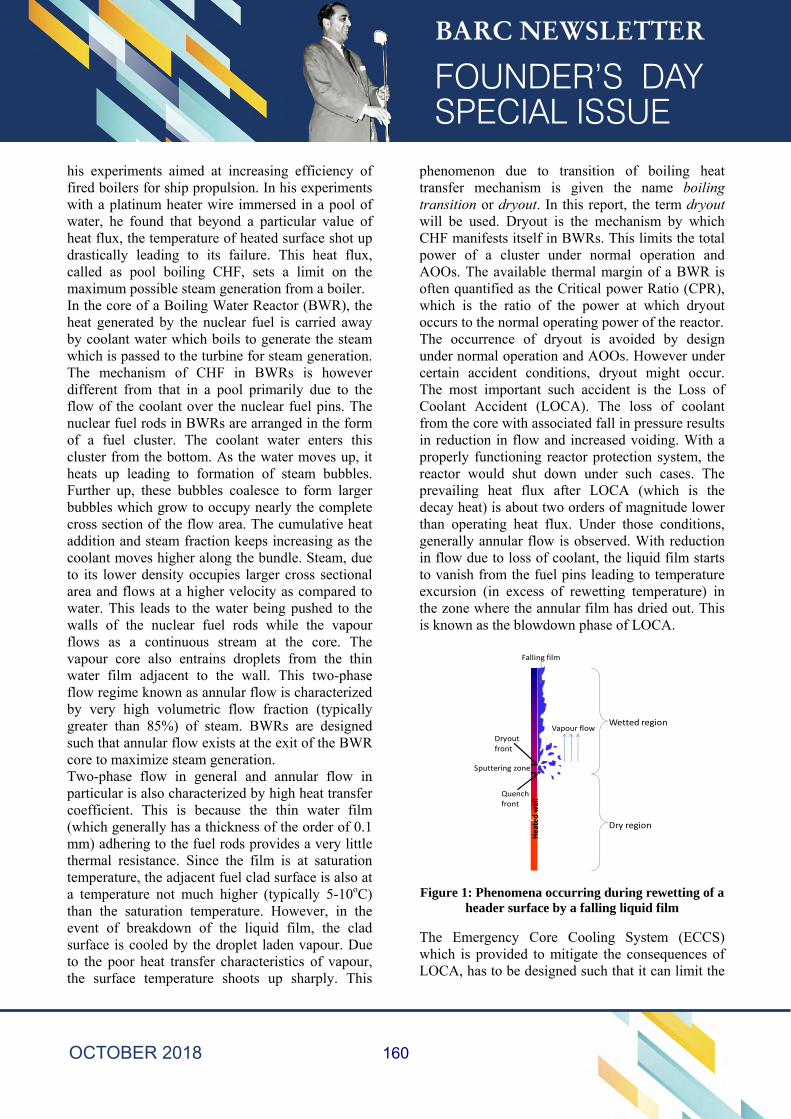
his experiments aimed at increasing efficiency of fired boilers for ship propulsion. In his experiments with a platinum heater wire immersed in a pool of water, he found that beyond a particular value of heat flux, the temperature of heated surface shot up drastically leading to its failure. This heat flux, called as pool boiling CHF, sets a limit on the maximum possible steam generation from a boiler. In the core of a Boiling Water Reactor (BWR), the heat generated by the nuclear fuel is carried away by coolant water which boils to generate the steam which is passed to the turbine for steam generation. The mechanism of CHF in BWRs is however different from that in a pool primarily due to the flow of the coolant over the nuclear fuel pins. The nuclear fuel rods in BWRs are arranged in the form of a fuel cluster. The coolant water enters this cluster from the bottom. As the water moves up, it heats up leading to formation of steam bubbles. Further up, these bubbles coalesce to form larger bubbles which grow to occupy nearly the complete cross section of the flow area. The cumulative heat addition and steam fraction keeps increasing as the coolant moves higher along the bundle. Steam, due to its lower density occupies larger cross sectional area and flows at a higher velocity as compared to water. This leads to the water being pushed to the walls of the nuclear fuel rods while the vapour flows as a continuous stream at the core. The vapour core also entrains droplets from the thin water film adjacent to the wall. This two-phase flow regime known as annular flow is characterized by very high volumetric flow fraction (typically greater than 85%) of steam. BWRs are designed such that annular flow exists at the exit of the BWR core to maximize steam generation. Two-phase flow in general and annular flow in particular is also characterized by high heat transfer coefficient. This is because the thin water film (which generally has a thickness of the order of 0.1 mm) adhering to the fuel rods provides a very little thermal resistance. Since the film is at saturation temperature, the adjacent fuel clad surface is also at a temperature not much higher (typically 5-10oC) than the saturation temperature. However, in the event of breakdown of the liquid film, the clad surface is cooled by the droplet laden vapour. Due to the poor heat transfer characteristics of vapour, the surface temperature shoots up sharply. This
phenomenon due to transition of boiling heat transfer mechanism is given the name boiling transition or dryout. In this report, the term dryout will be used. Dryout is the mechanism by which CHF manifests itself in BWRs. This limits the total power of a cluster under normal operation and AOOs. The available thermal margin of a BWR is often quantified as the Critical power Ratio (CPR), which is the ratio of the power at which dryout occurs to the normal operating power of the reactor. The occurrence of dryout is avoided by design under normal operation and AOOs. However under certain accident conditions, dryout might occur. The most important such accident is the Loss of Coolant Accident (LOCA). The loss of coolant from the core with associated fall in pressure results in reduction in flow and increased voiding. With a properly functioning reactor protection system, the reactor would shut down under such cases. The prevailing heat flux after LOCA (which is the decay heat) is about two orders of magnitude lower than operating heat flux. Under those conditions, generally annular flow is observed. With reduction in flow due to loss of coolant, the liquid film starts to vanish from the fuel pins leading to temperature excursion (in excess of rewetting temperature) in the zone where the annular film has dried out. This is known as the blowdown phase of LOCA.
Figure 1: Phenomena occurring during rewetting of a header surface by a falling liquid film
The Emergency Core Cooling System (ECCS) which is provided to mitigate the consequences of LOCA, has to be designed such that it can limit the
Wetted region
Dry region
Vapour flow
Quench front
Dryout front
Sputtering zone
Falling film
Heated wall
160
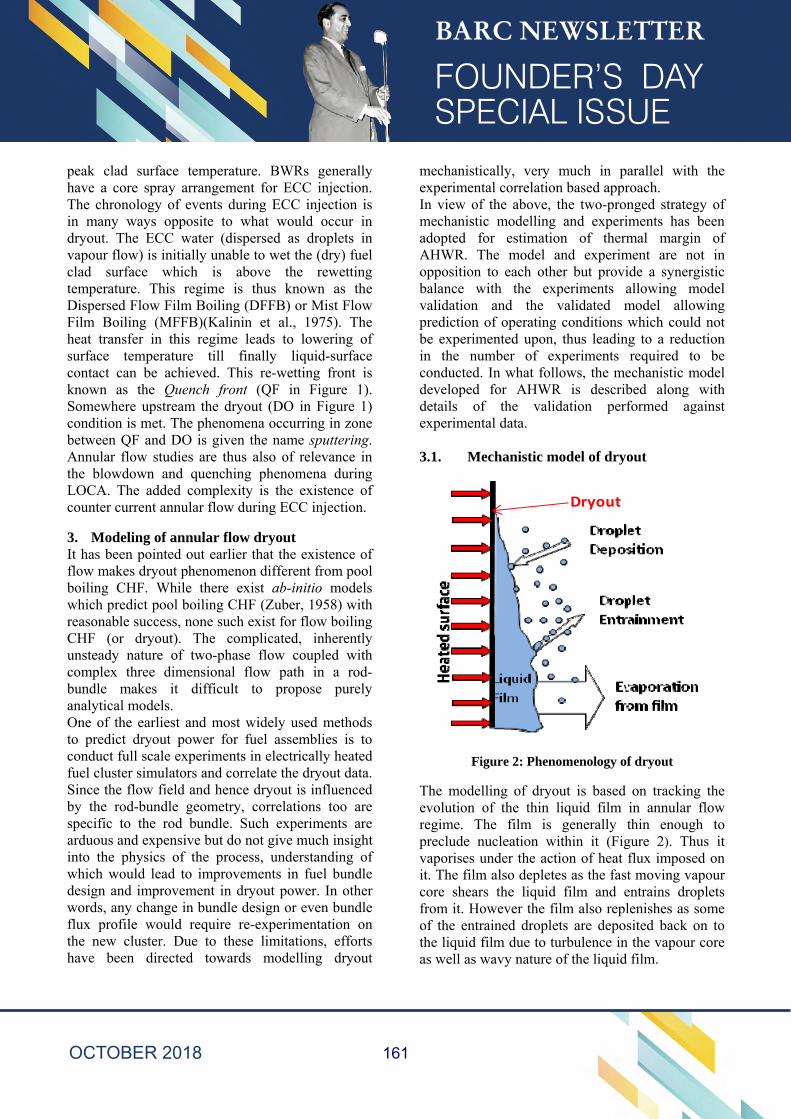
peak clad surface temperature. BWRs generally have a core spray arrangement for ECC injection. The chronology of events during ECC injection is in many ways opposite to what would occur in dryout. The ECC water (dispersed as droplets in vapour flow) is initially unable to wet the (dry) fuel clad surface which is above the rewetting temperature. This regime is thus known as the Dispersed Flow Film Boiling (DFFB) or Mist Flow Film Boiling (MFFB)(Kalinin et al., 1975). The heat transfer in this regime leads to lowering of surface temperature till finally liquid-surface contact can be achieved. This re-wetting front is known as the Quench front (QF in Figure 1). Somewhere upstream the dryout (DO in Figure 1) condition is met. The phenomena occurring in zone between QF and DO is given the name sputtering. Annular flow studies are thus also of relevance in the blowdown and quenching phenomena during LOCA. The added complexity is the existence of counter current annular flow during ECC injection.
3. Modeling of annular flow dryout It has been pointed out earlier that the existence of flow makes dryout phenomenon different from pool boiling CHF. While there exist ab-initio models which predict pool boiling CHF (Zuber, 1958) with reasonable success, none such exist for flow boiling CHF (or dryout). The complicated, inherently unsteady nature of two-phase flow coupled with complex three dimensional flow path in a rod-bundle makes it difficult to propose purely analytical models. One of the earliest and most widely used methods to predict dryout power for fuel assemblies is to conduct full scale experiments in electrically heated fuel cluster simulators and correlate the dryout data. Since the flow field and hence dryout is influenced by the rod-bundle geometry, correlations too are specific to the rod bundle. Such experiments are arduous and expensive but do not give much insight into the physics of the process, understanding of which would lead to improvements in fuel bundle design and improvement in dryout power. In other words, any change in bundle design or even bundle flux profile would require re-experimentation on the new cluster. Due to these limitations, efforts have been directed towards modelling dryout
mechanistically, very much in parallel with the experimental correlation based approach. In view of the above, the two-pronged strategy of mechanistic modelling and experiments has been adopted for estimation of thermal margin of AHWR. The model and experiment are not in opposition to each other but provide a synergistic balance with the experiments allowing model validation and the validated model allowing prediction of operating conditions which could not be experimented upon, thus leading to a reduction in the number of experiments required to be conducted. In what follows, the mechanistic model developed for AHWR is described along with details of the validation performed against experimental data. 3.1. Mechanistic model of dryout
Figure 2: Phenomenology of dryout
The modelling of dryout is based on tracking the evolution of the thin liquid film in annular flow regime. The film is generally thin enough to preclude nucleation within it (Figure 2). Thus it vaporises under the action of heat flux imposed on it. The film also depletes as the fast moving vapour core shears the liquid film and entrains droplets from it. However the film also replenishes as some of the entrained droplets are deposited back on to the liquid film due to turbulence in the vapour core as well as wavy nature of the liquid film.
Dryout
161
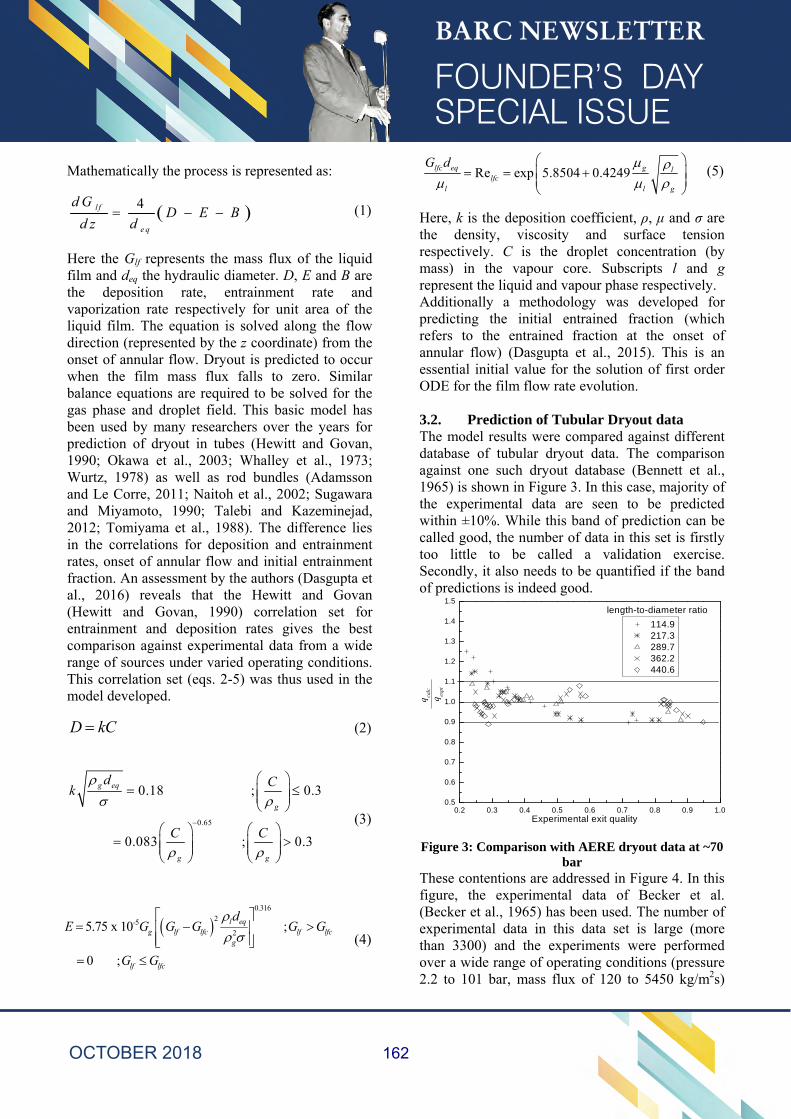
Mathematically the process is represented as:
4l f
e q
d GD E B
d z d (1)
Here the Glf represents the mass flux of the liquid film and deq the hydraulic diameter. D, E and B are the deposition rate, entrainment rate and vaporization rate respectively for unit area of the liquid film. The equation is solved along the flow direction (represented by the z coordinate) from the onset of annular flow. Dryout is predicted to occur when the film mass flux falls to zero. Similar balance equations are required to be solved for the gas phase and droplet field. This basic model has been used by many researchers over the years for prediction of dryout in tubes (Hewitt and Govan, 1990; Okawa et al., 2003; Whalley et al., 1973; Wurtz, 1978) as well as rod bundles (Adamsson and Le Corre, 2011; Naitoh et al., 2002; Sugawara and Miyamoto, 1990; Talebi and Kazeminejad, 2012; Tomiyama et al., 1988). The difference lies in the correlations for deposition and entrainment rates, onset of annular flow and initial entrainment fraction. An assessment by the authors (Dasgupta et al., 2016) reveals that the Hewitt and Govan (Hewitt and Govan, 1990) correlation set for entrainment and deposition rates gives the best comparison against experimental data from a wide range of sources under varied operating conditions. This correlation set (eqs. 2-5) was thus used in the model developed.
D kC (2)
(3)
(4)
(5)
Here, k is the deposition coefficient, ρ, μ and σ are the density, viscosity and surface tension respectively. C is the droplet concentration (by mass) in the vapour core. Subscripts l and g represent the liquid and vapour phase respectively. Additionally a methodology was developed for predicting the initial entrained fraction (which refers to the entrained fraction at the onset of annular flow) (Dasgupta et al., 2015). This is an essential initial value for the solution of first order ODE for the film flow rate evolution. 3.2. Prediction of Tubular Dryout data The model results were compared against different database of tubular dryout data. The comparison against one such dryout database (Bennett et al., 1965) is shown in Figure 3. In this case, majority of the experimental data are seen to be predicted within ±10%. While this band of prediction can be called good, the number of data in this set is firstly too little to be called a validation exercise. Secondly, it also needs to be quantified if the band of predictions is indeed good.
Figure 3: Comparison with AERE dryout data at ~70 bar
These contentions are addressed in Figure 4. In this figure, the experimental data of Becker et al. (Becker et al., 1965) has been used. The number of experimental data in this data set is large (more than 3300) and the experiments were performed over a wide range of operating conditions (pressure 2.2 to 101 bar, mass flux of 120 to 5450 kg/m2s)
0.2 0.3 0.4 0.5 0.6 0.7 0.8 0.9 1.00.5
0.6
0.7
0.8
0.9
1.0
1.1
1.2
1.3
1.4
1.5
114.9 217.3 289.7 362.2 440.6
Experimental exit quality
q calc
q expt
length-to-diameter ratio
0.65
0.18 ; 0.3
0.083 ; 0.3
g eq
g
g g
d Ck
C C
0.316
2-525.75 x 10 ;
0 ;
l eqg lf lfc lf lfc
g
lf lfc
dE G G G G G
G G
Re exp 5.8504 0.4249lfc eq g llfc
l l g
G d
162
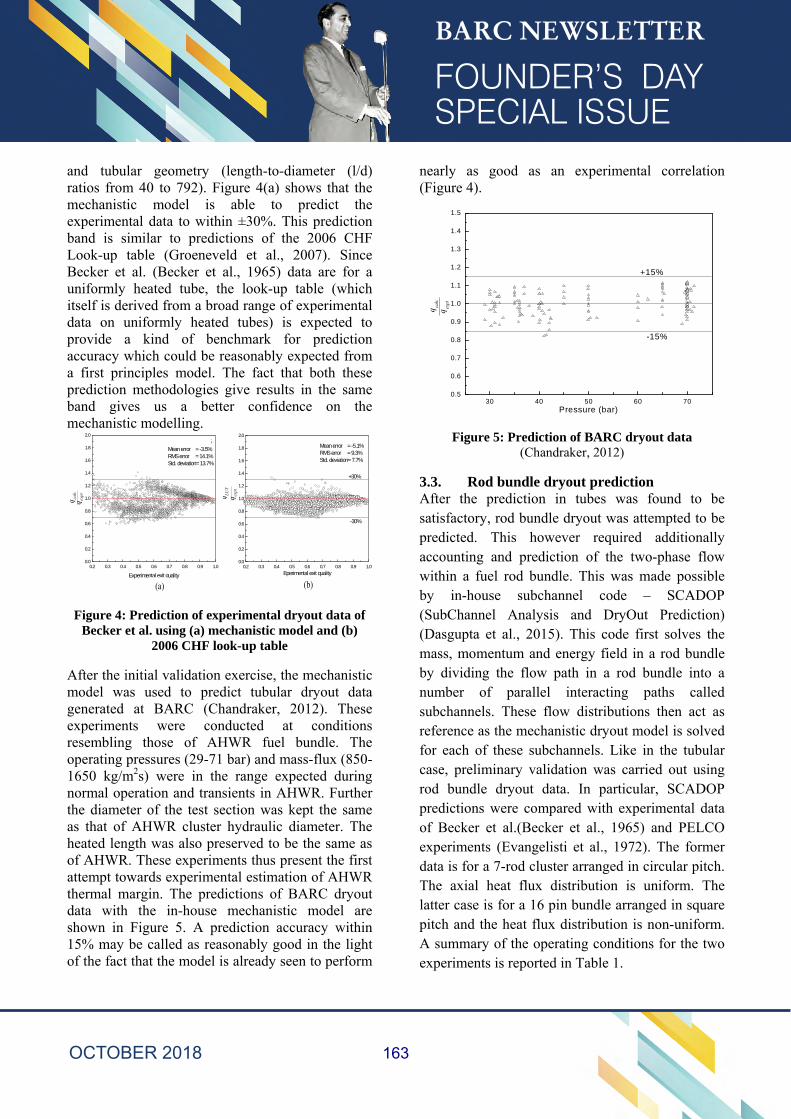
and tubular geometry (length-to-diameter (l/d) ratios from 40 to 792). Figure 4(a) shows that the mechanistic model is able to predict the experimental data to within ±30%. This prediction band is similar to predictions of the 2006 CHF Look-up table (Groeneveld et al., 2007). Since Becker et al. (Becker et al., 1965) data are for a uniformly heated tube, the look-up table (which itself is derived from a broad range of experimental data on uniformly heated tubes) is expected to provide a kind of benchmark for prediction accuracy which could be reasonably expected from a first principles model. The fact that both these prediction methodologies give results in the same band gives us a better confidence on the mechanistic modelling.
Figure 4: Prediction of experimental dryout data of Becker et al. using (a) mechanistic model and (b)
2006 CHF look-up table
After the initial validation exercise, the mechanistic model was used to predict tubular dryout data generated at BARC (Chandraker, 2012). These experiments were conducted at conditions resembling those of AHWR fuel bundle. The operating pressures (29-71 bar) and mass-flux (850-1650 kg/m2s) were in the range expected during normal operation and transients in AHWR. Further the diameter of the test section was kept the same as that of AHWR cluster hydraulic diameter. The heated length was also preserved to be the same as of AHWR. These experiments thus present the first attempt towards experimental estimation of AHWR thermal margin. The predictions of BARC dryout data with the in-house mechanistic model are shown in Figure 5. A prediction accuracy within 15% may be called as reasonably good in the light of the fact that the model is already seen to perform
nearly as good as an experimental correlation (Figure 4).
Figure 5: Prediction of BARC dryout data (Chandraker, 2012)
3.3. Rod bundle dryout prediction After the prediction in tubes was found to be satisfactory, rod bundle dryout was attempted to be predicted. This however required additionally accounting and prediction of the two-phase flow within a fuel rod bundle. This was made possible by in-house subchannel code – SCADOP (SubChannel Analysis and DryOut Prediction) (Dasgupta et al., 2015). This code first solves the mass, momentum and energy field in a rod bundle by dividing the flow path in a rod bundle into a number of parallel interacting paths called subchannels. These flow distributions then act as reference as the mechanistic dryout model is solved for each of these subchannels. Like in the tubular case, preliminary validation was carried out using rod bundle dryout data. In particular, SCADOP predictions were compared with experimental data of Becker et al.(Becker et al., 1965) and PELCO experiments (Evangelisti et al., 1972). The former data is for a 7-rod cluster arranged in circular pitch. The axial heat flux distribution is uniform. The latter case is for a 16 pin bundle arranged in square pitch and the heat flux distribution is non-uniform. A summary of the operating conditions for the two experiments is reported in Table 1.
0.2 0.3 0.4 0.5 0.6 0.7 0.8 0.9 1.00.0
0.2
0.4
0.6
0.8
1.0
1.2
1.4
1.6
1.8
2.0
q expt
q calc
Experimental exit quality
Set 5Mean error = -3.5%RMS error = 14.1%Std. deviation= 13.7%
Computed IEF
(b)0.2 0.3 0.4 0.5 0.6 0.7 0.8 0.9 1.0
0.0
0.2
0.4
0.6
0.8
1.0
1.2
1.4
1.6
1.8
2.0
Mean error = -5.1%RMS error = 9.3%Std. deviation= 7.7%
-30%
Eperimental exit quality
q expt
q LUT
+30%
(a) (b)
30 40 50 60 700.5
0.6
0.7
0.8
0.9
1.0
1.1
1.2
1.3
1.4
1.5
-15%
q expt
q calc
Pressure (bar)
+15%
163
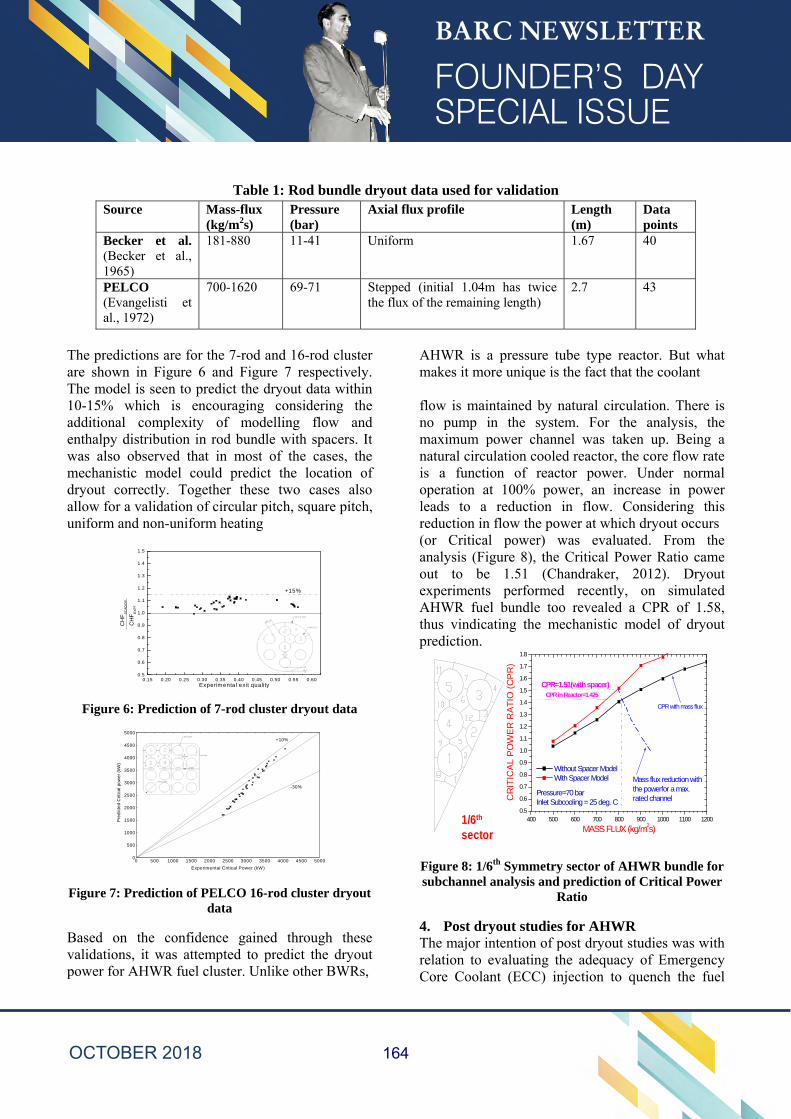
Table 1: Rod bundle dryout data used for validation
Source Mass-flux (kg/m2s)
Pressure (bar)
Axial flux profile Length (m)
Data points
Becker et al. (Becker et al., 1965)
181-880 11-41 Uniform 1.67 40
PELCO (Evangelisti et al., 1972)
700-1620 69-71 Stepped (initial 1.04m has twice the flux of the remaining length)
2.7 43
The predictions are for the 7-rod and 16-rod cluster are shown in Figure 6 and Figure 7 respectively. The model is seen to predict the dryout data within 10-15% which is encouraging considering the additional complexity of modelling flow and enthalpy distribution in rod bundle with spacers. It was also observed that in most of the cases, the mechanistic model could predict the location of dryout correctly. Together these two cases also allow for a validation of circular pitch, square pitch, uniform and non-uniform heating
Figure 6: Prediction of 7-rod cluster dryout data
Figure 7: Prediction of PELCO 16-rod cluster dryout data
Based on the confidence gained through these validations, it was attempted to predict the dryout power for AHWR fuel cluster. Unlike other BWRs,
AHWR is a pressure tube type reactor. But what makes it more unique is the fact that the coolant flow is maintained by natural circulation. There is no pump in the system. For the analysis, the maximum power channel was taken up. Being a natural circulation cooled reactor, the core flow rate is a function of reactor power. Under normal operation at 100% power, an increase in power leads to a reduction in flow. Considering this reduction in flow the power at which dryout occurs (or Critical power) was evaluated. From the analysis (Figure 8), the Critical Power Ratio came out to be 1.51 (Chandraker, 2012). Dryout experiments performed recently, on simulated AHWR fuel bundle too revealed a CPR of 1.58, thus vindicating the mechanistic model of dryout prediction.
Figure 8: 1/6th Symmetry sector of AHWR bundle for subchannel analysis and prediction of Critical Power
Ratio
4. Post dryout studies for AHWR The major intention of post dryout studies was with relation to evaluating the adequacy of Emergency Core Coolant (ECC) injection to quench the fuel
0.15 0.20 0.25 0.30 0.35 0.40 0.45 0.50 0.55 0.600.5
0.6
0.7
0.8
0.9
1.0
1.1
1.2
1.3
1.4
1.5
CH
FE
XP
T.
CH
FS
CA
DO
P
Experimental exit quality
+15%
0 500 1000 1500 2000 2500 3000 3500 4000 4500 50000
500
1000
1500
2000
2500
3000
3500
4000
4500
5000
-30%
Pre
dict
ed C
ritic
al p
ow
er
(kW
)
Experimental Critical Power (kW)
+10%
400 500 600 700 800 900 1000 1100 12000.5
0.6
0.7
0.8
0.9
1.0
1.1
1.2
1.3
1.4
1.5
1.6
1.7
1.8
Without Spacer Model With Spacer Model
CPR=1.51(with spacer) CPR in Reactor=1.425
Mass flux reduction with the powerfor a max. rated channel
CPR with mass flux
Pressure=70 barInlet Subcooling = 25 deg. CC
RIT
ICA
L P
OW
ER
RA
TIO
(C
PR
)
MASS FLUX (kg/m2s)1/6th
sector
164
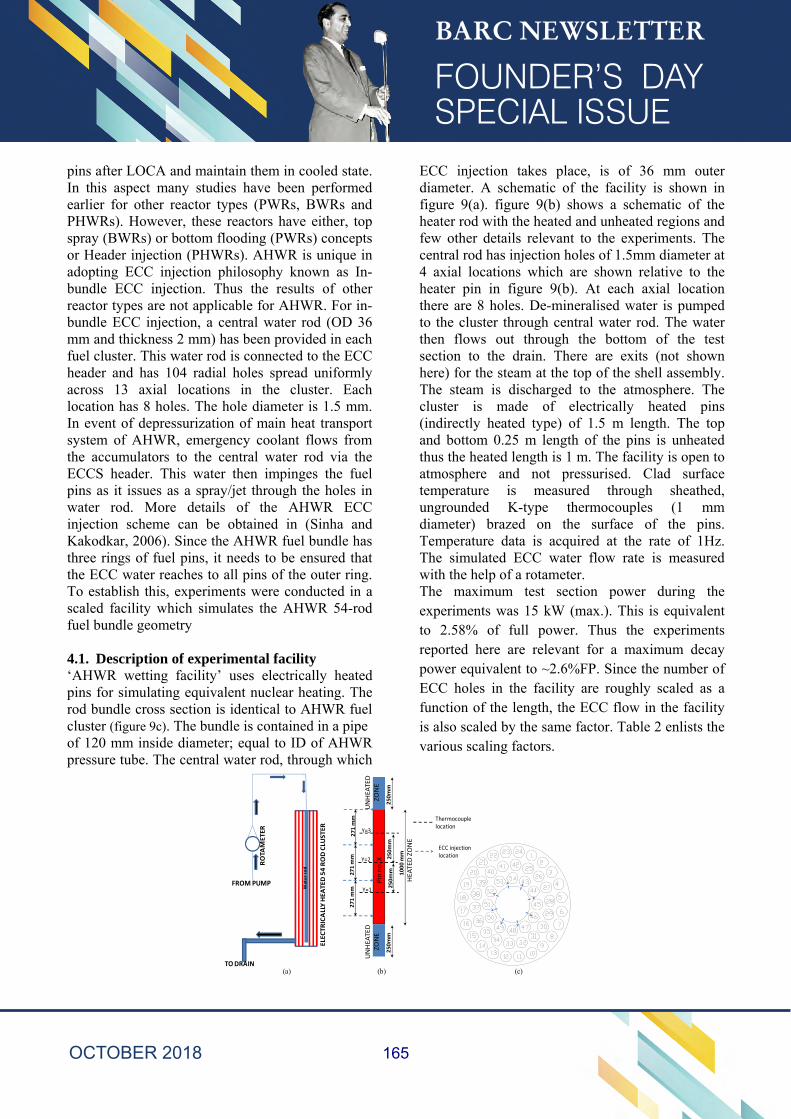
pins after LOCA and maintain them in cooled state. In this aspect many studies have been performed earlier for other reactor types (PWRs, BWRs and PHWRs). However, these reactors have either, top spray (BWRs) or bottom flooding (PWRs) concepts or Header injection (PHWRs). AHWR is unique in adopting ECC injection philosophy known as In-bundle ECC injection. Thus the results of other reactor types are not applicable for AHWR. For in-bundle ECC injection, a central water rod (OD 36 mm and thickness 2 mm) has been provided in each fuel cluster. This water rod is connected to the ECC header and has 104 radial holes spread uniformly across 13 axial locations in the cluster. Each location has 8 holes. The hole diameter is 1.5 mm. In event of depressurization of main heat transport system of AHWR, emergency coolant flows from the accumulators to the central water rod via the ECCS header. This water then impinges the fuel pins as it issues as a spray/jet through the holes in water rod. More details of the AHWR ECC injection scheme can be obtained in (Sinha and Kakodkar, 2006). Since the AHWR fuel bundle has three rings of fuel pins, it needs to be ensured that the ECC water reaches to all pins of the outer ring. To establish this, experiments were conducted in a scaled facility which simulates the AHWR 54-rod fuel bundle geometry 4.1. Description of experimental facility ‘AHWR wetting facility’ uses electrically heated pins for simulating equivalent nuclear heating. The rod bundle cross section is identical to AHWR fuel cluster (figure 9c). The bundle is contained in a pipe of 120 mm inside diameter; equal to ID of AHWR pressure tube. The central water rod, through which
ECC injection takes place, is of 36 mm outer diameter. A schematic of the facility is shown in figure 9(a). figure 9(b) shows a schematic of the heater rod with the heated and unheated regions and few other details relevant to the experiments. The central rod has injection holes of 1.5mm diameter at 4 axial locations which are shown relative to the heater pin in figure 9(b). At each axial location there are 8 holes. De-mineralised water is pumped to the cluster through central water rod. The water then flows out through the bottom of the test section to the drain. There are exits (not shown here) for the steam at the top of the shell assembly. The steam is discharged to the atmosphere. The cluster is made of electrically heated pins (indirectly heated type) of 1.5 m length. The top and bottom 0.25 m length of the pins is unheated thus the heated length is 1 m. The facility is open to atmosphere and not pressurised. Clad surface temperature is measured through sheathed, ungrounded K-type thermocouples (1 mm diameter) brazed on the surface of the pins. Temperature data is acquired at the rate of 1Hz. The simulated ECC water flow rate is measured with the help of a rotameter. The maximum test section power during the experiments was 15 kW (max.). This is equivalent to 2.58% of full power. Thus the experiments reported here are relevant for a maximum decay power equivalent to ~2.6%FP. Since the number of ECC holes in the facility are roughly scaled as a function of the length, the ECC flow in the facility is also scaled by the same factor. Table 2 enlists the various scaling factors.
ELECTRICALLY HEA
TED 54 ROD CLU
STER
FROM PUMP
TO DRAIN
ROTA
METER
Water rod
Y=3
Y=2
Y=1
250mm
250mm
Pin no
. X
1000 mm
271 mm
271 mm
271 mm
Thermocouple location
ECC injection location
(a) (b)
250mm
250mm
HEATED ZONE
UNHEATED
ZONE
UNHEATED
ZONE
(c)
165
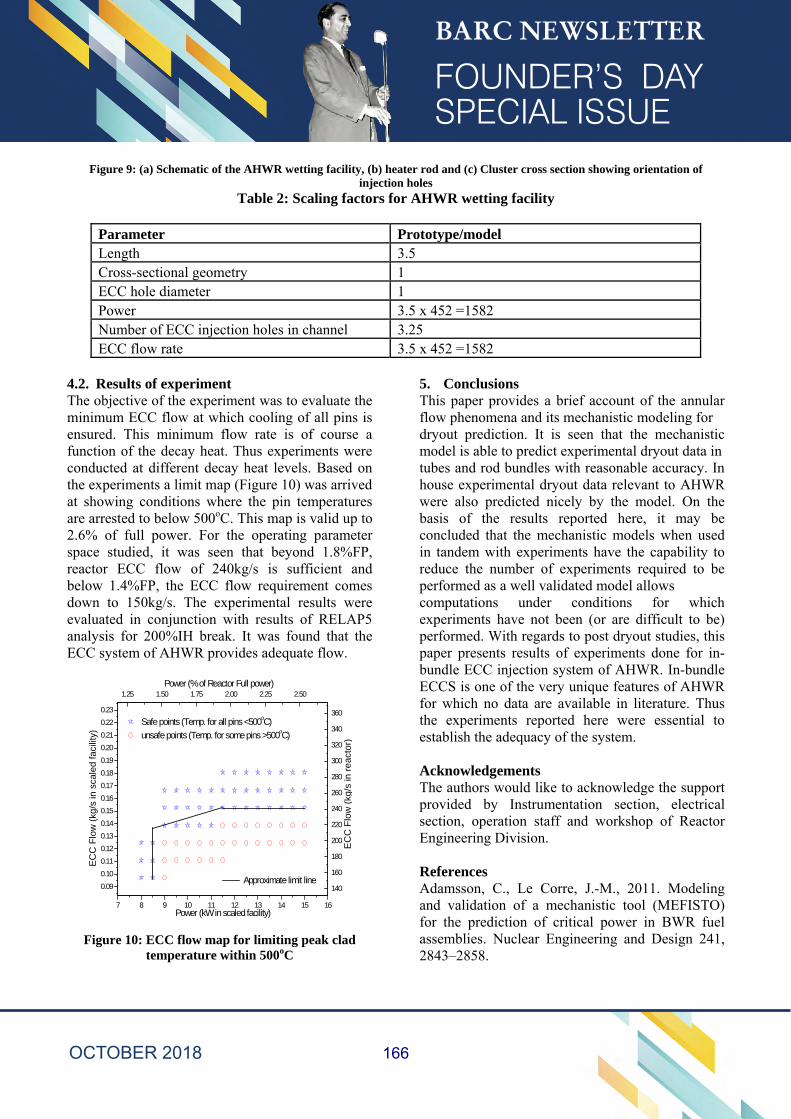
Figure 9: (a) Schematic of the AHWR wetting facility, (b) heater rod and (c) Cluster cross section showing orientation of injection holes
Table 2: Scaling factors for AHWR wetting facility
Parameter Prototype/model Length 3.5 Cross-sectional geometry 1 ECC hole diameter 1 Power 3.5 x 452 =1582 Number of ECC injection holes in channel 3.25 ECC flow rate 3.5 x 452 =1582
4.2. Results of experiment The objective of the experiment was to evaluate the minimum ECC flow at which cooling of all pins is ensured. This minimum flow rate is of course a function of the decay heat. Thus experiments were conducted at different decay heat levels. Based on the experiments a limit map (Figure 10) was arrived at showing conditions where the pin temperatures are arrested to below 500oC. This map is valid up to 2.6% of full power. For the operating parameter space studied, it was seen that beyond 1.8%FP, reactor ECC flow of 240kg/s is sufficient and below 1.4%FP, the ECC flow requirement comes down to 150kg/s. The experimental results were evaluated in conjunction with results of RELAP5 analysis for 200%IH break. It was found that the ECC system of AHWR provides adequate flow.
Figure 10: ECC flow map for limiting peak clad temperature within 500oC
5. Conclusions This paper provides a brief account of the annular flow phenomena and its mechanistic modeling for dryout prediction. It is seen that the mechanistic model is able to predict experimental dryout data in tubes and rod bundles with reasonable accuracy. In house experimental dryout data relevant to AHWR were also predicted nicely by the model. On the basis of the results reported here, it may be concluded that the mechanistic models when used in tandem with experiments have the capability to reduce the number of experiments required to be performed as a well validated model allows computations under conditions for which experiments have not been (or are difficult to be) performed. With regards to post dryout studies, this paper presents results of experiments done for in-bundle ECC injection system of AHWR. In-bundle ECCS is one of the very unique features of AHWR for which no data are available in literature. Thus the experiments reported here were essential to establish the adequacy of the system. Acknowledgements The authors would like to acknowledge the support provided by Instrumentation section, electrical section, operation staff and workshop of Reactor Engineering Division. References Adamsson, C., Le Corre, J.-M., 2011. Modeling and validation of a mechanistic tool (MEFISTO) for the prediction of critical power in BWR fuel assemblies. Nuclear Engineering and Design 241, 2843–2858.
7 8 9 10 11 12 13 14 15 16
0.09
0.10
0.11
0.12
0.13
0.14
0.15
0.16
0.17
0.18
0.19
0.20
0.21
0.22
0.23
Safe points (Temp. for all pins <500oC)
unsafe points (Temp. for some pins >500oC)
Power (% of Reactor Full power)
EC
C F
low
(kg
/s in
re
acto
r)
EC
C F
low
(kg
/s in
sca
led
faci
lity)
Power (kW in scaled facility)
Approximate limit line
1.25 1.50 1.75 2.00 2.25 2.50
140
160
180
200
220
240
260
280
300
320
340
360
166
Becker, K.M., Hernborg, G., Bode, M., Eriksson, O., 1965. Burnout data for flow of boiling water in vertical round ducts, Annuli and Rod Clusters, AE-177. Atomenergi, Stockholm, Sweden. Bennett, A.W., Hewitt, G.F., Kearsey, H.A., Keeys, R.K.F., 1965. Measurements of burnout heat flux in uniformly heated round tubes at 1000 psia. AERE-R-5055. Harwell, UK. Chandraker, D.K., 2012. Study on critical power for Advanced Heavy Water Reactor. Ph.D. Thesis, Tokyo Institute of Technology, Tokyo. Dasgupta, A., Chandraker, D.K., Vijayan, P.K., 2015. SCADOP: Phenomenological modeling of dryout in nuclear fuel rod bundles. Nuclear Engineering and Design 293, 127–137. Dasgupta, A., Chandraker, D.K., Walker, S.P., Vijayan, P.K., 2016. An assessment of the correlations for entrainment and deposition rates in annular flow for dryout prediction. Multiphase Science and Technology 28, 99–133. Evangelisti, R., Gaspari, G.., Rubiera, L., Vanoli, G., 1972. Heat transfer crisis data with steam-water mixture in a sixteen rod bundle. International Journal of Heat and Mass Transfer 15, 387–402. doi:10.1016/0017-9310(72)90205-0 Groeneveld, D.C., Shan, J.Q., Vasić, A.Z., Leung, L.K.H., Durmayaz, A., Yang, J., Cheng, S.C., Tanase, A., 2007. The 2006 CHF look-up table. Nuclear Engineering and Design 237, 1909–1922. doi:10.1016/j.nucengdes.2007.02.014 Hewitt, G.F., Govan, A.H., 1990. Phenomenological modelling of non-equilibrium flows with phase change. International Journal of Heat and Mass Transfer 33, 229–242. doi:10.1016/0017-9310(90)90094-B Kalinin, E.K., Berlin, I.I., Kostiouk, V.V., 1975. Film boiling heat transfer. Advances in heat transfer 11, 51–197. Naitoh, M., Ikeda, T., Nishida, K., Okawa, T., Kataoka, I., 2002. Critical power analysis with
mechanistic models for nuclear fuel bundles, (I) models and verifications for boiling water reactor application. Journal of Nuclear Science and Technology39,40–52. doi:10.1080/18811248.2002.9715155 Nukiyama, S., 1965. Maximum and minimum values of heat q transmitted from metal to boiling water under atmospheric pressure. International Journal of Heat and Mass Transfer 9, 1419–1433. Okawa, T., Kotani, A., Kataoka, I., Naito, M., Naitoh, M., 2003. Prediction of critical heat flux in annular flow using a film flow model. Journal of Nuclear Science and Technology 40, 388–396. doi:10.1080/18811248.2003.9715370 Sinha, R.K., Kakodkar, A., 2006. Design and development of the AHWR-the Indian thorium fuelled innovative nuclear reactor. Nuclear Engineering and Design 236, 683–700. doi:10.1016/j.nucengdes.2005.09.026 Sugawara, S., Miyamoto, Y., 1990. FIDAS: Detailed subchannel analysis code based on three-fluid and three-field model. Nuclear Engineering and Design 120, 147–161. Talebi, S., Kazeminejad, H., 2012. A mathematical approach to predict dryout in a rod bundle. Nuclear Engineering and Design 249, 348–356. Tomiyama, A., Yokomizo, O., Yoshimoto, Y., Sugawara, S., 1988. Method of critical power prediction based on film flow model coupled with subchannel analysis. Journal of Nuclear Science and Technology 25, 914–928. doi:10.1080/18811248.1988.9735949 Whalley, P.B., Hutchinson, P., Hewitt, G.F., 1973. The calculation of critical heat flux in forced convective boiling, AERE-R 7520. Wurtz, J., 1978. An Experimental and Theoretical Investigation of Upward Two-Phase Flow in Annuli, Riso. doi:10.2118/79512-PA Zuber, N., 1958. On stability of boiling heat transfer. Transactions of ASME 80.
167
Development of Advanced Alkaline Water Electrolyzer Cell Module for on-demand, on-site
Hydrogen and Oxygen Production
*Sandeep K C, Sachin Kamath, S K Bhattacharya, Kalyan Bhanja, Sadhana Mohan Heavy Water Division
Sandeep K.C. is the recipient of the DAE Young Engineer
Award for the year 2016
Abstract The major challenge in the development of low temperature water electrolyzer technology is focused on the reduction in energy consumption and cost of hydrogen production. Heavy Water Division, BARC is involved in the development of highly efficient compact advanced alkaline water electrolyzers for hydrogen and oxygen production using porous nickel electrodes with a capacity varying from 4 Nlph to 10 Nm3/hr of hydrogen. The overall efficiency of the developed cell module is found to be at par with the international standards. The developmental effort has resulted in the capability and competence to scale up the cell module design for larger industrial capacity. Subsequently, the technology has been transferred to industry for commercialization. Introduction Low temperature alkaline water electrolysis is the simplest hydrogen production process splitting water into hydrogen and oxygen at its maximum purity in a single step. The major thrust on the technology development for electrolyzer is focused on the reduction in energy consumption and cost of hydrogen production. The main parameters, which decide the performance of electrolyzers, are the operating current density and cell voltage at a given temperature. In the existing commercial alkaline water electrolyzers globally, the maximum current density is limited to 2000 Ampere per square meter with a cell voltage of 1.75 V to 1.9 V and the operating temperature varies from 70oC to 82oC [1]. In general, higher the current density for a given production capacity of hydrogen, the cell module size required is smaller, which can eventually lead to reduction in the initial investment cost. The cell voltage at a given current density determines the energy efficiency of the electrolyzers and energy consumption for hydrogen production. Hence, all the efforts were focused to maximize the current density at the lowest possible cell voltage close to thermo-neutral voltage of 1.48 V at 25oC.
Alkaline Water Electrolyzer technology development The development of porous nickel electrode was the central and important innovation in the entire electrolyzer program at Heavy Water Division, BARC. Nickel was selected as the electrode material, as it was a cost effective option with favorable reaction kinetics and appreciable corrosion resistance in alkaline medium. These porous nickel electrodes provide high internal surface area for the electrochemical reaction in comparison to planar electrodes, resulting in high hydrogen production rate per unit volume of the electrolyzer. These electrodes were made by coating the slurry of carbonyl nickel powder on nickel wire mesh. The green plaques were sintered in hydrogen furnace at high temperature. The sintered electrodes were made into circular geometry up to the desired dimensions and fixed on the electrode rings. Further, the electrodes were joined to electrode rings through electron beam welding. The SEM photograph of porous nickel electrode is given in Fig.1.
168
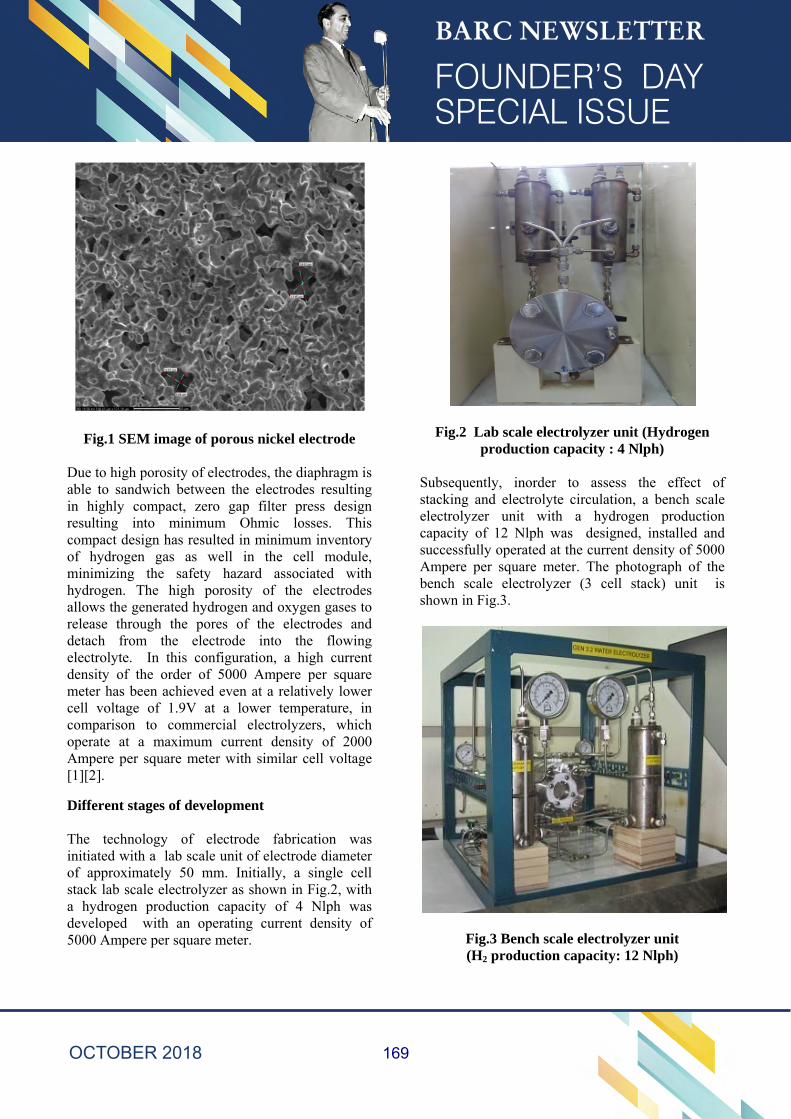
Fig.1 SEM image of porous nickel electrode
Due to high porosity of electrodes, the diaphragm is able to sandwich between the electrodes resulting in highly compact, zero gap filter press design resulting into minimum Ohmic losses. This compact design has resulted in minimum inventory of hydrogen gas as well in the cell module, minimizing the safety hazard associated with hydrogen. The high porosity of the electrodes allows the generated hydrogen and oxygen gases to release through the pores of the electrodes and detach from the electrode into the flowing electrolyte. In this configuration, a high current density of the order of 5000 Ampere per square meter has been achieved even at a relatively lower cell voltage of 1.9V at a lower temperature, in comparison to commercial electrolyzers, which operate at a maximum current density of 2000 Ampere per square meter with similar cell voltage [1][2].
Different stages of development The technology of electrode fabrication was initiated with a lab scale unit of electrode diameter of approximately 50 mm. Initially, a single cell stack lab scale electrolyzer as shown in Fig.2, with a hydrogen production capacity of 4 Nlph was developed with an operating current density of 5000 Ampere per square meter.
Fig.2 Lab scale electrolyzer unit (Hydrogen production capacity : 4 Nlph)
Subsequently, inorder to assess the effect of stacking and electrolyte circulation, a bench scale electrolyzer unit with a hydrogen production capacity of 12 Nlph was designed, installed and successfully operated at the current density of 5000 Ampere per square meter. The photograph of the bench scale electrolyzer (3 cell stack) unit is shown in Fig.3.
Fig.3 Bench scale electrolyzer unit (H2 production capacity: 12 Nlph)
169
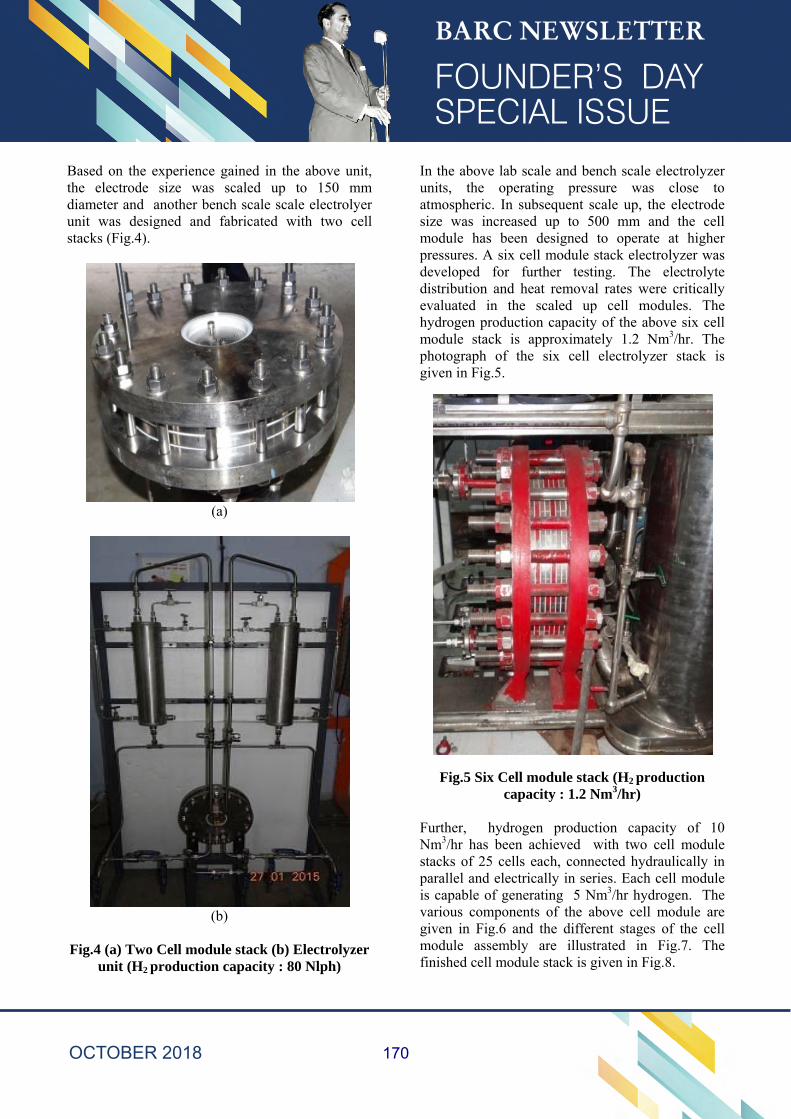
Based on the experience gained in the above unit, the electrode size was scaled up to 150 mm diameter and another bench scale scale electrolyer unit was designed and fabricated with two cell stacks (Fig.4).
(a)
(b)
Fig.4 (a) Two Cell module stack (b) Electrolyzer
unit (H2 production capacity : 80 Nlph)
In the above lab scale and bench scale electrolyzer units, the operating pressure was close to atmospheric. In subsequent scale up, the electrode size was increased up to 500 mm and the cell module has been designed to operate at higher pressures. A six cell module stack electrolyzer was developed for further testing. The electrolyte distribution and heat removal rates were critically evaluated in the scaled up cell modules. The hydrogen production capacity of the above six cell module stack is approximately 1.2 Nm3/hr. The photograph of the six cell electrolyzer stack is given in Fig.5.
Fig.5 Six Cell module stack (H2 production capacity : 1.2 Nm3/hr)
Further, hydrogen production capacity of 10 Nm3/hr has been achieved with two cell module stacks of 25 cells each, connected hydraulically in parallel and electrically in series. Each cell module is capable of generating 5 Nm3/hr hydrogen. The various components of the above cell module are given in Fig.6 and the different stages of the cell module assembly are illustrated in Fig.7. The finished cell module stack is given in Fig.8.
170
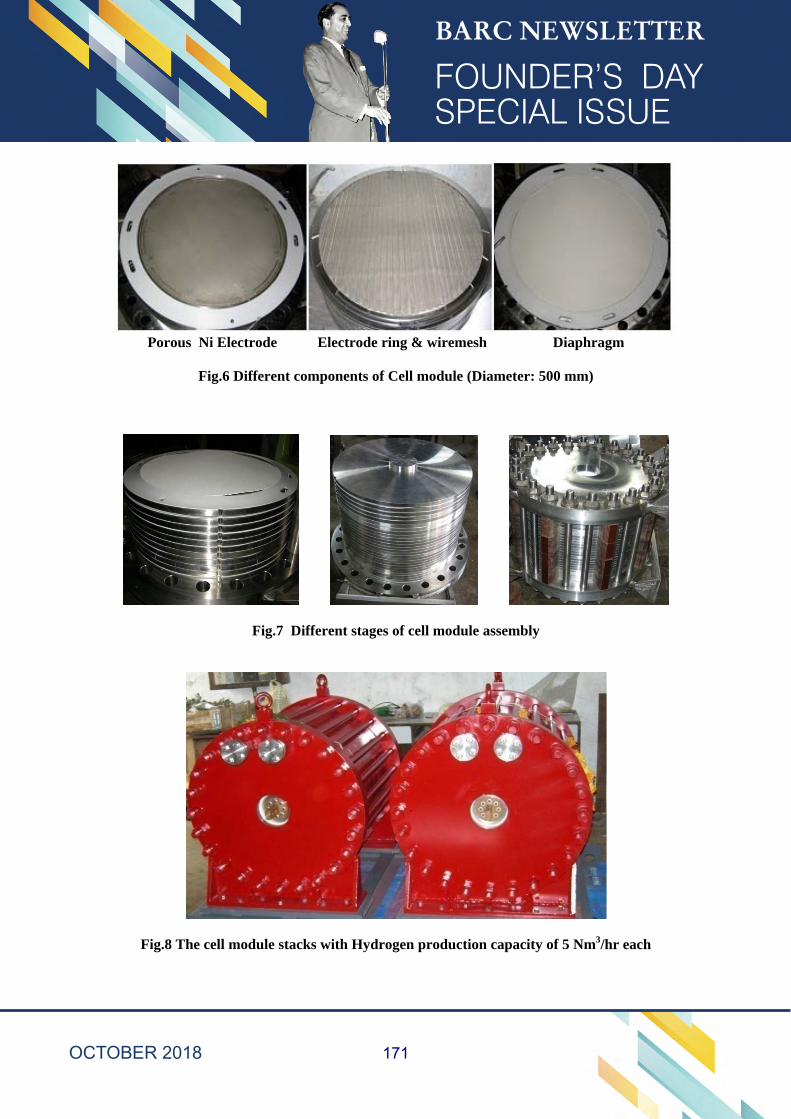
Porous Ni Electrode Electrode ring & wiremesh Diaphragm
Fig.6 Different components of Cell module (Diameter: 500 mm)
Fig.7 Different stages of cell module assembly
Fig.8 The cell module stacks with Hydrogen production capacity of 5 Nm3/hr each
171
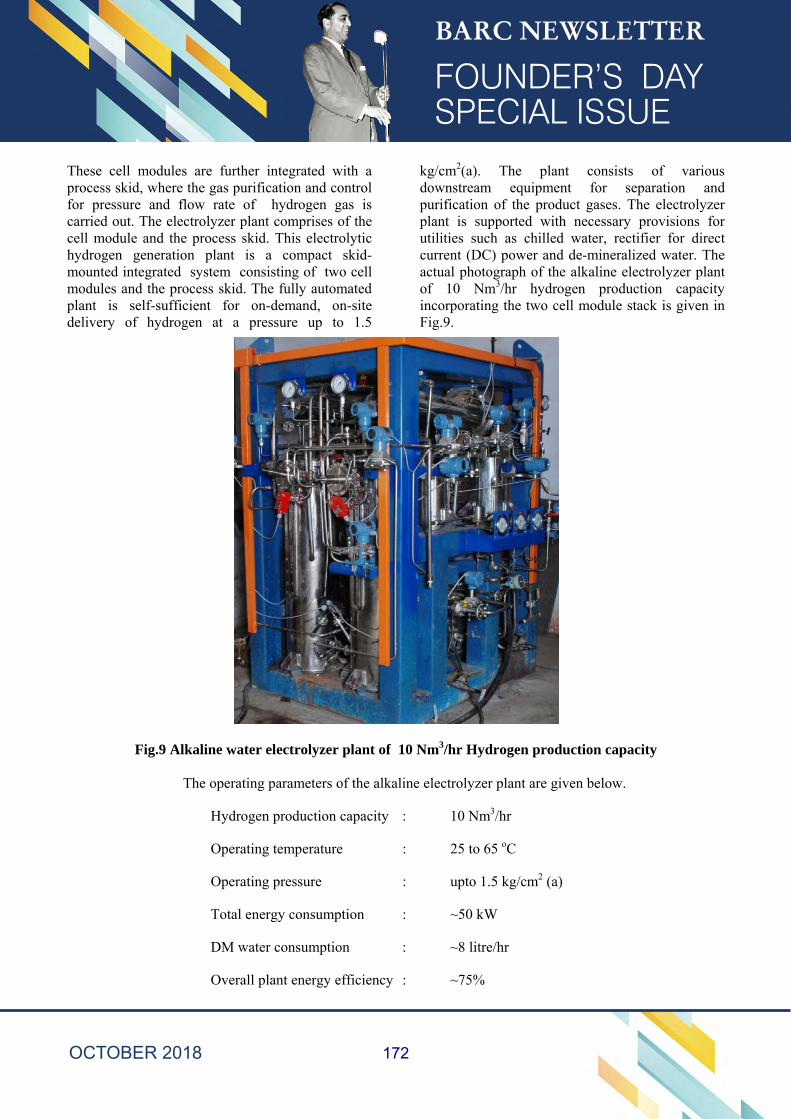
These cell modules are further integrated with a process skid, where the gas purification and control for pressure and flow rate of hydrogen gas is carried out. The electrolyzer plant comprises of the cell module and the process skid. This electrolytic hydrogen generation plant is a compact skid-mounted integrated system consisting of two cell modules and the process skid. The fully automated plant is self-sufficient for on-demand, on-site delivery of hydrogen at a pressure up to 1.5
kg/cm2(a). The plant consists of various downstream equipment for separation and purification of the product gases. The electrolyzer plant is supported with necessary provisions for utilities such as chilled water, rectifier for direct current (DC) power and de-mineralized water. The actual photograph of the alkaline electrolyzer plant of 10 Nm3/hr hydrogen production capacity incorporating the two cell module stack is given in Fig.9.
Fig.9 Alkaline water electrolyzer plant of 10 Nm3/hr Hydrogen production capacity
The operating parameters of the alkaline electrolyzer plant are given below.
Hydrogen production capacity : 10 Nm3/hr
Operating temperature : 25 to 65 oC
Operating pressure : upto 1.5 kg/cm2 (a)
Total energy consumption : ~50 kW
DM water consumption : ~8 litre/hr
Overall plant energy efficiency : ~75%
172
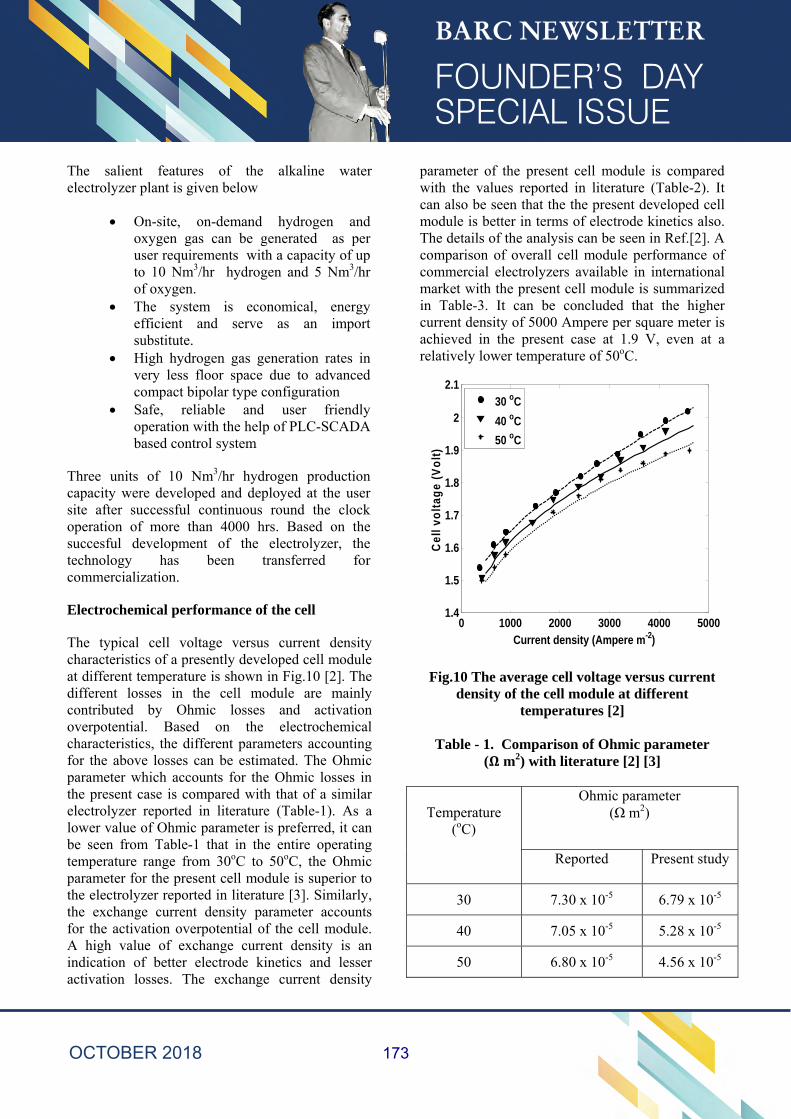
The salient features of the alkaline water electrolyzer plant is given below
On-site, on-demand hydrogen and oxygen gas can be generated as per user requirements with a capacity of up to 10 Nm3/hr hydrogen and 5 Nm3/hr of oxygen.
The system is economical, energy efficient and serve as an import substitute.
High hydrogen gas generation rates in very less floor space due to advanced compact bipolar type configuration
Safe, reliable and user friendly operation with the help of PLC-SCADA based control system
Three units of 10 Nm3/hr hydrogen production capacity were developed and deployed at the user site after successful continuous round the clock operation of more than 4000 hrs. Based on the succesful development of the electrolyzer, the technology has been transferred for commercialization.
Electrochemical performance of the cell
The typical cell voltage versus current density characteristics of a presently developed cell module at different temperature is shown in Fig.10 [2]. The different losses in the cell module are mainly contributed by Ohmic losses and activation overpotential. Based on the electrochemical characteristics, the different parameters accounting for the above losses can be estimated. The Ohmic parameter which accounts for the Ohmic losses in the present case is compared with that of a similar electrolyzer reported in literature (Table-1). As a lower value of Ohmic parameter is preferred, it can be seen from Table-1 that in the entire operating temperature range from 30oC to 50oC, the Ohmic parameter for the present cell module is superior to the electrolyzer reported in literature [3]. Similarly, the exchange current density parameter accounts for the activation overpotential of the cell module. A high value of exchange current density is an indication of better electrode kinetics and lesser activation losses. The exchange current density
parameter of the present cell module is compared with the values reported in literature (Table-2). It can also be seen that the the present developed cell module is better in terms of electrode kinetics also. The details of the analysis can be seen in Ref.[2]. A comparison of overall cell module performance of commercial electrolyzers available in international market with the present cell module is summarized in Table-3. It can be concluded that the higher current density of 5000 Ampere per square meter is achieved in the present case at 1.9 V, even at a relatively lower temperature of 50oC.
Fig.10 The average cell voltage versus current
density of the cell module at different temperatures [2]
Table - 1. Comparison of Ohmic parameter
( m2) with literature [2] [3]
Temperature
(oC)
Ohmic parameter (Ω m2)
Reported
Present study
30 7.30 x 10⁻⁵ 6.79 x 10⁻⁵
40 7.05 x 10⁻⁵ 5.28 x 10⁻⁵
50 6.80 x 10⁻⁵ 4.56 x 10⁻⁵
0 1000 2000 3000 4000 50001.4
1.5
1.6
1.7
1.8
1.9
2
2.1
Current density (Ampere m-2)
Cel
l vo
ltag
e (V
olt
)
30 oC
40 oC
50 oC
173
Table - 2. Comparison of lumped exchange current density parameter (Ampere m-2) with literature [2]-[4]
Temperature (oC) ++
j (Ampere m-2)
* Reported for Ni
at 30% KOH Present study
30 6.2585 12.0185 50 17.6481 43.7869
* Estimated based on the separate polarization data for anode and cathode ++ Cathode parameters are reported in literature at 28oC and 52oC
Table - 3. Global comparsion of different electrolyzers with the cell module developed
at HWD, BARC [1]
Parameter De Nora SAP
Norsk Hydro Electrolyzer Corp
Teledyne Energy Systems
HWD, BARC
Temperature (oC) 80 80 70 82 50
Current density (Ampere m-2)
1500 1750 1340 2000 5000
Cell voltage (V) 1.85 1.75 1.9 1.9 1.9
Applications The alkaline water electrolyzer plant can be used as a high puirity on-demand, on-site generator for hydrogen and oxygen derived from non-carbonaceous sources which can find applications in areas such as:
Generator cooling in power plants Chemical industries such as metallurgical, pharmaceuticals, biotechnolgy, telecom and fuel cell industry Several uses in laboratory for analysis, reduction, oxidation and other reactions Reliable oxygen supply in hospitals, emergency shelters, etc Conclusion Porous nickel electrodes were developed in Heavy
Water Division, BARC as a part of developement of advanced alkaline water electrolyzers for hydrogen and oxygen production. The various stages of development includes different units starting from 4 Nlph to 10 Nm3/hr hydrogen production capacity. The electrochemical performance of the plant has been compared with the data existing in literature and the present cell module is found to be superior. Three plants of 10 Nm3/hr hydrogen production capacity were operated in round the clock basis for more than 4000 hrs and deployed at the user site. Further, the technology has been transferred for commercialization. The developmental effort has resulted in the capability and competence to scale up the cell module design for larger industrial capacity. Major applications of this plant includes various industry sectors such as automobile fuels, power generation and different chemical industries.
174
Acknowledgement
The authors would like to acknowledge the support recieved from different groups of Heavy Water Division, BARC such as Plant operation, Analytical Services, Electrical & Intrumentation and Mechanical Maintenance, for the successful implementation of the above project.
References
1. K. Zeng, D. Zhang, Recent progress in alkaline water electrolysis for hydrogen production and applications, Prog. Energy Combust. Sci. 36 (2010) 307–326. doi:10.1016/j.pecs.2009.11.002. 2. K.C. Sandeep, Sachin Kamath, Krunal Mistry, Ashok Kumar M, S K Bhattacharya, K. Bhanja, S. Mohan, Experimental studies and modeling of advanced alkaline water electrolyser with porous nickel electrodes for hydrogen production, Int. J. Hydrogen Energy. 42 (2017) 12094-12103
3. I. Ulleberg, Modeling of advanced alkaline electrolyzers: a system simulation approach, Int. J. Hydrogen Energy. 28 (2003) 21–33. www.elsevier.com/locate/ijhydene (accessed July 25, 2016). 4. M.F. Kibria, A.H. Khan, Electrochemical studies of a nickel electrode for the hydrogen evolution reaction, Int. J. Hydrogen Energy. 20 (1995) 435–440.
5. M.F. Kibria, Electrochemical studies of the nickel electrode for the oxygen evolution reaction, Int. J. Hydrogen Energy. 21 (1996).
.
175
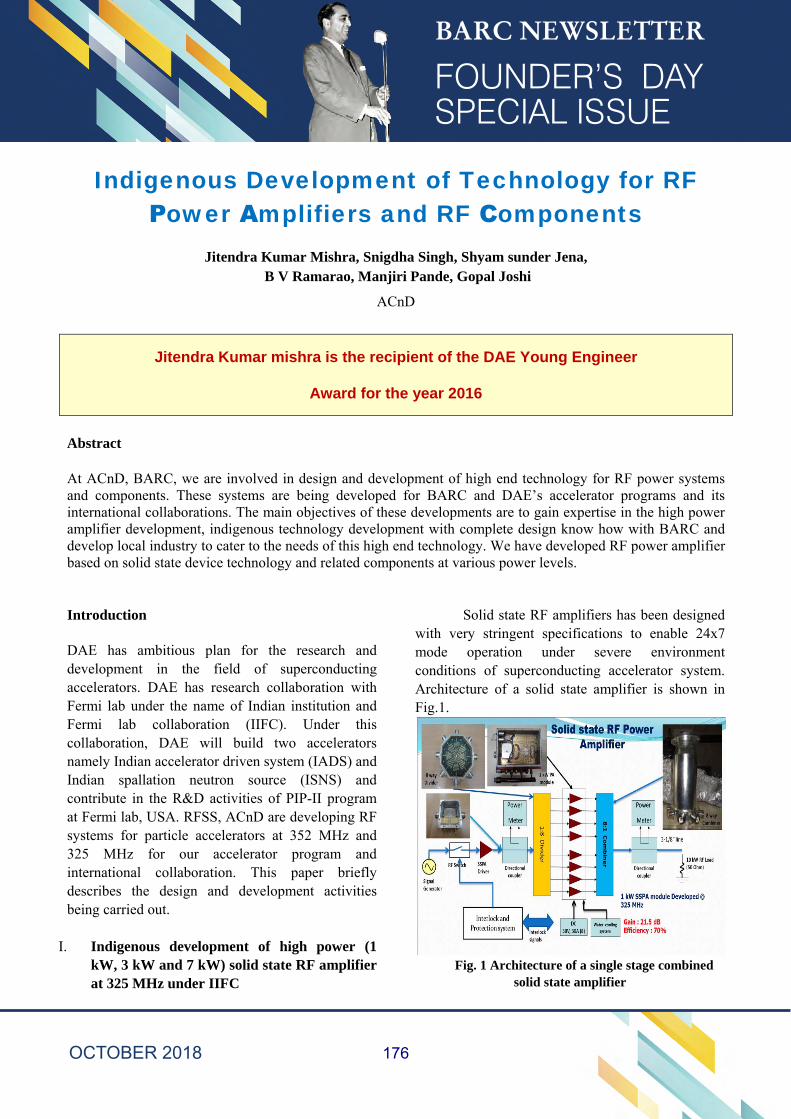
Indigenous Development of Technology for RF Power Amplifiers and RF Components
Jitendra Kumar Mishra, Snigdha Singh, Shyam sunder Jena, B V Ramarao, Manjiri Pande, Gopal Joshi
ACnD
Jitendra Kumar mishra is the recipient of the DAE Young Engineer
Award for the year 2016
Abstract
At ACnD, BARC, we are involved in design and development of high end technology for RF power systems and components. These systems are being developed for BARC and DAE’s accelerator programs and its international collaborations. The main objectives of these developments are to gain expertise in the high power amplifier development, indigenous technology development with complete design know how with BARC and develop local industry to cater to the needs of this high end technology. We have developed RF power amplifier based on solid state device technology and related components at various power levels.
Introduction
DAE has ambitious plan for the research and development in the field of superconducting accelerators. DAE has research collaboration with Fermi lab under the name of Indian institution and Fermi lab collaboration (IIFC). Under this collaboration, DAE will build two accelerators namely Indian accelerator driven system (IADS) and Indian spallation neutron source (ISNS) and contribute in the R&D activities of PIP-II program at Fermi lab, USA. RFSS, ACnD are developing RF systems for particle accelerators at 352 MHz and 325 MHz for our accelerator program and international collaboration. This paper briefly describes the design and development activities being carried out.
I. Indigenous development of high power (1kW, 3 kW and 7 kW) solid state RF amplifierat 325 MHz under IIFC
Solid state RF amplifiers has been designed with very stringent specifications to enable 24x7 mode operation under severe environment conditions of superconducting accelerator system. Architecture of a solid state amplifier is shown in Fig.1.
Fig. 1 Architecture of a single stage combined solid state amplifier
176
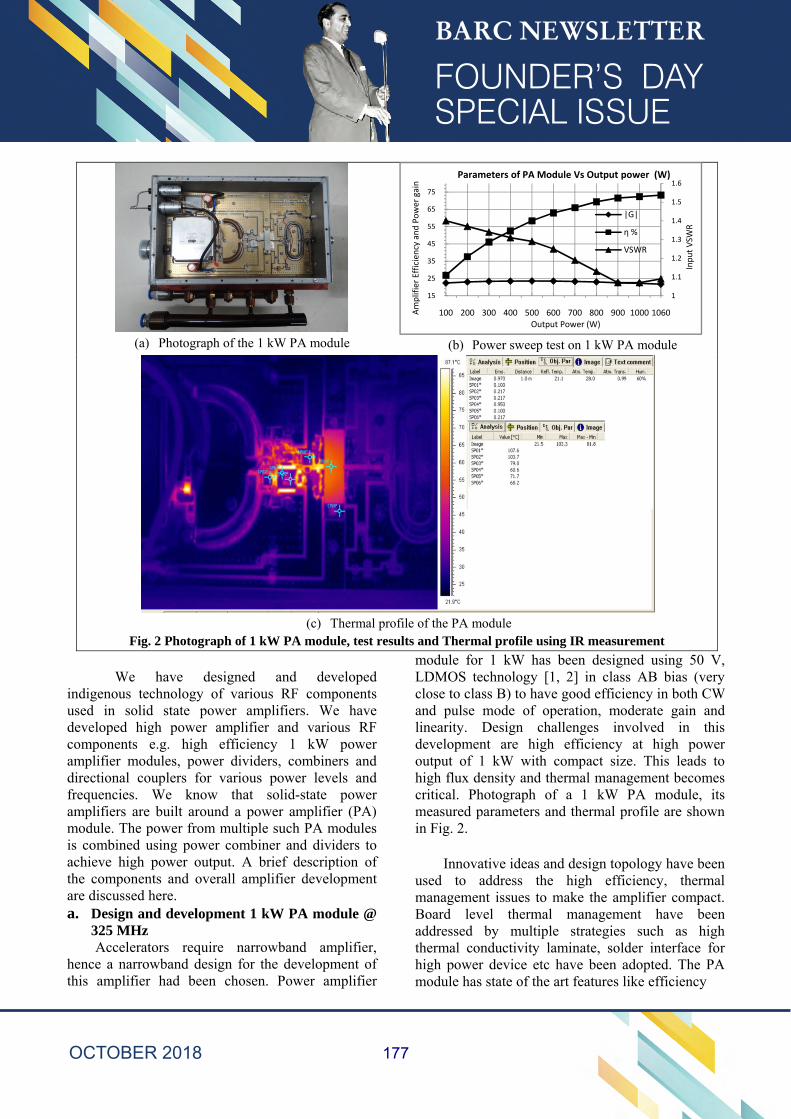
(a) Photograph of the 1 kW PA module (b) Power sweep test on 1 kW PA module
(c) Thermal profile of the PA moduleFig. 2 Photograph of 1 kW PA module, test results and Thermal profile using IR measurement
We have designed and developed indigenous technology of various RF components used in solid state power amplifiers. We have developed high power amplifier and various RF components e.g. high efficiency 1 kW power amplifier modules, power dividers, combiners and directional couplers for various power levels and frequencies. We know that solid-state power amplifiers are built around a power amplifier (PA) module. The power from multiple such PA modules is combined using power combiner and dividers to achieve high power output. A brief description of the components and overall amplifier development are discussed here. a. Design and development 1 kW PA module @
325 MHzAccelerators require narrowband amplifier,
hence a narrowband design for the development of this amplifier had been chosen. Power amplifier
module for 1 kW has been designed using 50 V, LDMOS technology [1, 2] in class AB bias (very close to class B) to have good efficiency in both CW and pulse mode of operation, moderate gain and linearity. Design challenges involved in this development are high efficiency at high power output of 1 kW with compact size. This leads to high flux density and thermal management becomes critical. Photograph of a 1 kW PA module, its measured parameters and thermal profile are shown in Fig. 2.
Innovative ideas and design topology have been used to address the high efficiency, thermal management issues to make the amplifier compact. Board level thermal management have been addressed by multiple strategies such as high thermal conductivity laminate, solder interface for high power device etc have been adopted. The PA module has state of the art features like efficiency
1
1.1
1.2
1.3
1.4
1.5
1.6
15
25
35
45
55
65
75
100 200 300 400 500 600 700 800 900 1000 1060
Parameters of PA Module Vs Output power (W)
|G|
η %
VSWR
Input VSW
R
Output Power (W)
AmplifierEfficien
cy and Power gain
177
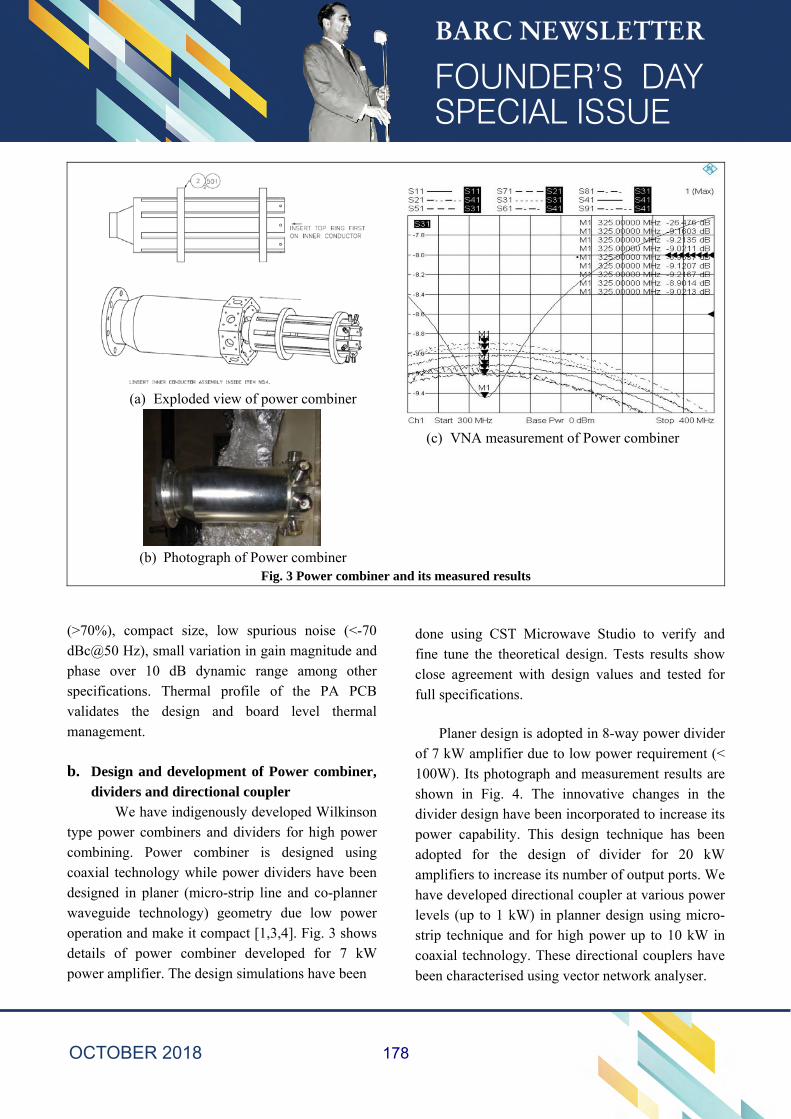
(a) Exploded view of power combiner
(b) Photograph of Power combiner
(c) VNA measurement of Power combiner
Fig. 3 Power combiner and its measured results
(>70%), compact size, low spurious noise (<-70 dBc@50 Hz), small variation in gain magnitude and phase over 10 dB dynamic range among other specifications. Thermal profile of the PA PCB validates the design and board level thermal
management.
b. Design and development of Power combiner, dividers and directional coupler
We have indigenously developed Wilkinson type power combiners and dividers for high power combining. Power combiner is designed using coaxial technology while power dividers have been designed in planer (micro-strip line and co-planner waveguide technology) geometry due low power operation and make it compact [1,3,4]. Fig. 3 shows details of power combiner developed for 7 kW
power amplifier. The design simulations have been
done using CST Microwave Studio to verify and fine tune the theoretical design. Tests results show close agreement with design values and tested for
full specifications.
Planer design is adopted in 8-way power divider of 7 kW amplifier due to low power requirement (< 100W). Its photograph and measurement results are shown in Fig. 4. The innovative changes in the divider design have been incorporated to increase its power capability. This design technique has been adopted for the design of divider for 20 kW amplifiers to increase its number of output ports. We have developed directional coupler at various power levels (up to 1 kW) in planner design using micro-strip technique and for high power up to 10 kW in coaxial technology. These directional couplers have
been characterised using vector network analyser.
178
Fig. 4 Power divider, its VNA characterisation and micro-strip directional couplers
c. Design and development of 3 kW and 7 kW
@ 325 MHz We have indigenously developed 3 kW
amplifier using 4 nos. of 1 kW PA modules [5,6]. Some of the qualification tests (e.g. endurance test
of >200 Hrs, spurious noise, gain and phase variation over 10 dB dynamic range etc.) on 3 kW RF amplifier as carried out at Fermi lab USA are shown in Fig. 5. Amplifier has also passed endurance test for 210 hrs at 3.2 kW operations
Fig. 5: Tests performed at Fermi lab, USA on 3 kW RF amplifier
179
(a) 7 kW power amplifier
(b) Test results for 7 kW power amplifier
Fig. 6 Photograph of 7 kW power amplifiers and some important test results
Power amplifier rack for 7 kW and some of the test results are shown in Fig. 6 with details of the work reported in [1,4]. It has been designed for operating power of 7 kW at 325 MHz and has been tested up to saturated power of 8 kW with DC to RF efficiency of 68.4% among other specifications. Technology developed for 7 kW RF power amplifier under DAE’s international collaboration is under
series production at ECIL, Hyderabad for accelerator program. Detailed documentation required during production of this amplifier (e.g. ATP, QAP, BOM, detailed drawings of all its sub-systems among others) has also been prepared. All the important components in the power amplifier have been design and their fabrication is carried out in local industry.
d. Development of 10 kW, 352 MHz power amplifier for MEBT buncher cavity of LEHIPA
RF amplifier for buncher uses two stages of power combining. It has 2 nos. of 8 way power combiner and divider, 16 nos. of 800 W PA modules, one set of 2-way power divider and combiner among other components as reported in [7]. The PA module for this design has been derived by modifying the 1 kW PA module designed at 325 MHz and tuning its matching network for 352 MHz operation. This amplifier is installed in the Klystron gallery at common facility building (CFB). It has been thoroughly tested in CW and pulse mode at various duty factors. Fig. 7 shows photograph of 10 kW amplifier as installed at CFB and pulse tests.
This amplifier has capability to deliver more than 10 kW of RF power if RF power requirement to buncher cavity is increased.
(a)10 kW power amplifier and directional coupler
(b)Pulse response of 10 kW power amplifier Fig. 7 Photograph of 10 kW RF amplifier units and and components installed at CFB with pulse test
20.5
21
21.5
22
22.5
23
0
1000
2000
3000
4000
5000
6000
7000
8000
9000
5 10 15 20 25 30 35 40 45 50 55 60
Output Power (W)
Output power and Module gainfor 8 kW Power Amplifier
Power Output (W)
Power Gain(dB)
Power
Gain
(dB)Power input to the divider (W)
0.5
0.7
0.9
1.1
1.3
1.5
25
35
45
55
65
75
5 10 15 20 25 30 35 40 45 50 55 60
Efficien
cy and PAE (%
)
Efficiency, PAE and VSWR Vs Input powerCombined Power Amplifier
Efficiency %
Power Added Efficiency (PAE) (%)
VSW
R at th
e Inputof d
ivider
Power input to the divider (W)
180
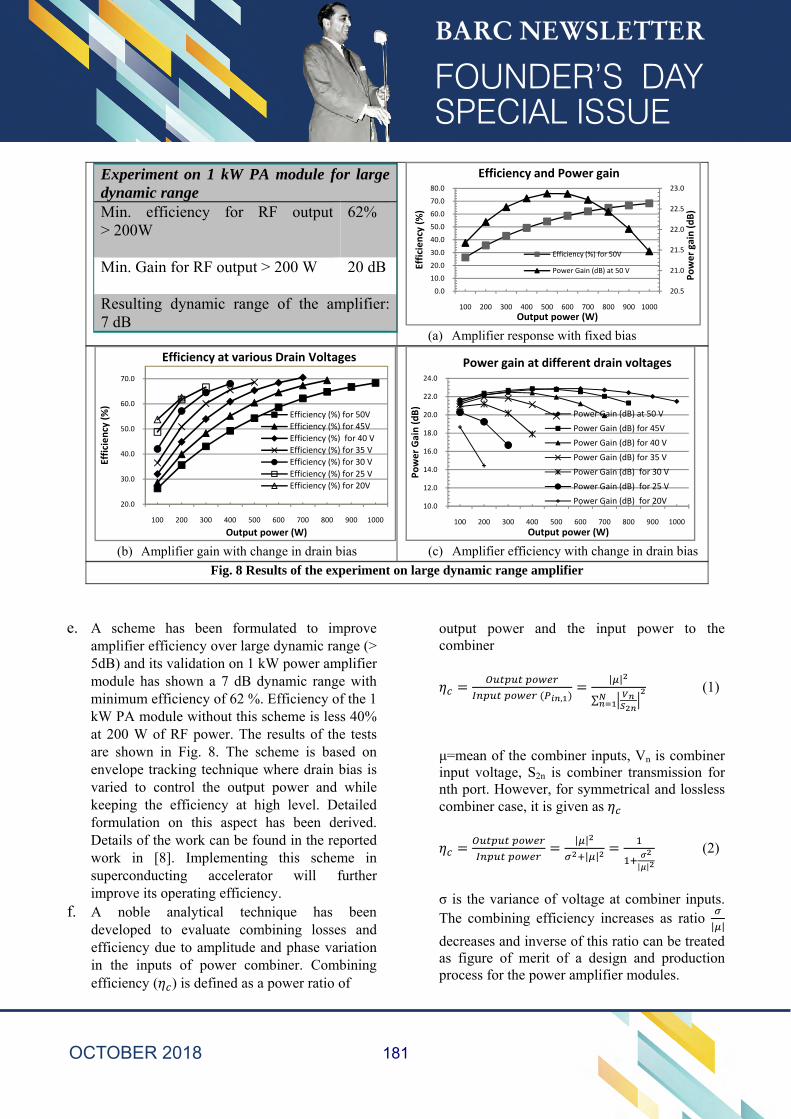
Experiment on 1 kW PA module for large dynamic range Min. efficiency for RF output > 200W
62%
Min. Gain for RF output > 200 W
20 dB
Resulting dynamic range of the amplifier: 7 dB
(a) Amplifier response with fixed bias
(b) Amplifier gain with change in drain bias
(c) Amplifier efficiency with change in drain bias Fig. 8 Results of the experiment on large dynamic range amplifier
e. A scheme has been formulated to improve amplifier efficiency over large dynamic range (> 5dB) and its validation on 1 kW power amplifier module has shown a 7 dB dynamic range with minimum efficiency of 62 %. Efficiency of the 1 kW PA module without this scheme is less 40% at 200 W of RF power. The results of the tests are shown in Fig. 8. The scheme is based on envelope tracking technique where drain bias is varied to control the output power and while keeping the efficiency at high level. Detailed formulation on this aspect has been derived. Details of the work can be found in the reported work in [8]. Implementing this scheme in superconducting accelerator will further improve its operating efficiency.
f. A noble analytical technique has been developed to evaluate combining losses and efficiency due to amplitude and phase variation in the inputs of power combiner. Combining efficiency ( ) is defined as a power ratio of
output power and the input power to the combiner
,
| |
∑ (1)
μ=mean of the combiner inputs, Vn is combiner input voltage, S2n is combiner transmission for nth port. However, for symmetrical and lossless combiner case, it is given as
| |
| || |
(2)
σ is the variance of voltage at combiner inputs. The combining efficiency increases as ratio
| |
decreases and inverse of this ratio can be treated as figure of merit of a design and production process for the power amplifier modules.
20.5
21.0
21.5
22.0
22.5
23.0
0.0
10.0
20.0
30.0
40.0
50.0
60.0
70.0
80.0
100 200 300 400 500 600 700 800 900 1000
Efficiency (%)
Output power (W)
Efficiency and Power gain
Efficiency (%) for 50V
Power Gain (dB) at 50 V
Power gain (dB)
20.0
30.0
40.0
50.0
60.0
70.0
100 200 300 400 500 600 700 800 900 1000
Efficiency (%)
Output power (W)
Efficiency at various Drain Voltages
Efficiency (%) for 50V
Efficiency (%) for 45V
Efficiency (%) for 40 V
Efficiency (%) for 35 V
Efficiency (%) for 30 V
Efficiency (%) for 25 V
Efficiency (%) for 20V
10.0
12.0
14.0
16.0
18.0
20.0
22.0
24.0
100 200 300 400 500 600 700 800 900 1000
Power Gain (dB)
Output power (W)
Power gain at different drain voltages
Power Gain (dB) at 50 V
Power Gain (dB) for 45V
Power Gain (dB) for 40 V
Power Gain (dB) for 35 V
Power Gain (dB) for 30 V
Power Gain (dB) for 25 V
Power Gain (dB) for 20V
181
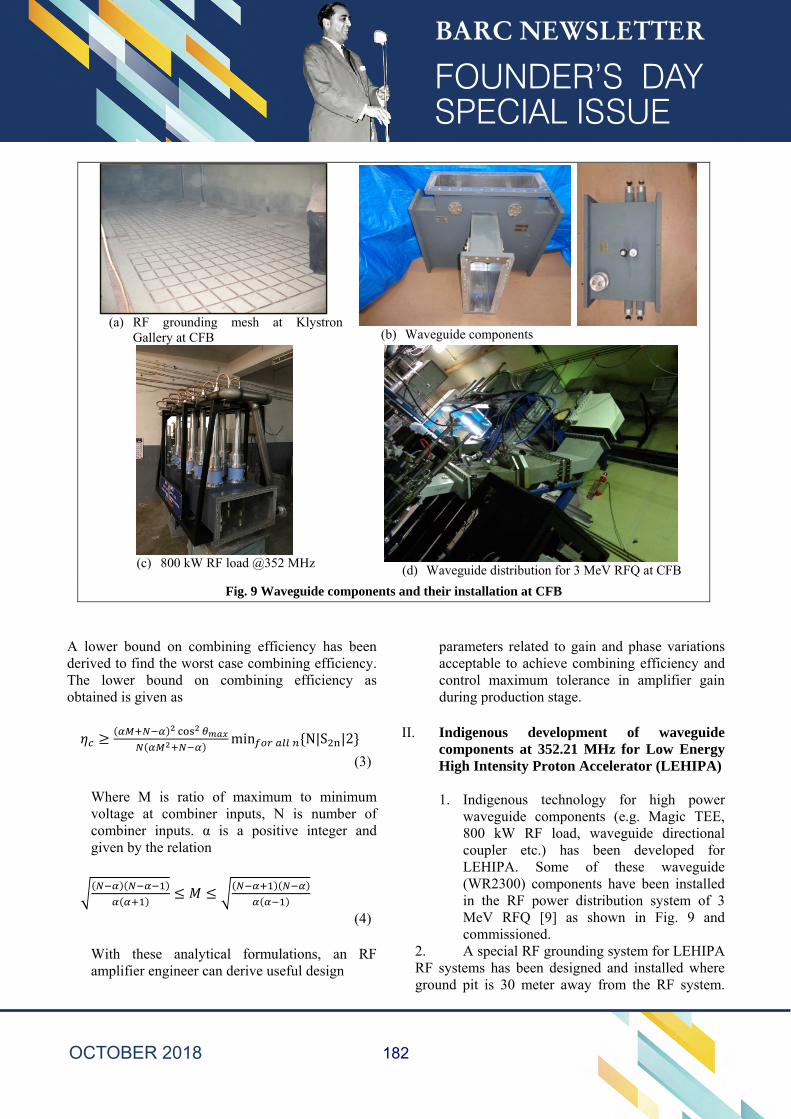
(a) RF grounding mesh at Klystron
Gallery at CFB
(b) Waveguide components
(c) 800 kW RF load @352 MHz
(d) Waveguide distribution for 3 MeV RFQ at CFB
Fig. 9 Waveguide components and their installation at CFB
A lower bound on combining efficiency has been derived to find the worst case combining efficiency. The lower bound on combining efficiency as obtained is given as
min N|S |2
(3)
Where M is ratio of maximum to minimum voltage at combiner inputs, N is number of combiner inputs. α is a positive integer and given by the relation
(4)
With these analytical formulations, an RF amplifier engineer can derive useful design
parameters related to gain and phase variations acceptable to achieve combining efficiency and control maximum tolerance in amplifier gain during production stage.
II. Indigenous development of waveguide components at 352.21 MHz for Low Energy High Intensity Proton Accelerator (LEHIPA) 1. Indigenous technology for high power
waveguide components (e.g. Magic TEE, 800 kW RF load, waveguide directional coupler etc.) has been developed for LEHIPA. Some of these waveguide (WR2300) components have been installed in the RF power distribution system of 3 MeV RFQ [9] as shown in Fig. 9 and commissioned.
2. A special RF grounding system for LEHIPA RF systems has been designed and installed where ground pit is 30 meter away from the RF system.
182
The effective DC resistance of whole grounding network (comprising of ground pit, copper mesh and inter connecting copper strips) as measured is 0.65 ohm. The Klystron system for 1 MW has been using this RF grounding system for commissioning of radio frequency quadrupole (RFQ).
Conclusions
The development of 7 kW power amplifier at 325 MHz under IIFC program and 10 kW power amplifier at 352 MHz under LEHIPA by combining of multiple PA modules has led to indigenization of
various RF power components and systems. Electronics Corporation of India Limited (ECIL) has taken up the production of 7 kW RF power amplifier for IIFC requirements. These works for high end technologies has truly contributed to “Make in India” initiative of Indian Government and has also helped develop fabrication capability of local industry as well as saved Government foreign exchange because these systems/components are import substitute.
References 1. Jitendra Kumar Mishra, B. V. Ramarao, Manjiri
Pande, P. Singh, A Compact High Efficiency 8 kW 325 MHz power amplifier for accelerator applications, Nuclear Instruments and Methods in Physics Research A, (2014), 764, p. 247-256.
2. B. V. Ramarao, J. K. Mishra, Manjiri Pande, Comparison Study of LDMOS and VDMOS Technologies for RF Power Amplifiers, Proceedings of the 57th DAE Solid State Physics Symposium 2012, AIP conf. Proc. 1512, 492-493 (2013), AIP.
3. J. K. Mishra, B. V. Ramarao, Manjiri M Pande, V. K. Handu, Design and analysis of RF power combiners/splitters at 350MHz, Proc. of Indian Particle Accelerator Conference (InPAC 2011), IUAC New Delhi.
4. J. K. Mishra, B. V. Ramarao, Muthu S., Manjiri Pande, Pitamber Singh, Design and Development of Power Divider/Combiners for Solid State RF Amplifier Required for Accelerator Development at BARC, National Symposium on High Power RF & Microwave (HPRFM-2013).
5. B. V. Ramarao, S. Sonal, J. K. Mishra, Manjiri Pande, P. Singh, G. Kumar, J. Mukherjee,
Development of 3 kW at 325 MHz Solid State RF Power Amplifier using four power amplifier modules, Nuclear Instruments and Methods in Physics Research A, (2014), 735, p. 283-290.
6. B. V. Ramarao, J. K. Mishra, S. Sharma, M. Pande, P. Singh, G. Kumar, and J. Mukherjee, Design of a Four-way Power Combiner for RF Accelerators, Proc. Of APSYM, 2014, pp. 41-44.
7. B. V. Ramarao, J. K. Mishra, S. Sonal, S. Muthu, Manjiri Pande, and P. V. Bhagwat, Status of Solid-state Power Amplifiers Development in BARC, Proc. of Indian Particle Accelerator Conference InPAC-2015, December 21 - 24, 2015
8. Jitendra Kumar Mishra, B. V. Ramarao, Manjiri M. Pande, Gopal Joshi, Archana Sharma, Pitamber Singh, High Efficiency RF Amplifier Development Over Wide Dynamic Range for Accelerator Application, Nuclear Instruments and Methods in Physics Research, A 868C (2017), pp. 48-52.
9. J K Mishra, B V Ramarao, Manjiri M Pande, P Singh, Design and simulation and development of Waveguide components for LEHIPA at BARC, Proc. of Indian Particle Accelerator Conference (InPAC2013), November 19-22, 2013
183
Continuous pH Measurement System for Batch Process Involving Slurry Media
Bikram Roy UED
Bikram Roy is the recipient of the DAE Young Engineer
Award for the year 2016
What is pH? pH is a short form for the Power (p) of Hydrogen (H) pH is defined as the negative log of the Hydrogen ion activity or the effective hydrogen ion concentration. pH is a unit of measure which describes the degree of acidity or alkalinity of a solution. Acidity is defined as the concentration of hydrogen ions [H+] in solution and alkalinity as the concentration of hydroxyl ions [OH-] in solution. pH Measurement Techniques
There are few popular ways of measuring pH. The first is a Colorimetric Method which uses color indicators to indicate the pH of the sample. There are limitations to this measurement technique. For instance, visual measurement by an operator is subject to variation. As well, this technique is done by grab sample which is not suitable for continuous or inline measurement. A more effective way to measure pH in an industrial setting is the potentiometric method of pH analysis. The potentiometric method allows continuous, on-line measurement and is not subject to operator bias. Potentiometric analysis has four parts: 1) sample, 2) pH sensing electrode, 3) reference electrode and 4) signal amplifier/readout. When properly combined the result is accurate, representative pH readings. The pH sensing electrode acts as a battery whose potential varies with the hydrogen ion concentration in solution. The Standard Glass Electrode is commonly used in industrial applications because of its ruggedness and
versatility. Finally, there are other Solid State Electrodes such as the Antimony Electrode which is a sensing element made of Antimony Hydroxide and is used in applications, like high fluoride, where glass is dissolved. While pH measurement systems are quite standard at Laboratory scale and various suppliers provide different models of pH sensing system for laboratory application, the technique for pH measurement in industry is not simple as this. Different models of insertion and immersion type pH sensor are available for application at industrial scale. The primary principle of operation remains the same, however industrial probes are more rugged and can be customized to meet user requirement. pH Concerns in Industrial Batch Process involving slurry There are several patented and established techniques available to counter pH sensor related issues such as Offset, temperature effect, ground loop etc. However two common issues in pH sensor installation prevail in all application, which are discussed below: Issue A : pH sensor Drying: In case of batch process and semi batch process, the sensor face may not be immersed all time in the liquid/semi liquid media. Where frequency of batch operation is less and time interval between successive batch varies between one to seven days, the probability of sensor drying is very high. The same case is true once plants undergo long shutdown ranging from seven days to few months. All industrial and laboratory pH sensor
184
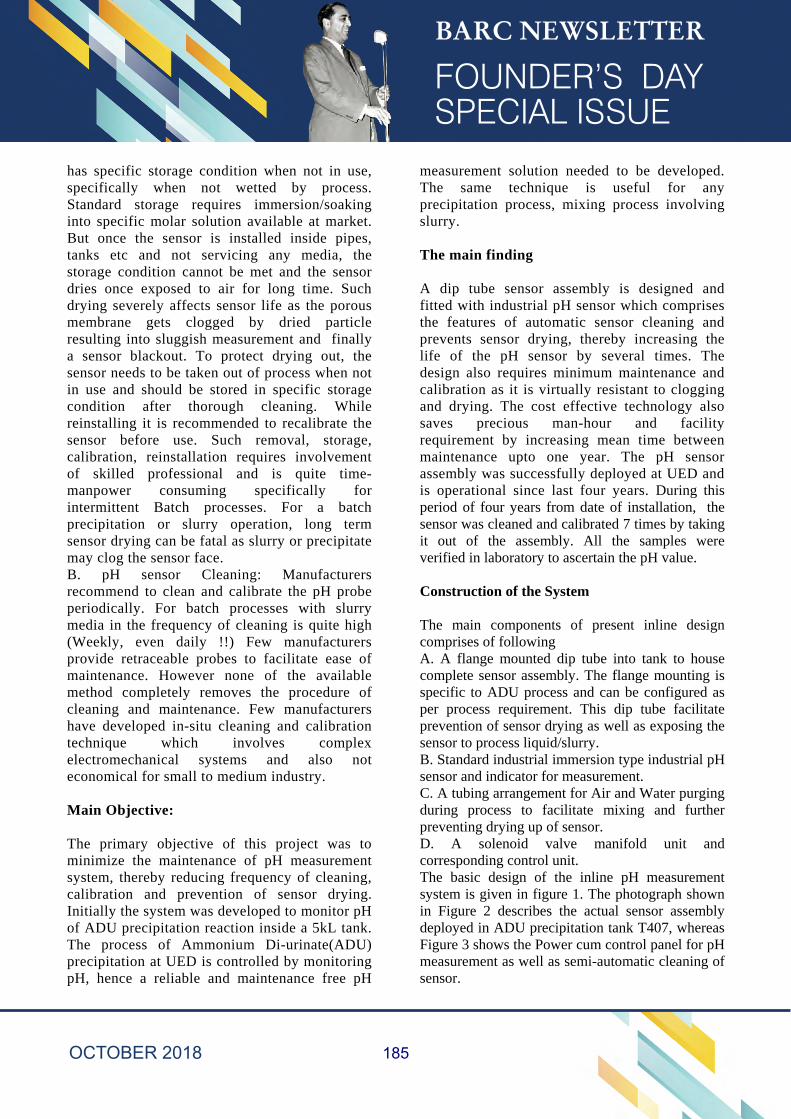
has specific storage condition when not in use, specifically when not wetted by process. Standard storage requires immersion/soaking into specific molar solution available at market. But once the sensor is installed inside pipes, tanks etc and not servicing any media, the storage condition cannot be met and the sensor dries once exposed to air for long time. Such drying severely affects sensor life as the porous membrane gets clogged by dried particle resulting into sluggish measurement and finally a sensor blackout. To protect drying out, the sensor needs to be taken out of process when not in use and should be stored in specific storage condition after thorough cleaning. While reinstalling it is recommended to recalibrate the sensor before use. Such removal, storage, calibration, reinstallation requires involvement of skilled professional and is quite time-manpower consuming specifically for intermittent Batch processes. For a batch precipitation or slurry operation, long term sensor drying can be fatal as slurry or precipitate may clog the sensor face. B. pH sensor Cleaning: Manufacturers recommend to clean and calibrate the pH probe periodically. For batch processes with slurry media in the frequency of cleaning is quite high (Weekly, even daily !!) Few manufacturers provide retraceable probes to facilitate ease of maintenance. However none of the available method completely removes the procedure of cleaning and maintenance. Few manufacturers have developed in-situ cleaning and calibration technique which involves complex electromechanical systems and also not economical for small to medium industry. Main Objective: The primary objective of this project was to minimize the maintenance of pH measurement system, thereby reducing frequency of cleaning, calibration and prevention of sensor drying. Initially the system was developed to monitor pH of ADU precipitation reaction inside a 5kL tank. The process of Ammonium Di-urinate(ADU) precipitation at UED is controlled by monitoring pH, hence a reliable and maintenance free pH
measurement solution needed to be developed. The same technique is useful for any precipitation process, mixing process involving slurry. The main finding A dip tube sensor assembly is designed and fitted with industrial pH sensor which comprises the features of automatic sensor cleaning and prevents sensor drying, thereby increasing the life of the pH sensor by several times. The design also requires minimum maintenance and calibration as it is virtually resistant to clogging and drying. The cost effective technology also saves precious man-hour and facility requirement by increasing mean time between maintenance upto one year. The pH sensor assembly was successfully deployed at UED and is operational since last four years. During this period of four years from date of installation, the sensor was cleaned and calibrated 7 times by taking it out of the assembly. All the samples were verified in laboratory to ascertain the pH value. Construction of the System The main components of present inline design comprises of following A. A flange mounted dip tube into tank to house complete sensor assembly. The flange mounting is specific to ADU process and can be configured as per process requirement. This dip tube facilitate prevention of sensor drying as well as exposing the sensor to process liquid/slurry. B. Standard industrial immersion type industrial pH sensor and indicator for measurement. C. A tubing arrangement for Air and Water purging during process to facilitate mixing and further preventing drying up of sensor. D. A solenoid valve manifold unit and corresponding control unit. The basic design of the inline pH measurement system is given in figure 1. The photograph shown in Figure 2 describes the actual sensor assembly deployed in ADU precipitation tank T407, whereas Figure 3 shows the Power cum control panel for pH measurement as well as semi-automatic cleaning of sensor.
185
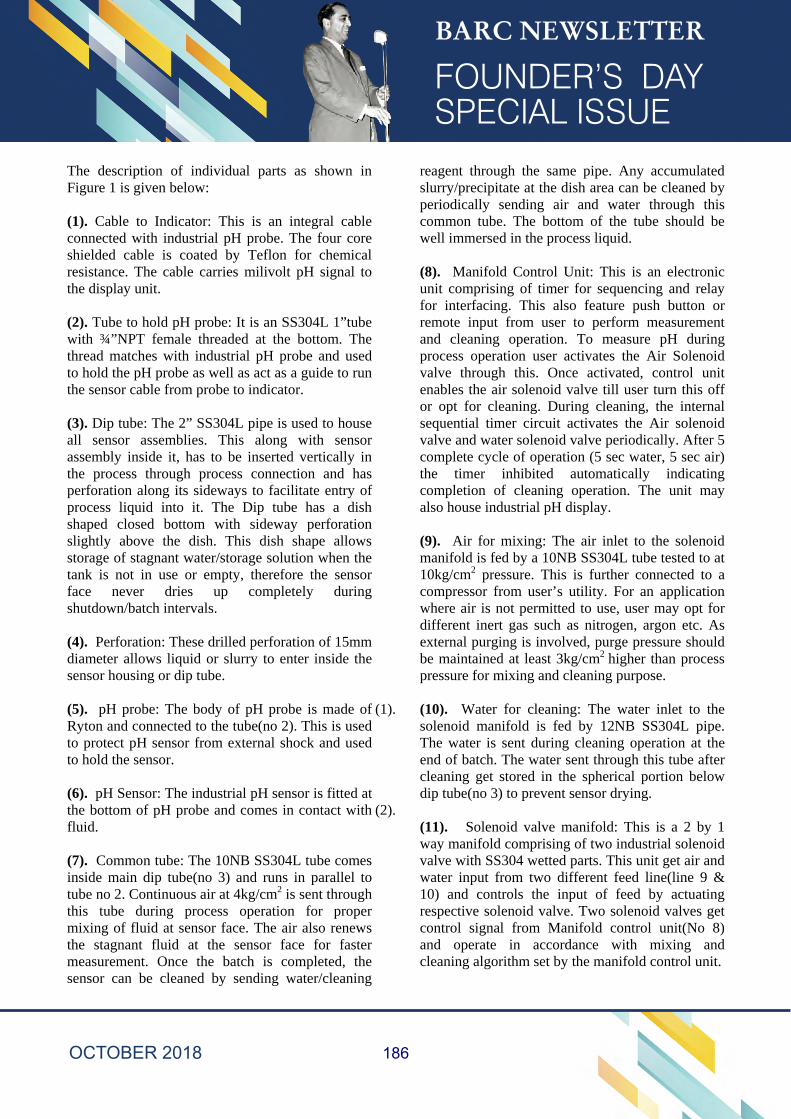
The description of individual parts as shown in Figure 1 is given below: (1). Cable to Indicator: This is an integral cable connected with industrial pH probe. The four core shielded cable is coated by Teflon for chemical resistance. The cable carries milivolt pH signal to the display unit. (2). Tube to hold pH probe: It is an SS304L 1”tube with ¾”NPT female threaded at the bottom. The thread matches with industrial pH probe and used to hold the pH probe as well as act as a guide to run the sensor cable from probe to indicator. (3). Dip tube: The 2” SS304L pipe is used to house all sensor assemblies. This along with sensor assembly inside it, has to be inserted vertically in the process through process connection and has perforation along its sideways to facilitate entry of process liquid into it. The Dip tube has a dish shaped closed bottom with sideway perforation slightly above the dish. This dish shape allows storage of stagnant water/storage solution when the tank is not in use or empty, therefore the sensor face never dries up completely during shutdown/batch intervals. (4). Perforation: These drilled perforation of 15mm diameter allows liquid or slurry to enter inside the sensor housing or dip tube. (5). pH probe: The body of pH probe is made of Ryton and connected to the tube(no 2). This is used to protect pH sensor from external shock and used to hold the sensor. (6). pH Sensor: The industrial pH sensor is fitted at the bottom of pH probe and comes in contact with fluid. (7). Common tube: The 10NB SS304L tube comes inside main dip tube(no 3) and runs in parallel to tube no 2. Continuous air at 4kg/cm2 is sent through this tube during process operation for proper mixing of fluid at sensor face. The air also renews the stagnant fluid at the sensor face for faster measurement. Once the batch is completed, the sensor can be cleaned by sending water/cleaning
reagent through the same pipe. Any accumulated slurry/precipitate at the dish area can be cleaned by periodically sending air and water through this common tube. The bottom of the tube should be well immersed in the process liquid. (8). Manifold Control Unit: This is an electronic unit comprising of timer for sequencing and relay for interfacing. This also feature push button or remote input from user to perform measurement and cleaning operation. To measure pH during process operation user activates the Air Solenoid valve through this. Once activated, control unit enables the air solenoid valve till user turn this off or opt for cleaning. During cleaning, the internal sequential timer circuit activates the Air solenoid valve and water solenoid valve periodically. After 5 complete cycle of operation (5 sec water, 5 sec air) the timer inhibited automatically indicating completion of cleaning operation. The unit may also house industrial pH display. (9). Air for mixing: The air inlet to the solenoid manifold is fed by a 10NB SS304L tube tested to at 10kg/cm2 pressure. This is further connected to a compressor from user’s utility. For an application where air is not permitted to use, user may opt for different inert gas such as nitrogen, argon etc. As external purging is involved, purge pressure should be maintained at least 3kg/cm2 higher than process pressure for mixing and cleaning purpose.
(1). (10). Water for cleaning: The water inlet to the solenoid manifold is fed by 12NB SS304L pipe. The water is sent during cleaning operation at the end of batch. The water sent through this tube after cleaning get stored in the spherical portion below dip tube(no 3) to prevent sensor drying.
(2). (11). Solenoid valve manifold: This is a 2 by 1 way manifold comprising of two industrial solenoid valve with SS304 wetted parts. This unit get air and water input from two different feed line(line 9 & 10) and controls the input of feed by actuating respective solenoid valve. Two solenoid valves get control signal from Manifold control unit(No 8) and operate in accordance with mixing and cleaning algorithm set by the manifold control unit.
186
O TCclcththinooh
Operation of
The device oCleaning. Dcommand to ocal push b
control unit she solenoid he solenoid n turn create
of the dip tuof liquid/slurhelps to prev
Figure 2: Se
f the device:
operates in During meas
start measubutton or remsend signal manifold unvalve sends e agitation atube. The air rry for better ent any build
F
ensor assem
:
two mode: surement theurement opemote input. to the air so
nit to ‘open’air into the dt the sphericmixing facilmeasuremen
d up of slurry
Figure-1 : Co
mbly with Dip
Measuremene user inpuration throuThe manifo
olenoid vale . Once opendip tube whi
cal dish bottolitates renewnt. The air aly or
onstruction
p Tube F
nt, uts gh
old in
ned ich om wal lso
prmopclin‘orepelaanofThw
of the syste
Figure 3: Po
recipitate at measurement
peration comlean the probnput, the maopen’ signaespectively. erform cleanast cycle of nd then watef water remahis stored w
when not in u
m
wer cum co
the bottom the air valv
mmences. Obe using locnifold contro
al to waterThe period
nsing operatcleaning the
er valve is clains in the diwater preventse.
ntrol panel
of diptube. Ave is closed Once user ccal push buttol unit perior valve andic opening tion of the se air valve iosed so that sh portion ofts the sensor
At the end oand cleanin
commands tton or remotodically sendnd air valv
and closinensor. Durinis closed firsome amounf the dip tubr from dryin
of ng to te ds ve ng ng rst nt e.
ng
187
Performance characteristics:
Figure 4a Figure 4b
Figure 4c Figure 4d Figure 4a and 4b represents the deviation of sensor behavior from ideal Nernst slope after 224 hours and 116 hours of operation respectively. Figure 4c represents the electrode behavior during air purging and Figure 4d reproduces the sensor data during
116th batch operation after six months of initial calibration. Figure 5 illustrates the effect of the turbidity on the measurement in accordance with an embodiment of the present invention.
188
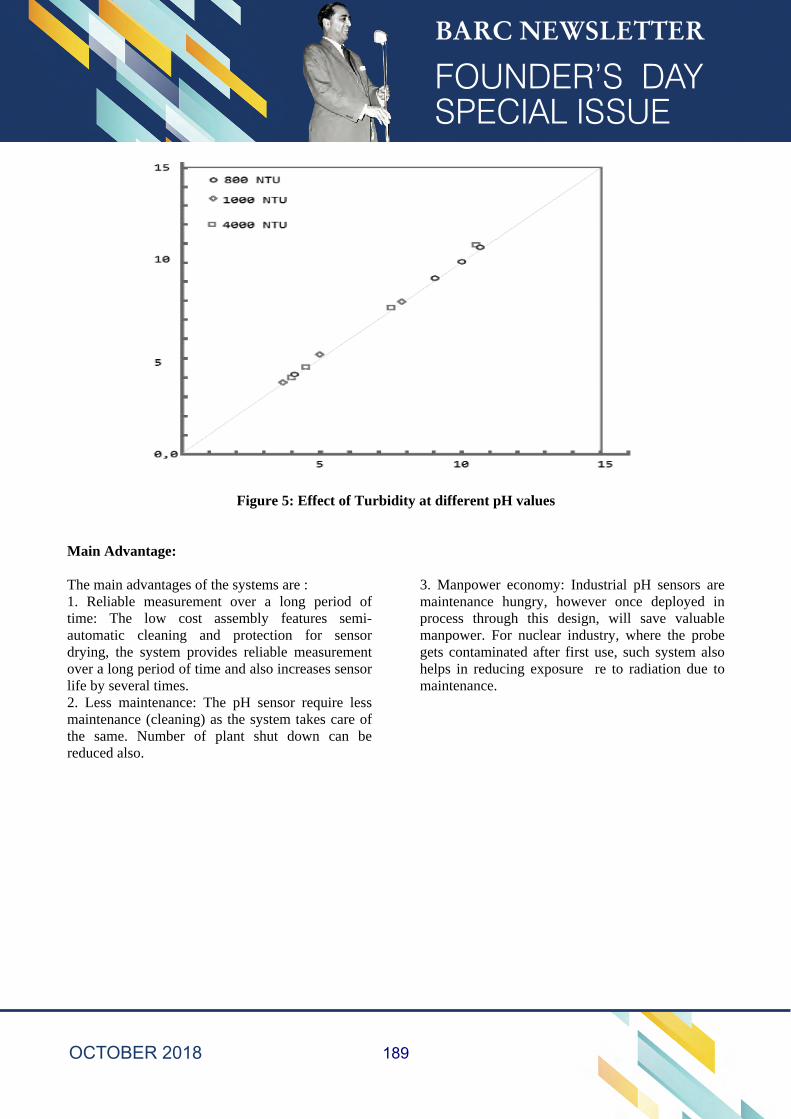
M T1tadol2mthr
Main Advan
The main adv1. Reliable ime: The
automatic cdrying, the sover a long pife by severa
2. Less mainmaintenance he same. N
reduced also.
ntage:
vantages of tmeasuremenlow cost
cleaning andsystem proviperiod of timal times. ntenance: Th(cleaning) a
Number of .
Figure 5
the systems ant over a loassembly fd protectionides reliablee and also in
he pH sensoas the systemplant shut
5: Effect of T
are : ong period features semn for sens
e measuremencreases sens
or require lem takes care
down can
Turbidity at
of mi-sor ent sor
ess of be
3.mprmgehem
t different p
. Manpower maintenance
rocess throumanpower. Fo
ets contaminelps in reduc
maintenance.
H values
r economy: Ihungry, how
ugh this desor nuclear in
nated after ficing exposu
Industrial pHwever once sign, will sndustry, whirst use, suchre re to rad
H sensors ardeployed i
save valuablere the probh system alsdiation due t
re in le be so to
189
190
191

Related Documents