arXiv:0801.2759v2 [astro-ph] 18 Jan 2008 Draft version February 2, 2008 Preprint typeset using L A T E X style emulateapj v. 03/07/07 SPITZER UNCOVERS ACTIVE GALACTIC NUCLEI MISSED BY OPTICAL SURVEYS IN 7 LATE-TYPE GALAXIES S. Satyapal 1 , D. Vega 1 , R. P. Dudik 1,2 , N. P. Abel 3 , & T. Heckman 4 Draft version February 2, 2008 ABSTRACT We conducted a high resolution mid-infrared spectroscopic investigation using Spitzer of 32 late- type (Sbc or later) galaxies that show no definitive signatures of Active Galactic Nuclei (AGN) in their optical spectra in order to search for low luminosity and/or embedded AGN. These observations reveal the presence of the high ionization [NeV] 14μm and/or 24μm line in 7 sources, providing strong evidence for AGNs in these galaxies. Taking into account the variable sensitivity of our observations, we find that the AGN detection rate based on mid-infrared diagnostics in optically normal late-type galaxies is ∼ 30%, implying an AGN detection rate in late-type galaxies that is possibly 4 times larger than what optical spectroscopic observations alone suggest. We demonstrate using photoionization models with both an input AGN and an extreme EUV-bright starburst ionizing radiation field that the observed mid-infrared line ratios in our 7 AGN candidates cannot be replicated unless an AGN contribution, in some cases as little as 10% of the total galaxy luminosity, is included. These models show that when the fraction of the total luminosity due to the AGN is low, optical diagnostics are insensitive to the presence of the AGN. In this regime of parameter space, the mid-infrared diagnostics offer a powerful tool for uncovering AGN missed by optical spectroscopy. The AGN bolometric luminosities in our sample inferred using our [NeV] line luminosities range from ∼ 3×10 41 ergs s −1 to ∼ 2×10 43 ergs s −1 . Assuming that the AGN is radiating at the Eddington limit, this range corresponds to a lower mass limit for the black hole that ranges from ∼ 3×10 3 M ⊙ to as high as ∼ 1.5×10 5 M ⊙ . These lower mass limits however do not put a strain on the well-known relationship between the black hole mass and the host galaxy’s stellar velocity dispersion established in predominantly early-type galaxies. Our findings add to the growing evidence that black holes do form and grow in low-bulge environments and that they are significantly more common than optical studies indicate. Subject headings: Galaxies: Active— Galaxies: black hole physics – dark matter – galaxies: spiral: Galaxies — Infrared: Galaxies 1. INTRODUCTION The vast majority of currently known active galactic nuclei (AGN) in the local Universe reside in host galaxies with prominent bulges (e.g. Heckman 1980a; Keel 1983b; Terlevich, Melnick, & Moles 1987; Ho, Filippenko, & Sar- gent 1997; Kauffmann et al. 2003). This result, together with the finding that the black hole mass, M BH , and the host galaxy’s stellar velocity dispersion, σ, is strongly correlated (Gebhardt et al. 2000; Ferrarese & Merritt 2000), has led to the general consensus that black hole formation and growth is fundamentally connected to the build-up of galaxy bulges. Indeed, it has been proposed that feedback from the AGN regulates the surrounding star formation in the host galaxy (e.g. Silk & Rees 1998; Kauffmann & Haehnelt 2000). However, an important outstanding question remains unresolved: is a bulge in general a necessary ingredient for a black hole to form and grow? On the one hand, M33, the best studied nearby bulgeless galaxy, shows no evidence of a super- massive black hole (SBH), and the upper limit on the 1 George Mason University, Department of Physics & Astron- omy, MS 3F3, 4400 University Drive, Fairfax, VA 22030; satya- [email protected] 2 Observational Cosmology Laboratory, NASA Goddard Space Flight Center, Greenbelt, MD 20711 3 Department of Physics, University of Cincinnati, Cincinnati, OH 45221 4 Center for Astrophysical Sciences, Department of Physics and Astronomy, The Johns Hopkins University, Baltimore, MD 21218 mass is significantly below that predicted by the M BH -σ relation established in early-type galaxies (Gebhardt et al. 2001; Merritt et al. 2001). On the other hand, both NGC 4395 (Filippenko & Ho 2003) and POX52 (Barth et al. 2004) show no evidence for a bulge and yet do con- tain AGN. However, these two galaxies have remained isolated cases of bulgeless galaxies with accreting black holes, suggesting that they are anomalies. Indeed in the extensive Palomar optical spectroscopic survey of 486 nearby galaxies (Ho, Filippenko, & Sargent1997; hence- forth H97), there are only 9 optically identified Seyferts with Hubble type of Sc or later. Only one galaxy of Hub- ble type of Scd or later in the entire survey is classified as a Seyfert (NGC 4395). Greene & Ho (2004, 2007) re- cently conducted an extensive search for broad-line AGN with intermediate mass black holes in the Fourth Data Release of the Sloan Digital Sky Survey (2004, 2007). Of the 8435 broad line AGN, they found only 174 (2%) such intermediate mass objects, indicating that they are extremely rare. Forty percent of these seem to be in late- type galaxies with colors consistent with morphological type Sab, although the Sloan images are of insufficient spatial resolution to extract precise morphological infor- mation. Optical observations thus clearly suggest that AGN in late-type galaxies are uncommon. However, determining if AGN reside in low bulge galaxies cannot be definitively answered using optical observations alone. The problem arises because a pu- tative AGN in a galaxy with a minimal bulge is likely

Welcome message from author
This document is posted to help you gain knowledge. Please leave a comment to let me know what you think about it! Share it to your friends and learn new things together.
Transcript
arX
iv:0
801.
2759
v2 [
astr
o-ph
] 1
8 Ja
n 20
08
Draft version February 2, 2008Preprint typeset using LATEX style emulateapj v. 03/07/07
SPITZER UNCOVERS ACTIVE GALACTIC NUCLEI MISSED BY OPTICAL SURVEYS IN 7 LATE-TYPEGALAXIES
S. Satyapal1, D. Vega1, R. P. Dudik1,2, N. P. Abel3, & T. Heckman4
Draft version February 2, 2008
ABSTRACT
We conducted a high resolution mid-infrared spectroscopic investigation using Spitzer of 32 late-type (Sbc or later) galaxies that show no definitive signatures of Active Galactic Nuclei (AGN) intheir optical spectra in order to search for low luminosity and/or embedded AGN. These observationsreveal the presence of the high ionization [NeV] 14µm and/or 24µm line in 7 sources, providing strongevidence for AGNs in these galaxies. Taking into account the variable sensitivity of our observations,we find that the AGN detection rate based on mid-infrared diagnostics in optically normal late-typegalaxies is ∼ 30%, implying an AGN detection rate in late-type galaxies that is possibly 4 times largerthan what optical spectroscopic observations alone suggest. We demonstrate using photoionizationmodels with both an input AGN and an extreme EUV-bright starburst ionizing radiation field thatthe observed mid-infrared line ratios in our 7 AGN candidates cannot be replicated unless an AGNcontribution, in some cases as little as 10% of the total galaxy luminosity, is included. These modelsshow that when the fraction of the total luminosity due to the AGN is low, optical diagnostics areinsensitive to the presence of the AGN. In this regime of parameter space, the mid-infrared diagnosticsoffer a powerful tool for uncovering AGN missed by optical spectroscopy. The AGN bolometricluminosities in our sample inferred using our [NeV] line luminosities range from ∼ 3×1041 ergs s−1 to∼ 2×1043 ergs s−1. Assuming that the AGN is radiating at the Eddington limit, this range correspondsto a lower mass limit for the black hole that ranges from ∼ 3×10³M⊙ to as high as ∼ 1.5×10⁵M⊙.These lower mass limits however do not put a strain on the well-known relationship between the blackhole mass and the host galaxy’s stellar velocity dispersion established in predominantly early-typegalaxies. Our findings add to the growing evidence that black holes do form and grow in low-bulgeenvironments and that they are significantly more common than optical studies indicate.Subject headings: Galaxies: Active— Galaxies: black hole physics – dark matter – galaxies: spiral:
Galaxies — Infrared: Galaxies
1. INTRODUCTION
The vast majority of currently known active galacticnuclei (AGN) in the local Universe reside in host galaxieswith prominent bulges (e.g. Heckman 1980a; Keel 1983b;Terlevich, Melnick, & Moles 1987; Ho, Filippenko, & Sar-gent 1997; Kauffmann et al. 2003). This result, togetherwith the finding that the black hole mass, MBH, and thehost galaxy’s stellar velocity dispersion, σ, is stronglycorrelated (Gebhardt et al. 2000; Ferrarese & Merritt2000), has led to the general consensus that black holeformation and growth is fundamentally connected to thebuild-up of galaxy bulges. Indeed, it has been proposedthat feedback from the AGN regulates the surroundingstar formation in the host galaxy (e.g. Silk & Rees 1998;Kauffmann & Haehnelt 2000). However, an importantoutstanding question remains unresolved: is a bulge ingeneral a necessary ingredient for a black hole to formand grow? On the one hand, M33, the best studiednearby bulgeless galaxy, shows no evidence of a super-massive black hole (SBH), and the upper limit on the
1 George Mason University, Department of Physics & Astron-omy, MS 3F3, 4400 University Drive, Fairfax, VA 22030; [email protected]
2 Observational Cosmology Laboratory, NASA Goddard SpaceFlight Center, Greenbelt, MD 20711
3 Department of Physics, University of Cincinnati, Cincinnati,OH 45221
4 Center for Astrophysical Sciences, Department of Physics andAstronomy, The Johns Hopkins University, Baltimore, MD 21218
mass is significantly below that predicted by the MBH-σrelation established in early-type galaxies (Gebhardt etal. 2001; Merritt et al. 2001). On the other hand, bothNGC 4395 (Filippenko & Ho 2003) and POX52 (Barthet al. 2004) show no evidence for a bulge and yet do con-tain AGN. However, these two galaxies have remainedisolated cases of bulgeless galaxies with accreting blackholes, suggesting that they are anomalies. Indeed in theextensive Palomar optical spectroscopic survey of 486nearby galaxies (Ho, Filippenko, & Sargent1997; hence-forth H97), there are only 9 optically identified Seyfertswith Hubble type of Sc or later. Only one galaxy of Hub-ble type of Scd or later in the entire survey is classifiedas a Seyfert (NGC 4395). Greene & Ho (2004, 2007) re-cently conducted an extensive search for broad-line AGNwith intermediate mass black holes in the Fourth DataRelease of the Sloan Digital Sky Survey (2004, 2007).Of the 8435 broad line AGN, they found only 174 (2%)such intermediate mass objects, indicating that they areextremely rare. Forty percent of these seem to be in late-type galaxies with colors consistent with morphologicaltype Sab, although the Sloan images are of insufficientspatial resolution to extract precise morphological infor-mation. Optical observations thus clearly suggest thatAGN in late-type galaxies are uncommon.
However, determining if AGN reside in low bulgegalaxies cannot be definitively answered using opticalobservations alone. The problem arises because a pu-tative AGN in a galaxy with a minimal bulge is likely
2
to be both energetically weak and deeply embedded inthe center of a dusty late-type spiral. As a result, op-tical emission lines will be dominated by the emissionfrom star formation regions, severely limiting the diag-nostic power of optical surveys in determining the inci-dence of accreting black holes in low-bulge systems. Inour previous work, we demonstrated the power of mid-IRspectroscopy in detecting the low-power AGN in the Sdgalaxy NGC 3621 (Satyapal et al. 2007; henceforth S07).AGN show prominent high ionization fine structure lineemission at mid-infrared wavelengths but starburst andnormal galaxies are characterized by a lower ionizationspectra characteristic of HII regions ionized by youngstars (e.g. Genzel et al. 1998; Sturm et al. 2002; Satya-pal et al. 2004). In particular, the [NeV] 14 µm (ion-ization potential 97 eV) line is not generally produced inHII regions surrounding young stars, the dominant en-ergy source in starburst galaxies, since even hot massivestars emit very few photons with energy sufficient forthe production of Ne4+. The detection of this line inany galaxy provides strong evidence for an AGN.
The goal of this paper is to answer the question: areAGN in late-type galaxies more common than previouslythought? If so, this would revise our understandingof the environments in which supermassive black holes(SMBHs) can form and grow and perhaps shed light onthe nature of the MBH-σ relation in low-bulge systems.Toward this end, we conducted an archival investigationof 32 late-type galaxies observed by the Spitzer high res-olution spectrograph that show no definitive optical sig-natures of AGN to search for low-power and/or deeplyembedded AGN.
This paper is structured as follows. In Section 2, wesummarize the properties of the Spitzer archival samplepresented in this paper. In Section 3, we summarize theobservational details and data analysis procedure, fol-lowed by a description of our results in Section 4. InSection 5, we discuss the origin of the [NeV] emission, with each galaxy discussed individually, followed by adiscussion of the implications of our discoveries in Sec-tion 6. A summary of our major conclusions is given inSection 7.
2. THE SAMPLE
The target sources were selected from the Palomar sur-vey of nearby bright galaxies (H97). Of the 486 galaxiesin the Palomar survey, 169 are of Hubble type of Sbc orlater and classified based on their optical line ratios as“HII” stellar-powered galaxies or “T2” transition galax-ies. T2 galaxies have optical line ratios intermediate be-tween HII galaxies and low-ionization nuclear emission-line regions (LINERs) and have no broad permitted lines(e.g. Hα) in their optical spectrum. There is there-fore no firm optical spectroscopic evidence for AGN inthese galaxies. Of these 169 galaxies, 32 were observedby the high resolution modules of the Infrared Spectro-graph (IRS; Houck et al. 2004) onboard Spitzer.
Table 1 summarizes the basic properties of the galaxiesin our sample. All targets are nearby, ranging in distancefrom 1.6 to 43.6 Mpc. The majority of galaxies are clas-sified as HII galaxies; only 4 out of 32 are T2 objects.Figure 1 shows the distribution of Hubble types for thesample. Note that there are only 2 Sd and 1 Sdm galaxyin the sample and that the majority of galaxies are of
Fig. 1.— The distribution of Hubble types for the sample. Thegalaxies with [NeV] detections are indicated by the filled histogram(see Section 4 for details). Since the sensitivity of the observationsvaried across the sample, we also indicate with a downward arrowin Figure 1 the number of galaxies with [NeV] 14µm line sensitivityof 1038 ergs s−1or better. Although the sample size is too smallto make statistically meaningful statements, we note that none ofthe galaxies of Hubble type later than Scd in this sample displaya [NeV] line.
Hubble type Sc and Sbc.Figure 2 shows the standard optical line ratio diagnos-
tic diagrams (Veilleux & Osterbrock 1987) widely used toclassify AGN for the entire H97 sample with our Spitzersample highlighted. We also show in Figure 2 the theo-retical starburst limit line from Kewley et al. 2001. Thisline represents the maximum line ratios possible fromstarburst photoionization models using the hardest pos-sible starburst input ionizing radiation field. Note thatthe majority of galaxies in our sample (∼85-94%, de-pending on the diagram) have optical line ratios well tothe left of this line, indicating that the optical line ratiosdo not require the presence of any AGN contribution. Wepoint out that the optical spectroscopic classification ofa galaxy in principle will depend on the measurementaperture size, particularly in sources with weak AGNsurrounded by vigorous star formation activity. How-ever, the aperture size employed in the H97 optical spec-tral measurements (∼2′′×4′′) are in general some of thesmallest available in the literature. In addition, the sen-sitivity of the observations is considerably higher relativeto many other surveys; the optical line ratios from H97therefore provide the most sensitive optical classificationsfor weak AGN currently available.
3. OBSERVATIONAL DETAILS AND DATA REDUCTION
All data presented in this work were obtained us-ing both the short-wavelength (SH, 4.7”×11.3”, λ =9.9-19.6µm) and long-wavelength(LH, 11.1”×22.3”, λ =18.7-37.2µm) high-resolution modules of the IRS. Thesemodules have a spectral resolution of R ∼ 600. The 32observations were archived from various programs, in-cluding the SINGS Legacy Program (Kennicutt et al.2003), and therefore contain both spectral mapping andstaring observations. In spectral mapping mode, thespacecraft moves in a raster pattern of discrete steps,generally of half-slit width and half-slit length in size,in order to construct a rectangular map of the targeted

3
Table 1: Properties of the Sample
Galaxy Distance Hubble T M0
BT[OIII]/Hβ [OI]/Hα [NII]/Hα [SII]/Hα Optical
Name (Mpc) Type Class(1) (2) (3) (4) (5) (6) (7) (8) (9) (10)
NGC925 9.4 SAB(s)d 7 -19.90 0.84 0.01 0.22 0.33 HNGC1569 1.6 IBm 10 -16.60 5.48 0.00 0.04 0.03 HNGC2276 36.8 SAB(rs)c 5 -21.08 0.15 0.01 0.35 0.18 HNGC2903 6.3 SAB(rs)bc 4 -19.89 0.10 0.01 0.34 0.19 HNGC2976 2.1 SAc pec 5 -16.31 1.42 0.01 0.31 0.18 HNGC3034 5.2 IAO spin 90 -19.72 0.36 0.01 0.56 0.18 HNGC3077 2.1 IAO pec 90 -16.29 0.75 0.00 0.21 0.15 HNGC3184 8.7 SAB(rs)cd 6 -19.36 0.13 0.01 0.33 0.20 HNGC3198 10.8 SB(rs)c 5 -19.96 0.23 0.03 0.42 0.32 HNGC3310 18.7 SAB(r)bc pec 4 -20.41 0.95 0.04 0.66 0.26 HNGC3367 43.6 SB(rs)c 5 -21.28 0.50 0.03 0.83 0.28 HNGC3556 14.1 SB(s)cd spin 6 -20.92 0.26 0.01 0.32 0.29 HNGC3726 17.0 SAB(r)c 5 -20.48 0.14 0.01 0.31 0.22 HNGC3938 17.0 SA(s)c 5 -20.32 1.76 0.14 0.53 1.67 HNGC3949 17.0 SA(s)bc 4 -20.01 0.22 0.05 0.40 0.44 HNGC4088 17.0 SAB(rs)bc 4 -20.63 0.21 0.01 0.32 0.18 HNGC4192 17.0 SA(s)cd spin 6 -19.52 1.87 0.14 1.41 1.02 T2NGC4214 3.5 IAB(s)m H -17.58 3.67 0.01 0.07 0.13 HNGC4236 2.2 SB(s)dm 8 -17.18 2.04 0.03 0.17 0.44 HNGC4254 16.8 SA(s)c 5 -21.03 0.90 0.02 0.48 0.23 HNGC4273 35.1 SB(s)c 5 -20.68 0.18 0.01 0.38 0.23 HNGC4321 16.8 SAB(s)bc 4 -21.15 0.79 0.11 1.18 0.48 T2NGC4414 9.7 SA(rs)c 5 -19.31 0.58 0.14 0.59 0.50 T2NGC4490 7.8 SB(s)d pec 7 -19.65 2.55 0.12 0.25 0.71 HNGC4536 13.3 SAB(rs)bc 4 -20.04 0.33 0.03 0.47 0.36 HNGC4559 9.7 SAB(rs)cd 6 -20.17 0.35 0.03 0.42 0.40 HNGC4567 16.8 SA(rs)bc 4 -19.34 0.12 0.02 0.28 0.16 HNGC4631 6.9 SB(s)d spin 7 -20.58 1.53 0.03 0.24 0.23 HNGC5055 7.2 SA(rs)bc 4 -20.26 1.85 0.17 1.48 0.74 T2NGC5474 6.0 SA(s)cd pec 6 -17.59 1.76 0.02 0.14 0.27 HNGC5907 14.9 SA(s)c spin 5 -21.17 1.07 0.03 0.60 0.34 HNGC6946 5.5 SAB(rs)cd 6 -20.92 0.38 0.04 0.64 0.32 HIC342 3.0 SAB(rs)cd 6 -21.35 0.10 0.01 0.45 0.22 H
Columns Explanation: Col(1): Common Source Names; Col(2): Distance to the source in units of Mpc are all taken directly from H97 where
distances for objects closer than 40 Mpc are adopted from Tully & Shaya (1984) and those farther than 40 Mpc were obtained using systemic
velocities and assuming H0 = 75 km s−1 Mpc−1; Col(3): Hubble Type; Col(4): Numerical Hubble type index as listed in Ho, Filippenko, & Sargent
(1997); Col(5): Total absolute B magnitude corrected for extinction, adopted from Ho, Filippenko, & Sargent (1997); Col(6): [OIII] to Hβ ratio
taken from Ho, Filippenko, & Sargent (1997); Col(7): [OI] to Hα ratio taken from Ho, Filippenko, & Sargent (1997); Col(8): [NII] to Hα ratio
taken from Ho, Filippenko, & Sargent (1997); Col(9): [SII] to Hα ratio taken from Ho, Filippenko, & Sargent (1997); Col(10): Optical classification
of the source; “H” signifies HII region ratios, “T” represents transitional spectra between LINERs and HII regions, and “2” indicates that broad
permitted lines were not found in the optical spectrum.
region. The SH and LH maps for the observations varyin size. In Table 2, we summarize the observational de-tails for our sample. The apertures from which our fluxeswere extracted are listed in Table 2 and correspond to ei-ther the size of a single slit if the galaxy was observed asa staring observation, or the maximum overlap aperturebetween the SH and LH maps such that both the SHand LH spectra correspond to the same physical regionon the sky. For the SINGS observations, this correspondsto roughly a 23”×15” aperture. In some mapping obser-vations, the [NeV] line was detected in a small aperture,but not in the largest possible extraction region. In thesecases, the aperture used to obtain the [NeV] detectionis listed in Table 2. Here, identical apertures for boththe SH and LH modules were also used so that spec-tra from both modules corresponded to the same phys-ical region. The data presented here were preprocessedby the IRS pipeline (version 15.3) at the Spitzer ScienceCenter (SSC) prior to download. Preprocessing includesramp fitting, dark-sky subtraction, droop correction, lin-
earity correction, flat-fielding, and flux calibration1. Forall mapping observations, we used the pipeline-processed’BCD-level’ data products downloaded from the Spitzerarchive in conjunction with CUBISM v.1.52 (Kennicuttet al. 2003; Smith et al. 2004) to construct the high-resolution spectral cubes. The 2D FITS output imagesfrom CUBISM were smoothed using a Gaussian kernelof 1.5-pixel width. To extract final 1D spectra andline maps, we used the CUBEVIEW and CUBESPECtools within CUBISM. Detailed descriptions of the post-processing steps included in CUBISM are given in Smithet al. (2004). The Spitzer spectra obtained from bothstaring and mapping observations were further processedusing the SMART v. 6.2.4 analysis package (Higdon etal. 2004) and the corresponding version of the calibra-
1 See Spitzer Observers Manual, Chapter 7,http://ssc.spitzer.caltech.edu/documents/som/som8.0.irs.pdf
2 URL: http:// ssc.spitzer.caltech.edu/ archanaly/ contributed/cubism/ index.html
4
-1.5 -1.0 -0.5 0.0 0.5 1.0-1.5
-1.0
-0.5
0.0
0.5
1.0
1.5
NGC 3938
NGC 4414
NGC 3367NGC 4536 NGC 4321
NGC 5055
NGC 3556
lo
g([O
III]/H
)
log([NII]/H )
HII LINER Seyfert Transition
Filled symbols: IRS Observations
-1.5 -1.0 -0.5 0.0 0.5 1.0 1.5-1.5
-1.0
-0.5
0.0
0.5
1.0
1.5
· · · · · · · · · · · · · · · · · · · · · · · · · · · · · ··
··
··
··
·
·
·
·
·
·
·
·
·
·
NGC 4414
NGC 3938
NGC 4321NGC 5055
NGC 4536
NGC 3556
NGC 3367
log([O
III]/H
)
log([SII]/H )
HII LINER Seyfert Transition
-3.0 -2.5 -2.0 -1.5 -1.0 -0.5 0.0 0.5 1.0-1.5
-1.0
-0.5
0.0
0.5
1.0
1.5
NGC 3938
NGC 4414
NGC 3367
NGC 4321
NGC 5055
NGC 4536
NGC 3556
log(
[OIII
]/H)
log([OI]/H )
HII LINER Seyfert Transition
Fig. 2.— Standard optical line ratio diagnostic diagrams (Veilleux & Osterbrock 1987) widely used to classify AGN for the entire H97sample with our Spitzer sample represented by the filled symbols. The solid line represents the theoretical starburst limit line from Kewleyet al. 2001. This line represents the maximum line ratios possible from purely starburst photoionization models. The galaxies with [NeV]detections are labeled in the figure (see Section 4 for details). Note that most of the galaxies with [NeV] detections are to the left of thestarburst limit line, indicating that their optical line ratios are consistent purely with star formation.
tion files (v.1.4.8), which were used to obtain final linefluxes.
All of the staring observations were centered on thenucleus of the galaxy as requested, and generally corre-spond to the 2MASS nuclear coordinates.. We note thatthe SH and LH staring observations include data fromtwo slit positions overlapping by one third of a slit. Be-cause the slits occupy distinctly different regions of thesky, the flux from the slits cannot be averaged unless theemission originates from a compact source that is con-tained entirely in each slit. Therefore, the procedure forflux extraction for staring observations was the follow-ing: 1) If the fluxes measured from the two slits differedby no more than the calibration error of the instrument,then the fluxes were averaged; otherwise, the slit with thehighest measured line flux was chosen. 2) If an emissionline was detected in one slit, but not in the other, thenthe detection was selected. The slit for the SH and LHmodules is too small for background subtraction to takeplace and separate SH or LH background observationsdo not exist for any of the galaxies in this sample. Wetherefore did not perform any background subtraction
on any of the observations presented in this work. Theoverall calibration uncertainty for the fluxes we report inthis paper is 25 to 30% for all mapping observations and15% for staring observations.
4. RESULTS
4.1. Line Fluxes and Spectral Line Fits
In Table 3 we list the line fluxes, statistical errors andupper limits for the SH and LH observations for the[NeV] 14.3µm and 24.3µm lines, as well as the 26µm[OIV] line. The apertures from which these fluxes wereextracted are listed in Table 2. In all cases, detectionswere defined when the line flux was at least 3σ. We de-tected either the [NeV] 14.3µm or 24.3µm line in 7 out ofthe 32 galaxies, providing strong evidence for the pres-ence of an AGN in these galaxies.. The [OIV] 26µm line(ionization potential = 55 eV) was detected in 12 out ofthe 32 galaxies. Although this line is generally strongin powerful AGN (e.g. Genzel et al. 1998, Sturm et al.2002), it can be produced purely by photoionization byvery hot stars or shock-heated gas (Schaerer & Stasin-ska 1999) and is therefore not a definitive signature of an

5
Table 2: Observational Details
Galaxy PID Instrument Exposure Exposure Position (J2000) Extraction ExtractionName Mode Time SH Time LH RA Dec Aperture Aperture
Size SH Size LH(1) (2) (3) (4) (5) (6) (7) (8) (9)
NGC925 159 Mapping 60 60 02:27:16.90 +33:34:45.00 14×25 14×25NGC1569 117 Mapping 600 1200 04:30:49.10 +64:50:53.0 5×57 22×33NGC2276 20140 Staring 60 120 07:27:14.30 +85:45:16.00 5×11 11×22NGC2903 59 Staring 120 120 09:32:10.1 +21:30:04 5×11 11×22NGC2976 159 Mapping 60 60 09:47:15.40 +67:54:59.00 14×25 14×25NGC3034 21 Mapping 24 30 09:55:52.20 +69:40:47.00 27×27 27×27NGC3077 73 Staring 30 14 10:03:19.10 +68:44:02.00 5×11 11×22NGC3184 159 Mapping 60 60 10:18:17.00 +41:25:28.00 14×25 14×25NGC3310 14 Staring 120 120 10:38:45.96 +53:30:05.3 5×11 11×22NGC3367 59 Staring 240 120 10:46:34.96 +13:45:02.8 5×11 11×22NGC3198 159 Mapping 60 60 10:19:55.05 +45:32:59.50 14×25 14×25NGC3556 14 Staring 120 120 11:11:30.97 +55:40:26.8 5×11 11×22NGC3726 3124 Staring 240 240 11:33:21.17 +47:01:44.7 5×11 11×22NGC3938 159 Mapping 60 60 11:52:50.3 +44:07:15 5×11 11×22NGC3949 3124 Staring 240 240 11:53:41.74 +47:51:31.5 5×11 11×22NGC4088 14 Staring 120 120 12:05:34.19 +50:32:20.5 5×11 11×22NGC4192 3237 Staring 480 300 12:13:48.29 +14:54:01.2 5×11 11×22NGC4236 159 Mapping 60 60 12:16:42.10 +69:27:45.00 14×25 14×25NGC4273 20140 Staring 60 120 12:19:56.1 +05:20:35 5×11 11×22NGC4254 159 Mapping 60 60 12:18:49.60 +14:24:59.00 14×25 14×25NGC4321 159 Mapping 60 60 12:22:54.93 +15:49:21.8 27×43 31×49NGC4490 3124 Staring 240 240 12:30:36.37 +41:38:37.1 5×11 11×22NGC4414 3674 Staring 240 180 12:26:27.10 +31:13:24.7 5×11 11×22NGC4536 159 Mapping 60 60 12:34:27.35 +02:11:25.5 9×9 9×9NGC4559 159 Mapping 60 60 12:35:57.70 +27:57:35.00 14×25 14×25NGC4567 20140 Staring 60 120 12:36:32.8 +11:15:26 5×11 11×22NGC4631 159 Mapping 60 60 12:42:08.01 +32:32:29.4 16×25 16×25NGC5055 159 Mapping 60 60 13:15:49.3 +42:01:52 5×11 11×22NGC5474 159 Mapping 60 60 14:05:01.61 +53:39:44.00 14×25 14×25NGC5907 3124 Staring 240 240 15:15:53.69 +56:19:43.9 5×11 11×22NGC6946 159 Mapping 60 60 20:34:52.30 +60:09:14.00 18×31 18×31IC342 14 Staring 120 112 3:46:48.51 +68:05:46.0 5×11 11×22
Columns Explanation: Col(1): Common Source Names; Col(2): Project identification number Cols(3): Instrument mode for the observation;Col(4) & (5): Exposure time per pointing in seconds given for the SH and LH modules, respectively; Col(6) & (7): Position of peak flux of [NeV]14µm when detected and 2MASS or radio nuclear coordinates otherwise; Col(8) & (9): Extraction apertures for mapping observations could bematched using CUBISM, whereas single slit sizes are quoted for staring observations. Values given are in arcseconds.
AGN. The spectral line fits for the detected [NeV] linesas well as the [OIV] 26µm and [NeIII] 15.5µm lines, whendetected, for each of the 7 galaxies are shown in Figure3. We note that the spectral resolution of the SH and LHmodules of the IRS is insufficient to resolve the velocitystructure for most of the lines.
The optical line ratios of the galaxies with [NeV] de-tections are shown in Figure 1. As can be seen, severalof the galaxies with [NeV] detections lie significantly tothe left of the theoretical limit line from Kewley et al.(2001) indicating that there is no hint of the presence ofan AGN from the optical emission lines alone. Three outof the 7 galaxies with [NeV] detections are classified byH97 as transition objects as can be seen in Table 1. The[NeV] 14.3µm or 24.3µm line was not detected in onlyone out of the 4 transition objects in our sample.
4.2. IR Emission Line Morphologies
The signal-to-noise of the observations was insufficientto provide detailed spatial information on the [NeV]emission for all 4 of the AGN candidates with mappingobservations. However, we show in Figure 4, the detected[OIV] 26µm and [NeIII] 15.5µm images for 3 out of the4 galaxies with [NeV] detections. The signal-to-noise ra-tio corresponding to both the [OIV] and the [NeIII] forNGC3968 precluded any analysis of the spatial distribu-tion of the emission in this galaxy. This galaxy is there-fore excluded from Figure 4. The ionization potential of
OIV and NeIII are 55 eV and 41 eV, respectively. Bothspecies can be produced in gas ionized by hot stars. How-ever in all cases, centrally compact emission is observed,suggestive of an AGN origin.. Although we do not knowthe spatial morphology of the [NeV] emission, it is likelyto be similar to the centrally concentrated [OIV] and[NeIII] emission shown below. We note that there is pos-sibly one anomalous galaxy in our sample of detections.The peak of the [NeV] emission in NGC 4536 appears tobe offset from the peak of the [OIV] and [NeIII] emis-sion which both peak at the optical and 2MASS nucleus.However, the signal to noise ratio of the data severelyhampers any detailed study of the spatial distributionof the [NeV] emission in this galaxy (see Section 5.1 fordetails). We discuss each galaxy individually in Section5.1.
4.3. Line Flux Ratios and Luminosities
Since the ratio of high to low excitationlines depends on the nature of the ionizingsource, the [NeV]14µm/[NeII]12.8µm and the[OIV]25.9µm/[NeII]12.8µm line flux ratios have beenused to characterize the nature of the dominant ionizingsource in galaxies (Genzel et al. 1998; Sturm et al.2002; Satyapal et al. 2004; Dale et al. 2006). Table 4lists the [NeV]/[NeII], [NeV]/[NeIII], and [OIV]/[NeII]line flux ratios and the [NeV] 14.3µm line luminositiesfor the 7 galaxies in which either [NeV] line is detected.

6
Table 3: Fluxes for Full Sample
Galaxy [NeV] 14.32µm [NeV] 24.32µm [OIV] 25.89µmName (97.1 eV) (97.1 eV) (54.9 eV)(1) (2) (3) (4)
NGC925 <1.0 <0.48 0.63±0.19NGC1569 <0.15 <1.0 25.0±6.6NGC2276 <0.56 <0.39 <0.69NGC2903 <0.47 <2.7 <4.0NGC2976 <0.81 <0.37 <0.28NGC3034 <111.1 <250.6 <259.6NGC3077 <0.45 <0.75 <0.81NGC3184 <0.70 <0.59 0.57±0.17NGC3310 <0.38 <1.7 3.9±0.8NGC3367 1.2±0.3 0.93±0.24 0.81±0.23NGC3198 <0.80 <0.93 <0.82NGC3556 0.40±0.09 <1.1 <1.5NGC3726 <0.30 <0.66 <0.62NGC3938 <4.43 1.1±0.3 0.56±0.19NGC3949 <0.31 <0.54 0.92±0.29NGC4088 <0.39 <0.68 <0.73NGC4192 <0.59 <1.5 <1.2NGC4236 <0.85 <0.45 <0.41NGC4273 <0.62 <0.40 <1.28NGC4254 <0.90 <0.41 1.6±0.5NGC4321 2.6±0.8 <3.6 <5.6NGC4490 <0.22 <0.46 1.3±0.2NGC4414 <0.65 1.2±0.4 2.1±0.3NGC4536 0.32±0.09 <0.90 <1.2NGC4559 <0.84 <0.39 <0.40NGC4567 <0.53 <0.45 <0.54NGC4631 <2.0 <1.35 <4.7NGC5055 0.56±0.18 <0.55 1.4±0.2NGC5474 <1.1 <0.44 <0.32NGC5907 <0.23 <0.58 1.3±0.2NGC6946 <1.5 <0.39 <12.07IC342 <1.7 <15.88 <23.37
Columns Explanation: Col(1): Common Source Names; Col(2) &
(3) & (4): Fluxes are in units of 10−21 W cm−2. 3 σ upper limits are
reported for nondetections.
In NGC 3938 and NGC 4414 the [NeV] 14.3µm linewas not detected. In this case, we estimated and usein Table 4 the 14.3µm line luminosity using the [NeV]24.3µm line luminosity. The [NeV] 14.3µm and 24.3µmline luminosities are tightly correlated in a large sampleof standard optically-identified AGN recently observedby Spitzer (Dudik et al. 2007) as can be seen in Figure5. Employing a Spearman rank correlation analysis(Kendall & Stuart 1976) yields a correlation coefficientof rS = 0.97 between the [NeV] 14.3µm and 24.3µm lineluminosities, with a probability of chance correlation of6.7 × 10−12, indicating a significant correlation. Thisrelation implies similar densities to the [NeV]-emittinggas in the galaxies in the sample. The best-fit linearrelation yields:
log(L[NeV]14) = (0.995) log(L[NeV]24) + 0.0566 (1)
with an rms scatter of 0.219 dex. We note that equa-tion (1) is consistent with the relationship between the[NeV] 14.3µm and 24.3µm line luminosities in standardAGN observed by ISO (Sturm et al. 2002), as well asNGC 3367, the one galaxy in our current sample in whichboth lines were detected. The [NeV]/[NeII] line flux ra-tio for the 13 AGN with both [NeV] and [NeII] detec-tions by the Infrared Space Observatory (ISO) rangesfrom 0.06 to 2.11, with a median value of 0.47 (Sturm
et al. 2002). [NeV]/[NeII] ratios for our 7 galaxies rangefrom approximately 0.01 to 0.27, with most falling belowthe lowest value observed in standard AGN by ISO. The[OIV]/[NeII] line flux ratio for the 17 ISO AGN with bothlines detected ranges from 0.15 to 8.33, with a medianvalue of 1.73 (Sturm et al. 2002). The [OIV]/[NeII] lineflux ratio for our sample of 7 galaxies range from 0.28to 0.67, within the range observed in the nearby pow-erful AGN observed by ISO. For comparison, the fewstarburst galaxies that show detectable [OIV] emissionhave [OIV]/[NeII] line flux ratios that range from 0.006to 0.647 (median = 0.019; Verma et al. 2003) but showno [NeV] emission.
We note that when mapping observations were used,line fluxes from SH and LH maps were extracted fromidentically sized apertures. However, because the LH slitis larger than the SH slit, fluxes obtained from the SHand LH modules for staring observations correspond todifferent extraction regions. The line ratios in this workas well as those obtained from ISO are subject to aper-ture effects and should be viewed with some caution. Inparticular, the emission from lower ionization potentialspecies are likely to be more spatially extended than theemission from higher ionization potential species. Lineflux ratios from both matched and non-uniform apertureswith the SH and LH modules will therefore likely dependon the distance to the source.
Table 4 lists the [NeV] 14µm line luminosities for all 7of our galaxies. Compiling the line luminosities for thelarge (33) sample of optically identified standard AGNwith [NeV] 14µm detections recently observed by Spitzerfrom Dudik et al. (2007) and Gorijian et al. (2007) ,the [NeV] 14µm line luminosity ranges from ∼ 1×1038
ergs s−1 to ∼ 8×1042 ergs s−1 with a median value of∼ 1×1041 ergs s−1. As expected for weak AGN, theline luminosities for our candidate sample of AGN is sig-nificantly lower than that found for optically identifiedAGN. Four out of the 7 galaxies with [NeV] detectionshave luminosities below the minimum value found instandard optically identified AGN. Although NGC 4321,optically identified as a transition object, and NGC 3367both have [NeV] luminosities somewhat higher than theminimum value seen in standard AGN, they are still bothan order of magnitude less luminous than the medianvalue observed in optically identified AGN.
In Figure 6, we investigate the relationship betweenthe [OIII] λ5007 luminosity, for which extensive compi-lations are available in the literature, and the [NeV] lu-minosity in our sample of galaxies compared with stan-dard AGN. The [OIII] λ5007 emission is often assumedto originate primarily in gas ionized exclusively by theAGN and lying outside of the obscuring torus. Underthese assumptions, it has been used as a measure of theintrinsic bolometric luminosity of the AGN (e.g. Heck-man et al. 2004). As can be seen from Figure 6, thereis a significant correlation between the [OIII] and [NeV]luminosities. Employing a Spearman rank correlationanalysis for the standard AGN plotted in Figure 6 yieldsa correlation coefficient between the line luminosities ofrS = 0.84, with a probability of chance correlation of 8 ×
10−6. The best-fit linear regression yields the followingrelation:
log(L[OIII]λ5007) = (1.273) log(L[NeV]14) − 10.268 (2)
7
The [NeV] data for the ”standard AGN” plotted in Fig-ure 6 were compiled from Dudik et al. (2007), Weedmanet al. (2005), Ogle et al. (2006), Gorjian et al. (2007),Haas et al. (2005), Cleary et al. (2007), and Armus etal. (2007). The ”standard” AGN are mostly Seyfert 1galaxies, quasars, 3C radio galaxies, and a few bonafideSeyfert 2s but all LINERs were excluded. The [OIII] lu-minosities were taken from H97, Veilleux et al. (1997),and the extensive compilations of [OIII] λ5007 emissionline data from Xu et al. (1999) and Whittle (1992). Wenote that none of the line luminosities plotted in Figure6 are corrected for extinction.
There is considerable scatter in Figure 6 (rms scat-ter of 0.67 dex). This scatter is expected for a numberof reasons. Firstly, the [OIII] fluxes used in Figure 6were obtained using a wide range of apertures. Since[OIII] emission can originate in both HII regions and theAGN narrow line region, the luminosity can vary consid-erably with measurement aperture size and the distanceto the galaxy. For example, [OIII] λ5007 measurementswere recently obtained by Moustakas & Kennicutt (2006)for two of the galaxies in our sample (NGC 4321 andNGC 4414). These observations show that the [OIII]λ5007 nuclear (2.5”×2.5”) flux is roughly two orders ofmagnitude lower than the flux integrated across the op-tical extent of the galaxy. Thus, the AGN’s contribu-tion to the total luminosity is variable in the sample.Since the high ionization [NeV] line is more sensitive tothe AGN, having a negligible star formation component,variation in the [OIII]/[NeV] luminosity ratio with AGNstrength is expected. Secondly, the [OIII] luminosity isnot corrected for extinction, and although the AGN con-tribution to the [OIII] originates outside the torus, therestill can be some extinction from the host galaxy, whichis probably higher in our of galaxies sample since theyare late-type spirals. Figure 6 shows that the median[OIII]/[NeV] luminosity ratio in our sample of late-typegalaxies is roughly 20 times less than the median value ofthe ratio for the standard AGN. Assuming a foregroundscreen geometry for the obscuring material, this differ-ence in line flux ratio can be caused by an extinction ofonly AV ∼ 3 magnitudes.
4.4. IR Spectroscopic AGN Detection Rate
Using IR spectroscopy to identify AGN, counting onlythe 7 firm [NeV] detections, the detection rate of AGNin our sample of optically normal late-type galaxies is ∼
20%. However, the limited and variable signal-to-noiseof the observations leaves open the possibility that thedetection rate could be higher if the sensitivity of the ob-servations were uniform and higher. Figure 7 shows thedistribution of detections as a function of the 3σ [NeV]14µm line sensitivity. Here galaxies are included in eachbin if the 3σ line sensitivity is equal to the value listed onthe X-axis or better. Although our sample size is limited,precluding us from making statistically firm conclusions,Figure 7 suggests that the detection rate is not likelyto be greater than ∼30% even if deeper exposures wereobtained in all the observations.
From the H97 sample, out of the full sample of 486galaxies, 207 are of Hubble type Sbc and later and only16 (∼ 8%) are optically classified as AGN. Our IR spec-troscopic technique suggests that the AGN detection ratein optically normal late-type galaxies is ∼ 30% – imply-
ing that the incidence of AGN in late-type galaxies ispossibly greater than a factor of four higher than whatoptical observations alone suggest.
Amongst the 7 AGN candidates in our sample, 3 areSbc galaxies, 3 are Sc galaxies, and 1 is of Hubble typeScd. Figure 1 shows the distribution of Hubble types forthe sample with the 7 AGN candidates displayed by theshaded histogram. Since the sensitivity of the observa-tions varied across the sample, we also indicate with adownward arrow in Figure 1 the number of galaxies with[NeV] 14µm 3σ line sensitivity of 1038 ergs s−1 or better.Although the sample size is too small to make statisti-cally firm statements, we note that none of the galaxiesof Hubble type later than Scd display a [NeV] line. Un-fortunately there are only 3 galaxies of Hubble type Sd.With such limited statistics it is not possible to say howcommon it is for Sd galaxies to host AGN. A more ex-tensive mid-infrared spectroscopic survey of Sd galaxiesis crucial to obtain meaningful statistics on the numberof completely bulgeless galaxies that contain accretingSMBHs.
5. AGN ORIGIN OF THE [NEV] EMISSION
The detection of [NeV] emission from the 7 galaxieslisted in Tables 3 and 4 is highly suggestive of the pres-ence of an AGN in these galaxies. In this section, we sum-marize some of the published literature on each sourcehighlighting any previous evidence for nuclear activity.We also provide theoretical confirmation that the ori-gin of the [NeV] emission is indeed an AGN. Finally wedetermine the contribution of the AGN to the total lu-minosity.
5.1. Notes on Individual Galaxies
NGC 3367: NGC 3367 is an isolated face-on Scbarred galaxy (de Vaucouleurs et al. 1976) that is op-tically classified as an HII object. Its optical line ra-tios place it well to the left of the Kewley et al. (2001)starburst theoretical limit line as can be seen in Fig-ure 1, indicating that there is no hint of the presence ofan AGN from its optical spectrum. The aperture fromwhich the [NeV] 14.3µm line was detected in this galaxycorresponds to a projected size of ∼ 1kpc × 2.4kpc.
Although there is no hint of an AGN from opticalobservations, radio observations reveal a bipolar syn-chrotron outflow from a compact unresolved nucleus(of diameter less than 65 pc) and possibly two largelobes straddling the nucleus that extend up to ∼ 12kpc.(Garcia-Barreto et al. 1998). There are no Chandra orXMM observations of NGC 3367 but it was detected byEinstein (Fabbiano et al. 1992). The detection of the[NeV] lines in this work firmly establishes the existenceof a weak AGN in this galaxy.
There are no published observations of the central stel-lar velocity dispersion in this galaxy.
NGC 3556: NGC 3556 is an isolated edge-on Scdgalaxy (de Vaucouleurs et al. 1976) that is also opticallyclassified as an HII galaxy. As can be seen in Figure 1, itsoptical line ratios are at the extreme low-end occupied byHII galaxies, well to the left of the starburst theoreticallimit line from Kewley et al. (2001). There is thereforeabsolutely no hint of the presence of an AGN in thisgalaxy in its optical spectrum. Adopting the distance tothis galaxy from H97, the aperture from which the [NeV]

8
15.4 15.5 15.6 15.7 15.8 15.9 16.09.00E-019
9.50E-019
1.00E-018
1.05E-018
1.10E-018
1.15E-018
1.20E-018
1.25E-018
1.30E-018
1.35E-018
1.40E-018
[NeIII]
NGC3367
Flux
Den
sity
W c
m-2
m-1
Wavelength m14.3 14.4 14.5 14.6 14.7 14.8 14.9
9.40E-019
9.60E-019
9.80E-019
1.00E-018
1.02E-018
1.04E-018
1.06E-018
1.08E-018
NGC3367
[NeV]
[ClII] [HeII]
Flux
Den
sity
W c
m-2
m-1
Wavelength m
24.0 24.2 24.4 24.6 24.8 25.0 25.2 25.4
1.70E-019
1.80E-019
1.90E-019
2.00E-019
2.10E-019
2.20E-019
2.30E-019NGC3367
Flux
Den
sity
W c
m-2
m-1
Wavelength m
[FeII][NeV]
25.6 25.8 26.0 26.2 26.4 26.61.40E-019
1.50E-019
1.60E-019
1.70E-019
1.80E-019
1.90E-019
2.00E-019
2.10E-019
NGC3367
Wavelength m
Flux
Den
sity
W c
m-2
m-1
[OIV]
[FeII]
15.40 15.45 15.50 15.55 15.60 15.65 15.70 15.75 15.80 15.85
6.00E-020
8.00E-020
1.00E-019
1.20E-019
1.40E-019
1.60E-019
1.80E-019
2.00E-019
2.20E-019NGC3556
Wavelength m
Flux
Den
sity
W c
m-2
m-1
[NeIII]
14.2 14.3 14.4 14.5 14.6 14.7
7.00E-020
8.00E-020
9.00E-020
1.00E-019
1.10E-019
1.20E-019
NGC3556
Flux
Den
sity
W c
m-2
m-1
Wavelength m
[ClII][NeV]
Fig. 3.— IRS Spectra showing the detections of the [NeV] 14.3µm and/or [NeV] 24.3µm line for the 7 galaxies with detections listed inTable 3. Also shown are spectra showing the [NeIII] 15.5µm and [OIV] 26µm lines when detected for each of the galaxies.

9
23.8 24.0 24.2 24.4 24.6 24.8 25.0
4.00E-020
4.50E-020
5.00E-020
5.50E-020
6.00E-020
6.50E-020
7.00E-020
7.50E-020
NGC3938
[NeV]
Flux
Den
sity
W c
m-2
m-1
Wavelength m25.2 25.4 25.6 25.8 26.0 26.2 26.4 26.6
3.50E-020
4.00E-020
4.50E-020
5.00E-020
5.50E-020
6.00E-020
6.50E-020
[OIV]
NGC3938
Flux
Den
sity
W c
m-2
m-1
Wavelength m
15.3 15.4 15.5 15.6 15.7 15.8 15.9 16.0
4.00E-011
4.50E-011
5.00E-011
5.50E-011
6.00E-011
6.50E-011
7.00E-011
7.50E-011NGC4321
[NeIII]
Wavlength ( m)
Flu
x D
ensit
y (W
cm
-2
m-1 sr
-1)
14.1 14.2 14.3 14.4 14.5 14.6 14.7
4.60E-011
4.80E-011
5.00E-011
5.20E-011
5.40E-011
5.60E-011
NGC4321
Wavlength ( m)
Flu
x D
ensit
y (W
cm
-2
m-1 sr
-1) PAH
[ClII]
[NeV]
15.4 15.5 15.6 15.7 15.8 15.9
8.00E-011
1.00E-010
1.20E-010
1.40E-010
1.60E-010
1.80E-010
2.00E-010
NGC4536
[NeIII]
Flu
x D
ensit
y (W
cm
-2
m-1 sr
-1)
Wavlength ( m)14.0 14.2 14.4 14.6
8.50E-011
9.00E-011
9.50E-011
1.00E-010
1.05E-010
NGC4536
[NeV]
[ClII][PAH]
Flux
Den
sity
W c
m-2 m
m-1 sr
-1
Wavelength m
Fig 3.–Continued

10
15.2 15.3 15.4 15.5 15.6 15.7 15.8 15.94.00E-020
6.00E-020
8.00E-020
1.00E-019
1.20E-019
1.40E-019
1.60E-019
1.80E-019
2.00E-019
NGC5055
[NeIII]
Flux
Den
sity
W c
m-2 m
m-1
Wavelength m13.8 14.0 14.2 14.4 14.6 14.8
4.00E-020
5.00E-020
6.00E-020
7.00E-020
8.00E-020
9.00E-020
NGC5055
PAH[ClII]
[NeV]
Flux
Den
sity
W c
m-2
m-1
Wavelength m
25.4 25.6 25.8 26.0 26.2 26.4 26.6 26.81.00E-019
1.10E-019
1.20E-019
1.30E-019
1.40E-019
1.50E-019
1.60E-019
1.70E-019NGC5055
[FeII][OIV]
Flux
Den
sity
W c
m-2
m-1
Wavelength m15.3 15.4 15.5 15.6 15.7 15.8 15.9 16.0
6.00E-020
8.00E-020
1.00E-019
1.20E-019
1.40E-019
1.60E-019
NGC4414
[NeIII]
Flux
Den
sity
W c
m-2
m-1
Wavelength m
24.0 24.1 24.2 24.3 24.4 24.5 24.6 24.7 24.81.40E-019
1.50E-019
1.60E-019
1.70E-019
1.80E-019
1.90E-019
2.00E-019
2.10E-019NGC4414
Wavelength m
Flux
Den
sity
W c
m-2
m-1
[FeII][NeV]
25.4 25.6 25.8 26.0 26.2 26.4 26.6
1.50E-019
1.60E-019
1.70E-019
1.80E-019
1.90E-019
2.00E-019
2.10E-019
2.20E-019
2.30E-019
NGC4414
Flux
Den
sity
W c
m-2
m-1
Wavelength m
[FeII][OIV]
[CoII]
Fig 3.–Continued

11
Fig. 4.— (a) The [NeIII] 15.5µm continuum-subtracted image of NGC 4321. Contour overlays of the archival IRAC 8µm image arealso shown and display the prominent circumnuclear star formation ring in this galaxy. Note that there are two components to the [NeIII]emission–one that follows the circumnuclear ring and a compact centrally concentrated component likely originated from gas ionized by theAGN. (b) The [OIV] 26µm continuum-subtracted image of NGC 4321 with contour overlays of the [NeII] 12.8µm emission. Note that the[NeII] emission traces the circumnuclear ring but the [OIV] emission is compact and centrally concentrated highly suggestive of an AGNorigin. (c) The [NeIII] 15.5µm continuum-subtracted image of NGC 4536. (d) The [OIV] 26µm continuum-subtracted image of NGC 4536.The emission appears to be associated with the nucleus however the [NeV] emission seems to be offset from the nuclear coordinates. SeeSection 5.1 for details. (e) The [NeIII] 15.5µm continuum-subtracted image of NGC 5055 (f) The [OIV] 26µm continuum-subtracted imageof NGC 5055. The cross in all images indicates the nuclear coordinates from the 2MASS database. Note that in all images the emission isconcentrated and centered on the nucleus, suggesting an AGN as the ionizing source.

12
38.0 38.5 39.0 39.5 40.0 40.5 41.0 41.5 42.0 42.538.0
38.5
39.0
39.5
40.0
40.5
41.0
41.5
42.0
42.5
log(
L[N
eV]1
4m
erg
s/s)
log(L[NeV]24 m ergs/s)
Standard AGN from Dudik et al. (2007)
Fig. 5.— The [NeV] 14.3µm line luminosity as a function of the[NeV] 24.3µm line luminosity in known AGN that currently have[NeV] observations (Dudik et al. 2007). The figure clearly showsa strong correlation. The Spearman rank correlation coefficientbetween the 14.3µm and 24.3µm line luminosities is S = 0.97, witha probability of chance correlation of 6.7 × 10⁻¹², indicating asignificant correlation. The rms scatter in the relation is 0.219dex.
14.3µm line was detected corresponds to a projected sizeof ∼320pc×770pc.
There is some previously published data that may beconsistent with a weak AGN as well as strong nuclear starformation in this galaxy. Chandra observations reveal nu-merous X-ray point sources scattered around the centralregions with one source coincident with the optical nu-cleus that has a power-law X-ray spectrum typical for anAGN (Wang, Chaves, & Irwin 2003). Prominent extra-planar diffuse X-ray emission is seen with substructuresimilar to that seen in Hα images (Collins et al. 2000)possibly representing superbubbles of hot gas heated inmassive star-forming regions.
There are no published observations of the central stel-lar velocity dispersion in this galaxy.
NGC 3938: NGC 3938 is a nearly face-on Sc galaxy(de Vaucouleurs et al. 1976) at a distance of 17 Mpc(Tully & Shaya 1984) that is also optically classifiedas an HII galaxy. The [NeV] 24.3µm and the [OIV]26µm lines were detected in this source in a ∼11′′×22′′
aperture which corresponds to a projected size of ∼
0.9kpc×1.8kpc.There are scattered HII regions in the central regions of
this galaxy (Jimnez-Vicente et al. 1999) but no publishedevidence for AGN activity. The nucleus was undetectedat 6 cm (Ulvestad & Ho 2002) and there are no publishedX-ray observations of this source.
The central stellar velocity dispersion in this galaxy is40 km/s (Bottema 1988).
NGC 4321:NGC 4321 is an Sbc spiral galaxy (de Vau-couleurs et al. 1976) at a distance of 16.8 Mpc (Tully &Shaya 1984). At this distance, the aperture from whichthe [NeV] 14.3µm line was detected corresponds to a pro-jected size of ∼ 0.9kpc×1.4kpc. This galaxy is opticallyclassified as a transition object with no broad lines de-tected (H97), implying that there is no firm evidence foran AGN based solely only its optical spectrum.
Previously published multiwavelength observations re-veal no signs of AGN activity in this galaxy . There areseveral published radio observations displaying extendedemission (Filho, Barthel & Ho 2000, 2006), but no evi-dence for a compact flat spectrum radio core (Nagar et al.2002). The nucleus is not detected by Chandra and theupper limit to the 2-10 keV luminosity is LX ∼ 3.6×1038
ergs s−1 (Dudik et al. 2005) implying that the AGN is ei-ther weak or highly absorbed in the X-rays. Mid-infrared(Wozniak et al. 1998), optical (Pierce 1986), Hα (Knap-pen et al. 1995), and CO (Rand 1995) observations dis-play a prominent circumnuclear ring of star formation ac-tivity which is also seen in the IRAC and [NeII] images(see Figure 4). However, the emission from the higherionization potential [NeIII] and [OIV] lines are clearlycentrally concentrated and compact, strongly suggestiveof AGN activity in the nucleus.
The central stellar velocity dispersion in this galaxy is83±12 km/s (Whitmore & Kirshner 1981).
NGC 4414: NGC 4414 is a relatively isolated floccu-lent Sc galaxy (de Vaucouleurs et al. 1976) that is opti-cally classified as a transition object with no broad linesdetected (H97). There is therefore no firm evidence foran AGN based solely only its optical spectrum. Its op-tical line ratios are very close to the Kewley et al.(2001)starburst theoretical limit line as can be seen in Figure1.
There are no published observations of NGC 4414 sug-gesting that it contains an AGN. This source was notdetected at radio frequencies by Filho, Barthel, & Ho(2006) and arcsecond resolution VLA observations re-veal a diffuse radio morphology (Filho, Barthel, & Ho2002). There is also no indication of intense nuclear starformation. Based on its infrared and Hα luminosities, itis not classified as a starburst. In fact, Hα images show acentral hole, indicating that there is no nuclear star for-mation (Pogge 1989) in this galaxy. Although there is noevidence for powerful star formation activity, HI and COobservations indicate that it has one of the highest diskneutral surface gas densities known (Braine, Combes, &van Driel 1993).
The central stellar velocity dispersion in this galaxy is128 ± 9 km/s (Barth, Ho, & Sargent 2002).
NGC 4536: NGC 4536 is a barred late-type spiral(SABbc; de Vaucouleurs et al. 1976) which based onHST imaging, shows no evidence of a classical bulgebut instead has a surface brightness profile consistentwith a pseudobulge that seems to exhibit spiral struc-ture (Fisher 2006). This galaxy is optically classified byH97 as an HII galaxy. We detected the [NeV] 14.3µmline in this galaxy from a ∼ 580pc×580pc region (adopt-ing the distance to NGC 4536 from H97) approximately10′′north-east of the optical nucleus of the galaxy. Thisis the only galaxy in our sample for which the [NeV]emission seems to originate from a location that doesnot coincide with the optical nucleus as listed in NED.The [OIV] 26µm and [NeIII] 15.5 µm emission howeveris centrally concentrated with a peak that is offset fromthe location of the [NeV] emission and is closer to theoptical nucleus than defined in NED as can be seen fromFigure 4. The [OIV] 26µm line was not detected in thesame aperture from which the [NeV] 14.3µm line was de-tected; the [OIV] flux is therefore listed as an upper limitin Tables 3 and 4 but is displayed in Figure 4. We note

13
Table 4: Line Ratios and Luminosities of AGN Candidate Galaxies
Galaxy Projected Projected [NeV] 14.32µm [NeV] 14.32µm [OIV] 25.89µm L[NeV]Name Aperture Aperture [NeII] 12.81µm [NeIII] 15.56µm [NeII] 12.81µm 14.32µm
Size SH (kpc) Size LH (kpc)(1) (2) (3) (4) (5) (6) (7)
NGC3367 .99x2.4 2.3x4.7 0.010±0.003 0.117±0.035 0.007±0.002 39.415NGC3556 .32x.77 .76x1.5 0.017±0.004 0.126±0.030 <0.063 37.950NGC3938† .39x.93 .91x1.8 0.457±0.149 >0.053 0.314±0.113 38.426NGC4321 2.2x3.5 2.5x4.0 0.016±0.005 0.134±0.041 <0.035 38.913NGC4414† .22x.53 .52x1.0 0.154±0.048 0.391±0.123 0.361±0.050 37.980NGC4536‡ .58x.58 .58x.58 0.012±0.003 0.062±0.017 <0.047 37.803NGC5055 .16x.39 .39x.78 0.108±0.035 0.206±0.068 0.279±0.041 37.516
Note. — Columns Explanation: Col(1): Common Source Names; Col(2): Dimensions of the extraction region from theSH observation; Col(3): Dimensions of the extraction region from the LH observation; Col(4): Ratio of flux of [NeV] 14.32µmto [NeII] 12.81µm; uncertainties reported in columns 4, 5, and 6 are based on calibration uncertainties on the line flux of 30%for mapping observations and 15% for staring. Col(5): Ratio of flux of [NeV] 14.32µm to [NeIII] 15.56µm . Col(6): Ratio of fluxof [OIV] 25.89µm to [NeII] 12.81µm ; upper limits provided for non-detections based on 3-sigma upper limit for [OIV]. Col(7):Log of luminosity of [NeV] 14.32µm in units of erg s−1.†Flux of [NeV] 14.32µm estimated using [NeV] 24.32µm flux, ac-
cording to equation 1, see section 4.3.‡[NeV] 14.32µm emitting region does not overlap with 2MASS
nuclear coordinates, See Table 2 for exact coordinates.
that the sensitivity of the current mapping observationof NGC 4536 is insufficient to conduct a full explorationof the spatial morphology of the [NeV] emission in thisgalaxy. Deeper IRS mapping observations are criticalto confirm the exact peak of the [NeV] emission in thisgalaxy.
Apart from the [NeV] detection reported in this work,to the best of our knowledge, there is only one previ-ously published observation of NGC 4536 that hints atthe possibility of nuclear activity in this galaxy. The op-tical line ratios obtained using recent high spatial res-olution STIS spectroscopy suggests the presence of aweak AGN (Hughes et al. 2005). There is abundantevidence for powerful nuclear star formation in NGC4536. Its high far-infrared luminosity, strong Hα (Pogee1989), Brγ (Puxley, Hawarden, & Mountain 1988), and10.8µm (Telesco, Dressel, & Wolstencroft 1993) emis-sion all suggest vigorous star formation in the central ∼20′′×30′′region. The radio emission shows a diffuse mor-phology with 3 separate peaks (Vila et al. 1990, Laine etal. 2006), possibly representing an annular ring of starformation surrounding the nucleus. However, Laine et al.(2006) suggest based on HST data that the radio clumpsare close to the nucleus in projection but none correspondto the nucleus itself. This morphology is similar to thatseen at 10.8µm (Telesco, Dressel, & Wolstencroft 1993)as well as in the 1-0 S(1) molecular hydrogen line (Davies,Sugai, & Ward 1997). We note that the variable reso-lution of most published observations, coupled with thefact that this galaxy is nearly edge-on and has an intri-cate central complex of emission at various wavelengthsmakes it very difficult to confirm the spatial coincidenceof the various sources.
The galaxy was detected by Einstein (Fabbiano, Kim,& Trinchieri 1992). ROSAT HRI data reveal 2 ultra-luminous X-ray sources (ULXs), one of which may becoincident with the optical nucleus (Ji-Feng & Bregman2005). It is not possible based on existing X-ray obser-vations to determine if this source is consistent with anAGN. The galaxy was not observed by Chandra.
36 37 38 39 40 41 42 43 44
36
37
38
39
40
41
42
43
44
45
46
lo
g(L(
OII
I)er
gs/s
)
log(L([NeV]ergs/s))
Standard AGN Our Sample
Fig. 6.— The [OIII] λ5007 line luminosity versus the[NeV]14.3µm line luminosity for standard optically identified AGNand our sample of galaxies. There is a significant correlation be-tween the luminosities. The Spearman rank correlation coefficientbetween the line luminosities is S = 0.84, with a probability ofchance correlation of 8 × 10⁻⁶, indicating a significant correlation.The rms scatter in the relation is 0.67 dex.
Our observations provide strong motivation to conductan extensive high-spatial resolution investigation at in-frared and x-ray wavelengths of NGC 4536 to determinethe exact location of the peak of the [NeV] emission andto confirm its association with an AGN in this galaxy.
The central stellar velocity dispersion in this galaxy is84 ± 1 km/s (Batcheldor et al. 2005).
NGC 5055: NGC 5055 is an Sbc spiral galaxy (deVaucouleurs et al. 1976) at a distance of 7.2 Mpc (Pierce1994). At this distance, the aperture from which the[NeV] 14.3µm line was detected corresponds to a pro-jected size of ∼170pc×380pc. This galaxy is opticallyclassified as a transition object with no broad lines de-

14
Fig. 7.— The distribution of galaxies with [NeV] detections as afunction of limiting line sensitivity. Plotted on the X-axis is the logof the 3σ limiting [NeV] 14µm line sensitivity in units of ergs s−1.Galaxies are included in each bin if the sensitivity of the obser-vations is equal to or better than the value listed. Detections areindicated by the shaded histogram. As can be seen, the detectionrate at a limiting sensitivity of 1038 ergs s−1 is close to 30%
tected (H97). Hence, there is no firm evidence for anAGN based solely only its optical spectrum.
The evidence for AGN activity at other wavelengths isinconclusive. The nucleus is not detected at a number ofradio frequencies except at 57.5 MHz with a flux densityof 2.1 Jy (Israel & Mahoney 1990), implying that thesource is radio-quiet. A central UV source is detected,however high resolution HST observations show that itis resolved with a radius of ∼ 7 pc (Maoz et al. 1995)and shows no variability (Maoz et al. 2005). The UVemission from this galaxy is therefore most likely dom-inated by a nuclear star cluster. Chandra observationsreveal the presence of numerous point sources scatteredacross the nuclear region and a bright hard point sourcecoincident with the optical and infrared nucleus (Flohicet al. 2006; Luo et al. 2007). Flohic et al. (2006) ar-gue that the spectrum of this source is well-fitted by atwo-temperature plasma model suggesting that the X-rayemission is powered by stellar processes. Conversely, Luoet al. (2007) report that the central source is well-fittedby an absorbed power law with a spectral index typicalof an AGN. The [NeV] detection reported in this workprovides firm confirmation of an AGN in this galaxy.
The central stellar velocity dispersion associated withthe bulge in this galaxy is 103±6 km/s (Hraudeau.&Simien 1998.)
5.2. Model Fits to the Mid-IR Fine Structure LineFluxes: The Power of the AGN
The mid-infrared fine structure line fluxes presentedhere can be modeled using photoionization models toconfirm the AGN origin of the [NeV] emission and, inprinciple, estimate the contribution of the AGN to thebolometric luminosities in the 7 galaxies with [NeV] de-tections. We use the spectral synthesis code Cloudy (Fer-land et al. 1998) to model the mid-IR spectrum emittedby gas ionized by both an input AGN radiation field anda young starburst. The modeling, along with a moreextensive exploration of parameter space, is described
in detail by Abel & Satyapal (2007). In short, we as-sume a typical AGN radiation field with a continuumshape characterized by the standard UV bump and X-ray power law as given in Korista et al. (1997). The stel-lar continuum is chosen to be a 4 Myr continuous star-formation model with a Salpeter initial mass function(IMF) and star formation rate of 1 M⊙yr−1, generatedusing the Starburst99 website (Leitherer et al. 1999). Wehave chosen conservatively to employ starburst param-eters that generate the hardest ionizing radiation field.This selection results in the maximum contribution of thestarburst to the high-ionization line fluxes. Our modelsassume a simple plane-parallel geometry with constantdensity typical of HII regions (log(n)=2.5 cm−3). Theionization parameter, U - the dimensionless ratio of ion-izing flux to gas density - is varied, along with percentcontribution of the AGN to the total luminosity. Theemission line ratios are most sensitive to changes in theseparameters. We emphasize that this is a simple model, presented here with the intent of illustrating the effectthe AGN luminosity has on the infrared and optical lineratios and to show that the mid-infrared line fluxes forour sample of 7 galaxies with [NeV] detections cannot beexplained by pure photoionization by a starburst, evenwhen an extreme starburst SED is adopted.
Figure 8 shows the predicted[NeV]14.3µm/[NeII]12.8µm flux ratio versus the [OI]/Hα and [SII]/ Hα optical line flux ratios for varyingvalues of U and AGN luminosity contribution, alongwith the observed values for all 7 galaxies. We displayonly a narrow range of ionization parameters thatgenerate line flux ratios within the range observed in oursample of galaxies. A more extensive grid of theoreticalcalculations, with all standard optical line flux ratiosplotted, is presented in Abel & Satyapal (2007). Asexpected, Figure 8 shows that when the ionization pa-rameter is held constant, the [NeV]14.3µm/[NeII]12.8µmflux ratio increases dramatically as the AGN luminos-ity fraction increases. Indeed, for logU=-2.5, the[NeV]14.3µm/[NeII]12.8µm flux ratio increases by over5 orders of magnitude as the AGN luminosity fractionincreases from 3% to 100%. In contrast, the optical lineflux ratios vary by only a factor of ∼ 10. Note thatwhen the AGN luminosity fraction increases from 0.1%to 10%, there is essentially no change in the opticalline flux ratios. Figure 8 clearly shows that infrareddiagnostic ratios are much more sensitive to weak AGNthan optical diagnostic ratios. This regime of parameterspace is clearly best explored using the high ionizationmid-infrared emission line fluxes presented in this work.
Surprisingly, when the AGN luminosity fraction goesto zero, [NeV] emission is still produced exclusively bythe starburst. The production of Ne4+ requires photonswith energies > 97eV, typically not produced by hot O-stars. However, an extremely young starburst with alarge population of Wolf-Rayet and O stars, can producesignificant emission in the extreme ultraviolet (Schaerer& Stasinka 1999; see Abel & Satyapal (2007) for a moreextensive discussion of this result ). However, as canbe seen from Figure 8, it is impossible to replicate theobserved mid-infrared and optical line flux ratios in oursample of 7 galaxies with purely a starburst ionizationradiation field. An AGN contribution is required to ex-
15
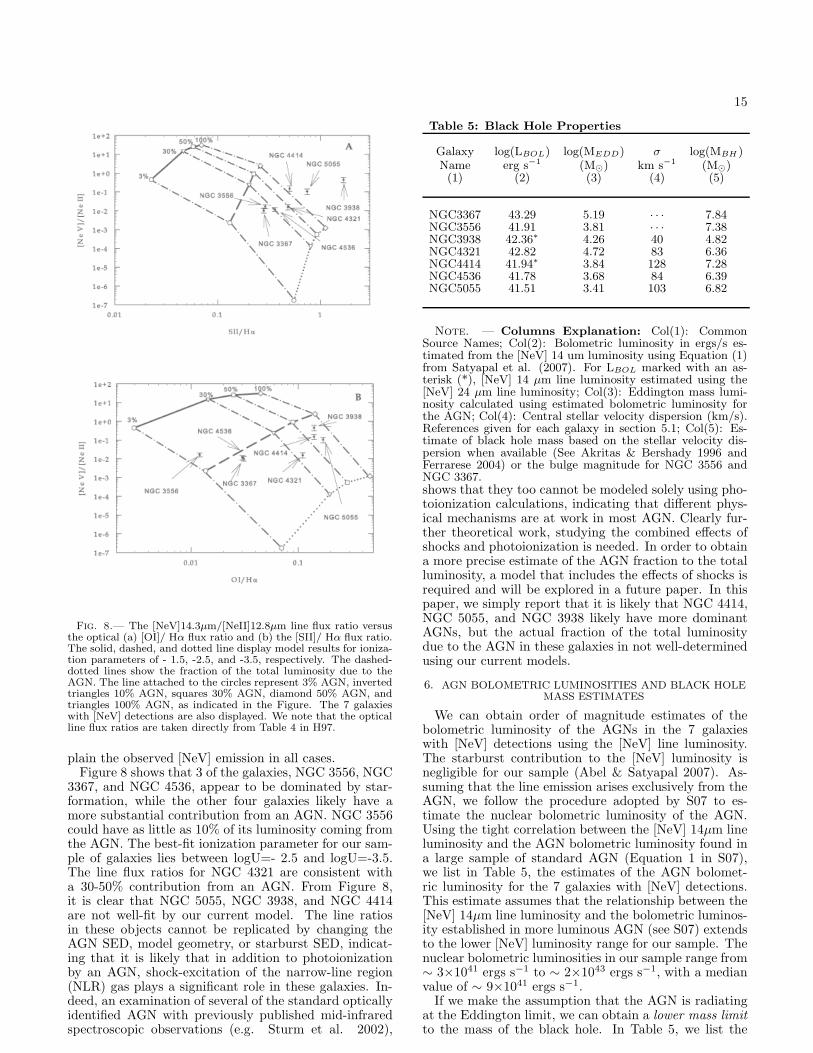
Fig. 8.— The [NeV]14.3µm/[NeII]12.8µm line flux ratio versusthe optical (a) [OI]/ Hα flux ratio and (b) the [SII]/ Hα flux ratio.The solid, dashed, and dotted line display model results for ioniza-tion parameters of - 1.5, -2.5, and -3.5, respectively. The dashed-dotted lines show the fraction of the total luminosity due to theAGN. The line attached to the circles represent 3% AGN, invertedtriangles 10% AGN, squares 30% AGN, diamond 50% AGN, andtriangles 100% AGN, as indicated in the Figure. The 7 galaxieswith [NeV] detections are also displayed. We note that the opticalline flux ratios are taken directly from Table 4 in H97.
plain the observed [NeV] emission in all cases.Figure 8 shows that 3 of the galaxies, NGC 3556, NGC
3367, and NGC 4536, appear to be dominated by star-formation, while the other four galaxies likely have amore substantial contribution from an AGN. NGC 3556could have as little as 10% of its luminosity coming fromthe AGN. The best-fit ionization parameter for our sam-ple of galaxies lies between logU=- 2.5 and logU=-3.5.The line flux ratios for NGC 4321 are consistent witha 30-50% contribution from an AGN. From Figure 8,it is clear that NGC 5055, NGC 3938, and NGC 4414are not well-fit by our current model. The line ratiosin these objects cannot be replicated by changing theAGN SED, model geometry, or starburst SED, indicat-ing that it is likely that in addition to photoionizationby an AGN, shock-excitation of the narrow-line region(NLR) gas plays a significant role in these galaxies. In-deed, an examination of several of the standard opticallyidentified AGN with previously published mid-infraredspectroscopic observations (e.g. Sturm et al. 2002),
Table 5: Black Hole Properties
Galaxy log(LBOL) log(MEDD) σ log(MBH )Name erg s−1 (M⊙) km s−1 (M⊙)(1) (2) (3) (4) (5)
NGC3367 43.29 5.19 · · · 7.84NGC3556 41.91 3.81 · · · 7.38NGC3938 42.36∗ 4.26 40 4.82NGC4321 42.82 4.72 83 6.36NGC4414 41.94∗ 3.84 128 7.28NGC4536 41.78 3.68 84 6.39NGC5055 41.51 3.41 103 6.82
Note. — Columns Explanation: Col(1): CommonSource Names; Col(2): Bolometric luminosity in ergs/s es-timated from the [NeV] 14 um luminosity using Equation (1)from Satyapal et al. (2007). For LBOL marked with an as-terisk (*), [NeV] 14 µm line luminosity estimated using the[NeV] 24 µm line luminosity; Col(3): Eddington mass lumi-nosity calculated using estimated bolometric luminosity forthe AGN; Col(4): Central stellar velocity dispersion (km/s).References given for each galaxy in section 5.1; Col(5): Es-timate of black hole mass based on the stellar velocity dis-persion when available (See Akritas & Bershady 1996 andFerrarese 2004) or the bulge magnitude for NGC 3556 andNGC 3367.shows that they too cannot be modeled solely using pho-toionization calculations, indicating that different phys-ical mechanisms are at work in most AGN. Clearly fur-ther theoretical work, studying the combined effects ofshocks and photoionization is needed. In order to obtaina more precise estimate of the AGN fraction to the totalluminosity, a model that includes the effects of shocks isrequired and will be explored in a future paper. In thispaper, we simply report that it is likely that NGC 4414,NGC 5055, and NGC 3938 likely have more dominantAGNs, but the actual fraction of the total luminositydue to the AGN in these galaxies in not well-determinedusing our current models.
6. AGN BOLOMETRIC LUMINOSITIES AND BLACK HOLEMASS ESTIMATES
We can obtain order of magnitude estimates of thebolometric luminosity of the AGNs in the 7 galaxieswith [NeV] detections using the [NeV] line luminosity.The starburst contribution to the [NeV] luminosity isnegligible for our sample (Abel & Satyapal 2007). As-suming that the line emission arises exclusively from theAGN, we follow the procedure adopted by S07 to es-timate the nuclear bolometric luminosity of the AGN.Using the tight correlation between the [NeV] 14µm lineluminosity and the AGN bolometric luminosity found ina large sample of standard AGN (Equation 1 in S07),we list in Table 5, the estimates of the AGN bolomet-ric luminosity for the 7 galaxies with [NeV] detections.This estimate assumes that the relationship between the[NeV] 14µm line luminosity and the bolometric luminos-ity established in more luminous AGN (see S07) extendsto the lower [NeV] luminosity range for our sample. Thenuclear bolometric luminosities in our sample range from∼ 3×1041 ergs s−1 to ∼ 2×1043 ergs s−1, with a medianvalue of ∼ 9×1041 ergs s−1.
If we make the assumption that the AGN is radiatingat the Eddington limit, we can obtain a lower mass limitto the mass of the black hole. In Table 5, we list the

16
lower limits to the black hole mass based on the AGNbolometric luminosity estimates. The Eddington massestimates in our sample range from ∼ 3×10³M⊙ to ∼
1.5×10⁵M⊙ with a median value of ∼ 7×10³M⊙.In order to determine if the lower mass limits derived
for the black hole mass are incompatible with the MBH -σ relation, assuming a linear extrapolation to the massrange of our sample, we also list in Table 5, the expectedblack hole masses using the published central stellar ve-locity dispersions, when available, for our sources. In theabsence of published central stellar velocity dispersionmeasurements, we list in Table 5 black hole masses ex-pected using the bulge magnitude assuming the updatedcalibration of the Magorrian relationship from Ferrarese& Ford (2005). Estimates for the bulge magnitude inthese cases are taken directly from Table 11 of H97 andare crude estimates based on the morphological type ofthe galaxy and its total luminosity. In all cases, our lowermass limit is below the black hole mass estimate basedon the MBH -σ relation, by a factor of ∼ 4 to three or-ders of magnitude, indicating that our results are notnecessarily inconsistent with the MBH -σ relation.
7. SUMMARY AND CONCLUSIONS
We conducted a mid-infrared spectroscopic investiga-tion of 32 late-type (Hubble type of Sbc or later) galaxiesshowing no definitive signatures of AGN in their opticalspectra in order to search for low luminosity and/or em-bedded AGN. The primary goal of our study was deter-mine if AGN in low-bulge environments are more com-mon than once thought. Our high resolution Spitzerspectroscopic observations reveal that the answer to thisquestion is yes. Our main results are summarized below:
1. We detected the high ionization [NeV] 14.3µmand/or 24.3µm lines in 7 late-type galaxies, pro-viding strong evidence for AGNs in these galaxies.
2. We detected the high excitation [OIV] 25.9µm and[NeIII] 15.5µm lines in 5 out of the 7 of the galaxieswith [NeV] emission. Although these lines can beexcited in star forming regions, our mapping ob-servations (when available) suggest that the emis-sion is centrally concentrated and likely to be dom-inated by the AGN.
3. Taking into account the range of sensitivities of ourobservations, our work suggests that the AGN de-tection rate based on mid-infrared diagnostics inlate-type optically normal galaxies can be as muchor more than ∼ 30%. This detection rate impliesthat the overall fraction of late-type galaxies host-ing AGN is possibly more than 4 times larger thanwhat optical spectroscopic observations alone sug-gest.
4. Several of the galaxies with [NeV] detections haveoptical emission line ratios in the extreme “star-burst range” indicating that there is absolutely nohint of an AGN based on their optical spectra.Three out of the 7 galaxies are classified based ontheir optical line ratios as “transition objects” butnone show broad permitted optical lines.
5. Amongst the 7 AGN candidates in our sample, 3are Sbc, 3 are Sc, and 1 is of Hubble type Scd.
Since there are only 3 galaxies of Hubble type Sd,our limited sample size precludes us from makingany definitive conclusions on the incidence of AGNin completely bulgeless galaxies. The lowest cen-tral stellar velocity dispersion amongst the galaxieswith published measurements is 40 km/s.
6. We demonstrate using photoionization models withboth an input AGN and an extreme EUV-brightstarburst ionizing radiation field that the observedmid-infrared line ratios in our 7 AGN candidatescannot be replicated unless an AGN contributionis included. These models show that when the frac-tion of the total luminosity due to the AGN is low,the optical diagnostics are insensitive to the pres-ence of the AGN. In this regime of parameter space,the mid-infrared diagnostics offer a powerful tool inuncovering AGN missed by optical spectroscopy.
7. Three of the galaxies, NGC 3556, NGC 3367,and NGC 4536, appear to be dominated by star-formation. NGC 3556 could have as little as 10% ofits luminosity coming from the AGN. NGC 4321,NGC 5055, NGC 3938, and NGC 4414 likely havea more dominant contribution to their luminosityfrom the AGN in addition to having some contribu-tion to their emission line fluxes from shock-excitedgas. All of the galaxies that H97 classifies as HIIgalaxies are well characterized by a low AGN con-tribution, while all the transition objects seem torequire some shock component.
8. The AGN bolometric luminosities inferred usingour [NeV] line luminosities range from ∼ 3×1041
ergs s−1 to ∼ 2×1043 ergs s−1, with a median valueof ∼ 9×1041 ergs s−1. Assuming that the AGN isradiating at the Eddington limit, this corresponds alower mass limit for the black hole that ranges from∼ 3×10³M⊙ to as high as ∼ 1.5×10⁵M⊙. Theselower mass limits however do not put a strain onthe well-known relationship between the black holemass and the host galaxys stellar velocity disper-sion established in predominantly early-type galax-ies.
The Spitzer spectroscopic study presented here demon-strates that black holes do form and grow in low-bulge en-vironments and that they are significantly more commonthan optical studies indicate. In order to truly determinehow common SBHs and AGN activity are in completelybulgeless galaxies, a more extensive study with Spitzer iscrucial.
We are very thankful to Diana Marcu and BrianO’Halloran for their invaluable help in the data analysisand to Jackie Fischer, Mario Gliozzi, and Rita Sambrunafor their enlightening and thoughtful comments. We arealso very grateful to Kartik Sheth and Daniel Dale forvery helpful support with our questions about calibra-tion and to the Spitzer helpdesk for numerous emails insupport of our data analysis questions. We are also verygrateful for the helpful comments from the referee, whichimproved this paper. This research has made use ofthe NASA/IPAC Extragalactic Database (NED) which

17
is operated by the Jet Propulsion Laboratory, Califor-nia Institute of Technology, under contract with the Na-tional Aeronautics and Space Administration. SS grate-fully acknowledges financial support from NASA grant
NAG5-11432. NA gratefully acknowledges NSF grant0094050 and 0607497. RPD gratefully acknowledges fi-nancial support from the NASA Graduate Student Re-search Program.
REFERENCES
Abel & Satyapal, 2007, submitted to ApJ, 2007Akritas, M. G. & Bershady, M. A. 1996, ApJ, 470, 706Armus, L., Charmandaris, V., Bernard-Salas, J., Spoon, H. W. W.,
et al. 2007, ApJ, 656..148Batcheldor, D. et al. 2005, ApJS, 160, 76Barth, A., Ho, L., & Sargent, W. 2002, AJ, 124, 2607Barth, A., Ho, L., & Sargent, W. 2004, ASPC, 311, 91Bottema, R., 1988, A&A, 197, 105Braine, J., Combes, F., & van Driel, W. 1993, A&A, 280, 451Cleary, K., Lawrence, C., Marshall, J., Hao, L., & Meier, D. 2007,
ApJ, 660, 117Collins, J. A., Rand, R. J., Duric, N., & Walterbos, R. A. M. 2000,
ApJ, 536, 645Dale. D.A. & The SINGs Team 2006, ApJ, 646, 161Davies, R. I., Sugai, H., & Ward, M. J. 1997, MNRAS, 291, 314de Vaucouleurs, G. et al., 1976, Second Reference Catalogue of
Bright Galaxies RC2Dudik, R.P., Satyapal, S., Gliozzi, M., & Sambruna, R.M. 2005,
ApJ, 620, 113Dudik, R. P. et al. 2007, ApJ, 664, 71Fabbiano, G., Kim, D.W., & Trinchieri, G. 1992, ApJS, 80, 531Ferland, G. J. et al. 1998, PASP, 110, 761Ferrarese, L. & Merritt, D., 2000, ApJ, 539, 9Ferrarese, L. & Ford, H. 2005, SSRv, 116, 523Ferrarese, L. 2004, ASSL, 308, 1Filho, M.E., Barthel, P.D., & Ho, L.C. 2000, ApJS, 129, 93Filho, M.E., Barthel, P.D., & Ho, L.C. 2006, A&A, 451, 71Filippenko, A.V. & Ho, L.C. 2003, ApJ, 588, 13Fisher, D. B. 2006, ASPC, 352, 237Flohic, H., Eracleous, M., Chartas, G., Shields, J.C., & Moran,
E.C. 2006, ApJ, 647, 140Garca-Barreto, J. A., Rudnick, L., Franco, J., & Martos, M. 1998,
AJ, 116, 111Gebhardt, K. et al. 2000, ApJ, 539, 13Gebhardt, K. et al. 2001, AJ, 122, 2469
Genzel, R. et al. 1998, ApJ, 498, 579Gorjian, V., Cleary, K., Werner, M. W., & Lawrence, C. R. 2007,
ApJ, 655, 73Greene,J.E.; Ho,L.C., 2004, ApJ, 610, 722Greene,J.E.; Ho,L.C., 2007, ApJ, 670, 72Haas, M., Siebenmorgen, R., Schulz, B., Krugel, E., & Chini, R.
2005, A&A, 442, L39Heckman, T.M. 1980, A&A, 87, 152Heckman, T. M., Kauffmann, G., Brinchmann, J., Charlot, S., et
al. 2004, ApJ, 613, 109Heraudeau, P. & Simien, F. 1998, A&AS, 133, 317Higdon, S.J.U. et al. 2004, PASP, 116, 975Ho, L.C. et al. 1997, ApJS, 112, 315Ho, L. C., Filippenko, A.V., & Sargent, W.L.W. 1997, ApJS, 112,
315Houck, J. R. et al. 2004, ApJS, 154, 18Hughes, M. A. et al. 2005, AJ, 130, 73Israel, F.P. & Mahoney, M.J. 1990, ApJ, 352, 30Jimnez-Vicente, J., Battaner, E., Rozas, M., Castaeda, H.,
&Porcel, C. 1999, A&A, 342, 417
Kauffmann, G. et al., 2003, MNRAS, 346, 1055Kauffmann, G. & Haehnelt, M. 2000, MNRAS, 311, 576Keel, W.C. 1983, ApJ, 269, 466Kendall, M., & Stuart, A. 1976, In: The Advanced Theory of
Statistics, Vol. 2, (New York: Macmilli an)Kennicutt, R. C. & The SINGs Team, 2003, PASP, 115, 928Kewley, L.J., Dopita, M.A., Sutherland, R.S., Heisler, C.A., &
Trevena, J. 2001, ApJ, 556, 121Korista, K., Ferland, G., & Baldwin, J. 1997, ApJ, 487, 555Knapen, J.H., Beckman, J.E., Heller, C.H., Shlosman, I., & de
Jong, R.S. 1995, ApJ, 454, 623Laine, S., Kotilainen, J. K., Reunanen, J., Ryder, S. D., & Beck,
R. 2006, AJ, 131, 701Leitherer, C. et al. 1999, ApJS, 123, 3Liu, J. F., Bregman, J. N. 2005, ApJS, 157, 59
Luo, B. et al. 2007, ChJAA, 7, 335Maoz, D. et al. 1995, ApJ, 440, 91Maoz, D., Nagar, N.M., Falcke, H., & Wilson, A.S. 2005, ApJ, 625,
699Merritt, D., Ferrarese, L., & Joseph, C.L. 2001, Sci, 293,1116Moustakas, J., Kennicutt, R. C., Jr., 2006, ApJS, 164, 81Nagar, N.M., Falcke, H., Wilson, A.S., & Ulvestad, J.S. 2002, A&A,
392, 53Ogle, P., Whysong, D., & Antonucci, R. 2006, ApJ, 647, 161Pierce, M.J. 1994, ApJ, 430, 53Pierce, M.J. 1986, AJ, 92, 285Pogge, R. W. 1989, ApJ, 345, 730Puxley, P. J., Hawarden, T. G., & Mountain, C. M. 1988, MNRAS,
231, 465Rand, R.J. 1995, AJ, 109, 2444Satyapal, S., Sambruna, R. M., & Dudik, R. 2004, A&A, 414, 825Satyapal, S., Vega, D., Heckman, T., OHalloran, B., Dudik, R.
2007, ApJ, 663, 9Schaerer, D., Stasi?ska, G. 1999, A&A, 345, 17Silk, J. & Rees, M. J., 1998, A&A, 331, 1Smith, J. D. T. & The SINGs Team, 2004, ApJS, 154, 199Sturm, E. et al. 2002, A&A, 393, 821Telesco, C. M., Dressel, L. L., & Wolstencroft, R. D. 1993, ApJ,
414, 120Terlevich, R., Melnick, J., & Moles, M. 1987 IAUS, 121, 499Tully, R.B. & Shaya, E.J. 1984, ApJ, 281, 31Ulvestad, J.S., & Ho, L.C. 2002, ApJ, 581, 925Veilleux, S. & Osterbrock, D.E. 1987, ApJS, 63, 295Veilleux, S., Sanders, D. B.; Kim, D.-C., 1997, ApJ, 484, 92Verma, A. et al. 2003, A&A, 403, 829Vila, M. B., Pedlar, A., Davies, R. D., Hummel, E., & Axon, D. J.
1990, MNRAS, 242, 379Wang, Q.D., Chaves, T., Irwin, J.A. 2003, ApJ, 598, 969Weedman, D. W., et al. 2005, ApJ, 633, 706Whitmore, B.C. & Kirshner, R.P. 1981, ApJ, 250, 43WWhittle, M., 1992, ApJS, 79, 49Wozniak, H., Friedli, D., Martinet, L., & Pfenniger, D. 1998, A&A,
330, 5Xu, C., Livio, M., Baum, S., 1999, AJ, 118, 1169
Related Documents