Figure 1. Photograph looking upstream at the south fish ladder and training spill from bay 18, Bonneville Dam, April 4, 2006. Spill bay 18 South fish ladder Bradford Island “B” Branch Fish Ladder

Spill bay 18
Dec 30, 2015
Spill bay 18. Bradford Island “B” Branch Fish Ladder. South fish ladder. Figure 1. Photograph looking upstream at the south fish ladder and training spill from bay 18, Bonneville Dam, April 4, 2006. Spill bay 1. Cascade Island North fish ladder. - PowerPoint PPT Presentation
Welcome message from author
This document is posted to help you gain knowledge. Please leave a comment to let me know what you think about it! Share it to your friends and learn new things together.
Transcript
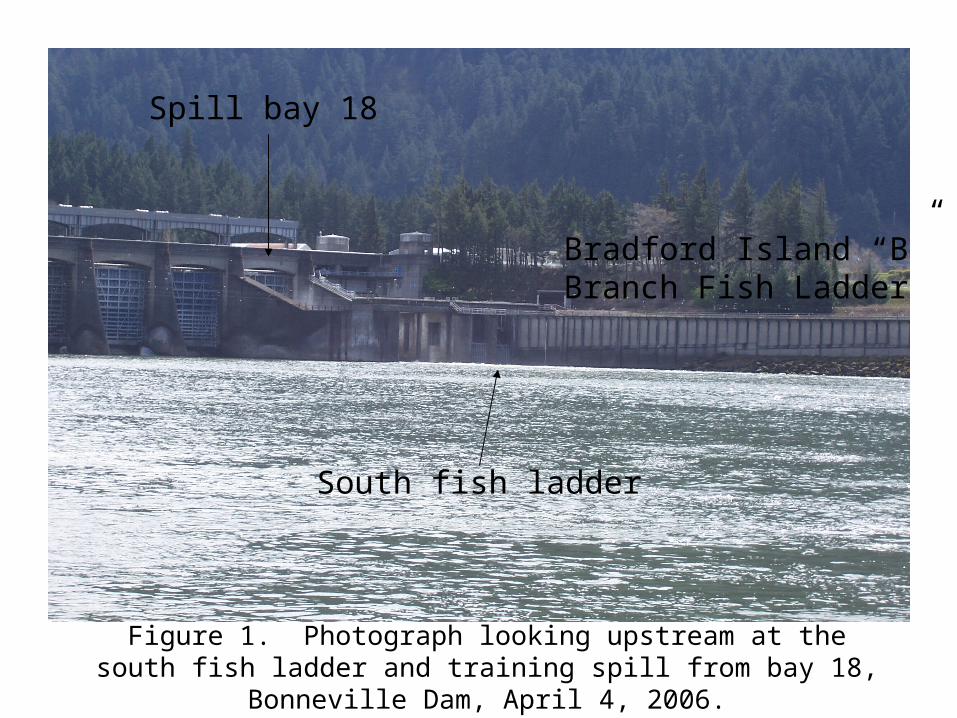
Figure 1. Photograph looking upstream at the south fish ladder and training spill from bay 18, Bonneville Dam, April 4, 2006.
Spill bay 18
South fish ladder
Bradford Island “B”Branch Fish Ladder

Figure 2. Photograph looking upstream at the north fish ladder and training spill from bay 1, Bonneville Dam, April 4, 2006.
Spill bay 1
Cascade IslandNorth fish ladder

Figure 3. TDG pressure and project operations measured at the Bonneville Dam forebay and tailwater fixed monitoring stations, April 4, 2006.

ABC
Figure 4. South fish ladder deployment sketch

Figure 5. Photograph of the entrance of the south fish ladder (positions A and B), Bonneville Dam, April 4, 2006.
A
B
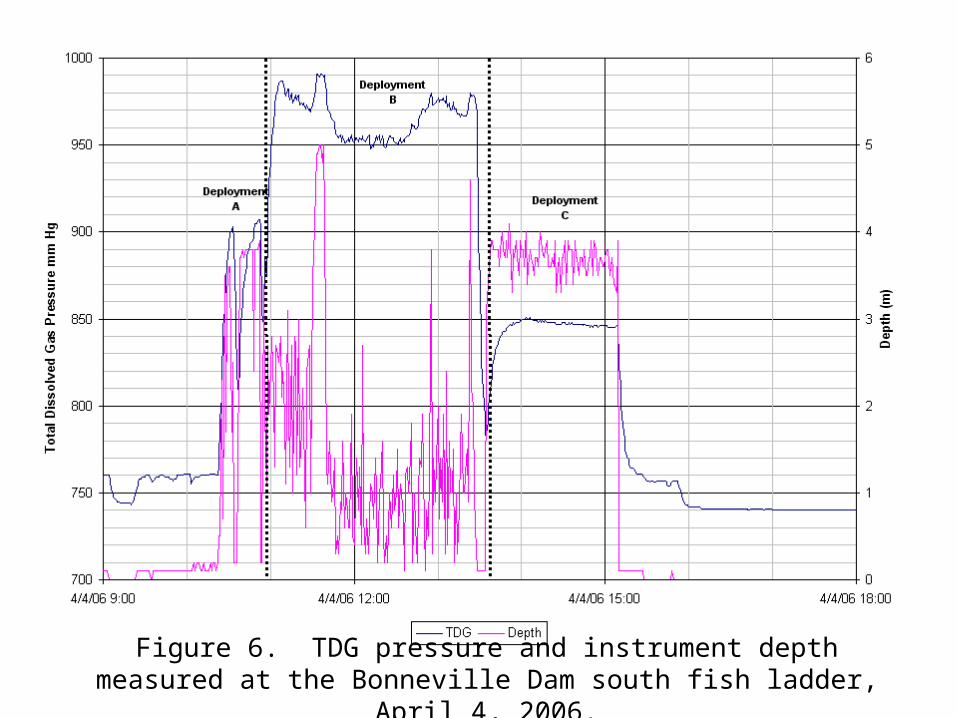
Figure 6. TDG pressure and instrument depth measured at the Bonneville Dam south fish ladder, April 4, 2006.

Figure 7. TDG saturations and instrument depth measured at the Bonneville Dam south fish ladder, April 4, 2006.

DE
F
Figure 8. North fish ladder deployment sketch

Figure 9. TDG pressure and instrument depth measured at the Bonneville Dam north fish ladder, April 4, 2006.

Figure 10. TDG saturations and instrument depth measured at the Bonneville Dam north fish ladder, April 4, 2006.

Figure 11. Photograph of the north fish ladder (positions E and F), Bonneville Dam, April 4, 2006.
E
F
Related Documents