ORIGINAL RESEARCH ARTICLE published: 19 December 2012 doi: 10.3389/fnhum.2012.00330 Speeding up the brain: when spatial facilitation translates into latency shortening Anne-Lise Paradis 1,2,3,4 *, Shasha Morel 1,5,6 , Peggy Seriès 7 and Jean Lorenceau 1,2,3,4 * 1 UPMC Univ Paris 06, UMR-S975 UMR 7225, Centre de Recherche en Neuroscience, Equipe Cogimage, Paris, France 2 Inserm U 975, Centre de Recherche en Neuroscience, Equipe Cogimage, Paris, France 3 CNRS UMR 7225, Centre de Recherche en Neuroscience, Equipe Cogimage, Paris, France 4 ICM, Equipe Cogimage, Paris, France 5 Laboratoire de Psychopathologie et Neuropsychologie, Université Paris 8, Saint-Denis, France 6 Centre de NeuroImagerie de Recherche - CENIR, CRICM, UPMC/Inserm UMR-975, CNRS 7225, Hôpital Pitié-Salpêtrière, Paris, France 7 School of Informatics, Institute for Adaptive and Neural Computation, The University of Edinburgh, Edinburgh, UK Edited by: Srikantan S. Nagarajan, University of California, San Francisco, USA Reviewed by: Sophie Molholm, Albert Einstein College of Medicine, USA Brian P. Keane, Rutgers University Center for Cognitive Science, USA *Correspondence: Anne-Lise Paradis or Jean Lorenceau, Centre de Recherche en Neurosciences, ICM, Equipe Cogimage, 47 bd de l’hôpital, F75005, Paris, France. e-mail: [email protected]; [email protected] Waves of activity following a focal stimulation are reliably observed to spread across the cortical tissue. The origin of these waves remains unclear and the underlying mechanisms and function are still debated. In this study, we ask whether waves of activity modulate the magnetoencephalography (MEG) signals recorded in humans during visual stimulation with Gabor patches sequentially flashed along a vertical path, eliciting a perception of vertical apparent motion. Building upon the functional properties of long-rang horizontal connections, proposed to contribute to spreading activity, we specifically probe the amplitude and latency of MEG responses as a function of Gabor contrast and orientation. The results indicate that in the left hemisphere the response amplitude is enhanced and the half height response latency is shortened for co-aligned Gabor as compared to misaligned Gabor patches at a low but not at a high contrast. Building upon these findings, we develop a biologically plausible computational model that performs a “spike time alignment” of the responses to elongated contours with varying contrast, endowing them with a phase advance relative to misaligned contours. Keywords: horizontal connections, magnetoencephalography (MEG), contrast, contour detection, cortical latencies, neural facilitation, activity propagation INTRODUCTION Recent optical imaging and electrophysiological recordings in cat and monkey reported waves of activity propagating slowly across the visual cortex after a focal visual stimulation (Grinvald et al., 1994; Bringuier et al., 1999; Jancke et al., 2004; Benucci et al., 2007; Nauhaus et al., 2008, 2012; Meirovithz et al., 2010; Chavane et al., 2011). The distance travelled and the speed of these waves depend on contrast, with lower contrast eliciting slower waves propagating over larger distances (Nauhaus et al., 2009; Meirovithz et al., 2010). Whether these waves play a role in visual processing remains unclear and the underlying mechanisms are still debated (Ray and Maunsell, 2011; Nauhaus et al., 2012). In cortical space, traveling speeds are relatively slow (0.1–1 m/s, Grinvald et al., 1994; Jancke et al., 2004; Benucci et al., 2007; Sharon et al., 2007). These speeds are commensurable with the estimates of propagation speeds through thin unmyelinated long- range axons running parallel to the cortical surface (Bringuier et al., 1999; Bullier, 2001; Hupé et al., 2001a), suggesting that long-range lateral connections contribute to wave propagation (Bringuier et al., 1999; Benucci et al., 2007; Nauhaus et al., 2009, 2012). If true, the functional architecture of lateral connections could constrain the wave dynamics and provide hints on their functional role. Key aspects to take into consideration are the speed of propagation through horizontal long-range connections as well as orientation and contrast that shape the responses of neurons linked by lateral connections. Extensive electrophysiological (Kapadia et al., 1995, 1999, 2000; Polat et al., 1998), anatomical (Gilbert and Wiesel, 1989; Sincich and Blasdel, 2001), psychophysical (Field et al., 1993; Kovács and Julesz, 1993; Polat and Sagi, 1993, 1994; Alais and Lorenceau, 2002; Hess et al., 2003; Cass and Alais, 2006), and modeling (review in Seriès et al., 2002) approaches converge to suggest that long-range horizontal cortical connections in primary visual cortex embed a sophisticated mechanism for processing visual contours, reminiscent of the principle of good continuation proposed by the Gestalt psychology (Koffka, 1935; Kellman and Shipley, 1991; Chavane et al., 2000). Anatomically, intrinsic long-range lateral connections extend over large dis- tances (up to 8 mn, Gilbert and Wiesel, 1983; Fitzpatrick, 1996; Schmidt et al., 1997; Cavanaugh et al., 2002; Levitt and Lund, 2002) and link cells with non-overlapping recep- tive fields, predominantly neurons belonging to iso-orientation columns (Gilbert and Wiesel, 1979, 1983; Malach et al., 1993; Bosking et al., 1997; Levitt and Lund, 1997; Sincich and Blasdel, 2001). Horizontal connections are inhibitory as well as excitatory (Hirsch and Gilbert, 1991), although the majority of the postsy- naptic effects of long-range intra-cortical interactions are exci- tatory (Nelson and Frost, 1985; Kisvarday et al., 1986; McGuire Frontiers in Human Neuroscience www.frontiersin.org December 2012 | Volume 6 | Article 330 | 1 HUMAN NEUROSCIENCE

Welcome message from author
This document is posted to help you gain knowledge. Please leave a comment to let me know what you think about it! Share it to your friends and learn new things together.
Transcript
ORIGINAL RESEARCH ARTICLEpublished: 19 December 2012
doi: 10.3389/fnhum.2012.00330
Speeding up the brain: when spatial facilitation translatesinto latency shorteningAnne-Lise Paradis1,2,3,4*, Shasha Morel 1,5,6, Peggy Seriès7 and Jean Lorenceau1,2,3,4*
1 UPMC Univ Paris 06, UMR-S975 UMR 7225, Centre de Recherche en Neuroscience, Equipe Cogimage, Paris, France2 Inserm U 975, Centre de Recherche en Neuroscience, Equipe Cogimage, Paris, France3 CNRS UMR 7225, Centre de Recherche en Neuroscience, Equipe Cogimage, Paris, France4 ICM, Equipe Cogimage, Paris, France5 Laboratoire de Psychopathologie et Neuropsychologie, Université Paris 8, Saint-Denis, France6 Centre de NeuroImagerie de Recherche - CENIR, CRICM, UPMC/Inserm UMR-975, CNRS 7225, Hôpital Pitié-Salpêtrière, Paris, France7 School of Informatics, Institute for Adaptive and Neural Computation, The University of Edinburgh, Edinburgh, UK
Edited by:
Srikantan S. Nagarajan, University ofCalifornia, San Francisco, USA
Reviewed by:
Sophie Molholm, Albert EinsteinCollege of Medicine, USABrian P. Keane, Rutgers UniversityCenter for Cognitive Science, USA
*Correspondence:
Anne-Lise Paradis or JeanLorenceau, Centre de Recherche enNeurosciences, ICM, EquipeCogimage, 47 bd de l’hôpital,F75005, Paris, France.e-mail: [email protected];[email protected]
Waves of activity following a focal stimulation are reliably observed to spread across thecortical tissue. The origin of these waves remains unclear and the underlying mechanismsand function are still debated. In this study, we ask whether waves of activity modulatethe magnetoencephalography (MEG) signals recorded in humans during visual stimulationwith Gabor patches sequentially flashed along a vertical path, eliciting a perception ofvertical apparent motion. Building upon the functional properties of long-rang horizontalconnections, proposed to contribute to spreading activity, we specifically probe theamplitude and latency of MEG responses as a function of Gabor contrast and orientation.The results indicate that in the left hemisphere the response amplitude is enhancedand the half height response latency is shortened for co-aligned Gabor as comparedto misaligned Gabor patches at a low but not at a high contrast. Building upon thesefindings, we develop a biologically plausible computational model that performs a “spiketime alignment” of the responses to elongated contours with varying contrast, endowingthem with a phase advance relative to misaligned contours.
Keywords: horizontal connections, magnetoencephalography (MEG), contrast, contour detection, cortical
latencies, neural facilitation, activity propagation
INTRODUCTIONRecent optical imaging and electrophysiological recordings incat and monkey reported waves of activity propagating slowlyacross the visual cortex after a focal visual stimulation (Grinvaldet al., 1994; Bringuier et al., 1999; Jancke et al., 2004; Benucciet al., 2007; Nauhaus et al., 2008, 2012; Meirovithz et al., 2010;Chavane et al., 2011). The distance travelled and the speed of thesewaves depend on contrast, with lower contrast eliciting slowerwaves propagating over larger distances (Nauhaus et al., 2009;Meirovithz et al., 2010). Whether these waves play a role in visualprocessing remains unclear and the underlying mechanisms arestill debated (Ray and Maunsell, 2011; Nauhaus et al., 2012).In cortical space, traveling speeds are relatively slow (0.1–1 m/s,Grinvald et al., 1994; Jancke et al., 2004; Benucci et al., 2007;Sharon et al., 2007). These speeds are commensurable with theestimates of propagation speeds through thin unmyelinated long-range axons running parallel to the cortical surface (Bringuieret al., 1999; Bullier, 2001; Hupé et al., 2001a), suggesting thatlong-range lateral connections contribute to wave propagation(Bringuier et al., 1999; Benucci et al., 2007; Nauhaus et al., 2009,2012). If true, the functional architecture of lateral connectionscould constrain the wave dynamics and provide hints on theirfunctional role. Key aspects to take into consideration are thespeed of propagation through horizontal long-range connections
as well as orientation and contrast that shape the responses ofneurons linked by lateral connections.
Extensive electrophysiological (Kapadia et al., 1995, 1999,2000; Polat et al., 1998), anatomical (Gilbert and Wiesel, 1989;Sincich and Blasdel, 2001), psychophysical (Field et al., 1993;Kovács and Julesz, 1993; Polat and Sagi, 1993, 1994; Alais andLorenceau, 2002; Hess et al., 2003; Cass and Alais, 2006), andmodeling (review in Seriès et al., 2002) approaches convergeto suggest that long-range horizontal cortical connections inprimary visual cortex embed a sophisticated mechanism forprocessing visual contours, reminiscent of the principle of goodcontinuation proposed by the Gestalt psychology (Koffka, 1935;Kellman and Shipley, 1991; Chavane et al., 2000). Anatomically,intrinsic long-range lateral connections extend over large dis-tances (up to 8 mn, Gilbert and Wiesel, 1983; Fitzpatrick,1996; Schmidt et al., 1997; Cavanaugh et al., 2002; Levittand Lund, 2002) and link cells with non-overlapping recep-tive fields, predominantly neurons belonging to iso-orientationcolumns (Gilbert and Wiesel, 1979, 1983; Malach et al., 1993;Bosking et al., 1997; Levitt and Lund, 1997; Sincich and Blasdel,2001). Horizontal connections are inhibitory as well as excitatory(Hirsch and Gilbert, 1991), although the majority of the postsy-naptic effects of long-range intra-cortical interactions are exci-tatory (Nelson and Frost, 1985; Kisvarday et al., 1986; McGuire
Frontiers in Human Neuroscience www.frontiersin.org December 2012 | Volume 6 | Article 330 | 1
HUMAN NEUROSCIENCE
Paradis et al. Speeding up the brain
et al., 1991; Kapadia et al., 1999; Polat et al., 1998). In V1,stimulation in a cell’s receptive field and in its surround showsthat response modulation by remote stimuli depends on con-trast and distance (Kapadia et al., 1995, 2000; Polat et al., 1998).Stimulation away from the receptive field of a recorded neurondoes not elicit spiking activity in itself and only modulates theresting membrane potential (Nelson and Frost, 1985; Ts’o et al.,1986; Kapadia et al., 1995; Polat et al., 1998). Neural facilitationis observed with low-contrast stimuli while suppression domi-nates at high contrasts (Kapadia et al., 1999). Suppression or weakfacilitation has been reported for non-collinear arrangements.Moreover, neurons tuned to the same orientation but with dis-tant or not aligned receptive fields do not facilitate each other(Kapadia et al., 1995, 2000; Polat et al., 1998; Ito and Gilbert,1999).
These converging anatomical and electrophysiological studiessuggest that long-range horizontal connections underlie the inte-gration of elongated contours (Field et al., 1993; Polat and Sagi,1993, 1994; Polat et al., 1998; Kapadia et al., 1999, 2000) and that“association fields” (Field et al., 1993) are the basis of an inferenceprocess whereby a neuron activated by its preferred orientationpropagates its “belief” that neighboring neurons should also beco-activated, given the statistical distribution of orientations innatural images (Geisler et al., 2001).
Most investigations of the temporal dynamics of contour cod-ing (Usher and Donnelly, 1998; Beaudot, 2002; Polat and Sagi,2006) varied the temporal asynchrony between co-aligned targetelement and randomly oriented non-target elements, with dis-crepant results. Usher and Donnelly (1998) reported enhancedcontour detection for asynchronous target and background, butBeaudot (2002) did not replicate this finding and suggests itresults from a strong priming effect when the target is pre-sented first. However both studies used high contrast stimulitogether with a path detection task where subjects have toreport the presence or the position of several co-aligned ele-ments. Polat and Sagi (2006) measured the detection thresholdfor a Gabor target flanked by high contrast Gabors while vary-ing the temporal offset between the target and the flankers.The temporal asymmetry they report is interpreted as reflect-ing the different speed of excitation and inhibition. However,the use of double flash presentations—target followed or pre-ceded by distractors—and high contrast stimuli may not bebest suited to test the intrinsic dynamics of long-range inter-actions, as they mainly reflect interactions between a maskingbackground and a target rather than estimate the flow of activ-ity along long-range connections. Cass and Alais (2006) useda clever psychophysical paradigm where subjects must detect astatic target Gabor flashed with varying time offset while flankerGabors rotate over time. Plotting the contrast threshold as afunction of phase lag they derive an optimal facilitative delayfor target-flanker interactions commensurable with electrophys-iological estimates of the propagation speed through long-rangeinteractions.
The aim of the magnetoencephalography (MEG) experimentdetailed below is twofold: (1) to investigate whether waves ofactivity modulate the latency and amplitude of MEG recordingsin humans and (2) to test whether these hypothetical modulations
depend on contrast and orientation, as would be expected if thenetwork of long-range horizontal connections is involved.
In order to probe the effects of wave propagation on theamplitude and latency of cortical responses, it is desirable that thetemporal course of the visual stimulation closely matches theircortical speed so as to maximize the interactions between lat-eral and feedforward inputs. Moreover, the stimulation shouldremain in a reasonable range to ensure it can be perceptuallyprocessed. To convert cortical speed into motion in visual space,one must take into account the magnification factor, M, whichvaries with eccentricity and between species (Seriès et al., 2002).Taking an estimate of M between 2 and 5 mm/deg, correspondingto an eccentricity of 2–6◦ for human retino-cortical projection(Dow et al., 1981; Sereno et al., 1995), leads to visual speeds rang-ing between 20 and 500◦/s. Although this speed range is wide, itis worth noting that slow cortical waves correspond to very fastmotion in visual space, at least much faster than usual ecologicalmotion encountered in natural vision.
Electrophysiological recordings (Bringuier et al., 1999; Frégnacet al., 2010), psychophysical (Georges et al., 2002) and model-ing (Seriès et al., 2002) studies suggest that when two co-alignedGabor patches are flashed sequentially in two neighboring loca-tions, the lateral activity propagated by the first patch can facilitatethe response to the second patch provided that the temporal andspatial separations as well as the relative orientation between bothGabors are appropriately set. As this sequential stimulation alsoelicits a percept of apparent motion we shall refer to motionstimulation in the following. We relied on these previous stud-ies to choose the speed, orientation and contrast of fast apparentmotion sequences presented left or right from a fixation crossand examined whether the amplitude and the latency of MEGresponses depend on propagating activity within the network ofhorizontal long-range connections.
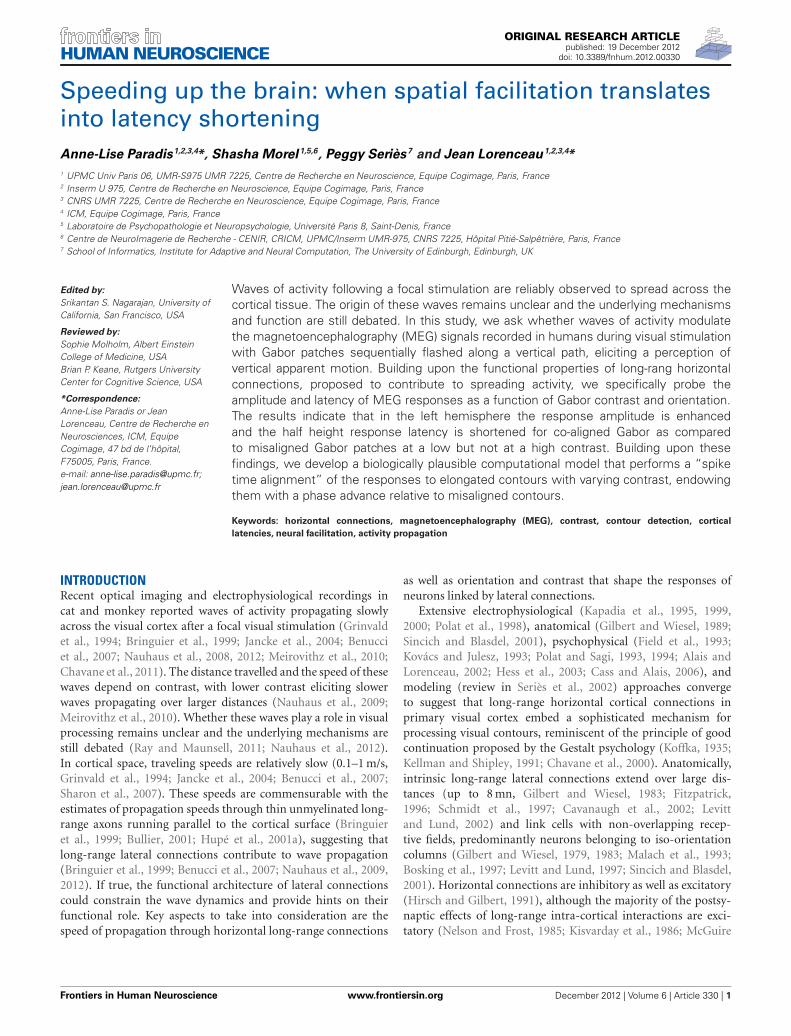
Specifically, we tested whether spreading facilitation elicits ashortening of the response latency to incoming inputs. In themodel of Seriès et al. (2002), long-range facilitation, propagat-ing slowly through thin non-myelinited axons running horizontalto the cortical surface, depolarizes neurons’ membrane potentialafter a delay. As a consequence, whenever a neuron is activated, itsends facilitating signals to neighboring neurons with similar ori-entation preference and receptive fields co-aligned in visual space(Figure 1).
This depolarizing wave, although it does not produce spikingresponses in itself, reduces the time-to-firing threshold of neu-rons to subsequent feed-forward inputs, and thus their firinglatency. This effect of depolarization on response latency increaseswith decreased contrast because time-to-threshold is longer at alow than at a high contrast. Crucially, the model predicts thatlow-contrast co-aligned Gabor patches presented in successionelicit neuronal responses with a shorter delay than misalignedGabor patches. This effect should occur whenever lateral andfeed-forward inputs temporally coincide, hence when successivestimulations are separated by short time intervals, and shoulddecrease at high contrast because time-to-threshold is too shortto be significantly modulated by lateral inputs in this case.
In the following, we test these predictions by analyzing theMEG response of humans passively viewing low or high contrast
Frontiers in Human Neuroscience www.frontiersin.org December 2012 | Volume 6 | Article 330 | 2
Paradis et al. Speeding up the brain
FIGURE 1 | Illustration of the hypothesis. Responses of two orientationselective V1 neurons with co-aligned non-overlapping receptive fieldsstimulated in succession. Cell 1, stimulated first at time t1, depolarizes itsneighbors through long-range horizontal connections with slow propagationspeed (green arrow). Stimulation of the depolarized cell 2 at time t2 resultsin shortened response latency (L2), as compared to the response latency ofcell 1 to the first input (L1).
Gabor patches briefly flashed in successive positions along thevertical axis, depending on whether these patches are parallel ororthogonal to the vertical axis.
METHODS AND PROTOCOLPARTICIPANTSTen volunteers (five men and five women), aged 22–28, par-ticipated in the study after giving their informed consent, andreceived financial compensation for their participation. All wereright-handed, had a normal vision without correction andwere naive with respect to the stimuli. Four had a left oculardominance.
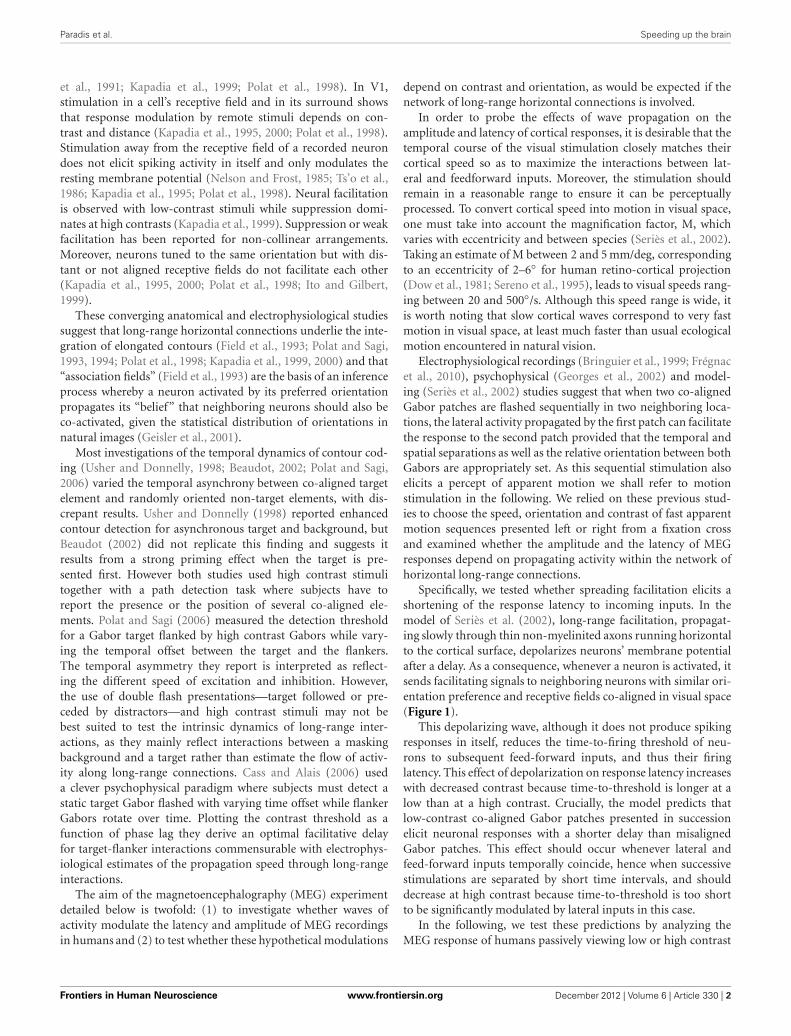
STIMULATIONThe stimuli consisted of Gabor patches displayed in sequencealong a vertical axis located 2 degrees right or left from a cen-tral fixation, and inducing a fast apparent downward motion at64◦/s. In each trial, two fixation periods flanked this sequence(see Figure 2A). Each patch subtended 1.6◦ of visual angle (dvathereafter). Their mean luminance was the same as the back-ground (189 Cd/m2) but was modulated horizontally or verti-cally with a spatial frequency of 1.5 cycle per degree (cpd), andtheir contrast followed a Gaussian profile (σ = 0.32 dva; seePolat and Sagi, 1993). The Gabor patches were either orthog-onal to the vertical apparent motion path (#) or parallel toit (//). Depending on the conditions, the maximal Michelsoncontrast of the patches was 50% (“High” contrast) or 20%(“Low” contrast, see Figure 2B). These values are derived fromour previous psychophysical study (Georges et al., 2002), chosento be largely above threshold while entailing significantly differ-ent neural response latencies (as indicated in electrophysiologicalstudies, e.g., Gawne et al., 1996). Stimuli were back projected ona screen, via a mirror system, using a calibrated Mitsubishi X120projector (60 Hz refresh rate) located outside the shielded room.
Subjects underwent seven blocks of 6 min, each comprising 128trials, corresponding to 16 repetitions of the four conditions ineach hemi-field, for a total of 112 trials per condition. The orderof presentation of the conditions was randomized across blocks.
Subjects were given no other task than to stare at the fixa-tion point and to avoid moving their head or blinking as longas the fixation point was on the screen. The ISI was long enough(random duration between 1300 and 1600 ms) to allow blinkingduring this period.
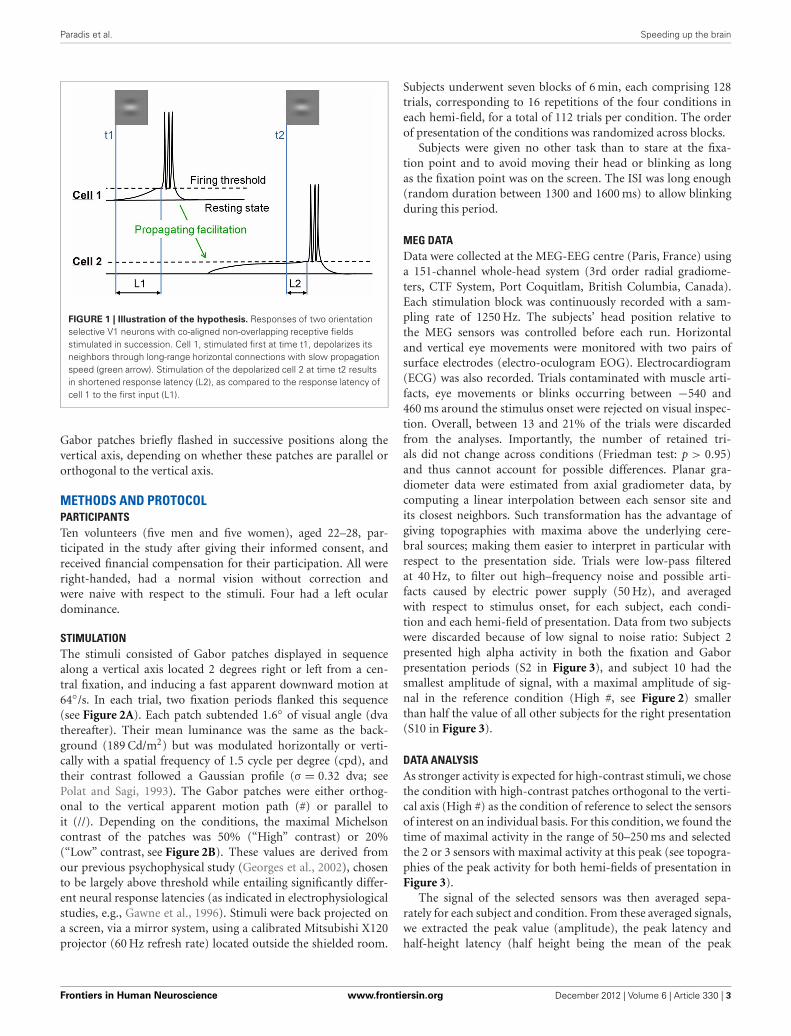
MEG DATAData were collected at the MEG-EEG centre (Paris, France) usinga 151-channel whole-head system (3rd order radial gradiome-ters, CTF System, Port Coquitlam, British Columbia, Canada).Each stimulation block was continuously recorded with a sam-pling rate of 1250 Hz. The subjects’ head position relative tothe MEG sensors was controlled before each run. Horizontaland vertical eye movements were monitored with two pairs ofsurface electrodes (electro-oculogram EOG). Electrocardiogram(ECG) was also recorded. Trials contaminated with muscle arti-facts, eye movements or blinks occurring between −540 and460 ms around the stimulus onset were rejected on visual inspec-tion. Overall, between 13 and 21% of the trials were discardedfrom the analyses. Importantly, the number of retained tri-als did not change across conditions (Friedman test: p > 0.95)and thus cannot account for possible differences. Planar gra-diometer data were estimated from axial gradiometer data, bycomputing a linear interpolation between each sensor site andits closest neighbors. Such transformation has the advantage ofgiving topographies with maxima above the underlying cere-bral sources; making them easier to interpret in particular withrespect to the presentation side. Trials were low-pass filteredat 40 Hz, to filter out high–frequency noise and possible arti-facts caused by electric power supply (50 Hz), and averagedwith respect to stimulus onset, for each subject, each condi-tion and each hemi-field of presentation. Data from two subjectswere discarded because of low signal to noise ratio: Subject 2presented high alpha activity in both the fixation and Gaborpresentation periods (S2 in Figure 3), and subject 10 had thesmallest amplitude of signal, with a maximal amplitude of sig-nal in the reference condition (High #, see Figure 2) smallerthan half the value of all other subjects for the right presentation(S10 in Figure 3).
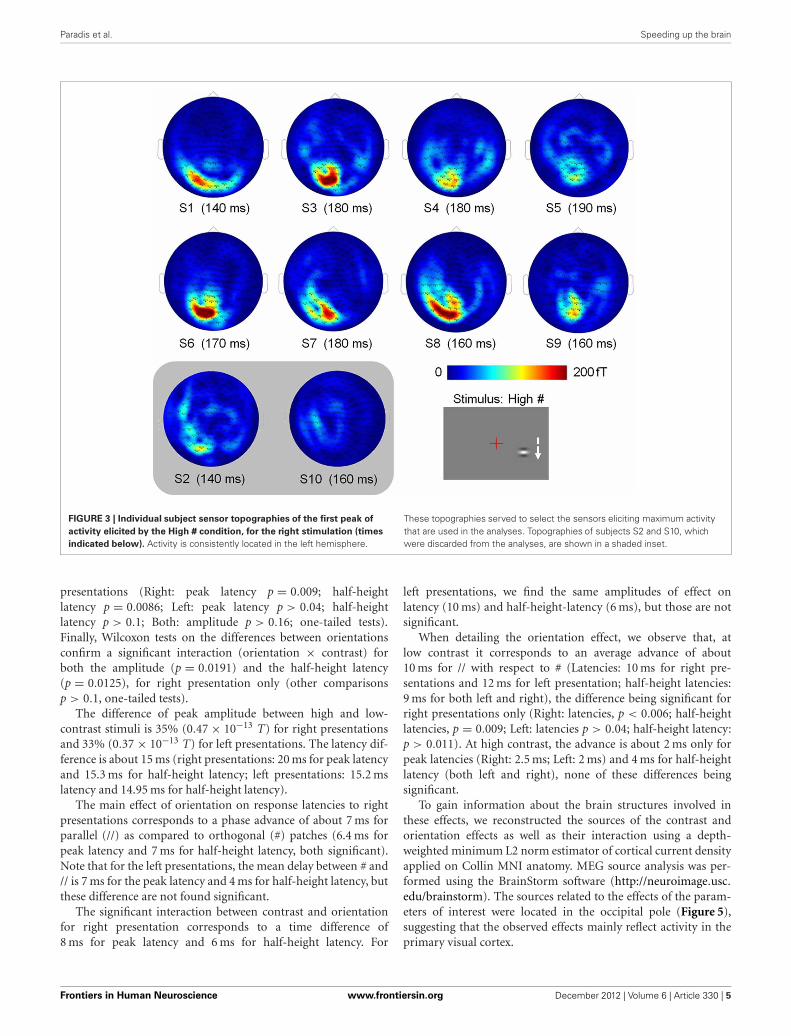
DATA ANALYSISAs stronger activity is expected for high-contrast stimuli, we chosethe condition with high-contrast patches orthogonal to the verti-cal axis (High #) as the condition of reference to select the sensorsof interest on an individual basis. For this condition, we found thetime of maximal activity in the range of 50–250 ms and selectedthe 2 or 3 sensors with maximal activity at this peak (see topogra-phies of the peak activity for both hemi-fields of presentation inFigure 3).
The signal of the selected sensors was then averaged sepa-rately for each subject and condition. From these averaged signals,we extracted the peak value (amplitude), the peak latency andhalf-height latency (half height being the mean of the peak
Frontiers in Human Neuroscience www.frontiersin.org December 2012 | Volume 6 | Article 330 | 3
Paradis et al. Speeding up the brain
FIGURE 2 | Experimental design and hypotheses. (A) Timing of a trial. AGabor patch is presented sequentially in different positions along a verticalaxis, left or right from fixation (B) High and low-contrast Gabor at twoorientations used in the experiment. For visualization purpose, the contrastsof the figure do not correspond to the real ones. (C) Schematic
representation of the effect of traveling waves on the amplitude and latencyof cortical responses to the different conditions of stimulation. Green:High-contrast Gabor parallel to the vertical axis (High //). Blue: High-contrastGabor orthogonal to the vertical axis (High #). Red: Low contrast, parallel(Low //). Black: Low contrast, orthogonal (Low #).
and a baseline value estimated between −120 and −20 ms, seeFigure 4).
For these three measures, we performed repeated-measureANOVAS with factors Contrast (High, Low) and Orientation(#, //), separately for each hemi-field of presentation. Accordingto our hypotheses, a main effect of contrast and an interactionbetween contrast and orientation are expected.
Because of the limited number of subjects, non-parametricstatistics were also performed (Friedman test, Georgin and Gouet,2000). Wilcoxon tests were used to separately assess the maineffects of Contrast (mean of high-contrast conditions vs. mean oflow-contrast conditions) and Orientation (mean of # conditionsvs. mean of // conditions) and the crossed effect of Contrast ×Orientation (difference between High # and High // vs. differencebetween Low # and Low //). To better characterize a possible inter-action, we also tested the orientation effect separately for the highcontrast and low contrast conditions.
RESULTSAll results, computed from eight datasets are shown inFigure 4. The Friedman tests reveal that the four exper-imental conditions induce significant variations of ampli-tude (Right: p = 1.3 × 10⁻⁴ and Left: p = 4.1 × 10⁻⁴), peaklatency (Right: p = 1.1 × 10⁻⁴; Left: p = 1.92 × 10⁻³) and half-height latency (Right: p = 1.5 × 10⁻⁴; Left: p = 1.02 × 10⁻²).According to post-hoc tests, the Low # condition alwayssignificantly differs from the High # condition (p < 0.05
corrected for multiple comparisons, Siegel and Andersen,1988).
The ANOVAs (see Table 1) reveal a strong effect ofcontrast on the three measures (amplitude: p = 5.3 × 10⁻⁵
and p = 0.0019 for right and left presentations respectively;latency: p = 7 × 10⁻⁵ and p = 1.8 × 10⁻⁵; half-height latency:p = 9 × 10⁻⁴ and 0.0089). For right presentations, we also find amain effect of Orientation on the response latency (p = 0.049 forpeak latency and p = 0.012 for half-height latency); and a signif-icant interaction between Orientation and Contrast for both theamplitude (p = 0.0035) and the half-height latency (p = 0.019).However, we found no effect of orientation on the amplitude(p = 0.33) and no Orientation × Contrast interaction on peaklatency (p = 0.11).
For left presentations, despite a clear effect of contrast, we findno effect of orientation either on the amplitude (p = 0.44) or onthe latency of the responses (p = 0.1 and p = 0.15 for peak andhalf-height latency respectively). No interaction is found either(amplitude: p = 0.66; peak latency: p = 0.2; half-height latency:p = 0.33).
These results were systematically confirmed by non-parametric statistics (see Table 2). Wilcoxon tests on thedata averaged by orientation confirm a main effect of the contraston amplitude (p = 0.0059, one tailed test), latency (p = 0.0059)and half-height latency (Right: p = 0.0059 and Left: p = 0.0086).Wilcoxon tests on the data averaged by contrast show a maineffect of the patch orientation on the latencies only for right
Frontiers in Human Neuroscience www.frontiersin.org December 2012 | Volume 6 | Article 330 | 4
Paradis et al. Speeding up the brain
FIGURE 3 | Individual subject sensor topographies of the first peak of
activity elicited by the High # condition, for the right stimulation (times
indicated below). Activity is consistently located in the left hemisphere.
These topographies served to select the sensors eliciting maximum activitythat are used in the analyses. Topographies of subjects S2 and S10, whichwere discarded from the analyses, are shown in a shaded inset.
presentations (Right: peak latency p = 0.009; half-heightlatency p = 0.0086; Left: peak latency p > 0.04; half-heightlatency p > 0.1; Both: amplitude p > 0.16; one-tailed tests).Finally, Wilcoxon tests on the differences between orientationsconfirm a significant interaction (orientation × contrast) forboth the amplitude (p = 0.0191) and the half-height latency(p = 0.0125), for right presentation only (other comparisonsp > 0.1, one-tailed tests).
The difference of peak amplitude between high and low-contrast stimuli is 35% (0.47 × 10⁻¹³ T) for right presentationsand 33% (0.37 × 10⁻¹³ T) for left presentations. The latency dif-ference is about 15 ms (right presentations: 20 ms for peak latencyand 15.3 ms for half-height latency; left presentations: 15.2 mslatency and 14.95 ms for half-height latency).
The main effect of orientation on response latencies to rightpresentations corresponds to a phase advance of about 7 ms forparallel (//) as compared to orthogonal (#) patches (6.4 ms forpeak latency and 7 ms for half-height latency, both significant).Note that for the left presentations, the mean delay between # and// is 7 ms for the peak latency and 4 ms for half-height latency, butthese difference are not found significant.
The significant interaction between contrast and orientationfor right presentation corresponds to a time difference of8 ms for peak latency and 6 ms for half-height latency. For
left presentations, we find the same amplitudes of effect onlatency (10 ms) and half-height-latency (6 ms), but those are notsignificant.
When detailing the orientation effect, we observe that, atlow contrast it corresponds to an average advance of about10 ms for // with respect to # (Latencies: 10 ms for right pre-sentations and 12 ms for left presentation; half-height latencies:9 ms for both left and right), the difference being significant forright presentations only (Right: latencies, p < 0.006; half-heightlatencies, p = 0.009; Left: latencies p > 0.04; half-height latency:p > 0.011). At high contrast, the advance is about 2 ms only forpeak latencies (Right: 2.5 ms; Left: 2 ms) and 4 ms for half-heightlatency (both left and right), none of these differences beingsignificant.
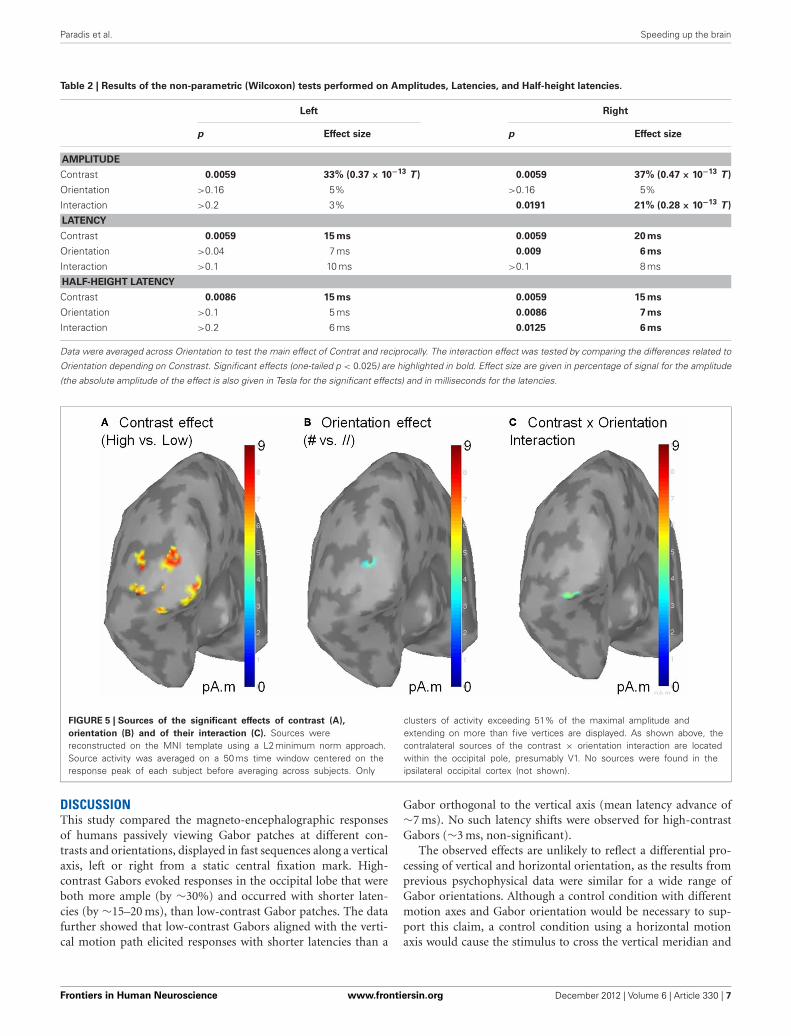
To gain information about the brain structures involved inthese effects, we reconstructed the sources of the contrast andorientation effects as well as their interaction using a depth-weighted minimum L2 norm estimator of cortical current densityapplied on Collin MNI anatomy. MEG source analysis was per-formed using the BrainStorm software (http://neuroimage.usc.edu/brainstorm). The sources related to the effects of the param-eters of interest were located in the occipital pole (Figure 5),suggesting that the observed effects mainly reflect activity in theprimary visual cortex.
Frontiers in Human Neuroscience www.frontiersin.org December 2012 | Volume 6 | Article 330 | 5
Paradis et al. Speeding up the brain
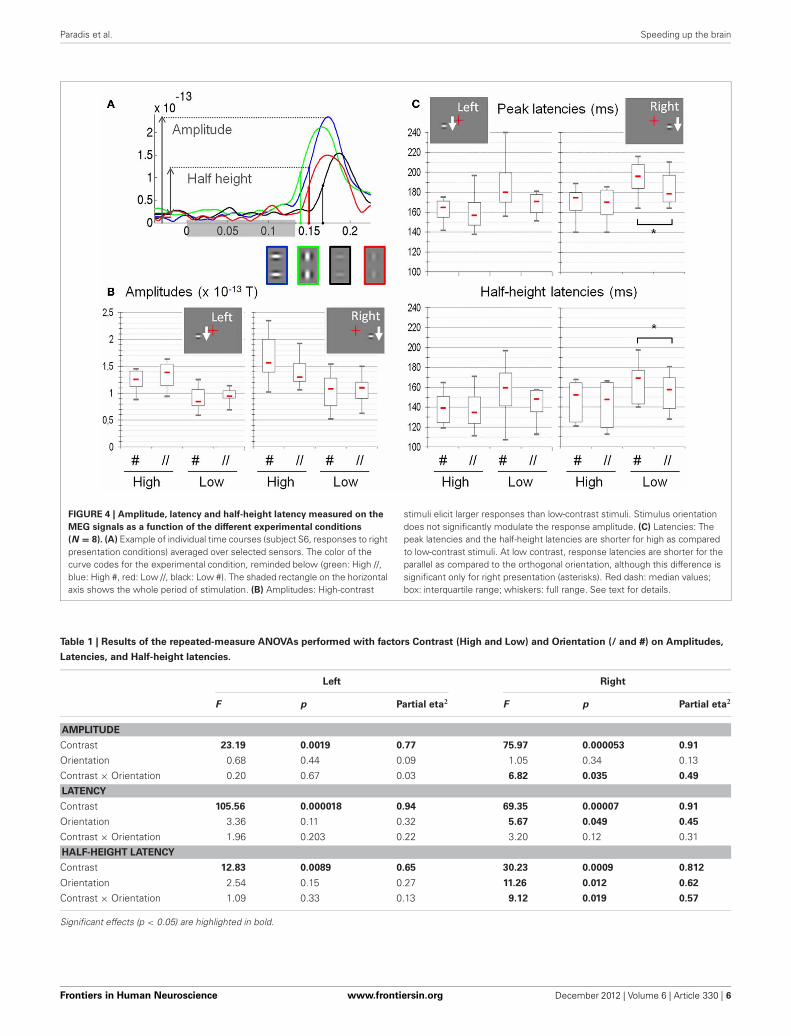
FIGURE 4 | Amplitude, latency and half-height latency measured on the
MEG signals as a function of the different experimental conditions
(N = 8). (A) Example of individual time courses (subject S6, responses to rightpresentation conditions) averaged over selected sensors. The color of thecurve codes for the experimental condition, reminded below (green: High //,blue: High #, red: Low //, black: Low #). The shaded rectangle on the horizontalaxis shows the whole period of stimulation. (B) Amplitudes: High-contrast
stimuli elicit larger responses than low-contrast stimuli. Stimulus orientationdoes not significantly modulate the response amplitude. (C) Latencies: Thepeak latencies and the half-height latencies are shorter for high as comparedto low-contrast stimuli. At low contrast, response latencies are shorter for theparallel as compared to the orthogonal orientation, although this difference issignificant only for right presentation (asterisks). Red dash: median values;box: interquartile range; whiskers: full range. See text for details.
Table 1 | Results of the repeated-measure ANOVAs performed with factors Contrast (High and Low) and Orientation (/ and #) on Amplitudes,
Latencies, and Half-height latencies.
Left Right
F p Partial eta2 F p Partial eta2
AMPLITUDE
Contrast 23.19 0.0019 0.77 75.97 0.000053 0.91
Orientation 0.68 0.44 0.09 1.05 0.34 0.13
Contrast × Orientation 0.20 0.67 0.03 6.82 0.035 0.49
LATENCY
Contrast 105.56 0.000018 0.94 69.35 0.00007 0.91
Orientation 3.36 0.11 0.32 5.67 0.049 0.45
Contrast × Orientation 1.96 0.203 0.22 3.20 0.12 0.31
HALF-HEIGHT LATENCY
Contrast 12.83 0.0089 0.65 30.23 0.0009 0.812
Orientation 2.54 0.15 0.27 11.26 0.012 0.62
Contrast × Orientation 1.09 0.33 0.13 9.12 0.019 0.57
Significant effects (p < 0.05) are highlighted in bold.
Frontiers in Human Neuroscience www.frontiersin.org December 2012 | Volume 6 | Article 330 | 6
Paradis et al. Speeding up the brain
Table 2 | Results of the non-parametric (Wilcoxon) tests performed on Amplitudes, Latencies, and Half-height latencies.
Left Right
p Effect size p Effect size
AMPLITUDE
Contrast 0.0059 33% (0.37 × 10⁻¹³ T ) 0.0059 37% (0.47 × 10⁻¹³ T )
Orientation >0.16 5% >0.16 5%
Interaction >0.2 3% 0.0191 21% (0.28 × 10⁻¹³ T )
LATENCY
Contrast 0.0059 15 ms 0.0059 20 ms
Orientation >0.04 7 ms 0.009 6 ms
Interaction >0.1 10 ms >0.1 8 ms
HALF-HEIGHT LATENCY
Contrast 0.0086 15 ms 0.0059 15 ms
Orientation >0.1 5 ms 0.0086 7 ms
Interaction >0.2 6 ms 0.0125 6 ms
Data were averaged across Orientation to test the main effect of Contrat and reciprocally. The interaction effect was tested by comparing the differences related to
Orientation depending on Constrast. Significant effects (one-tailed p < 0.025) are highlighted in bold. Effect size are given in percentage of signal for the amplitude
(the absolute amplitude of the effect is also given in Tesla for the significant effects) and in milliseconds for the latencies.
FIGURE 5 | Sources of the significant effects of contrast (A),
orientation (B) and of their interaction (C). Sources werereconstructed on the MNI template using a L2 minimum norm approach.Source activity was averaged on a 50 ms time window centered on theresponse peak of each subject before averaging across subjects. Only
clusters of activity exceeding 51% of the maximal amplitude andextending on more than five vertices are displayed. As shown above, thecontralateral sources of the contrast × orientation interaction are locatedwithin the occipital pole, presumably V1. No sources were found in theipsilateral occipital cortex (not shown).
DISCUSSIONThis study compared the magneto-encephalographic responsesof humans passively viewing Gabor patches at different con-trasts and orientations, displayed in fast sequences along a verticalaxis, left or right from a static central fixation mark. High-contrast Gabors evoked responses in the occipital lobe that wereboth more ample (by ∼30%) and occurred with shorter laten-cies (by ∼15–20 ms), than low-contrast Gabor patches. The datafurther showed that low-contrast Gabors aligned with the verti-cal motion path elicited responses with shorter latencies than a
Gabor orthogonal to the vertical axis (mean latency advance of∼7 ms). No such latency shifts were observed for high-contrastGabors (∼3 ms, non-significant).
The observed effects are unlikely to reflect a differential pro-cessing of vertical and horizontal orientation, as the results fromprevious psychophysical data were similar for a wide range ofGabor orientations. Although a control condition with differentmotion axes and Gabor orientation would be necessary to sup-port this claim, a control condition using a horizontal motionaxis would cause the stimulus to cross the vertical meridian and
Frontiers in Human Neuroscience www.frontiersin.org December 2012 | Volume 6 | Article 330 | 7
Paradis et al. Speeding up the brain
stimulate bothhemispheres,whichwouldentaildifficulties fordataanalyses and valid comparisons between different motion axes.
The effects of contrast and orientation were similar in bothhemispheres, but are only significant for visual motion sequencespresented in the right hemi-field. We do yet not have a straight-forward explanation of this left/right asymmetry that we alsoobserved in a behavioral speed discrimination task with simi-lar stimuli. We note that all subjects were right handed and canonly speculate that the left/right difference could correlate withalready known asymmetries in visual processing, as for instancepseudoneglect (Jewell and McCourt, 2000), or hemispheric dif-ferences in spatial frequencies and motion processing (Sergent,1982; Peyrin et al., 2003) but further studies are needed to testthese hypotheses.
Overall, the responses latencies reported here are relativelylong as compared to a classical M100 response. The relativelylate response latencies observed here for all conditions is likely toreflect the fact that the stimulus first enters the observers’ visualfield from the periphery and that interactions between elementscan only occur after the occurrence of the second frame of asequence.
The latency advance for high-contrast stimuli is in good agree-ment with previous electrophysiological recordings in macaqueV1 (e.g., Gawne et al., 1996) and corroborates the effects ofcontrast and orientation found for intracellular recordings inanesthetized cat that also used fast Gabor sequences (Baudot et al.,2000; Lorenceau et al., 2001; Frégnac et al., 2010). A psychophysi-cal speed discrimination study using stimuli similar to those usedherein (Georges et al., 2002), reported that a Gabor patch alignedwith the motion axis appears faster than a Gabor orthogonal to it.This speed-up effect is large at high speeds (PSE of 2 for 64◦/s)and decreases at higher and lower physical speeds. Additionalresults (Paradis et al., 2011) found that a low-contrast Gabor(20%) aligned with the motion path is seen as moving much fasterthan a similarly oriented high-contrast Gabor (50%), an effectthat disappears for Gabor patches orthogonal to the motion path.Altogether, these electrophysiological and psychophysical resultssuggest that the effects of contrast and orientation found withMEG reflect veridical and reliable processing differences.
The computational model developed by Seriès et al. (2002)accounts for the perceptual reports of Georges et al. (2002), andprovides insights into the underlying mechanisms. The modelrelies on latency shifts mediated by long-range horizontal con-nections between cortical neurons responding in succession tooriented Gabors (Figure 1). In addition to simulating the psy-chophysical data, the model also predicts most of the effects ofcontrast and orientation reported here.
Crucially, the model predicts larger effects for a low-contrastGabor aligned with the motion path than for other contrastand orientation configurations. This prediction stems from thefact that whenever a depolarizing input arising from a neigh-boring neuron through long-range facilitation brings a neuronclose to its spiking threshold, its time-to-threshold is shortened.This shortening is large for low-contrast stimuli because thedepolarization needed to reach the spiking threshold at low con-trast is slow (long time-to-threshold; Figure 1), but the latencygain is smaller for high-contrast stimuli because depolarization
is fast and the time-to-threshold is already short in this case.The present findings support this processing scheme, as aresponse phase advance is only observed for a low-contrast Gaboraligned with the motion path. In this view, latency shifts occurbecause horizontal facilitation—and/or suppression—betweencells selective to similar—or dissimilar—orientations modulatethe neurons’ resting potential. As a consequence, the time neededto integrate the energy of an incoming feedforward input ismodulated by signals from distant cortical neurons.
POSSIBLE ROLE OF LATENCY SHIFTS IN VISUAL PROCESSINGWhat could be the functional role of latency shifts in visualprocessing? The dependency on contrast, orientation and speedprovides constraints on what these putative roles can be. The per-ceptual speed-up effect detailed in Georges et al. (2002) reachesa maximum at a high speed (∼64◦/s). We speculate that, exceptwith rare exceptions, this speed is much faster than the aver-age speeds usually encountered in a natural environment (Calowand Lappe, 2007). It therefore seems unlikely that latency shiftscan play a significant role in visual motion analysis. As sac-cadic eye-movements can induce very high retinal speeds, couldlatency shifts play a role in eye-movement control, for instanceby speeding-up saccades or guiding eye movements toward rel-evant targets? The fact that saccades are mostly generated bysub-cortical structures such as the superior colliculus (Robinson,1972; Wurtz and Albano, 1980), where neurons lack orientationselectivity, weakens the plausibility of this interpretation. An alter-native is that latency shifts play no role in motion processing oreye-movement control and that the apparent motion paradigmused herein was only appropriate to temporally decompose theneural dynamics that would otherwise had gone unnoticed withstationary stimuli, because they are below perceptual thresholds.In this view, the latency shifts induced by spatial facilitation couldreflect the propagation of “beliefs” between neurons, based onthe high probability that neighboring neurons sharing similar ori-entation preference are stimulated by a single elongated contour(Geisler et al., 2001; Geisler, 2008), and serve to help contourextraction in cluttered environments.
Considering natural contours provides arguments in favor ofthis view: In natural images, an elongated contour rarely has ahomogenous contrast, owing to the background against which thecontour is presented, the illuminant or the presence of occludingobjects, as exemplified in Figures 6A,B where regions with highand low contrasts define a single elongated contour. One conse-quence of this contrast heterogeneity is that neurons respondingto different local contrasts should do so with different latencies.Therefore, response latencies should be scattered in time and thevariance of their distribution should be high. High spike timevariance would in turn limit the efficacy of feed-forward inputsthat drive neurons at subsequent processing stages (Azouz andGray, 2000). We propose that one of the consequences of long-range collinear facilitation is to reduce spike time variance bytemporally aligning the slower responses to low-contrast regionswith the earlier fast responses to high-contrast regions.
According to the present findings and the model predictions,one consequence of the observed latency shifts is that neuronsstimulated by a single elongated contour with varying contrast
Frontiers in Human Neuroscience www.frontiersin.org December 2012 | Volume 6 | Article 330 | 8
Paradis et al. Speeding up the brain
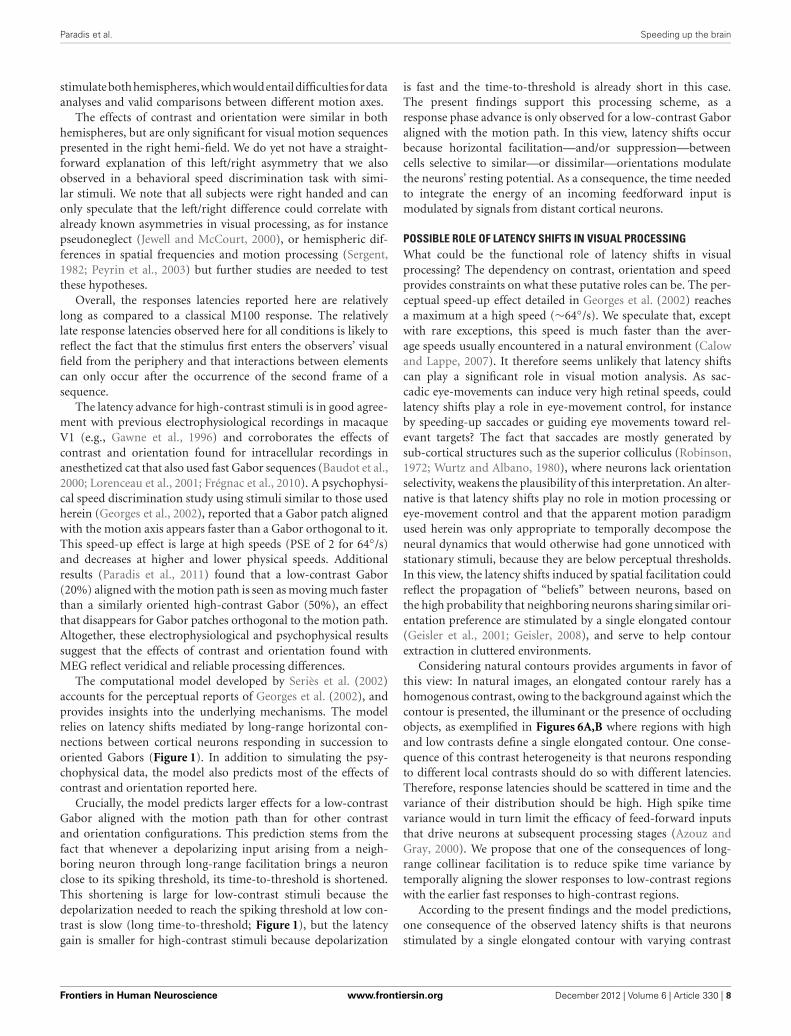
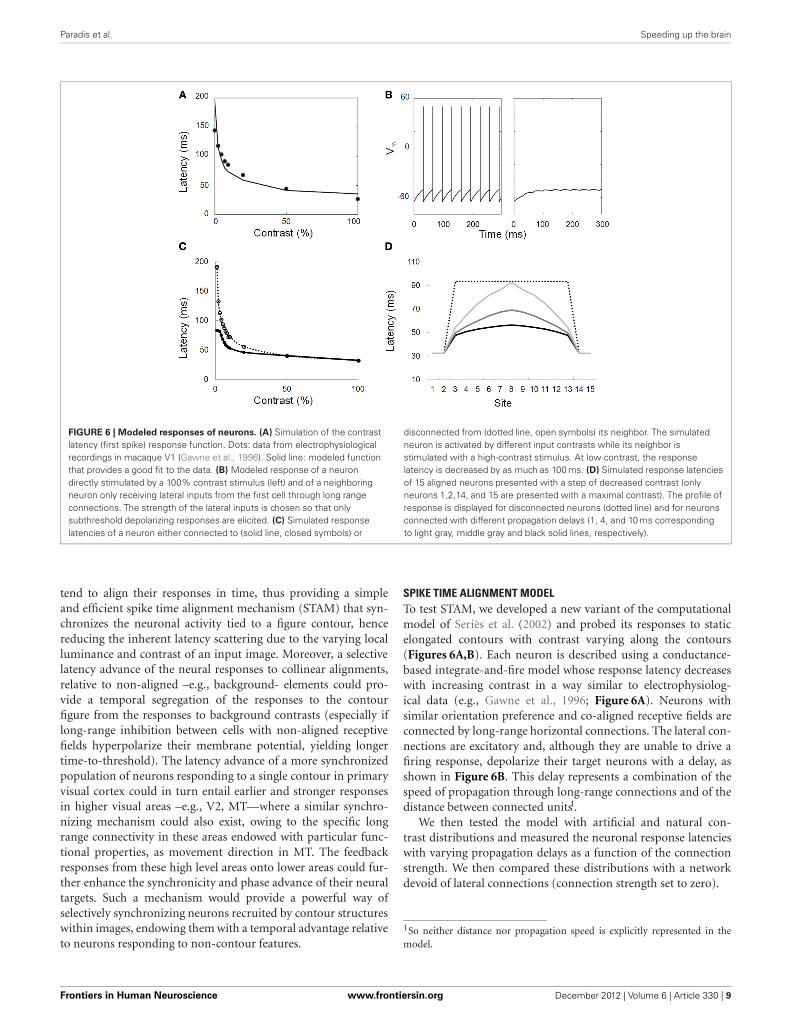
FIGURE 6 | Modeled responses of neurons. (A) Simulation of the contrastlatency (first spike) response function. Dots: data from electrophysiologicalrecordings in macaque V1 (Gawne et al., 1996). Solid line: modeled functionthat provides a good fit to the data. (B) Modeled response of a neurondirectly stimulated by a 100% contrast stimulus (left) and of a neighboringneuron only receiving lateral inputs from the first cell through long rangeconnections. The strength of the lateral inputs is chosen so that onlysubthreshold depolarizing responses are elicited. (C) Simulated responselatencies of a neuron either connected to (solid line, closed symbols) or
disconnected from (dotted line, open symbols) its neighbor. The simulatedneuron is activated by different input contrasts while its neighbor isstimulated with a high-contrast stimulus. At low contrast, the responselatency is decreased by as much as 100 ms. (D) Simulated response latenciesof 15 aligned neurons presented with a step of decreased contrast (onlyneurons 1,2,14, and 15 are presented with a maximal contrast). The profile ofresponse is displayed for disconnected neurons (dotted line) and for neuronsconnected with different propagation delays (1, 4, and 10 ms correspondingto light gray, middle gray and black solid lines, respectively).
tend to align their responses in time, thus providing a simpleand efficient spike time alignment mechanism (STAM) that syn-chronizes the neuronal activity tied to a figure contour, hencereducing the inherent latency scattering due to the varying localluminance and contrast of an input image. Moreover, a selectivelatency advance of the neural responses to collinear alignments,relative to non-aligned –e.g., background- elements could pro-vide a temporal segregation of the responses to the contourfigure from the responses to background contrasts (especially iflong-range inhibition between cells with non-aligned receptivefields hyperpolarize their membrane potential, yielding longertime-to-threshold). The latency advance of a more synchronizedpopulation of neurons responding to a single contour in primaryvisual cortex could in turn entail earlier and stronger responsesin higher visual areas –e.g., V2, MT—where a similar synchro-nizing mechanism could also exist, owing to the specific longrange connectivity in these areas endowed with particular func-tional properties, as movement direction in MT. The feedbackresponses from these high level areas onto lower areas could fur-ther enhance the synchronicity and phase advance of their neuraltargets. Such a mechanism would provide a powerful way ofselectively synchronizing neurons recruited by contour structureswithin images, endowing them with a temporal advantage relativeto neurons responding to non-contour features.
SPIKE TIME ALIGNMENT MODELTo test STAM, we developed a new variant of the computationalmodel of Seriès et al. (2002) and probed its responses to staticelongated contours with contrast varying along the contours(Figures 6A,B). Each neuron is described using a conductance-based integrate-and-fire model whose response latency decreaseswith increasing contrast in a way similar to electrophysiolog-ical data (e.g., Gawne et al., 1996; Figure 6A). Neurons withsimilar orientation preference and co-aligned receptive fields areconnected by long-range horizontal connections. The lateral con-nections are excitatory and, although they are unable to drive afiring response, depolarize their target neurons with a delay, asshown in Figure 6B. This delay represents a combination of thespeed of propagation through long-range connections and of thedistance between connected units1.
We then tested the model with artificial and natural con-trast distributions and measured the neuronal response latencieswith varying propagation delays as a function of the connectionstrength. We then compared these distributions with a networkdevoid of lateral connections (connection strength set to zero).
1So neither distance nor propagation speed is explicitly represented in themodel.
Frontiers in Human Neuroscience www.frontiersin.org December 2012 | Volume 6 | Article 330 | 9
Paradis et al. Speeding up the brain
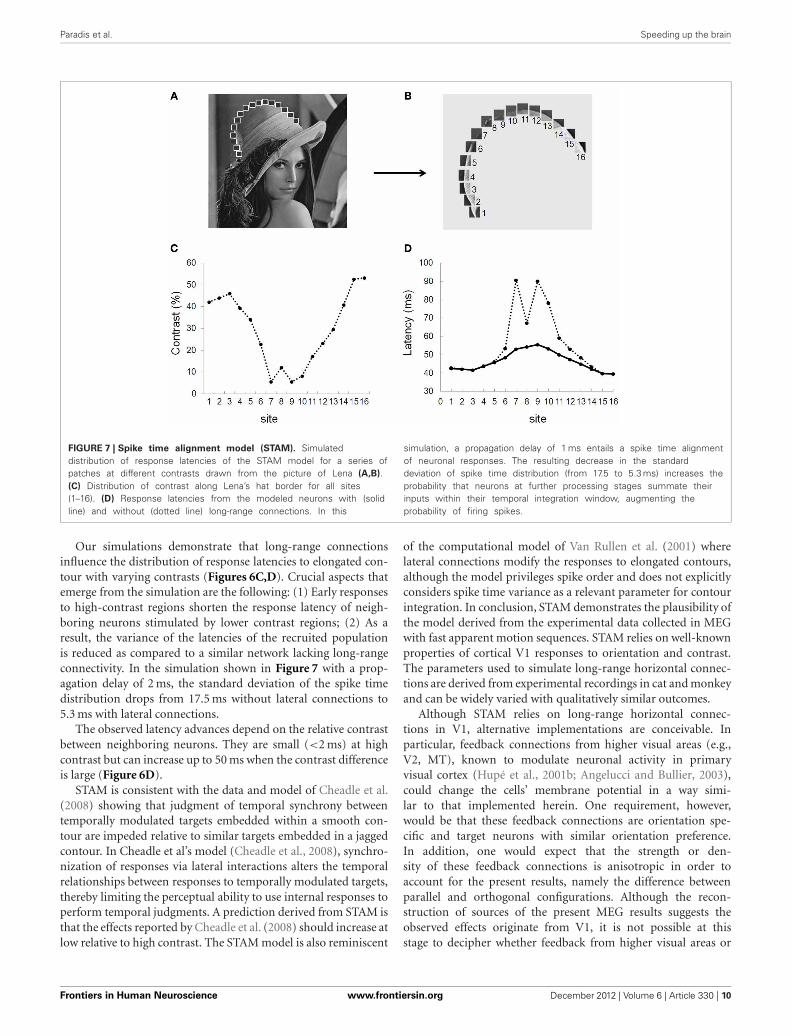
FIGURE 7 | Spike time alignment model (STAM). Simulateddistribution of response latencies of the STAM model for a series ofpatches at different contrasts drawn from the picture of Lena (A,B).(C) Distribution of contrast along Lena’s hat border for all sites(1–16). (D) Response latencies from the modeled neurons with (solidline) and without (dotted line) long-range connections. In this
simulation, a propagation delay of 1 ms entails a spike time alignmentof neuronal responses. The resulting decrease in the standarddeviation of spike time distribution (from 17.5 to 5.3 ms) increases theprobability that neurons at further processing stages summate theirinputs within their temporal integration window, augmenting theprobability of firing spikes.
Our simulations demonstrate that long-range connectionsinfluence the distribution of response latencies to elongated con-tour with varying contrasts (Figures 6C,D). Crucial aspects thatemerge from the simulation are the following: (1) Early responsesto high-contrast regions shorten the response latency of neigh-boring neurons stimulated by lower contrast regions; (2) As aresult, the variance of the latencies of the recruited populationis reduced as compared to a similar network lacking long-rangeconnectivity. In the simulation shown in Figure 7 with a prop-agation delay of 2 ms, the standard deviation of the spike timedistribution drops from 17.5 ms without lateral connections to5.3 ms with lateral connections.
The observed latency advances depend on the relative contrastbetween neighboring neurons. They are small (<2 ms) at highcontrast but can increase up to 50 ms when the contrast differenceis large (Figure 6D).
STAM is consistent with the data and model of Cheadle et al.(2008) showing that judgment of temporal synchrony betweentemporally modulated targets embedded within a smooth con-tour are impeded relative to similar targets embedded in a jaggedcontour. In Cheadle et al’s model (Cheadle et al., 2008), synchro-nization of responses via lateral interactions alters the temporalrelationships between responses to temporally modulated targets,thereby limiting the perceptual ability to use internal responses toperform temporal judgments. A prediction derived from STAM isthat the effects reported by Cheadle et al. (2008) should increase atlow relative to high contrast. The STAM model is also reminiscent
of the computational model of Van Rullen et al. (2001) wherelateral connections modify the responses to elongated contours,although the model privileges spike order and does not explicitlyconsiders spike time variance as a relevant parameter for contourintegration. In conclusion, STAM demonstrates the plausibility ofthe model derived from the experimental data collected in MEGwith fast apparent motion sequences. STAM relies on well-knownproperties of cortical V1 responses to orientation and contrast.The parameters used to simulate long-range horizontal connec-tions are derived from experimental recordings in cat and monkeyand can be widely varied with qualitatively similar outcomes.
Although STAM relies on long-range horizontal connec-tions in V1, alternative implementations are conceivable. Inparticular, feedback connections from higher visual areas (e.g.,V2, MT), known to modulate neuronal activity in primaryvisual cortex (Hupé et al., 2001b; Angelucci and Bullier, 2003),could change the cells’ membrane potential in a way simi-lar to that implemented herein. One requirement, however,would be that these feedback connections are orientation spe-cific and target neurons with similar orientation preference.In addition, one would expect that the strength or den-sity of these feedback connections is anisotropic in order toaccount for the present results, namely the difference betweenparallel and orthogonal configurations. Although the recon-struction of sources of the present MEG results suggests theobserved effects originate from V1, it is not possible at thisstage to decipher whether feedback from higher visual areas or
Frontiers in Human Neuroscience www.frontiersin.org December 2012 | Volume 6 | Article 330 | 10

Paradis et al. Speeding up the brain
long-range horizontal connections or both underlie the latencyshortening reported here for co-aligned low contrast elements.Further studies with different methodologies (e.g., optical imag-ing, multielectrode recordings) would be necessary to clarify thisissue.
In the present study, the responses of the modeled neuronsonly depend on the contrast/latency response function and onthe weight and propagation speed of the lateral inputs. Previousstudies have shown that neuronal response latencies also dependon other dimensions (Bullier, 2001). For instance, low spatial fre-quency information is mostly processed by fast magnocellularneurons with short response latencies while high spatial frequencyinformation is mostly processed by slower parvocellular neuronswith longer latencies (Bullier, 2001). Extending STAM to sim-ulate magno and parvocellular neurons with spatial-frequency
dependent response latencies would implement an early “coarse-to-fine” facilitation of visual processing (Bar, 2003) where mag-nocellular neurons stimulated by extended contours embeddingdifferent spatial scales would facilitate parvocellular neurons withco-aligned receptive fields. In this view, STAM predicts that thespike time variance of the population response to different spatialscale patterns should be decreased when these different patternsbelong to a same contour.
ACKNOWLEDGMENTSWe thank Catherine Tallon-Baudry, Anne Caclin, and the mem-bers of the MEG center for their help. This research was sup-ported by a grant from the Ministère de la Recherche, ACINeurosciences Computationnelles n◦ 02 20407 and a grant fromANR ViMAGINE to Jean Lorenceau.
REFERENCESAlais, D., and Lorenceau, J. (2002).
Perceptual grouping in the Ternusdisplay: evidence for an ‘associationfield’ in apparent motion. VisionRes. 42, 1005–1016.
Angelucci, A., and Bullier, J. (2003).Reaching beyond the classical recep-tive field of V1 neurons: horizontalor feedback axons? J. Physiol. Paris97, 141–154.
Azouz, R., and Gray, C. M. (2000).Dynamic spike threshold reveals amechanism for synaptic coincidencedetection in cortical neurons in vivo.Proc. Natl. Acad. Sci. U.S.A. 97,8110–8115.
Bar, M. (2003). A cortical mechanismfor triggering top-down facilitationin visual object recognition. J. Cogn.Neurosci. 15, 600–609.
Baudot, P., Chavane, F., Pananceau, M.,Edet, V., Gutkin, B., Lorenceau, J.,et al. (2000). Cellular correlates ofapparent motion in the associationfield of cat area 17 neurons. Soc.Neurosci. (abstracts) 26, 446.
Beaudot, W. H. (2002). Role of onsetasynchrony in contour integration.Vision Res. 42, 1–9.
Benucci, A., Frazor, R. A., andCarandini, M. (2007). Standingwaves and traveling waves distin-guish two circuits in visual cortex.Neuron 55, 103–117.
Bosking, W. H., Zhang, Y., Schofield,B., and Fitzpatrick, D. (1997).Orientation selectivity and thearrangement of horizontal connec-tions in tree shrew striate cortex.J. Neurosci. 17, 2112–2127.
Bringuier, V., Chavane, F., Glaeser, L.,and Fregnac, Y. (1999). Horizontalpropagation of visual activity in thesynaptic integration field of area 17neurons. Science 283, 695–699.
Bullier, J. (2001). Integrated model ofvisual processing. Brain Res. BrainRes. Rev. 36, 96–107.
Calow, D., and Lappe, M. (2007). Localstatistics of retinal optic flow forself-motion through natural scener-ies. Network 18, 343–374.
Cass, J., and Alais, D. (2006). Themechanisms of collinear integra-tion. J. Vis. 6, 915–922.
Cavanaugh, J. R., Bair, W., andMovshon, J. A. (2002). Selectivityand spatial distribution of signalsfrom the receptive field sur-round in macaque V1 neurons.J. Neurophysiol. 88, 2547–2556.
Chavane, F., Monier, C., Bringuier,V., Baudot, P., Borg-Graham, L.,Lorenceau, J., et al. (2000). Thevisual cortical association field: aGestalt concept or a psychophysi-ological entity? J. Physiol. Paris 94,333–342.
Chavane, F., Sharon, D., Jancke,D., Marre, O., Frégnac, Y., andGrinvald, A. (2011). Lateral spreadof orientation selectivity in V1 iscontrolled by intracortical coopera-tivity. Front. Syst. Neurosci. 5:4. doi:10.3389/fnsys.2011.00004
Cheadle, S., Bauer, F., Parton, A.,Muller, H., Bonneh, Y. S., and Usher,M. (2008). Spatial structure affectstemporal judgments: evidence for asynchrony binding code. J. Vis. 8, 1211–12.
Dow, B. M., Snyder, A. Z., Vautin,R. G., and Bauer, R. (1981).Magnification factor and receptivefield size in foveal striate cortexof the monkey. Exp. Brain Res. 44,213–228.
Field, D. J., Hayes, A., and Hess, R. F.(1993). Contour integration by thehuman visual system: evidence for alocal “association field.” Vision Res.33, 173–193.
Fitzpatrick, D. (1996). The functionalorganization of local circuits invisual cortex: insights from thestudy of tree shrew striate cortex.Cereb. Cortex 6, 329–341.
Frégnac, Y., Baudot, P., Chavane, F.,Lorenceau, J., Marre, O., Monier,C., et al. (2010). “Multiscale func-tional imaging in V1 and corticalcorrelates of apparent motion,”in Dynamics of Visual MotionProcessing, eds G. Masson and U. J.Ilg (Berlin: Springer), 73–94.
Gawne, T. J., Kjaer, T. W., andRichmond, B. J. (1996). Latency:another potential code for fea-ture binding in striate cortex.J. Neurophysiol. 76, 1356–1360.
Geisler, W. S. (2008). Visual perceptionand the statistical properties of nat-ural scenes. Annu. Rev. Psychol. 59,167–192.
Geisler, W. S., Perry, J. S., Super, B.J., and Gallogly, D. P. (2001). Edgeco-occurrence in natural imagespredicts contour grouping perfor-mance. Vision Res. 41, 711–724.
Georges, S., Seriès, P., Fregnac, Y., andLorenceau, J. (2002). Orientationdependent modulation of appar-ent speed: psychophysical evidence.Vision Res. 42, 2757–2772.
Georgin, P., and Gouet, M. (2000).Statistiques Avec Excel 2000. Paris:Eyrolles.
Gilbert, C. D., and Wiesel, T. N.(1979). Morphology and intracor-tical projections of functionallycharacterised neurones in thecat visual cortex. Nature 280,120–125.
Gilbert, C. D., and Wiesel, T. N. (1983).Clustered intrinsic connections incat visual cortex. J. Neurosci. 3,1116–1133.
Gilbert, C. D., and Wiesel, T. N. (1989).Columnar specificity of intrinsichorizontal and corticocorticalconnections in cat visual cortex.J. Neurosci. 9, 2432–2442.
Grinvald, A., Lieke, E. E., Frostig, R. D.,and Hildesheim, R. (1994). Corticalpoint-spread function and long-range lateral interactions revealed
by real-time optical imaging ofmacaque monkey primary visualcortex. J. Neurosci. 14(5 Pt 1),2545–2568.
Hess, R. F., Hayes, A., and Field, D.J. (2003). Contour integration andcortical processing. J. Physiol. Paris97, 105–119.
Hirsch, J. A., and Gilbert, C. D. (1991).Synaptic physiology of horizontalconnections in the cat’s visual cor-tex. J. Neurosci. 11, 1800–1809.
Hupé, J. M., James, A. C., Girard, P.,and Bullier, J. (2001a). Responsemodulations by static texturesurround in area V1 of themacaque monkey do not dependon feedback connections from V2.J. Neurophysiol. 85, 146–163.
Hupé, J. M., James, A. C., Girard, P.,Lomber, S. G., Payne, B. R., andBullier, J. (2001b). Feedback con-nections act on the early part of theresponses in monkey visual cortex.J. Neurophysiol. 85, 134–145.
Ito, M., and Gilbert, C. D. (1999).Attention modulates contextualinfluences in the primary visualcortex of alert monkeys. Neuron 22,593–604.
Jancke, D., Chavane, F., Naaman, S.,and Grinvald, A. (2004). Imagingcortical correlates of illusion in earlyvisual cortex. Nature 428, 423–426.
Jewell, G., and McCourt, M. E.(2000). Pseudoneglect: a reviewand meta-analysis of performancefactors in line bisection tasks.Neuropsychologia 38, 93–110.
Kapadia, M. K., Ito, M., Gilbert, C.D., and Westheimer, G. (1995).Improvement in visual sensitivityby changes in local context: paral-lel studies in human observers andin V1 of alert monkeys. Neuron 15,843–856.
Kapadia, M. K., Westheimer, G., andGilbert, C. D. (1999). Dynamics ofspatial summation in primary visual
Frontiers in Human Neuroscience www.frontiersin.org December 2012 | Volume 6 | Article 330 | 11

Paradis et al. Speeding up the brain
cortex of alert monkeys. Proc. Natl.Acad. Sci. U.S.A. 96, 12073–12078.
Kapadia, M. K., Westheimer, G., andGilbert, C. D. (2000). Spatial dis-tribution of contextual interactionsin primary visual cortex and invisual perception. J. Neurophysiol.84, 2048–2062.
Kellman, P. J., and Shipley, T. F. (1991).A theory of visual interpolation inobject perception. Cogn. Psychol. 23,141–221.
Kisvarday, Z. F., Martin, K. A., Freund,T. F., Magloczky, Z., Whitteridge, D.,and Somogyi, P. (1986). Synaptictargets of HRP-filled layer III pyra-midal cells in the cat striate cortex.Exp. Brain Res. 64, 541–552.
Koffka, K. (1935). Principles of GestaltPsychology. NewYork, NY: Harcourt.
Kovács, I., and Julesz, B. (1993). Aclosed curve is much more thanan incomplete one: effect of clo-sure in figure-ground segmentation.Proc. Natl. Acad. Sci. U.S.A. 90,7495–7497.
Levitt, J. B., and Lund, J. S. (1997).Contrast dependence of contextualeffects in primate visual cortex.Nature 387, 73–76.
Levitt, J. B., and Lund, J. S. (2002).The spatial extent over which neu-rons in macaque striate cortex poolvisual signals. Vis. Neurosci. 19,439–452.
Lorenceau, J., Baudot, P., Seriès, P.,Georges, S., Pananceau, M., andFrégnac, Y. (2001). Modulationof apparent motion speed byhorizontal intracortical dynamics.J. Vis. 1:400. doi: 10.1167/1.3.400.Available online at: http://www.
journalofvision.org/content/401/403/400
Malach, R., Amir, Y., Harel, M., andGrinvald, A. (1993). Relationshipbetween intrinsic connections andfunctional architecture revealed byoptical imaging and in vivo targetedbiocytin injections in primate striatecortex. Proc. Natl. Acad. Sci. U.S.A.90, 10469–10473.
McGuire, B. A., Gilbert, C. D., Rivlin,P. K., and Wiesel, T. N. (1991).Targets of horizontal connectionsin macaque primary visual cortex.J. Comp. Neurol. 305, 370–392.
Meirovithz, E., Ayzenshtat, I., Bonneh,Y. S., Itzhack, R., Werner-Reiss,U., and Slovin, H. (2010).Population response to contex-tual influences in the primaryvisual cortex. Cereb. Cortex 20,1293–1304.
Nauhaus, I., Benucci, A., Carandini,M., and Ringach, D. L. (2008).Neuronal selectivity and local mapstructure in visual cortex. Neuron57, 673–679.
Nauhaus, I., Busse, L., Carandini,M., and Ringach, D. L. (2009).Stimulus contrast modulates func-tional connectivity in visual cortex.Nat. Neurosci. 12, 70–76.
Nauhaus, I., Busse, L., Ringach, D.L., and Carandini, M. (2012).Robustness of traveling waves inongoing activity of visual cortex.J. Neurosci. 32, 3088–3094.
Nelson, J. I., and Frost, B. J. (1985).Intracortical facilitation among co-oriented, co-axially aligned simplecells in cat striate cortex. Exp. BrainRes. 61, 54–61.
Paradis, A.-L., Arnal, L., Morel, S., andLorenceau, J. (2011). MEG corre-lates of perceptual apparent speed.Perception 40, 131. (ECVP abstractsupplement).
Peyrin, C., Chauvin, A., Chokron,S., and Marendaz, C. (2003).Hemispheric specialization forspatial frequency processing in theanalysis of natural scenes. BrainCogn. 53, 278–282.
Polat, U., Mizobe, K., Pettet, M. W.,Kasamatsu, T., and Norcia, A. M.(1998). Collinear stimuli regulatevisual responses depending on cell’scontrast threshold. Nature 391,580–584.
Polat, U., and Sagi, D. (1993). Lateralinteractions between spatial chan-nels: suppression and facilitation
revealed by lateral masking experi-ments. Vision Res. 33, 993–999.
Polat, U., and Sagi, D. (1994). Thearchitecture of perceptual spatialinteractions. Vision Res. 34, 73–78.
Polat, U., and Sagi, D. (2006). Temporalasymmetry of collinear lateral inter-actions. Vision Res. 46, 953–960.
Ray, S., and Maunsell, J. H. (2011).Network rhythms influence the rela-tionship between spike-triggeredlocal field potential and func-tional connectivity. J. Neurosci. 31,12674–12682.
Robinson, D. A. (1972). Eye move-ments evoked by collicular stimula-tion in the alert monkey. Vision Res.12, 1795–1808.
Schmidt, K. E., Goebel, R., Lowel,S., and Singer, W. (1997). Theperceptual grouping criterionof colinearity is reflected byanisotropies of connections inthe primary visual cortex. Eur. J.Neurosci. 9, 1083–1089.
Sereno, M., Dale, A., Reppas, J., Kwong,K., Belliveau, J., Brady, T., et al.(1995). Borders of multiple visualareas in humans revealed by func-tional magnetic resonance imaging.Science 268, 889–893.
Sergent, J. (1982). The cerebral balanceof power: confrontation or cooper-ation? J. Exp. Psychol. Hum. Percept.Perform. 8, 253–272.
Seriès, P., Georges, S., Lorenceau, J.,and Fregnac, Y. (2002). Orientationdependent modulation of apparentspeed: a model based on the dynam-ics of feed-forward and horizontalconnectivity in V1 cortex. VisionRes. 42, 2781–2797.
Sharon, D., Jancke, D., Chavane, F.,Na’aman, S., and Grinvald, A.(2007). Cortical response fielddynamics in cat visual cortex. Cereb.Cortex 17, 2866–2877.
Siegel, R. M., and Andersen, R.A. (1988). Perception of three-dimensional structure from motionin monkey and man. Nature 331,259–261.
Sincich, L. C., and Blasdel, G. G. (2001).Oriented axon projections in pri-mary visual cortex of the monkey.J. Neurosci. 21, 4416–4426.
Ts’o, D. Y., Gilbert, C. D., and Wiesel,T. N. (1986). Relationships betweenhorizontal interactions and func-tional architecture in cat striatecortex as revealed by cross-correlation analysis. J. Neurosci. 6,1160–1170.
Usher, M., and Donnelly, N. (1998).Visual synchrony affects bindingand segmentation in perception.Nature 394, 179–182.
Van Rullen, R., Delorme, A., andThorpe, S. J. (2001). Feed-forwardcontour integration in primaryvisual cortex based on asyn-chronous spike propagation.Neurocomputing 38–40, 1003–1009.
Wurtz, R. H., and Albano, J. E. (1980).Visual-motor function of the pri-mate superior colliculus. Annu. Rev.Neurosci. 3, 189–226.
Conflict of Interest Statement: Theauthors declare that the researchwas conducted in the absence of anycommercial or financial relationshipsthat could be construed as a potentialconflict of interest.
Received: 30 July 2012; accepted: 28November 2012; published online: 19December 2012.Citation: Paradis A-L, Morel S, Seriès Pand Lorenceau J (2012) Speeding up thebrain: when spatial facilitation translatesinto latency shortening. Front. Hum.Neurosci. 6:330. doi: 10.3389/fnhum.2012.00330Copyright © 2012 Paradis, Morel,Seriès and Lorenceau. This is an open-access article distributed under the termsof the Creative Commons AttributionLicense, which permits use, distributionand reproduction in other forums, pro-vided the original authors and sourceare credited and subject to any copy-right notices concerning any third-partygraphics etc.
Frontiers in Human Neuroscience www.frontiersin.org December 2012 | Volume 6 | Article 330 | 12

Paradis et al. Speeding up the brain
APPENDIX: MODEL DESCRIPTIONThe model describes a network of N neurons in early visual cortex(e.g. V1), with non-overlapping receptive fields. Those N neuronsare interconnected through lateral connections.
NEURON MODELEach neuron i is described using a conductance-based integrate-and-fire model:
τmdVi
dt= EL − Vi + RmIS
i + Ilati (1)
where EL = −65 mV, Rm = 40 M, τM = 30 msec. When themembrane potential reaches Vth = −50 mV, the neuron fires aspike and the potential is reset to Vreset = −65 mV. Is denotes thevisual feed-forward input, while Ilat denotes the recurrent input(cf below).
STIMULUS INPUTIs is a function of the contrast of the image patch shown in thereceptive field,
ISi = K.log10(ci + c0.G(θ − θi) + c1) (2)
with K = 0.3, c0 = 7 and c1 = 10 and ci in range [1, 100]. Weassume that the neurons are stimulated with their preferred orien-tation: G(θ − θi) = 1 if there is a stimulus in their receptive field,and 0 otherwise.
This model and the parameters of the neuron were chosenso that the latency response approximates experimental data inmonkey visual cortex [1] (Figure 1).
The contrast of the image patches are computed using thestandard deviation of the normalized luminance values:
ci =√√√√√ 1
MN
N∑k = 1
M∑j = 1
(Ikj− < I >
)2(3)
where < I > denotes the mean normalized luminance in thepatch and where Ikj are the kth − jth element of the two dimen-sional image patch of size M × N shown in the receptive field.
LATERAL INPUTThe neurons are connected via long-range horizontal connectionsand excitatory synapses.
Ilati = −
∑j
rmgij(V − Es) (4)
with Es = 0 mV. Pij follows:
τSdPij
dt= −Pij (5)
making the replacement Pij →1 after each presynaptic actionpotential of neuron j and with a synaptic delay τij. τs is set to5 ms. and the delay between two adjacent neuron is fixed toτij = 2 msec.
Because each neuron is representative of a larger population ofneurons sensitive to the same region of visual space, the ampli-tude of the PSPs is assumed to describe that of a compound EPSP.The value of gij is chosen so that long-range horizontal inputs arenot strong enough to elicit a spike by themselves.
Synaptic weights are assumed to decrease linearly with dis-tance, while delays increase linearly.
Frontiers in Human Neuroscience www.frontiersin.org December 2012 | Volume 6 | Article 330 | 13
Related Documents