Speech Quality based on Arabic Pronunciation using MFCC and LDA: Investigating the Emphatic Consonants N.S.Zahra Zainon School of Computer Engineering Universiti Malaysia Perlis Kangar, Malaysia [email protected] om Z.A. Ahmad School of Computer Engineering Universiti Malaysia Perlis Kangar, Malaysia [email protected] M.A. Romli School of Computer Engineering Universiti Malaysia Perlis Kangar, Malaysia [email protected] S. Yaacob School of Mechatronic Engineering Universiti Malaysia Perlis Kangar, Malaysia [email protected]. my Abstract— Arabic is widely considered as one of the most difficult languages which made up of phoneme-based and has its own category. In that regard, determining its speech quality is a big challenge. The letters that particularly found difficulties are the emphatics and many speakers do find articulating these letters as a challenge. The emphatic consonants are ﺺ(sad), ﺽ(Dhad), ﻂ(Taa’), ﻆ(Dzo) and ﻕ(Qaf). In this study, we investigate these five letters of Arabic, which are spoken by non-native people using speech evaluating approach. Speech samples were recorded using Malaysian students and employing the International Phonetic Alphabet of Arabic chart as a reference. The recorded sound was analyzed and tested based on different coefficients of Mel-Frequency Ceptral Coefficient (MFCC) for feature extraction whilst the classifier used is a Linear Discriminat Analysis (LDA). The results showed that, among the letters, the highest accuracy rate achieved is 92.500% for ط(Taa’), when training for 80% of data by using 35 Coefficients of MFCC. Keywords—Emphatic consonants, Speech evaluating, Mel-Frequency Cepstral Coefficient (MFCC), Linear Discriminat Analysis (LDA). I. INTRODUCTION Speech is the primary means of communication between people. Arabic is one of the common languages to all Arabic-speaking countries and it is also spoken by people throughout the Muslim world, as it is the language of The Quran. In Arabic, not pronouncing the language correctly can change the meaning of the words. This problem occurs, especially, for emphatic alphabets as the co-articulation effect caused by emphatic phonemes can affect adjacent phonemes especially vowels [1]. Much of the complexity of the Arabic language is found at the morphological level as it has a rich and productive morphology, which leads to a large number of potential word forms [2]. Like other language, Arabic has its own unique consonants which are the emphatics phonemes /ᵴ/, /ᵭ/, /ᵵ/, /ᵶ/ and also /q/ [3]. These unique consonants also sometimes refer as the pharyngealized consonants. From these five emphatic phonemes, they are only two types of manner of production which is fricative for /ᵴ/ and /ᵶ/ meanwhile /ᵭ/, /ᵵ/ and /q/ is a plosive. Fricative sound produced as the air escaped a narrow constriction in the mouth while plosive refers to behavior of sound produced by stopping the airflow in the mouth. It also calls as stop or spirant [4]. Speech assessment using Arabic word might not be as popular as English, Japanese, Spanish or even Mandarin [2][5]. At present, there are no established methods for speech classification using Arabic words however related works can be found in [6][7][8]. However, there are many ways on evaluating speech. One of the ways is speech quality. Speech quality is a multi-dimensional term and its evaluation contains several problems. It is very difficult; to say which test method that provides the optimal evaluation. The common approach is either through a subject test or speech processing [9]. With the adverse of communication, signal processing has taken precedence to become the forth rant in the technology in accessing speech quality. On determination of speech signal, pre-processing and linguistic realization will give impacts towards final speech quality. There are many methods on feature extraction as well as classifiers proposed by researchers today as speech synthesis, automatic generation of speech waveforms, has been under development for several decades. Some common feature extraction methods are Linear Predictive Coding (LPC), Mel- Frequency Ceptral Coefficient (MFCC) and Spectrographic Analysis [10]. While in classifier stage, the regular techniques used are Hidden Markov Models (HMM), Vector Quantization (VQ) and Artificial Neural Network (ANN) [10]. The aims of this paper are twofold which is to build a database and assessment of speech processing by 2012 IEEE International Conference on Control System, Computing and Engineering, 23 - 25 Nov. 2012, Penang, Malaysia 978-1-4673-3141-8©2012 IEEE

Welcome message from author
This document is posted to help you gain knowledge. Please leave a comment to let me know what you think about it! Share it to your friends and learn new things together.
Transcript
Speech Quality based on Arabic Pronunciation
using MFCC and LDA: Investigating the Emphatic Consonants
N.S.Zahra Zainon School of Computer
Engineering
Universiti Malaysia
Perlis
Kangar, Malaysia
om
Z.A. Ahmad
School of Computer
Engineering
Universiti Malaysia
Perlis
Kangar, Malaysia
M.A. Romli
School of Computer
Engineering
Universiti Malaysia
Perlis
Kangar, Malaysia
S. Yaacob School of Mechatronic
Engineering
Universiti Malaysia
Perlis
Kangar, Malaysia
my
Abstract— Arabic is widely considered as one of the most
difficult languages which made up of phoneme-based and
has its own category. In that regard, determining its
speech quality is a big challenge. The letters that
particularly found difficulties are the emphatics and many
speakers do find articulating these letters as a challenge.
The emphatic consonants are ص (sad), ض (Dhad), ط (Taa’),
In this study, we investigate these five .(Qaf) ق and (Dzo) ظ
letters of Arabic, which are spoken by non-native people
using speech evaluating approach. Speech samples were
recorded using Malaysian students and employing the
International Phonetic Alphabet of Arabic chart as a
reference. The recorded sound was analyzed and tested
based on different coefficients of Mel-Frequency Ceptral
Coefficient (MFCC) for feature extraction whilst the
classifier used is a Linear Discriminat Analysis (LDA). The
results showed that, among the letters, the highest
accuracy rate achieved is 92.500% for ط (Taa’), when
training for 80% of data by using 35 Coefficients of
MFCC.
Keywords—Emphatic consonants, Speech evaluating,
Mel-Frequency Cepstral Coefficient (MFCC), Linear
Discriminat Analysis (LDA).
I. INTRODUCTION
Speech is the primary means of communication
between people. Arabic is one of the common languages
to all Arabic-speaking countries and it is also spoken by
people throughout the Muslim world, as it is the
language of The Quran. In Arabic, not pronouncing the
language correctly can change the meaning of the
words. This problem occurs, especially, for emphatic
alphabets as the co-articulation effect caused by
emphatic phonemes can affect adjacent phonemes
especially vowels [1]. Much of the complexity of the
Arabic language is found at the morphological level as
it has a rich and productive morphology, which leads to
a large number of potential word forms [2].
Like other language, Arabic has its own unique
consonants which are the emphatics phonemes /ᵴ/, /ᵭ/,
/ᵵ/, /ᵶ/ and also /q/ [3]. These unique consonants also
sometimes refer as the pharyngealized consonants.
From these five emphatic phonemes, they are only two
types of manner of production which is fricative for /ᵴ/
and /ᵶ/ meanwhile /ᵭ/, /ᵵ/ and /q/ is a plosive. Fricative
sound produced as the air escaped a narrow constriction
in the mouth while plosive refers to behavior of sound
produced by stopping the airflow in the mouth. It also
calls as stop or spirant [4].
Speech assessment using Arabic word might not be
as popular as English, Japanese, Spanish or even
Mandarin [2][5]. At present, there are no established
methods for speech classification using Arabic words
however related works can be found in [6][7][8].
However, there are many ways on evaluating speech.
One of the ways is speech quality. Speech quality is a
multi-dimensional term and its evaluation contains
several problems. It is very difficult; to say which test
method that provides the optimal evaluation. The
common approach is either through a subject test or
speech processing [9].
With the adverse of communication, signal
processing has taken precedence to become the forth
rant in the technology in accessing speech quality. On
determination of speech signal, pre-processing and
linguistic realization will give impacts towards final
speech quality. There are many methods on feature
extraction as well as classifiers proposed by researchers
today as speech synthesis, automatic generation of
speech waveforms, has been under development for
several decades. Some common feature extraction
methods are Linear Predictive Coding (LPC), Mel-
Frequency Ceptral Coefficient (MFCC) and
Spectrographic Analysis [10]. While in classifier stage,
the regular techniques used are Hidden Markov Models
(HMM), Vector Quantization (VQ) and Artificial
Neural Network (ANN) [10].
The aims of this paper are twofold which is to build
a database and assessment of speech processing by
2012 IEEE International Conference on Control System, Computing and Engineering, 23 - 25 Nov. 2012, Penang, Malaysia
978-1-4673-3141-8©2012 IEEE
using speech evaluation approach. The outline of the
paper is as follow; Section I. Introduction, Section II.
Emphatic Characteristics, Section III. Methodology,
Section IV. Result and discussion and Section V.
Conclusion.
II. EMPHATIC CHARACTERISTICS
As the emphatic consonants for non-Arabic
speakers, it could be very difficult to get the Makhraj
(exact point of articulation of the Arabic letters) for
some of the letters right. Why are these consonants
problematic? The reasons behind the difficulty of these
consonants are both the place and mechanisms of
articulation. All the above-mentioned sounds are related
to the pharynx, an inactive articulatory area which
explains why such sounds are difficult to perceive and
articulate. The production of pharyngealized consonants
involves the trimovement of the tongue: the apex rising
towards the place of articulation, the back moving
towards the soft palate and the retraction of the dorsum
or root of the tongue, which is described as velarization.
The secondary movements of the dorsum and the back
of the tongue give these consonants the emphatic value
which sets them apart from their counterpart phonemes
[1].
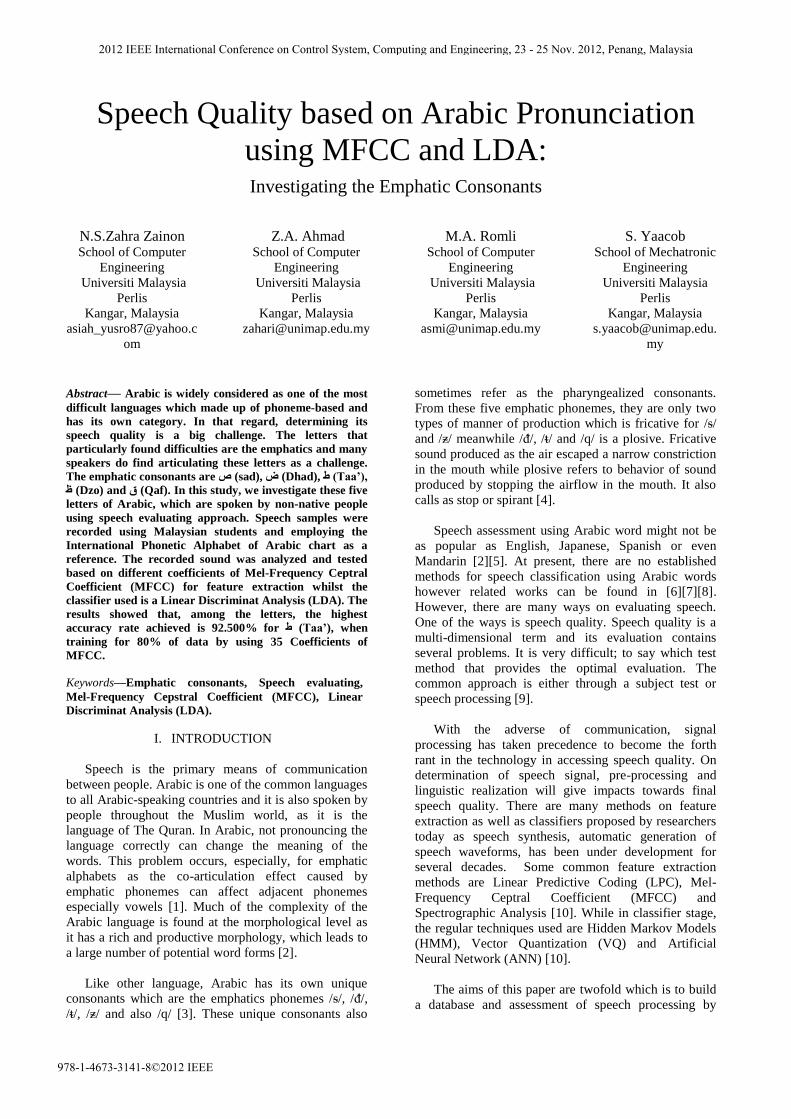
From 28 letters of Hijaiyah, respectively, were
divided into several properties. There are five groups of
properties that can be delegated to a) very strong, b)
strong, c) very poor, 4) weak and 5) very weak [11].
However, this paper will focus on five of the letters
which were deemed to have a very strong character ص
(Saad), ض (Daad), ط (Taa‟), ظ (Zaa‟) and ق (Qaaf). Fig.
1 show the place of articulation for each alphabet in
Arabic while TABLE I is a summary list of the five
letters separately with each letter indicates the mode of
production and point of articulation with specific
Makhraj.
Fig. 1. Places of articulation [4].
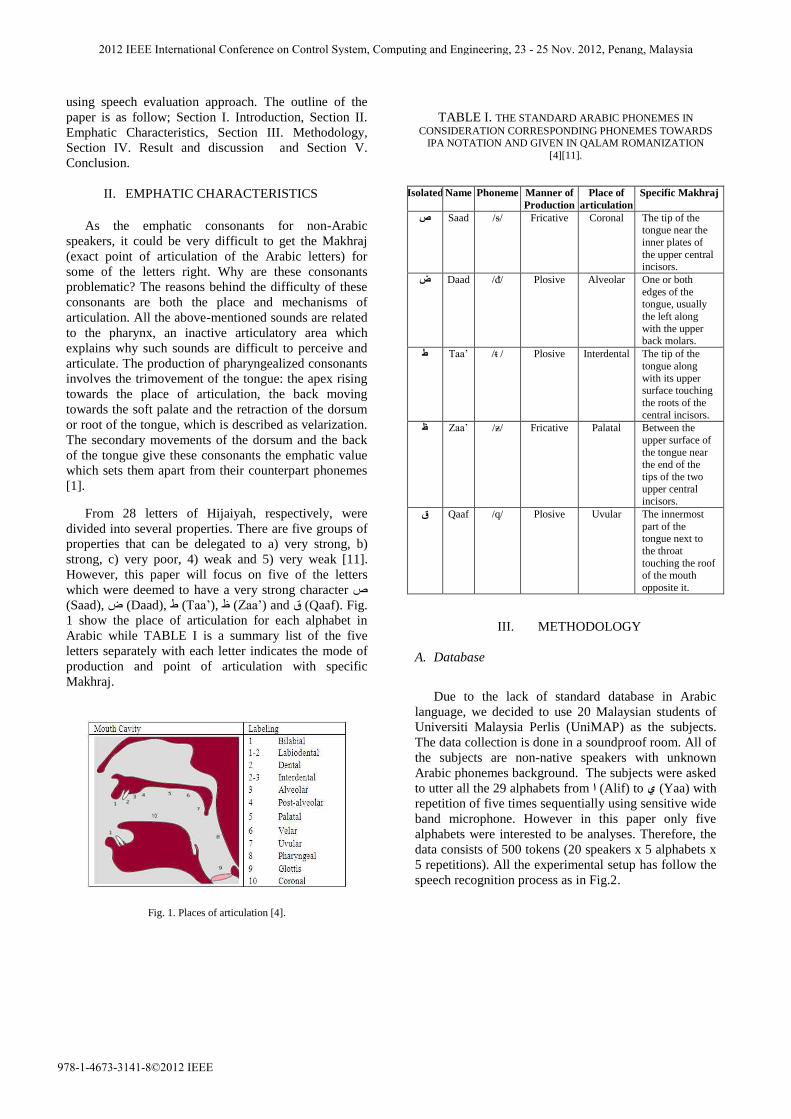
TABLE I. THE STANDARD ARABIC PHONEMES IN
CONSIDERATION CORRESPONDING PHONEMES TOWARDS IPA NOTATION AND GIVEN IN QALAM ROMANIZATION
[4][11].
Isolated Name Phoneme Manner of
Production
Place of
articulation
Specific Makhraj
Saad /ᵴ/ Fricative Coronal The tip of the صtongue near the
inner plates of
the upper central incisors.
Daad /ᵭ/ Plosive Alveolar One or both ض
edges of the tongue, usually
the left along
with the upper back molars.
Taa‟ /ᵵ / Plosive Interdental The tip of the ط
tongue along
with its upper surface touching
the roots of the
central incisors.
Zaa‟ /ᵶ/ Fricative Palatal Between the ظ
upper surface of
the tongue near the end of the
tips of the two
upper central incisors.
Qaaf /q/ Plosive Uvular The innermost ق
part of the tongue next to
the throat
touching the roof of the mouth
opposite it.
III. METHODOLOGY
A. Database
Due to the lack of standard database in Arabic
language, we decided to use 20 Malaysian students of
Universiti Malaysia Perlis (UniMAP) as the subjects.
The data collection is done in a soundproof room. All of
the subjects are non-native speakers with unknown
Arabic phonemes background. The subjects were asked
to utter all the 29 alphabets from ا (Alif) to ي (Yaa) with
repetition of five times sequentially using sensitive wide
band microphone. However in this paper only five
alphabets were interested to be analyses. Therefore, the
data consists of 500 tokens (20 speakers x 5 alphabets x
5 repetitions). All the experimental setup has follow the
speech recognition process as in Fig.2.
2012 IEEE International Conference on Control System, Computing and Engineering, 23 - 25 Nov. 2012, Penang, Malaysia
978-1-4673-3141-8©2012 IEEE
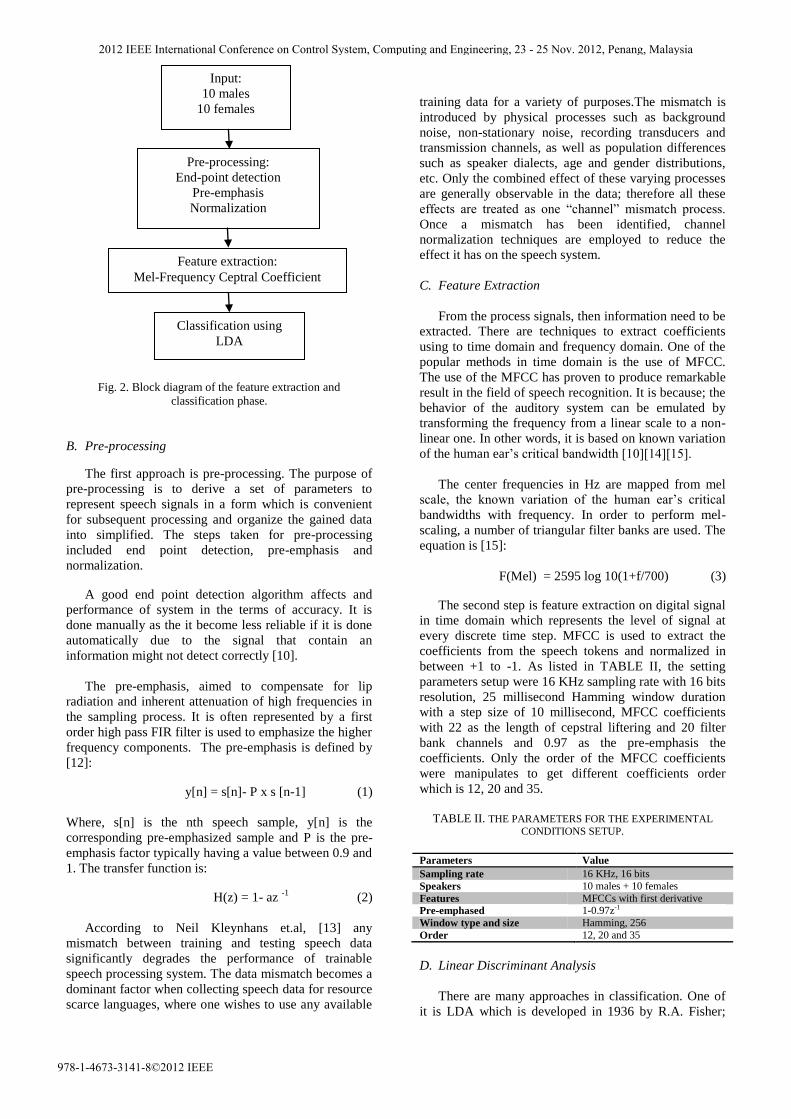
Fig. 2. Block diagram of the feature extraction and
classification phase.
B. Pre-processing
The first approach is pre-processing. The purpose of
pre-processing is to derive a set of parameters to
represent speech signals in a form which is convenient
for subsequent processing and organize the gained data
into simplified. The steps taken for pre-processing
included end point detection, pre-emphasis and
normalization.
A good end point detection algorithm affects and
performance of system in the terms of accuracy. It is
done manually as the it become less reliable if it is done
automatically due to the signal that contain an
information might not detect correctly [10].
The pre-emphasis, aimed to compensate for lip
radiation and inherent attenuation of high frequencies in
the sampling process. It is often represented by a first
order high pass FIR filter is used to emphasize the higher
frequency components. The pre-emphasis is defined by
[12]:
y[n] = s[n]- P x s [n-1] (1)
Where, s[n] is the nth speech sample, y[n] is the
corresponding pre-emphasized sample and P is the pre-
emphasis factor typically having a value between 0.9 and
1. The transfer function is:
H(z) = 1- az -1
(2)
According to Neil Kleynhans et.al, [13] any
mismatch between training and testing speech data
significantly degrades the performance of trainable
speech processing system. The data mismatch becomes a
dominant factor when collecting speech data for resource
scarce languages, where one wishes to use any available
training data for a variety of purposes.The mismatch is
introduced by physical processes such as background
noise, non-stationary noise, recording transducers and
transmission channels, as well as population differences
such as speaker dialects, age and gender distributions,
etc. Only the combined effect of these varying processes
are generally observable in the data; therefore all these
effects are treated as one “channel” mismatch process.
Once a mismatch has been identified, channel
normalization techniques are employed to reduce the
effect it has on the speech system.
C. Feature Extraction
From the process signals, then information need to be
extracted. There are techniques to extract coefficients
using to time domain and frequency domain. One of the
popular methods in time domain is the use of MFCC.
The use of the MFCC has proven to produce remarkable
result in the field of speech recognition. It is because; the
behavior of the auditory system can be emulated by
transforming the frequency from a linear scale to a non-
linear one. In other words, it is based on known variation
of the human ear‟s critical bandwidth [10][14][15].
The center frequencies in Hz are mapped from mel
scale, the known variation of the human ear‟s critical
bandwidths with frequency. In order to perform mel-
scaling, a number of triangular filter banks are used. The
equation is [15]:
F(Mel) = 2595 log 10(1+f/700) (3)
The second step is feature extraction on digital signal
in time domain which represents the level of signal at
every discrete time step. MFCC is used to extract the
coefficients from the speech tokens and normalized in
between +1 to -1. As listed in TABLE II, the setting
parameters setup were 16 KHz sampling rate with 16 bits
resolution, 25 millisecond Hamming window duration
with a step size of 10 millisecond, MFCC coefficients
with 22 as the length of cepstral liftering and 20 filter
bank channels and 0.97 as the pre-emphasis the
coefficients. Only the order of the MFCC coefficients
were manipulates to get different coefficients order
which is 12, 20 and 35.
TABLE II. THE PARAMETERS FOR THE EXPERIMENTAL
CONDITIONS SETUP.
Parameters Value
Sampling rate 16 KHz, 16 bits
Speakers 10 males + 10 females
Features MFCCs with first derivative
Pre-emphased 1-0.97z-1
Window type and size Hamming, 256
Order 12, 20 and 35
D. Linear Discriminant Analysis
There are many approaches in classification. One of
it is LDA which is developed in 1936 by R.A. Fisher;
Feature extraction:
Mel-Frequency Ceptral Coefficient
Input:
10 males
10 females
Pre-processing:
End-point detection
Pre-emphasis
Normalization
Classification using
LDA
2012 IEEE International Conference on Control System, Computing and Engineering, 23 - 25 Nov. 2012, Penang, Malaysia
978-1-4673-3141-8©2012 IEEE
Discriminant Analysis is a classic method of
classification that has stood the test of time. Discriminant
analysis often produces models whose accuracy
approaches (and occasionally exceeds) more complex
modern methods. LDA has two functions which is data
classification as well as dimensionality reduction. It also
provides more class separability and draws a decision
region between the given classes. This method also helps
to better understand the distribution of the feature data
[16].
LDA involves the determination of a linear equation
like regression that will predict which group the case
belongs to. The equation is [17]:
D = v1 X1 + v2 X2 + v3 X3 + ........+ vi Xi + a (4)
Where D = discriminate function
v = the discriminant coefficient or weight for that
variable
X = respondent‟s score for that variable
a = a constant
i = the number of predictor variables
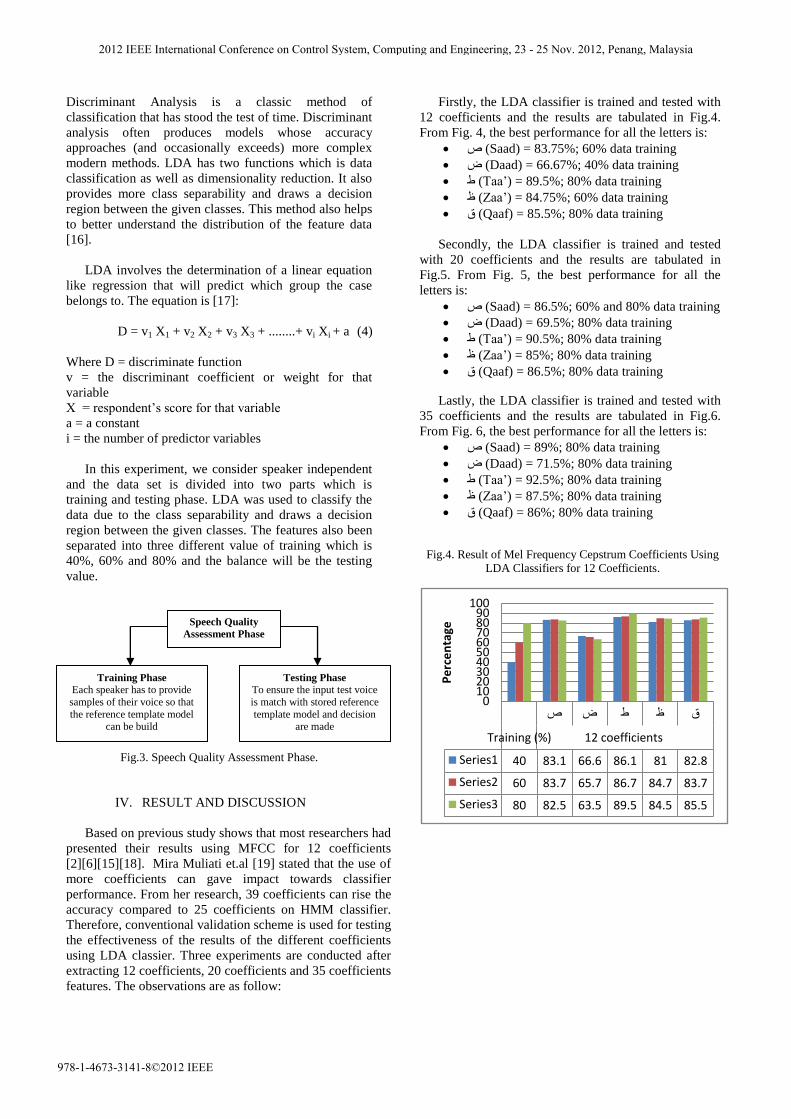
In this experiment, we consider speaker independent
and the data set is divided into two parts which is
training and testing phase. LDA was used to classify the
data due to the class separability and draws a decision
region between the given classes. The features also been
separated into three different value of training which is
40%, 60% and 80% and the balance will be the testing
value.
Fig.3. Speech Quality Assessment Phase.
IV. RESULT AND DISCUSSION
Based on previous study shows that most researchers had
presented their results using MFCC for 12 coefficients
[2][6][15][18]. Mira Muliati et.al [19] stated that the use of
more coefficients can gave impact towards classifier
performance. From her research, 39 coefficients can rise the
accuracy compared to 25 coefficients on HMM classifier.
Therefore, conventional validation scheme is used for testing
the effectiveness of the results of the different coefficients
using LDA classier. Three experiments are conducted after
extracting 12 coefficients, 20 coefficients and 35 coefficients
features. The observations are as follow:
Firstly, the LDA classifier is trained and tested with
12 coefficients and the results are tabulated in Fig.4.
From Fig. 4, the best performance for all the letters is:
ص (Saad) = 83.75%; 60% data training
ض (Daad) = 66.67%; 40% data training
ط (Taa‟) = 89.5%; 80% data training
ظ (Zaa‟) = 84.75%; 60% data training
ق (Qaaf) = 85.5%; 80% data training
Secondly, the LDA classifier is trained and tested
with 20 coefficients and the results are tabulated in
Fig.5. From Fig. 5, the best performance for all the
letters is:
ص (Saad) = 86.5%; 60% and 80% data training
ض (Daad) = 69.5%; 80% data training
ط (Taa‟) = 90.5%; 80% data training
ظ (Zaa‟) = 85%; 80% data training
ق (Qaaf) = 86.5%; 80% data training
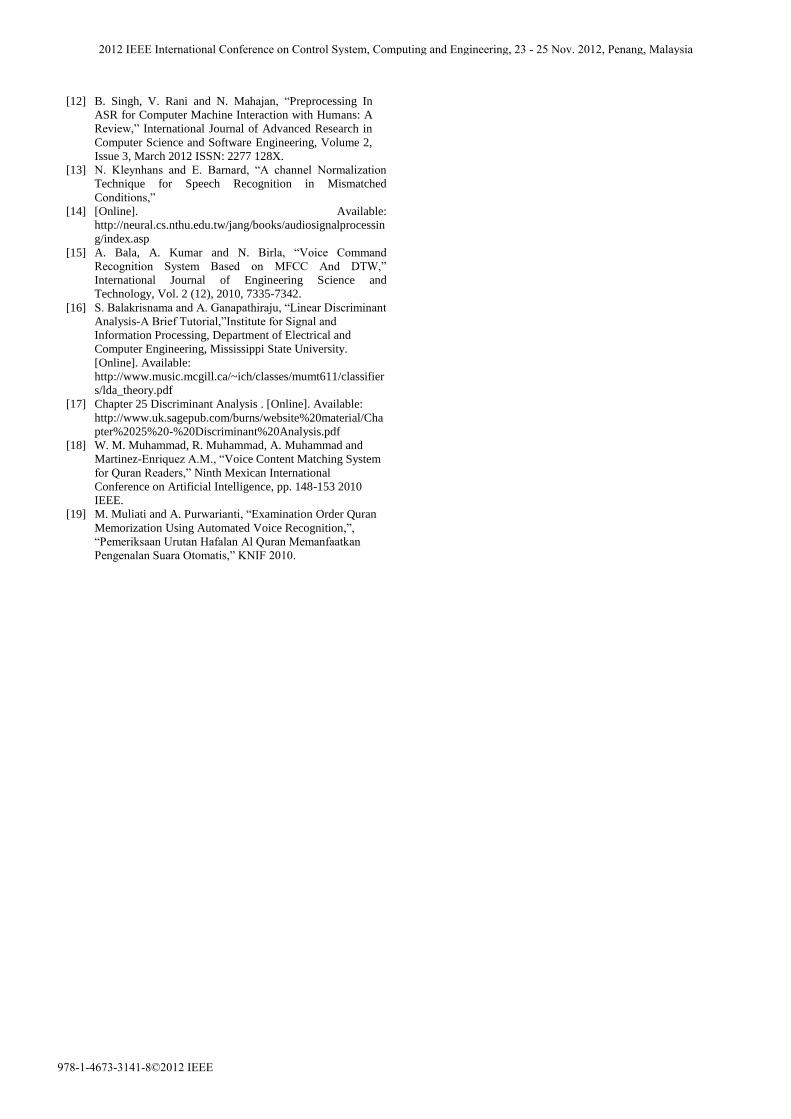
Lastly, the LDA classifier is trained and tested with
35 coefficients and the results are tabulated in Fig.6.
From Fig. 6, the best performance for all the letters is:
ص (Saad) = 89%; 80% data training
ض (Daad) = 71.5%; 80% data training
ط (Taa‟) = 92.5%; 80% data training
ظ (Zaa‟) = 87.5%; 80% data training
ق (Qaaf) = 86%; 80% data training
Fig.4. Result of Mel Frequency Cepstrum Coefficients Using
LDA Classifiers for 12 Coefficients.
ص ض ط ظ ق
Training (%) 12 coefficients
Series1 40 83.1 66.6 86.1 81 82.8
Series2 60 83.7 65.7 86.7 84.7 83.7
Series3 80 82.5 63.5 89.5 84.5 85.5
0102030405060708090
100
Percentage
Speech Quality
Assessment Phase
Training Phase
Each speaker has to provide
samples of their voice so that
the reference template model
can be build
Testing Phase
To ensure the input test voice
is match with stored reference
template model and decision
are made
2012 IEEE International Conference on Control System, Computing and Engineering, 23 - 25 Nov. 2012, Penang, Malaysia
978-1-4673-3141-8©2012 IEEE
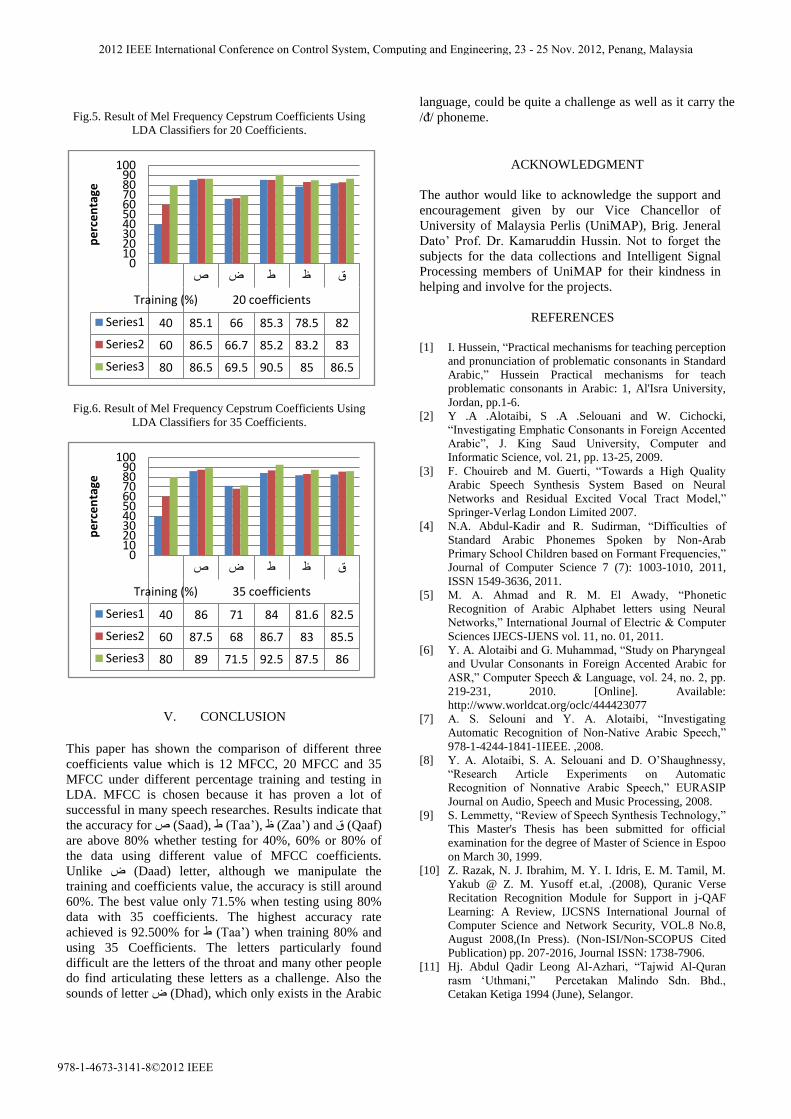
Fig.5. Result of Mel Frequency Cepstrum Coefficients Using
LDA Classifiers for 20 Coefficients.
Fig.6. Result of Mel Frequency Cepstrum Coefficients Using
LDA Classifiers for 35 Coefficients.
V. CONCLUSION
This paper has shown the comparison of different three
coefficients value which is 12 MFCC, 20 MFCC and 35
MFCC under different percentage training and testing in
LDA. MFCC is chosen because it has proven a lot of
successful in many speech researches. Results indicate that
the accuracy for ص (Saad), ط (Taa‟), ظ (Zaa‟) and ق (Qaaf)
are above 80% whether testing for 40%, 60% or 80% of
the data using different value of MFCC coefficients.
Unlike ض (Daad) letter, although we manipulate the
training and coefficients value, the accuracy is still around
60%. The best value only 71.5% when testing using 80%
data with 35 coefficients. The highest accuracy rate
achieved is 92.500% for ط (Taa‟) when training 80% and
using 35 Coefficients. The letters particularly found
difficult are the letters of the throat and many other people
do find articulating these letters as a challenge. Also the
sounds of letter ض (Dhad), which only exists in the Arabic
language, could be quite a challenge as well as it carry the
/ᵭ/ phoneme.
ACKNOWLEDGMENT
The author would like to acknowledge the support and
encouragement given by our Vice Chancellor of
University of Malaysia Perlis (UniMAP), Brig. Jeneral
Dato‟ Prof. Dr. Kamaruddin Hussin. Not to forget the
subjects for the data collections and Intelligent Signal
Processing members of UniMAP for their kindness in
helping and involve for the projects.
REFERENCES
[1] I. Hussein, “Practical mechanisms for teaching perception
and pronunciation of problematic consonants in Standard
Arabic,” Hussein Practical mechanisms for teach
problematic consonants in Arabic: 1, Al'Isra University,
Jordan, pp.1-6.
[2] Y .A .Alotaibi, S .A .Selouani and W. Cichocki,
“Investigating Emphatic Consonants in Foreign Accented
Arabic”, J. King Saud University, Computer and
Informatic Science, vol. 21, pp. 13-25, 2009.
[3] F. Chouireb and M. Guerti, “Towards a High Quality
Arabic Speech Synthesis System Based on Neural
Networks and Residual Excited Vocal Tract Model,”
Springer-Verlag London Limited 2007.
[4] N.A. Abdul-Kadir and R. Sudirman, “Difficulties of
Standard Arabic Phonemes Spoken by Non-Arab
Primary School Children based on Formant Frequencies,”
Journal of Computer Science 7 (7): 1003-1010, 2011,
ISSN 1549-3636, 2011.
[5] M. A. Ahmad and R. M. El Awady, “Phonetic
Recognition of Arabic Alphabet letters using Neural
Networks,” International Journal of Electric & Computer
Sciences IJECS-IJENS vol. 11, no. 01, 2011.
[6] Y. A. Alotaibi and G. Muhammad, “Study on Pharyngeal
and Uvular Consonants in Foreign Accented Arabic for
ASR,” Computer Speech & Language, vol. 24, no. 2, pp.
219-231, 2010. [Online]. Available:
http://www.worldcat.org/oclc/444423077
[7] A. S. Selouni and Y. A. Alotaibi, “Investigating
Automatic Recognition of Non-Native Arabic Speech,”
978-1-4244-1841-1IEEE. ,2008.
[8] Y. A. Alotaibi, S. A. Selouani and D. O‟Shaughnessy,
“Research Article Experiments on Automatic
Recognition of Nonnative Arabic Speech,” EURASIP
Journal on Audio, Speech and Music Processing, 2008.
[9] S. Lemmetty, “Review of Speech Synthesis Technology,”
This Master's Thesis has been submitted for official
examination for the degree of Master of Science in Espoo
on March 30, 1999.
[10] Z. Razak, N. J. Ibrahim, M. Y. I. Idris, E. M. Tamil, M.
Yakub @ Z. M. Yusoff et.al, .(2008), Quranic Verse
Recitation Recognition Module for Support in j-QAF
Learning: A Review, IJCSNS International Journal of
Computer Science and Network Security, VOL.8 No.8,
August 2008,(In Press). (Non-ISI/Non-SCOPUS Cited
Publication) pp. 207-2016, Journal ISSN: 1738-7906.
[11] Hj. Abdul Qadir Leong Al-Azhari, “Tajwid Al-Quran
rasm „Uthmani,” Percetakan Malindo Sdn. Bhd.,
Cetakan Ketiga 1994 (June), Selangor.
ص ض ط ظ ق
Training (%) 20 coefficients
Series1 40 85.1 66 85.3 78.5 82
Series2 60 86.5 66.7 85.2 83.2 83
Series3 80 86.5 69.5 90.5 85 86.5
0102030405060708090
100
percentage
ص ض ط ظ ق
Training (%) 35 coefficients
Series1 40 86 71 84 81.6 82.5
Series2 60 87.5 68 86.7 83 85.5
Series3 80 89 71.5 92.5 87.5 86
0102030405060708090
100
percentage
2012 IEEE International Conference on Control System, Computing and Engineering, 23 - 25 Nov. 2012, Penang, Malaysia
978-1-4673-3141-8©2012 IEEE
[12] B. Singh, V. Rani and N. Mahajan, “Preprocessing In
ASR for Computer Machine Interaction with Humans: A
Review,” International Journal of Advanced Research in
Computer Science and Software Engineering, Volume 2,
Issue 3, March 2012 ISSN: 2277 128X.
[13] N. Kleynhans and E. Barnard, “A channel Normalization
Technique for Speech Recognition in Mismatched
Conditions,”
[14] [Online]. Available:
http://neural.cs.nthu.edu.tw/jang/books/audiosignalprocessin
g/index.asp
[15] A. Bala, A. Kumar and N. Birla, “Voice Command
Recognition System Based on MFCC And DTW,”
International Journal of Engineering Science and
Technology, Vol. 2 (12), 2010, 7335-7342.
[16] S. Balakrisnama and A. Ganapathiraju, “Linear Discriminant
Analysis-A Brief Tutorial,”Institute for Signal and
Information Processing, Department of Electrical and
Computer Engineering, Mississippi State University.
[Online]. Available:
http://www.music.mcgill.ca/~ich/classes/mumt611/classifier
s/lda_theory.pdf
[17] Chapter 25 Discriminant Analysis . [Online]. Available:
http://www.uk.sagepub.com/burns/website%20material/Cha
pter%2025%20-%20Discriminant%20Analysis.pdf
[18] W. M. Muhammad, R. Muhammad, A. Muhammad and
Martinez-Enriquez A.M., “Voice Content Matching System
for Quran Readers,” Ninth Mexican International
Conference on Artificial Intelligence, pp. 148-153 2010
IEEE.
[19] M. Muliati and A. Purwarianti, “Examination Order Quran
Memorization Using Automated Voice Recognition,”,
“Pemeriksaan Urutan Hafalan Al Quran Memanfaatkan
Pengenalan Suara Otomatis,” KNIF 2010.
2012 IEEE International Conference on Control System, Computing and Engineering, 23 - 25 Nov. 2012, Penang, Malaysia
978-1-4673-3141-8©2012 IEEE
Related Documents