Tobias Rader Speech Perception of Cochlear Implanted Patients with Combined Electric-Acoustic Stimulation

Welcome message from author
This document is posted to help you gain knowledge. Please leave a comment to let me know what you think about it! Share it to your friends and learn new things together.
Transcript

Tobias Rader
Speech Perception of Cochlear Implanted Patientswith Combined Electric-Acoustic Stimulation

TECHNISCHE UNIVERSITÄT MÜNCHENLehrstuhl für Mensch-Maschine-Kommunikation
AG Technische Akustik
Speech Perception of Cochlear Implanted Patientswith Combined Electric-Acoustic Stimulation
Tobias M.Rader
Vollständiger Abdruck der von der Fakultät für Elektrotechnik und Informationstechnikder Technischen Universität München zur Erlangung des akademischen Grades eines
Doktor-Ingenieurs (Dr.-Ing.)
genehmigten Dissertation.
Vorsitzende: Univ.-Prof. Dr. rer. nat. Doris Schmitt-Landsiedel
Prüfer der Dissertation: 1. apl. Prof. Dr.-Ing., Dr.-Ing. habil. Hugo Fastl2. Univ.-Prof. Dr.-Ing. Klaus Diepold3. Univ.-Prof. Dr.-Ing. Uwe Baumann
Johann Wolfgang Goethe-Universität Frankfurt am Main
Die Dissertation wurde am 05. Oktober 2011 bei der Technischen UniversitätMüncheneingereicht und durch die Fakultät für Elektrotechnik und Informationstechnik am23. Februar 2012 angenommen.


Meinen Eltern.


Contents
Introduction 1
1 Speech perception in a multi-source noise field 51.1 Summary of chapter 1 . . . . . . . . . . . . . . . . . . . . . . . . . . . . . 51.2 Introduction . . . . . . . . . . . . . . . . . . . . . . . . . . . . . . . . . . . 61.3 Material and methods . . . . . . . . . . . . . . . . . . . . . . . . . . . . . 7
1.3.1 Subjects . . . . . . . . . . . . . . . . . . . . . . . . . . . . . . . . . 71.3.2 Experimental set-up . . . . . . . . . . . . . . . . . . . . . . . . . . 91.3.3 Speech test . . . . . . . . . . . . . . . . . . . . . . . . . . . . . . . 111.3.4 Sound field . . . . . . . . . . . . . . . . . . . . . . . . . . . . . . . 121.3.5 Noise characteristics . . . . . . . . . . . . . . . . . . . . . . . . . . 12
1.4 Results . . . . . . . . . . . . . . . . . . . . . . . . . . . . . . . . . . . . . . 151.4.1 Comparison to control group results . . . . . . . . . . . . . . . . . 151.4.2 Effect of soundfield . . . . . . . . . . . . . . . . . . . . . . . . . . . 161.4.3 Effect of noise spectral characteristics . . . . . . . . . . . . . . . . 171.4.4 Effect of noise modulation characteristics . . . . . . . . . . . . . . 171.4.5 Effect of implant device . . . . . . . . . . . . . . . . . . . . . . . . 171.4.6 Comparison of ranges and interquartiles . . . . . . . . . . . . . . . 171.4.7 Group performance averaged in noise and sound field condition . . 19
1.5 Discussion . . . . . . . . . . . . . . . . . . . . . . . . . . . . . . . . . . . . 191.5.1 Gap listening . . . . . . . . . . . . . . . . . . . . . . . . . . . . . . 191.5.2 Noise frequency characteristic . . . . . . . . . . . . . . . . . . . . 201.5.3 Normalization in reference to OL-noise and S0N0 . . . . . . . . . . 21
2 Pitch scaling psychometrics in users of electric-acoustic stimulation (EAS) 232.1 Summary of chapter 2 . . . . . . . . . . . . . . . . . . . . . . . . . . . . . 232.2 Introduction . . . . . . . . . . . . . . . . . . . . . . . . . . . . . . . . . . . 242.3 Material and methods . . . . . . . . . . . . . . . . . . . . . . . . . . . . . 25
2.3.1 Subjects . . . . . . . . . . . . . . . . . . . . . . . . . . . . . . . . . 252.3.2 Cochlear implant interface . . . . . . . . . . . . . . . . . . . . . . . 262.3.3 Pitch matching procedure . . . . . . . . . . . . . . . . . . . . . . . 272.3.4 Stimuli . . . . . . . . . . . . . . . . . . . . . . . . . . . . . . . . . 282.3.5 Loudness balancing . . . . . . . . . . . . . . . . . . . . . . . . . . . 282.3.6 Feedback device . . . . . . . . . . . . . . . . . . . . . . . . . . . . 292.3.7 Insertion angle estimation . . . . . . . . . . . . . . . . . . . . . . . 29
v

Contents
2.4 Results . . . . . . . . . . . . . . . . . . . . . . . . . . . . . . . . . . . . . . 302.4.1 Contralateral acoustic-electric pitch matches for the most apical
electrode . . . . . . . . . . . . . . . . . . . . . . . . . . . . . . . . 302.4.2 Ipsilateral acoustic-electric pitch matches for the most apical electrode 312.4.3 Electrode-pitch function . . . . . . . . . . . . . . . . . . . . . . . . 32
2.5 Discussion . . . . . . . . . . . . . . . . . . . . . . . . . . . . . . . . . . . . 332.5.1 Lowest pitch perception depends on electrode array and insertion
depth . . . . . . . . . . . . . . . . . . . . . . . . . . . . . . . . . . 332.5.2 Constraints of pitch matching with electric-acoustic stimulation . . 342.5.3 Electrode place pitch for insertion angles above 450 degrees . . . . 36
3 Simulation of electric and electric-acoustic hearing 393.1 Summary of chapter 3 . . . . . . . . . . . . . . . . . . . . . . . . . . . . . 393.2 Introduction . . . . . . . . . . . . . . . . . . . . . . . . . . . . . . . . . . . 403.3 Material and methods . . . . . . . . . . . . . . . . . . . . . . . . . . . . . 40
3.3.1 Subjects . . . . . . . . . . . . . . . . . . . . . . . . . . . . . . . . . 403.3.2 Hardware and software . . . . . . . . . . . . . . . . . . . . . . . . . 413.3.3 Acoustic stimuli . . . . . . . . . . . . . . . . . . . . . . . . . . . . 41
3.4 Results . . . . . . . . . . . . . . . . . . . . . . . . . . . . . . . . . . . . . . 453.4.1 Cochlear implant-simulation . . . . . . . . . . . . . . . . . . . . . . 453.4.2 Influence of cutoff frequency . . . . . . . . . . . . . . . . . . . . . . 453.4.3 Influence of modified fundamental frequency . . . . . . . . . . . . 46
3.5 Discussion . . . . . . . . . . . . . . . . . . . . . . . . . . . . . . . . . . . . 473.5.1 Simulation of cochlear implant and electric-acoustic stimulation
with varied cutoff frequency . . . . . . . . . . . . . . . . . . . . . . 473.5.2 Simulation with modified fundamental frequency . . . . . . . . . . 48
4 Modeling of electric and electric-acoustic hearing 494.1 Summary of chapter 4 . . . . . . . . . . . . . . . . . . . . . . . . . . . . . 494.2 Introduction . . . . . . . . . . . . . . . . . . . . . . . . . . . . . . . . . . . 504.3 Material and methods . . . . . . . . . . . . . . . . . . . . . . . . . . . . . 50
4.3.1 Speech recognition system . . . . . . . . . . . . . . . . . . . . . . 504.3.2 Speech data . . . . . . . . . . . . . . . . . . . . . . . . . . . . . . 524.3.3 Noise data . . . . . . . . . . . . . . . . . . . . . . . . . . . . . . . 544.3.4 Model setup . . . . . . . . . . . . . . . . . . . . . . . . . . . . . . 54
4.4 Results . . . . . . . . . . . . . . . . . . . . . . . . . . . . . . . . . . . . . . 554.4.1 Speech discrimination function in acoustic condition . . . . . . . . 554.4.2 Influence of low frequency hearing in various noise conditions . . . 564.4.3 Speech discrimination function of electric-acoustic stimulation . . . 57
4.5 Discussion . . . . . . . . . . . . . . . . . . . . . . . . . . . . . . . . . . . . 584.5.1 Model composition . . . . . . . . . . . . . . . . . . . . . . . . . . . 584.5.2 Residual hearing . . . . . . . . . . . . . . . . . . . . . . . . . . . . 594.5.3 Performance in noise . . . . . . . . . . . . . . . . . . . . . . . . . . 59
vi

Contents
5 General Summary 615.1 Psychoacoustic measurements and model approach . . . . . . . . . . . . . 615.2 Outlook . . . . . . . . . . . . . . . . . . . . . . . . . . . . . . . . . . . . . 62
Appendix 63
A Subjects 65A.1 Normal hearing subjects . . . . . . . . . . . . . . . . . . . . . . . . . . . 65A.2 Implanted subjects . . . . . . . . . . . . . . . . . . . . . . . . . . . . . . . 66
B. Abbreviations and formula symbols 69
Bibliography 73
vii

viii

Introduction
“I received a shock in the head, and some moments after ... I began to hear asound ... it was a kind of crackling with shocks, as if some paste or tenaciousmatter had been boiling ... The disagreeable sensation, and which I apprehendedmight be dangerous, of the shock in the brain, prevented me from repeatingthis experiment” after he put two rods, connected to a pile of forty [battery]elements, into his ears. 1
Alessandro Volta (1800)
A Cochlear Implant (CI) is an inner ear hearing prosthesis which stimulates the hearingnerve directly by the use of electrical pulses. The function of inner hair cells in the cochlearwhich are largely damaged in case of severe labyrinthine hearing loss is replaced by theelectrical stimulation of the hearing nerve. Electric-Acoustic Stimulation (EAS) combinesacoustic hearing and perceptions elicited by electrical stimulation in an ear implantedwith a cochlear implant. Introduced by Ilberg et al. (1999), EAS is a therapeutic optionfor patients with severe-to-profound high and mid frequency hearing loss but remaininglow frequency hearing (Baumann and Helbig, 2009; Ilberg et al., 2011; Gantz and Turner,2004; Turner et al., 2010). Advances in the surgical approach as well as the introductionof electrode arrays designed to minimize trauma of the delicate structures of the innerear boost the preservation of acoustic low frequency hearing in the majority of patientsafter implantation (Gstoettner et al., 2009; Helbig et al., 2011a). An illustration andexplanation of the EAS-system containing a speech processor with a combined hearing aidand the implanted stimulator with an intra-cochlear electrode array are shown in figure 1.EAS is only an option for hearing impaired patients whose hearing threshold is stableand not progressive. The robustness of the residual low frequency hearing is shown byGstoettner et al. (2006) who document the complete and partial usable preservation ofipsilateral hearing after cochlear implant for 70% of cases over an averaged period of 27months. Results with EAS after rehabilitation show enhanced speech in noise perceptioncompared to usual “cochlear implant” conditions (Kiefer et al., 2002).
The initial electric sensory stimulation of hearing was reported by Alessandro Volta(1800) who stimulated his inner ears using two metal rods that were inserted into hisouter ear canals with a voltage of approximately 50V. The electric current activateddendrites and ganglion cells of the acoustic nerve (Nervus cochlearis) and effected a hearingsensation.
1Mertens, J.: Shocks and Sparks: The Voltaic Pile as a Demonstration Device. Isis, 89(2):300-311, 1998.
1

Introduction
implant housing
electrode array
earhook with output for
acoustic amplification
speech processor with
microphone and battery
coil
ear mould
Fig. 1.: Schematic drawing of the peripheral hearing system and the components of an EASsystem. EAS stands for “Electric-Acoustic Stimulation” and describes the simultaneous electricstimulation via Cochlear-Implant (CI, high frequencies) combined with the acoustic stimulationvia hearing aid (low frequencies) at the same ear. The speech processor is located behind theear and contains power supply, microphone and digital speech processor. The transducer coilis connected to the speech processor by wire and magnetically bound outside the head to theimplant, which is embedded in the skull under the skin. The implant housing is located slightlybehind the pinna, lying in a drilled implant bed (tiny recess of the bone) and fixed in a periosteumpocket. The electrode array leads through the mastoid into the cochlea. Emitted electric impulsesinside the cochlea (scala tympani) directly stimulate the hearing nerve. Stimulating the apicalregion (“apex” of the cochlea) evokes a low pitch perception. The hight of the pitch perceptionincreases towards the basal region (round window). In contrast to a conventional CI, residuallow frequency hearing is achieved using an earhook with integrated transducer. The amplifiedacoustic signal is transfered to the ear canal with an ear mold.
This experiment was repeated by the German researcher Johann Wilhelm Ritter witha doubled voltage of approximately 100V. After stimulating himself for several timeshe asserted that “repeated shocks in the head of this kind [...] are of detrimental impactfor the executing experimenter” and he was not able to continue his research with therequired examinations because of this (Ritter, 1801).
The first report of direct stimulation of the cochlear nerve aimed to treat hearing lossappeared in the year 1957 with the work of Djourno et al. (1957). The auditory nerve ofa patient was partially removed because of a cholesteatomas surgery (excision of diseasedtissue in the region of the middle/inner ear and the mastoid). They used an induction coilplaced with one end on the stump of the auditory nerve and with the other end within thetemporalis muscle (elevates the mandible). This single-electrode implant used an analogstimulation strategy. Until the device failed after several months the patient was able tosense environmental sounds but there was no intelligibility of speech (Wilson and Dorman,2008).
2
Commercial cochlear implantation started in 1972 with the “House 3M” single-electrodeimplant which was formally approved by the U.S. Food and Drug Administration (FDA)for adults in 1984. Using more than one electrode made it possible to stimulate differentregions of the auditory nerve fibers and thereby evoke different pitch sensations. The firstFDA approval of a multi-channel implant (Nucleus 22-channel CI, Cochlear Pty. Limited,Sydney, Australia) was available for adults in 1984 and for children down to the age oftwo in 1990 (Clark, 2006).
All present commercial CI use an intra-cochlear approach: Up to 24 electrodes mountedon a silicone carrier wound through the cochlea in the scala tympani send short electricpulses to the acoustic nerve. Recent speech coding strategies use a kind of temporal codingwith temporally interleaved pulses to avoid electrical field interactions that reduce frequencyselectivity. The coding strategies primary vary in number of channels, rate of stimulationand the number of electrodes activated. Examples for these speech coding strategies are:“FS4” (MED-EL, Innsbruck, Austria) which provides fine structure information on thefour most apical channels and a continuous interleaved sampling (CIS) on the remainingelectrodes, Advanced Combination Encoders “ACE” (Cochlear) which stimulates then out of 22 electrodes corresponding to the most energetic frequency bands in everystimulation cycle and “HiRes Fidelity 120” (Advanced Bionics, Sylmar, USA) which usessimultaneous stimulation of two electrodes at the same time to rise the spectral resolutionup to theoretical 120 spectral bands. A summarization of early speech processor codingstrategies up to recent years like “F0F1F2”, “MPEAK” or “SPEAK” is shown in Møller(2006).
In the history, different other approaches of electrode placement like e.g. extra-cochlearat the promontorium (House, 1976), intra-cochlear without opening peri- or endolymphaticcavities (Banfai et al., 1979) or an insertion of the electrode through the round windowinto the scala tympani (Burian, 1979) were investigated.
A mentionable approach was developed by Zwicker and Naumann in the mid eighties,who tried to insert a “bundle of electrodes” directly into the cochlear nerve. The “DirectElectrical Eight-Nerve Stimulation” was realized by using a two component system withimplanted receiver and portable transmitter developed at the TU München (Zwicker et al.,1986a,b). The activation of this prototype implant resulted in various hearing sensationswith a dynamic range of 12dB but no speech discrimination. After a time period of 66days the acoustic nerve could no longer be stimulated from outside which was caused bya leakage of the implant housing (Naumann et al., 1986).
All these approaches and various research worldwide led to an impressive contemporaryspeech perception of CI patients which was beyond all imagination in former times. Thegoal of the present thesis is not only to document the advantages of EAS but additionallyto simulate and model the processing of sounds in patients fitted with EAS devices. Thethesis is organized as follows:
3

Introduction
Chapter 1 describes the results of a study which applied a newly developed and realizedMulti-Source Noise Field (MSNF) consisting of a four-loudspeaker array with independentnoise sources in combination with a closed set sentence test (Oldenburg Sentence Test,OLSA) to measure and compare speech perception in noise with EAS, bimodal, uni-and bilateral Cochlear Implant (CI) recipients. Speech simulating noise (Fastl-noise),CCITT-noise (continuous) and OL-noise (pseudo continuous) serve as noise sources withdifferent temporal patterns. Four groups of subjects who use CI without any residualacoustic hearing (unilateral CI and bilateral CI) on the one hand and CI with acoustichearing (bimodal CI and EAS) on the other hand perform speech perception tasks. Allsubjects in the bimodal CI and EAS group were fitted with a high power hearing aid inthe opposite ear. A group of 20 listeners with normal hearing serve as controls. A strongdisruptive effect of amplitude modulated noise on speech perception in CI implantedlisteners is observed. Group results show that bimodal EAS group provides superiorspeech perception in all tested noise conditions compared to bilateral CI.
To minimize a frequency overlap between electric and acoustic stimulation in EASit is important to have knowledge about the height of the percepted pitch evoked bythe stimulating electrodes. Results of a pitch matching study are shown in chapter 2.The crossover frequency between acoustic and electric hearing can be determined bymeans of a bimodal pitch matching procedure in EAS users. This knowledge is importantfor the fitting of EAS devices to minimize the overlap between electric and acousticstimulation. Bimodal pitch adjustment experiments were conducted in eight patientsimplanted unilaterally with a cochlear implant. All subjects have residual hearing in theopposite ear as well as in the implanted ear.
Chapter 3 presents the results of an EAS-simulation study. Experiments were con-ducted with normal hearing subjects and results compared with data of implanted subjectgroups. The sentences of the Oldenburg sentence test were transformed into a CI-simulationby reducing pitch information of the original signal. An additionally applied low-passfiltered original signal expanded the CI-simulation to an EAS-simulation. Comparedto implanted subjects, the simulation data shows a good accordance in various testedconditions.
Chapter 4 introduces a model of speech perception in quiet and in noisy environmentfor CI-, EAS and normal hearing subjects. The speech perception process is modeledusing a speech recognition system which was adapted to the demands of a CI/EAS-system.The findings show a synergic effect and a significant improvement of speech perception innoise for EAS.
This thesis closes with a summary of the most important results and an outlook onfuture developments.
4
1 Speech perception in a multi-sourcenoise field
1.1 Summary of chapter 1
This chapter introduces a Multi-Source Noise Field (MSNF), consisting of a loudspeakerarray with four independent noise sources, in combination with a closed set sentence test(Oldenburg Sentence Test, OLSA) to measure and compare speech perception in noise inCochlear Implant (CI) recipients supported individually with different device types. Thekind of CI and Hearing Aid (HA) supply differs by the availability of low- to mid-frequencyacoustic hearing. Speech simulating noise (Fastl-noise), CCITT-noise (continuous) andOL-noise (pseudo continuous) served as different noise sources with different temporalpatterns. Speech tests were performed in four groups of cochlear implanted subjects whowere using either unilateral CI, bilateral CI, bimodal CI or EAS. All subjects in the EASand bimodal group were fitted with a high power hearing aid in the opposite ear. A groupof 20 listeners with normal hearing served as controls.
Speech Reception Thresholds (SRT) were severely compromised by modulated noise(Fastl) in both groups of cochlear implant users but not in normal hearing listeners whoeven performed better. Average SRTs for the EAS group were significantly lower thanaverage CI group results in all test conditions. In reference to the OLSA-noise condition,the EAS group data showed improved SRTs especially in the Fastl-noise condition. Thebetter performance of the EAS group in modulated noise conditions might be explainedeither by “glimpsing”, the enhanced ability of subjects with residual acoustic hearingto listen into temporal gaps or by the improved transmission of fundamental frequencycues in the lower frequency region of acoustic hearing, which might foster grouping ofspeech auditory objects. Furthermore, the results do indicate that binaural interactionbetween EAS in one ear and residual acoustic hearing in the opposite ear enhances speechperception in complex noise situations.
5

1 Speech perception in a multi-source noise field
1.2 Introduction
EAS is a well accepted therapeutic treatment for subjects with profound hearing loss inthe higher frequencies and no or mild hearing loss in the low frequencies (Baumann andHelbig, 2009). This technique was introduced by Ilberg et al. (1999) as a consequence ofground breaking surgical approaches that enabled hearing preservation with optimizedelectrode designs. These combined techniques minimize trauma to the delicate structuresof the Basilar membrane, and preserves the acoustic low frequency hearing in the majorityof subjects after implantation (Helbig et al., 2011a; Gstoettner et al., 2009; Skarzynskiand Podskarbi-Fayette, 2010; Gantz and Turner, 2004). EAS users show improved speechintelligibility compared to “normal” CI users (Kiefer et al., 2002). In particular, speechperception in noise is one of the most difficult tasks for people with hearing impairment.The OLSA sentence test is a useful tool for investigating speech intelligibility thresholdsin noisy environments (Wagener et al., 1999c; Müller-Deile, 2009). In the present study, aMulti-Source Noise Field (MSNF, Rader et al., 2008), consisting of a four-loudspeakerarray (cf. figure 1.5) with independent noise sources was combined with the OLSA.The MSNF enables the presentation of a more realistic noise environment, and allowsresearchers to investigate the effects of binaural interaction regarding the perceptualseparation of signal and noise arriving from different directions.
It has been shown in previous studies that amplitude modulated noise is extremelydisruptive for hearing impaired individuals. Different fluctuating noises simulating speechhave been proposed to assess inter-individual variability; such as speech modulated CCITT-noise (also called Fastl-noise, Fastl, 1987), or ICRA-noise (Wagener et al., 2006). Usersof cochlear implant systems show extreme difficulties in non-continuous noise situations,whereas normal hearing listeners are able to listen to short spectro-temporal gaps ofmasking noise (Fastl et al., 1998). The so called effect of “glimpsing” is deteriorated oreven absent in hearing aid or cochlear implant users.
The following questions are addressed in the present chapter:
• How do subjects fitted with EAS on one ear and a hearing aid on the opposite earperform in different noise and sound field conditions compared to other implantedsubject groups?
• Can subjects using EAS in one ear and a hearing aid in the other make use ofbinaural cues to enhance speech perception in complex noise fields?
• Do EAS subjects make use of “glimpsing” in modulated noise?
6

1.3 Material and methods
1.3 Material and methods
1.3.1 Subjects
Four groups of cochlear implant users were recruited in the study. The groups differ innumber of implants (one or two) and usable residual hearing in the implanted ear (EAS)or in the non implanted ear (bimodal CI). Details are given in table 1.1. Demographicaldata for all subjects are provided in table A.1 and A.2. Monosyllabic word comprehensionwas tested for all groups in the best aided condition at 65dB Sound Pressure Level (SPL,free sound field) with the German Freiburger Monosyllables Speech Test (FMS, WESTRAElektroakustik GmbH, Binswangen, Germany) in quiet. Group data shows comparableresults in quiet (figure 1.2). An analysis of variance showed no significant differencebetween groups (p=0.137) and warranted the group homogeneity.
group name hearing condition hearing conditionone ear other ear
normal hearing unaided (normal hearing) unaided (normal hearing)unilateral CI unaided (deaf) CI (deaf)bilateral CI CI (deaf) CI (deaf)bimodal CI HA (residual hearing) CI (deaf)EAS HA (residual hearing) CI and HA (low frequency hearing)
Tab. 1.1: Name of subject groups and corresponding devices (HA: hearing aid, CI: CochlearImplant, EAS: Electric-Acoustic Stimulation) and the level of acoustic hearing in brackets (deaf,normal, residual and low frequency hearing) for both ears.
The EAS group consisted of twelve subjects implanted with devices manufacturedby MED-EL. Eleven subjects were implanted with a FLEXEAS electrode array; eightwere provided with a PULSARCI
100 implant (ceramic housing); while the remainingthree received a SONATAT I
100 implant (titanium housing). One subject received aSONATAT I
100 implant attached with the recently introduced FLEX20 electrode array(see Baumann and Helbig, 2009, for further details on implant and electrode technology).Subjects ranged in age between 19 and 76 years with a median age of 44.5 years. Theaverage EAS experience was 11 months (median). All subjects were fitted with a DUETspeech processor in the implanted ear. The DUET processor is a device which combines aCI speech processor and a hearing aid specially designed for amplification of the lowerfrequencies (Helbig et al., 2008). The DUET was fitted to the individual needs of thepatients according to the MED-EL fitting strategy described in Helbig and Baumann(2010). The opposite ear was fitted with a high power digital hearing aid, and all speechtests were performed in best aided condition (DUET processor combined with high powerhearing aid in the opposite ear). Average pure tone air conduction thresholds measured in
7

1 Speech perception in a multi-source noise field
0.125 0.250 0.5 0.75 1 1.5 2 3 4 6 8
frequency [kHz]
0.125 0.250 0.5 0.75 1 1.5 2 3 4 6 8
frequency [kHz]
implanted ear
preoperative
postoperative
-10
0
10
20
30
40
50
60
70
80
90
100
110
120
he
arin
g le
ve
l [d
B]
non-implanted ear
a) b)
Fig. 1.1: Air conduction pure tone audiograms (medians and quartiles) for the EAS groupmeasured a) in the non-implanted ear and b) in the implanted ear preoperatively (triangles) andpostoperatively (squares).
the contralateral ear are displayed in the left half of figure 1.1, while the average thresholdsfor the implanted ear (pre- and post-implantation) are displayed in the right half. Asit can be seen in the right part of figure 1.1, after implantation there was considerableresidual hearing up to 750Hz. Average hearing loss at 500Hz is 80dB HL. However,compared to preoperative results, hearing thresholds deteriorate after implantation to acertain extent: The average difference between pre- and post-implantation thresholds are:35dB at 500Hz, 20dB at 250Hz, and 15dB at 125Hz. As displayed in figure 1.2, FMSare within a range of 25% to 100% (average 68.8%, median 70.0%).
The unilateral CI group contains eleven implanted subjects with no residual acoustichearing neither at the implanted nor the contralateral side. Three of them used a Cochleardevice; eight used a MED-EL device. Subjects ranged in age between 33 and 75 yearswith a median age of 53 years. FMS result in average at 77.7% (median 80.0%, span 65to 85%) correct discrimination.
The bimodal CI group contains seven (five MED-EL and two Cochlear devices) im-plantees. Bimodal implantees use a CI at one ear (no residual hearing) and a HA (residualacoustic hearing) at the contralateral side. Subjects ranged in age between 15 and 68years with a median age of 42 years. FMS are within a range of 65 to 100% (average87.1%, median 95.0%).
The bilateral CI group consisted of ten subjects with an age range from 41 to 66 yearsand a median of 51 years. Five of these subjects had a Cochlear device; three had aMED-EL and two had an Advanced Bionics device. All but one subject had bilateralexperience of more than 12 months. There was no preserved residual hearing in thebilateral CI group. FMS were within a range of 50 to 100% with the bilateral CI group(average 80.5%, median 87.5%) as shown in figure 1.2.
8

1.3 Material and methods
pe
rce
nt co
rre
ct
100
80
90
60
70
40
50
20
30
10
0
unilateral CI bilateral CI bimodal CI EAS
median
arithmetic mean
Fig. 1.2: Freiburger monosyllable scores (free field condition, 65 dB SPL) in different groups:unilateral CI, bilateral CI, bimodal CI and EAS users. Bars signify median (solid) and arithmeticmean (dashed) average score.
Reference data was collected from a control group of 20 normal hearing subjects (seeRader et al., 2008 for more details). The fittings of all devices (HA and CI) were checkedby measuring aided thresholds, speech audiometry (FMS and OLSA) and loudness scalingprocedure (Kategoriale Lautheitsskalierung, part of Oldenburger Messprogramme, HörTechGmbH, Oldenburg, Germany). The HA and the acoustic part of the EAS-system wereadditionally controlled by a coupler measurement in sound chamber (Maicoscan MH 20,MAICO Diagnostic GmbH, Berlin, Germany). The subjects received an allowance fortheir efforts. The study was approved by the local ethical review board (University ofFrankfurt, 168/07).
1.3.2 Experimental set-up
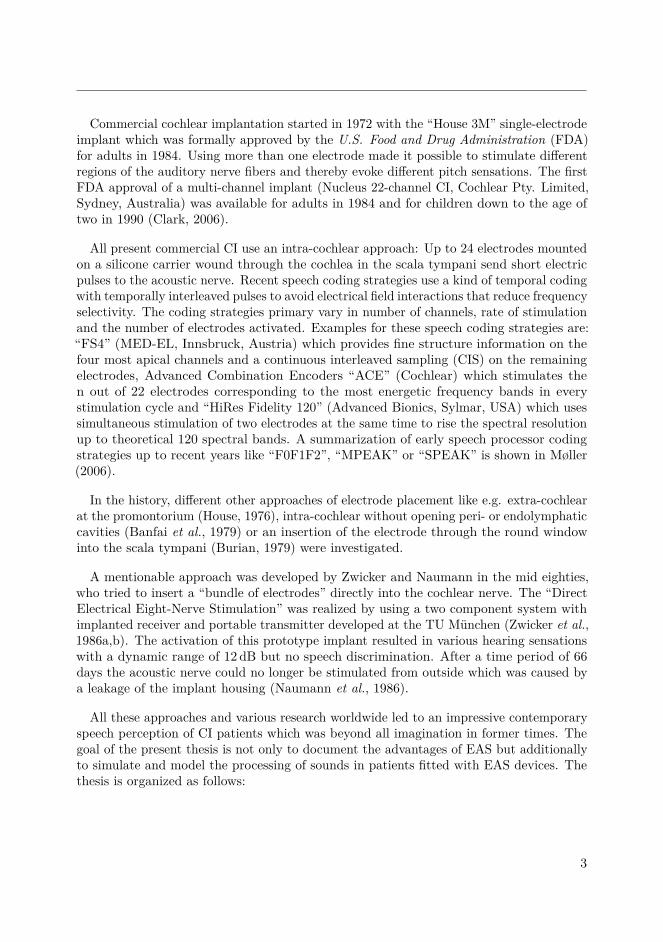
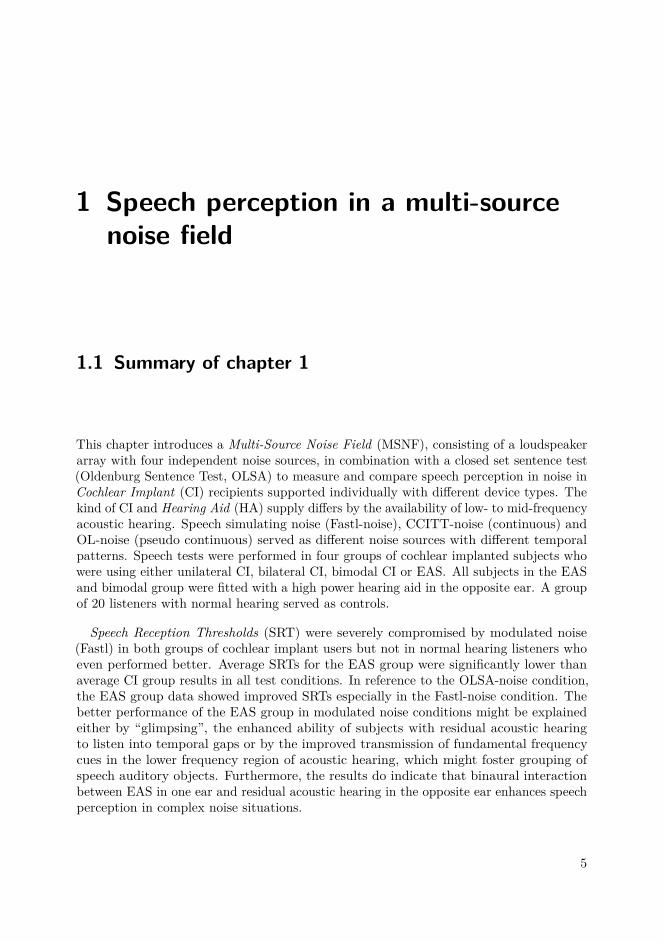
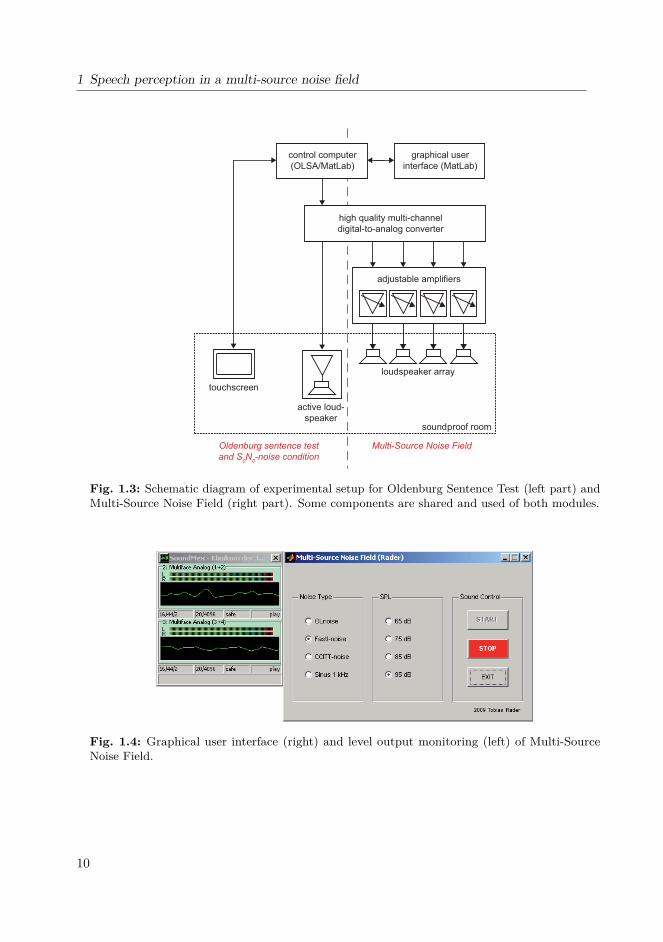
Speech intelligibility tests were conducted by means of a personal computer equipped witha high quality 24-bit 8-channel AD-DA converter (Hammerfall DSP Multiface II, RME,Haimhausen, Germany). A schematic is shown in figure 1.3. The noise field was presentedvia a four-loudspeaker array (Control One, JBL, Stamford, USA). A Matlab (MathWorks,Natick, USA) graphic user interface (GUI, figure 1.4) employing a toolbox was used(SoundMex, HörTech GmbH, Oldenburg, Germany) to simultaneously send independentnoise signals to four channels of the digital-to-analog (DA) converter, where the signalswere amplified (MPA 6-80R, Ecler, Barcelona, Spain), and fed to the loudspeaker array.
9
1 Speech perception in a multi-source noise field
Oldenburg sentence test
and S0N
0-noise condition
Multi-Source Noise Field
graphical user
interface (MatLab)
adjustable amplifiers
active loud-
speakersoundproof room
touchscreen
high quality multi-channel
digital-to-analog converter
control computer
(OLSA/MatLab)
loudspeaker array
Fig. 1.3: Schematic diagram of experimental setup for Oldenburg Sentence Test (left part) andMulti-Source Noise Field (right part). Some components are shared and used of both modules.
Fig. 1.4: Graphical user interface (right) and level output monitoring (left) of Multi-SourceNoise Field.
10

1.3 Material and methods
The speech signal was presented through an additional channel and then sent to adifferent active speaker (VNet300, Tannoy Ltd., Coatbridge, UK) placed in front of thesubject (see also figure 1.5).
1.3.3 Speech test
The Oldenburg Sentence Test (Wagener et al., 1999c,a,b; Kollmeier and Wesselkamp,1997) which is based on a study for the Swedish language (Hagerman, 1982) was usedto determine subjects’ individual speech reception thresholds (SRT) in different noiseconditions. Each test list consists of 20 sentences which contains a subject, verb, numeral,adjective and object. Each one of these words is randomly selected out of a list of tenpossible options (see table 1.2). Based on the randomized selection of words, a largenumber of test lists are possible and the sentences patterned seem to be senseless in mostcases. This results in an enormous advantage of the OLSA: Subjects are unable to predictsentences with logical syntax or to memorize sentences. Further advantages of the OLSAare a steep discrimination function combined with an average speed of the spoken sentenceand the usage of common words (Wagener et al., 1999c).
The noise level was fixed and the speech level was set adaptively according to thenumber of words perceived correctly. Speech levels automatically increased when onlyup to two words were perceived correctly, and decreased when more than two wordswere correct of the five. The initial step size for the adaptive procedure was 5 dB, 3 dB,1 dB, −1dB, −3 dB, −5 dB for 0, 1, 2, 3, 4, 5 correctly perceived words. The step sizesdecreased with the number of inflection points according to Brand and Kollmeier (2002).
subject verb numeral adjective objectPeter bekommt drei große BlumenKerstin sieht neun kleine TassenTanja kauft sieben alte AutosUlrich gibt acht nasse BilderBritta schenkt vier schwere Dosen
Wolfgang verleiht fünf grüne SesselStefan hat zwei teure MesserThomas gewann achtzehn schöne SchuheDoris nahm zwölf rote SteineNina malt elf weiße Ringe
Tab. 1.2: Word array and an example for sentence structure (bold words) of Oldenburg SentenceTest (OLSA).
11

1 Speech perception in a multi-source noise field
The subjects’ responses were analyzed by the number of words perceived correctly. Theresult of the OLSA is given by the SRT (“speech reception threshold”) or L50 and isdefined by a SNR (“signal-to-noise ratio”) with 50% correct intelligibilty of the presentedsentence.
The OLSA was conducted in “closed set” mode. After the acoustic presentation of eachsentence the subject had to indicate on a touch screen which tokens of the sentences wereunderstood. All words of the sentence test are arranged in a 10-by-5 matrix according totheir position in the sentence.
1.3.4 Sound field
Two different kinds of loudspeaker placements (figure 1.5) were set up to investigate theadvantage of probably binaural loudness cues with and without residual acoustic lowfrequency hearing. The inner dimensions of the soundproof room were 242 x 344 cm witha hight of 233 cm. All the following measurements refer to the reference point (middlebetween the subjects’ ears). The distance to the center speaker at 0◦ azimuth was 130 cm,the distance to the four surrounding speakers in the upper corners of the room at ±27◦
and ±153◦ was 169 cm (100 cm above the reverence point).
• S0N0: This speech in noise condition presents speech and noise from 0◦ azimuthdirection with one single loudspeaker for both speech and noise signal. It can beassumed that in this mode of signal presentation speech intelligibility performanceis not influenced by binaural effects.
• Multi-Source Noise Field (MSNF): Four speakers were set up in the cornersof a sound proof room. Each speaker was directed towards the head of the subject.Speech was presented at 0◦ azimuth. Subjects were placed in the center of theroom. The MSNF set-up allows the presentation of a pseudo-diffuse noise sourcefield (independent noise sources) at the subjects’ ears. It is assumed that theMSNF setup allows the subject to take advantage of localization cues that could aidperceptual separation of speech and noise sources. Binaural cues such as interauraltime differences (ITD) and interaural level differences (ILD) may be transmittedin aided conditions and therefore the squelch effect may be present in the differentimplanted subject groups. Likewise, spatial release from masking will maybe occurdue to the head shadow or summation effect.
1.3.5 Noise characteristics
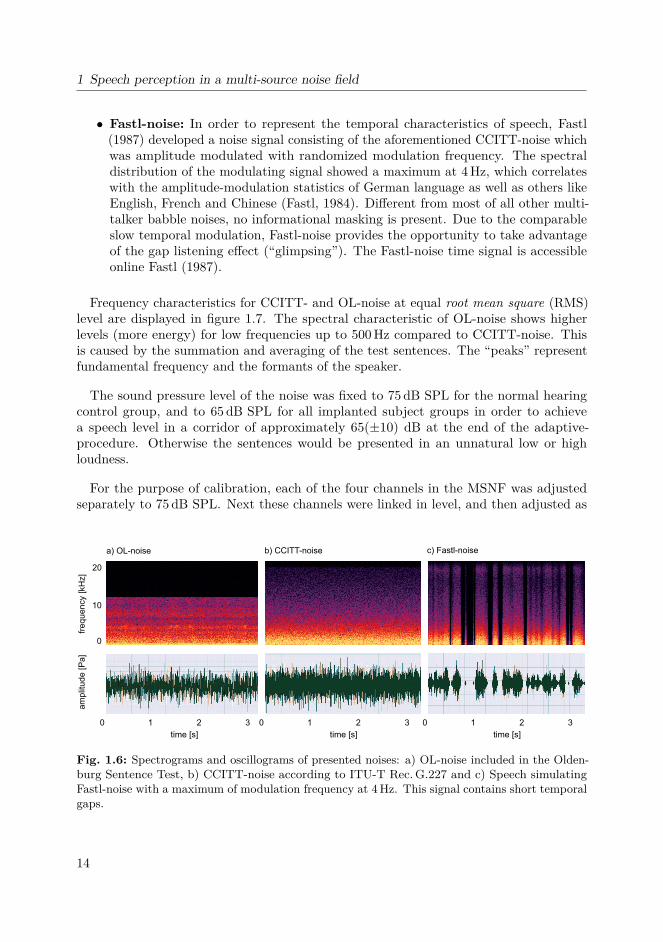
It is well known that the spectral-temporal as well as the informational characteristics ofa certain competing noise signal will influence the amount of masking on a target speechsignal. Three different noise signals were applied in the present study. The spectrogramsand oscillograms of presented noises are shown in figure 1.6.
12

1.3 Material and methods
soundproof room
touchscreen
speaker
a) S0N
0
signal
subject
b) Multi-Source Noise Field
noise
Fig. 1.5: Schematic of sound proof room with two different noise conditions: a) S0N0: Signaland noise are presented from the identical loudspeaker at 0◦ azimuth. b) Multi-Source NoiseField (MSNF): Signal is presented from 0◦ azimuth and noise is presented from four speakers inthe corners of the room (independent channels).
• OL-noise: The noise signal used for the OLSA was generated by the summationand averaging of 30 randomly time-wise shifted OLSA test sentences (Wageneret al., 1999c). Therefore, OL-noise showed only very weak temporal modulation.The methods of summation and averaging kept the short-term spectrum equal tothe OLSA sentences. The frequency of the noise ranged from 150Hz to 12.6 kHz.Due to the high masking efficacy of the OL-noise signal, the speech discriminationfunction shows a very steep slope (17.1% per dB, Wagener et al., 1999b) and allowsefficient and exact estimations of individual SRT.
• CCITT-noise: This noise signal was developed by the Comité Consultatif Inter-national Télégraphique et Téléphonique (CCITT, 2011), according to ITU-T Rec.G.227 (11/88) conventional telephone signal and renamed by the InternationalTelecommunication Union (ITU) Telecommunication Standardization Sector. Thespectral characteristics of the CCITT-noise intent to simulate a very large numberof competing speakers comparable to situations found in train stations or footballstadiums. As well as with the OL-noise signal, temporal modulation is nearly absent.Compared to OL-noise, the spectrum of the CCITT-signal is slightly enhancedin the lower frequency region and comprises frequencies up to 22 kHz (figure 1.7).Measurement with the CCITT-noise signal were necessary to determine baseline datain order to compare individual and group results to data obtained with Fastl-noiseand therefore to assess a potential gap listening effect.
13
1 Speech perception in a multi-source noise field
• Fastl-noise: In order to represent the temporal characteristics of speech, Fastl(1987) developed a noise signal consisting of the aforementioned CCITT-noise whichwas amplitude modulated with randomized modulation frequency. The spectraldistribution of the modulating signal showed a maximum at 4Hz, which correlateswith the amplitude-modulation statistics of German language as well as others likeEnglish, French and Chinese (Fastl, 1984). Different from most of all other multi-talker babble noises, no informational masking is present. Due to the comparableslow temporal modulation, Fastl-noise provides the opportunity to take advantageof the gap listening effect (“glimpsing”). The Fastl-noise time signal is accessibleonline Fastl (1987).
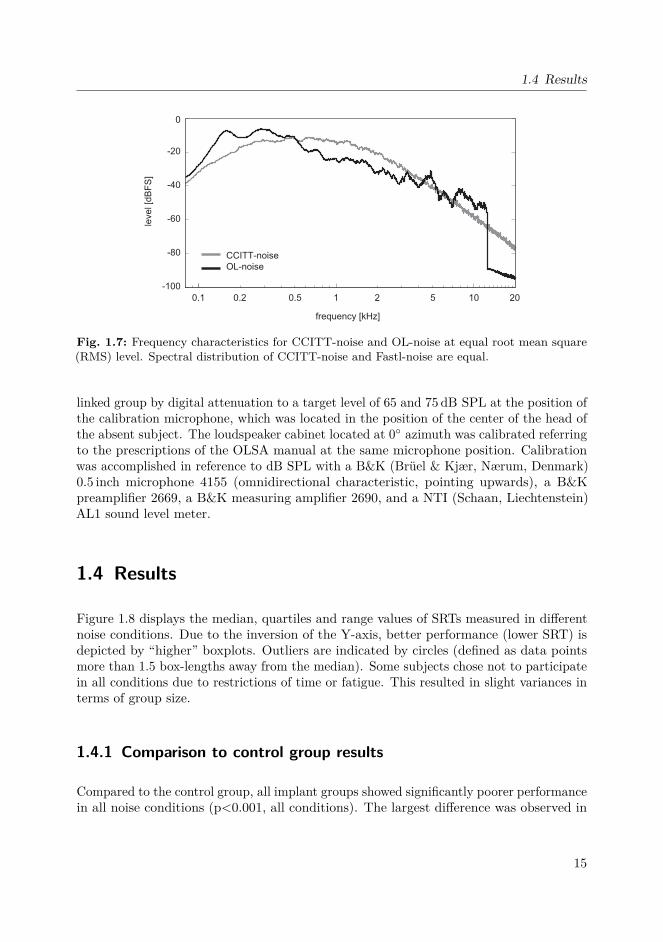
Frequency characteristics for CCITT- and OL-noise at equal root mean square (RMS)level are displayed in figure 1.7. The spectral characteristic of OL-noise shows higherlevels (more energy) for low frequencies up to 500Hz compared to CCITT-noise. Thisis caused by the summation and averaging of the test sentences. The “peaks” representfundamental frequency and the formants of the speaker.
The sound pressure level of the noise was fixed to 75dB SPL for the normal hearingcontrol group, and to 65dB SPL for all implanted subject groups in order to achievea speech level in a corridor of approximately 65(±10) dB at the end of the adaptive-procedure. Otherwise the sentences would be presented in an unnatural low or highloudness.
For the purpose of calibration, each of the four channels in the MSNF was adjustedseparately to 75dB SPL. Next these channels were linked in level, and then adjusted as
time [s] time [s]
0 1 32 03 1 2 30 1 2
time [s]
fre
qu
en
cy [kH
z]
am
plit
ud
e [P
a]
c) Fastl-noise
20
0
10
a) OL-noise b) CCITT-noise
Fig. 1.6: Spectrograms and oscillograms of presented noises: a) OL-noise included in the Olden-burg Sentence Test, b) CCITT-noise according to ITU-T Rec.G.227 and c) Speech simulatingFastl-noise with a maximum of modulation frequency at 4Hz. This signal contains short temporalgaps.
14
1.4 Results
0.50.1 0.2 1
frequency [kHz]
2 5 10 20
-100
-80
-60
-40
-20
0
CCITT-noise
OL-noise
leve
l [d
BF
S]
Fig. 1.7: Frequency characteristics for CCITT-noise and OL-noise at equal root mean square(RMS) level. Spectral distribution of CCITT-noise and Fastl-noise are equal.
linked group by digital attenuation to a target level of 65 and 75dB SPL at the position ofthe calibration microphone, which was located in the position of the center of the head ofthe absent subject. The loudspeaker cabinet located at 0◦ azimuth was calibrated referringto the prescriptions of the OLSA manual at the same microphone position. Calibrationwas accomplished in reference to dB SPL with a B&K (Brüel & Kjær, Nærum, Denmark)0.5 inch microphone 4155 (omnidirectional characteristic, pointing upwards), a B&Kpreamplifier 2669, a B&K measuring amplifier 2690, and a NTI (Schaan, Liechtenstein)AL1 sound level meter.
1.4 Results
Figure 1.8 displays the median, quartiles and range values of SRTs measured in differentnoise conditions. Due to the inversion of the Y-axis, better performance (lower SRT) isdepicted by “higher” boxplots. Outliers are indicated by circles (defined as data pointsmore than 1.5 box-lengths away from the median). Some subjects chose not to participatein all conditions due to restrictions of time or fatigue. This resulted in slight variances interms of group size.
1.4.1 Comparison to control group results
Compared to the control group, all implant groups showed significantly poorer performancein all noise conditions (p<0.001, all conditions). The largest difference was observed in
15

1 Speech perception in a multi-source noise field
bilateral CI
EAS
bimodal CI
normal hearing
OL-noise
-16
-20
-12
-8
-4
0
4
8
12
SR
T [d
B S
NR
]
n=6 n=6 n=6 n=6n=7n=4n=7 n=7n=21 n=11n=8 n=21 n=21 n=21n=9 n=11 n=11n=21n=10 n=10n=9 n=9n=12 n=12n=10 n= 12n=7 n=7 n=20
CCITT-noise Fastl-noise
S0N
0MSNFS
0N
0MSNFS
0N
0MSNF
unilateral CI
n=4
Fig. 1.8: Speech reception thresholds (SRT) of different groups: Unilateral CI, bilateral CI,bimodal CI, EAS and normal hearing controls. Bimodal CI and EAS combined with a hearingaid in the opposite ear. Boxplot contains median, quartiles and maximum values. Noisecharacteristics: OL-noise, CCITT-noise and Fastl-noise. Noise level: 65 dB SPL for the implantedgroups, 75dB SPL for the reference group. There was significantly higher performance in theEAS group compared to the bilateral CI group across all noise and sound field conditions. Circle:Outlier greater than 1.5 times but less than three times the interquartile range. Star: Outliergreater than three times the interquartile range.
the Fastl-noise/S0N0 condition: The average SRT of the control group was as much as20.8 dB better than that of the bilateral CI group. The smallest difference in SRTs wasseen with OL-noise in the MSNF condition with a difference of 2.8 dB between EAS usersand controls.
1.4.2 Effect of soundfield
The largest effect of noise sound field characteristics was observed in the Fastl-noisecondition. All bilateral user groups (bilateral CI, bimodal CI and EAS) showed a significantimprovement of 4.3 dB (p=0.004), 3.2 dB (p<0.001) and 5.4 dB (p=0.002) in average SRTsbetween S0N0 and MSNF sound field conditions respectively. The unilateral group showedno significant improvement (1.2 dB, p=0.072). Obviously, the ability to separate speechfrom noise improved in both groups of subjects when binaural dichotic information was
16

1.4 Results
made accessible. There were no effects of noise sound field characteristics in the Fastlnoise condition in the normal hearing group (p=0.074).
1.4.3 Effect of noise spectral characteristics
Noise spectral characteristics showed a significant impact on SRT levels. Compared toOL-noise, the average performance of the bilateral CI group in CCITT-noise decreased by3.4dB in the S0N0 condition (p<0.001) and by 5.4 dB in the MSNF condition (p<0.01).This effect is nearly absent in the group of EAS subjects (S0N0 condition: 1.7 dB, p=0.069;MSNF condition: 1.3 dB, p=0.051). In contrast to both implanted groups, the controlgroup performed better with CCITT-noise in both S0N0 and MSNF sound field conditions.
1.4.4 Effect of noise modulation characteristics
Performance in the control group showed a highly significant beneficial effect of modulation.Compared to the unmodulated CCITT-noise condition, in the modulated Fastl-noisecondition SRTs improved by 6.5dB in the S0N0 sound field (p<0.001) and by 3.0 dB inMSNF (p<0.01). A comparison between OL-noise (−6.6 dB) and Fastl-noise (−14.9 dB)in S0N0 showed an improvement of performance about 8.3 dB (p<0.001). In contrastto the control group, the unilateral and bilateral CI groups showed a small decrease inperformance in the modulated noise condition (S0N0 sound field). In the EAS groupthere was no significant effect of noise modulation characteristics on performance. Theeffect of amplitude modulation on performance was absent in MSNF in all of implantedsubjects with the exception of unilateral CI group.
1.4.5 Effect of implant device
The EAS subject group demonstrated superior performance compared to the bilateral CIgroup in all conditions. The largest difference was observed in the CCITT-noise condition(6.1 dB, p=0.001) followed by the Fastl-noise condition (5.4 dB, p=0.002) in MSNF. Thesmallest difference was 1.6 dB (p<0.05) in the OL-noise condition (S0N0).
1.4.6 Comparison of ranges and interquartiles
Ranges and interquartiles were larger for CCITT- and Fastl-noise compared to OL-noise inbilateral, EAS and normal hearing subject groups. Within the Fastl-noise condition, rangesand interquartiles for bilateral CI and EAS implanted groups seemed to be nearly equal
17
1 Speech perception in a multi-source noise field
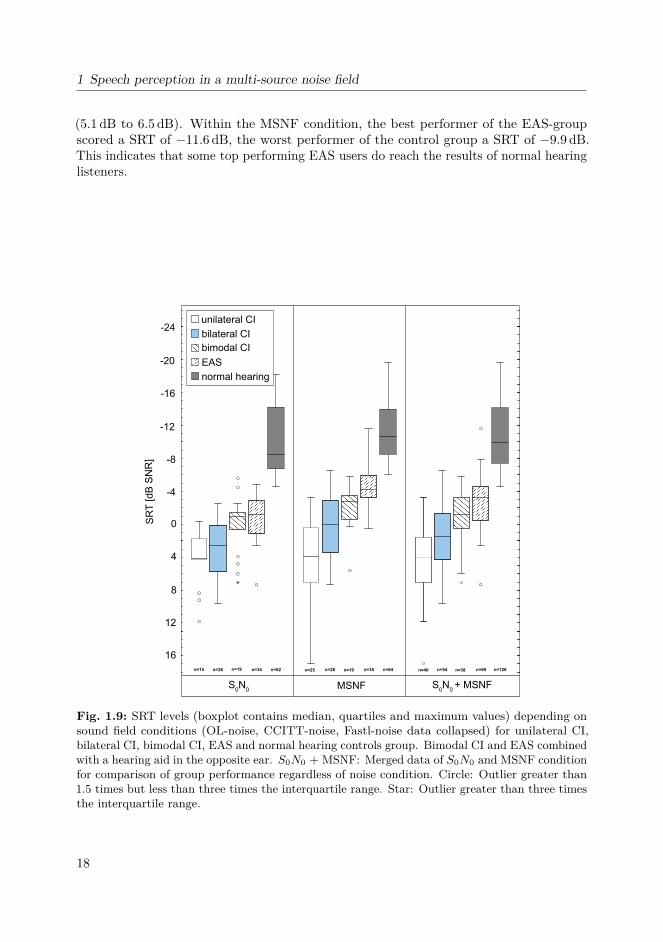
(5.1 dB to 6.5 dB). Within the MSNF condition, the best performer of the EAS-groupscored a SRT of −11.6dB, the worst performer of the control group a SRT of −9.9dB.This indicates that some top performing EAS users do reach the results of normal hearinglisteners.
-12
-8
-4
0
4
8
12
16
SR
T [d
B S
NR
]
MSNF
-20
-16
-24
S0N
0S
0N
0 + MSNF
n=28 n=35 n=64n=26 n=34 n=62 n=54 n=69 n=126n=19n=25
n=19n=15 n=38n=40
bilateral CI
EAS
bimodal CI
normal hearing
unilateral CI
Fig. 1.9: SRT levels (boxplot contains median, quartiles and maximum values) depending onsound field conditions (OL-noise, CCITT-noise, Fastl-noise data collapsed) for unilateral CI,bilateral CI, bimodal CI, EAS and normal hearing controls group. Bimodal CI and EAS combinedwith a hearing aid in the opposite ear. S0N0 + MSNF: Merged data of S0N0 and MSNF conditionfor comparison of group performance regardless of noise condition. Circle: Outlier greater than1.5 times but less than three times the interquartile range. Star: Outlier greater than three timesthe interquartile range.
18

1.5 Discussion
1.4.7 Group performance averaged over noise condition and soundfield condition
In order to compare group performance regardless of noise condition, data was collapseddepending on sound field conditions. This data is presented in figure 1.9. As alreadyshown in figure 1.8, the unilateral group do the worst and the EAS group demonstratedsuperior performance compared to the bimodal and bilateral CI groups. The largest effectbetween bilateral CI and EAS group is demonstrated in the MSNF sound field condition(SRT difference 4.2 dB, p<0.001). Best performers in the EAS group reached the range ofperformance of the control group. The difference between the best (EAS) and the worst(unilateral CI) implanted performer in the MSNF condition is 28.5 dB. Collapsed datafor the control group revealed significantly better performance than for the implantedgroups (p<0.001). In the MSNF condition, differences in average SRT levels between theCI bilateral/EAS and control groups were −10.5 dB and −6.5 dB respectively.
1.5 Discussion
Several studies have demonstrated the beneficial effect of combined acoustic and electricstimulation in noise: Recently, Dorman et al. (2008) have investigated speech perceptionin noise in a group of bimodal CI users (hearing aid in contralateral ear) compared toa group of unilateral CI users. When acoustic stimulation was added contralateral toelectrical stimulation, performance increased by 17% in quiet and 23% in a 4-talkerbabble noise condition. Seeber et al. (2004) and Seeber and Fastl (2008) demonstratedthe positive effect of bimodal and bilateral CI on localization ability which can be used bythe subjects to focus on the sentence presented from 0◦ in the MSNF condition. However,since speech and noise were presented in the S0N0 condition, the benefit of additionalbilateral information on speech recognition was not investigated.
1.5.1 Gap listening
The ability to listen into short temporal gaps produced by temporal amplitude fluctuationsin modulated noise (glimpsing) is a capacity of the auditory system. In this study datafrom normal hearing individuals in this study demonstrate that this effect is slightlylarger in the S0N0 sound field condition compared to the MSNF condition. This could beexplained by the acoustic summation of four independently modulated noise signals in theMSNF condition. In contrast to the single source S0N0 condition, this summation of fourindependently noise signals reduces the overall temporal fluctuation and the possibility tomake use of the glimpsing effect. Wagener and Brand (2005) reported that “a fluctuating,speech-shaped noise is recommended to differentiate between subjects”.
19

1 Speech perception in a multi-source noise field
Compared to normal hearing subjects neither the bilateral CI nor EAS users were ableto make use of the glimpsing effect: Average SRT levels did not improve in the modulatednoise condition. The average distorting effect of noise modulation on performance waseven higher in the unilateral CI condition. The average SRT of unilateral CI users wasapproximately 20dB higher than in normal listeners, whereas the average SRT of EASusers was about 10dB, and the average SRT of bilateral CI users was 15.6 dB higher thanin normal hearing subjects. These findings are in line with data of CI subjects (MED-ELCombi40 8-channel systems) compared to normal hearing (Fastl et al., 1998).
Fastl and Zwicker (2007, p. 341ff) defined an easy measure (Temporal-Resolution Factor,TRF) to investigate the ability of a subject to benefit from gap listening when hearinga pulsed sinusoidal test tone (500ms on, 500ms off) masked by square-wave-modulatedoctave-band noise with the period T = 64ms. The measurements of the hearing thresholdof the subject under three noise conditions are required to calculate the TRF: The hearingthreshold in quiet of the probe (without noise, LT HQ), the audibility of the probe maskedby the square-wave-modulated noise (LMOD) and the hearing threshold of the probe incontinuous noise (LCONT ). The TRF is calculated by the ratio of the level differenceof the conditions “continuous” and “modulated” and of the difference “modulated” and“threshold in quiet”, see formula (1.1). The TRF is close to one for normal hearing subjectsand can drastically decrease for hearing-impaired subjects. It can be concluded that thesehearing-impaired subjects have more difficulties to listen into temporal gaps and can notproperly, for example, discriminate phonemes of a word.
TRF = LCONT − LMOD
LMOD − LT HQ(1.1)
These findings bear a resemblance to the findings in this chapter: SRT-testing withspeech-modulated Fastl-noise CI subjects with no residual hearing (uni- and bilateral CIgroup) show lower performance compared to the bimodal CI group with residual hearingat the contralateral side. The EAS group with residual low frequency hearing at bothears perform even better in this task compared to the bimodal CI group. The normalhearing group in this study (estimated TRF close to one) performs even better in theSRT-testing than the EAS group.
1.5.2 Noise frequency characteristic
Comparing performance in different noise conditions, the normalized data illustratesmore clearly a degraded performance in CCITT-noise and the S0N0 condition for allpatient groups, whereas the control group demonstrates improved performance. Asshown in figure 1.7 OL-noise exhibits a low frequency emphasized power spectrum anda decreased spectral level between 500Hz and 3 kHz compared to the CCITT noisespectrum. This property can be shown by measuring the A-weighted and the linear
20

1.5 Discussion
Leq,A Leq,lin
CCITT-noise 74.0 dB(A) 75.0 dBOL-noise 68.9 dB(A) 75.0 dB
Tab. 1.3: A-weighted and linear equivalent continuous sound level of CCITT- and OL-noise.
equivalent continuous sound level for CCITT-noise and OL-noise at equal root meansquare (RMS) level (table 1.3). Linear and A-weighted equivalent sound levels are almostequal for CCITT-noise. The A-weighted equivalent sound level is lower for OL-noisecompared to linear sound level. Therefore the differences of spectral distribution (OL-noisecompared to CCITT-noise) were not responsible for the degraded performance in speechperception of bilateral CI and EAS group in CCITT-noise (figure 1.10).
1.5.3 Normalization in reference to OL-noise and S0N0
Results obtained from different groups of subjects might be influenced by the differentcomposition of many factors such as etiology, age at implantation, duration of experienceand rehabilitation quality. Therefore, between group comparisons might be compromisedto a certain extent. In order to minimize group effects, normalization was carried out withthe OL-noise S0N0 condition as reference for all subject groups. Box plots of normalizeddata are displayed in figure 1.10.
Normalized data for the Fastl-noise and S0N0 sound field condition clearly showedthe previously observed effect: The presence of temporal masker fluctuation deterioratesperformance severely in both implant user groups (bilateral CI −5.9 dB, EAS −1.6 dB),and increases performance dramatically in normal hearing subjects. In reference to theOL-noise condition, SRT levels for normal hearing subjects improved by about 7.4dB.Interestingly, the MSNF condition showed improved SRTs compared to the S0N0 conditionin both implant user groups. This indicates that bilateral CI/EAS bimodal subjects areable to make use of binaural cues. Hypothetically, performance in the implanted groupsincreased because speech and noise sources were perceptually separated. These effectswere present in all noise conditions. Hypothetically, performance in the MSNF conditionsincreased in addition due to binaural effects which foster the segregation between speechand noise sources.
21

1 Speech perception in a multi-source noise field
OL-noise
-12
-16
-8
-4
0
4
8
12
SR
T [d
B S
NR
]
S0N
0MSNF
CCITT-noise
S0N
0MSNF
Fastl-noise
S0N
0MSNF
bilateral CI
EAS
normal hearing
n=8 n=7 n=20n=8 n=7 n=20 n=10 n=7 n=20n=9 n=7 n=19n=10 n=7 n=19n=10 n=7 n=20
normalized to OL-noise S0N
0
Fig. 1.10: Data of figure 1.8 normalized in reference to OL-noise S0N0 condition for bilateralCI, EAS and normal hearing subject group. Both implanted groups showed the largest drop inperformance in modulated noise (Fastl-noise, S0N0 sound field). See text for further discussion.Boxplot contains median, quartiles and maximum values. Circle: Outlier greater than 1.5 timesbut less than three times the interquartile range. Star: Outlier greater than three times theinterquartile range.
22

2 Pitch scaling psychometrics in usersof electric-acoustic stimulation (EAS)
2.1 Summary of chapter 2
Knowledge of electric and acoustic pitch mapping may be important for effective fitting toset the frequency range of acoustic and electric processing. In this chapter, the bimodalpitch matching in EAS users as a function of the angular placement of electrodes isinvestigated. Results are compared with data obtained from previous pitch matchingstudies.
Pitch adjustment experiments were conducted in eight subjects with residual hearing inthe opposite ear as well as in the implanted ear. Four subjects received a standard 31.5mmelectrode array and four subjects received the shorter, more flexible 24mm FLEXEAS
electrode array (PULSARCI100 or SONATAT I
100 stimulator, MED-EL). The subjects’task was to listen to single electrode stimuli presented at a fixed rate (800 pulses persecond) via the cochlear implant, and to adjust the frequency of the acoustic stimulus untilthe perceived pitch matched the perception of the electrically conveyed stimulus. Two tofour of the most apical electrodes were tested depending on the range of the individual’sresidual hearing. Postoperative X-rays (“cochlear view”, Xu et al., 2000) were analyzed tocompare individual pitch matching data in terms of the electrode arrays’ insertion angle.
The average mean frequency match for the most apical electrode 1 in EAS subjectsimplanted with the FLEXEAS array was 583Hz, while for the two subjects with a deepinsertion of the 31.5mm standard electrode array the matches were 128Hz and 223Hz.Since the residual hearing in the EAS subgroup was rather limited in the high frequencyrange, a limited number of basal electrodes were assessed in order to determine the slope ofthe electric place/pitch function. A considerable variation in terms of the individual pitchfunction was observed. The slope of the pitch function varied to a large extent amongsubjects. The differences between contra- and ipsilateral adjustments were very small(mean average 14Hz) and within the range of the variance (average standard deviation,SD, 124Hz).
The application of a pitch matching procedure to assess the electric/acoustic crossoverfrequency is feasible. In the present study, ipsi- and contralateral pitch matches made by
23
2 Pitch scaling psychometrics in users of electric-acoustic stimulation (EAS)
EAS patients were nearly equal; therefore, a severe alteration in the excitation pattern ofthe basilar membrane in the implanted ear can be ruled out.
2.2 Introduction
The possibility of preserving residual hearing in an implanted ear has attracted worldwideattention. Current cochlear implants rarely provide adequate pitch perception. As hearingloss commonly affects higher frequencies more than the lower frequencies, a feasiblesolution is to preserve acoustic hearing in the low frequencies by inserting a specificallydesigned electrode array which minimizes trauma to the sensitive inner ear structures.Multiple studies suggest an overall benefit of combined EAS over conventional CIs (Ilberget al., 2011; Helbig et al., 2008; Helbig and Baumann, 2010; Lenarz et al., 2009). Forsubjects with severe-to-profound high frequency hearing loss, combined EAS appears tooffer a significant, everyday, and long-term benefit (see review in Talbot and Hartley,2008).
Initially, a CI processor and a separate in-the-ear hearing aid were necessary to provideamplification for the remaining acoustic hearing. Meanwhile, combined devices suchas the DUET (MED-EL) or the Hybrid system (Cochlear) have been developed, whichincorporate a hearing aid component and a CI processor into a single behind the ear unit(Baumann and Helbig, 2009). Since the residual hearing typically drops precipitouslyin the majority of EAS implantees, the range of beneficial acoustic hearing is limited.Moreover, there may be an advantage to setting the crossover frequency between acousticand electric hearing according to the individual pattern of surviving inner ear function aswell as neural tonotopy. Current methods disregard the individual electric place/pitchfunction and only take the pure tone audiogram into consideration. Fitting guidelinesoutlined by the DUET device manufacturer require the crossover frequency (precisely:The center frequency of the lowest filter band in the CI-processing signal path) of thespeech processor to be set to the 60dB pure tone audiogram hearing loss cut-off frequency(Baumann and Helbig, 2009). As animal studies report a strong interaction and mutualmasking between electric and acoustic stimuli in terms of spike count reduction (Vollmeret al., 2010), these interactions can also be expected in human subjects. As an example,Brill et al. (2001) reported a strong masking effect of acoustic broad band noise on electricstimulus threshold. Faulkner et al. (2003) stressed the need of knowledge about theelectrode-pitch function.
The impact of overlapping acoustic and electric stimulation on speech perception is stillthe subject of controversial discussion. Wilson et al. (2002) investigated the effects of theinfluence of CI analysis frequency range by varying the lower limit between 300Hz, 650Hzand 1000Hz. The authors report decreasing performance with increasing CI analysis filterband for all but one EAS subject. Interestingly, this subject showed the best residualhearing among all subjects in the implanted ear (nearly normal thresholds up to 500Hz,audiogram given in Kiefer et al. (2005), subject S.L.); and the best performance with an
24

2.3 Material and methods
increased band limit of 650 Hz. Kiefer et al. (2005) have provided only an anecdotal reporton the results obtained with different crossover frequency settings. One out of elevensubjects preferred 650Hz instead of the default 300Hz frequency setting. Zhang et al.(2010) have investigated whether a reduced overlap would improve speech recognitionin subjects with a cochlear implant in one ear and low-frequency acoustic hearing inthe contralateral ear. Their results show that reducing the overlap did not increasespeech understanding. However, these results were not obtained with simultaneouselectric/acoustic stimulation in the same ear; and therefore are not prone to mutualintracochlear hybrid masking effects. Vermeire et al. (2008a) reported that a reducedoverlap of cochlear implant stimulation and hearing aid amplification gave best resultsacross all listening conditions in four EAS subjects. All of the subjects in the studyimproved with a cochlear implant filter setting different from “full frequency range”.
As outlined above, the effects of mutual interaction between electric and acousticstimulation are still unclear. Therefore, methods to determine EAS frequency mapping areneeded. In this paper a pitch matching paradigm between the two different stimulationmodes in the implanted or contralateral ear are investigated as a potential procedure.This procedure should determine reliable estimates of pitch elicited by the stimulation ofthe most apical electrodes. The present study addresses the question of whether a bimodalpitch matching procedure for the ipsi- and contralateral ear is applicable to determine thecrossover frequency between acoustic and electric hearing in EAS users. The potentialof this psychoacoustic measurement to significantly improve speech perception in EASrecipients will be subject to further studies.
2.3 Material and methods
2.3.1 Subjects
Eight subjects implanted with either a MED-EL PULSARCI100 or SONATAT I
100 stim-ulator and who had various etiologies of hearing loss consented to participate in thepitch adjustment experiment (cf. table 2.1). Subjects’ age ranged from 26 to 75 yearsand their CI/EAS experience ranged from 1 to 30 months. Four subjects received a31.5mm (standard) electrode array, and four subjects received the shorter, more flexibleFLEXEAS 24mm electrode array (Adunka et al., 2004). One of the subjects (PI3) inthe standard electrode group received only a partial insertion of the standard electrodearray (three electrodes extra - cochlear) presumably due to cochlear otosclerosis. Anothersubject (EAS4) in the EAS group received a standard electrode with a restricted insertiondepth of 26 mm, as at the time of surgery the FLEXEAS array was not yet available.With the exception of subject EAS4, all subjects achieved 70% or more on the Freiburgmonosyllable test in quiet at 65dB speech presentation level (mean 80%, SD 13%).
25

2 Pitch scaling psychometrics in users of electric-acoustic stimulation (EAS)
subject etiology age at
test
[years]
implanted
ear
hearing
condition
implant
type
electrode
type
experience
CI [months]
FMS aided
65 dB
free field
remark
CI1 otosclerosis 38.3 left CI S Standard 8 70 % SSD
CI2 sudden hearing loss 51.0 right CI P Standard 30 90 % SSD
PI3 otosclerosis 67.7 right BM S Standard 1 80 % PI
EAS4congenital unknown
(progressive)47.3 right EAS P Standard 28 55 % PI
EAS5 unknown
(progressive)
29.4 right EAS P FlexEAS 6 90 % MT
EAS6 unknown
(progressive)
26.5 right EAS P FlexEAS 6 85 % MT
EAS7
EAS8
unknown
(progressive)
70.9 left EAS P FlexEAS 10 90 %
unknown
(progressive)
75.3 left EAS P FlexEAS 1 80 %
Tab. 2.1: Subject demographics. CI: Cochlear Implant, EAS: Electric-Acoustic Stimulation,BM: Bimodal (CI + hearing aid contralateral). P: PULSARCI
100, S: SONATAT I100. Standard:
31.7mm electrode array, FLEXEAS : 24mm electrode array. FMS: Freiburger Monosyllable,stimulus level 65dB SPL free field, EAS/BM: Duet device (EAS) or contralateral hearing aid(BM), CI only: electrical stimulation only (CI map set to full frequency range), contralateralear blocked, HA only: hearing aid only (CI2 single-sided deafness), acoustic stimulation, SSD:single-sided deafness, PI: partial insertion, MT: musical training.
All subjects showed varying degrees of residual hearing and in one case there was evennormal hearing in the contralateral, non-implanted ear (CI2). Figure 2.1 depicts puretone air conduction thresholds for the contralateral ear in three subjects with unilateralhearing loss. One subject showed normal hearing and two subjects experienced a mild tomoderate hearing loss. In figure 2.2 the left panel shows air conduction thresholds for thenon-implanted ear, while the right panel shows the thresholds for the implanted ear ofthe EAS subjects. The study was approved by the local ethical review board (Universityof Frankfurt, 168/07).
2.3.2 Cochlear implant interface
A customized interface (Research Interface Box II, RIB2, Institute for Applied Physics, Inns-bruck, Austria) was used to directly control the MED-EL PULSARCI
100 and SONATAT I100
stimulators. Details about the CI stimulator interface software and hardware are outlinedin Bahmer et al. (2008).
26

2.3 Material and methods
0.125 0.250 0.5 0.75 1 1.5 2 3 4 6 8
frequency [kHz]
-10
0
10
20
30
40
50
60
70
80
90
100
120
110
he
arin
g le
ve
l [d
B]
CI2
CI1
PI3
Fig. 2.1: Air conduction pure tone audiograms for the contralateral ear (non-implanted) insubjects with single-sided deafness supplied with CI.
0.125
a) b)
0.250 0.5 0.75 1 1.5 2 3 4 6 8
frequency [kHz]
non-implanted ear
EAS5
EAS6
EAS7
EAS8
EAS4
0.125 0.250 0.5 0.75 1 1.5 2 3 4 6 8
frequency [kHz]
implanted ear
EAS5
EAS6
EAS7
EAS4
2-10
0
10
20
30
40
50
60
70
80
90
100
120
110
hearin
g leve
l [d
B]
Fig. 2.2: Air conduction pure tone audiograms for a) EAS subjects in the contralateral ear forEAS4-8 and b) in the implanted ear for subjects EAS4-7.
2.3.3 Pitch matching procedure
The pitch matching procedure follows the experimental paradigm described by Baumannand Nobbe (2006). Depending on the audiometric threshold of acoustic hearing, thetask was performed at corresponding electrodes and with varying initial frequency of theacoustic stimulus. Initial pure tone frequency was pseudo-randomized in the range of theindividual’s hearing determined by the audiogram (figure 2.1 and 2.2) with a step widthof 100Hz.
The lower limit was set to 100Hz and the upper limit was the highest frequency wherethe subject was able to determine a most comfortable acoustic level. The stimuli for theCI and the residual hearing (either contra- or ipsilateral) were presented alternately. The
27

2 Pitch scaling psychometrics in users of electric-acoustic stimulation (EAS)
subject was asked to turn an endless incremental adjusting knob to change the frequencyof the acoustic stimulus. The matching task was terminated when the subject pressed akey to indicate that the acoustic stimulus was perceived at the same pitch as the electricreference stimulus in the implanted ear. There was no time limit on how long the subjectslistened to the alternating stimuli. Because of restrictions of availability, for each subjectand each electrode a varying number of adjustment repetitions were carried out. Thenumber of repetitions per individual is indicated by the index n in figures presented inthe result section.
2.3.4 Stimuli
The electric stimuli consisted of biphasic current pulses with a pulse duration of 26.7µsper phase, and had a total duration of 500ms. A previous study has shown that withpulse rates above approximately 300 pulses per second (pps) no further increase in pitchis perceived (Baumann and Nobbe, 2004b). To assure the absence of periodicity cues, thestimulation rate was fixed at 800 pps. Depending on the subject’s residual hearing in thenon implanted ear, two (subject EAS7: Upper limit of hearing 1500Hz) to 11 electrodes(subject CI1, single sided deafness, E1 to E11) were stimulated. The acoustic stimuli weredigitally generated and consisted of pure tones with a 25-ms rise/fall time and a durationof 500ms. The pure tones were delivered via a high quality 24-bit 8-channel AD-DAconverter (44.1 kHz sample rate) and amplifier, and were presented through audiometricheadphones (HDA 200, Sennheiser, Wennebostel, Germany). A schematic of the set-up isshown in figure 2.3. The frequency of the sinusoids was adjustable within the range ofindividual subjects’ audiograms. The inter-stimulus gaps between electric and acousticstimuli were 200ms.
2.3.5 Loudness balancing
The levels of the acoustic stimuli were determined via the MATLAB software as follows:Prior to testing, the level to achieve comfortable loudness was determined within therange of individual audiograms with frequency sampling points set to pure tone audiogramfrequencies. Depending on the adjusted frequency, the actual acoustic presentation levelduring the experimental run was then calculated based on a linear interpolation betweenthe predetermined comfortable loudness levels. To achieve comfortable loudness levels,the sound pressure level ranged from 80 to 110 dB SPL (B&K coupler 4152), dependingon frequency and individual hearing loss. The current amplitude was adjusted to theperception of comfortable loudness for each stimulated electrode with an ascending-descending technique (Baumann and Nobbe, 2004a).
28

2.3 Material and methods
MED-EL
research interface
box 2.0
control computer
(MatLab)
rotary pulse encoder
digital-to-analog
converter with
headphone amplifier
headphones CI-coil
soundproof room
Fig. 2.3: Schematic setup for pitch-matching experiment in a soundproof room. A controlcomputer running matlab was used to present acoustic stimuli after digital-to-analog conversionwith headphone amplifier via headphones and electric stimuli using a MED-EL research interfacebox (RIB 2.0) with CI-coil for direct CI stimulation without speech processor. The rotary pulseencoder was used by the subject for pitch adjustment of the acoustic stimulus.
2.3.6 Feedback device
To collect the subject’s data a custom made device has been developed and realized.The specification required an endless rotary knob with press switch function in a handybox. For this task a microcontroller (SpinWarrior24RE, Code Mercenaries, Schönefeld,Germany) was set up in combination with a mechanical rotary encoder in a handy box.The computer was connected via Universal Serial Bus (USB). A “cyclic retrieval” functionof Matlab returns digital data (movement steps) from the knob. The wiring diagram andan image are shown in figure 2.4.
2.3.7 Insertion angle estimation
Postoperative X-rays were available for subjects CI1 and EAS5-EAS8 which made itpossible to compare individual pitch adjustment data in terms of the electrode array’sinsertion angle (“cochlear view”, Xu et al., 2000, equivalent to “modified Stenver’s view”).The round window was estimated according to the method described by Cohen et al.(1996). As outlined by Boëx et al. (2006), the insertion angle of electrodes belonging tothe first turn of the spiral made by the electrode array were computed from the centre ofthis first turn, using as reference the zero reference line. In subject CI1 who had a deep
29

2 Pitch scaling psychometrics in users of electric-acoustic stimulation (EAS)
electrode insertion, the insertion angles of electrodes belonging to the second turn of thespiral were computed from the centre of this second turn, using the 720 degree line asreference.
B3
A3B2A2B1A1B0A0
/EN
Sw6Sw5Sw4Sw3Sw2Sw1Sw0
rotary pulse
encoder
a) b)
Fig. 2.4: a) Wiring diagram and b) implementation of rotary pulse encoder developed andrealized for pitch-matching experiment.
2.4 Results
2.4.1 Contralateral acoustic-electric pitch matches for the mostapical electrode
Figure 2.5 displays the acoustic frequencies matched to the most apical electrode byeach of the eight subjects. A large interquartile range is observed for several subjectsindicating considerable variation in pitch adjustment (except subject EAS5). The medianadjusted frequencies were 128Hz, 223Hz, 310Hz, 309Hz, 481Hz, 579Hz, 543Hz, and689Hz (subjects CI1, CI2, PI3, EAS4-8). Compared to all other subjects, CI1 and CI2adjusted the lowest median average frequencies. Both subjects show full insertion ofthe standard electrode array. Subjects with partial insertion of the standard electrodearray adjusted matching frequencies a little higher to 310Hz and 309Hz (subjects PI3and EAS4). All subjects in the subgroup implanted with the FLEXEAS array (EAS5-8)matched the comparison pure tone stimulus higher than the subgroup implanted with
30

2.4 Results
a standard array. This indicates that - as expected - the shorter electrode array withmaximum insertion angles at or below 360 degrees conveys higher pitch with stimulationof the most apical electrode.
EAS8EAS7EAS6EAS5EAS4PI3CI2CI1
subject number
n=12 n=2 n=1 n=6 n=21 n=19 n=6 n=7
800
900
600
400
200
700
500
300
100
0
ad
juste
d fre
qu
en
cy [H
z]
Fig. 2.5: Contralateral acoustic-electric pitch matches on the most apical electrode (E1) for allsubjects (boxplot contains median, quartiles and maximum values). Index n denotes individualnumber of repetitions. Circle: Outlier greater than 1.5 times but less than three times theinterquartile range.
2.4.2 Ipsilateral acoustic-electric pitch matches for the most apicalelectrode
In addition to contralateral acoustic adjustments (across-ear pitch comparison), foursubjects EAS4 - EAS7 also compared the electric and acoustic stimulus in the implantedear (ipsilateral pitch comparison) for the most apical electrode E1. Figure 2.6 replicatesthe results displayed in figure 2.5 for the contralateral ear with additional results for theimplanted ear. Pitch matches obtained from either the implanted or the opposite ear fellinto the same range. As already observed in the contralateral ear, pitch matches made bysubject EAS4 (partial insertion of a standard electrode) were lower than those matchesderived from subjects implanted with the FLEXEAS electrode array. Subjects EAS4 andEAS5 show very small variation with repeated adjustments (interquartile ranges: EAS48Hz contra, 27Hz ipsi, EAS5 19Hz contra, 17Hz ipsi), whereas subjects EAS6 and EAS7show large variation (interquartile ranges: EAS6 124Hz contra, 146Hz ipsi, EAS7 111Hzcontra, 179Hz ipsi).
The difference in the mean average adjusted sinusoid frequency between the ipsi- andcontralateral ear was 14Hz, 7Hz, 7Hz, and 28Hz for subjects EAS4 - EAS7, respectively.
31

2 Pitch scaling psychometrics in users of electric-acoustic stimulation (EAS)
These differences were only about factor two to four larger than frequency difference limenof normal hearing subjects (cf. Fastl and Zwicker, 2007, p. 182ff).
EAS7EAS6EAS5EAS4
subject number
ipsicontra ipsicontra ipsicontra ipsicontra
1600
1400
1200
1000
800
600
400
200
1500
1300
1100
900
700
500
300
100
ad
juste
d fre
qu
en
cy [H
z]
n=6 n=6 n=21 n=3 n=19 n=12 n=6 n=5
Fig. 2.6: Pitch matches in a subgroup of EAS subjects. Contralateral (contra) as well asipsilateral (ipsi) acoustic-electric pitch matches on the most apical electrode (E1). Index ndenotes individual number of repetitions. Average mean difference in the range of SD. Seefigure 2.5 for explanation of boxplot symbols. Circle: Outlier greater than 1.5 times but less thanthree times the interquartile range. Star: Outlier three times over/under interquartile range.Whiskers: Range.
2.4.3 Electrode-pitch function
To estimate the magnitude of pitch change with electrode positions, subjects implantedwith the FLEXEAS electrode array performed pitch matches in the ear opposite to theimplanted side for a set of apical reference electrodes. The number of reference electrodesdepended on the upper limit of residual hearing in the contralateral ear. Between two(EAS7) and four reference electrodes (EAS5 and EAS6) elicited pitch percepts in therange of individuals’ audiometric thresholds in the contralateral ear (cf. figure 2.2 left).Figure 2.7 shows the median values of pure tone frequency adjustments in reference toestimated insertion angle. Each data point represents adjustments for a specific electrodelocation. The data derived from the subject with unilateral hearing loss (full insertion of astandard electrode) is also displayed. Electrode insertion angles could not be determinedfor subjects CI2, PI3 and EAS4, because Stenvers’ X-rays were not available. Thereforepitch matching data from these subjects could not be included in figure 2.7.
32

2.5 Discussion
090180270360450540630720810
64
128
256
512
1024
2048
4096
insertion angle [degree]
ad
juste
d fre
qu
en
cy [H
z]
EAS6
EAS5
EAS8
EAS7
CI1
present data
CH1
H70
Cp18
Fp36
Fp39
H58
H68
OC
SG
previous data
Fig. 2.7: Bold lining: Place-pitch map depending on electrode array insertion angle for EASsubjects EAS5-8 and unilaterally deaf subject CI1 from this study. Matches obtained by com-parison between implanted (electric stimulus) and opposite ear (acoustic stimulus). In addition,data (H70, Cp18, Fp36, Fp39, H58, H68) from Boëx et al. (2006) and data (CH1) from Dormanet al. (2007) are depicted with thinner lines. Frequency position functions for the organ of Corti(OC) and spiral ganglion (SG) are plotted for reference (Stakhovskaya et al., 2007). See text fordiscussion.
2.5 Discussion
2.5.1 Lowest pitch perception depends on electrode array andinsertion depth
As depicted in figure 2.7, frequency adjustments for the most apical electrode seem tobe related to electrode array length and insertion angle. Baumann and Nobbe (2006)reported frequencies between 150Hz and 380Hz as an average pitch match for the mostapical electrode (MED-EL standard electrode array). Data from two subjects (CI1, CI2)in the present study are in good accordance with these findings. With partial insertion orshorter electrode arrays, the pitch elicited by stimulation of the most apical electrode ishigher. Pitch adjustments for the FLEXEAS electrode array were between 481Hz and689Hz. The intracochlear position of the most apical electrode of the FLEXEAS arraywas measured as being between 260 and 370 degrees. Boëx et al. (2006) presented pitch
33
2 Pitch scaling psychometrics in users of electric-acoustic stimulation (EAS)
matching data for six subjects implanted with different electrode arrays and stimulatorsmanufactured by Advanced Bionics (see figure 2.7). Five of their subjects matched afrequency of approximately 400Hz as the corresponding pitch to an electrode positionedat 360 degrees. These results are also in agreement with the present study. A recent studypresented pitch matching data from a subject implanted with a MED-EL COMBI 40+implant (Dorman et al., 2007), see figure 2.7. For the first three apical electrodes, pitchmatches were around 500Hz. Pitch matching values increased for the remaining electrodes.Another recent study presented pitch scaling data for the most apical electrode from 14users of different implant models manufactured by Cochlear Corporation (McDermottet al., 2009). The results were between 250Hz and 900Hz with angular insertion depthsbetween 350 and 410 degrees. The average frequency for the most apical electrode (E22,electrode indexing applied by Cochlear) was 483Hz.
2.5.2 Constraints of pitch matching with electric-acoustic stimulation
The present results on pitch matching show considerable variation in some subjects. Thismay be due to differences in sound quality between electric and acoustic stimuli. Assingle electrode stimulation creates a neural spread of excitation, it could be expectedthat neurons are activated over a broad range of characteristic frequencies which possiblyimplies ambiguity or noise in pitch perception. Paradoxically, this rather broad electricstimulation elicits clear and mostly ’noiseless’ pitch percepts in most subjects; it is only incomparison with acoustic stimulation when ambiguities appear. These differences make areliable pitch comparison difficult to achieve.
Another consideration is the fact that subjects with profound hearing loss sometimesperceive non-auditory vibrotactile or pressure sensations in response to high sound pressurelevels (Baumann and Nobbe, 2006). Furthermore, in EAS subjects with profound hearingloss, regions of non-functional inner hair cells (dead regions) may be present in the basalturn of the cochlea (Moore, 2004). If the frequency of an acoustic stimulus excites thearea of a dead region, “off frequency listening” may occur as inner hair cells at the borderof the functional area will be stimulated. As a consequence, a variation in the frequencyof the acoustic stimulus in a dead region will not correspond to a change in pitch.
However, in this study subjects with normal or nearly normal hearing in the nonimplanted ear were tested and still a large amount of variation was observed (cf. figure 2.5subject CI1). On the other hand, some EAS subjects performed with very high repetitionaccuracy (subjects EAS4, EAS5). The rate-place mismatch seems to be a potentialorigin for the variation in pitch adjustments, since a stimulation rate of 800 pps was used.Presumably, if a place inside the cochlea corresponds to this rate, a more accurate pitchmight be feasible. The lack of accurate matching in electric acoustic pitch comparisonsneeds to be further studied.
34

2.5 Discussion
It has been argued that an electrode array introduced into the cochlea may alter thebiomechanical properties of the inner ear and thus affect the perception of acoustic stimuli(Kiefer et al., 2006). If the electrode array contacts the basilar membrane, the membranemay be fixated within this region. Kiefer et al. (2006) predicted the extinction of basilarmembrane displacement in the fixed, non-motile region. In addition, they predicted anamplitude increase in the basilar membrane movement before and behind the fixed region.Therefore, shifts in amplitude maxima towards the fixed region might occur, which willaffect pitch perception. For a complete fixation of the basilar membrane in the middlepart of the cochlea, the results of a simulation study by Kiefer et al. (2006) showed amaximum enhancement of 8dB in basilar membrane movement. It remains unclear ifthis effect is large enough to shift pitch perception. The differences between contra- andipsilateral adjustments from four EAS subjects depicted in figure 2.6 are very small (meanaverage 14Hz) and within the range of the variance (average SD 124Hz). Therefore it isreasonable to conclude that these EAS subjects have no severe alteration in the basilarmembrane excitation pattern.
All of our subjects’ pitch estimates for the most-apical electrode correspond to frequenciesthat are well below what is expected from the location of the spiral ganglion (SG) neuronsthat are presumably activated by that electrode (Stakhovskaya et al., 2007; figure 2.7).Likewise, none of the more basally located electrodes elicited pitch percepts predicted bythe organ of Corti (OC) frequency position functions. This finding is well in line with theoutcomes of several other studies (Baumann and Nobbe, 2006; Boëx et al., 2006; Dormanet al., 2007; McDermott et al., 2009). A possible explanation for the mismatch in pitchadjustment and the reference of the OC mapping may be the speech processor setting ofthe filter frequency. Subjects may have adapted to this setting and therefore determinedtheir preference for a certain frequency rather than basing their pitch matches on OCtuning.
Figure 2.8 displays individual average pitch match data obtained from four EAS subjectsin this study against their speech processor filter centre frequencies (DUET map frequency)for all matched electrodes. Data from subject EAS8 was plotted with two different filtersettings. A close relation between map filter frequency setting and matched frequency isvisible for subjects EAS5, EAS6, and EAS8 (M2 map setting, also preferred map). Thisfinding may account for the fact that the pitch matches obtained were lower than thosepredicted by either the OC or SG map.
There are assumptions on the role of adaptation in pitch perception in CI users withexperience over time (McDermott et al., 2009; Reiss et al., 2007, 2008). It has been arguedthat if implant recipients with usable acoustic hearing listen to sounds via simultaneouselectric and acoustic stimulation, a pitch mismatch would be noticeable. Presumably,a simultaneous acoustic and electric stimulation resulting from a sound signal with afrequency of 250Hz would be perceived at a much higher pitch with electric compared toacoustic stimulation. It is plausible that perceptual adaptation could occur over time andreduce the pitch difference. Such adaptation would result in a smaller difference between
35

2 Pitch scaling psychometrics in users of electric-acoustic stimulation (EAS)
256 512 1024 2048256
512
1024
2048
DUET map-frequency [Hz]
ad
juste
d fre
qu
en
cy [H
z]
EAS6
EAS5
EAS8 - M1
EAS8 - M2
EAS7
Fig. 2.8: Pitch adjustments for electrode sites and corresponding filter centre frequency settingof the DUET speech processor. Pitch matching data from subject EAS8 plotted with two differentfilter settings (M1, M2). M2 preferred mapping.
the frequency corresponding to the pitch of the electric stimulation and the originalacoustic frequency (McDermott et al., 2009). The reproducibility of electric/acoustic pitchmatching by means of repeated measurements over time in two subjects was determinedto test the hypothesis of pitch adaptation.
Figure 2.9 displays test results collected over nine months. Median pitch adjustmentson one single electrode at the first and last test session were 481Hz and 472Hz for subjectEAS5, and 561Hz and 585Hz for subject EAS6 respectively. A perceptual adaptationeffect, which would change pitch perception over time, was not apparent in these twosubjects.
2.5.3 Electrode place pitch for insertion angles above 450 degrees
Baumann and Nobbe (2006) reported that for several subjects with deeply insertedelectrodes the most apical electrodes show no clear perceptual pitch difference.
This finding has been replicated by Boëx et al. (2006), where one subject with anelectrode array insertion angle larger than 450 degrees showed no difference in perceivedpitch for apical electrodes (cf. figure 2.7). Dorman et al. (2007), who outlined an electricfrequency-to-place map for a CI subject with hearing in the non-implanted ear, also foundno difference (cf. figure 2.7). Vermeire et al. (2008b) investigated neural tonotopy in
36

2.5 Discussion
800
700
600
500
400
300
200
ad
juste
d fre
qu
en
cy [H
z]
n=14 n=5 n=5 n=8 n=6
EAS5 EAS6
subject number
135
implant experience [months]
951
Fig. 2.9: Repeated pitch adjustment measurements for two subjects with a history of musicaltraining (boxplot contains median, quartiles and maximum values). No perceptual pitch adapta-tion effect over a period of nine months (implant experience time denotes “post-hookup” time).Circle: Outlier greater than 1.5 times but less than three times the interquartile range.
subjects with unilateral hearing loss by means of a scaling procedure. Eight out of thirteensubjects showed disturbed apical tonotopy with either no change in pitch or pitch reversalsfor electrodes located more basally. Likewise, in the present study Subject CI1’s pitchmatching data as depicted in figure 2.7 is nearly identical for the five most apical electrodesstarting at an angle of 350 degrees. As outlined previously, missing pitch percepts in theapical region are likely to be related to the neurophysiologic finding of no spiral ganglioncells in this part of the cochlea (Hochmair et al., 2003; Spoendlin and Schrott, 1989).The most apical half turn of the cochlea is innervated through Rosenthal’s canal withdendrites, which are connected to narrowly neighbored spiral ganglion cells located in thecenter of the modiolus. Due to the spread of the electric field it can be assumed that thesame set of dendrites projecting to the same spiral ganglion cells are excited and activatedwhen neighboring electrodes are stimulated. Consequently, no clear differences in pitchcan be perceived (Baumann and Nobbe, 2006). Another explanation for this effect mightbe the etiology as subject CI1 suffered from otosclerosis. Poor channel separation andthus poor pitch perception might be present due to the poor isolating properties of thebony structures.
Nevertheless, a general loss of ability to distinguish pitch perception on apical electrodescannot be concluded, since some subjects showed weak tonotopic matching for most apicalelectrodes. The differences may be due to considerable variation in anatomical structures.
37

38

3 Simulation of electric andelectric-acoustic hearing
3.1 Summary of chapter 3
Patients with Electric-Acoustic Stimulation (EAS) show significant better results inspeech intelligibility tests in complex noise situations (cf. chapter 1) compared to bilateralimplanted Cochlear Implant (CI) patients. To investigate this positive effect it is importantto simulate the hybrid stimulation with a computer model and to test this with normalhearing subjects.
The speech recordings of a German sentence test (Oldenburger Satztest, OLSA) anddifferent types of noise (speech modulated Fastl-noise and unmodulated OL-noise) weremodified in a signal processing pathway to simulate the electric-acoustic hearing.
First, the continuous spectrum was filtered at the 12 center frequencies of a CI speechprocessor (MED-EL DUET) and resynthesized using a 12-band sinusoidal-vocoder withcontinuity of phases at the sampling points (identical 12 frequencies) to represent the partof electrical hearing with a CI. A low-pass filtered part of the original signal with differentcutoff frequencies and two different processing schemes of fundamental frequency wereadded to represent residual low frequency hearing. The used noises were treated equallysuch as the speech recordings.
These synthesized audio signals should simulate the hearing of implanted CI and EAS-users in quiet and in noise. Speech Reception Thresholds (SRT) were measured using anadaptive procedure. Only normal hearing subjects participated in the EAS-simulationexperiment. The speech test was presented binaurally via headphones. The results werecompared to the data of patients supplied with CI- and EAS-systems.
The median values of both conditions showed conformance between simulation and im-plantees for a subset of tested conditions. Therefore, CI- and EAS-simulation experimentscan be used to estimate the influence of different type of noise sources on the SRT of CI-and EAS-users.
39

3 Simulation of electric and electric-acoustic hearing
3.2 Introduction
The results of chapter 1 necessitate an examination of the “glimpsing” for differentconditions of residual low frequency hearing. To investigate these factors, which result inan improved “glimpsing”, an EAS/CI-simulation with different kinds of low frequencyinformation was set up and conducted with normal hearing subjects. The results of thesesimulations were compared to the data of implantees. Dorman et al. (2008) reportedthat “performance increased by 17-23 percentage points on tests of word and sentencerecognition in quiet and sentence recognition in noise” for a fully inserted CI on one sideand residual low frequency hearing at the contralateral side. Brown et al. (2010) gave anaccount of the importance of fundamental frequency for speech perception in noise forhearing impaired and CI listeners.
Simulation of CI and EAS or bimodal CI has been shown in different studies, but thenumber of channels was limited to five (Dorman et al., 1997; Chen and Loizou, 2011), six(Kong and Carlyon, 2007), eight (Cullington and Zeng, 2008; Li and Loizou, 2008; Souzaet al., 2011) or eleven channels (Zollner, 1979).
The importance of temporal fine structure for speech perception and the problems of aninadequate representation of fundamental frequency f0 are reported in Stickney et al. (2007)and Brown and Bacon (2010). Faulkner et al. (2003) studied the adaptation to distortedfrequency-to-place maps and used an eight-band noise-excited vocoder similar to that usedby Shannon et al. (1995) who reduced the spectral cues but without CI/EAS-simulation.
3.3 Material and methods
3.3.1 Subjects
The data collected by simulation experiments with normal hearing subjects was comparedto the data of ten bilateral CI and eleven EAS patients. The definition of normal hearingis shown in appendix A.1, implantees demographics is shown in appendix A.2. The datacollection of normal hearing in this simulation experiment was realized in three sessionsseparated in time. This resulted in a varying number of participants in the different partsof experiments. The experience of all implantees with CI or EAS was more than threemonths.
40
3.3 Material and methods
3.3.2 Hardware and software
The CI/EAS-simulation experiments and data collection were conducted by means ofa personal computer equipped with a high quality 24-bit 8-channel AD-DA converterwith included headphones amplifier (Hammerfall DSP Multiface II, RME, Germany).The stimuli were presented binaurally via headphones (HDA 200, Sennheiser, Germany).The experiment control was realized with a script running on software MatLab. Thisexperiment was performed in a sound proof room.
The SRT was measured using the OLSA sentence test described in chapter 1.3.3. Thespeech signal was presented with a fixed SPL of 65dB, the noise was adaptively adjusteddepending from the correctly discriminated words of the sentence. To minimize thetraining effect in the sentence test, a training session with a minimum of 20 sentences wasdone previous to the data collection (Rader and Baumann, 2009).
3.3.3 Acoustic stimuli
The speech material of the OLSA and two types of noise (OL-noise and Fastl-noise, cf.chapter 1.3.5) were analyzed and processed digitally to an acoustic EAS-simulation fornormal hearing subjects. A schematic of this signal processing is shown in figure 3.1. First,the sound files were converted to the the “Part-Tone-Time-Pattern” (PTTP) domainaccording to Heinbach (1988) and Baumann (1995). This step includes a Fourier-t-Transformation (FTT, Terhardt, 1985) with adjusted analysis bandwidth proportionalto the critical bands of the ear. Frequency and phase were analyzed and a magnitudespectrum was built. Finally a maxima-detection with defined criteria was done to obtainthe PTTP of the input signal. The graphical PTTP representation of the Germansentence “Stefan gewann zwölf grüne Blumen.” [Stefan won twelve green flowers.] is shownin figure 3.2a.
As a second step the upper cutoff frequency was set to 8500Hz which is a typicalfrequency transmission range of a CI speech processor. The lower cutoff frequency was setto 500Hz which is the average crossover frequency for most DUET users. The continuousfrequency spectrum was divided into twelve band pass filtered channels according tothe upper and lower cutoff frequencies of the DUET speech processor (table 3.1) andstraightened to the center frequencies (figure 3.2c) which were set according to thesuggestion given by the MED-EL speech processor fitting software. The resynthesis of thesound material to the time domain was realized with a 12-band sinusoidal-vocoder withphasing continuity at the sampling points. The frequencies of the sinusoidal vocoder werechosen identically to the band-pass center frequencies of the DUET speech processor andare shown in table 3.1, too. This signal intended to simulate the “electric” stimulation. Finestructure frequency information is lost due to fixed pitch for each of the twelve channels.Only amplitude information is changing at every of the 12 channels corresponding to theoutput of the band-pass filtered input signal.
41

3 Simulation of electric and electric-acoustic hearing
channel resynthesis
number lower upper frequency [Hz]
1 500 637 567
2 638 807 717
3 808 1022 909
4 1023 1294 1150
5 1295 1639 1457
6 1640 2076 1845
7 2077 2628 2336
8 2629 3328 2958
9 3329 4215 3746
10 4216 5337 4743
11 5338 6759 6007
12 6760 7999 7606
cutoff frequency [Hz]
Tab. 3.1: Channel numbers, cutoff frequencies of analytic filters used for speech processinganalysis (DUET) and center frequencies used for resynthesis for CI/EAS-simulation experiment.
In order to provide additional low frequency information for the CI-simulation differentconditions were composed:
• EAS500: The signal in the PTTP-domain was filtered with a low-pass filter (cutofffrequency fLP = 500Hz, slope: -60 dB/octave) to model a typical residual acoustichearing of an EAS-implanted patient. The PTTP representation of this EAS-simulation is shown in figure 3.2c.
• EAS200: In some EAS users residual hearing is more limited. In order to reflect themore restricted residual hearing, the cutoff frequency fLP was set to 200Hz (slope:-60 dB/octave, figure 3.2d).
• Fixed level of fundamental frequency (Lfix): To investigate the major influenceof pitch information, the amplitude of fundamental frequency f0 was fixed to aconstant level (figure 3.2e). The level of f0 was set to a psychoacoustically judgedloudness to achieve a loudness balanced signal.
• Fixed fundamental frequency (Ffix): In this case an extraction of the f0 wasdone and the frequency was fixed to 110Hz (figure 3.2f).
42

3.3 Material and methods
FTT (window adjusted to center frequencies)
analysis of frequency and phase
magnitude spectrum
maxima-detection
sinusoidal-vocoder (phasing continuity)
LP
filterbank (DUET speech processor)
summation of power in each band
analysis
input signal
part-tone-time-pattern
resynthesis
output signal
“electric” hearing
“acoustic” hearing
CI-simulation
EAS-simulation
f0-extraction
f0-fixation of- level- frequ.
Fig. 3.1: Schematic of sound processing for CI and EAS-simulation using part-tone-time-pattern(PTTP). The input signal was processed in a signal processing chain and resulted in an acousticoutput signal. Red boxes indicate functional blocks: After signal analysis (PTTP) the signalpath was divided into an optionally “acoustic” hearing path (residual low frequency hearing) andan “electric” hearing path (CI) followed by summation and resynthesis.
Figure 3.2 shows the PTTP representations of different stages in the signal processingchain of figure 3.1. The x-axes represent the time in seconds and the y-axes the frequency inHertz (Bark scaled). The power of each data point is coded in colors with blue for low andred for high power. Figure 3.2a displays the spoken German sentence “Stefan gewann zwölfgrüne Blumen.” [Stefan won twelve green flowers] analyzed in PTTP. Figure 3.2b showsthe output of CI-simulation after resynthesis. The 12 horizontal lines are representingthe channels (electrodes) of a CI containing only intensity and no pitch informationin each channel. Figure 3.2c and d are the combination of CI-simulation and low-passfiltered signal (fLP = 500Hz and fLP = 200Hz) resulting in EAS-simulation. Fixed levelof fundamental frequency (Lfix) and fixed fundamental frequency (Ffix) are shown infigure 3.2e and 3.2f respectively.
43

3 Simulation of electric and electric-acoustic hearing
fre
qu
en
cy [H
z]
a) b)
100
500
300
1000
2000
3000
40005000
7000
fre
qu
en
cy [H
z]
100
500
300
1000
2000
3000
40005000
7000
c) d)
fre
qu
en
cy [H
z]
0 1 2
time [s]
0 1 2
time [s]
e) f)
100
500
300
1000
2000
3000
40005000
7000
Fig. 3.2: Spectro-temporal representation of the German sentence “Stefan gewann zwölf grüneBlumen.” [Stefan won twelve green flowers]: a) Part-tone-time-pattern, b) simulation of pureelectrical stimulation, c) combined EAS-simulation with fLP = 500Hz and d) fLP = 200Hz.EAS-simulation with modified fundamental frequencies: e) fixed level (Lfix) and f) fixed frequency(Ffix). Power: blue-low, red-high. The y-axes in Hertz are arranged to the Bark-scale.
44

3.4 Results
3.4 Results
3.4.1 Cochlear implant-simulation
The results depending of two different cutoff frequencies and for the CI only conditionare shown in figure 3.3. Boxplot contains median, quartiles and maximum values. Ifthe low-pass signal is absent (condition CI only), SRT results are in Fastl-noise 6.2dBand for real CI user data 6.8 dB. The CI-simulation data is in good accordance to thedata of CI users and no significant difference could be found (p=0.690). The results forSRT measures in OL-noise are 5.1dB for CI-simulation and −0.4 dB for CI user data(p<0.001).
EAS
OL-noiseFastl-noise
bilateral CI
-20
-15
-10
-5
-0
5
10
15
20
-20
-15
-10
-5
-0
5
10
15
20
EAS user
EAS200
-simulation
EAS500
-simulation
SR
T [d
B S
NR
]
CI user
CI-simulation
OL-noiseFastl-noise
n=9 n=18 n=10 n=13 n=18 n=11 n=13 n=18n=10 n=18
Fig. 3.3: Left: Speech reception threshold (boxplot contains median, quartiles and maximumvalues) in Fastl- and OL-noise obtained in simulations and groups of patients. Right: Resultsderived with EAS-simulation in two subgroups with different acoustic low-pass filter frequencyof fLP = 200Hz (blue) and fLP = 500Hz (shaded). Speech presentation level was set to 65dB,noise level was adjusted using an adaptive procedure. Index n denotes number of subjects. Circle:Outliers greater than 1.5 times but less than three times the interquartile range.
3.4.2 Influence of cutoff frequency
The addition of low-pass filtered speech components signal (cutoff frequency 200Hz)improved the SRT for Fastl- and OL-noise compared to CI only group. A good accordance
45

3 Simulation of electric and electric-acoustic hearing
of the median values for the SRT is shown for the simulation data with a cutoff frequencyof 200Hz (−0.4 dB) and the measured EAS-patients’ data (1.9 dB) in Fastl-noise. Anextension of the acoustic low frequency hearing (increase of cutoff frequency from 200 to500Hz) in the simulation results in a manifestly improved SRT (−10.1 dB) which is notin agreement with the measured EAS-patients’ data. A stronger correlation between theimplantees’ data and the EAS-simulation is found for the cutoff frequency fLP = 500Hz, ifcontinuous OL-noise is used instead of speech simulating Fastl-noise (simulation: −1.0 dB,implantees: −1.9 dB).
3.4.3 Influence of modified fundamental frequency
Figure 3.4 displays boxplots of SRT measurements in Fastl- and OL-noise for the followingsimulation groups: EAS200 is compared to the two modified fundamental frequencyconditions Ffix and Lfix. The median values show in both noise conditions a differencebetween Ffix and Lfix (figure 3.4). The difference is 2.1dB (Ffix: 0.8 dB; Lfix: 2.9 dB)for Fastl-noise and slightly weaker with 1.0dB (Ffix: 2.7 dB; Lfix: 3.7 dB) for OL-noise.However, the medians show only tendencies to a better speech discrimination in conditionFfix. No significant difference can be found between fixed Lfix and Ffix (p=0.149) inOL-noise.
A highly significant deterioration of performance for the SRT could be shown in Fastl-noise, if speech information was reduced from the EAS200 condition to Lfix (p<0.001) orfrom EAS200 to Ffix (p=0.004).
OL-noise
-10
-15
-5
0
5
10
SR
T [d
B S
NR
]
EAS200
-simulation
CI-simulation + f0 (frequency fix)
CI-simulation + f0 (level fix)
Fastl-noise
p<0.001
p=0.004
n=12 n=12 n=12 n=12 n=12
Fig. 3.4: Speech reception threshold (boxplot contains median, quartiles and maximum values)for EAS-simulation in Fastl- and OL-noise with an acoustic low-pass frequency of 200Hz (white)and the conditions CI-simulation with additional fundamental frequency f0 for frequency fix(blue) and level fix (shaded). Presentation level of speech was 65 dB, the noise was adjusted usingan adaptive procedure. Index n denotes number of subjects.
46

3.5 Discussion
3.5 Discussion
3.5.1 Simulation of cochlear implant and electric-acoustic stimulationwith varied cutoff frequency
The presented data of the CI- and EAS-simulations are in good accordance to the dataof the implantees. If the EAS-simulation was an easy task for normal hearing subjects(fLP = 500Hz), they performed better compared to the implanted subject group. Thedeteriorated performance for the more difficult tasks (EAS200 and CI only in combinationwith OL-noise) could be caused by limited training of hearing with CI/EAS-simulationfor the normal hearing subjects.
The data of CI-simulation SRT measurement show similar values for speech modulatedFastl-noise and unmodulated OL-noise. Compared to the CI-simulation an improvedSRT was found for the EAS500 as well as the EAS200 group for the corresponding noiseconditions in EAS-simulation data. Analog findings are shown by Li and Loizou (2008):No impact was found in a continuous speech-shaped noise condition for an EAS-simulation(five-channel vocoder with low-pass filtered unprocessed signal) compared to an eight-channel CI-simulation with the same frequency range. An improved speech recognitionrate was found for EAS-simulation in a modulated noise signal condition (female voiceserved as competing-talker) compared to CI-simulation.
The EAS500 and EAS200 groups showed an improved SRT in Fastl-noise condition(EAS500: −10.1 dB; EAS200: −0.4 dB) compared to OL-noise (EAS500: −1.0 dB; EAS200:2.1dB) whereas implanted EAS subjects showed a deteriorated speech perception inFastl-noise condition (1.9 dB) compared to OL-noise condition (−1.9 dB). This effectcould be explained with the TRF (introduced in section 1.5.1). The TRF of normalhearing subjects is superior to EAS implanted subjects with a partial hearing loss whoare rather comparable to subjects with hearing loss for data shown in (Fastl and Zwicker,2007, p. 346).
Subjects who participated the CI/EAS-simulation study presented in this chapterreported an improved naturalness for the EAS-simulation compared to the CI-simulation.Zollner (1979) reported a substantially improved naturalness of speech quality for anadditional unprocessed low-pass filtered speech signal in combination with an 11-channelvocoder simulation experiment, too. In contrast to the data of Zollner (1979) with noimprovement in the Freiburger monosyllable testing for additional low-pass filtered signal,an improvement in speech perception in noise for sentence testing has been shown.
EAS with the use of residual low frequency hearing is the best option for patients with asteep (ski-slope like) hearing loss at higher frequencies and residual hearing below 500Hz.The positive effect of additional usable low frequency hearing is shown for EAS simulationdata in this chapter, for EAS patients in chapter 1 as well as in other studies: Helbig
47

3 Simulation of electric and electric-acoustic hearing
et al. (2008) found an improvement in correct speech perception score in noise (HochmairSchulz Moser Sentence Test, HSM, at 70dB SPL with 10dB SNR) for EAS condition(84%) compared to CI only condition (55%). Both conditions were tested with the sameears of the subjects: The loudspeaker (commonly called a receiver) of the DUET EASspeech processor was temporarly removed to measure the CI only condition. Adunkaet al. (2010) reported an improvement in the Consonant Nucleus Consonant Word Test(CNC) score from 21% (HA of EAS without CI) to 50% (CI of EAS without HA) to 69%(EAS) correct perception. The speech intelligibility tests used in the preceding studies(HSM and CNC) were not adequate because they were either conducted at a fixed SNRand with the use of reasonable memorizable sentences or they used only word testing.
3.5.2 Simulation with modified fundamental frequency
The results for continuous noise show as well as for modulated noise an improved SRTcaused by the amplitude information of the fundamental frequency compared to the pitchinformation. This effect is observable in both types of noise.
The subjects seems to be more sensitive for measuring tiny changes of information of thespeech signal in Fastl-noise because of obvious differences of median values. The question,if an improved speech perception is caused by frequency or amplitude information of thefundamental frequency could not be finally answered.
A reduction of the “acoustic” part of the EAS-simulation from fLP = 200Hz to thefundamental frequency f0 results in a significant impairment of the SRT in noise. Thisreduction of frequency information in EAS-simulation is comparable to a hearing loss oflow frequency hearing in EAS patients. Thus the residual low frequency hearing shall besaved as much as possible during implantation and afterwards in daily life.
48
4 Modeling of electric andelectric-acoustic hearing
4.1 Summary of chapter 4
The design process of new speech processing strategies which aim to increase the per-formance of cochlear implant systems requires numerous time consuming tests in orderto test a large amount of variable parameters such as e. g. band pass filter frequenciesor acoustic to electric stimulus mapping strategies. These tests involve large numbersof implanted subjects and carefully designed psychoacoustic tests. A model of CochlearImplant (CI) and Electric-Acoustic Stimulation (EAS) speech perception could serve asauthoring tool for developers of speech processing strategies.
In this chapter, a model approach for speech perception in noise by CI and EAS usersis developed. The combination of an Automated Speech Recognition (ASR) system withadaptive Speech Reception Threshold (SRT) measurements enable to predict the recognitionrate of acoustic and electric stimulus conditions. The speech discrimination function ofthe ASR-system was determined in Fastl- and OL-noise. The SRT shows differences of10.9 dB between these conditions. The simulation of Electric-Acoustic Stimulation (EAS)as input to an ASR- system resembles the difference found in the control group as shownin section 1.4.3 with 8.3 dB. An increasing cutoff frequency of the low frequency hearingfrom 0 to 500Hz at a fixed signal-to-noise ratio (SNR) of 0 dB noise condition showed onlyan impact for Fastl-noise. No improvement of the SRT was pointed out in the continuousOL-noise condition for an increasing cutoff frequency. This finding is also in line with theresults of chapter 1, where only a slight improvement of EAS compared to the bilateral CIgroup was measured. Finally, the speech discrimination function was measured for Fastl-and OL-noise with EAS. The different portion of low-pass filtered unprocessed signalserved as parameter. The SRT is remarkably favorable for Fastl- as well as for OL-noiseif the usable low frequency hearing is 300Hz or higher.
The amount of residual low frequency hearing should be preserved as much as possibleduring cochlear implantation to gain the speech perception for implanted users in complexnoise conditions. Modeling speech perception of implanted users is a successful tool toevaluate the quality of new speech processing strategies.
49

4 Modeling of electric and electric-acoustic hearing
4.2 Introduction
There are existing models for different kinds of CI tasks. Svirsky et al. (2011) described amathematical model of medial consonant identification by cochlear implant users. Themultidimensional phoneme identification model is applied to consonant confusion matricesobtained from 28 postlingually deafened cochlear implant users. Sagi et al. (2010) havedescribed a model of phoneme identification with more input filters below 1 kHz toexamine the effect of severely shifted frequency allocation. Speech recognition withprimarily temporal cues was conducted by Shannon et al. (1995). Do et al. (2010)described the speech recognition with cochlear implant-like spectrally reduced speech.All these examinations did not focus on the impact of additional acoustic low frequencyhearing.
This chapter introduces a model which aimes to predict speech perception in quiet andnoisy environment for EAS and CI patients. The amount of low frequency hearing isdefined by cutoff frequency fLP and serves as actuating variable. fLP was varied from 0(CI-simulation) to 500Hz (EAS500-simulation).
4.3 Material and methods
4.3.1 Speech recognition system
ASR assumes that speech is a sequence of symbols, in which the language is encoded. Astream of continuous speech is regarded as stationary for time intervals of about 10ms(Young et al., 2000). An acoustic speech signal is digitized and would be divided into smalltime segments, which are coded to parametrical speech vectors. This abstraction enablesthe implementation of a speech recognition model using discrete statistical systems likeHidden Markov Models (HMMs).
Here, the Hidden Markov Model Toolkit (HTK, University of Cambridge) was usedfor building HMM-based speech processing tools, in particular speech recognizers. Thus,much of the infrastructure support in HTK is dedicated to this task (Young et al., 2000).
Training
First, the HMMs are defined at a prototype tuple. The model must be trained accordingto provided speech data for a given task, here the OLSA. Multiple utterances of the sameMarkov chain are analyzed and coded into observation sequences which area correspondingto the speech vectors. The HTK then maximizes the probability of each coded observation
50

4.3 Material and methods
sequence being generated, hence adjusting that model. The new HMM elements wouldthen be redefined and assigned to a certain phoneme, so that ultimately each of the speechbuilding blocks gets a dedicated model. Given a particular task grammar, the HTK wouldproduce a specialized ASR-system.
This study incorporates most recommended parameters for the training process (Younget al., 2000; Vertanen, 2006), while omitting refinements not applicable for the Germanlanguage. In order to maximize the speech information in the vector abstractions, thecoding of the waveform signals was limited at the upper end to 8 kHz according to theupper cutoff frequency of the DUET speech processor (table 3.1).
The resolution of the filterbanks for coding the waveform data into speech vectors isdistributed according to the mel-scale (Young et al., 2000).
Recognition
After processing the training data and yielding the improved HMMs, the HTK attemptsto uncover the state sequence that optimally fits an unknown observation sequence. Byfinding the HMM with the highest probability, the HTK identifies the best suitablephoneme and translates it back to a symbol. The sequence of symbols is then arrangedinto words according to a phonemic dictionary.
Task Grammar
The Oldenburg Sentence Test (OLSA) is used as a basis for the model and thus defined asthe task grammar for the HTK training process. The HTK provides a simple grammardefinition language to describe the grammatical structure of the sentence test. An excerptis shown here:
$name = BRITTA | DORIS | KERSTIN | NINA | PETER | STEFAN | TANJA | ...$verb = BEKOMMT | GEWANN | GIBT | HAT | KAUFT | MALT | NAHM | ...$numeral = ACHT | ACHTZEHN | DREI | ELF | FUENF | NEUN | SIEBEN | ...$adjective = ALTE | KLEINE | GROSSE | GRUENE | NASSE | ROTE | ...$object = AUTOS | BILDER | BLUMEN | DOSEN | MESSER | RINGE | ...( SENT-START ( $name $verb $numeral $adjective $object ) SENT-END )
This enables the ASR-system to analyze the training and test signals more efficiently.Of course, this dependency is prone to become too complex for wider applications. Thisfactor is not relevant in this work because of the manageable load of sentences. On thecontrary, this specialized implementation helps to focus the study scope by avoidingavoiding disruptive side influences.
51

4 Modeling of electric and electric-acoustic hearing
Dictionary
A phonemic dictionary is required in order to translate the defined task grammar intosymbol sequences which are representing the individual words. A comprehensive dictionaryfor the German language was provided as part of a work concerning Large-VocabularyContinuous Speech Recognition (LVCSR) systems (Weninger et al., 2010). The machine-readable phonetic alphabet SAMPA (Speech Assessment Methods Phonetic Alphabet)was used to transcript the German phonemes (Wells, 2011). The HTK requires a certainformat for the phonemic dictionary to be processed correctly. The abbreviation “sp”stands for a short pause after a previous word. An excerpt is demonstrated according tothe following sample:
ACHT Q a x t spACHTZEHN Q a x t s e: n spALTE Q a l t @ spAUTOS Q aU t o: s spBEKOMMT b @ k O m t spBILDER b I l d 6: spBLUMEN b l u: m @ n spBRITTA b r I t a sp...
As mentioned in section 4.3.1, the training of the HMMs improves the initial modelsusing the provided speech data and corresponding transcriptions by using the task grammarand phonemic dictionary. However, the robustness of the improved HMMs rely mainly onthe phoneme distribution. If a phoneme does not occur often, the corresponding HMMswould be more susceptible to mistakes.
In general, the phoneme distribution should be balanced out. Unfortunately, the OLSAas a training module is fairly uneven in its distribution (see table 4.1). Despite thisdrawback, the OLSA speech data provides a consistent basis for later evaluations and wasthus used in this model.
4.3.2 Speech data
The speech data used to train the model is entirely based on OLSA. The OLSA contains20 lists with 30 OLSA utterances each. This broad spectrum of combinations minimizesstatistical errors that would falsify the results of the evaluation. All the test speech signalsare based on a clean signal group, which consists of standard OLSA utterances for thegiven array of words. The ensemble of all clean OLSA sentences was used for training theASR model with HTK.
52
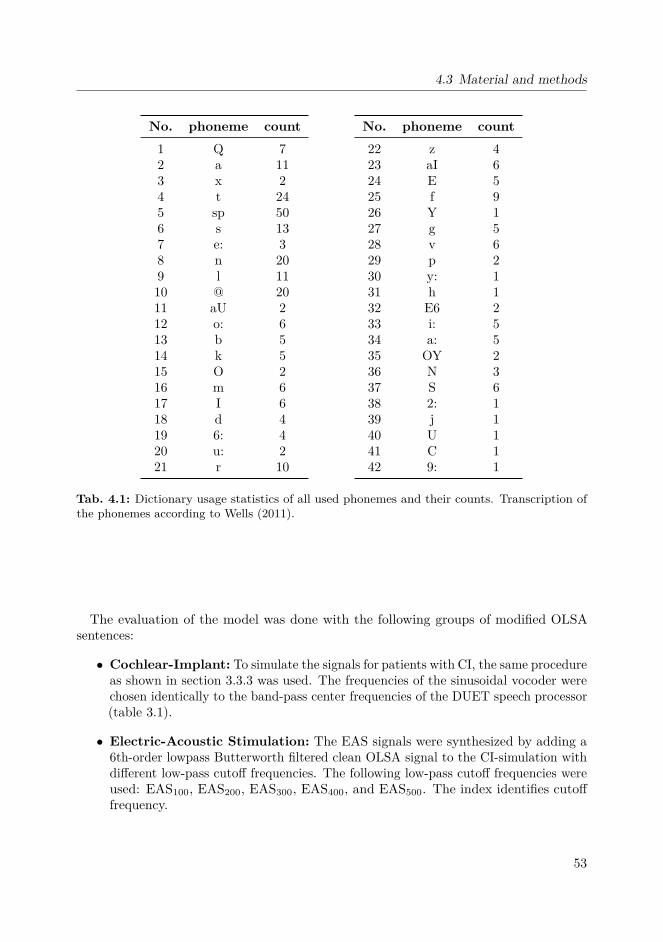
4.3 Material and methods
No. phoneme count1 Q 72 a 113 x 24 t 245 sp 506 s 137 e: 38 n 209 l 1110 @ 2011 aU 212 o: 613 b 514 k 515 O 216 m 617 I 618 d 419 6: 420 u: 221 r 10
No. phoneme count22 z 423 aI 624 E 525 f 926 Y 127 g 528 v 629 p 230 y: 131 h 132 E6 233 i: 534 a: 535 OY 236 N 337 S 638 2: 139 j 140 U 141 C 142 9: 1
Tab. 4.1: Dictionary usage statistics of all used phonemes and their counts. Transcription ofthe phonemes according to Wells (2011).
The evaluation of the model was done with the following groups of modified OLSAsentences:
• Cochlear-Implant: To simulate the signals for patients with CI, the same procedureas shown in section 3.3.3 was used. The frequencies of the sinusoidal vocoder werechosen identically to the band-pass center frequencies of the DUET speech processor(table 3.1).
• Electric-Acoustic Stimulation: The EAS signals were synthesized by adding a6th-order lowpass Butterworth filtered clean OLSA signal to the CI-simulation withdifferent low-pass cutoff frequencies. The following low-pass cutoff frequencies wereused: EAS100, EAS200, EAS300, EAS400, and EAS500. The index identifies cutofffrequency.
53

4 Modeling of electric and electric-acoustic hearing
automated speech recognition
system (HTK)
SRT measurement
(OLSA)
test sentence
(OLSA)
noise
(OL-/Fastl-noise)
CI/EAS-simulation
(optional)
SNR adjustment for testing in noise
noise
speech
Fig. 4.1: Model approach for speech discrimination: Speech data of the OLSA with an optionallyCI/EAS-simulation was feed into the ASR-system. Depending from the correct recognizedwords, an adaptive SNR adjustment was done by increasing or decreasing the noise by means ofmultiplication for the next sentence. This signal was mixed with the speech signal and fed againto the ASR. A stable SRT was achieved after looping this procedure for 20 sentences.
4.3.3 Noise data
The trained ASR model was tested in quiet and in two noise conditions. The noiseconditions are outlined in section 1.3.5. Fastl- and OL-noise were applied.
4.3.4 Model setup
A schematic of the model approach for speech discrimination is shown in figure 4.1 andcan be divided into three logical partitions: First, the test sentences and noises of theOLSA were transformed to a CI/EAS-simulation signal according to section 3.3.3 (stepbypassed for pure acoustic condition). The second step includes the speech recognitionprovided by the ASR. The third step is the adaptive SNR adjustment for the noise signal.
Depending on the number of words correctly perceived by the ASR, the noise wasincreased for three to five and decreased for two or less correct discriminated words. Theinitial step size of this adaptive procedure was set to ±5dB for all/none correct perceivedwords, ±3 dB for 4/1 correct and ±1 dB for 3/2 correct respectively. In the onwardprocedure, the step size lowers adaptively due to achieve the SRT. The speech signal wasconstantly fixed to a defined value.
All tests that were performed with this model were compared to the results of implantedcontrol groups supplied with CI or EAS.
54

4.4 Results
4.4 Results
4.4.1 Speech discrimination function in acoustic condition
The speech discrimination function describes the relationship between the signal-to-noiseratio and the correct speech discrimination. The discrimination function usually resemblesa sigmoid function with the percentage of correct discrimination plotted on the y-axisand the SNR on the x-axis. The SNR value of the sigmoid function with 50%-correctdiscrimination is defined as speech reception threshold (SRT). Figure 4.2 displays thespeech discrimination function of the ASR-system for OL-noise and Fastl-noise withunprocessed speech and noise data. The arrows indicate SRT values. A low (negative)SNR effects in a discrimination around chance level (five words out of 50: 10%. A highpositive SNR effects the opposite: The psychometric function converges to 100% speechperception.
Formula (4.1) and (4.2) specify the linear equation of the linear part from the discrimina-tion function of Fastl- and OL-noise. The gradient of OL-noise results in 8.4% per dB SNRand is slightly steeper than that of Fastl-noise with 6.6% per dB SNR. A steeper gradientof the discrimination function means a more accurate meassurement of the SRT. TheSRT results for OL-noise in 3.4 dB and for Fastl-noise in −7.5 dB. By reason of thespeech modulated Fastl-noise (short temporal gaps), the ASR achieved an improved SRTcompared to OL-noise. The SRTs differ by 10.9 dB between speech modulated Fastl-noiseand continous OL-noise.
0
10
20
30
40
50
60
70
80
90
100
-16 -14 -12 -10 -8 -6 -4 -2 0 2 4 6 8 10 12
signal-to-noise ratio [dB SNR]
pe
rce
nt co
rre
ct
Fastl-noise
OL-noise
slope approx.
Fig. 4.2: Discrimination function for Fastl-noise (circles) and OL-noise (squares) with optimizedspeech recognition system (HTK-Toolkit). The arrows indicate the SRT with a signal-to-noiseratio and 50% correct discrimination, the thin solid lines a slope approximation in the linearpart of the functions.
55

4 Modeling of electric and electric-acoustic hearing
Fastl-noise: y = 0.0656 · x+ 0.9942 (4.1)
OL-noise: y = 0.0842 · x+ 0.2177 (4.2)
4.4.2 Influence of low frequency hearing in various noise conditions
ASR speech recognition rates with signals generated by the CI/EAS model were measuredwithout additional noise and compared to Fastl- and OL-noise with a fixed SNR level of0 dB to demonstrate the influence of additional low frequency hearing. The results areshown in figure 4.3.
CI
simulation
EAS100
EAS200
EAS300
EAS400
EAS500
unprocessed
without noise
Fastl-noise (0 dB SNR)
OL-noise (0 dB SNR)
0
10
20
30
40
50
60
70
80
90
100
pe
rce
nt co
rre
ct
Fig. 4.3: Speech recognition rate obtained in condition “without noise” (triangles), Fastl-noise(circles) and OL-noise (squares) for speech of the Oldenburg Sentence Test with an optimizedspeech recognition system (HTK-Toolkit). Noise conditions were presented at 0 dB SNR. Opensymbols indicate the EAS-simulation containing an additional low-pass filtered original signal(cutoff frequency identified by index), the filled symbols indicate the condition CI (no additionallow frequency information) and “unprocessed” (without simulation).
CI-simulation
In the condition “CI only” in a noisy condition with a fixed level of 0 dB SNR, therecognition rates resulted close to chance level slightly better for Fastl-noise with 16.3%than for OL-noise with 13.5%. In quiet, the recognition rate of CI-simulation was nearlytwice better with 26.3% than measured with OL-noise.
56

4.4 Results
SRT [dB SNR] unprocessed EAS500 EAS400 EAS300 EAS200 EAS100
Fastl-noise -7.5 -3.4 -2.2 1.4 11.9 n/aOL-noise 3.4 6.3 7.2 9.0 16.8 n/a
Tab. 4.2: Speech reception thresholds in Fastl- and OL-noise for unprocessed signal (withoutsimulation) and simulated EAS conditions with differing cutoff frequencies. The EAS100 conditiondid not obtain the 50% correct discrimination.
EAS-simulation with different low-pass frequencies
An additional low-pass filtered original signal (EAS-simulation) added to the processed CI-simulation resulted in an increased recognition rate for higher crossover frequencies. Thiseffect was only visible for the conditions “without noise” and “Fastl-noise”. In the condition“without noise” a recognition rate close to 100% was shown for cutoff frequencies ≥ 300Hz.A crossover frequency of 100Hz showed no increased speech recognition compared to“CI only” condition for Fastl- and OL-noise. The OL-noise masks the speech signal at0 dB SNR quite good, so that an only slightly increased recognition rate (17.2%) overchance level (10%) was shown for a crossover frequency of 500Hz.
The data displayed in figure 4.3 show a remarkable synergetic effect for the EAScondition. An additional low-pass filtered acoustic signal ≤ 100Hz effects only a marginalimprovement of the speech recognition rate in quiet as well as in noise. However, anadditional low-pass signal ≥ 300Hz in Fastl-noise and ≥ 200Hz in quiet results in asignificant improvement of the speech recognition.
4.4.3 Speech discrimination function of electric-acoustic stimulation
The speech discrimination function of the recognizer in Fastl- and OL-noise condition isshown in figure 4.4. The recognition rate was measured in 1dB steps for the whole setof OLSA sentences in a SNR range from −16 to 14dB for Fastl-noise and from −6 to24dB for OL-noise. EAS-simulation was implemented by adding the unprocessed low-passfiltered signal with cutoff frequencies fLP = 100Hz, 200Hz, 300Hz, 400Hz, 500Hz tomodel the impact of different residual low frequency hearing. The SRT values for Fastl-and OL-noise are listed in table 4.2. The EAS-condition EAS100 with a low-pass filterfrequency of fLP = 100Hz did not achieve the 50% value in the measured SNR range, sothat no SRT can be reported.
57
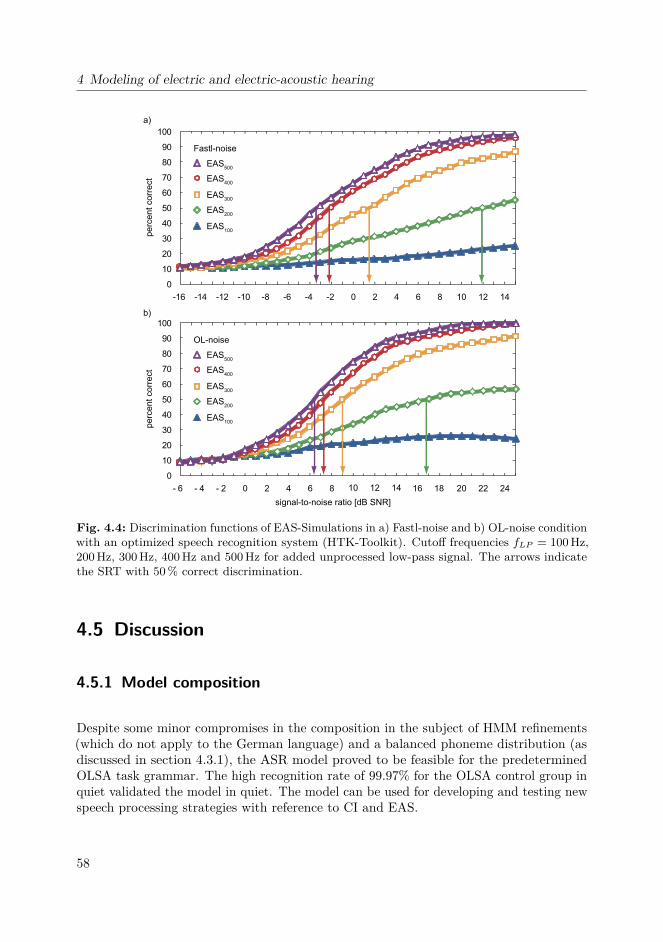
4 Modeling of electric and electric-acoustic hearing
0
10
20
30
40
50
60
70
80
90
100
a)
b)
-16 -14 -12 -10 -8 -6 -4 -2 0 2 4 6 8 10 12 14
pe
rce
nt co
rre
ct
EAS500
EAS400
EAS300
EAS200
EAS100
0
10
20
30
40
50
60
70
80
90
100
- 6 - 4 - 2 0 2 4 6 8 10 12 14 16 18 20 22 24
signal-to-noise ratio [dB SNR]
pe
rce
nt co
rre
ct
EAS500
Fastl-noise
OL-noise
EAS400
EAS300
EAS200
EAS100
Fig. 4.4: Discrimination functions of EAS-Simulations in a) Fastl-noise and b) OL-noise conditionwith an optimized speech recognition system (HTK-Toolkit). Cutoff frequencies fLP = 100Hz,200Hz, 300Hz, 400Hz and 500Hz for added unprocessed low-pass signal. The arrows indicatethe SRT with 50% correct discrimination.
4.5 Discussion
4.5.1 Model composition
Despite some minor compromises in the composition in the subject of HMM refinements(which do not apply to the German language) and a balanced phoneme distribution (asdiscussed in section 4.3.1), the ASR model proved to be feasible for the predeterminedOLSA task grammar. The high recognition rate of 99.97% for the OLSA control group inquiet validated the model in quiet. The model can be used for developing and testing newspeech processing strategies with reference to CI and EAS.
58

4.5 Discussion
4.5.2 Residual hearing
The mel-scale distribution of the filter banks for coding the speech vectors helped toimitate the human speech perception in the ASR model (see section 4.3.1, Training). Bylimiting the frequency band to a range from 0 to 8 kHz, a high-resolution analysis in thelower frequencies was granted.
The synergic effect of EAS for different cutoff frequencies of the low-pass filtering(corresponding to residual hearing by HA) was legibly differentiated. A significant amountof speech information was found to be contained for cutoff frequencies ≥ 300Hz. This resultcould form a guideline for EAS applications concerning their success rates in improvingspeech intelligibility and hence counseling patients for EAS accordingly.
4.5.3 Performance in noise
The human control group with no hearing loss (cf. section 1.4.1) and the ASR modelshow an analogy in terms of discrimination functions respective SRT values for OL- andFastl-noise. For unprocessed data the shifts between the normal hearing control groupand the ASR model were 10.0 dB in OL-noise and 7.4dB in Fastl-noise. A reason for thisshift in SRT could be the missing temporal processing of time structure in the ASR.
The gradient of the speech discrimination function in OL-noise is with 8.4% per dB SNRflatter for the ASR model than for normal hearing subjects with 17.1% per dB SNR(Wagener et al., 1999b). This is explicable with general troubles of ASR systems in noise.
If, however, the assumption that the composition of the OL-noise (spectral optimalmasker, consisting of overlapped OLSA utterances, cf. section 1.3.5) confuses the HMMsis correct, then the test results would be falsified. A better investigation of the OL-noisecomposition in short-time segments (which are relevant to the speech vectors used forbuilding the HMMs) might then be useful.
59

60

5 General Summary
In this work the interrelationship between psychoacoustic perceptions and the amount ofresidual low frequency hearing in implanted Cochlear Implant (CI) patients was examined.After a comprehensive introduction psychoacoustic measurements were conducted andcompared to the results of simulations with normal hearing subjects. Finally a modelapproach was developed.
5.1 Psychoacoustic measurements and model approach
In the first chapter, a Multi-Source Noise Field (MSNF) containing a loudspeaker arraywith four independent noise sources was newly developed and realized to measure implantedCI user. The focus was to establish a realistic acoustic scenery however with use of“technical” noise sources (no speech signal with “informational masking” for interference).The aim was to measure SRTs in almost entirely realistic but strict laboratory conditions.The results demonstrated the strong disruptive effect of amplitude modulated noise onspeech perception in user of cochlear implant systems. The combination of EAS in oneear supported by a hearing aid in the contralateral side (bimodal EAS) provided superiorspeech perception in noise compared to other implanted groups. The SRT of the EAS-group (MSNF, Fastl-noise) showed an improvement of approximately 10dB compared tothe unilateral CI group but still a gap of approximately 10dB to normal hearing listener.Binaural processing between an EAS implant and contralateral acoustic hearing mayaccount for this effect. The MSNF is predestined to measure the different benefit ofvarious implanted groups and finds the way into clinical practice to put up the indicationfor, e. g. bilateral cochlear implantation.
The electric pitch function and the crossover frequency between acoustic and electrichearing respectively was investigated in chapter 2 by means of a bimodal pitch matchingprocedure in EAS users. Since ipsi- and contralateral matches were nearly equal, a severealteration of the basilar membrane excitation pattern in the implanted ear can be ruledout. After the first CI fitting of two EAS subjects and an initial experience of at leastone month, no perceptual pitch adaptation to electric stimulation was observed over aperiod of nine months. The knowledge of the electrically evoked pitch can be used foran enhanced fitting of the speech processor. A possible mismatch between the neuronalstimulated “place” by an electrode (perceived frequency) and the according analyze center
61

5 General Summary
frequency of the speech processor can be located and resolved to achieve a potentiallyimproved speech perception in noise.
The simulation experiments in chapter 3 showed the same disruptive effect of speechmodulated Fastl-noise as showed for implantees in chapter 1. Results of group averagessignified in EAS-simulation a superior SRT compared to CI-simulation concerning speechperception in noise. An expansion of the acoustic low frequency hearing resulted in animproved SRT in noise. The simulation of EAS is used to examine fundamental mechanismof the EAS effect.
A model approach was set up in chapter 4 to estimate the potential speech recognitionrate regarding the usable residual low frequency hearing in patients with EAS. From theresults thus obtained the speech reception model demonstrates the greatest benefit oflow-frequency acoustic stimulation in speech modulated Fastl-noise from a low-pass filterfrequency above 300Hz. The temporal gaps in the speech modulated noise allow the ASRa more favorable speech discrimination compared to continuous speech signal. The ASRmodel was able to restate the synergetic effect of EAS and thus differentiate some of itsconstituting factors, regarding the residual hearing. The tests conducted in noise validatethe proposed ASR model for examining the effects of different parameters in Fastl- orOL-noise. The model will also be used for a systematic analysis of parameter variation inthe speech coding strategies of speech processors.
In the future it might be useful to base a similar model on another task grammar thatis based on a test other than OLSA. One might be able to explore further aspects ina more manifested manner by studying a human control group using separate speechintelligibility testing and comparing it to the results of a similarly composed ASR model.
5.2 Outlook
The focus of the presented study is on establishing the advantages of “soft surgery”techniques for every CI surgical intervention. Nowadays surgeons need to complete aspecialized training in soft surgery to preserve intra cochlear structures like e. g. operatinghair cells in the apical region or the basilar membrane, preserving the normal cochlearnonlinear processing (Gifford et al., 2010) and to prevent fibrosis in the cochlear labyrinth.Figure 5.1 shows a cross-section of human temporal bone with an inserted CI electrodeinside the scala tympani to illustrate the small-sized dimension of a cochlear comparedto a cochlear electrode array. Clearly visible are intracochlear structures in the cochlearturns like the three fluid chambers scala vestibuli, scala media and scala tympani (topdown), the compartment separating Reissner’s membrane (scala vestibuli from the scalamedia) and basilar membrane (scala media from the scala tympani) and the cochlearnerve in the conical shaped central axis (modiolus).
62
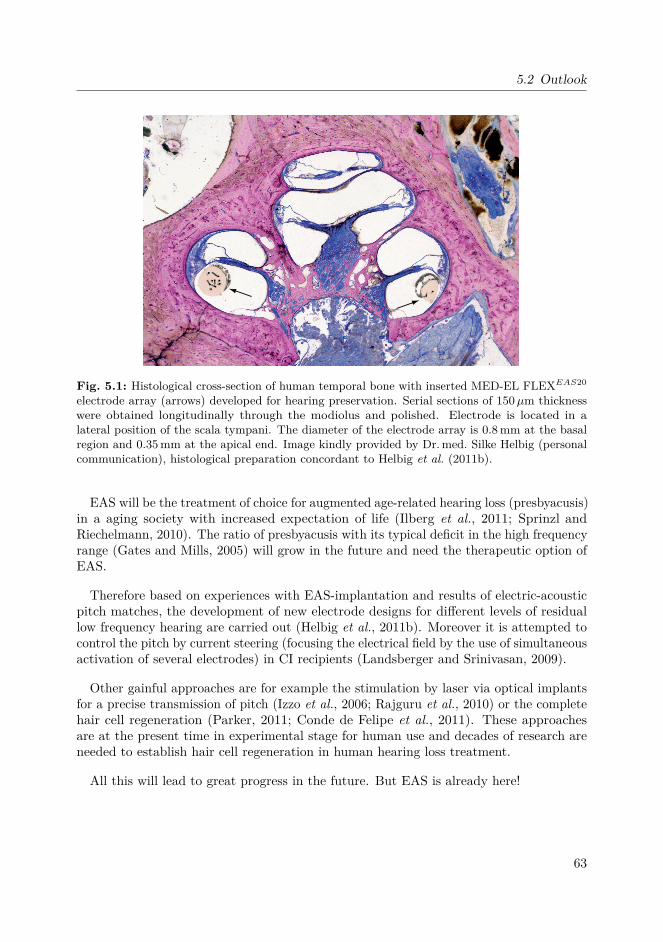
5.2 Outlook
Fig. 5.1: Histological cross-section of human temporal bone with inserted MED-EL FLEXEAS20
electrode array (arrows) developed for hearing preservation. Serial sections of 150µm thicknesswere obtained longitudinally through the modiolus and polished. Electrode is located in alateral position of the scala tympani. The diameter of the electrode array is 0.8mm at the basalregion and 0.35mm at the apical end. Image kindly provided by Dr.med. Silke Helbig (personalcommunication), histological preparation concordant to Helbig et al. (2011b).
EAS will be the treatment of choice for augmented age-related hearing loss (presbyacusis)in a aging society with increased expectation of life (Ilberg et al., 2011; Sprinzl andRiechelmann, 2010). The ratio of presbyacusis with its typical deficit in the high frequencyrange (Gates and Mills, 2005) will grow in the future and need the therapeutic option ofEAS.
Therefore based on experiences with EAS-implantation and results of electric-acousticpitch matches, the development of new electrode designs for different levels of residuallow frequency hearing are carried out (Helbig et al., 2011b). Moreover it is attempted tocontrol the pitch by current steering (focusing the electrical field by the use of simultaneousactivation of several electrodes) in CI recipients (Landsberger and Srinivasan, 2009).
Other gainful approaches are for example the stimulation by laser via optical implantsfor a precise transmission of pitch (Izzo et al., 2006; Rajguru et al., 2010) or the completehair cell regeneration (Parker, 2011; Conde de Felipe et al., 2011). These approachesare at the present time in experimental stage for human use and decades of research areneeded to establish hair cell regeneration in human hearing loss treatment.
All this will lead to great progress in the future. But EAS is already here!
63

64

A Subjects
A.1 Normal hearing subjects
Participants experiment chapter 1: Multi-Source Noise Field
Altogether, 22 native speaking German and normal hearing subjects (11 female, 11 male)with a median age of 24 years (min: 21, max: 36) were included in this experiment. Allshowed an unobtrusive eardrum in the ear inspection through a medical scientist andthe pure tone auditory threshold was lower than 15dB HL in the frequency range from125Hz up to 8 kHz. The difference between auditory threshold to bone conduction waslower than 5 dB HL in the frequency range from 500Hz up to 4 kHz. The tympanometrictesting showed a shift lower than 100 daPa. The medical examination was conducted atthe university hospital Frankfurt, ENT department.
Participants experiment chapter 3: Simulation of CI and EAS
The data set “simulation” of normal hearing subjects in this chapter was collected in threechronologically separated sessions with miscellaneous subject groups. The quantity ofparticipants for each experiment is shown in the figures of the result section (index n).
All subjects whose pure tone audiogram does not exceed 20dB deviance compared tothe standard hearing threshold (Zwicker and Heinz, 1955; DIN EN ISO 7029, 2001) overthe whole frequency range 0-24 Bark refers to normal hearing. This was verified for allindividuals by Békésy tracking with an audiometer implemented by Seeber et al. (2003).All subjects were students of the Institute for Human-Machine Communication and theirage was between 22 and 27 years.
65

A Subjects
A.2 Implanted subjects
Implanted participants experiment chapter 1: Multi-Source Noise Field
unilateral CI 33 f CI deafness <1 >24Cochlear
CI22Mmeningitis
unilateral CI 50 m CI deafness 5 6MedEl
PULSARci100
inherited,
progressive
unilateral CI 66 m CI deafness <1 6MedEl
SONATAti100
hearing loss,
progressive
unilateral CI 53 f CI deafness n.a. >24MedEl
PULSARci100hereditary
unilateral CI 63 f deafness CI n.a. 7Cochlear
CI24RECAprogressive
unilateral CI 34 m CI deafness 1 6MedEl
PULSARci100hearing loss
unilateral CI 50 f deafness CI 5 4MedEl
SONATAti100unknown
unilateral CI 75 f CI deafness 4 6MedEl
SONATAti100progressive
unilateral CI 48 f CI deafness 2 12MedEl
PULSARci100hereditary
unilateral CI 61 f CI deafness <1 7Cochlear
CI24RECA
hearing loss,
progressive
unilateral CI 72 m CI deafness 11 13MedEl
PULSARci100
unknown,
progressive
bimodal CI 68 m HA CI n.a. 12MedEl
PULSARci100progressive
bimodal CI 47 m CI HA 41 12MedEl
PULSARci100infection
bimodal CI 57 m HA CI 8 >24MedEl
C40+meningitis
bimodal CI 42 m CI HA 12 3Cochlear
CI24RECA
hearing loss,
progressive
bimodal CI 15 f CI HA 7 6MedEl
PULSARci100unknown
bimodal CI 33 m CI HA n.a. 7Cochlear
CI24RECAinfection
bimodal CI 38 f CI HA 3 16MedEl
SONATAti100otosclerosis
group age
[years]
sex condition
left ear
condition
right ear
duration of
deafness
[years]
experience
CI
[months]
implant type etiology
Tab. A.1: Subject demographics of unilateral CI and bimodal CI implantees for MSNF experiment.f: female, m: male, CI: Cochlear Implant, HA: Hearing Aid, bimodal CI: CI and HA atcontralateral ear.
66

A.2 Implanted subjects
group age
[years]
sex condition
left ear
condition
right ear
duration of
deafness
[years]
experience
CI
[months]
implant type etiology
EAS 26 f EAS HA 4MED-EL
PULSARci100
unknown,
progressive
EAS 32 f EAS HA 14MED-EL
PULSARci100
EAS 69 f HA EAS 15MED-EL
PULSARci100
EAS 69 m HA EAS 15MED-EL
PULSARci100
EAS 68 m HA EAS >24MED-EL
PULSARci100
EAS 37 m EAS HA 8MED-EL
PULSARci100
EAS 66 f EAS HA 3MED-EL
SONATAti100
progressive,
hearing loss
bilateral CI 42 m CI CI 9 3Advanced Bionics
HiRes90k
progressive,
hearing loss
bilateral CI 52 m CI CI 46 >24MED-EL
PULSARci100ototoxicity
bilateral CI 66 m CI CI 1 13Cochlear
CI24RECAprogressive
bilateral CI 41 f CI CI n.a. >24MED-EL
C40+
progressive,
degenerative
bilateral CI 56 m CI CI 6 >24MED-EL
PULSARci100/C40+hearing loss
bilateral CI 50 f CI CI 1 13Cochlear
CI24RECA
progressive,
hearing loss
bilateral CI 57 f CI CI 10 >24Cochlear
CI24M/CI24RECAhearing loss
bilateral CI 60 f CI CI 1 >24Cochlear
CI24RECAprogressive
bilateral CI 47 f CI CI 14 >24Advanced Bionics
HiRes90kotosclerosis
bilateral CI 47 m CI CI 6 19Cochlear
CI24RECAprogressive
EAS 76 m EAS HA 10MED-EL
SONATAti100progressive
EAS 34 f EAS HA 8MED-EL
SONATAti100
SONATAti100
progressive
EAS 41 m EAS HA 12MED-EL
PULSARci100unknown
EAS 19 f EAS HA >24MED-EL
PULSARci100
progressive,
hearing loss
infection
progressive
progressive
congenital
progressive
EAS 48 f HA EAS 7MED-EL
progressive
Tab. A.2: Subject demographics of EAS and bilateral CI implantees for MSNF experiment. f:female, m: male, CI: Cochlear Implant, EAS: Electric-Acoustic Stimulation, HA: Hearing Aid,bilateral CI: CI at both sides.
67

A Subjects
Implanted participants experiment chapter 3: Simulation of CI and EAS
group age
[years]
sex condition
left ear
condition
right ear
duration of
deafness
[years]
experience
CI
[months]
implant type etiology
EAS 26 f EAS HA 4MED-EL
PULSARci100
unknown,
progressive
EAS 32 f EAS HA 14MED-EL
PULSARci100
EAS 69 f HA EAS 15MED-EL
PULSARci100
EAS 69 m HA EAS 15MED-EL
PULSARci100
EAS 68 m HA EAS >24MED-EL
PULSARci100
EAS 37 m EAS HA 8MED-EL
PULSARci100
EAS 66 f EAS HA 3MED-EL
SONATAti100
progressive,
hearing loss
bilateral CI 42 m CI CI 9 3Advanced Bionics
HiRes90k
progressive,
hearing loss
bilateral CI 52 m CI CI 46 >24MED-EL
PULSARci100ototoxicity
bilateral CI 66 m CI CI 1 13Cochlear
CI24RECAprogressive
bilateral CI 41 f CI CI n.a. >24MED-EL
C40+
progressive,
degenerative
bilateral CI 56 m CI CI 6 >24MED-EL
PULSARci100/C40+hearing loss
bilateral CI 50 f CI CI 1 13Cochlear
CI24RECA
progressive,
hearing loss
bilateral CI 57 f CI CI 10 >24Cochlear
CI24M/CI24RECAhearing loss
bilateral CI 60 f CI CI 1 >24Cochlear
CI24RECAprogressive
bilateral CI 47 f CI CI 14 >24Advanced Bionics
HiRes90kotosclerosis
bilateral CI 47 m CI CI 6 19Cochlear
CI24RECAprogressive
EAS 76 m EAS HA 10MED-EL
SONATAti100progressive
EAS 34 f EAS HA 8MED-EL
SONATAti100progressive
EAS 41 m EAS HA 12MED-EL
PULSARci100unknown
EAS 19 f EAS HA >24MED-EL
PULSARci100
progressive,
hearing loss
infection
progressive
progressive
congenital
progressive
Tab. A.3: Subject demographics of EAS and bilateral CI implantees for simulation CI/EASexperiment. f: female, m: male, CI: Cochlear Implant, EAS: Electric-Acoustic Stimulation, HA:Hearing Aid, bilateral CI: CI at both sides.
68
B. Abbreviations and formula symbols
f0 . . . . . . . . . . . . . . Fundamental Frequency
fLP . . . . . . . . . . . . Cutoff Frequency of Low-Pass Filter
L50 . . . . . . . . . . . . . Speech Reception Threshold of Oldenburg Sentence Test
Leq,A . . . . . . . . . . . A-Weighted Equivalent Continuous Sound Level
Leq,lin . . . . . . . . . . Continuous Sound Level
S0N0 . . . . . . . . . . . Signal and noise are presented from the front (0◦ azimuth)
AD . . . . . . . . . . . . . Analog-to-Digital Converter
ASR . . . . . . . . . . . . Automated Speech Recognition
cf. . . . . . . . . . . . . . . confer [compare to]
CI . . . . . . . . . . . . . . Cochlear Implant
CNC . . . . . . . . . . . Consonant Nucleus Consonant Word Test
DA . . . . . . . . . . . . . Digital-to-Analog Converter
EAS . . . . . . . . . . . . Electric-Acoustic Stimulation
Ffix . . . . . . . . . . . . Fixed Fundamental Frequency
FDA . . . . . . . . . . . U.S. Food and Drug Administration
FMS . . . . . . . . . . . Freiburger Monosyllables Speech Test
FS . . . . . . . . . . . . . . Full Scale
69

B. Abbreviations and formula symbols
FTT . . . . . . . . . . . Fourier-t-Transformation (cf. Terhardt, 1985)
HA . . . . . . . . . . . . . Hearing Aid
HL . . . . . . . . . . . . . Hearing Level
HMM . . . . . . . . . . Hidden Markov Model
HSM . . . . . . . . . . . Hochmair Schulz Moser Sentence Test
HTK . . . . . . . . . . . Hidden Markov Model Toolkit, University of Cambridge
ILD . . . . . . . . . . . . Interaural Level Difference
ITD . . . . . . . . . . . . Interaural Time Difference
Lfix . . . . . . . . . . . . Fixed Level of Fundamental Frequency
LP . . . . . . . . . . . . . Low-Pass Filter
MSNF . . . . . . . . . . Multi-Source Noise Field
OC . . . . . . . . . . . . . Organ of Corti
OLSA . . . . . . . . . . Oldenburger Satztest [Oldenburg Sentence Test]
PTTP . . . . . . . . . . Part-Tone-Time-Pattern
RMS . . . . . . . . . . . Root Mean Square
SAMPA . . . . . . . . Speech Assessment Methods Phonetic Alphabet
SD . . . . . . . . . . . . . Standard Deviation
SG . . . . . . . . . . . . . Spiral Ganglion Neurons
SNR . . . . . . . . . . . . Signal-to-Noise Ratio
sp . . . . . . . . . . . . . . Short Pause
SPL . . . . . . . . . . . . Sound Pressure Level
70

B. Abbreviations and formula symbols
SRT . . . . . . . . . . . . Speech Reception Threshold
T . . . . . . . . . . . . . . . Period of Signal
TRF . . . . . . . . . . . Temporal-Resolution Factor
USB . . . . . . . . . . . . Universal Serial Bus
71

72
Bibliography
Adunka, O., J. Kiefer, M. H. Unkelbach, A. Radeloff, T. Lehnert andW. Gstöttner: Evaluation eines Elektrodendesigns für die kombinierte elektrisch-akustische Stimulation [Evaluation of an electrode design for the combined electric-acoustic stimulation]. Laryngorhinootologie, 83(10):653–658, 2004.
Adunka, O. F., H. C. Pillsbury, M. C. Adunka and C. A. Buchman: Is electricacoustic stimulation better than conventional cochlear implantation for speech perceptionin quiet? Otol Neurotol, 31(7):1049–1054, 2010.
Bahmer, A., O. Peter and U. Baumann: Recording of electrically evoked auditorybrainstem responses (E-ABR) with an integrated stimulus generator in Matlab. Journalof Neuroscience Methods, 173(2):306–314, 2008.
Banfai, P., G. Hortmann, S. Kubik and F. Wustrow: Cochlear Implant mit Multi-elektroden ohne Eröffnung der Innenohrräume [Cochlear implant with multi-electrodeswithout opening the labyrinthine space]. Laryngol Rhinol Otol (Stuttg), 58(6):526–534,1979.
Baumann, U.: Ein Verfahren zur Erkennung und Trennung multipler akustischer Objekte[A procedure for recognition and separation of multiple acoustical objects]. Dissertation,Lehrstuhl für Mensch-Maschine-Kommunikation, Technische Universität München,published by Herbert Utz Verlag München, 1995.
Baumann, U. and S. Helbig: Hören mit kombinierter elektrischer und akustischerStimulation [Hearing with combined electric-acoustic stimulation]. HNO, 57(6):542–550,2009.
Baumann, U. and A. Nobbe: Pitch ranking with deeply inserted electrode arrays. HearRes, 25:275–283, 2004a.
Baumann, U. and A. Nobbe: Pulse rate discrimination with deeply inserted electrodes.Hear Res, 196:49–57, 2004b.
Baumann, U. and A. Nobbe: The cochlear implant electrode-pitch function. Hear Res,213:34–42, 2006.
Boëx, C., L. Baud, G. Cosendai, A. Sigrist, M.-I. Kós and M. Pelizzone: Acousticto electric pitch comparisons in cochlear implant subjects with residual hearing. J AssocRes Otolaryngol, 7(2):110–124, 2006.
73

Bibliography
Brand, T. and B. Kollmeier: Efficient adaptive procedures for threshold and concurrentslope estimates for psychophysics and speech intelligibility tests. JASA, 111(6):2801–2810, 2002.
Brill, S., D. Lawson, R. Wolford, B. Wilson and R. Schatzer. Speech processorsfor auditory prostheses. (Eleventh Quarterly Report on NIH Project N01-DC-8-2105),2001.
Brown, C. A. and S. P. Bacon: Fundamental frequency and speech intelligibility inbackground noise. Hear Res, 266(1-2):52–59, 2010.
Brown, C. A., N. M. Scherrer and S. P. Bacon: Shifting fundamental frequency insimulated electric-acoustic listening. J Acoust Soc Am, 128(3):1272–1279, 2010.
Burian, K.: Klinische Erfahrungen mit der Elektrostimulation des Hörorgans [Clinicalobservations in electric stimulation of the ear]. Arch Otorhinolaryngol, 223(1):139–166,1979.
CCITT. CCITT-noise. Comité Consultatif International Téléphonique et Télégraphique.International Telecommunication Union., 2011. URL www.itu.int.
Chen, F. and P. C. Loizou: Predicting the intelligibility of vocoded speech. Ear Hear,32(3):331–338, 2011.
Clark, Graeme M: The multiple-channel cochlear implant: the interface between soundand the central nervous system for hearing, speech, and language in deaf people-apersonal perspective. Philos Trans R Soc Lond B Biol Sci, 361(1469):791–810, 2006.
Cohen, L. T., J. Xu, S. A. Xu and G. M. Clark: Improved and simplified methodsfor specifying positions of the electrode bands of a cochlear implant array. AmericanJournal of Otology, 17:859–865, 1996.
Conde de Felipe, M. M., A. Feijoo Redondo, J. García-Sancho, T. Schimmangand M. B. Durán Alonso: Cell- and gene-therapy approaches to inner ear repair.Histol Histopathol, 26(7):923–940, 2011.
Cullington, H. E. and F.-G. Zeng: Speech recognition with varying numbers andtypes of competing talkers by normal-hearing, cochlear-implant, and implant simulationsubjects. J Acoust Soc Am, 123(1):450–461, 2008.
DIN EN ISO 7029: Akustik - Statistische Verteilung von Hörschwellen als eine Funktiondes Alters [Acoustics - Statistical distribution of hearing thresholds as a function of age].Deutsche Norm, 2001.
Djourno, A., C. Eyries and B. Vallancien: De l’excitation electrique du nerfcochleaire chez l’homme, par induction a distance, a l’aide d’un micro-bobinage inclus ademeure. [Electric excitation of the cochlear nerve in man by induction at a distancewith the aid of micro-coil included in the fixture]. C R Soc Biol (Paris), 151:423–425,1957.
74

Bibliography
Do, C.-T., D. Pastor and A. Goalic: On the Recognition of Cochlear Implant-LikeSpectrally Reduced Speech With MFCC and HMM-Based ASR. IEEE Transactions onAudio, Speech, and Language Processing, 18(5):1065–1068, 2010.
Dorman, M. F., R. H. Gifford, A. J. Spahr and S. A. McKarns: The benefitsof combining acoustic and electric stimulation for the recognition of speech, voice andmelodies. Audiol Neurootol, 13(2):105–112, 2008.
Dorman, M. F., P. C. Loizou and D. Rainey: Simulating the effect of cochlear-implantelectrode insertion depth on speech understanding. J Acoust Soc Am, 102(5):2993–2996,1997.
Dorman, M. F., T. Spahr, R. Gifford, L. Loiselle, S. McKarns, T. Holden,M. Skinner and C. Finley: An electric frequency-to-place map for a cochlear implantpatient with hearing in the nonimplanted ear. J Assoc Res Otolaryngol, 8:234–240,2007.
Fastl, H.: Schwankungsstärke und zeitliche Hüllkurve von Sprache und Musik [Fluctuationstrength and time-domain envelope of speech and music]. In: Fortschritte der Akustik -DAGA ’84, DEGA e.V., DPG-GmbH, Bad Honnef, Oldenburg, S. 739–742, 1984.
Fastl, H.: A background noise for speech audiometry. Audiol. Acoustics, 26:2–13, 1987.URL http://www.mmk.ei.tum.de/~tal/demos/noise.html.
Fastl, H., H. Oberdanner, W. Schmidt, I. Stemplinger, I. Hochmair-Desoyerand E. Hochmair: Zum Sprachverständnis von Cochlea-Implantat-Patienten bei Störg-eräuschen [Contribution to speech perception of cochlea implant patients in noise]. In:Sill, A. (Editor): Fortschritte der Akustik - DAGA ’98, DEGA e.V., Oldenburg, S.358–359, 1998.
Fastl, H. and E. Zwicker: Psychoacoustics. Facts and Models. 3rd Edition. SpringerVerlag Berlin, Heidelberg, 2007.
Faulkner, A, S. Rosen and D. Stanton: Simulations of tonotopically mapped speechprocessors for cochlear implant electrodes varying in insertion depth. J Acoust Soc Am,113(2):1073–1080, 2003.
Gantz, B. J. and C. Turner: Combining acoustic and electrical speech processing:Iowa/Nucleus hybrid implant. Acta Otolaryngol, 124(4):344–347, 2004.
Gates, G. A. and J. H. Mills: Presbycusis. Lancet, 366(9491):1111–1120, 2005.
Gifford, R. H., M. F. Dorman and Brown Ch. A.: Psychophysical properties oflow-frequency hearing: implications for perceiving speech and music via electric andacoustic stimulation. Adv Otorhinolaryngol, 67:51–60, 2010.
Gstoettner, W., S. Helbig, C. Settevendemie, U. Baumann, J. Wagenblastand C. Arnoldner: A new electrode for residual hearing preservation in cochlearimplantation: first clinical results. Acta Otolaryngol, 129(4):372–379, 2009.
75

Bibliography
Gstoettner, W. K., S. Helbig, N. Maier, J. Kiefer, A. Radeloff and O.F.Adunka: Ipsilateral electric acoustic stimulation of the auditory system: results oflong-term hearing preservation. Audiol Neurootol, 11 Suppl 1:49–56, 2006.
Hagerman, B.: Sentences for testing speech intelligibility in noise. Scand Audiol, 11(2):79–87, 1982.
Heinbach, W.: Aurally adequate signal representation: The Part-Tone-Time-Pattern.Acustica, 67:113–121, 1988.
Helbig, S. and U. Baumann: Acceptance and fitting of the DUET device - a combinedspeech processor for electric acoustic stimulation. Adv Otorhinolaryngol, 67:81–87,2010.
Helbig, S., U. Baumann, M. Helbig, N. von Malsen-Waldkirch and W. Gstöt-tner: A new combined speech processor for electric and acoustic stimulation–eightmonths experience. ORL J Otorhinolaryngol Relat Spec, 70(6):359–365, 2008.
Helbig, S., U. Baumann, C. Hey and M. Helbig: Hearing preservation after completecochlear coverage in cochlear implantation with the free-fitting FLEXSOFT electrodecarrier. Otol Neurotol, 32(6):973–979, 2011a.
Helbig, S., C. Settevendemie, M. Mack, U. Baumann, M. Helbig and T. Stöver:Evaluation of an Electrode Prototype for Atraumatic Cochlear Implantation in HearingPreservation Candidates: Preliminary Results From a Temporal Bone Study. OtolNeurotol, 32(3):419–423, 2011b.
Hochmair, I., W. Arnold, P. Nopp, C. Jolly, J. Müller and P. Roland: Deep elec-trode insertion in cochlear implants: apical morphology, electrodes and speech perceptionresults. Acta Otolaryngol, 123(5):612–617, 2003.
House, W. F.: Cochlear implants. Ann Otol Rhinol Laryngol, 85 suppl 27(3Pt2):1–93,1976.
Ilberg, C. von, U. Baumann, J. Kiefer, J. Tillein and O. F. Adunka: Electric-acoustic stimulation of the auditory system: a review of the first decade. AudiolNeurootol, 16 Suppl 2:1–30, 2011.
Ilberg, C. von, J. Kiefer, J. Tillein, T. Pfenningdorff, R. Hartmann,E. Sturzebecher and R. Klinke: Electric-acoustic stimulation of the auditory system- New technology for severe hearing loss. Orl-Journal for Oto-Rhino-Laryngology andIts Related Specialties, 61:334–340, 1999.
Izzo, A. D., C.-P. Richter, E. D. Jansen and J. T. Walsh: Laser stimulation ofthe auditory nerve. Lasers Surg Med, 38(8):745–753, 2006.
Kiefer, J., F. Böhnke, O. Adunka and W. Arnold: Representation of acousticsignals in the human cochlea in presence of a cochlear implant electrode. Hear Res, 221(1-2):36–43, 2006.
76

Bibliography
Kiefer, J., M. Pok, O. Adunka, E. Stürzebecher, W. Baumgartner, M. Schmidt,J. Tillein, Q. Ye and W. Gstöttner: Combined Electric and Acoustic Stimulationof the Auditory System: Results of a Clinical Study. Audiol Neurotol, 10(3):134–144,2005.
Kiefer, J., J. Tillein, C. von Illberg, T. Pfennigdorff, E. Stürzebecher,R. Klinke and W. Gstöttner: Fundamental aspects and first clinical results of theclinical application of combined electric and acoustic stimulation of the auditory system.In: Kubo T, Iwaki T, Takagashi Y (eds) Advances in Cochlear implants - Un Update.The Hague, Kugler Publications, S. 569–576, 2002.
Kollmeier, B. and M. Wesselkamp: Development and evaluation of a Germansentence test for objective and subjective speech intelligibility assessment. J Acoust SocAm, 102(4):2412–2421, 1997.
Kong, Y.-Y. and R. P. Carlyon: Improved speech recognition in noise in simulatedbinaurally combined acoustic and electric stimulation. J Acoust Soc Am, 121(6):3717–3727, 2007.
Landsberger, D. M. and A. G. Srinivasan: Virtual channel discrimination isimproved by current focusing in cochlear implant recipients. Hear Res, 254(1-2):34–41,2009.
Lenarz, T., T. Stöver, A. Buechner, A. Lesinski-Schiedat, J. Patrick andJ. Pesch: Hearing conservation surgery using the Hybrid-L electrode. Results from thefirst clinical trial at the Medical University of Hannover. Audiol Neurootol, 14 Suppl 1:22–31, 2009.
Li, N. and P. C. Loizou: A glimpsing account for the benefit of simulated combinedacoustic and electric hearing. J Acoust Soc Am, 123(4):2287–2294, 2008.
McDermott, H., C. Sucher and A. Simpson: Electro-Acoustic Stimulation Acousticand Electric Pitch Comparisons. Audiol Neurootol, 14:2–7, 2009.
Møller, A. R.: History of cochlear implants and auditory brainstem implants. AdvOtorhinolaryngol, 64:1–10, 2006.
Moore, B. C. J.: Dead regions in the cochlea: Conceptual foundations, diagnosis, andclinical applications. Ear Hear, 25:98–116, 2004.
Müller-Deile, J.: Sprachverständlichkeitsuntersuchungen bei Kochleaimplantatpatienten[Speech intelligibility tests in cochlear implant patients]. HNO, 57(6):580–592, 2009.
Naumann, H. H., E. Zwicker, H. Scherer, J. Seifert, H. Leysieffer and M. Zoll-ner: Erfahrungen mit der Implantation einer Mehrkanalelektrode in den Nervus acus-ticus [Experiences with the implantation of a multichannel electrode in the acousticnerve]. Laryngol Rhinol Otol (Stuttg), 65(3):118–122, 1986.
77

Bibliography
Parker, M. A.: Biotechnology in the Treatment of Sensorineural Hearing Loss: Foun-dations and Future of Hair Cell Regeneration. J Speech Lang Hear Res, in press,2011.
Rader, T. and U. Baumann: Untersuchungen zum Oldenburger Satztest im Bezug aufLerneffekt und Antwortmodus [Studies to Oldenburg sentence test with regard to learingeffect and answering mode]. In: Tagungsband der 12. Jahrestagung der DeutschenGesellschaft für Audiologie. Deutsche Gesellschaft für Audiologie e.V., Innsbruck, 2009.
Rader, T., C. Schmiegelow, U. Baumann and H. Fastl: Oldenburger Satztest im"Multi-Source Noise Field" mit unterschiedlichen Modulationscharakteristika [Oldenburgsentence test in the "Multi-Source Noise Field" with various modulation charcteristics].In: Jekosch, U. and R. Hoffmann (Editor): Tagungsband Fortschritte der Akustik -DAGA 2008, Dresden, S. 663–664, 2008.
Rajguru, S. M., A Izzo-Matic, A. M. Robinson, A. J. Fishman, L. E. Moreno,A. Bradley, I. Vujanovic, J. Breen, J. D. Wells, M. Bendett and C.-P. Richter: Optical cochlear implants: evaluation of surgical approach and laserparameters in cats. Hear Res, 269(1-2):102–111, 2010.
Reiss, L. A. J., B. J. Gantz and C. W. Turner: Cochlear implant speech processorfrequency allocations may influence pitch perception. Otol Neurotol, 29(2):160–167,2008.
Reiss, L. A. J., C. W. Turner, S. R. Erenberg and B. J. Gantz: Changes inpitch with a cochlear implant over time. J Assoc Res Otolaryngol, 8(2):241–257, 2007.
Ritter, J. W.: Versuche und Bemerkungen über den Galvanismus der VoltaischenBatterie [Experiments and remarks on the galvanism of the voltaic battery]. Annalender Physik, 7(4):431–484, 1801.
Sagi, E., Q.-J. Fu, J. J. Galvin and M. A. Svirsky: A model of incompleteadaptation to a severely shifted frequency-to-electrode mapping by cochlear implant users.J Assoc Res Otolaryngol, 11(1):69–78, 2010.
Seeber, B., Fastl H. and V. Koci: Ein PC-basiertes Bekesy-Audiometer mit Bark-Skalierung [PC based Bekesy-audiometer with Bark scaling]. In: Fortschritte der Akustik- DAGA 2003. Deutsche Gesellschaft für Akustik e.V., Berlin. Deutsche Gesellschaftfür Akustik e.V. Oldenburg, S. 614–615, 2003.
Seeber, B. U., U. Baumann and H. Fastl: Localization ability with bimodal hearingaids and bilateral cochlear implants. J Acoust Soc Am, 116(3):1698–1709, 2004.
Seeber, B. U. and H. Fastl: Localization cues with bilateral cochlear implants. JAcoust Soc Am, 123(2):1030–1042, 2008.
Shannon, R. V., F. G. Zeng, V. Kamath, J. Wygonski and M. Ekelid: Speechrecognition with primarily temporal cues. SCIENCE, 270(5234):303–304, 1995.
78
Bibliography
Skarzynski, H. and R. Podskarbi-Fayette: A new cochlear implant electrode designfor preservation of residual hearing: a temporal bone study. Acta Otolaryngol, 130(4):435–442, 2010.
Souza, P., K. Arehart, C. W. Miller and R. K. Muralimanohar: Effects of ageon F0 discrimination and intonation perception in simulated electric and electroacoustichearing. Ear Hear, 32(1):75–83, 2011.
Spoendlin, H. and A. Schrott: Analysis of the human auditory nerve. Hear Res, 43:25–38, 1989.
Sprinzl, G. M. and H. Riechelmann: Current trends in treating hearing loss in elderlypeople: a review of the technology and treatment options - a mini-review. Gerontology,56(3):351–358, 2010.
Stakhovskaya, O., D. Sridhar, B. H. Bonham and P. A. Leake: Frequency mapfor the human cochlear spiral ganglion: implications for cochlear implants. J Assoc ResOtolaryngol, 8(2):220–233, 2007.
Stickney, G. S., P. F. Assmann, J. Chang and F.-G. Zeng: Effects of cochlear im-plant processing and fundamental frequency on the intelligibility of competing sentences.J Acoust Soc Am, 122(2):1069–1078, 2007.
Svirsky, M. A., E. Sagi, T. A. Meyer, A. R. Kaiser and S. W. Teoh: Amathematical model of medial consonant identification by cochlear implant users. JAcoust Soc Am, 129(4):2191–2200, 2011.
Talbot, K. N. and D. E. H. Hartley: Combined electro-acoustic stimulation: abeneficial union? Clinical Otolaryngology, 33(6):536–545, 2008.
Terhardt, E.: Fourier transformation of time signals: Conceptual revision. Acustica,57:242–256, 1985.
Turner, C. W., B. J. Gantz, S. Karsten, J. Fowler and L. A. Reiss: Impact ofhair cell preservation in cochlear implantation: combined electric and acoustic hearing.Otol Neurotol, 31(8):1227–1232, 2010.
Vermeire, K., I. Anderson, M. Flynn and P. van de Heyning: The Influence ofDifferent Speech Processor and Hearing Aid Settings on Speech Perception Outcomes inElectric Acoustic Stimulation Patients. Ear Hear, 29:76–86, 2008a.
Vermeire, K., A. Nobbe, P. Schleich, P. Nopp, M. H. Voormolen and P. H.Van de Heyning: Neural tonotopy in cochlear implants: an evaluation in unilateralcochlear implant patients with unilateral deafness and tinnitus. Hear Res, 245(1-2):98–106, 2008b.
Vertanen, K.: Baseline WSJ Acoustic Models for HTK and Sphinx: Training Recipesand Recognition Experiments. Cavendish Laboratory, University of Cambridge, 2006.
79

Bibliography
Vollmer, M., R. Hartmann and J. Tillein: Neuronal responses in cat inferiorcolliculus to combined electric acoustic stimulation., S. 61–69. Number 67. AdvOtorhinolaryngol, cochlear implants and hearing preservation Edition, 2010.
Volta, A.: On the electricity excited by mere contact of conducting substances of differentkinds. Trans Roy Soc Phil, 90:403–431, 1800.
Wagener, C. and T. Brand: Sentence intelligibility in noise for listeners with normalhearing and hearing impairment: influence of measurement procedure and maskingparameters. Int J Audiol, 44(3):144–156, 2005.
Wagener, K., T. Brand and B. Kollmeier: Entwicklung und Evaluation einesSatztests in deutscher Sprache II: Optimierung des Oldenburger Satztests [Developmentand evaluation of a German sentence test II: Optimization of the Oldenburg sentencetest]. Z Audiol, 38(2):44–56, 1999a.
Wagener, K., T. Brand and B. Kollmeier: Entwicklung und Evaluation einesSatztests in deutscher Sprache III: Evaluation des Oldenburger Satztests [Developmentand evaluation of a German sentence test III: Evaluation of the Oldenburg sentencetest]. Z Audiol, 38(3):86–95, 1999b.
Wagener, K., V. Kühnel and B. Kollmeier: Entwicklung und Evaluation einesSatztests in deutscher Sprache I: Design des Oldenburger Satztests [Development andevaluation of a German sentence test I: Design of the Oldenburg sentence test]. ZAudiol, 38(1):4–15, 1999c.
Wagener, K. C., T. Brand and B. Kollmeier: The role of silent intervals for sentenceintelligibility in fluctuating noise in hearing-impaired listeners. Int J Audiol, 45(1):26–33, 2006.
Wells, C. J. SAMPA computer readable phonetic alphabet., 2011. URL www.phon.ucl.ac.uk/home/sampa.
Weninger, F., B. Schuller, F. Eyben, M. Wöllmer and G. Rigoll: A BroadcastNews Corpus for Evaluation and Tuning of German LVCSR Systems. Unpublished.2010.
Wilson, B., R. Wolford and et al. Lawson, D. Speech processors for auditoryprostheses. (Third quarterly Progress Report in NIH Project N01-DC-2-1002), 2002.
Wilson, B. S. and M. F. Dorman: Cochlear implants: a remarkable past and abrilliant future. Hear Res, 242(1-2):3–21, 2008.
Xu, J., S. A. Xu, L. T. Cohen and G. M. Clark: Cochlear view: postoperativeradiography for cochlear implantation. Am J Otol, 21(1):49–56, 2000.
Young, S., G. Evermann, M. Gales, T. Hain, D. Kershaw, X. Liu, G. Moore,J. Odell, D. Ollason, D. Povey, V. Valtchev and P. Woodland: The HTKBook (for HTK Version 3.4). Cambridge, U.K.: Cambridge Univ. Eng. Dept., 2000.
80
Bibliography
Zhang, T., A. Spahr and M. F. Dorman: Frequency overlap between electric andacoustic stimulation and speech-perception benefit in patients with combined electric andacoustic stimulation. Ear Hear, 31:195–201, 2010.
Zollner, M.: Verständlichkeit der Sprache eines einfachen Vocoders [Intelligibility ofthe speech of a simple vocoder]. Acustica, 43(4):271–272, 1979.
Zwicker, E. and W. Heinz: Zur Häufigkeitsverteilung der menschlichen Hörschwelle[Contribution to the distribution of the human hearing threshold]. Acustica, 5:75–80,1955.
Zwicker, E., H. Leysieffer and K. Dinter: Ein Implantat zur Reizung des Nervusacusticus mit zwölf Kanälen [An implant for stimulation of the acoustic nerve with 12channels]. Laryngol Rhinol Otol (Stuttg), 65(3):109–113, 1986a.
Zwicker, E., H. Scherer, H. Leysieffer and K. Dinter: Elektrische Reizung einessensiblen Nerven mit 70-Mikrometer-Elektroden [Electric stimulation of a sensory nervewith 70-micrometer electrodes]. Laryngol Rhinol Otol (Stuttg), 65(3):105–108, 1986b.
81

82

Electric-Acoustic Stimulation (EAS) means the stimulation of the hearing nerve with an inner ear hearing prosthesis by electrical pulses to compensate high frequency deafness, and in parallel using the low frequency residual hearing by a hearing aid at the same ear. The “Multi-Source Noise Field” is developed and realized as examinati-on environment for the subsequent realistic measurement of speech perception levels in various noisy situations. The transition frequency from acoustic to electric stimulation is determined by psycho-acoustic pitch comparison tests. The results of measurements from patients with inner ear hearing prosthesis have been reprodu-ced by simulations with normal hearing persons and described by a model.
Tobias Rader, born 1978 and raised in Munich, Germany, graduated in 1998 from academic high school. During his alternate civilian service at the ENT-Department at the University Hospital of Munich he experienced the treat-ment of hearing impaired people for the first time.
In 1999 he started to study Electrical Engineering and Infor-mation Technology at the Technische Universität München. He graduated the bachelor's degree with a thesis under guidance of Prof. Hugo Fastl about the psycho-acoustical perception of the different tunings of a Welte-Mignon reproducing grand piano. He finalized his graduate engi-
neer in 2004 in Japan at the Osaka University with his diploma thesis titled "Cross-Cultural Effects in Audio-Visual Interactions" under the supervision of Prof. Sonoko Kuwano.
After graduation in November 2004, he started working for the vestibular research and cochlear-implant team at the ENT-Department of the University Hospital of Munich under the leadership of PD Dr. Eike Krause, Prof. Karin Schorn and Prof. Uwe Baumann. In 2007 he followed Prof. Uwe Baumann to the department of Audiologi-cal Acoustics at the ENT-Department of the Goethe-University of Frankfurt as clinical and research assistant and started his doctoral thesis in cooperation with Prof. Hugo Fastl at the Institute for Human-Machine Communication, Technische Universität München. His doctoral thesis was accepted in February 2012.
Related Documents