Spectrum Management: Strategic Planning and Policies for Wireless Innovation Presenter : Eng. Tamer Sayed Place: Algeria Date: 1-5 Dec. 2019 Spectrum forecasting of future use methods and techniques 1

Welcome message from author
This document is posted to help you gain knowledge. Please leave a comment to let me know what you think about it! Share it to your friends and learn new things together.
Transcript

Spectrum Management: Strategic Planning and Policies for Wireless Innovation
Presenter : Eng. Tamer Sayed
Place: Algeria
Date: 1-5 Dec. 2019
Spectrum forecasting of future use methods and techniques
1

Module Objectives
• The aim of this session is to know how to develop demand forecasts process for spectrum? and what is the demand drivers?
• Explain that using two examples: cellular and fixed links.
2

Module Topics
• Qualitative and Quantitative Forecasts
• Assumptions and Data Requirements
• Spectrum Demand Drivers
• Cellular Demand
• Fixed Demand
• Spectrum Valuation
3

Demand for ServicesActive mobile broadband subscriptions per 100 inhabitants, 2001-2013
Source: ITU World Telecommunication /ICT Indicators database 4

• The principal objective of a demand study is to develop a forecast of the future demand for radio spectrum with some or all of the forecasts incorporated into the Spectrum Master Plan and in specific band plans where the goal is to ensure there is sufficient spectrum available to meet demand;
• Demand forecasts are usually developed for several timeframes: short-range (2-3 years), medium range (4-7 years) and long range (8 to 20 years) with particular focus on short range requirements.
Demand Forecast Objectives
5
Scope and Focus
• Scope
– It is typical when designing the terms of reference for the forecast exercise to establish a scope limitation or range of frequencies on to be examine studied. For example – frequencies and services falling below range 15GHz on the assumption there is little scarcity or unmet demand for spectrum above the range.
• Focus
– Furthermore, the scope could be narrowed to forecasts focussing generally upon commercial services and specific government used priority bands such as aeronautical, public safety, emergency services, etc.
– In doing so it will be important to take into account economic trends, emerging technologies, and government strategies (for example - resource development: oil and gas, mining, forestry, transportation, community infrastructure). As done in adopting WRC Agenda Items 6

Approach using Quantitative and Qualitative Analysis
• For most commercial services the linkage between infrastructure, technology, traffic growth, and spectrum demand is reasonably well understood and has been modelled.
• Non-commercial services are more difficult and lend themselves to qualitative analysis.
– To help reduce uncertainty several growth scenarios can be developed: low, expected, hyper-growth for example.
• Other services such as mobile radio, aeronautical and maritime, and public safety are not readily forecast able given usually to a lack of reliable data. For these services, forecasts are typically based on qualitative analysis using ITU documents and references, WRC planning efforts, planning activities completed by other regulators.
7

Caveat on Assumptions
• As with any forecast of demand or spectrum use assumptions will be made concerning the timing and capabilities of future technology developments:– availability, cost, and life cycle.
• Where the analysis makes necessary assumptions about future technologies and market developments, it needs to be understood that assumptions have been made to provide a tangible basis for the development of such forecasts; the use of any particular assumption should not be taken to imply that an alternative development is not equally likely.
8

General Caution
• Forecasting end user demand is neither easy nor trivial.
• This explains is why initial forecasts of end-user demand especially for new services are often quite far off the mark and have to be repeated.
• Demand analysis is iterative, repeated and is only as good as the starting point.
9
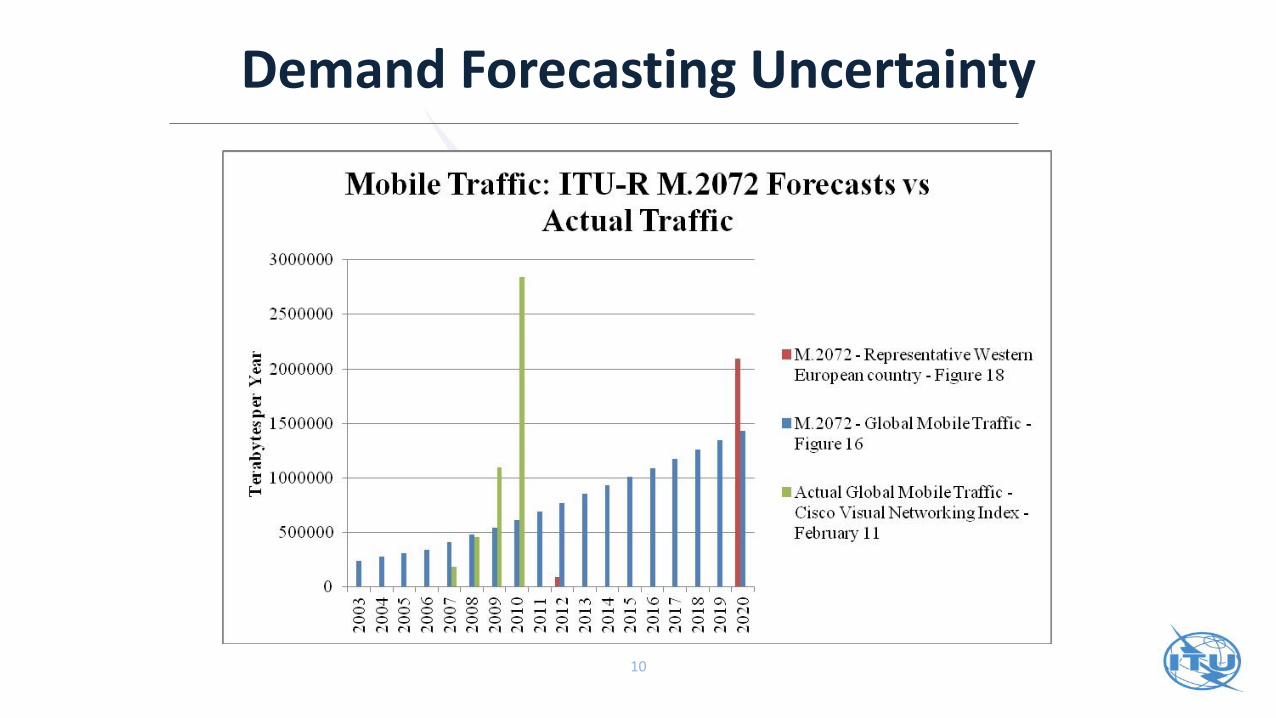
Demand Forecasting Uncertainty
10

Data Requirements
• One of the first steps, if not the first step, involves establishing an estimate of the current utilisation using information on assignments and utilization from the NRA spectrum licence database.– reasoned assumptions are made where data is not readily available
and reliable.
– Alternative sources should also be considered.
• Calculating the current utilisation is a non-trivial task because of re-use, geography and differences between urban and rural centres.
11

Spectrum Demand – Many sources and devices
• The forecasts of the worldwide Wireless LAN (Wi-Fi) device market for the 2012-20 period are soaring. The 802.11ac segment is expected to grow
significantly across a wide range of device types and technologies.
• Devices include:– Automotive devices (in-vehicle infotainment devices)
– Cellular devices (basic and feature phones, smartphones, mobile hotspots)
– Computing devices (desktops, mini-notes, notebooks, tablets)
– Networking devices (broadband routers, residential gateways, wireless access points, FTTH residential gateways, network attached storage )
– Peripheral devices (multifunction peripherals, ink jet printers, laser printers, USB adapters)
– Portable Consumer Electronics devices (digital still cameras, E-readers, portable media players [PMPs], personal navigation devices [PNDs], handheld game consoles)
– Stationary Consumer Electronics devices (Blu-ray players, digital photo frames, digital televisions, cable set top boxes, IP/DSL set top boxes, satellite set top boxes, standalone PVRs, terrestrial set top boxes, video game consoles)
12
Spectrum Drivers - Services
• Aeronautical and Maritime Services - Communications, Navigational Aids and Surveillance
• Amateur Radio – no changes
• Broadcast – Radio (35 MHz) and TV (350) MHz. DSO initially and as cable access increases need for terrestrial broadcast may subside
• Cellular – immediate and medium term requirements likely satisfied except for competition related issues
13

Spectrum Drivers - Services
• Land and Public Mobile: NTIA forecasts 200 MHz additional spectrum.
• Fixed Links – cellular operators and utilities
• Fixed Wireless Access – demand for internet and data.
• Satellite: big user below 30GHz – mobile, broadcast, fixed services
• Science
• Radio Determination Services – increased resolution of metrological, climatologically and space detections
14

Methodology
• Spectrum Drivers• Two types of forecast models – qualitative and quantitative• Quantitative Forecast Models
– Cellular– Fixed Links
• Other Forecast Models include:– Broadband Wireless– Broadcast– Satellite– Other Services
15
• Macro-economic drivers
– International Markets and Globalization – the need to be competitive
– Government use – Security, Military
– International developments – ITU, ICAO, IMO and ETSI
– Frequency dependent propagation characteristics
– Competition in radio services.
Spectrum Drivers
16

Spectrum Drivers - Macro-economic drivers
17
Economic value of the selected applications in the EU at 2012 prices

Spectrum Drivers - Services
• Aeronautical and Maritime Services - Communications, Navigational Aids and Surveillance
• Amateur Radio – no changes
• Broadcast – Radio (35 MHz) and TV (350) Mhz. DSO initially and as cable access increases need for terrestrial broadcast may subside
• Cellular – immediate and medium term requirements likely satisfied except for competition related issues
18
Cellular Demand
• The starting point for all spectrum considerations concerning IMT are the market expectations for wireless communications services
• Two scenarios with assumptions: a low traffic and high traffic scenario that is dominated by data. – This latter scenario is the situation currently underway in more
advanced economies.
• Compare forecast results with current studies on mobile penetration and traffic growth published by organization such as GSMA and 3GPP.
19

Factors Affecting Cellular Demand
• Conducts reviews secondary research and include summaries of main factors driving demand in in the short, medium and long range. These will likely be:– Traffic volume growth will be very high. Probably in excess of a
factor of 20.
– Mobile data traffic will comprise the majority, followed by machine to machine traffic, and then voice.
– The Internet/extranet will be the main driver of growth in the volume of traffic.
– Voice will still be a main service for most people
20
Methodology
• The analysis of future spectrum demand forecasts for cellular services should be undertaken at a high-level and as a result several simplifying assumptions are likely to be made. These include:
– 2G spectrum is reused for 3G and other technologies at some point over the time period ending 2019;
– existing 2G networks are not likely to be decommissioned until much later as with the experience in Europe and North America once a new system beyond IMT-2000 is deployed.
21

Cellular Demand Methodology
22
Source: Spectrum demand for non-government services 2005–2025, Mason Analysys

Predicted Results
• We should see demand for spectrum drop during the initial stages of 3G take-up. Spectrum demand beyond the take-up stage will be governed by prices and availability.
• As newer services are introduced such as 4G in the 2014-2016 timeframe spectrum demand will increase first in urban and rural areas.
23

Cellular Demand Forecast Results
[1] Includes uplink and downlink
24
Fixed Links Demand
• Terrestrial fixed-link services are used for a variety of purposes such as long-haul telecommunications trunked traffic and backhaul. Hence, the major users of fixed-links are the national fixed telecoms operator(s) and the cellular operators.
• Determining whether government users are major users of fixed-links. The strongest growth in demand for fixed-links in recent years has been driven by the cellular operators, which have made extensive use of fixed-links for their backhaul.
25
Factors Affecting Demand
• The bands below 15GHz can be expected to be generally congested especially in the urban areas and is one of the main causes of this is the low re-use potential of these bands (due to lower free space path loss).
• As well, the existence of exclusive use bands by the fixed line incumbent may be a constraint on demand by cellular and other operators.
26

Methodology• The fixed-link market is probably a highly concentrated
market, with the top five users making up a high percentage >75% of currently used fixed-link occupied bandwidth (operators).
• The current trend of cellular operators switching to fixed-links means those future operators may also become large users.
• We will make assumptions about own-provided networks, shared networks and substitute networks and spectrum prices
27

Methodology
• In order to do fixed-link forecasts, it will be necessary to base-line estimated current utilisation by band calculating fixed-link density by channel within each band by region (main cities, other urban areas, and rural) and making assumptions about how many high density channels there are in each band at capacity.
• How channels have been assigned to links by the regulator may be helpful in the analysis.
– A common approach is to assign links to channels at the extremities of the band. It may be possible to assume these channels are fully occupied at least in urban areas and in main cities.
28

Fixed Links Demand Methodology
29

30
Data Requirements – Population Density

Predicted Results
• It is possible that, over the next 10 years, the growth in terrestrial fixed-links will be primarily driven by cellular operators and that the majority of this growth will occur in bands above 15GHz, with some growth will occur in sub-15GHz bands.
• Overall, under the medium scenario assumptions we should see that demand for fixed-link spectrum sub-15GHz in cities (the area of highest demand) will rise.
31

Fixed Links Spectrum Demand Results - Example
• Fixed Link Utilization
Band Main City Urban Rural
1.4 GHz 22% 13% 11%
7.5 GHz 78% 31% 11%
13 GHz 72% 60% 16%
15 GHz 60% 33% 10%
32

Fixed Links Spectrum Demand Results - Example
• Occupied BandwidthBand 2014 2015 2020
1.4 GHz 1 1 2
6.0 GHz lower 11 11 12
6.0 GHz upper 14 14 15
7.5 GHz 20 33 40
13 GHz 80 100 120
15 GHz 16 20 25
33

Fixed Links Spectrum Demand Results
34

Spectrum Valuation
• Spectrum availability and spectrum prices have a major impact on spectrum demand. When spectrum is scarce, alternatives to spectrum use such as fibre back bone and fixed services will be sought after. If spectrum prices are high enough, operators can then make choices involving trade-offs less spectrum and more transmitters. Assumptions about spectrum prices can present the evaluation with difficult challenges since spectrum prices can be set at artificially low levels. Expectations around future spectrum prices increases and using these prices to determine appropriate trade-offs will require analysis. It is more likely that qualitative analysis of the impact of ‘orders of magnitude increases’ in spectrum prices will be sufficient at this time.
• In purely financial terms, one can establish the value of a discrete block of spectrum by putting it up for sale and seeing how much anyone is willing to pay to use it. This is the broad principle behind auctions and, by extension, secondary markets – including spectrum trading, leasing and even resale by downstream service providers. But the building blocks of spectrum value are as much political and socio-economic as they are purely financial.
• A government’s approach to spectrum regulation, its market structure and its investment regulations do influence the perceived value of a spectrum license.
– Add to that the demographics, physical geography and political history of the country, and you begin to get a picture of valuation that is highly situational and variable.
35

Spectrum Valuation
• Increasing demand for spectrum creates an economic challenge for regulators which is how to balance spectrum demand and supply. Increasingly, regulators are relying on purely economic models, letting market forces play a larger role in spectrum management to address these supply and demand issues. Technology advances, meanwhile, are driving more demand, and regulators are striving to realize the full economic potential of spectrum, and to keep pace with market changes.
36

Problems with Traditional Approaches
• The main problems with traditional administrative spectrum price determination are:– At best they can only reflect the scarcity of the bands to which they apply;
– They emerge from a computational process by the regulator not from the interaction of firms in a market place;
– The computational process is inevitably inaccurate and subjective. It is however better than adopting a zero price, which we know is incorrect;
– A risk assessment process (consultation or a study such as this one) is required to establish the harm imposed by making them too high and too low.
– Applying economic and business valuation modelling techniques brings much needed rigor to the exercise of valuing spectrum
37

Market-based Spectrum Valuation
• Economic Modelling– The objective of economic modelling is to assess spectrum value from the
perspective of its contribution to the national economy. This is important because we are interested in increasing economic contribution which translates into increasing value
• Business Case Valuation– A business-based valuation model assesses the value of spectrum from a
commercial perspective. The objectives of both regulator and operator converge at the point when the spectrum is optimally priced. Estimating the value of spectrum involves analysis of the impact on profits of changes in spectrum fees over the model period. Modelling what happens to estimates of profits across the sector in the case where there are no spectrum fees is revealing and can be analyzed in comparison to current fee levels.
• Opportunity Cost - AIP38
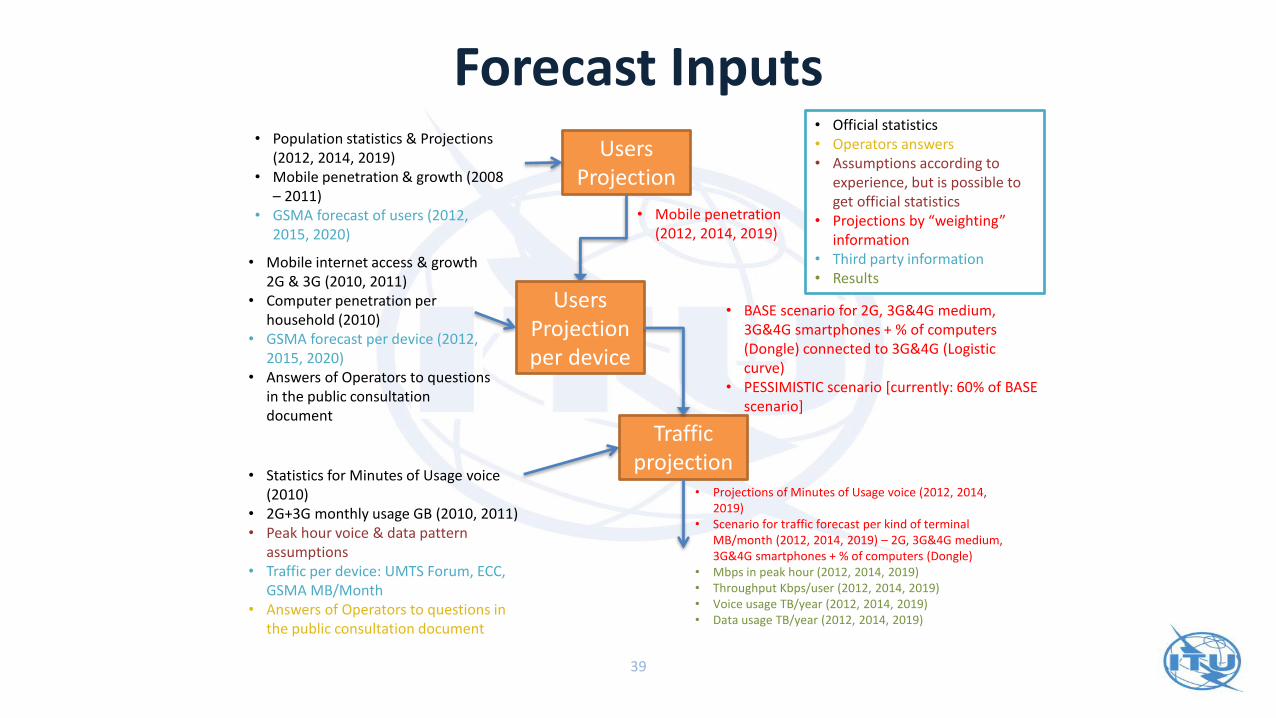
Forecast InputsUsers
Projection
• Mobile penetration (2012, 2014, 2019)
• Population statistics & Projections (2012, 2014, 2019)
• Mobile penetration & growth (2008 – 2011)
• GSMA forecast of users (2012, 2015, 2020)
• Statistics for Minutes of Usage voice (2010)
• 2G+3G monthly usage GB (2010, 2011)• Peak hour voice & data pattern
assumptions• Traffic per device: UMTS Forum, ECC,
GSMA MB/Month• Answers of Operators to questions in
the public consultation document
• Official statistics• Operators answers• Assumptions according to
experience, but is possible to get official statistics
• Projections by “weighting” information
• Third party information• Results
Users Projection per device
Traffic projection
• Projections of Minutes of Usage voice (2012, 2014, 2019)
• Scenario for traffic forecast per kind of terminal MB/month (2012, 2014, 2019) – 2G, 3G&4G medium, 3G&4G smartphones + % of computers (Dongle)
• Mbps in peak hour (2012, 2014, 2019)• Throughput Kbps/user (2012, 2014, 2019)• Voice usage TB/year (2012, 2014, 2019)• Data usage TB/year (2012, 2014, 2019)
• Mobile internet access & growth 2G & 3G (2010, 2011)
• Computer penetration per household (2010)
• GSMA forecast per device (2012, 2015, 2020)
• Answers of Operators to questions in the public consultation document
• BASE scenario for 2G, 3G&4G medium, 3G&4G smartphones + % of computers (Dongle) connected to 3G&4G (Logistic curve)
• PESSIMISTIC scenario [currently: 60% of BASE scenario]
39
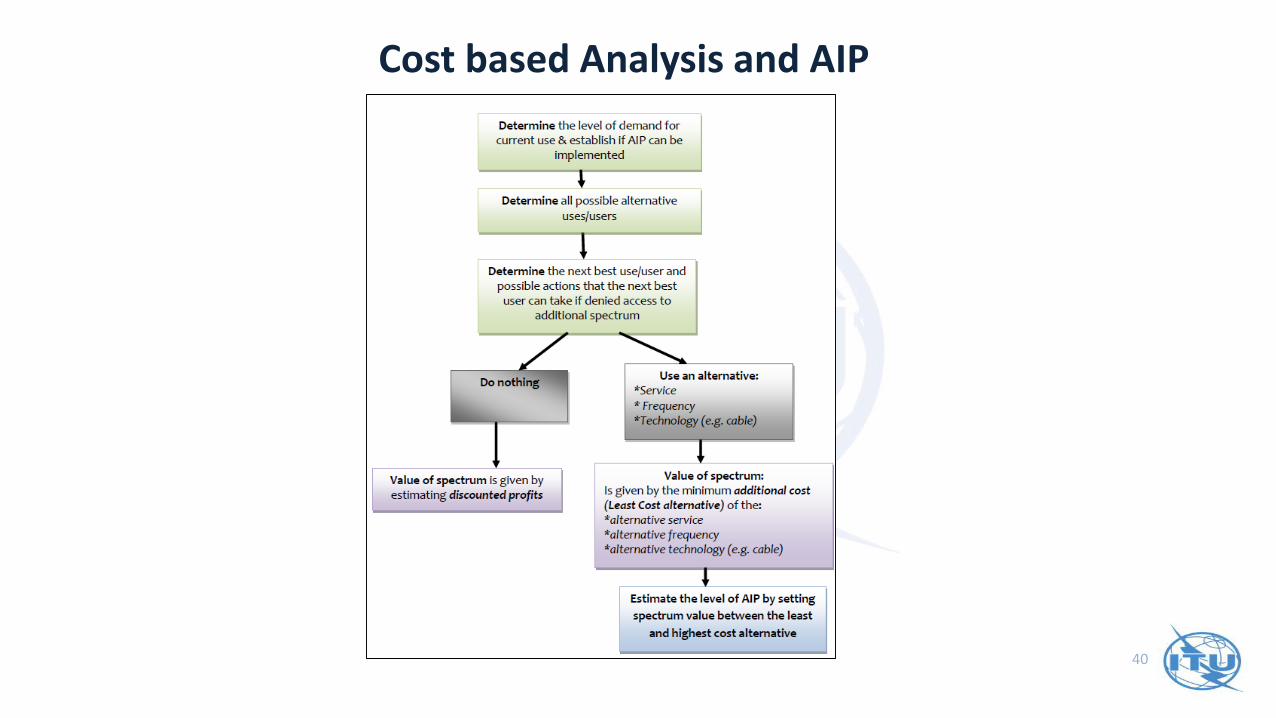
Cost based Analysis and AIP
40
References for further reading
• CEPT ECC PT1 Internal Report on Mobile Broadband Landscape. September 2011
• Mobile Traffic Forecasts 2010-2020, A Report by the UMTS Forum - Report 44, 2010
• Spectrum demand for non-government services 2005–2025, Mason Analysys
41

Thank you
42
Related Documents