INSTITUTE OF PHYSICS PUBLISHING REPORTS ON PROGRESS IN PHYSICS Rep. Prog. Phys. 69 (2006) 79–118 doi:10.1088/0034-4885/69/1/R02 Spectroscopy with trapped francium: advances and perspectives for weak interaction studies E Gomez 1 , L A Orozco 2 and G D Sprouse 1 1 Department of Physics and Astronomy, State University of New York at Stony Brook, Stony Brook, NY 11794-3800, USA 2 Department of Physics, University of Maryland, College Park, MD 20742-4111, USA E-mail: [email protected] Received 10 August 2005, in final form 3 October 2005 Published 7 November 2005 Online at stacks.iop.org/RoPP/69/79 Abstract Francium is a candidate for atomic parity non-conservation (PNC) experiments. Its simple atomic structure has been the subject of extensive experimental research facilitated by the ability to trap and cool significant numbers of atoms. The studies include the location of energy levels, their hyperfine splittings and their lifetime. All of these levels are close to the ground state. The results show a remarkable agreement with calculated ab initio properties to a degree that is comparable with other stable alkali atoms. The quantitative understanding of francium has made possible the exploration of avenues for a PNC measurement in the optical and the microwave regimes. These precision experiments have the potential to enhance our understanding of the weak coupling constants between electrons and nucleons, as well as between nucleons. 0034-4885/06/010079+40$90.00 © 2006 IOP Publishing Ltd Printed in the UK 79

Welcome message from author
This document is posted to help you gain knowledge. Please leave a comment to let me know what you think about it! Share it to your friends and learn new things together.
Transcript
INSTITUTE OF PHYSICS PUBLISHING REPORTS ON PROGRESS IN PHYSICS
Rep. Prog. Phys. 69 (2006) 79–118 doi:10.1088/0034-4885/69/1/R02
Spectroscopy with trapped francium: advances andperspectives for weak interaction studies
E Gomez1, L A Orozco2 and G D Sprouse1
1 Department of Physics and Astronomy, State University of New York at Stony Brook,Stony Brook, NY 11794-3800, USA2 Department of Physics, University of Maryland, College Park, MD 20742-4111, USA
E-mail: [email protected]
Received 10 August 2005, in final form 3 October 2005Published 7 November 2005Online at stacks.iop.org/RoPP/69/79
Abstract
Francium is a candidate for atomic parity non-conservation (PNC) experiments. Its simpleatomic structure has been the subject of extensive experimental research facilitated by theability to trap and cool significant numbers of atoms. The studies include the location ofenergy levels, their hyperfine splittings and their lifetime. All of these levels are close to theground state. The results show a remarkable agreement with calculated ab initio properties toa degree that is comparable with other stable alkali atoms. The quantitative understanding offrancium has made possible the exploration of avenues for a PNC measurement in the opticaland the microwave regimes. These precision experiments have the potential to enhance ourunderstanding of the weak coupling constants between electrons and nucleons, as well asbetween nucleons.
0034-4885/06/010079+40$90.00 © 2006 IOP Publishing Ltd Printed in the UK 79

80 E Gomez et al
Contents
Page1. Introduction 812. Francium production and trapping 82
2.1. Francium production 822.1.1. Decay techniques 822.1.2. Accelerator sources 82
2.2. The francium trap 862.2.1. Cell coatings 862.2.2. The Stony Brook first trap 862.2.3. The Boulder trap 882.2.4. The Legnaro trap 882.2.5. The Stony Brook second trap 89
2.3. Trapping efficiency for radioactive atoms 913. Spectroscopy of Fr 91
3.1. Experiments 923.1.1. Energy levels 923.1.2. 221Fr 7p levels 953.1.3. Hyperfine anomaly 963.1.4. Lifetime measurements 97
3.2. Atomic structure of francium 1044. Parity non-conservation 106
4.1. Atomic PNC theoretical background 1074.2. The anapole moment 1084.3. Status of PNC measurements 109
5. Considerations for a PNC experiment in francium 1105.1. The optical experiment 1105.2. The anapole moment measurement 1125.3. Other optical atomic PNC proposals 113
6. Perspectives and conclusions 113Acknowledgments 113Appendix. Tables of Fr parameters 113References 115
Spectroscopy with trapped francium 81
1. Introduction
Francium is the heaviest of the alkali atoms, so it has both a simple electronic structure anda large nucleus. All its isotopes are radioactive and the longest lived isotope has a half-lifeof 21.8 min. The advent of laser trapping and cooling [1] opened the possibility to study itsproperties in a controlled environment. Trapping of radioactive atoms has become a field initself [2]. It is closely related to weak interaction studies; in particular, precision measurementsbased on beta-decay of samples of atoms [3–5].
The long-term goal of the measurements in francium reviewed here is to reach aquantitative understanding that will permit the study of the weak interaction through a paritynon-conservation (PNC) measurement. Although no experiment has been completed to date,various groups are preparing to undertake the study of PNC in francium. This review focuses onthe measurements of the atomic structure of Fr and some of the existing experimental proposalsfor atomic PNC studies in Fr. There are extensive reviews on the theoretical methods associatedwith atomic PNC by the two leading theoretical groups in the field [6, 7] with details on thecurrent state of the calculations. The review by Bouchiat and Bouchiat [8] presents the stateof atomic PNC experiments in 1997.
The pioneering work of Bouchiat and Bouchiat [9] recognized that the size of the effectof PNC in atoms scales faster than Z3, with Z the atomic number, launching a series ofexperiments to look for effects of the weak interaction in heavy atoms. This strong scaling hasmade it possible not only to observe PNC effects in atoms but also to measure weak interactioncoupling constants.
Atomic PNC work has been centred around heavy atoms with atomic number greaterthan 50 [10–14]. Recent measurements in Cs [10] have reached sensitivity to the nuclear spindependent part of the interaction (primarily due to the nuclear anapole moment), opening anew avenue for studies of the weak interaction within the nucleus [15,16], an area very difficultto probe otherwise.
On the other hand, the spin independent measurements, helped by the ab initio atomicphysics calculations [17,18], have been used to put constraints on physics beyond the StandardModel [19]. Recent analysis of the results [20–22] show that an atomic PNC measurementcan place limits in the masses of extra neutral gauge bosons. However, the atomic andnuclear theory calculations are sufficiently complicated that high order corrections previouslyneglected [23] can modify the high energy limits obtained from the atomic PNC results.
The road to a PNC measurement in francium is long and several intermediate steps have tobe completed before getting there. The first step was achieved by the group of Liberman [24]when they managed to locate the 7S1/2 → 7P3/2 transition, the so called D2 line of franciumat CERN. The steady progress in the electronic and nuclear properties of francium wasfundamental for the 1995 magneto-optical trapping on line with the superconducting linearaccelerator at Stony Brook [25]. The new ability to make and contain francium provided asample of about 103 cold atoms confined to a interaction free region, ready to be studied. TheStony Brook group has devoted several years to the understanding of the electronic structurethrough spectroscopy. The study included the identification of energy levels and hyperfinesplitting measurements [26–29] and the measurement of electronic level lifetimes [30–34].The measurements provide complementary information on the electronic structure near thenucleus and far away from it. The Wieman group at Boulder succeeded in trapping franciumthat came as a daughter in the radioactive decay of 229Th and studied the electronic structureand hyperfine splittings of 221Fr [35]. Recent advances at the accelerator in Legnaro, Italy ledby Moi have opened a new source for the continuation of research with francium [36].
82 E Gomez et al
2. Francium production and trapping
Perey [37], of the Curie Institute in Paris, reported in 1939 the discovery of a new radioactiveelement. While doing chemical analysis of the decay products of actinium, she found anelement that behaved as an alkali. She named the new element francium after her country.
Francium is the heaviest of the alkali elements, with 87 electrons. It is the most unstable ofthe first 103 elements, with isotopes containing between 201 and 230 nucleons. In the last threedecades, states with energies accessible by laser excitation were measured in pioneering workat ISOLDE in CERN [38]. Their measurements of hyperfine splittings revealed informationabout the nuclear structure of the francium isotopes 207–213 and 220–228 [39]. Andreevet al [40] studied the structure of two Rydberg series including the ionization potential using221Fr, a daughter product of the decay of 229Th, by laser-resonance ionization.
It is now possible to perform precise measurements of the atomic properties of franciumas a result of two different developments. First new targets are available for its production withmore selective nuclear fusion reactions and second the advent of laser trapping and coolingtechniques for on-line capture of the produced radioactive isotopes [2].
2.1. Francium production
The simplest way to obtain francium is from a natural source. The short lifetime of franciummakes it hard to find it naturally in large amounts. The other approach is to produce theradioactive element in an accelerator. This implies the selection of a fusion or spallationreaction, the preparation of an appropriate beam and target as well as a means of extractingand directing the francium to a different area for the spectroscopic measurements.
2.1.1. Decay techniques. The most common method used to obtain a sample of 221Fr startswith a radioactive source of 229Th (τ1/2 = 7340 yr), which alpha decays into 225Ra(τ1/2 =14.9 d). The Ra then beta decays into 225Ac(τ1/2 = 10 d) which alpha decays to produce the221Fr(τ1/2 = 4.9 min). The group of Lethokhov produced a foil containing 221Fr by startingwith a thin layer of 229Th. They placed a thin Ta foil directly on top of the Th activity, sothat the recoil momentum of the first alpha decay would propel some of the 225Ra into theTa foil. After several weeks of close contact with the Th activity, the Ta foil was placed inthe experiment and heated to release the 221Fr activity that accumulates from the subsequentdecays [40]. The Wieman group deposited actinium in a platinum ribbon either electroplatingit from a thorium solution or via electrostatic collection of radium in a helium atmosphere [35].They placed the platinum inside an orthotropic oven to produce a highly collimated beam ofabout 104 221Fr atoms/s [41]. The advantage of the decay method is that it does not requirean accelerator to produce francium. The disadvantage is the limited number of atoms andisotopes produced this way.
2.1.2. Accelerator sources. The pioneering work of Liberman et al [24] relied on anaccelerator source at CERN to produce francium in spallation reactions. At Stony Brookand Legnaro, heavy ion fusion reactions produce the light francium isotopes.
Spallation sources. Copious amounts of francium have been produced at the ISOLDEexperiment at CERN [42]. High energy protons (originally 0.6 GeV and now 1.4 GeV) impingeon 50–100 g cm−2 ThC and UC targets to produce >109 atoms/µC for 208–212,220–226Fr andlesser amounts of other isotopes. Spallation reactions produce these francium isotopes, but
Spectroscopy with trapped francium 83
fission reactions make a tremendous amount of other activity. The target is heated to havequick diffusion and rapid release of the volatile elements such as francium. Target materialsmust withstand the large beam power, but yet allow a short diffusion path for the activity toreach the surface of the target material, and then quickly diffuse to the ionization region. Afterionization and acceleration to 60 keV, the different isotopes of Fr are magnetically separatedfrom all other activities and sent to the experiment. Typical proton beam intensities at ISOLDEhave been 1–10 µA limited mainly by radiation safety concerns. The ISAC facility at TRIUMFin Vancouver, B.C. Canada is currently developing targets for 100 µA of 500 MeV protons.ISAC and other proposed facilities such as the Rare Isotope Accelerator hope to have evenmore intense sources of Fr and other elements.
Fusion sources. Another alternative to produce unstable nuclei is with heavy-ion fusionreactions. A beam projectile with enough energy can overcome the Coulomb repulsion ofthe two nuclei and fuse them to form a compound nucleus. The new nucleus cools downby boiling off neutrons, creating a different isotope. The fusion reaction is more selectivethan the spallation reactions, and projectile–target–energy combinations can be chosen so thatmore than half of the reaction cross section forms a particular isotope, eliminating the needfor magnetic separation of reaction products. Different combinations of target and projectilecan make the same isotope, e.g. 12C on 203Tl or 18O on 197Au both make the same compoundnucleus, 215Fr, but the Au target is much to be preferred because of its chemical properties ofnoble metal and its low vapour pressure near the melting point. This latter reaction has beenused at Stony Brook and Legnaro to produce 210Fr. The products come to a stop in the target.As the target is heated, the reaction products, diffuse to the surface, are surface-ionized and aretransported as ions to a region where after neutralization they are trapped in a magneto opticaltrap (MOT) for further measurements.
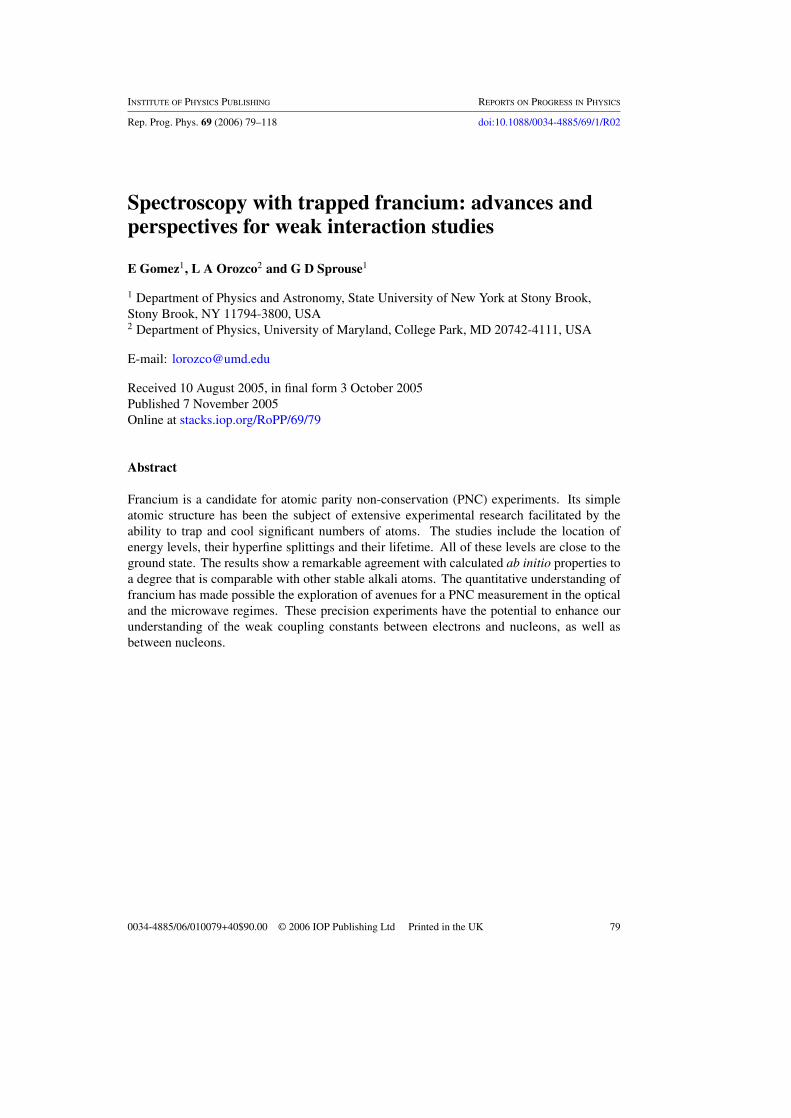
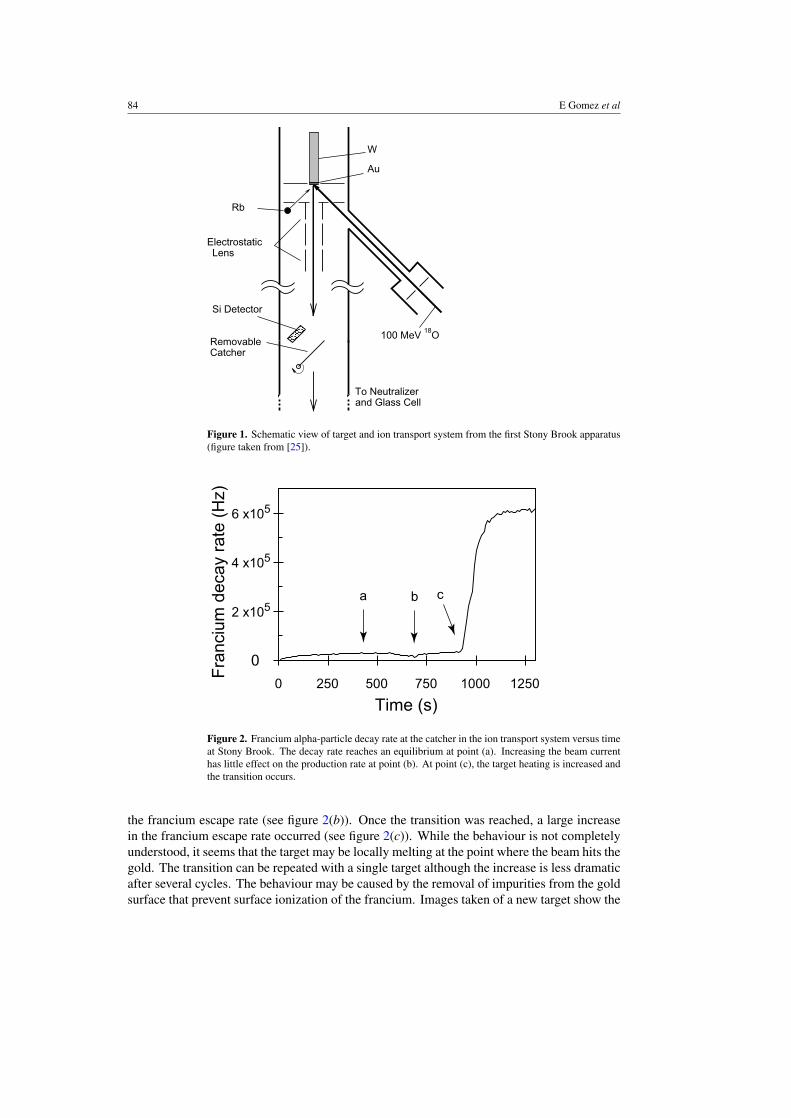
The apparatus used to trap francium at Stony Brook is based on the same principlesas the one they used to trap radioactive 79Rb [43]. Beams of 18O from the Stony Brooksuperconducting LINAC are incident on a Au target mounted on a W rod. The 197Au(18O,xn)reaction at 100 MeV produces predominantly 210Fr, which has a 3.2 min half-life. 210Fr has anestimated α decay branching of 60±30% with the remaining decays by β+ or electron capture.The target is heated to ≈1200 K by the beam power and by an auxiliary resistance heater asseen in figure 1. The francium is surface ionized as it escapes from the gold because the workfunction of gold (4.8–5.1 eV) is larger than the ionization potential of francium (4.07 eV).
A beam energy of 100 MeV is optimal for production of 210Fr since this isotope is createdvery close to the surface facilitating its escape from the target. Changing the beam energymodifies the production rate of the francium isotopes. Increasing the beam energy allows thefrancium nucleus to expel more neutrons during the cooling process following nuclear fusion.This produces francium isotopes with fewer neutrons. Combinations of projectile energy andtargets have allowed the production and trapping of 208−212Fr at Stony Brook [28]. To produceand trap 212Fr, they used an isotopically enriched Pt target with a beam of 19F [44]. Its 19.6 minhalf-life makes it nearly the longest lived francium isotope.
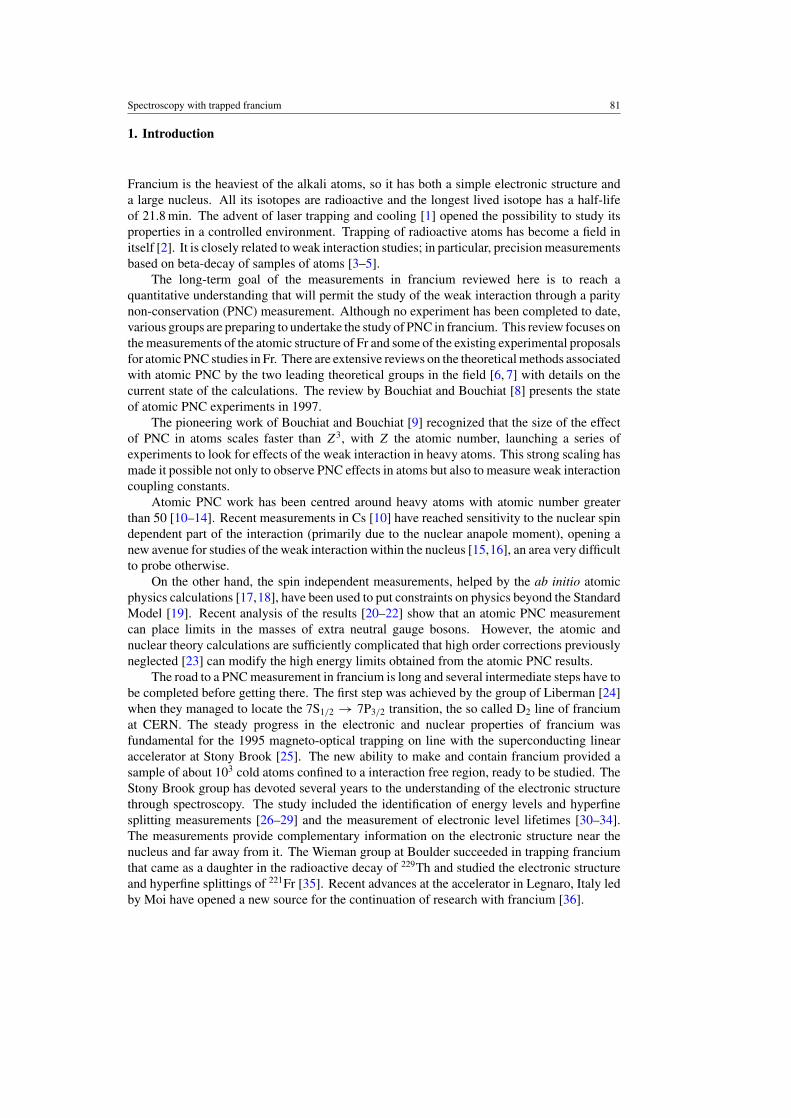
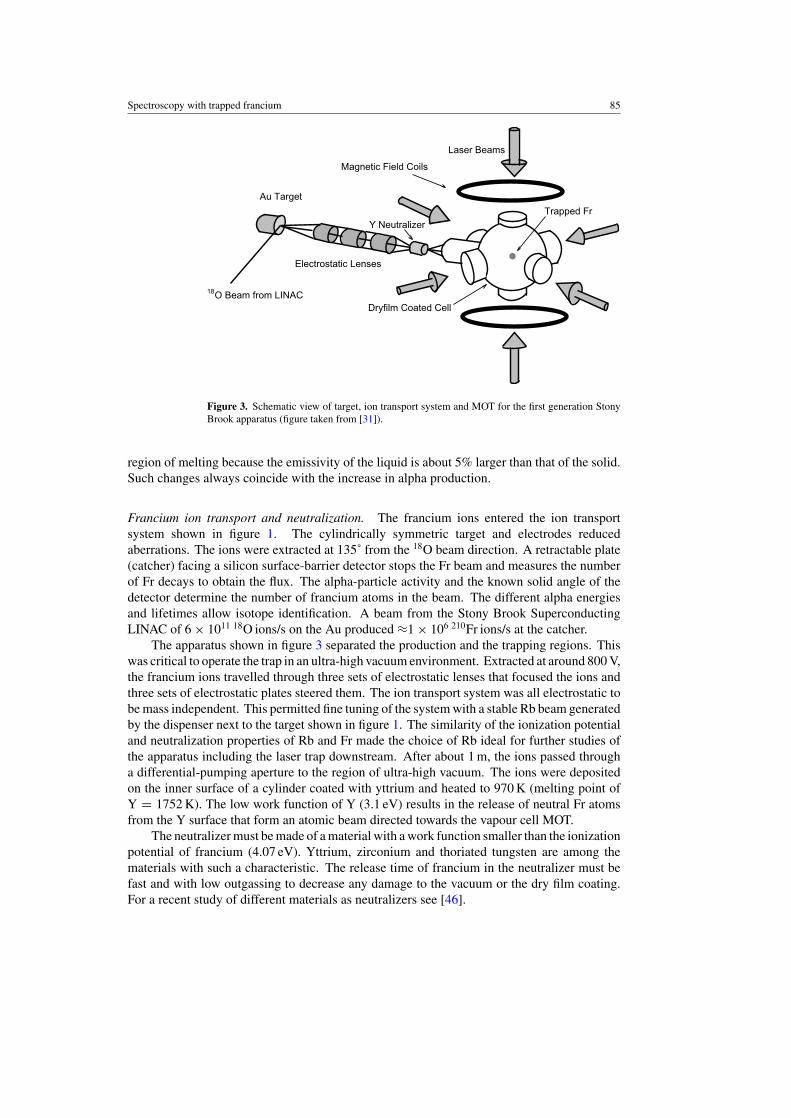
Close to the melting point of gold (1336 K) the Fr diffuses the most rapidly but the structuralproperties of the Au may become unstable. The coil around the W rod and the beam currentheated the target, and there was a sensitive dependence of the number of francium ions on thetarget temperature. The elevated temperature is necessary for the alkali elements to rapidlydiffuse to the surface and be surface ionized [45]. There was a sharp increase in the numberof francium ions that escaped from a new gold target when it heated. Figure 2 plots the alphadecay rate of francium ions at the silicon detector as a function of time while the beam is onthe target. Increasing the 18O beam current prior to the sharp transition had little effect on
84 E Gomez et al
Removable
Rb
100 MeV 18O
To Neutralizer and Glass Cell
Catcher
Si Detector
Electrostatic Lens
Au
W
Figure 1. Schematic view of target and ion transport system from the first Stony Brook apparatus(figure taken from [25]).
0
2 x10⁵
4 x10⁵
6 x10⁵
0 250 500 750 1000 1250
Time (s)
Fra
nciu
m d
ecay
rat
e (H
z)
a cb
Figure 2. Francium alpha-particle decay rate at the catcher in the ion transport system versus timeat Stony Brook. The decay rate reaches an equilibrium at point (a). Increasing the beam currenthas little effect on the production rate at point (b). At point (c), the target heating is increased andthe transition occurs.
the francium escape rate (see figure 2(b)). Once the transition was reached, a large increasein the francium escape rate occurred (see figure 2(c)). While the behaviour is not completelyunderstood, it seems that the target may be locally melting at the point where the beam hits thegold. The transition can be repeated with a single target although the increase is less dramaticafter several cycles. The behaviour may be caused by the removal of impurities from the goldsurface that prevent surface ionization of the francium. Images taken of a new target show the
Spectroscopy with trapped francium 85
O Beam from LINAC18
Electrostatic Lenses
Au Target
Dryfilm Coated Cell
Y Neutralizer
Laser Beams
Trapped Fr
Magnetic Field Coils
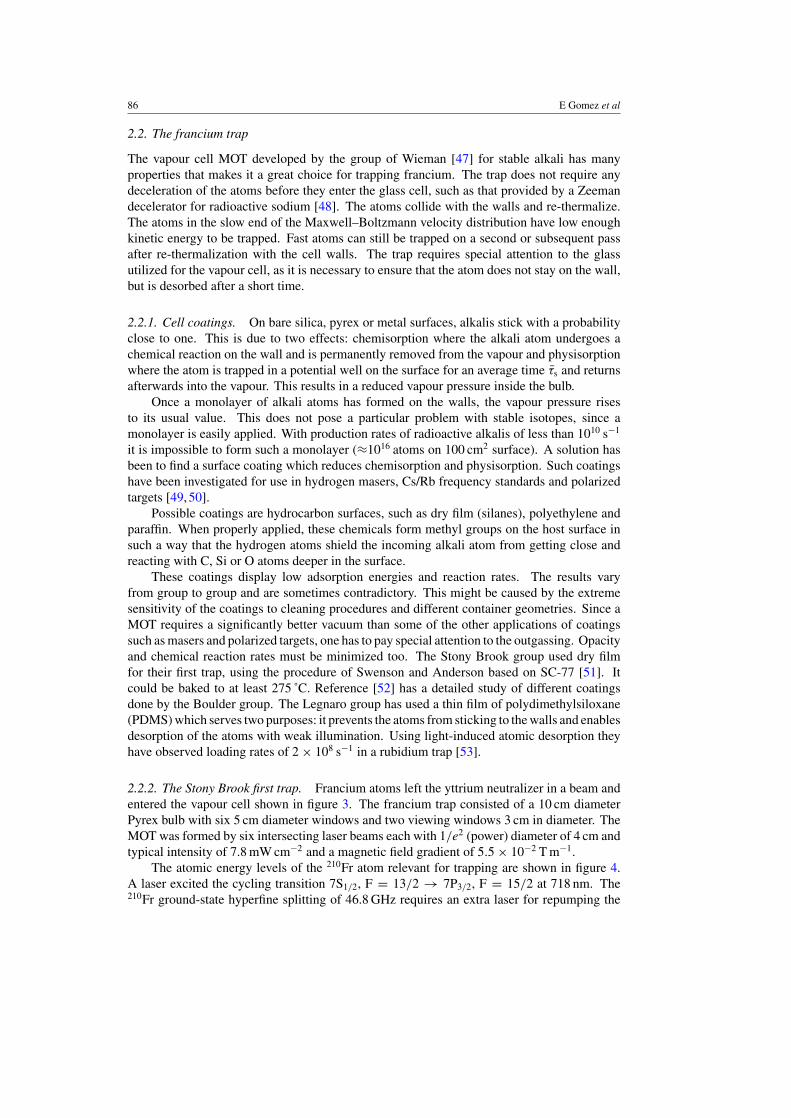
Figure 3. Schematic view of target, ion transport system and MOT for the first generation StonyBrook apparatus (figure taken from [31]).
region of melting because the emissivity of the liquid is about 5% larger than that of the solid.Such changes always coincide with the increase in alpha production.
Francium ion transport and neutralization. The francium ions entered the ion transportsystem shown in figure 1. The cylindrically symmetric target and electrodes reducedaberrations. The ions were extracted at 135˚ from the 18O beam direction. A retractable plate(catcher) facing a silicon surface-barrier detector stops the Fr beam and measures the numberof Fr decays to obtain the flux. The alpha-particle activity and the known solid angle of thedetector determine the number of francium atoms in the beam. The different alpha energiesand lifetimes allow isotope identification. A beam from the Stony Brook SuperconductingLINAC of 6 × 10¹¹ 18O ions/s on the Au produced ≈1 × 10⁶ 210Fr ions/s at the catcher.
The apparatus shown in figure 3 separated the production and the trapping regions. Thiswas critical to operate the trap in an ultra-high vacuum environment. Extracted at around 800 V,the francium ions travelled through three sets of electrostatic lenses that focused the ions andthree sets of electrostatic plates steered them. The ion transport system was all electrostatic tobe mass independent. This permitted fine tuning of the system with a stable Rb beam generatedby the dispenser next to the target shown in figure 1. The similarity of the ionization potentialand neutralization properties of Rb and Fr made the choice of Rb ideal for further studies ofthe apparatus including the laser trap downstream. After about 1 m, the ions passed througha differential-pumping aperture to the region of ultra-high vacuum. The ions were depositedon the inner surface of a cylinder coated with yttrium and heated to 970 K (melting point ofY = 1752 K). The low work function of Y (3.1 eV) results in the release of neutral Fr atomsfrom the Y surface that form an atomic beam directed towards the vapour cell MOT.
The neutralizer must be made of a material with a work function smaller than the ionizationpotential of francium (4.07 eV). Yttrium, zirconium and thoriated tungsten are among thematerials with such a characteristic. The release time of francium in the neutralizer must befast and with low outgassing to decrease any damage to the vacuum or the dry film coating.For a recent study of different materials as neutralizers see [46].
86 E Gomez et al
2.2. The francium trap
The vapour cell MOT developed by the group of Wieman [47] for stable alkali has manyproperties that makes it a great choice for trapping francium. The trap does not require anydeceleration of the atoms before they enter the glass cell, such as that provided by a Zeemandecelerator for radioactive sodium [48]. The atoms collide with the walls and re-thermalize.The atoms in the slow end of the Maxwell–Boltzmann velocity distribution have low enoughkinetic energy to be trapped. Fast atoms can still be trapped on a second or subsequent passafter re-thermalization with the cell walls. The trap requires special attention to the glassutilized for the vapour cell, as it is necessary to ensure that the atom does not stay on the wall,but is desorbed after a short time.
2.2.1. Cell coatings. On bare silica, pyrex or metal surfaces, alkalis stick with a probabilityclose to one. This is due to two effects: chemisorption where the alkali atom undergoes achemical reaction on the wall and is permanently removed from the vapour and physisorptionwhere the atom is trapped in a potential well on the surface for an average time τs and returnsafterwards into the vapour. This results in a reduced vapour pressure inside the bulb.
Once a monolayer of alkali atoms has formed on the walls, the vapour pressure risesto its usual value. This does not pose a particular problem with stable isotopes, since amonolayer is easily applied. With production rates of radioactive alkalis of less than 1010 s−1
it is impossible to form such a monolayer (≈1016 atoms on 100 cm2 surface). A solution hasbeen to find a surface coating which reduces chemisorption and physisorption. Such coatingshave been investigated for use in hydrogen masers, Cs/Rb frequency standards and polarizedtargets [49, 50].
Possible coatings are hydrocarbon surfaces, such as dry film (silanes), polyethylene andparaffin. When properly applied, these chemicals form methyl groups on the host surface insuch a way that the hydrogen atoms shield the incoming alkali atom from getting close andreacting with C, Si or O atoms deeper in the surface.
These coatings display low adsorption energies and reaction rates. The results varyfrom group to group and are sometimes contradictory. This might be caused by the extremesensitivity of the coatings to cleaning procedures and different container geometries. Since aMOT requires a significantly better vacuum than some of the other applications of coatingssuch as masers and polarized targets, one has to pay special attention to the outgassing. Opacityand chemical reaction rates must be minimized too. The Stony Brook group used dry filmfor their first trap, using the procedure of Swenson and Anderson based on SC-77 [51]. Itcould be baked to at least 275 ˚C. Reference [52] has a detailed study of different coatingsdone by the Boulder group. The Legnaro group has used a thin film of polydimethylsiloxane(PDMS) which serves two purposes: it prevents the atoms from sticking to the walls and enablesdesorption of the atoms with weak illumination. Using light-induced atomic desorption theyhave observed loading rates of 2 × 10⁸ s−1 in a rubidium trap [53].
2.2.2. The Stony Brook first trap. Francium atoms left the yttrium neutralizer in a beam andentered the vapour cell shown in figure 3. The francium trap consisted of a 10 cm diameterPyrex bulb with six 5 cm diameter windows and two viewing windows 3 cm in diameter. TheMOT was formed by six intersecting laser beams each with 1/e2 (power) diameter of 4 cm andtypical intensity of 7.8 mW cm−2 and a magnetic field gradient of 5.5 × 10⁻² T m−1.
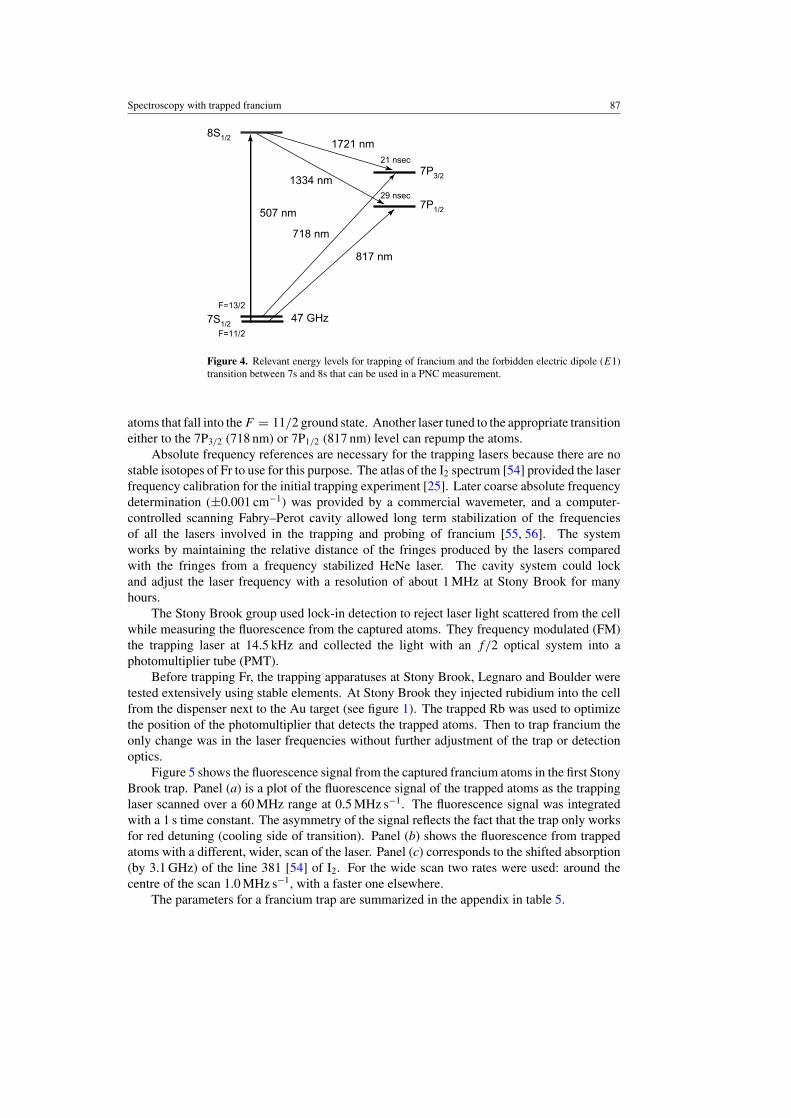
The atomic energy levels of the 210Fr atom relevant for trapping are shown in figure 4.A laser excited the cycling transition 7S1/2, F = 13/2 → 7P3/2, F = 15/2 at 718 nm. The210Fr ground-state hyperfine splitting of 46.8 GHz requires an extra laser for repumping the
Spectroscopy with trapped francium 87
7P3/2
7P1/2
817 nm
718 nm
21 nsec
29 nsec
8S1/2
47 GHz
507 nm
1721 nm
1334 nm
F=13/2
F=11/2
7S1/2
Figure 4. Relevant energy levels for trapping of francium and the forbidden electric dipole (E1)transition between 7s and 8s that can be used in a PNC measurement.
atoms that fall into the F = 11/2 ground state. Another laser tuned to the appropriate transitioneither to the 7P3/2 (718 nm) or 7P1/2 (817 nm) level can repump the atoms.
Absolute frequency references are necessary for the trapping lasers because there are nostable isotopes of Fr to use for this purpose. The atlas of the I2 spectrum [54] provided the laserfrequency calibration for the initial trapping experiment [25]. Later coarse absolute frequencydetermination (±0.001 cm−1) was provided by a commercial wavemeter, and a computer-controlled scanning Fabry–Perot cavity allowed long term stabilization of the frequenciesof all the lasers involved in the trapping and probing of francium [55, 56]. The systemworks by maintaining the relative distance of the fringes produced by the lasers comparedwith the fringes from a frequency stabilized HeNe laser. The cavity system could lockand adjust the laser frequency with a resolution of about 1 MHz at Stony Brook for manyhours.
The Stony Brook group used lock-in detection to reject laser light scattered from the cellwhile measuring the fluorescence from the captured atoms. They frequency modulated (FM)the trapping laser at 14.5 kHz and collected the light with an f/2 optical system into aphotomultiplier tube (PMT).
Before trapping Fr, the trapping apparatuses at Stony Brook, Legnaro and Boulder weretested extensively using stable elements. At Stony Brook they injected rubidium into the cellfrom the dispenser next to the Au target (see figure 1). The trapped Rb was used to optimizethe position of the photomultiplier that detects the trapped atoms. Then to trap francium theonly change was in the laser frequencies without further adjustment of the trap or detectionoptics.
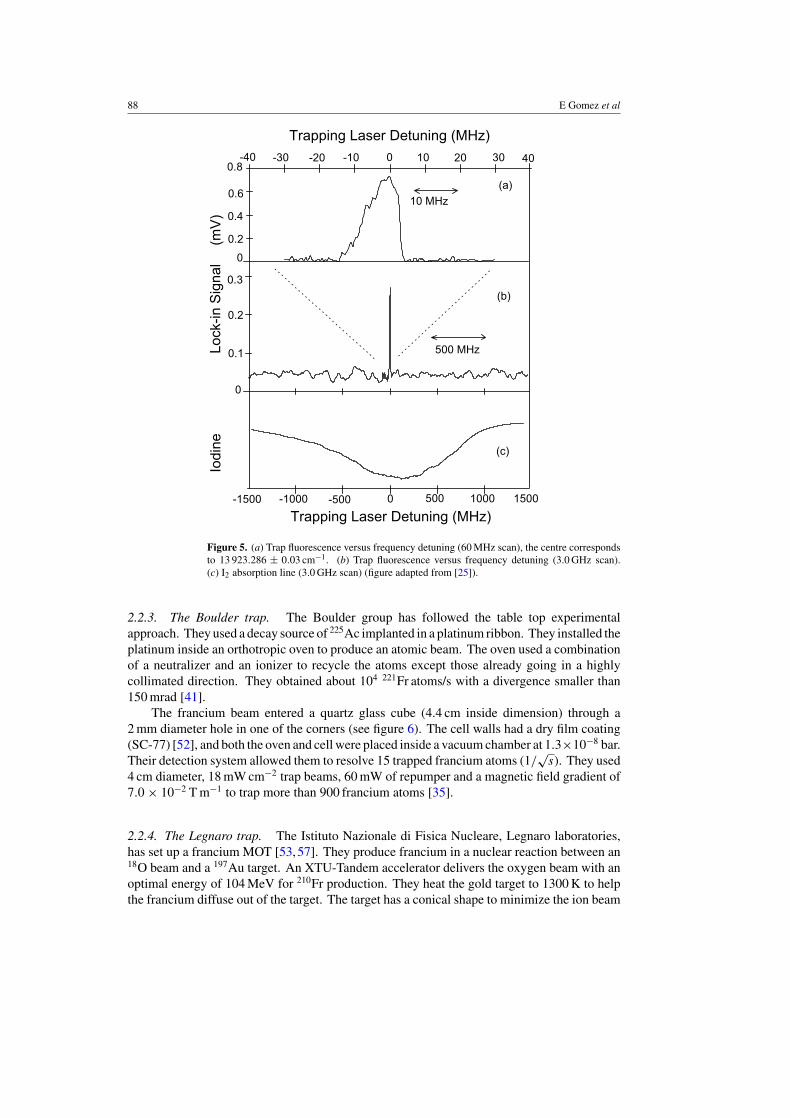
Figure 5 shows the fluorescence signal from the captured francium atoms in the first StonyBrook trap. Panel (a) is a plot of the fluorescence signal of the trapped atoms as the trappinglaser scanned over a 60 MHz range at 0.5 MHz s−1. The fluorescence signal was integratedwith a 1 s time constant. The asymmetry of the signal reflects the fact that the trap only worksfor red detuning (cooling side of transition). Panel (b) shows the fluorescence from trappedatoms with a different, wider, scan of the laser. Panel (c) corresponds to the shifted absorption(by 3.1 GHz) of the line 381 [54] of I2. For the wide scan two rates were used: around thecentre of the scan 1.0 MHz s−1, with a faster one elsewhere.
The parameters for a francium trap are summarized in the appendix in table 5.
88 E Gomez et al
0.3
500 MHz0.1
0.2
0
(b)
Lock
-in S
igna
l(m
V)
10 MHz
0.2
0.4
0.6
0.8
0
0 10 20 30-10 40-30-40 -20
(a)
Trapping Laser Detuning (MHz)
Iodi
ne
-1500 -1000 -500 0 500 1000 1500
(c)
Trapping Laser Detuning (MHz)
Figure 5. (a) Trap fluorescence versus frequency detuning (60 MHz scan), the centre correspondsto 13 923.286 ± 0.03 cm−1. (b) Trap fluorescence versus frequency detuning (3.0 GHz scan).(c) I2 absorption line (3.0 GHz scan) (figure adapted from [25]).
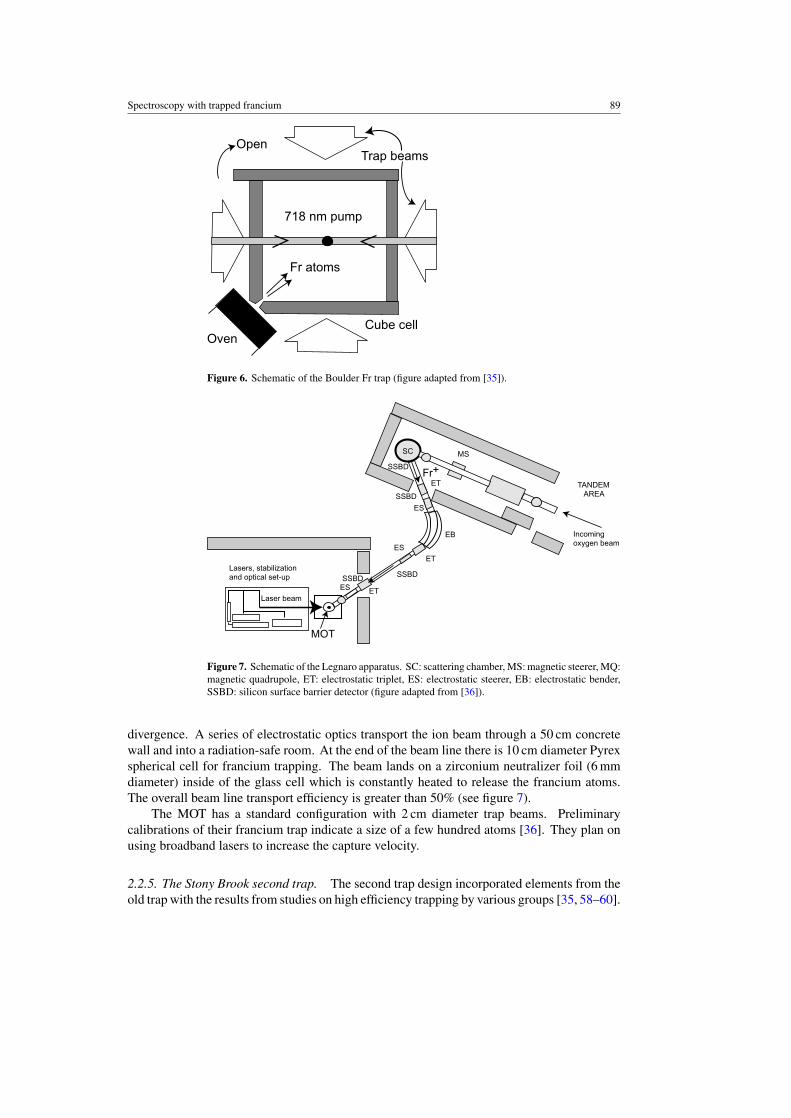
2.2.3. The Boulder trap. The Boulder group has followed the table top experimentalapproach. They used a decay source of 225Ac implanted in a platinum ribbon. They installed theplatinum inside an orthotropic oven to produce an atomic beam. The oven used a combinationof a neutralizer and an ionizer to recycle the atoms except those already going in a highlycollimated direction. They obtained about 104 221Fr atoms/s with a divergence smaller than150 mrad [41].
The francium beam entered a quartz glass cube (4.4 cm inside dimension) through a2 mm diameter hole in one of the corners (see figure 6). The cell walls had a dry film coating(SC-77) [52], and both the oven and cell were placed inside a vacuum chamber at 1.3×10⁻⁸ bar.Their detection system allowed them to resolve 15 trapped francium atoms (1/
√s). They used
4 cm diameter, 18 mW cm−2 trap beams, 60 mW of repumper and a magnetic field gradient of7.0 × 10−2 T m−1 to trap more than 900 francium atoms [35].
2.2.4. The Legnaro trap. The Istituto Nazionale di Fisica Nucleare, Legnaro laboratories,has set up a francium MOT [53,57]. They produce francium in a nuclear reaction between an18O beam and a 197Au target. An XTU-Tandem accelerator delivers the oxygen beam with anoptimal energy of 104 MeV for 210Fr production. They heat the gold target to 1300 K to helpthe francium diffuse out of the target. The target has a conical shape to minimize the ion beam
Spectroscopy with trapped francium 89
Cube cell
Fr atoms
Oven
OpenTrap beams
718 nm pump
Figure 6. Schematic of the Boulder Fr trap (figure adapted from [35]).
MS
MQ
SC
SSBDFr+
ES
EB
ETES
ET
MOT
ESLaser beam
Lasers, stabilizationand optical set-up SSBD SSBD
SSBD
Incoming oxygen beam
TANDEM AREA
ET
Figure 7. Schematic of the Legnaro apparatus. SC: scattering chamber, MS: magnetic steerer, MQ:magnetic quadrupole, ET: electrostatic triplet, ES: electrostatic steerer, EB: electrostatic bender,SSBD: silicon surface barrier detector (figure adapted from [36]).
divergence. A series of electrostatic optics transport the ion beam through a 50 cm concretewall and into a radiation-safe room. At the end of the beam line there is 10 cm diameter Pyrexspherical cell for francium trapping. The beam lands on a zirconium neutralizer foil (6 mmdiameter) inside of the glass cell which is constantly heated to release the francium atoms.The overall beam line transport efficiency is greater than 50% (see figure 7).
The MOT has a standard configuration with 2 cm diameter trap beams. Preliminarycalibrations of their francium trap indicate a size of a few hundred atoms [36]. They plan onusing broadband lasers to increase the capture velocity.
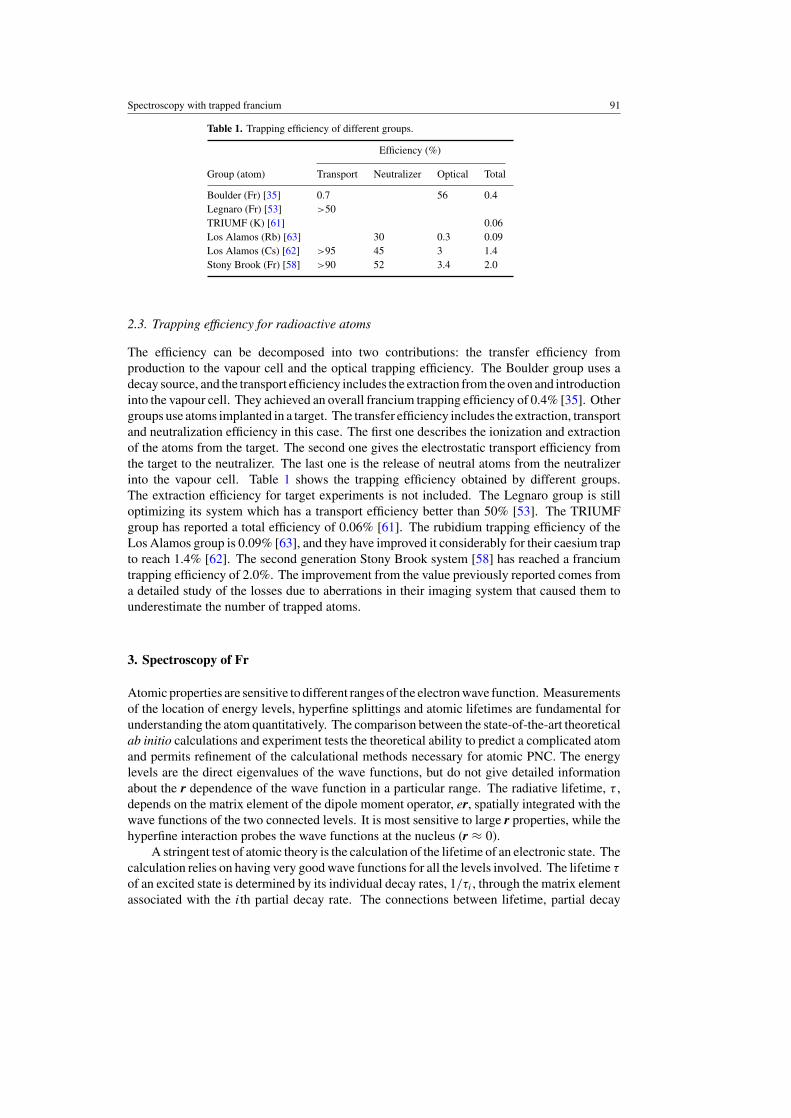
2.2.5. The Stony Brook second trap. The second trap design incorporated elements from theold trap with the results from studies on high efficiency trapping by various groups [35, 58–60].
90 E Gomez et al
~100 MeV18O beam
from Stony Brook LINAC
goldtarget
10m path through
target room wall
Yttrium neutralizer (movable)
anti-Helmholtzmagnetic field coils
Dry-film coatedglass cell
laser beams
electrostaticquadrupole lenses
Figure 8. Second generation Stony Brook on-line apparatus for francium production and trapping.The drawing is not to scale (figure adapted from [58]).
The focus of the design was in three points: the optical trap, the neutralizer and the exitholes.
The optical trap efficiency depends on the capture velocity, which is the maximum velocitythat an atom can have and still be trapped, and the trapping volume. The trapping volume shouldbe as close to the total available volume as possible. To maximize the capture velocity it isnecessary to increase the trap laser beams size, the detuning and the power. Since the power isfixed by the laser used, this also limits the optimum beam size and detuning. The cell consistsof a cube (5 cm on the side) with 1.5 cm windows on the corners for imaging and additionallasers (figure 8). The MOT has three pairs of retro-reflected beams with a 15 mW cm−2
intensity, 6 cm 1/e2 diameter each and a typical detuning of 31 MHz. The capture velocityunder equivalent conditions in rubidium is larger than 18 cm s−1 which gives a single passtrapping efficiency of 10−5 [58].
To improve over the single pass efficiency one needs to force the atoms to gothrough the trapping region several times. The dry film coating prevents the atoms fromsticking to the walls, but the atoms can still escape through an exit hole. The new designmaximized the number of bounces by eliminating the exit holes. The trap has an yttriumneutralizer foil (1 cm × 1 cm × 0.011 mm), which has been shown to work reliably in the past,heated to 1000 K for 1 s. The trap works in a pulsed mode with the neutralizer in a rotationstage. After accumulation of francium in the neutralizer the rotation stage blocks the only holeto the glass cell. DC current is then applied to the neutralizer to release atomic francium intothe glass cell. The pulsed mode has the additional advantage that the neutralizer is only hotfor a small fraction of the time minimizing any possible damage to the vacuum or coating.A typical cycle consists of 20 s of accumulation and 1 s of release which translates in a dutycycle loss of only 5%. Keeping the glass cell hole open most of the time increased the pumpingspeed and improved the vacuum. Once the atoms are trapped and the neutralizer removed, theatoms can be transferred through the lower hole into another chamber for further experiments.The efficiency from production to trapping is better than 2% [58] which corresponds to animprovement of more than a factor of 100 over the previous design. Similar studies have beenperformed for other alkali atoms [61, 62].
Spectroscopy with trapped francium 91
Table 1. Trapping efficiency of different groups.
Efficiency (%)
Group (atom) Transport Neutralizer Optical Total
Boulder (Fr) [35] 0.7 56 0.4Legnaro (Fr) [53] >50TRIUMF (K) [61] 0.06Los Alamos (Rb) [63] 30 0.3 0.09Los Alamos (Cs) [62] >95 45 3 1.4Stony Brook (Fr) [58] >90 52 3.4 2.0
2.3. Trapping efficiency for radioactive atoms
The efficiency can be decomposed into two contributions: the transfer efficiency fromproduction to the vapour cell and the optical trapping efficiency. The Boulder group uses adecay source, and the transport efficiency includes the extraction from the oven and introductioninto the vapour cell. They achieved an overall francium trapping efficiency of 0.4% [35]. Othergroups use atoms implanted in a target. The transfer efficiency includes the extraction, transportand neutralization efficiency in this case. The first one describes the ionization and extractionof the atoms from the target. The second one gives the electrostatic transport efficiency fromthe target to the neutralizer. The last one is the release of neutral atoms from the neutralizerinto the vapour cell. Table 1 shows the trapping efficiency obtained by different groups.The extraction efficiency for target experiments is not included. The Legnaro group is stilloptimizing its system which has a transport efficiency better than 50% [53]. The TRIUMFgroup has reported a total efficiency of 0.06% [61]. The rubidium trapping efficiency of theLos Alamos group is 0.09% [63], and they have improved it considerably for their caesium trapto reach 1.4% [62]. The second generation Stony Brook system [58] has reached a franciumtrapping efficiency of 2.0%. The improvement from the value previously reported comes froma detailed study of the losses due to aberrations in their imaging system that caused them tounderestimate the number of trapped atoms.
3. Spectroscopy of Fr
Atomic properties are sensitive to different ranges of the electron wave function. Measurementsof the location of energy levels, hyperfine splittings and atomic lifetimes are fundamental forunderstanding the atom quantitatively. The comparison between the state-of-the-art theoreticalab initio calculations and experiment tests the theoretical ability to predict a complicated atomand permits refinement of the calculational methods necessary for atomic PNC. The energylevels are the direct eigenvalues of the wave functions, but do not give detailed informationabout the r dependence of the wave function in a particular range. The radiative lifetime, τ ,depends on the matrix element of the dipole moment operator, er, spatially integrated with thewave functions of the two connected levels. It is most sensitive to large r properties, while thehyperfine interaction probes the wave functions at the nucleus (r ≈ 0).
A stringent test of atomic theory is the calculation of the lifetime of an electronic state. Thecalculation relies on having very good wave functions for all the levels involved. The lifetime τ
of an excited state is determined by its individual decay rates, 1/τi , through the matrix elementassociated with the ith partial decay rate. The connections between lifetime, partial decay
92 E Gomez et al
rates and matrix elements are1
τ=
∑i
1
τi
, (1)
1
τi
= 4
3
ω3
c2α
|〈J‖r‖J ′〉|22J ′ + 1
, (2)
where ω is the transition frequency, c is the speed of light, α is the fine-structure constant, J ′ andJ are respectively, the initial and final state angular momenta and |〈J‖r‖J ′〉| is the reducedmatrix element [32]. Equation (2) links the lifetime of an excited state to the electronic wavefunctions of the atom. The comparisons of measurements with theoretical predictions test thequality of the computed wave functions especially at large distances from the nucleus due tothe presence of the radial operator.
3.1. Experiments
The Boulder group used their francium MOT to perform measurements on the 7p levels of221Fr while the Stony Brook group has studied the spectroscopy of francium in a MOT on-linewith an accelerator. The captured atoms are confined for long periods of time in a small volumemoving at low velocity, an ideal environment for precision spectroscopy. The Stony Brookinvestigations includes the location of the 8s, 9s and 7d energy levels. The 8s energy level, notobserved before, is a prime candidate for use in a PNC experiment. A set of measurements ofradiative lifetimes includes the 7p, 8p, 8s, 9s and 7d levels in francium. The measurement ofthe hyperfine splitting of the 7P1/2 level in a series of isotopes was used to extract informationon the nuclear magnetization through the Bohr Weisskopf effect [64] (hyperfine anomaly).The precision achieved in lifetime measurements of the 7P1/2 and 7P3/2 levels is comparableto that achieved in stable atoms and permits direct comparison with ab initio calculations of theappropriate matrix elements. The measurements on the 7d levels help extend the knowledge ofthis class of atomic wave functions in which correlation effects are very significant. The mea-surements test atomic theory in a heavy atom where relativistic and correlation effects are large.
3.1.1. Energy levels. The work on francium at ISOLDE located many of the energy levels andmeasured their hyperfine splittings [38]. The nuclear structure parameters extracted from thesemeasurements have been very valuable. The short interaction time available at ISOLDE limitedsignificantly the possible manipulation of the states. The long interaction times achievablein a MOT facilitate the study of the low lying levels in francium by multiphoton excitation.Tables 7 and 8 in the appendix contain an extended summary of the energy levels measured in Fr.
The approach to find an energy level requires the preparation of a cold sample of atomsin a MOT. Then it is necessary to find the appropriate path to reach the level. To measurethe location of a level it is necessary to find a clean signature that is identifiable fromthe background. The signatures can be changes in the MOT fluorescence when the atomsare excited to another state, fluorescence at a very different energy than that used to excite theatom as it decays down to the ground state or even delayed fluorescence at the same excitationenergy. Each one of these methods has advantages and disadvantages, and it is common to usethem in combination with lock-in detection. The measurement usually requires very strongbackground rejection. Calibrated wavemeters allow simultaneous record of the energy of theexciting light with the fluorescence signal, but the iodine molecule atlas [54] has also beenused for this purpose.
Theoretical calculations can guide the search for an excited state. Ab initio energy levelcalculations have expected accuracies of about 25 cm−1 which makes for a very large frequency
Spectroscopy with trapped francium 93
F=15/2F=13/2
433 nm
423 nm
851 nm
F=11/2
F=13/2
F=11/2
F=13/2
Repump
8P3/2
8P1/2
7P3/2
9S1/2
7S1/2
Trap
718 nm
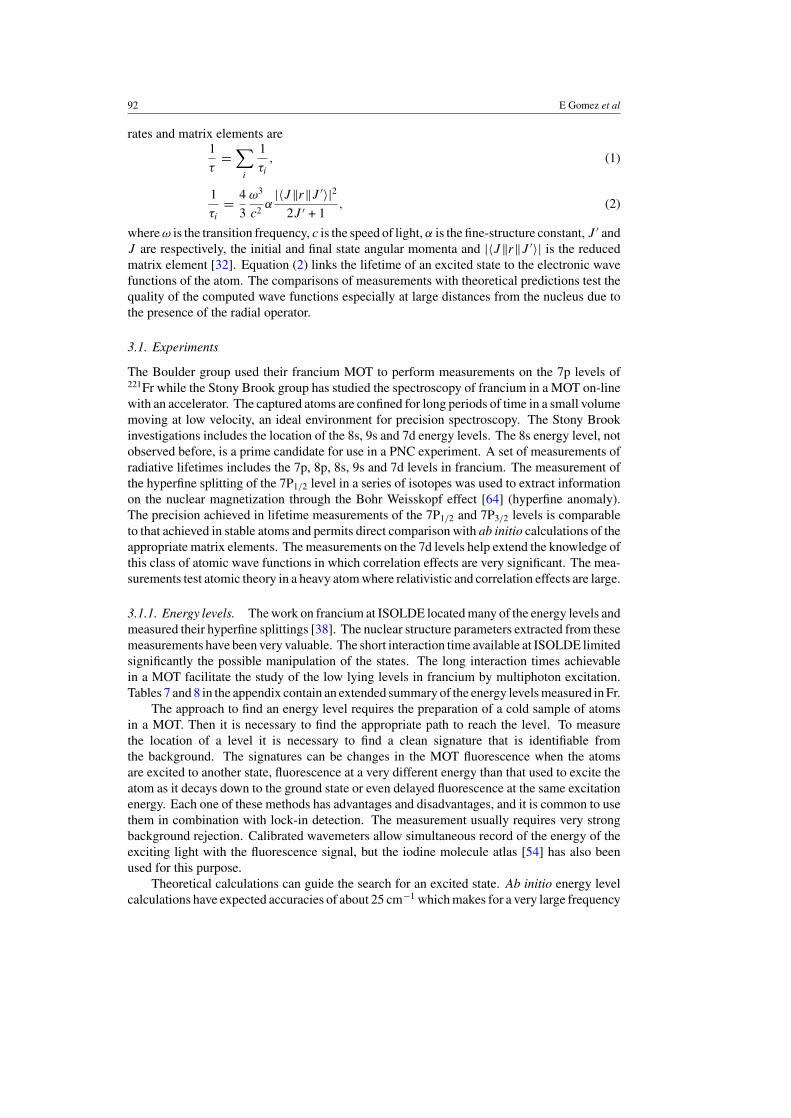
Figure 9. Diagram of energy levels of 210Fr relevant for trapping and two-photon excitation of the9s level (figure from [26]).
scan. However, once some levels with the same angular momentum have been measured, as isthe case for the s and d series in francium [38, 40], a quantum defect fit can make predictionsthat reach accuracies of 1 cm−1. The quantum defect is a semi-empirical approach to predictingenergy levels. It assumes that the levels follow the Rydberg formula, but the principal quantumnumber may be different, by the quantum deffect, from the appropriate integer. The paper byDrake and Swainson [65] explains the method and the physical interpretation of the differentapproximations.
When using a MOT for spectroscopic measurements it is important to consider the Autler–Townes splitting [66] of the excited states because of the presence of the strong laser that doesthe trapping and cooling. This splitting opens two possible avenues of excitation only a fewmegahertz apart.
9s level. Figure 9 shows the relevant levels necessary for excitation and detection of the 9slevel [26]. The Stony Brook group used a quantum defect fit to narrow their search. Theyexcited the atoms via a two step process (7S1/2 → 7P3/2 → 9S1/2). The trapping laserprovided the first photon and a narrow-linewidth diode laser operating at 851 nm provided thesecond. To locate the resonance a very clear signature, independent of background, came fromblue photons at 433 and 423 nm as the atom decayed from the 9s state via the 8P3/2 and 8P1/2
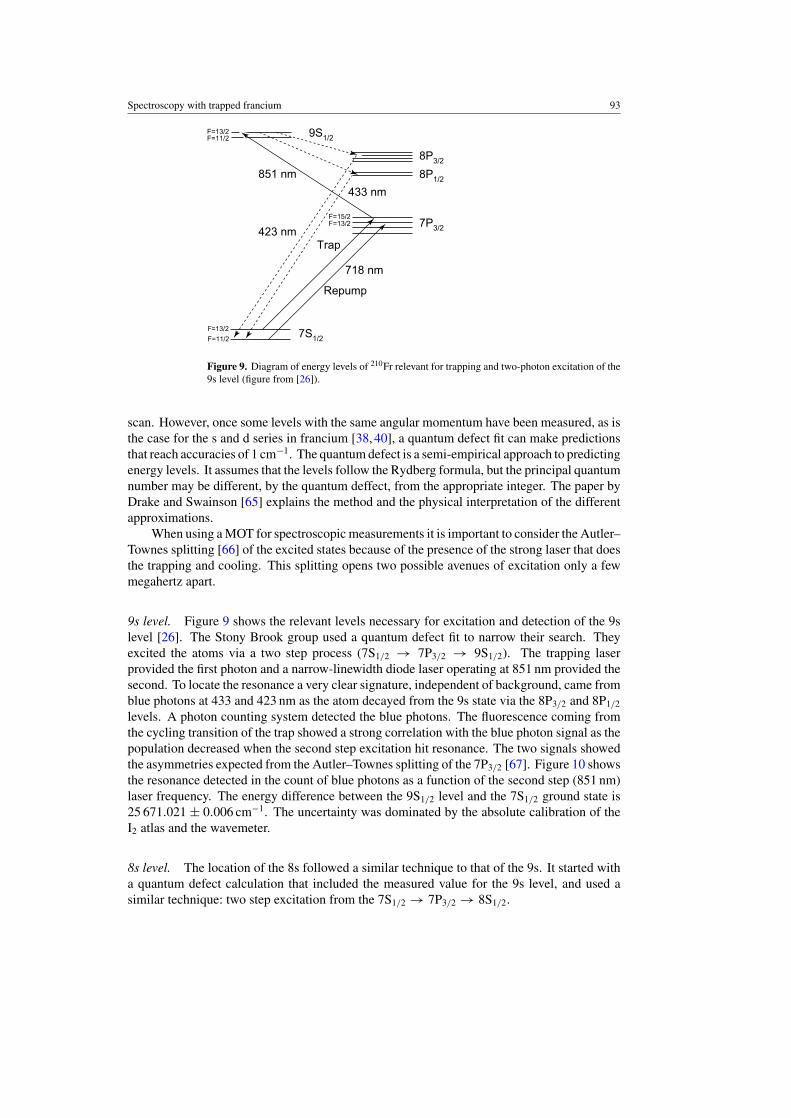
levels. A photon counting system detected the blue photons. The fluorescence coming fromthe cycling transition of the trap showed a strong correlation with the blue photon signal as thepopulation decreased when the second step excitation hit resonance. The two signals showedthe asymmetries expected from the Autler–Townes splitting of the 7P3/2 [67]. Figure 10 showsthe resonance detected in the count of blue photons as a function of the second step (851 nm)laser frequency. The energy difference between the 9S1/2 level and the 7S1/2 ground state is25 671.021 ± 0.006 cm−1. The uncertainty was dominated by the absolute calibration of theI2 atlas and the wavemeter.
8s level. The location of the 8s followed a similar technique to that of the 9s. It started witha quantum defect calculation that included the measured value for the 9s level, and used asimilar technique: two step excitation from the 7S1/2 → 7P3/2 → 8S1/2.
94 E Gomez et al
2500
3000
3500
4000
-50 -40 -30 -20 -10 0 10 20 30 40 50
Cou
nts
851 nm Laser Detuning (MHz)
Figure 10. Blue photons from the 9s resonance of Fr as a function of the 851 nm laser. The zeroof the scan corresponds to 11 746.978 ± 0.003 cm−1. The continuous line is a running average toguide the eye (figure adapted from [26]).
The Stony Brook group used two different levels, 7P3/2 or 7P1/2, for the first step to the8S1/2 level (see figure 4). Only the 8S1/2, F = 13/2 can be reached with an electric dipoleallowed transition when the 7P3/2, F = 15/2 is the intermediate level. A 1.7 µm laser couldexcite this transition. Both the 8S1/2 hyperfine states can be reached when the 7P1/2, F = 13/2is the intermediate state. A 1.3 µm laser could excite these transitions. The excitation with the1.7 µm laser allowed detection of the resonance in two different ways. Observation of photonsat 817 nm indicated that the atom decayed from the 8s state via the 7P1/2 levels, and a decreasein the cycling transition fluorescence indicated that some fraction of the population had beentransferred to the 8S1/2 level.
The centre of gravity energy difference between the 7S1/2 ground level and the 8S1/2 level is19 732.523±0.004 cm−1. The hyperfine separation of the 8S1/2, F = 11/2 and F = 13/2 statesis 10 256 ± 7 MHz giving a magnetic dipole hyperfine constant A of 1577.8 ± 1.1 MHz [27].The uncertainty in these measurements was dominated by the accuracy of the wavemeter.
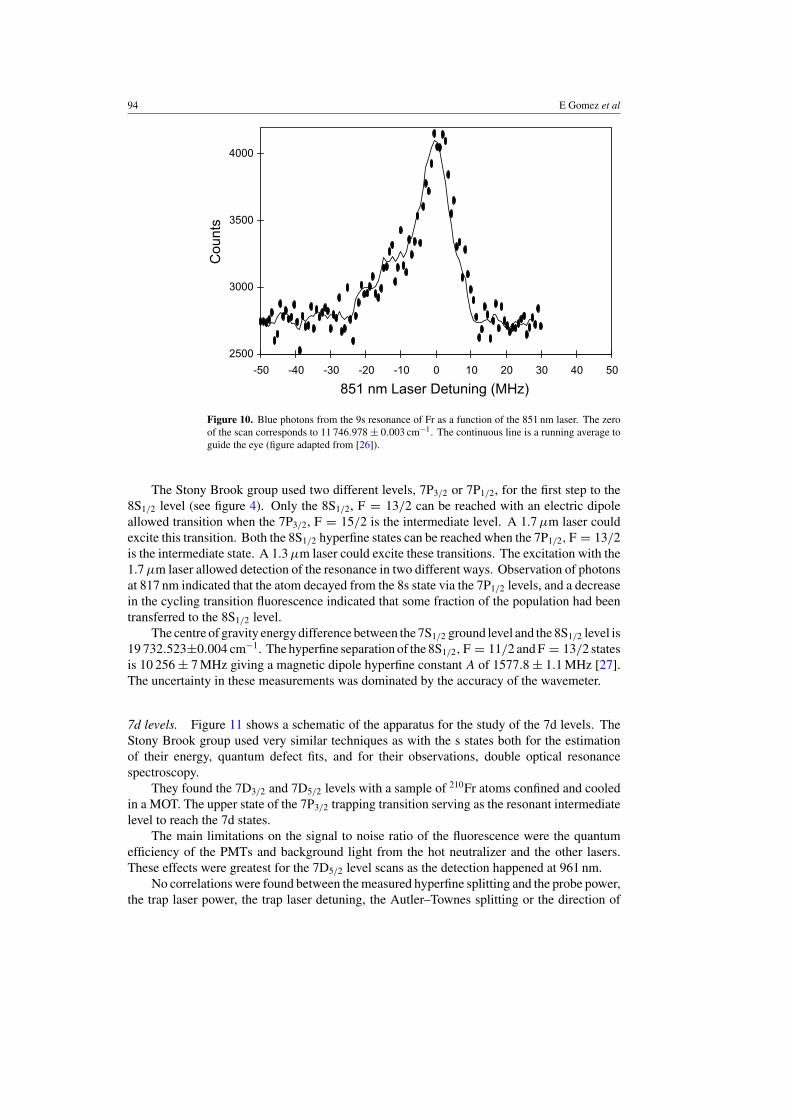
7d levels. Figure 11 shows a schematic of the apparatus for the study of the 7d levels. TheStony Brook group used very similar techniques as with the s states both for the estimationof their energy, quantum defect fits, and for their observations, double optical resonancespectroscopy.
They found the 7D3/2 and 7D5/2 levels with a sample of 210Fr atoms confined and cooledin a MOT. The upper state of the 7P3/2 trapping transition serving as the resonant intermediatelevel to reach the 7d states.
The main limitations on the signal to noise ratio of the fluorescence were the quantumefficiency of the PMTs and background light from the hot neutralizer and the other lasers.These effects were greatest for the 7D5/2 level scans as the detection happened at 961 nm.
No correlations were found between the measured hyperfine splitting and the probe power,the trap laser power, the trap laser detuning, the Autler–Townes splitting or the direction of
Spectroscopy with trapped francium 95
961 nm969
WavemeterLaserLock
817 nm
718 nm
Probe
Repump
Trap
AMEOM
632 nmHe-Ne
Fabry-Perot
AMEOM
Figure 11. Block diagram of the apparatus for the measurement of the location of the 7d levels.The probe lite is amplitude modulated (AM) with two electro-optic modulators (EOM) in tandem(figure from [29]).
Table 2. Hyperfine splittings, hyperfine constants and energies from the ground state of the 7dlevels of 210Fr. Grossman et al [29].
�(7D3/2, F = 15/2 ←→ 13/2) 167 ± 4 MHz�(7D5/2, F = 17/2 ←→ 15/2) −117.5 ± 2.5 MHzA(7D3/2) 22.3 ± 0.5 MHzB(7D3/2) 0 (assumed)A(7D5/2) −17.8 ± 0.8 MHzB(7D5/2) 64.0 ± 17.0 MHzEnergy(7D3/2) 24 244.831 ± 0.003 cm−1
Energy(7D5/2) 24 333.298 ± 0.003 cm−1
�Efine(7d) 88.467 ± 0.004 cm−1
the probe scan. The results are summarized in table 2. To obtain the centre of gravity forthe energy from the ground state they assumed B(7D3/2) = 0 and extrapolated the energiesof the inaccessible hyperfine levels from the hyperfine constants. The uncertainties in thehyperfine constants were dominated by statistics, while the calibration of the wavemeterdominated the uncertainty in the location of the centre of gravity of the transition energy.
3.1.2. 221Fr 7p levels. The Wieman group has made spectroscopic measurements on 221Fr intheir apparatus. In the thermal vapour, they measured the hyperfine splittings of the 7P3/2 and7P1/2 levels. They observed the individual hyperfine transitions by scanning the 718 nm laser,while the 817 nm laser was set (to either the F = 2 → F ′ = 3 or F = 2 → F ′ = 2 transition)to select one velocity group of atoms. They obtained the splittings by measuring the frequencydifferences between each hyperfine line using a high-resolution λ metre (accuracy of 3 MHz forsmall differences and 50 MHz for absolute frequency checked against the I2 Atlas [54]). Theyalso measured the absolute values of the D1 and D2 lines. The uncertainties in the hyperfineconstants A and B are better than previously published numbers [40,68] by more than a factorof three. Table 3 presents a summary of their measurements. The uncertainty is dominated bythe accuracy of their wavemeter.
96 E Gomez et al
Table 3. Hyperfine constants and wave numbers of the 7p level of 221Fr. Lu et al [35].
A(7P3/2) 66.5 ± 0.9 MHzB(7P3/2) −260 ± 4.8 MHzA(7P1/2) 811.0 ± 1.3 MHzEnergy(7P1/2) 12 236.6579 ± 0.0017 cm−1
Energy(7P3/2) 13 923.2041 ± 0.0017 cm−1
0.00
0.10
0.20
0.30
0.40
0.50
Normalized radius (r/R)
P(r
)(nu
cleu
s)
0.85
0.90
0.95
1.00
1.05
P(r
)(el
ectr
on)
π h9/2
ν f5/2
ν p1/2
e 7S1/2
e 7P1/2
0.0 1.00.2 0.4 0.6 0.8
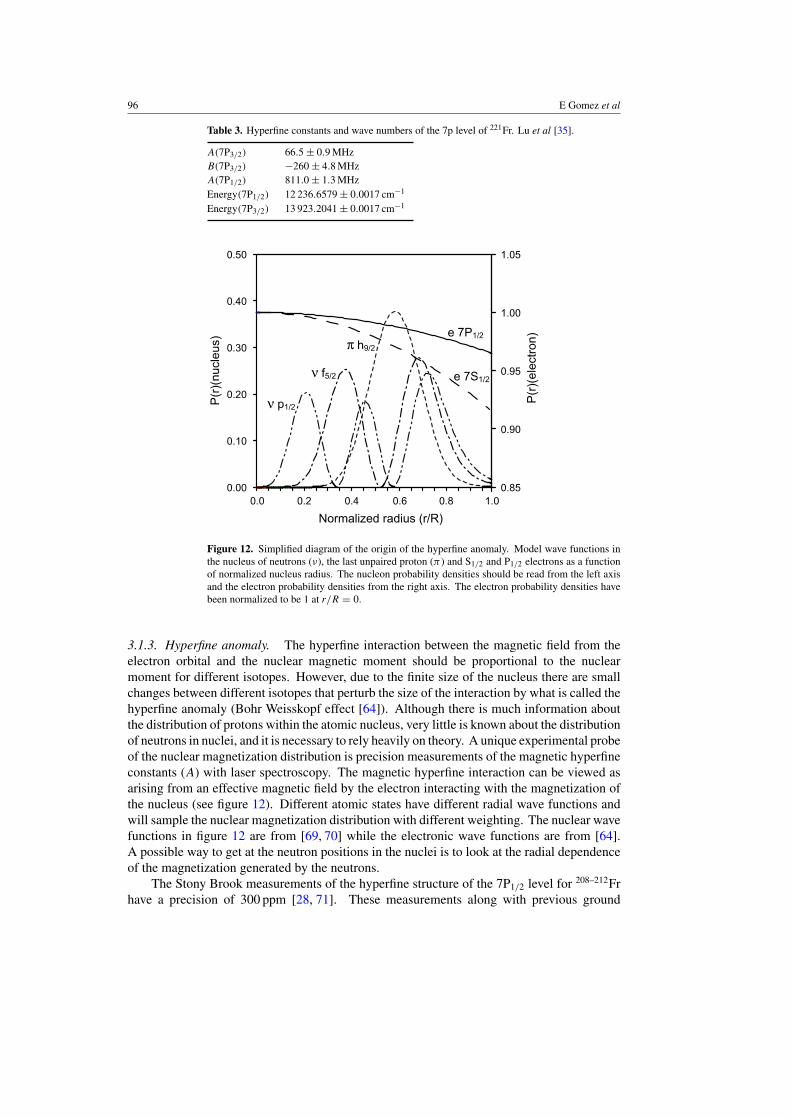
Figure 12. Simplified diagram of the origin of the hyperfine anomaly. Model wave functions inthe nucleus of neutrons (ν), the last unpaired proton (π ) and S1/2 and P1/2 electrons as a functionof normalized nucleus radius. The nucleon probability densities should be read from the left axisand the electron probability densities from the right axis. The electron probability densities havebeen normalized to be 1 at r/R = 0.
3.1.3. Hyperfine anomaly. The hyperfine interaction between the magnetic field from theelectron orbital and the nuclear magnetic moment should be proportional to the nuclearmoment for different isotopes. However, due to the finite size of the nucleus there are smallchanges between different isotopes that perturb the size of the interaction by what is called thehyperfine anomaly (Bohr Weisskopf effect [64]). Although there is much information aboutthe distribution of protons within the atomic nucleus, very little is known about the distributionof neutrons in nuclei, and it is necessary to rely heavily on theory. A unique experimental probeof the nuclear magnetization distribution is precision measurements of the magnetic hyperfineconstants (A) with laser spectroscopy. The magnetic hyperfine interaction can be viewed asarising from an effective magnetic field by the electron interacting with the magnetization ofthe nucleus (see figure 12). Different atomic states have different radial wave functions andwill sample the nuclear magnetization distribution with different weighting. The nuclear wavefunctions in figure 12 are from [69, 70] while the electronic wave functions are from [64].A possible way to get at the neutron positions in the nuclei is to look at the radial dependenceof the magnetization generated by the neutrons.
The Stony Brook measurements of the hyperfine structure of the 7P1/2 level for 208–212Frhave a precision of 300 ppm [28, 71]. These measurements along with previous ground
Spectroscopy with trapped francium 97
208 209 210 211 212Isotope
7.59
7.61
7.63
r=A
(7S 1
/2)/
A(7
P 1/2)
0.1%
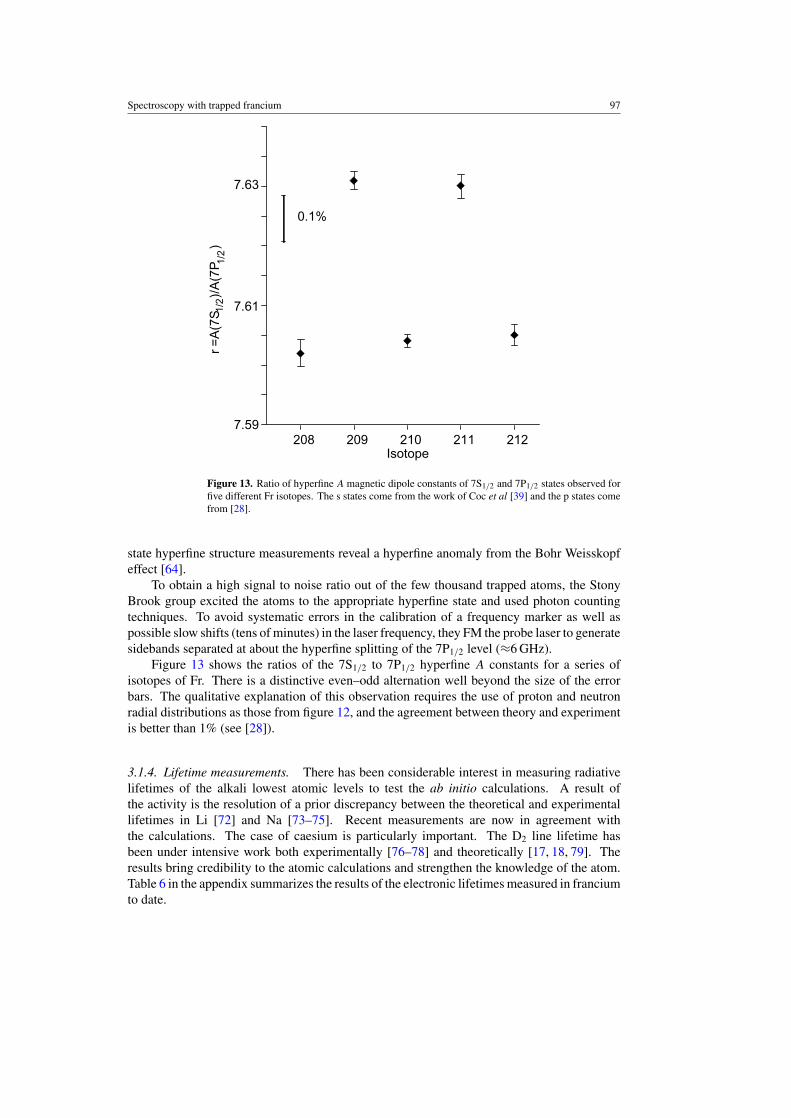
Figure 13. Ratio of hyperfine A magnetic dipole constants of 7S1/2 and 7P1/2 states observed forfive different Fr isotopes. The s states come from the work of Coc et al [39] and the p states comefrom [28].
state hyperfine structure measurements reveal a hyperfine anomaly from the Bohr Weisskopfeffect [64].
To obtain a high signal to noise ratio out of the few thousand trapped atoms, the StonyBrook group excited the atoms to the appropriate hyperfine state and used photon countingtechniques. To avoid systematic errors in the calibration of a frequency marker as well aspossible slow shifts (tens of minutes) in the laser frequency, they FM the probe laser to generatesidebands separated at about the hyperfine splitting of the 7P1/2 level (≈6 GHz).
Figure 13 shows the ratios of the 7S1/2 to 7P1/2 hyperfine A constants for a series ofisotopes of Fr. There is a distinctive even–odd alternation well beyond the size of the errorbars. The qualitative explanation of this observation requires the use of proton and neutronradial distributions as those from figure 12, and the agreement between theory and experimentis better than 1% (see [28]).
3.1.4. Lifetime measurements. There has been considerable interest in measuring radiativelifetimes of the alkali lowest atomic levels to test the ab initio calculations. A result ofthe activity is the resolution of a prior discrepancy between the theoretical and experimentallifetimes in Li [72] and Na [73–75]. Recent measurements are now in agreement withthe calculations. The case of caesium is particularly important. The D2 line lifetime hasbeen under intensive work both experimentally [76–78] and theoretically [17, 18, 79]. Theresults bring credibility to the atomic calculations and strengthen the knowledge of the atom.Table 6 in the appendix summarizes the results of the electronic lifetimes measured in franciumto date.
98 E Gomez et al
The most intuitive way to measure an atomic lifetime is to excite the atoms and recordthe exponential decay of the fluorescence as a function of time. It is important to have aquantitative understanding of the measurement equipment. To measure a time interval, thetime scale must be precisely calibrated.
In time-correlated single-photon counting a laser repetitively excites the atoms and a fixedposition detector collects the fluorescence as a function of time [80]. The atoms move slowlyso that the solid-angle for the fluorescence collection is constant. The method relies on fastelectronics to precisely record the time interval for detection events. Count rates are low toprevent the dead-time effects in the electronics and the preferential counting of early events.Low particle densities are necessary to minimize radiation trapping and quenching effects dueto collisions. Advantages of the method include good statistics and less sensitivity to thedivergence of the atomic source.
The Stony Brook approach to measure lifetimes utilized the limited number of available210Fr efficiently. The preparation of the state to measure required moving population withdepumping and repumping pulses. Their order and intensity can be critical for the success ofthe measurement. The rejection of background light needed careful timing, interference filtersand good imaging. When fast pulses were not available, it was necessary to deconvolve thefull excitation function for the extraction of the lifetime.
All data were first corrected for pulse pile-up to compensate the fact that the early eventsare preferentially counted [80]. Then the data were fit to the appropriate decaying function.The results of fits can show sensitivity to the beginning or ending position of the sample causinga so-called truncation error [77].
Among the systematic effects that may be present in lifetime measurements performed in aMOT are hyperfine and Zeeman quantum beats. Their presence, even when small, could modifythe result slightly. It is possible to bound their size using a worst case scenario considering themaximum magnetic field present. All the lifetime measurements performed at Stony Brookhave such a contribution to the error budget.
7p levels. Two electro-optic modulators (EOM) turned off the trapping laser at 718 nm whichprovided the excitation for the 7P3/2 lifetime measurement. The 718 nm trapping laser was oncontinuously for the 7P1/2 measurement. A second laser at 817 nm repumped the atoms onthe 7S1/2, F = 11/2 → 7P1/2, F = 13/2 transition. The repumping laser, chopped with theEOMs, provided the excitation for the 7P1/2 lifetime measurement. The lifetime measurementof the 7P1/2 level required a way to actively transfer population (depumper laser) from theF = 13/2 state to the F = 11/2 of the 7S1/2 ground state. See figure 14 for a diagram of thetiming sequences for the two measurements.
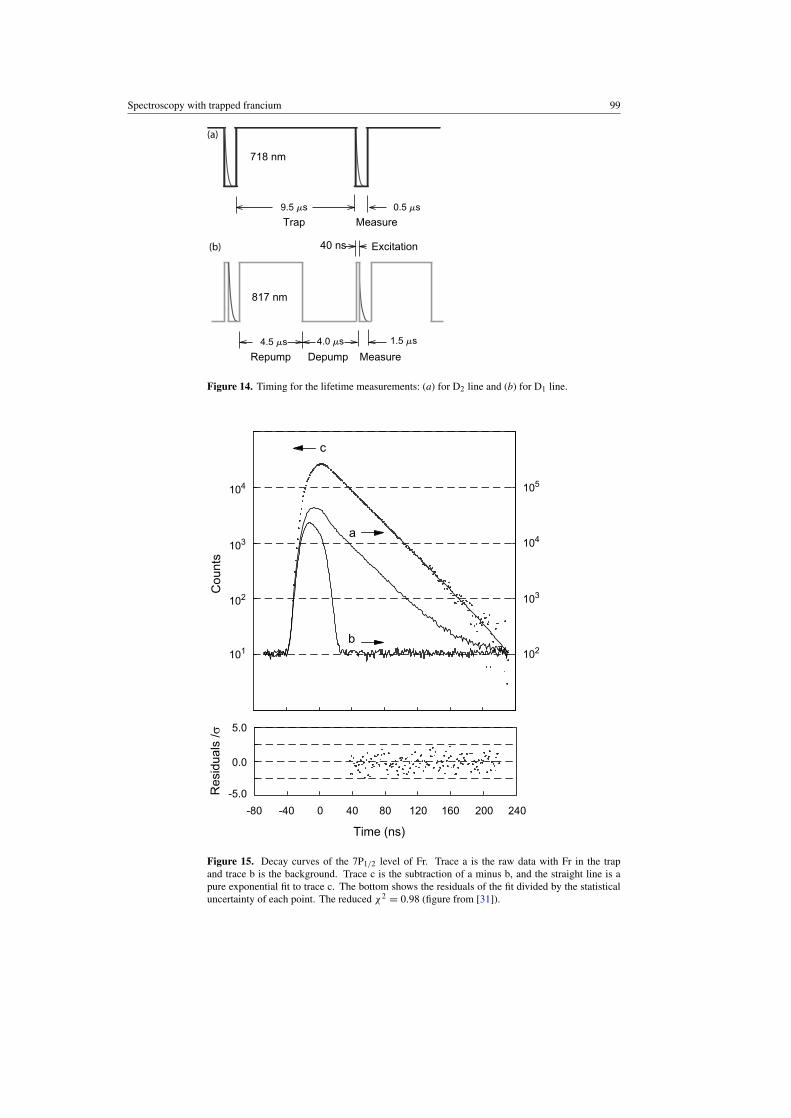
A data set consisted of ≈1 × 10⁵ fluorescence counts/channel accumulated with atomsin the trap in about 20 min (see figure 15(a)). A background count was taken for the samelength of time with the trapping laser frequency off resonance so that there were no atoms inthe trap. The background data set gave the excitation function for the atoms (see figure 15(b)).In case there was background from the radiation associated with the nuclear reaction, the100 MeV 18O beam was on the target while accumulating the signal and background data set.The subtraction of the background from the signal sets gave the data which is the exponentialdecay of the fluorescence for ≈5 lifetimes (see figure 15(c)).
The number of atoms in the trap was small (N ≈ 1000), and the typical diameter of thetrap was �1 mm. This minimized the possibility of multiple absorption. The unobservedcontribution of Zeeman quantum beats could at most contribute by 0.01% to the total lifetime.
To search for other possible shifts in the lifetime, the Stony Brook group measured thelifetime of the 5P3/2 level of 87Rb using exactly the same apparatus and technique. With Rb in
Spectroscopy with trapped francium 99
(a)
MeasureTrap
718 nm
817 nm
Excitation40 ns
DepumpRepump Measure4.5 ms
(b)
4.0 ms 1.5 ms
0.5 ms9.5 ms
Figure 14. Timing for the lifetime measurements: (a) for D2 line and (b) for D1 line.
Cou
nts
Time (ns)
Res
idua
ls /σ
a
c
b
104
103
102
101
104
103
102
105
5.0
0.0
-5.0
-80 -40 0 40 80 120 160 200 240
Figure 15. Decay curves of the 7P1/2 level of Fr. Trace a is the raw data with Fr in the trapand trace b is the background. Trace c is the subtraction of a minus b, and the straight line is apure exponential fit to trace c. The bottom shows the residuals of the fit divided by the statisticaluncertainty of each point. The reduced χ2 = 0.98 (figure from [31]).
100 E Gomez et al
29.0 29.5 30.0 30.5
20.5 21.0 21.5 22.5
Experiment
Simsarian
Dzuba et al (1995)
Johnson et al (1996)
7P1/2 lifetime (ns)
7P3/2 lifetime (ns)
Theory (1997)
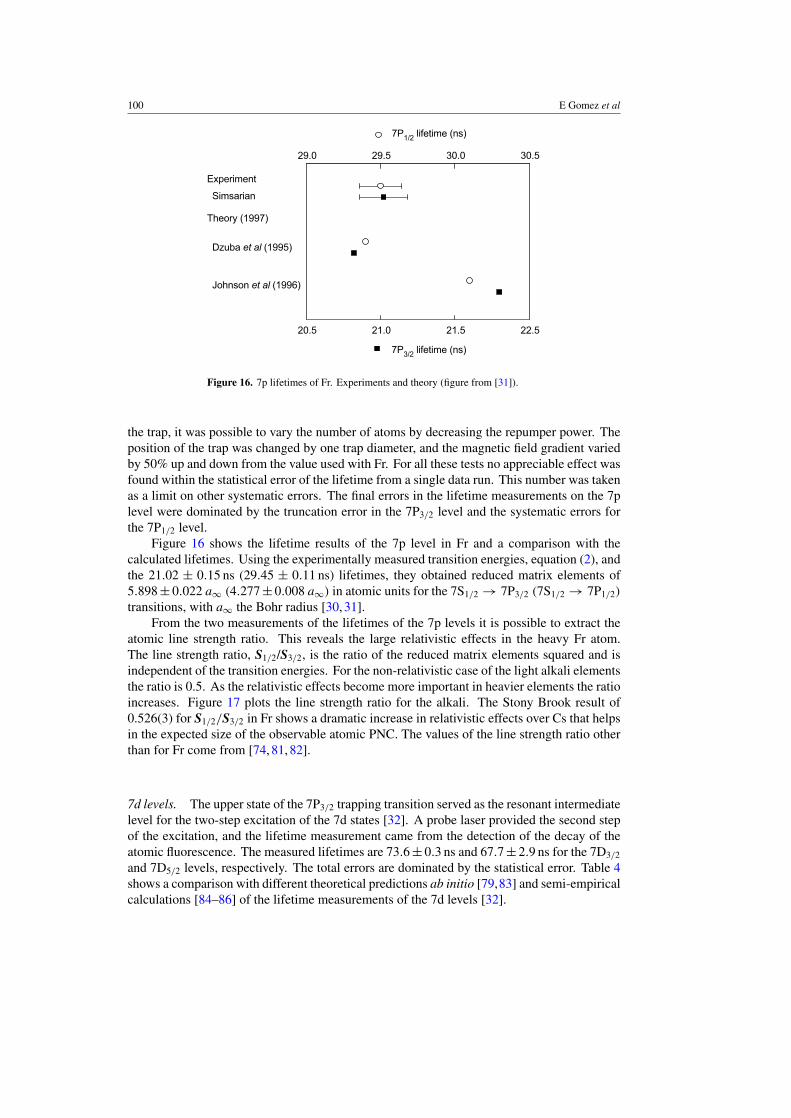
Figure 16. 7p lifetimes of Fr. Experiments and theory (figure from [31]).
the trap, it was possible to vary the number of atoms by decreasing the repumper power. Theposition of the trap was changed by one trap diameter, and the magnetic field gradient variedby 50% up and down from the value used with Fr. For all these tests no appreciable effect wasfound within the statistical error of the lifetime from a single data run. This number was takenas a limit on other systematic errors. The final errors in the lifetime measurements on the 7plevel were dominated by the truncation error in the 7P3/2 level and the systematic errors forthe 7P1/2 level.
Figure 16 shows the lifetime results of the 7p level in Fr and a comparison with thecalculated lifetimes. Using the experimentally measured transition energies, equation (2), andthe 21.02 ± 0.15 ns (29.45 ± 0.11 ns) lifetimes, they obtained reduced matrix elements of5.898 ± 0.022 a∞ (4.277 ± 0.008 a∞) in atomic units for the 7S1/2 → 7P3/2 (7S1/2 → 7P1/2)
transitions, with a∞ the Bohr radius [30, 31].From the two measurements of the lifetimes of the 7p levels it is possible to extract the
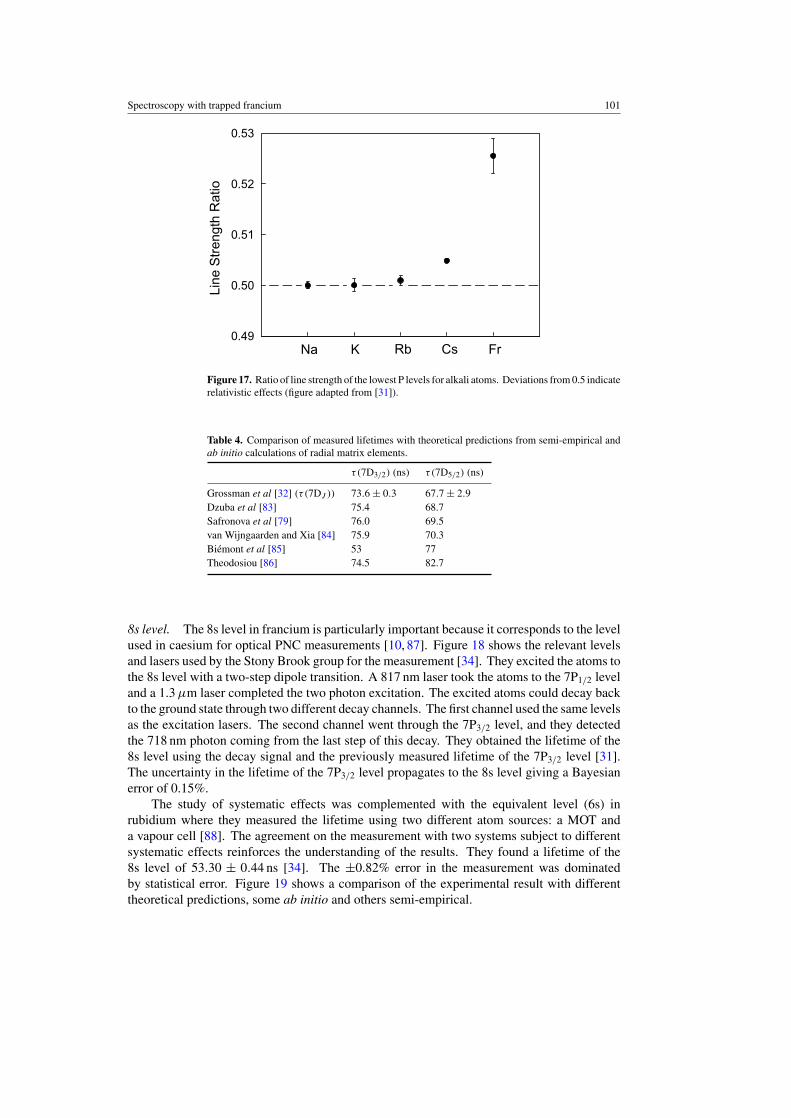
atomic line strength ratio. This reveals the large relativistic effects in the heavy Fr atom.The line strength ratio, S1/2/S3/2, is the ratio of the reduced matrix elements squared and isindependent of the transition energies. For the non-relativistic case of the light alkali elementsthe ratio is 0.5. As the relativistic effects become more important in heavier elements the ratioincreases. Figure 17 plots the line strength ratio for the alkali. The Stony Brook result of0.526(3) for S1/2/S3/2 in Fr shows a dramatic increase in relativistic effects over Cs that helpsin the expected size of the observable atomic PNC. The values of the line strength ratio otherthan for Fr come from [74, 81, 82].
7d levels. The upper state of the 7P3/2 trapping transition served as the resonant intermediatelevel for the two-step excitation of the 7d states [32]. A probe laser provided the second stepof the excitation, and the lifetime measurement came from the detection of the decay of theatomic fluorescence. The measured lifetimes are 73.6 ± 0.3 ns and 67.7 ± 2.9 ns for the 7D3/2
and 7D5/2 levels, respectively. The total errors are dominated by the statistical error. Table 4shows a comparison with different theoretical predictions ab initio [79,83] and semi-empiricalcalculations [84–86] of the lifetime measurements of the 7d levels [32].
Spectroscopy with trapped francium 101
0.49
0.50
0.51
0.52
0.53
K Rb Cs Fr
Line
Str
engt
h R
atio
Na
Figure 17. Ratio of line strength of the lowest P levels for alkali atoms. Deviations from 0.5 indicaterelativistic effects (figure adapted from [31]).
Table 4. Comparison of measured lifetimes with theoretical predictions from semi-empirical andab initio calculations of radial matrix elements.
τ(7D3/2) (ns) τ(7D5/2) (ns)
Grossman et al [32] (τ (7DJ )) 73.6 ± 0.3 67.7 ± 2.9Dzuba et al [83] 75.4 68.7Safronova et al [79] 76.0 69.5van Wijngaarden and Xia [84] 75.9 70.3Biemont et al [85] 53 77Theodosiou [86] 74.5 82.7
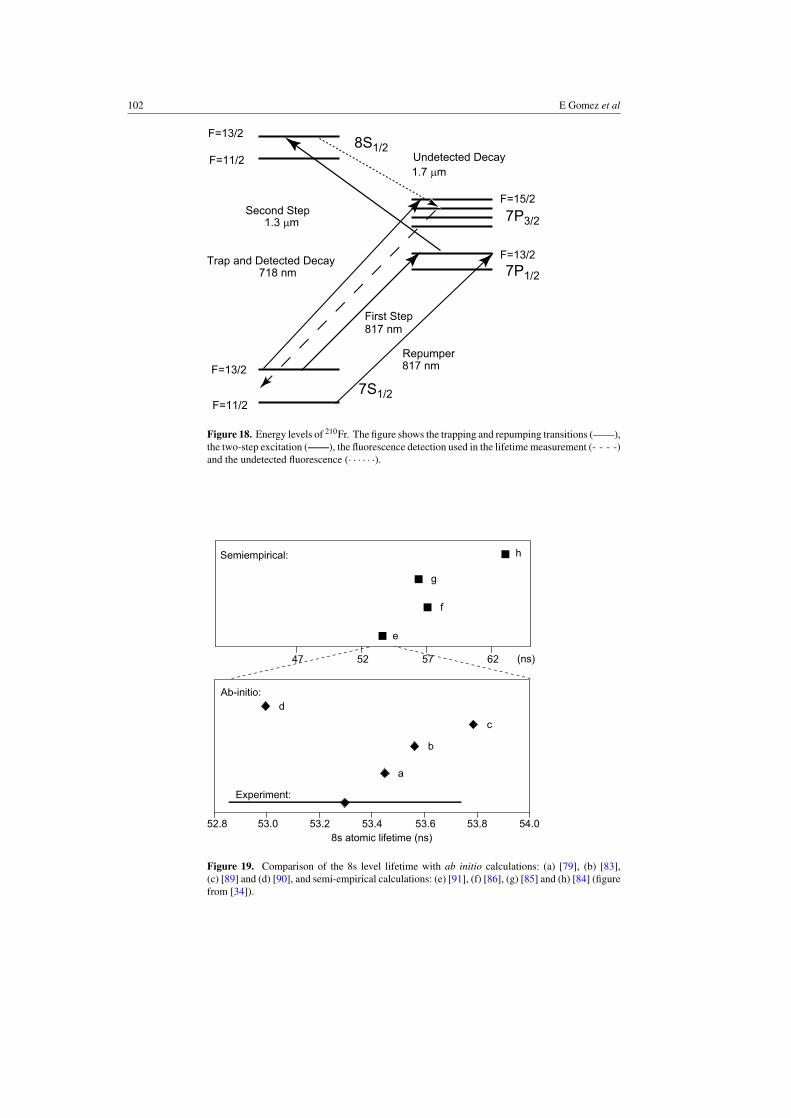
8s level. The 8s level in francium is particularly important because it corresponds to the levelused in caesium for optical PNC measurements [10, 87]. Figure 18 shows the relevant levelsand lasers used by the Stony Brook group for the measurement [34]. They excited the atoms tothe 8s level with a two-step dipole transition. A 817 nm laser took the atoms to the 7P1/2 leveland a 1.3 µm laser completed the two photon excitation. The excited atoms could decay backto the ground state through two different decay channels. The first channel used the same levelsas the excitation lasers. The second channel went through the 7P3/2 level, and they detectedthe 718 nm photon coming from the last step of this decay. They obtained the lifetime of the8s level using the decay signal and the previously measured lifetime of the 7P3/2 level [31].The uncertainty in the lifetime of the 7P3/2 level propagates to the 8s level giving a Bayesianerror of 0.15%.
The study of systematic effects was complemented with the equivalent level (6s) inrubidium where they measured the lifetime using two different atom sources: a MOT anda vapour cell [88]. The agreement on the measurement with two systems subject to differentsystematic effects reinforces the understanding of the results. They found a lifetime of the8s level of 53.30 ± 0.44 ns [34]. The ±0.82% error in the measurement was dominatedby statistical error. Figure 19 shows a comparison of the experimental result with differenttheoretical predictions, some ab initio and others semi-empirical.
102 E Gomez et al
F=13/2
F=11/2
F=13/2
F=11/2
8S1/2
817 nm
718 nm
7P3/2
7P1/2
7S1/2
F=15/2
F=13/2
1.7 µm
1.3 µm
First Step
Repumper
Trap and Detected Decay
Second Step
Undetected Decay
817 nm
Figure 18. Energy levels of 210Fr. The figure shows the trapping and repumping transitions (——),the two-step excitation (——), the fluorescence detection used in the lifetime measurement (- - - -)and the undetected fluorescence (· · · · · ·).
47 52 57 62
53.0 53.2 53.4 53.6 53.8 54.052.8
a
b
c
e
f
g
hSemiempirical:
Ab-initio:
Experiment:
(ns)
8s atomic lifetime (ns)
d
Figure 19. Comparison of the 8s level lifetime with ab initio calculations: (a) [79], (b) [83],(c) [89] and (d) [90], and semi-empirical calculations: (e) [91], (f) [86], (g) [85] and (h) [84] (figurefrom [34]).
Spectroscopy with trapped francium 103
F=15/2F=13/2
433 nm
F=11/2
F=13/2F=11/2
F=13/2
Repump
9S1/2
Trap
Depump
744 nm
817 nm
718
nm
7S1/2
7P1/2
7P3/2
8P3/2
8P1/2
423 nm
Figure 20. Energy levels and decay channels of 210Fr involved in the decay of the 9s and 8p levels.The solid line arrows represent the excitation lasers relevant to the measurements of the 9S1/2,8P3/2 and 8P1/2 lifetimes. The dashed line arrows represent the decay path used in the lifetimemeasurement of the 8p levels (figure from [92]).
100
120
107
109
Experiment Dipole Matrix Calculations Semiempirical
108
110
106
9S li
fetim
e (n
s)
a
b
c
d
e
f
Figure 21. Comparison of the measured 9S1/2 level lifetime with theoretical predictions from radialmatrix elements: (a) [79], (b) [94], (c) [91], and semi-empirical calculations: (d) [84], (e) [85],(f) [86] (figure from [33]).
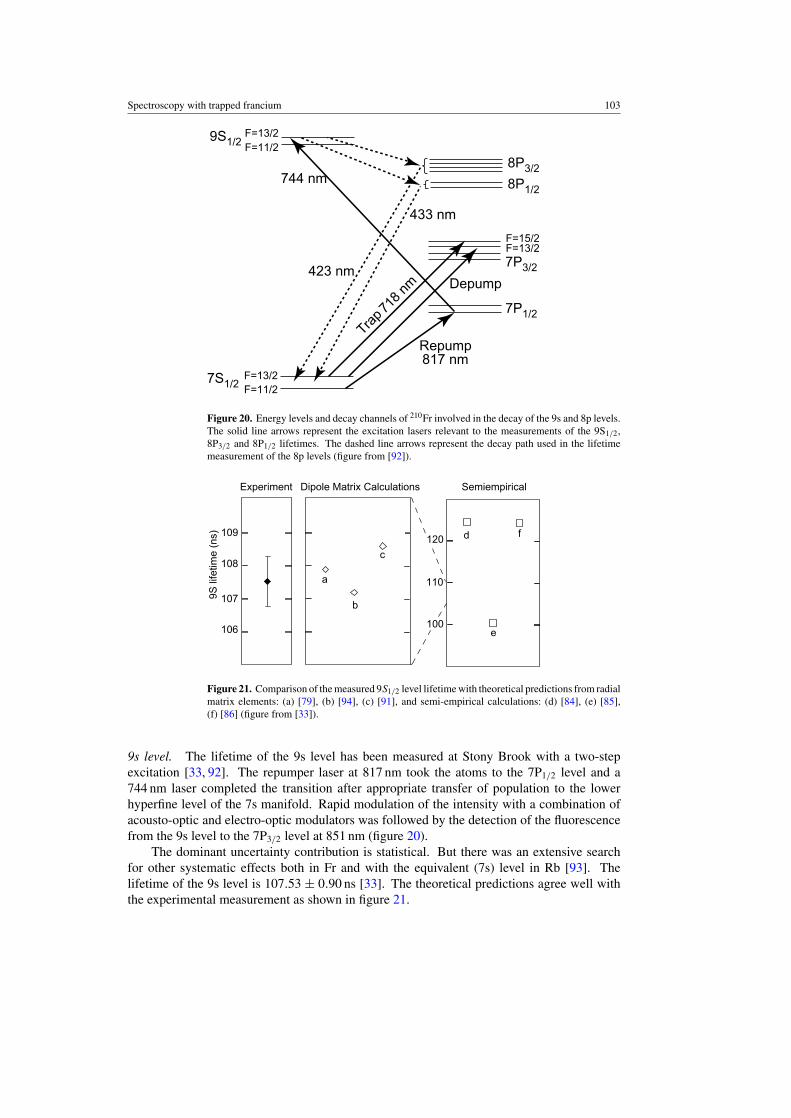
9s level. The lifetime of the 9s level has been measured at Stony Brook with a two-stepexcitation [33, 92]. The repumper laser at 817 nm took the atoms to the 7P1/2 level and a744 nm laser completed the transition after appropriate transfer of population to the lowerhyperfine level of the 7s manifold. Rapid modulation of the intensity with a combination ofacousto-optic and electro-optic modulators was followed by the detection of the fluorescencefrom the 9s level to the 7P3/2 level at 851 nm (figure 20).
The dominant uncertainty contribution is statistical. But there was an extensive searchfor other systematic effects both in Fr and with the equivalent (7s) level in Rb [93]. Thelifetime of the 9s level is 107.53 ± 0.90 ns [33]. The theoretical predictions agree well withthe experimental measurement as shown in figure 21.
104 E Gomez et al
8P3/
2 li
fetim
e (n
s)84
85
83
82
100
80
60
a
b
c
d
e
ExperimentDipole MatrixCalculations Semi-empirical
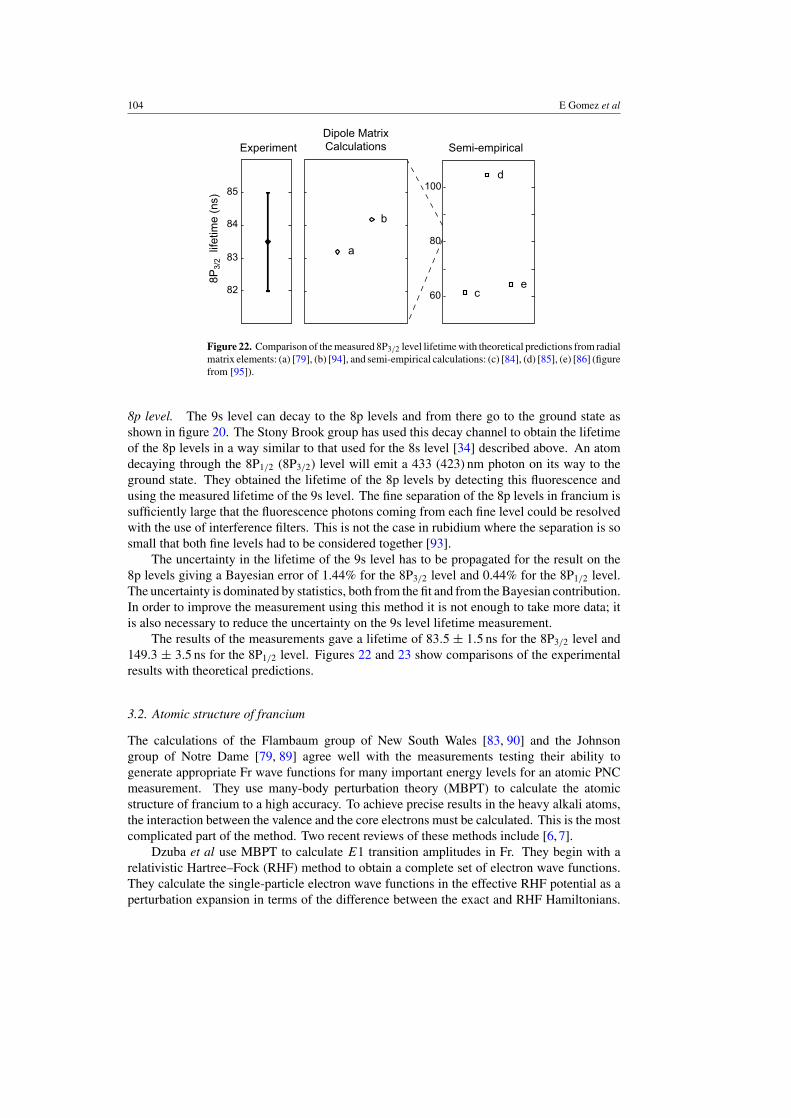
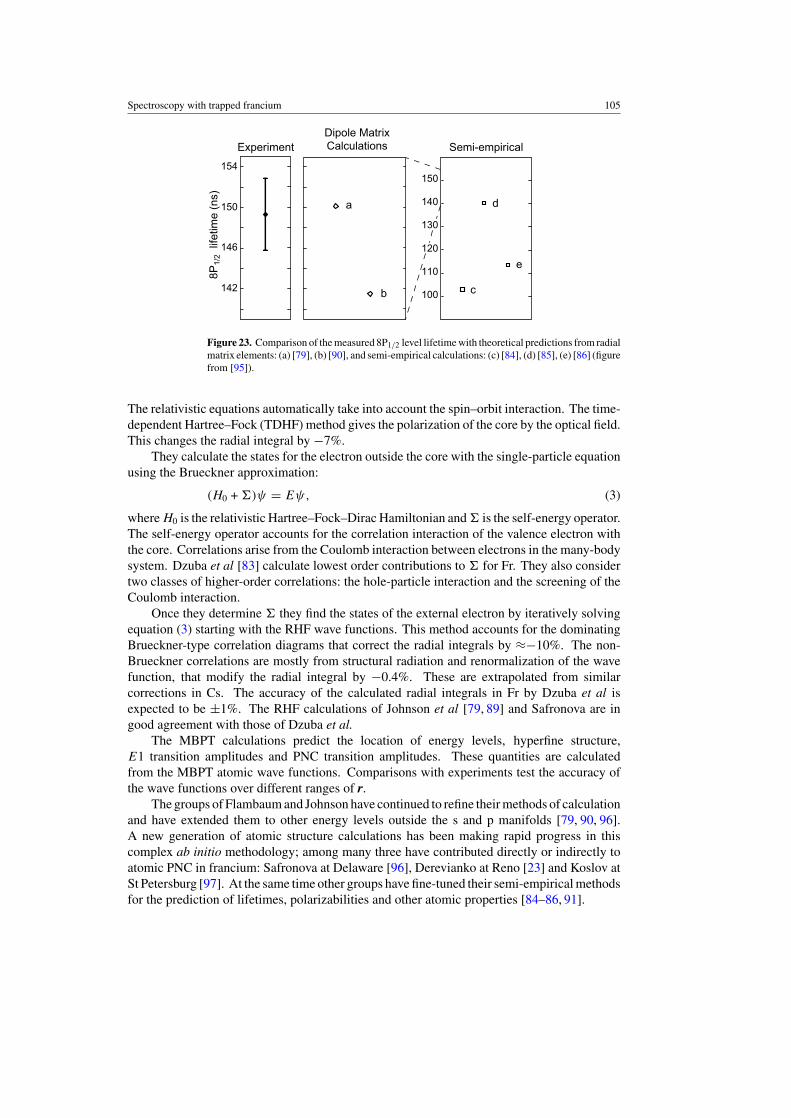
Figure 22. Comparison of the measured 8P3/2 level lifetime with theoretical predictions from radialmatrix elements: (a) [79], (b) [94], and semi-empirical calculations: (c) [84], (d) [85], (e) [86] (figurefrom [95]).
8p level. The 9s level can decay to the 8p levels and from there go to the ground state asshown in figure 20. The Stony Brook group has used this decay channel to obtain the lifetimeof the 8p levels in a way similar to that used for the 8s level [34] described above. An atomdecaying through the 8P1/2 (8P3/2) level will emit a 433 (423) nm photon on its way to theground state. They obtained the lifetime of the 8p levels by detecting this fluorescence andusing the measured lifetime of the 9s level. The fine separation of the 8p levels in francium issufficiently large that the fluorescence photons coming from each fine level could be resolvedwith the use of interference filters. This is not the case in rubidium where the separation is sosmall that both fine levels had to be considered together [93].
The uncertainty in the lifetime of the 9s level has to be propagated for the result on the8p levels giving a Bayesian error of 1.44% for the 8P3/2 level and 0.44% for the 8P1/2 level.The uncertainty is dominated by statistics, both from the fit and from the Bayesian contribution.In order to improve the measurement using this method it is not enough to take more data; itis also necessary to reduce the uncertainty on the 9s level lifetime measurement.
The results of the measurements gave a lifetime of 83.5 ± 1.5 ns for the 8P3/2 level and149.3 ± 3.5 ns for the 8P1/2 level. Figures 22 and 23 show comparisons of the experimentalresults with theoretical predictions.
3.2. Atomic structure of francium
The calculations of the Flambaum group of New South Wales [83, 90] and the Johnsongroup of Notre Dame [79, 89] agree well with the measurements testing their ability togenerate appropriate Fr wave functions for many important energy levels for an atomic PNCmeasurement. They use many-body perturbation theory (MBPT) to calculate the atomicstructure of francium to a high accuracy. To achieve precise results in the heavy alkali atoms,the interaction between the valence and the core electrons must be calculated. This is the mostcomplicated part of the method. Two recent reviews of these methods include [6, 7].
Dzuba et al use MBPT to calculate E1 transition amplitudes in Fr. They begin with arelativistic Hartree–Fock (RHF) method to obtain a complete set of electron wave functions.They calculate the single-particle electron wave functions in the effective RHF potential as aperturbation expansion in terms of the difference between the exact and RHF Hamiltonians.
Spectroscopy with trapped francium 105
150
140
130
120
110
100
150
154
146
142
a
b c
d
e
8P1/
2 li
fetim
e (n
s)
ExperimentDipole MatrixCalculations Semi-empirical
Figure 23. Comparison of the measured 8P1/2 level lifetime with theoretical predictions from radialmatrix elements: (a) [79], (b) [90], and semi-empirical calculations: (c) [84], (d) [85], (e) [86] (figurefrom [95]).
The relativistic equations automatically take into account the spin–orbit interaction. The time-dependent Hartree–Fock (TDHF) method gives the polarization of the core by the optical field.This changes the radial integral by −7%.
They calculate the states for the electron outside the core with the single-particle equationusing the Brueckner approximation:
(H0 + )ψ = Eψ, (3)
where H0 is the relativistic Hartree–Fock–Dirac Hamiltonian and is the self-energy operator.The self-energy operator accounts for the correlation interaction of the valence electron withthe core. Correlations arise from the Coulomb interaction between electrons in the many-bodysystem. Dzuba et al [83] calculate lowest order contributions to for Fr. They also considertwo classes of higher-order correlations: the hole-particle interaction and the screening of theCoulomb interaction.
Once they determine they find the states of the external electron by iteratively solvingequation (3) starting with the RHF wave functions. This method accounts for the dominatingBrueckner-type correlation diagrams that correct the radial integrals by ≈−10%. The non-Brueckner correlations are mostly from structural radiation and renormalization of the wavefunction, that modify the radial integral by −0.4%. These are extrapolated from similarcorrections in Cs. The accuracy of the calculated radial integrals in Fr by Dzuba et al isexpected to be ±1%. The RHF calculations of Johnson et al [79, 89] and Safronova are ingood agreement with those of Dzuba et al.
The MBPT calculations predict the location of energy levels, hyperfine structure,E1 transition amplitudes and PNC transition amplitudes. These quantities are calculatedfrom the MBPT atomic wave functions. Comparisons with experiments test the accuracy ofthe wave functions over different ranges of r.
The groups of Flambaum and Johnson have continued to refine their methods of calculationand have extended them to other energy levels outside the s and p manifolds [79, 90, 96].A new generation of atomic structure calculations has been making rapid progress in thiscomplex ab initio methodology; among many three have contributed directly or indirectly toatomic PNC in francium: Safronova at Delaware [96], Derevianko at Reno [23] and Koslov atSt Petersburg [97]. At the same time other groups have fine-tuned their semi-empirical methodsfor the prediction of lifetimes, polarizabilities and other atomic properties [84–86, 91].
106 E Gomez et al
4. Parity non-conservation
PNC was measured for the first time in three experiments with weak charged currents in 1957[98–100]. Attempts to unify the weak and electromagnetic interactions by Weinberg [101],Salam [102] and Glashow [103] showed the existence of a neutral heavy boson associatedwith the weak interaction. The effects of a neutral boson in atomic PNC had already beenestimated years before by Zel’dovich [104]. The race for the detection of the consequencesfor nuclear currents started, and the high-energy community with the Gargamelle experimentat CERN saw a positive signature in the elastic muon–neutrino electron scattering [105]. Theneutral weak interaction between the electron and the nucleons remained to be observed sinceit was dominated by the electromagnetic interaction. It was first observed in atomic PNCexperiments [106–109] in 1978. Further experiments in high energy physics with inelasticscattering enhanced the evidence of the neutral electroweak interaction [110]. The particlesresponsible for the weak interaction (W +, W− and Z0) were observed in 1983 [111, 112].
Atomic PNC experiments, such as the Boulder one performed in caesium [113], measurean electric dipole transition rate between levels of the same parity. The extraction of weakinteraction parameters from a PNC measurement requires the calculation of a matrix elementthat contains a weak interaction operator, energy levels coming from perturbation theoryand polarizabilities (sums of electric dipole transition matrix elements). These quantitiesare sensitive to the electron wave functions at short, intermediate and large distances fromthe nucleus, respectively. The energy levels and electric dipole transition matrix elementscan be measured directly from spectroscopy. Unfortunately, the weak interaction matrixelement cannot be measured directly. Instead, in the Boulder caesium PNC experiment,what is measured is the product of the weak matrix element with the weak charge. Sincethe interest is in extracting the weak charge it is necessary to rely on a theoretical calculationof the weak matrix element. The short range weak interaction depends on the electron densityat the nucleus.
The improvement in precision of the PNC measurement in caesium [10,113] encouragedtheorists to revisit their calculations to account for previously neglected corrections. Theavailability of high precision spectroscopic measurements made it possible to compare theirpredictions with measurements to below 1%. Several new corrections had to be included suchas the Breit interaction [23], the strong-field radiative corrections [114,115] and the self-energyand vertex contribution [116,117]. The relevance of the corrections will be different dependingon the atom, which is why measurements in francium are important not only for a future PNCmeasurement in francium but also as a cross check for calculations in caesium.
Atomic physics experiments benefit from the long interaction time between the electronand the nucleus compared with high energy collisions. In the latter, the interaction time is ofthe order of the transit time through the nucleus, whereas in atomic physics, where there isno decay of the nucleus, the time is limited by the coherence time that can be on the order ofseconds [118]. The neutral interaction between an electron and a nucleon can be mediated bya photon if it is electromagnetic, by a Z0 boson if it is weak according to the minimal standardmodel. Both the photon and Z0 channels are comparable at high energy, while the Z0 channelis suppressed at low energies by q2/M2
Z0 with q the momentum transfer and MZ0 the Z0 bosonmass [119]. The suppression appears because at low energies the interaction happens throughvirtual Z0 bosons since there is not enough energy to create them. The experiments at low andhigh energies are sensitive to different quantities and become complementary. For example,electron scattering at the Z0 pole can be used to obtain a value for the Weinberg angle, but ifthat value does not agree with the one extracted from atomic PNC measurements that couldbe an indication of physics beyond the Standard Model.
Spectroscopy with trapped francium 107
Peskin and Takeuchi introduced a parametrization of physics beyond the standard modelin terms of two parameters S and T [120, 121]. Atomic PNC measurements are sensitivealmost only to the S parameter and can be used in combination with other experiments toseparate the S and the T contributions [7]. PNC measurements are particularly sensitive toextra Z bosons [119]. A crude estimate for the effect of an extra Z boson can be obtainedfrom the suppression at low energies. In the case where the extra boson is identical to itslighter counterpart the correction at low energies would be proportional to M2
Z0/M2Zχ
withMZχ
the mass of the extra boson. Since the precision of PNC measurements is ∼1% thecrude estimate sets a lower bound on the mass of the extra boson of MZχ
> 10MZ = 912 GeV.A careful analysis gives a lower bound for extra Z bosons from the caesium PNC measurementof MZχ
> 750 GeV [7] which is higher than the 600 GeV limit set by direct searches at theTevatron [122] and a global analysis including the experiments at LEP [123].
4.1. Atomic PNC theoretical background
The exchange of weak neutral currents between electrons and nucleons constitutes the mainsource of parity violating atomic transitions. The currents are of two kinds, depending onwhether the electron or the nucleon enters as the axial vector current. The Hamiltonian for aninfinitely heavy nucleon without radiative corrections is [124]
H = G√2(κ1iγ5 − κnsd,iσn · α)δ(r), (4)
where G = 10−5 m−2p is the Fermi constant, mp is the proton mass, γ5 and α are Dirac matrices,
σn are Pauli matrices and κ1i and κnsd,i are constants of the interaction with i = p, n for aproton or a neutron and nsd = nuclear spin dependent. The standard model tree level values(no loops included in the calculation) for these constants with κnsd,i = κ2i are
κ1p = 12 (1 − 4 sin2 θW), κ1n = − 1
2 ,
κ2p = −κ2n = κ2 = − 12 (1 − 4 sin2 θW)η,
(5)
with sin2 θW ∼ 0.23 the Weinberg angle and η = 1.25. κ1i (κ2i) represents the couplingbetween nucleon and electron currents when the electron (nucleon) is the axial vector.
In an atom, the contribution from equation (4) for all the nucleons must be added. It isconvenient to work in the shell model approximation with a single valence nucleon of unpairedspin (nsi = nuclear spin independent):
H nsiPNC = G√
2
QW
2γ5δ(r). (6)
This contribution is independent of the nuclear spin and is proportional to the weak charge
QW = 2(κ1pZ + κ1nN), (7)
with N the number of neutrons. Because of the strong cancellation in κ1p the standard modelvalue for the weak charge is almost equal to −N . The theoretical uncertainty present in allthe extractions of weak interaction parameters from atomic PNC comes from the calculationof the matrix element γ5 as the experiment is not sensitive to the weak charge itself but to theproduct as equation (6) states.
Looking at this last Hamiltonian it is possible to follow more exactly the Z dependenceof the interaction for an s state atom for which PNC mixes some p character into its grounds state. The s level wave function grows as Z1/2, the derivative (the momentum) of the plevel at the origin goes as Z3/2 and QW ≈ −N ≈ −Z gives an overall scaling for theweak matrix element of Z3R, with R a relativistic enhancement factor. The enhancement
108 E Gomez et al
can be understood in a simple picture of the momentum of the electron that approaches thenucleus with Z increases to relativistic velocities (see the book of Khriplovich for an extendedexplanation [124]). As an example, the PNC effect of the spin independent part should be 18times larger in francium than in caesium according to the calculations of [83, 96].
The second term of equation (4) is nuclear spin dependent (nsd), and due to the pairingof nucleons its contribution has a weaker dependence on Z. The result after adding over allnucleons is [125]
H nsdPNC = G√
2
KI · α
I (I + 1)κnsd,iδ(r), (8)
where K = (I + 1/2)(−1)I+1/2−l , l is the valence nucleon orbital angular momentum and I isthe nuclear spin. The terms proportional to the anomalous magnetic moment of the nucleonsand the electrons have been neglected.
The interaction constant is given by [125]
κnsd,i = κa,i − K − 1/2
Kκ2,i +
I + 1
KκQW , (9)
with κ2,i given by equation (5) corresponding to the tree level approximation, and we have twocorrections, the effective constant of the anapole moment κa,i and κQW that is generated by thenuclear spin independent part of the electron nucleon interaction together with the hyperfineinteraction. Flambaum and Murray show that [125]
κa,i = 9
10gi
αµi
mpr0A2/3,
κQW = −1
3QW
αµN
mpr0AA2/3,
(10)
where α is the fine structure constant, µi and µN are the magnetic moment of the externalnucleon and of the nucleus, respectively, in nuclear magnetons, r0 = 1.2 fm is the nucleonradius, A = Z+N , and gi gives the strength of the weak nucleon-nucleus potential with gp ∼ 4for a proton and 0.2 < gn < 1 for a neutron [124]. The interaction is stronger in heavier atomssince both κa,i and κQW scale as A2/3 (QW/A ∼ 1/2 in κQW ). The anapole moment is thedominant contribution to the interaction in heavy atoms, for example in 209Fr, κa,p/κQW � 15,so it is safe to assume that κnsd,i = κa,i . Arguments similar to the nuclear spin independentpart give a scaling for the matrix element of the nuclear spin dependent part of Z8/3R. Theeffect in francium in this case is 11 times larger than in caesium.
4.2. The anapole moment
The anapole moment of a nucleus is a PNC, time reversal conserving moment that arises fromweak interactions between the nucleons (see the recent review by Haxton and Wieman [126]). Itcan be detected in a PNC electron–nucleus interaction and reveals itself in the spin dependentpart of the PNC interaction. Wood et al [10, 113] measured the anapole moment of 133Csby extracting the dependence of atomic PNC on the hyperfine energy levels involved andconsequently nuclear spin. The measurement shows that atomic PNC is a unique probe forneutral weak interactions inside the nucleus, which otherwise remain hidden by much largerelectromagnetic charged currents [127].
The anapole moment is defined by (see [128])
a = −π
∫d3rr2J(r), (11)
Spectroscopy with trapped francium 109
with J the electromagnetic current density. The anapole moment in francium arises mainlyfrom the weak interaction between the valence nucleons and the core. It is possible to thinkof it as a weak radiative correction that is detectable only with an electromagnetic interaction.Flambaum et al [129], by including weak interactions between nucleons in their calculationof the nuclear current density, estimate the anapole moment from equation (11) for a singlevalence nucleon to be
a = 1
e
G√2
Kjj (j + 1)
κa,i = Cani j, (12)
where j is the nucleon angular momentum. These values correspond to the nuclear valuesfor the case of a single valence nucleon. The calculation is based on the shell model for thenucleus, under the assumption of homogeneous nuclear density and a core with zero angularmomentum leaving the valence nucleon carrying all the angular momentum.
4.3. Status of PNC measurements
The weak interaction in atoms induces a mixing of states of different parity, observable throughPNC measurements. Transitions that were forbidden due to selection rules become allowedthrough the presence of the weak interaction. The transition amplitudes are generally smalland an interference method is commonly used to measure them. A typical observable hasthe form
|APC + APNC|2 = |APC|2 + 2Re(APCA∗PNC) + |APNC|2, (13)
where APC and APNC represent the parity conserving and PNC amplitudes. The second termon the right side corresponds to the interference term and can be isolated because it changessign under a parity transformation. The last term is usually negligible.
All recent and on-going experiments in atomic PNC rely on the large heavy nucleus (largeZ) enhancement factor proposed by Bouchiat and Bouchiat [9, 130, 131]. These experimentsfollow two main strategies (see recent review by M-A Bouchiat [132]). The first one isoptical activity in an atomic vapour. The asymmetry introduced by PNC makes the atomsinteract preferentially with right (or left) circularly polarized light. A linearly polarized lightbeam propagating through an atomic vapour experiences a rotation of the polarization planeanalogous to the one observed in the Faraday effect except that in this case there is no magneticfield present. The measurement strategy uses interference with an allowed transition to enhancethe small effect. The amount of rotation is related to the weak charge, which quantifies the effectof the weak force. The method has been applied to reach a precision of 2% in bismuth [13],1.2% in lead [133, 134] and 1.2% in thallium [11].
The second strategy measures the excitation rate of a highly forbidden transition. Theelectric dipole transition between the 6s and 7s levels in caesium becomes allowed throughthe weak interaction. Interference between this transition and the one induced by the Starkeffect due to the presence of an static electric field generates a signal proportional to the weakcharge. The best atomic PNC measurement to date uses this method to reach a precisionof 0.35% [10, 113]. The exquisite precision reached on the caesium experiment at Boulderallowed the extraction of the anapole moment from their measurement [10,113]. The transitionis dominated by the spin independent contribution, which is proportional to the weak charge.They observed a small difference on the signal depending on the hyperfine levels used for thetransition. The difference corresponds to the spin dependent contribution which for caesiumis dominated by the anapole moment. They extracted the spin dependent contribution with anaccuracy of 14% giving the first measurement of an anapole moment.
110 E Gomez et al
Other methods have been proposed and some work is already on the way. The Bouchiatgroup in Paris has been working also on the highly forbidden 6s to 7s electric dipole transitionin a caesium cell but detects the occurrence of the transition using stimulated emission ratherthan fluorescence [135]. The Budker group in Berkeley has been pursuing measurements inytterbium, which has many stable isotopes available [14,136]. There is an on-going experimentin the Fortson group in Seattle using a single barium (or alternatively radium) ion [127, 137].The group of DeMille at Yale is planning to measure anapole moments by placing diatomicmolecules in a strong magnetic field [138]. A collaboration in Russia wants to measure theanapole moment in a potassium cell [139]. The groups at Legnaro and Maryland–StonyBrook–Yale are working towards a PNC measurement using francium [53, 140]. This list isnot intended to encompass all the efforts, but represents some of the groups interested in PNCat present.
5. Considerations for a PNC experiment in francium
In order to enhance the small PNC effect in francium it is necessary to perform a measurementbased on an ‘electroweak interference’ between a weak-interaction amplitude Fpnc associatedwith a Z0 exchange and a parity conserving electromagnetic amplitude F associated withphoton exchanges [124]. The means of looking for such an effect consist in preparing a handedexperiment, one that can be performed in either a right-handed or a left-handed configuration.One measures the transition rate in the two configurations. The results of the two experimentsdiffer by the electroweak interference term. In terms of a right–left asymmetry
ARL = 2Re(FFpnc)
|F 2 + F 2pnc|
. (14)
The electromagnetic amplitude is much larger than the weak-interaction amplitude, andthe experiments are designed to make the argument of the numerator real to maximize theeffect, so the right–left asymmetry is simply
ARL = 2Fpnc
F. (15)
Typical numbers for the asymmetry from the caesium experiments are a few parts permillion [113]. The difficulty of the experiment consists in discriminating the tiny parityviolating interference against parity-conserving signals that are many orders of magnitudelarger. Systematic errors come from an imperfect reversal of the handedness of the experimentand give false parity violating signals that need to be checked by consistency.
5.1. The optical experiment
So far, there has been no PNC measurement in neutral atoms performed utilizing the newtechnologies of laser cooling and trapping. In order to create a road map for an experimentone could assume a transition rate measurement following closely the technique used by theBoulder group in caesium [140]. Start with a Stark shift to induce a parity conserving amplitudebetween the 7s and 8s levels of francium (figure 4) and look how this electromagnetic termwill interfere with the weak-interaction amplitude giving rise to a left–right asymmetry withrespect to the system of coordinates defined by the static electric field E, static magnetic field Band the Poynting vector S of the excitation field, such that the observable is proportional toB · (S × E).
Francium atoms would accumulate in a MOT. Then, after further cooling to control theirvelocities, they would be transferred to another region where a dipole trap will keep them ready
Spectroscopy with trapped francium 111
for the measurement. The measurement would be performed by moving the dipole trap withthe atoms into the mode of a high finesse interferometer tuned to the 7s to 8s transition in aregion with a dc electric field present. If an atom gets excited it will decay via the 7p state,but could also be ionized. Optical pumping techniques allow one to recycle the atom that hasperformed the PNC transition many times enhancing the probability to detect the signaturephoton. Redundancy in the reversal of the coordinates would suppress systematic errors. Thereis a strong assumption implicit in this statement that needs to be thoroughly studied: the trapdoes not affect the measurement.
To estimate the requirements for a PNC measurement in francium it is good to take theBoulder Cs experiment as a guide (see paper by Wieman in [19]). The most important quantityto estimate is the signal to noise ratio since that will determine many of the requirements ofthe experiment.
The approach of Stark mixing works as an amplifier in the full sense of the word; it enlargesthe signal, but it also brings noise. The Stark induced part of the signal in photons per secondis given in equation (16); this signal will contribute the shot noise to the measurement,
Sstark = 16π3
3hε0λ3E2β2I0N. (16)
While the PNC signal in photons per second is
Spnc = 16π3
3hε0λ32Eβ Im(Epnc)I0N, (17)
where β is the vector Stark polarizability, E the dc electric field used for the Stark mixinginterference, N the number of atoms in the interaction volume, λ the wavelength of thetransition, Im(Epnc) the PNC amplitude expressed as an equivalent electric field and I0 thenormalized (to atomic saturation) intensity of the excitation source. Assuming only shot noiseas the dominant source of noise, the signal to noise ratio achieved in 1 s is
Spnc
Noise= 2
(16π3
3hε0λ3
)1/2
Im(Epnc)√
I0N. (18)
For francium in the 7s to 8s state, the ratio becomes
Spnc
Noise= 7.9 × 10³ Im(Epnc)
√I0N. (19)
This last expression gives a result in (√
Hz)−1 when using atomic units for the PNC term.It illustrates where a future measurement with francium is stronger: the size of the effect. Thecalculated value from Dzuba et al [83] for Im(Epnc) of 1.5 × 10⁻¹⁰ in atomic units is eighteentimes larger than in caesium.
The ratio does not depend on the particular details of the interference experiment used;that is, the value of the vectorial Stark polarizability of the 7s → 8s transition β or in theparticular value of the dc electric field chosen E. These factors enter in the signal to noiseratio once the technical noise is considered.
The very high intensities available in a standing wave will exert a repelling force that willtend to move the cold atoms to a region of low intensity. The FM modulation at integers ofthe free spectral range of the cavity can create a slowly moving travelling envelope to solvethis problem as already suggested by the Boulder group. Another possible complicationis the ionization of the Fr atoms that have been excited by a second photon of 507 nm.The ionization potential is only 4.07 eV and two of those photons add to 4.89 eV. Takinga typical ionization cross section of 10−18 cm2 and an intracavity intensity of 106 W cm−2 theresulting ionization rate could amount to 1/6 of the decay rate from the 8s to the 7p state.
112 E Gomez et al
As the measurement proceeds alternating periods of cooling and trapping with periods ofexcitation, each time there is excitation some of the atoms will be lost. A careful balancebetween intracavity power and signal loss will be needed to find the optimal operating point.
5.2. The anapole moment measurement
There is interest in measuring the anapole moment in francium. The UMD–Stony Brook–Yale group have proposed inducing electric dipole (E1) transitions between the hyperfinelevels of the francium ground state [141]. The transition that is forbidden by the selectionrules becomes allowed due to the weak interactions that create the anapole moment. The E1transition amplitude is almost proportional to the anapole moment since it is the dominantprocess for heavy atoms. The measurement of the anapole moment should give informationon the weak nucleon–nucleon interactions inside the nucleus. A measurement of the anapolemoment in a chain of isotopes should provide information to separate the anapole momentdue to the valence proton from that of the neutron. The constraints that could be obtainedfor the proton and the neutron weak anapole moments are almost orthogonal in the weakmeson–nucleon coupling space.
The proposal by UMD-SB-Yale for a measurement of the nuclear anapole moment is bydirect excitation of the microwave electric dipole (E1) transition between the ground hyperfinestates of an alkali atom. The transition is parity forbidden but is allowed by the anapole inducedmixing of opposite parity states. The general approach has been suggested and followed inthe past [12, 142–145]. It is a modification of the suggestion of Fortson [127] for atomicPNC to use an ion placed at the anti-node of a standing optical wave. The proposal wouldplace many trapped atoms at the anti-node of a standing microwave field of a Fabry–Perotresonator. The atoms should be well localized within the anti-node of the electric standingwave (microwave frequency νm ∼ 45 GHz and wavelength λm ∼ 6.6 mm for francium).A blue detuned dipole trap would keep the atoms at the anti-node of the standing wavewhile minimizing the perturbation introduced by the confinement. The PNC signal wouldbe amplified by interfering it with a parity allowed Raman transition in the presence of a staticmagnetic field.
The fields present would define the system of coordinates for the experiment. Theobservable would be given by i(EM × (E1 × E2)) · B, with EM the microwave electric field,E1 and E2 the Raman fields, B the static magnetic field and the i is present in accordancewith time reversal symmetry. For a projection noise limited measurement [146], that is noisecoming from the collapse that distributes the atoms binomially between the two hyperfinelevels that leads to an uncertainty in the measured excited state fraction, the signal to noiseratio is given by
SNP
= 2AE1t
h
√N, (20)
with AE1 the E1 transition amplitude, t the excitation duration and N the number of atoms.The signal to noise ratio grows linearly with the excitation time t . The future experimentrequires not only good statistics but also control over many possible systematic effects [141].
A measurement of the anapole moment in Fr by direct E1 hyperfine transitions willrequire a big effort not only from the experimental side but also from the theoretical side,both atomic and nuclear. The extraction of the weak meson–nucleon couplings requires agood understanding of the atomic wave functions for the calculation of the matrix elementand subtraction of additional radiative corrections as well as the nuclear structure to model themeson exchange inside the nucleus [125, 126].
Spectroscopy with trapped francium 113
5.3. Other optical atomic PNC proposals
Sanguinetti et al recently analysed in [147] a new proposal for PNC measurements with Fr.They suggest choosing a geometry where the laser beam exciting the transition is collinear toa slow, cold atomic beam, either extracted from a trap or prepared by Zeeman slower. Thisway the interaction time with the excitation laser is lengthened.
The observable that they propose is new in the atomic PNC experimental field. Theysuggest creating a spin polarization Pe of the atomic beam at the output of the trap in adirection perpendicular to its velocity. Then, an observable physical quantity is a contribution tothe absorption rate involving this spin polarization. It results from an interference between theparity-violating electric dipole amplitude E
pv1 and the Stark amplitude induced by a transverse
electric field. The manifestation of atomic PNC would rely on the presence in the absorptionrate of the pseudoscalar quantity (E × ξ k) · Pe, where ξ k represents the angular momentumof the light beam which excites the transition and E is the applied static electric field. It hasthe advantage of appearing in the total population of the excited state. It can be detected bymonitoring the total intensity of the fluorescence light emitted during the two-step de-excitationprocess. No polarization analysis or even light filtering (except for stray light) is necessaryin principle. The PNC signal is odd under the separate reversals of the electric field, the spinpolarization and the helicity of the photons which excite the transition.
The signal to noise ratios that they obtain are very promising and point to statisticalprecisions of 10−3 achievable with a beam of Fr of the order of one million atoms per second.
6. Perspectives and conclusions
This review shows the status of the work on francium and the understanding of its atomicstructure. The experimental progress with francium has generated new ways to produce it,trap it and probe it. The agreement between experiment and theory in the lifetimes of differentexcited states is better than 1% and shows the quality and reliability of current day atomicstructure calculations. This level of precision is comparable to other alkali species. The sametheoretical methods used on other elements provide a cross check for the reliability of thecalculations. This is a vital step in PNC studies where a theoretical calculation is required toextract the constants of the weak interaction from the measurement in caesium.
Francium has the potential of contributing to our understanding of the weak interactiondirectly. The size of the weak effects in francium are more than ten times larger than in caesium.In addition, the choice of different isotopes to work with opens new possibilities. Comparingthe weak effects for different numbers of neutrons in the nucleus could provide a separationbetween weak interactions with protons or with neutrons. The study of the spin dependent partof the weak interaction through the anapole moment could provide access to weak processesamong nucleons. The nucleons are strongly correlated at the low energies of atomic physicsexperiments and provide complementary information to that obtained at high energies.
Acknowledgments
This work has been supported by the United States National Science Foundation. EGacknowledges support from CONACYT.
Appendix. Tables of Fr parameters
The following tables summarize the parameters presented in this review and may becomeuseful in future experiments with francium.
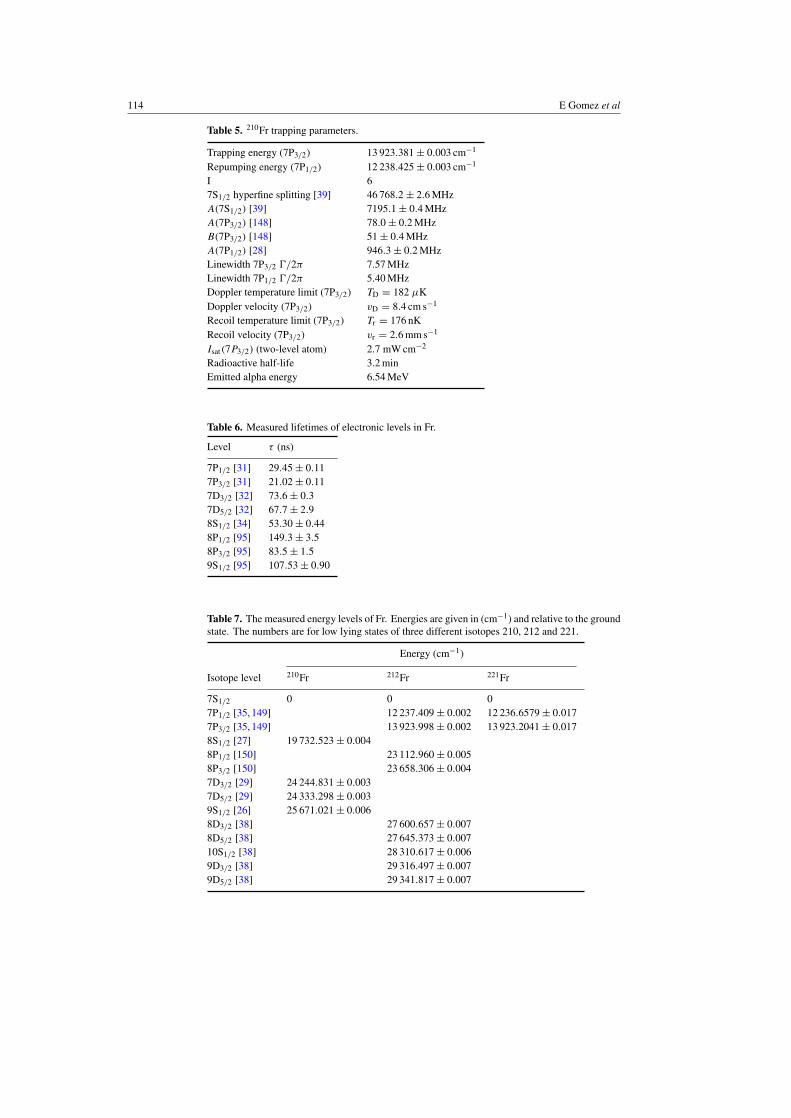
114 E Gomez et al
Table 5. 210Fr trapping parameters.
Trapping energy (7P3/2) 13 923.381 ± 0.003 cm−1
Repumping energy (7P1/2) 12 238.425 ± 0.003 cm−1
I 67S1/2 hyperfine splitting [39] 46 768.2 ± 2.6 MHzA(7S1/2) [39] 7195.1 ± 0.4 MHzA(7P3/2) [148] 78.0 ± 0.2 MHzB(7P3/2) [148] 51 ± 0.4 MHzA(7P1/2) [28] 946.3 ± 0.2 MHzLinewidth 7P3/2 �/2π 7.57 MHzLinewidth 7P1/2 �/2π 5.40 MHzDoppler temperature limit (7P3/2) TD = 182 µKDoppler velocity (7P3/2) vD = 8.4 cm s−1
Recoil temperature limit (7P3/2) Tr = 176 nKRecoil velocity (7P3/2) vr = 2.6 mm s−1
Isat(7P3/2) (two-level atom) 2.7 mW cm−2
Radioactive half-life 3.2 minEmitted alpha energy 6.54 MeV
Table 6. Measured lifetimes of electronic levels in Fr.
Level τ (ns)
7P1/2 [31] 29.45 ± 0.117P3/2 [31] 21.02 ± 0.117D3/2 [32] 73.6 ± 0.37D5/2 [32] 67.7 ± 2.98S1/2 [34] 53.30 ± 0.448P1/2 [95] 149.3 ± 3.58P3/2 [95] 83.5 ± 1.59S1/2 [95] 107.53 ± 0.90
Table 7. The measured energy levels of Fr. Energies are given in (cm−1) and relative to the groundstate. The numbers are for low lying states of three different isotopes 210, 212 and 221.
Energy (cm−1)
Isotope level 210Fr 212Fr 221Fr
7S1/2 0 0 07P1/2 [35, 149] 12 237.409 ± 0.002 12 236.6579 ± 0.0177P3/2 [35, 149] 13 923.998 ± 0.002 13 923.2041 ± 0.0178S1/2 [27] 19 732.523 ± 0.0048P1/2 [150] 23 112.960 ± 0.0058P3/2 [150] 23 658.306 ± 0.0047D3/2 [29] 24 244.831 ± 0.0037D5/2 [29] 24 333.298 ± 0.0039S1/2 [26] 25 671.021 ± 0.0068D3/2 [38] 27 600.657 ± 0.0078D5/2 [38] 27 645.373 ± 0.00710S1/2 [38] 28 310.617 ± 0.0069D3/2 [38] 29 316.497 ± 0.0079D5/2 [38] 29 341.817 ± 0.007
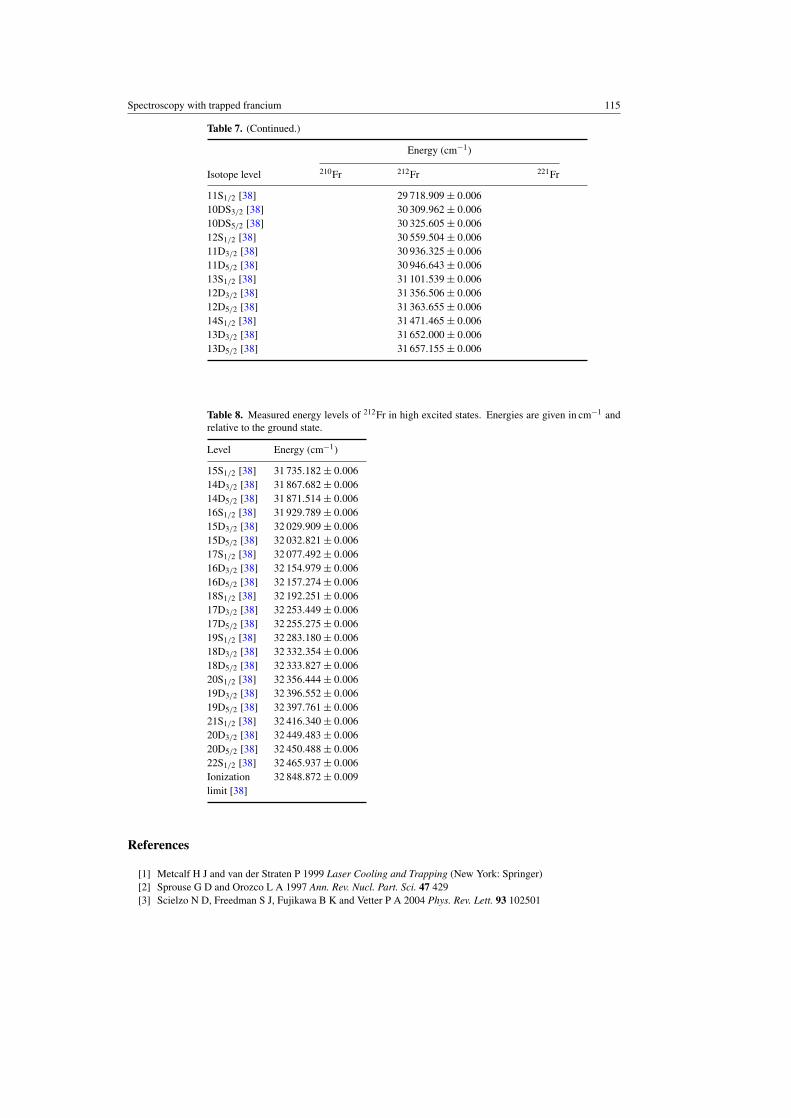
Spectroscopy with trapped francium 115
Table 7. (Continued.)
Energy (cm−1)
Isotope level 210Fr 212Fr 221Fr
11S1/2 [38] 29 718.909 ± 0.00610DS3/2 [38] 30 309.962 ± 0.00610DS5/2 [38] 30 325.605 ± 0.00612S1/2 [38] 30 559.504 ± 0.00611D3/2 [38] 30 936.325 ± 0.00611D5/2 [38] 30 946.643 ± 0.00613S1/2 [38] 31 101.539 ± 0.00612D3/2 [38] 31 356.506 ± 0.00612D5/2 [38] 31 363.655 ± 0.00614S1/2 [38] 31 471.465 ± 0.00613D3/2 [38] 31 652.000 ± 0.00613D5/2 [38] 31 657.155 ± 0.006
Table 8. Measured energy levels of 212Fr in high excited states. Energies are given in cm−1 andrelative to the ground state.
Level Energy (cm−1)
15S1/2 [38] 31 735.182 ± 0.00614D3/2 [38] 31 867.682 ± 0.00614D5/2 [38] 31 871.514 ± 0.00616S1/2 [38] 31 929.789 ± 0.00615D3/2 [38] 32 029.909 ± 0.00615D5/2 [38] 32 032.821 ± 0.00617S1/2 [38] 32 077.492 ± 0.00616D3/2 [38] 32 154.979 ± 0.00616D5/2 [38] 32 157.274 ± 0.00618S1/2 [38] 32 192.251 ± 0.00617D3/2 [38] 32 253.449 ± 0.00617D5/2 [38] 32 255.275 ± 0.00619S1/2 [38] 32 283.180 ± 0.00618D3/2 [38] 32 332.354 ± 0.00618D5/2 [38] 32 333.827 ± 0.00620S1/2 [38] 32 356.444 ± 0.00619D3/2 [38] 32 396.552 ± 0.00619D5/2 [38] 32 397.761 ± 0.00621S1/2 [38] 32 416.340 ± 0.00620D3/2 [38] 32 449.483 ± 0.00620D5/2 [38] 32 450.488 ± 0.00622S1/2 [38] 32 465.937 ± 0.006Ionization 32 848.872 ± 0.009limit [38]
References
[1] Metcalf H J and van der Straten P 1999 Laser Cooling and Trapping (New York: Springer)[2] Sprouse G D and Orozco L A 1997 Ann. Rev. Nucl. Part. Sci. 47 429[3] Scielzo N D, Freedman S J, Fujikawa B K and Vetter P A 2004 Phys. Rev. Lett. 93 102501

116 E Gomez et al
[4] Gorelov A et al 2005 Phys. Rev. Lett. 94 142501[5] Crane S G, Brice S J, Goldschmidt A, Guckert R, Hime A, Kitten J J and Vieira D J and Zhao X 2001 Phys.
Rev. Lett. 86 2967[6] Sapirstein J 1998 Rev. Mod. Phys. 70 55[7] Ginges J S M and Flambaum V V 2004 Phys. Rep. 397 63[8] Bouchiat M A and Bouchiat C 1997 Rep. Prog. Phys. 60 1351[9] Bouchiat M A and Bouchiat C 1974 J. Phys. (Paris) 35 899
[10] Wood C S, Bennett S C, Cho D, Masterson B P, Roberts J L, Tanner C E and Wieman C E 1997 Science275 1759
[11] Vetter P A, Meekhof D M, Majumder P K, Lamoreaux S K and Fortson E N 1995 Phys. Rev. Lett. 74 2658[12] Budker D 1998 Physics Beyond the Standard Model (Singapore: World Scientific)[13] Macpherson M J D, Zetie K P, Warrington R B, Stacey D N and Hoare J P Phys. Rev. Lett. 67 2784[14] DeMille D 1995 Phys. Rev. Lett. 74 4165[15] Fortson N 1990 Phys. Rev. Lett. 765 2857[16] Pollock J, Fortson E N and Wilets L 1992 Phys. Rev. C 46 2587[17] Blundell S A, Johnson W R and Sapirstein J 1991 Phys. Rev. A 43 3407[18] Dzuba V A, Flambaum V V and Sushkov O P 1989 Phys. Lett. A 141 147[19] Langacker P (ed) 1995 Precision Tests of the Standard Electroweak Model (Singapore: World Scientific)[20] Peskin M E 1998 Science 281 1153[21] Erler J and Langacker P 2000 Phys. Rev. Lett. 84 212[22] Rosner J L 2002 Phys. Rev. D 65 0073026[23] Derevianko A 2000 Phys. Rev. Lett. 85 1618[24] Liberman S et al (ISOLDE Collaboration) 1978 C R Acad. Sci. B 286 253[25] Simsarian J E, Ghosh A, Gwinner G, Orozco L A, Sprouse G D and Voytas P A 1996 Phys. Rev. Lett. 76 3522[26] Simsarian J E, Shi W, Orozco L A, Sprouse G D and Zhao W Z 1996 Opt. Lett. 21 1939[27] Simsarian J E, Zhao W Z, Orozco L A and Sprouse G D 1999 Phys. Rev. A 59 195[28] Grossman J S, Orozco L A, Pearson M R, Simsarian J E, Sprouse G D and Zhao W Z 1999 Phys. Rev. Lett.
83 935[29] Grossman J M, Fliller III R P, Mehlstaubler T E, Orozco L A, Pearson M R, Sprouse G D and Zhao W Z 2000
Phys. Rev. A 62 052507[30] Zhao W Z, Simsarian J E, Orozco L A, Shi W and Sprouse G D 1997 Phys. Rev. Lett. 78 4169[31] Simsarian J E, Orozco L A, Sprouse G D and Zhao W Z 1998 Phys. Rev. A 57 2448[32] Grossman J M, Fliller III R P, Orozco L A, Pearson M R and Sprouse G D 2000 Phys. Rev. A 62 062502[33] Aubin S, Gomez E, Orozco L A and Sprouse G D 2004 Phys. Rev. A 70 042504[34] Gomez E, Orozco L A, Galvan A P and Sprouse G D 2005 Phys. Rev. A 71 062504[35] Lu Z T, Corwin K L, Vogel K R, Wieman C E, Dinneen T P, Maddi J and Gould H 1997 Phys. Rev. Lett.
79 994[36] Atutov S N et al 2004 Nucl. Phys. A 746 421c[37] Perey M 1939 C. R. Acad. Sci. 208 97[38] Arnold E et al (ISOLDE Collaboration) 1990 J. Phys. B 23 3511[39] Coc A et al (ISOLDE Collaboration) 1985 Phys. Lett. B 163 66[40] Andreev S V, Mishin V I and Letokhov V S 1988 J. Opt. Soc. Am. B 5 2190[41] Dinneen T, Ghiorso A and Gould H 1996 Rev. Sci. Instrum. 67 752[42] Lettry J et al 1997 Nucl. Instrum. Methods B 326 170[43] Gwinner G, Behr J A, Cahn S B, Ghosh A, Orozco L A, Sprouse G D and Xu F 1994 Phys. Rev. Lett. 72 3795[44] Lipski A R, Orozco L A, Pearson M R, Simsarian J E, Sprouse G D and Zhao W Z 1999 Nucl. Instrum.
Methods A 438 217[45] Behr J A, Cahn S B, Dutta S B, Ghosh A, Gwinner G, Holbrow C H, Orozco L A, Sprouse G D, Urayama J
and Xu F 1994 Nucl. Instrum. Methods A 351 256[46] Melconian D et al 2005 Nucl. Instrum. Methods A 538 93[47] Monroe C, Swann W, Robinson H and Wieman C 1990 Phys. Rev. Lett. 65 1571[48] Lu Z T, Bowers C T, Freedman S J, Fujikawa B K, Mortara J L, Shang S Q, Coulter K P and Young L 1994
Phys. Rev. Lett. 72 3791[49] Goldenberg H M, Kleppner D and Ramsey N F 1961 Phys. Rev. 123 530[50] Vanier J, Simard J F and Boulanger J S 1974 Phys. Rev. A 9 1031[51] Swenson D R and Anderson L W 1988 Nucl. Instrum. Methods B 29 627[52] Stephens M, Rhodes R and Wieman C 1994 J. Appl. Phys. 76 3479[53] Atutov S N et al 2003 J. Opt. Soc. Am. B 20 953
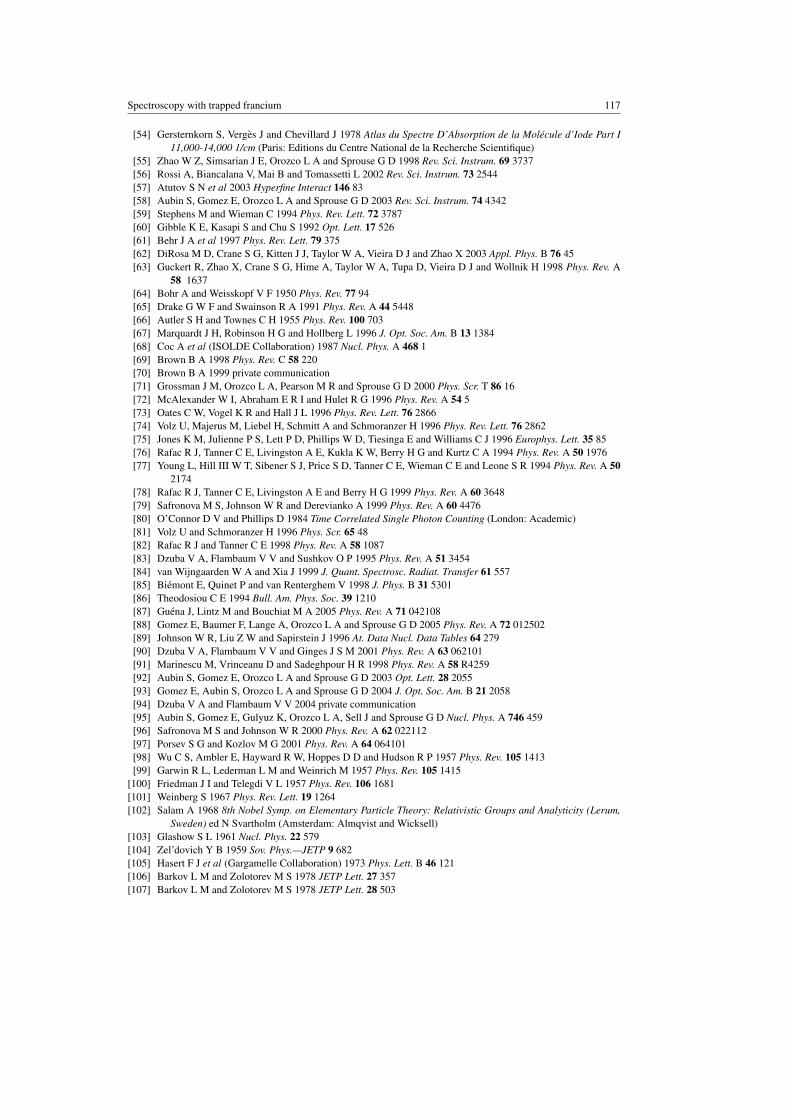
Spectroscopy with trapped francium 117
[54] Gersternkorn S, Verges J and Chevillard J 1978 Atlas du Spectre D’Absorption de la Molecule d’Iode Part I11,000-14,000 1/cm (Paris: Editions du Centre National de la Recherche Scientifique)
[55] Zhao W Z, Simsarian J E, Orozco L A and Sprouse G D 1998 Rev. Sci. Instrum. 69 3737[56] Rossi A, Biancalana V, Mai B and Tomassetti L 2002 Rev. Sci. Instrum. 73 2544[57] Atutov S N et al 2003 Hyperfine Interact 146 83[58] Aubin S, Gomez E, Orozco L A and Sprouse G D 2003 Rev. Sci. Instrum. 74 4342[59] Stephens M and Wieman C 1994 Phys. Rev. Lett. 72 3787[60] Gibble K E, Kasapi S and Chu S 1992 Opt. Lett. 17 526[61] Behr J A et al 1997 Phys. Rev. Lett. 79 375[62] DiRosa M D, Crane S G, Kitten J J, Taylor W A, Vieira D J and Zhao X 2003 Appl. Phys. B 76 45[63] Guckert R, Zhao X, Crane S G, Hime A, Taylor W A, Tupa D, Vieira D J and Wollnik H 1998 Phys. Rev. A
58 1637[64] Bohr A and Weisskopf V F 1950 Phys. Rev. 77 94[65] Drake G W F and Swainson R A 1991 Phys. Rev. A 44 5448[66] Autler S H and Townes C H 1955 Phys. Rev. 100 703[67] Marquardt J H, Robinson H G and Hollberg L 1996 J. Opt. Soc. Am. B 13 1384[68] Coc A et al (ISOLDE Collaboration) 1987 Nucl. Phys. A 468 1[69] Brown B A 1998 Phys. Rev. C 58 220[70] Brown B A 1999 private communication[71] Grossman J M, Orozco L A, Pearson M R and Sprouse G D 2000 Phys. Scr. T 86 16[72] McAlexander W I, Abraham E R I and Hulet R G 1996 Phys. Rev. A 54 5[73] Oates C W, Vogel K R and Hall J L 1996 Phys. Rev. Lett. 76 2866[74] Volz U, Majerus M, Liebel H, Schmitt A and Schmoranzer H 1996 Phys. Rev. Lett. 76 2862[75] Jones K M, Julienne P S, Lett P D, Phillips W D, Tiesinga E and Williams C J 1996 Europhys. Lett. 35 85[76] Rafac R J, Tanner C E, Livingston A E, Kukla K W, Berry H G and Kurtz C A 1994 Phys. Rev. A 50 1976[77] Young L, Hill III W T, Sibener S J, Price S D, Tanner C E, Wieman C E and Leone S R 1994 Phys. Rev. A 50
2174[78] Rafac R J, Tanner C E, Livingston A E and Berry H G 1999 Phys. Rev. A 60 3648[79] Safronova M S, Johnson W R and Derevianko A 1999 Phys. Rev. A 60 4476[80] O’Connor D V and Phillips D 1984 Time Correlated Single Photon Counting (London: Academic)[81] Volz U and Schmoranzer H 1996 Phys. Scr. 65 48[82] Rafac R J and Tanner C E 1998 Phys. Rev. A 58 1087[83] Dzuba V A, Flambaum V V and Sushkov O P 1995 Phys. Rev. A 51 3454[84] van Wijngaarden W A and Xia J 1999 J. Quant. Spectrosc. Radiat. Transfer 61 557[85] Biemont E, Quinet P and van Renterghem V 1998 J. Phys. B 31 5301[86] Theodosiou C E 1994 Bull. Am. Phys. Soc. 39 1210[87] Guena J, Lintz M and Bouchiat M A 2005 Phys. Rev. A 71 042108[88] Gomez E, Baumer F, Lange A, Orozco L A and Sprouse G D 2005 Phys. Rev. A 72 012502[89] Johnson W R, Liu Z W and Sapirstein J 1996 At. Data Nucl. Data Tables 64 279[90] Dzuba V A, Flambaum V V and Ginges J S M 2001 Phys. Rev. A 63 062101[91] Marinescu M, Vrinceanu D and Sadeghpour H R 1998 Phys. Rev. A 58 R4259[92] Aubin S, Gomez E, Orozco L A and Sprouse G D 2003 Opt. Lett. 28 2055[93] Gomez E, Aubin S, Orozco L A and Sprouse G D 2004 J. Opt. Soc. Am. B 21 2058[94] Dzuba V A and Flambaum V V 2004 private communication[95] Aubin S, Gomez E, Gulyuz K, Orozco L A, Sell J and Sprouse G D Nucl. Phys. A 746 459[96] Safronova M S and Johnson W R 2000 Phys. Rev. A 62 022112[97] Porsev S G and Kozlov M G 2001 Phys. Rev. A 64 064101[98] Wu C S, Ambler E, Hayward R W, Hoppes D D and Hudson R P 1957 Phys. Rev. 105 1413[99] Garwin R L, Lederman L M and Weinrich M 1957 Phys. Rev. 105 1415
[100] Friedman J I and Telegdi V L 1957 Phys. Rev. 106 1681[101] Weinberg S 1967 Phys. Rev. Lett. 19 1264[102] Salam A 1968 8th Nobel Symp. on Elementary Particle Theory: Relativistic Groups and Analyticity (Lerum,
Sweden) ed N Svartholm (Amsterdam: Almqvist and Wicksell)[103] Glashow S L 1961 Nucl. Phys. 22 579[104] Zel’dovich Y B 1959 Sov. Phys.—JETP 9 682[105] Hasert F J et al (Gargamelle Collaboration) 1973 Phys. Lett. B 46 121[106] Barkov L M and Zolotorev M S 1978 JETP Lett. 27 357[107] Barkov L M and Zolotorev M S 1978 JETP Lett. 28 503
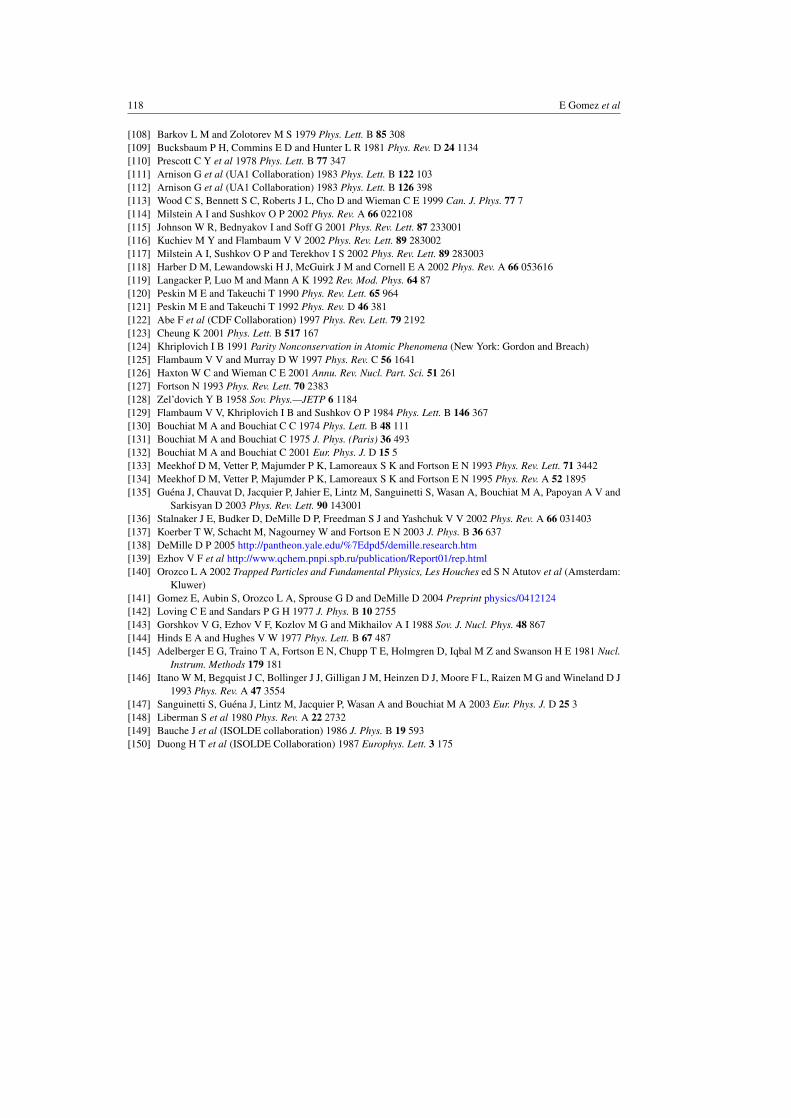
118 E Gomez et al
[108] Barkov L M and Zolotorev M S 1979 Phys. Lett. B 85 308[109] Bucksbaum P H, Commins E D and Hunter L R 1981 Phys. Rev. D 24 1134[110] Prescott C Y et al 1978 Phys. Lett. B 77 347[111] Arnison G et al (UA1 Collaboration) 1983 Phys. Lett. B 122 103[112] Arnison G et al (UA1 Collaboration) 1983 Phys. Lett. B 126 398[113] Wood C S, Bennett S C, Roberts J L, Cho D and Wieman C E 1999 Can. J. Phys. 77 7[114] Milstein A I and Sushkov O P 2002 Phys. Rev. A 66 022108[115] Johnson W R, Bednyakov I and Soff G 2001 Phys. Rev. Lett. 87 233001[116] Kuchiev M Y and Flambaum V V 2002 Phys. Rev. Lett. 89 283002[117] Milstein A I, Sushkov O P and Terekhov I S 2002 Phys. Rev. Lett. 89 283003[118] Harber D M, Lewandowski H J, McGuirk J M and Cornell E A 2002 Phys. Rev. A 66 053616[119] Langacker P, Luo M and Mann A K 1992 Rev. Mod. Phys. 64 87[120] Peskin M E and Takeuchi T 1990 Phys. Rev. Lett. 65 964[121] Peskin M E and Takeuchi T 1992 Phys. Rev. D 46 381[122] Abe F et al (CDF Collaboration) 1997 Phys. Rev. Lett. 79 2192[123] Cheung K 2001 Phys. Lett. B 517 167[124] Khriplovich I B 1991 Parity Nonconservation in Atomic Phenomena (New York: Gordon and Breach)[125] Flambaum V V and Murray D W 1997 Phys. Rev. C 56 1641[126] Haxton W C and Wieman C E 2001 Annu. Rev. Nucl. Part. Sci. 51 261[127] Fortson N 1993 Phys. Rev. Lett. 70 2383[128] Zel’dovich Y B 1958 Sov. Phys.—JETP 6 1184[129] Flambaum V V, Khriplovich I B and Sushkov O P 1984 Phys. Lett. B 146 367[130] Bouchiat M A and Bouchiat C C 1974 Phys. Lett. B 48 111[131] Bouchiat M A and Bouchiat C 1975 J. Phys. (Paris) 36 493[132] Bouchiat M A and Bouchiat C 2001 Eur. Phys. J. D 15 5[133] Meekhof D M, Vetter P, Majumder P K, Lamoreaux S K and Fortson E N 1993 Phys. Rev. Lett. 71 3442[134] Meekhof D M, Vetter P, Majumder P K, Lamoreaux S K and Fortson E N 1995 Phys. Rev. A 52 1895[135] Guena J, Chauvat D, Jacquier P, Jahier E, Lintz M, Sanguinetti S, Wasan A, Bouchiat M A, Papoyan A V and
Sarkisyan D 2003 Phys. Rev. Lett. 90 143001[136] Stalnaker J E, Budker D, DeMille D P, Freedman S J and Yashchuk V V 2002 Phys. Rev. A 66 031403[137] Koerber T W, Schacht M, Nagourney W and Fortson E N 2003 J. Phys. B 36 637[138] DeMille D P 2005 http://pantheon.yale.edu/%7Edpd5/demille.research.htm[139] Ezhov V F et al http://www.qchem.pnpi.spb.ru/publication/Report01/rep.html[140] Orozco L A 2002 Trapped Particles and Fundamental Physics, Les Houches ed S N Atutov et al (Amsterdam:
Kluwer)[141] Gomez E, Aubin S, Orozco L A, Sprouse G D and DeMille D 2004 Preprint physics/0412124[142] Loving C E and Sandars P G H 1977 J. Phys. B 10 2755[143] Gorshkov V G, Ezhov V F, Kozlov M G and Mikhailov A I 1988 Sov. J. Nucl. Phys. 48 867[144] Hinds E A and Hughes V W 1977 Phys. Lett. B 67 487[145] Adelberger E G, Traino T A, Fortson E N, Chupp T E, Holmgren D, Iqbal M Z and Swanson H E 1981 Nucl.
Instrum. Methods 179 181[146] Itano W M, Begquist J C, Bollinger J J, Gilligan J M, Heinzen D J, Moore F L, Raizen M G and Wineland D J
1993 Phys. Rev. A 47 3554[147] Sanguinetti S, Guena J, Lintz M, Jacquier P, Wasan A and Bouchiat M A 2003 Eur. Phys. J. D 25 3[148] Liberman S et al 1980 Phys. Rev. A 22 2732[149] Bauche J et al (ISOLDE collaboration) 1986 J. Phys. B 19 593[150] Duong H T et al (ISOLDE Collaboration) 1987 Europhys. Lett. 3 175
Related Documents