Eur. Phys. J. D 18, 309–318 (2002) DOI: 10.1140/epjd/e20020035 T HE EUROPEAN P HYSICAL JOURNAL D c EDP Sciences Societ` a Italiana di Fisica Springer-Verlag 2002 Spectroscopy of the regenerative soot Shoaib Ahmad a Accelerator Laboratory, PINSTECH, P.O. Nilore, Islamabad, Pakistan Received 2nd July 2001 and Received in final form 10 September 2001 Abstract. The mechanisms and processes of the formation of the regenerative soot in a graphite hollow cathode discharge that produces and emits carbon clusters are presented. Mass spectrometry with a spe- cially designed E ×B velocity filter analyzes the entire range of the charged clusters from C1 to ∼C4300 . The state of the carbon vapour within the source is evaluated by using the characteristic line emissions from the carbonaceous discharge whose formative mechanisms depend upon the kinetic and potential sputtering of the sooted cathode. The carbonaceous discharge generates atomic and ionic C and its clusters Cm (m ≥ 2), noble gas metastable atoms and ions, energetic electrons and photons in the cavity of the graphite hollow cathode. The parameters of soot formation and its recycling depend critically on the discharge parameters, the geometry of the hollow cathode and 3D profile of the cusp magnetic field contours. PACS. 34.50.Dy Interactions of atoms and molecules with surfaces; photon and electron emission; neutralization of ions – 34.80.Dp Atomic excitation and ionization by electron impact – 36.40.Wa Charged clusters 1 Introduction In this communication. we summarize the results of an ex- tended study that has been conducted on the mechanisms of production of the regenerative soot. Carbon clusters are be formed in the carbon vapour that is created in a cusp field, graphite hollow cathode discharge. This car- bonaceous discharge is characterized and diagnosed using mass spectrometry of the carbon clusters C + m (m ≥ 2) emitted from the source. The state of the carbon vapour within the source is monitored by photoemission spec- troscopy at various stages of soot formation and its recy- cling. The regenerative soot has been seen to provide an ideal clustering environment conducive to the formation of all sorts of clusters C + m (m ≤ 10 4 ) including the linear chains, rings, closed cages and even onions [1]. The mass spectrometry has identified the existence of sooting layers on graphite cathode’s inner walls as a pre-condition for the formation of clusters. In another study [2] the photon emission spectra of the atoms, molecules and ions (both positive as well as negative) were obtained from the en- ergetic heavy ion irradiation of the non-regenerative, flat graphite surfaces. The velocity spectra of these sputtered clusters C - 1 ...C - 4 showed similarities with results obtained by other workers from sublimation [3] or sputtering by ion bombardment [4] of graphite. However, there are signifi- cant differences in the formation of sputtered clusters and those that are produced in a regenerative sooting envi- ronment. The regenerative soot formation is identified by the state of excitation and ionisation of the carbonaceous a e-mail: [email protected] discharge. Our indicators are the relative number densities of the excited and ionised neon and carbon. Carbon cluster formation in sooting environments has led to the discovery of fullerenes in the laser ablated graphite plumes [5]. The technique for mass production of C 60 utilizes high pressure arc discharges between graphite electrodes [6]. This again is a non-regenerative arc discharge and efficient produc- tion of the “buckyballs” depends upon the discharge pa- rameters and the soot collection methodology. Whereas, in a graphite hollow cathode discharge one recycles the cathode deposited clusters. Therefore, it is a technique of carbon cluster production that relies on the regenera- tion of the cathode-deposited soot. By monitoring various stages of this regenerative sequences, we have been able to build a picture of the carbon cluster formation mecha- nisms. We will present the respective roles played by the neutral, excited and ionic states of C 1 ,C 2 and C 3 and higher clusters in the formative and sooting stages of the regenerative, carbonaceous discharges. We utilize a compact E × B velocity filter for the mass spectrometry of the carbon clusters [7]. On the basis of the analyses of these spectra, we identify the transition from a pure sputtering mode to a sooting one. We will also characterize the state of the carbon vapour during this transformation by using emission spectroscopy of the ex- cited and ionised plasma species. The excited and ionised component of the discharge is crucial for the sustenance of the discharge. In addition, we look at the role of the excited species in the recycling and regeneration of the cathode deposited clusters. We explore the roles played by the discharge parameters like the discharge voltage V dis ,

Welcome message from author
This document is posted to help you gain knowledge. Please leave a comment to let me know what you think about it! Share it to your friends and learn new things together.
Transcript
Eur. Phys. J. D 18, 309–318 (2002)DOI: 10.1140/epjd/e20020035 THE EUROPEAN
PHYSICAL JOURNAL Dc©
EDP SciencesSocieta Italiana di FisicaSpringer-Verlag 2002
Spectroscopy of the regenerative soot
Shoaib Ahmada
Accelerator Laboratory, PINSTECH, P.O. Nilore, Islamabad, Pakistan
Received 2nd July 2001 and Received in final form 10 September 2001
Abstract. The mechanisms and processes of the formation of the regenerative soot in a graphite hollowcathode discharge that produces and emits carbon clusters are presented. Mass spectrometry with a spe-cially designed E×B velocity filter analyzes the entire range of the charged clusters from C1 to ∼C4300 . Thestate of the carbon vapour within the source is evaluated by using the characteristic line emissions from thecarbonaceous discharge whose formative mechanisms depend upon the kinetic and potential sputtering ofthe sooted cathode. The carbonaceous discharge generates atomic and ionic C and its clusters Cm (m ≥ 2),noble gas metastable atoms and ions, energetic electrons and photons in the cavity of the graphite hollowcathode. The parameters of soot formation and its recycling depend critically on the discharge parameters,the geometry of the hollow cathode and 3D profile of the cusp magnetic field contours.
PACS. 34.50.Dy Interactions of atoms and molecules with surfaces; photon and electron emission;neutralization of ions – 34.80.Dp Atomic excitation and ionization by electron impact –36.40.Wa Charged clusters
1 Introduction
In this communication. we summarize the results of an ex-tended study that has been conducted on the mechanismsof production of the regenerative soot. Carbon clustersare be formed in the carbon vapour that is created in acusp field, graphite hollow cathode discharge. This car-bonaceous discharge is characterized and diagnosed usingmass spectrometry of the carbon clusters C+
m (m ≥ 2)emitted from the source. The state of the carbon vapourwithin the source is monitored by photoemission spec-troscopy at various stages of soot formation and its recy-cling. The regenerative soot has been seen to provide anideal clustering environment conducive to the formationof all sorts of clusters C+
m (m ≤ 104) including the linearchains, rings, closed cages and even onions [1]. The massspectrometry has identified the existence of sooting layerson graphite cathode’s inner walls as a pre-condition forthe formation of clusters. In another study [2] the photonemission spectra of the atoms, molecules and ions (bothpositive as well as negative) were obtained from the en-ergetic heavy ion irradiation of the non-regenerative, flatgraphite surfaces. The velocity spectra of these sputteredclusters C−1 ...C
−4 showed similarities with results obtained
by other workers from sublimation [3] or sputtering by ionbombardment [4] of graphite. However, there are signifi-cant differences in the formation of sputtered clusters andthose that are produced in a regenerative sooting envi-ronment. The regenerative soot formation is identified bythe state of excitation and ionisation of the carbonaceous
a e-mail: [email protected]
discharge. Our indicators are the relative number densitiesof the excited and ionised neon and carbon. Carbon clusterformation in sooting environments has led to the discoveryof fullerenes in the laser ablated graphite plumes [5]. Thetechnique for mass production of C60 utilizes high pressurearc discharges between graphite electrodes [6]. This againis a non-regenerative arc discharge and efficient produc-tion of the “buckyballs” depends upon the discharge pa-rameters and the soot collection methodology. Whereas,in a graphite hollow cathode discharge one recycles thecathode deposited clusters. Therefore, it is a techniqueof carbon cluster production that relies on the regenera-tion of the cathode-deposited soot. By monitoring variousstages of this regenerative sequences, we have been ableto build a picture of the carbon cluster formation mecha-nisms. We will present the respective roles played by theneutral, excited and ionic states of C1, C2 and C3 andhigher clusters in the formative and sooting stages of theregenerative, carbonaceous discharges.
We utilize a compact E×B velocity filter for the massspectrometry of the carbon clusters [7]. On the basis of theanalyses of these spectra, we identify the transition froma pure sputtering mode to a sooting one. We will alsocharacterize the state of the carbon vapour during thistransformation by using emission spectroscopy of the ex-cited and ionised plasma species. The excited and ionisedcomponent of the discharge is crucial for the sustenanceof the discharge. In addition, we look at the role of theexcited species in the recycling and regeneration of thecathode deposited clusters. We explore the roles played bythe discharge parameters like the discharge voltage Vdis,
310 The European Physical Journal D
discharge current idis and the support gas pressure Pg.Kratschmer et al. [6] had also identified the gas pressureas a critical parameter for sooting in the arc dischargebetween graphite electrodes. We evaluate the nature ofthe carbon vapour and the sources of the regeneration ofsoot by using different modes of excitation and ionisationof the atomic and ionic species by electrons, the estimationof the excitation temperatures Texc for various dischargespecies and the conspicuous transition from the C3 domi-nated discharge to a sooting plasma.
We have observed unique cluster forming propertiesin the regenerative sooting discharge of a graphite hol-low cathode in cusp magnetic field contours. In the initialstages of the evolution of the carbonaceous discharge, ki-netic sputtering is the main contributor. The second modeof discharge can be classified as the sooting mode whichmay be associated with high pressure discharges where thedensity of the ionised species C+ and Ne+ considerablyreduces. A constant but gentle surface erosion by poten-tial sputtering dominates this mode. Kinetic sputteringis also taking place and the process of cathode sputter-ing involves the two mechanisms together. Neutral (C∗1)and ionised carbon (C+) are the integral constituents ofall sooting processes and their densities are indicators ofthe soot formation on the cathode walls. We envisage thesooting mode to imply a loose agglomeration of carbonclusters on the cathode surface being recycled or regen-erated by kinetic sputtering with energies up to 500 eVas well as the collisions of metastable Ne∗ atoms with en-ergies E ∼ 16.7 eV. We believe that the transition fromthe sputtering proficient regime dominated by C3 to theregenerative soot has been identified and presented in thiscommunication. Furthermore, this information providesus an understanding the mechanisms that are responsi-ble for the formation of clusters including the fullerenes inthe regenerative sooting discharges.
2 Mechanisms of soot formation
During 1984–1985 carbon soot was redefined after the ex-periments on the laser ablation of graphite followed by thesupersonic expansion of the carbonaceous vapour [5,8].The agglomerates of pure carbon clusters so formed in-clude the closed caged carbon clusters-fullerenes. Togetherthese clusters produce what is now universally regarded asthe soot. Various other techniques have been developed inthe last decade for the production of soot. These includehigh pressure arc discharge by Kratschmer et al. [6] as aspecialist technique exclusively for the production of C60
and C70. Electron microscopy of the soot bombarded byhigh energy electrons has shown that the shelled or carbononion structures can also be produced [9–11].
Energetic ion irradiation in polymers can induce clus-tering of carbon atoms that has been observed to leadto optical blackening, electrical conductivity changes andhas also been studied for ion induced chemical effects [12].These authors invoked mechanisms of nuclear as well aselectronic energy transfer from ion to the carbon atoms
in the solid matrix to explain the ion-induced cluster-ing processes. Orders of magnitude estimate for the sizeof graphitic islands or carbon rich zones range from100−500 A. Similar experiments with MeV heavy ionsputtering of polymers at Uppsala [13] identified the for-mation of fullerenes in MeV iodine ion bombarded PVDFtargets. The fullerene yield measurements as a functionof ion fluence indicated clustering to be dependent onion-induced chemical changes in the polymer. Chadder-ton et al. [14] have reported the synthesis of fullerenesafter 130 MeV/amu Dy22+ ion bombardment of graphite.Chromatography of their irradiated samples has showntraces of C60. At PINSTECH, by using 100 keV Ar+,Kr+ and Xe+ beams on amorphous graphite, we have seenclear evidence of ion induced cluster formation in the en-ergy measurements of the direct recoiling clusters from ionbombarded amorphous graphite surfaces [15]. We variedion energy and the dose with irradiations done at grazingincidence angles.
3 Soot regeneration
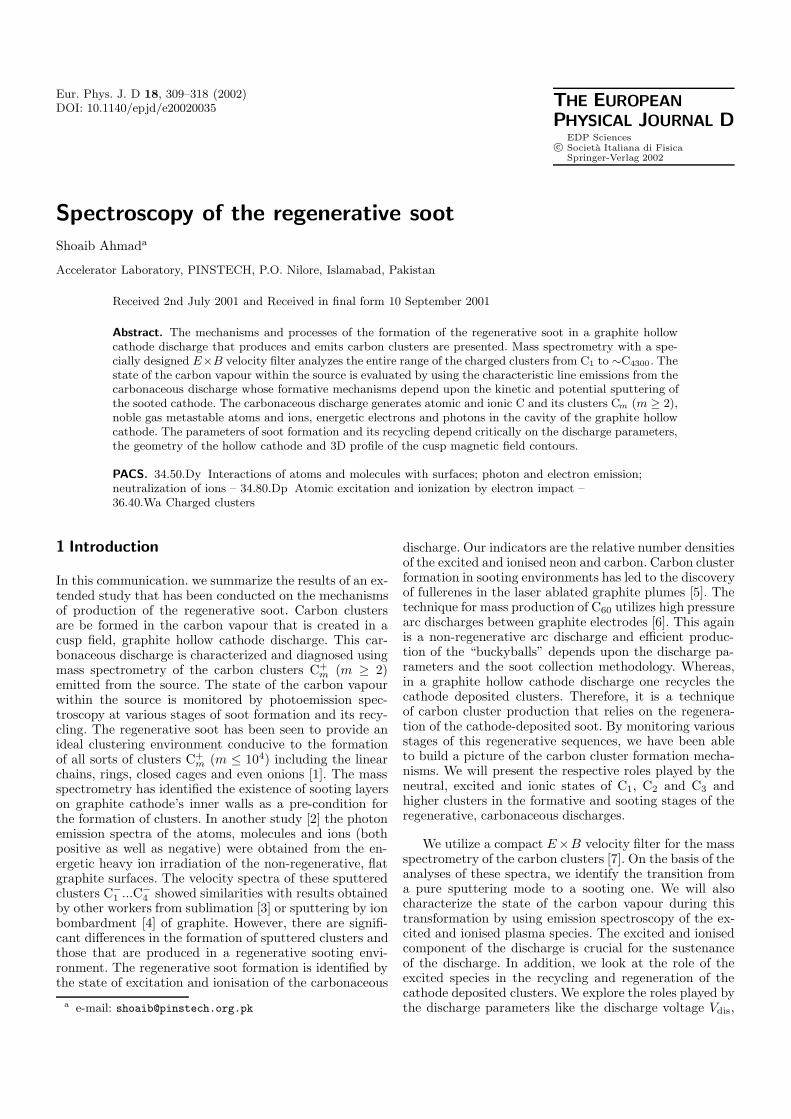
Understanding of the mechanisms of clustering may lie inthe synthesis of common features of the widely differentphysical methods of producing soot. The aim of the de-sign of a tunable, soot regenerative source is to create arecyclable carbon vapour environment and to study theformative as well as dissociative stages of a carbon clus-ter. Such a source has been designed and the technicaldetails have been presented elsewhere [1]. The schematicdiagram of the regenerative sooting source is shown inFigure 1. Its distinctive features depend upon the sput-tering efficiency of the cathode and the subsequent sootformation properties leading to the clustering of carbonatoms and ions. A steady stream of carbon atoms is sput-tered into the glow discharge plasma from graphite hollowcathode surface. The key to the ignition and sustenanceof the discharge at neon pressures ≈10−1−102 mbar is aset of six bar magnets wrapped around the hollow cathodeproviding an axially extended set of cusp magnetic fieldcontours. Xe, Ar, Ne and He have been used to providethe initial noble gas discharge which transforms into a car-bonaceous one as a function of the discharge conditions.The sooting discharge so produced demonstrates a tempo-ral growth in the densities of sputtered carbon atoms andions as a function of the discharge voltage Vdis and currentidis and support gas pressure Pg. The ions anchor onto aset of field contours, the direction of their consequent gy-rational motion and clustering probability is determinedby collision with electrons, neutral and excited C and thesupport gas atoms. The hexapole field confinement is de-signed so that the radial Br and axial Bz field lines pro-duce the combined 3D magnetic field contours Bz(r, θ)shown in Figure 1c. The streams of gyrating C+
1 , Ne+ andC+m ions with large collision cross-sections eventually lead
to the inside walls of the graphite cathode surface wherethey impact with E ≈ qVdis, where q is the charge on theion. The ion-impact continuously modifies the graphitecathode surface properties and it is covered with soot.
Shoaib Ahmad: Spectroscopy of the regenerative soot 311
b
c�B ( r ) ��
�
Z
rmax
rHA
rm ax
6 7
G a s
3� 5
1
2
a
r
z
2 0 m m
1 .5 kG
z
Fig. 1. The schematic diagram of the source is shown with graphite Hollow Cathode and Hollow Anode. The cusp magneticfield Bz(r, θ) is also indicated with arrows. The numbered items are described in detail in reference [1].
These sooted layers are recycled by kinetic sputtering bythe energetic ions as well as potentially sputtered with themetastable species of the discharge [16]. Velocity spectraof the emitted charged species have shown the dependenceof carbon cluster emission on the state of sooting in thesource. Spectrometry of the regenerative soot is done bya compact, permanent magnet based E×B velocity filterthat has specially been developed for the detection anddiagnostics of large carbon clusters [7]. Different mass an-alyzing techniques can be employed for the detection ofsuch a large range of cluster masses. These include time-of-flight (TOF), momentum analysis and E × B velocityfiltration. For the on-line mass analysis of clusters veloc-ity analysis has certain advantages over the momentumanalysis. The TOF technique uses pulsed beams and hassuperior resolution especially in the higher mass range.However, the E × B velocity filter has demonstrated itsutility as a low cost, useful diagnostic tool for the massdetection of very small to very large clusters as has beendemonstrated [1,7].
4 Spectroscopy of the regenerative soot
4.1 Mass spectrometry with E× B velocity filter
The permanent magnet based E × B velocity filter canperform mass analysis in a characteristic way. All massesare deflected by the fixed magnetic field according to theirrespective masses. The straight through beam containsthe desired mass at the compensating electric field ε0 =B0/v0, where B0 is the magnetic field intensity along theaxis and v0 – the velocity of a particular ion. All chargedspecies including monoatomic ions or the ionised clusters
�S
�Velocity��
������Filter�
��
Extractor
Lens��
�
���
��
� ��
�������
�HA�
HC��
a
l
N
ParticaleDetector
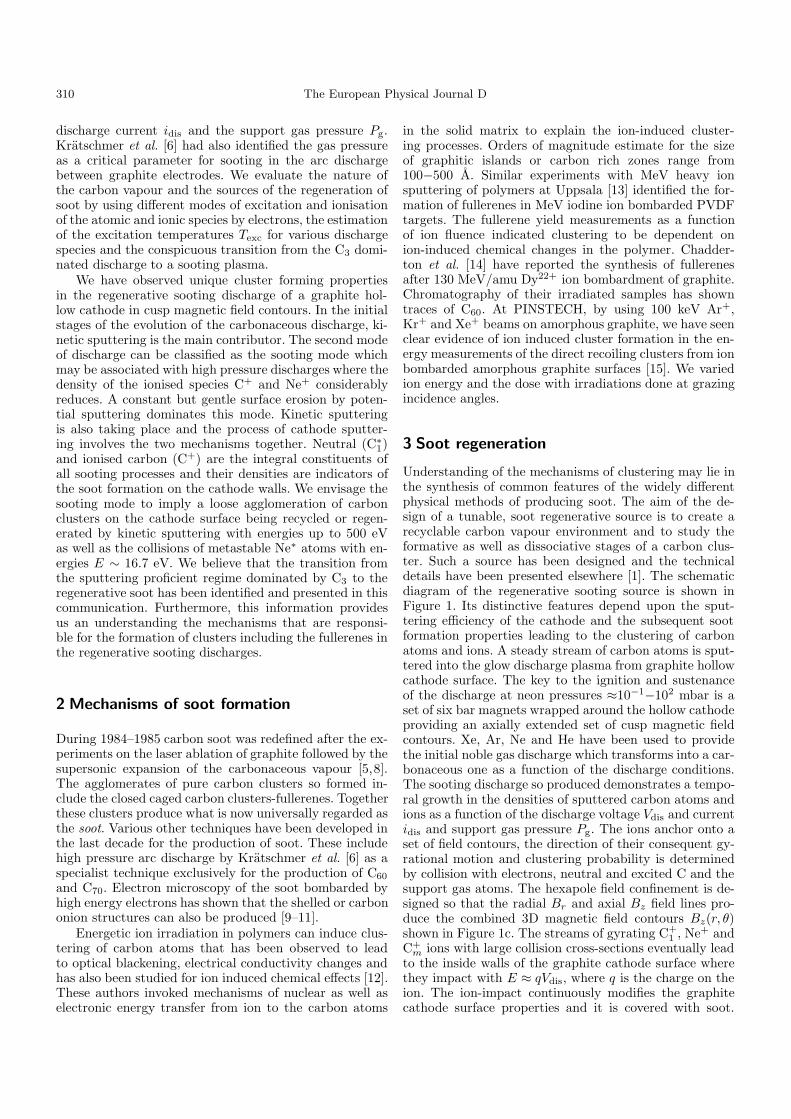
Fig. 2. It shows the cluster ion source, extraction lens, colli-mators, the velocity filter of dimension a. The Faraday cage isat distance l from the filter. The source is composed of a Hol-low Cathode (HC), Hollow Anode (HA) and a set of hexapolebar magnets shown with arrows.
are expected to have the same energy. A velocity spectrumalways contains all masses irrespective of their mass: theresolveability on the other hand is dependent upon certaindesign features. Figure 2 shows the experimental arrange-ment for the detection of carbon clusters Cm from theregenerative sooting source. A well collimated set of ex-traction lens set up provides a ±0.1◦ beam to the velocityfilter of effective length a. A picoampere meter measuresthe analyzed masses on a Faraday cage l mm away fromthe exit of the filter, in our case l = 1 500 mm. The detec-tion of heavy carbon clusters with an E×B velocity filterdepends on the highest possible magnetic fieldB0 and thatsets other parameters accordingly. We have B0 = 0.35 Ton the axis of the filter between the poles that are 10 mmapart. Specially shaped electrodes provide the compensat-ing electric field ε0 for the straight through masses. Theseelectrodes are slightly extended outwards to compensatefor the magnet’s edge effects. The resolution of the E×B
312 The European Physical Journal D
0 200 400 600 800 1000
0
20
40
60
80
100
120
140
C3
C4
IonCurren
t(pA)
Velocity Filter's Deflector Potential (Volts)
b
C200
C60
C11
C6
C14
C19
200 400 600 800 1000
0
2
4
6
8
10
a
C40
C19
C11
C7
C5
C4
C2
C3
C1
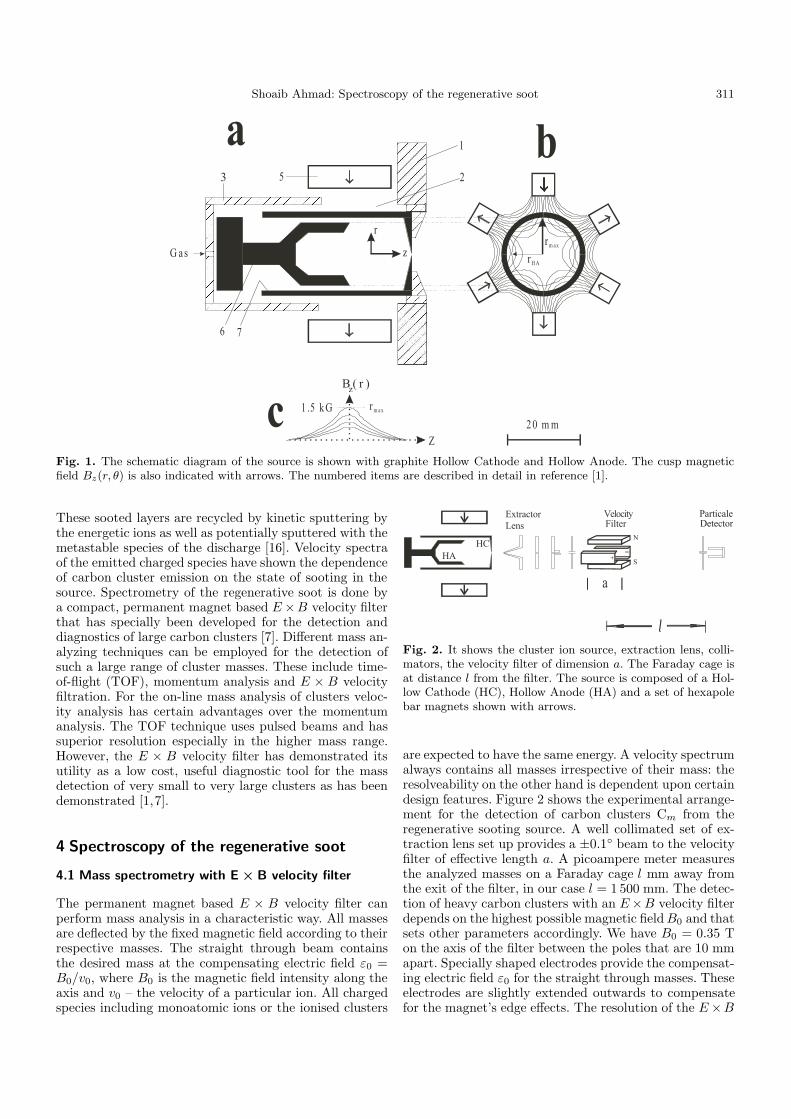
Fig. 3. The velocity spectrum of the initial sooting stagesof operation with Ne is shown in (a) with pressure in thesource Pg = 2−3 × 10⁻³ mbar, Vd = 0.5 kV, Id = 50 mAand Vextraction = 2 kV. Clusters from C1 to C19 are presentin the spectrum. (b) Shows results from a well sooted sourceoperated with Ne at ≈ 60 watts for 20 hours. It has been ob-tained with Xe as a source gas. The emitted charged clustershave a range of fullerenes from m ≈ 200 to C36 as well as therings, chains and linear regimes of clusters. Note the differencein cluster ion intensities in the two spectra.
velocity filter is determined by the dispersion d of massesm0± δm0 from the resolved mass m0 that travels straightthrough the filter with velocity v0 (= B0/ε0). Dispersiond ∝ al (δm0/m0)(ε0/Vext) where a and l are the lengths ofthe velocity filter unit and the flight path, respectively. Fora given ratio δm0/m0, the dispersion d can be enhancedby stacking multiple filter units since d ∝ na, n being thenumber of filter units or increasing the flight path l andalso by enhancing Vext.
We have reported [17] the observation of the two dis-tinct stages of sooting; one that is the initial sputter-ing dominated stage where lower cluster densities of pre-dominantly the linear chains and rings are obtained fromC1 to C19 as shown in Figure 3a. The later stage of awell sooted discharge is obtained with prolonged opera-tion with high power inputs. It produces the entire rangeof clusters from linear chains and rings to closed cagedfullerenes and perhaps, even the carbon onions. Figure 3bshows the masses higher than C10 up to C4350. In this
spectrum peaks due to C76, C60, C50, C44 and C40 havea mass difference of C2. Up to C40 we have the usualfullerene spectrum. The ring type cluster series startingfrom C24, C21, C19, C15 to C11. This is a familiar pat-tern of carbon cluster fragmentation for the fullerenes Cm(m ≥ 32) and rings and linear chains Cm (m ≥ 24) andhas been seen in the time-of-flight spectrometry of laserablated graphite experiments [5,6].
4.2 Photon emission spectroscopy
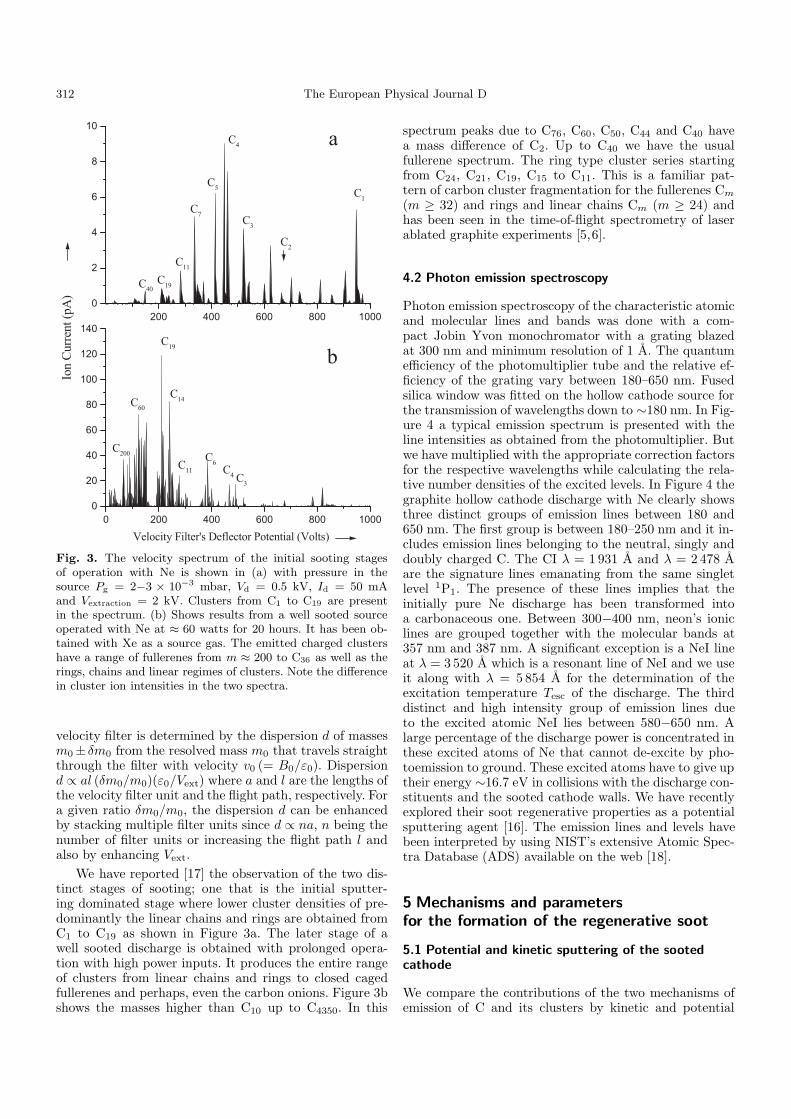
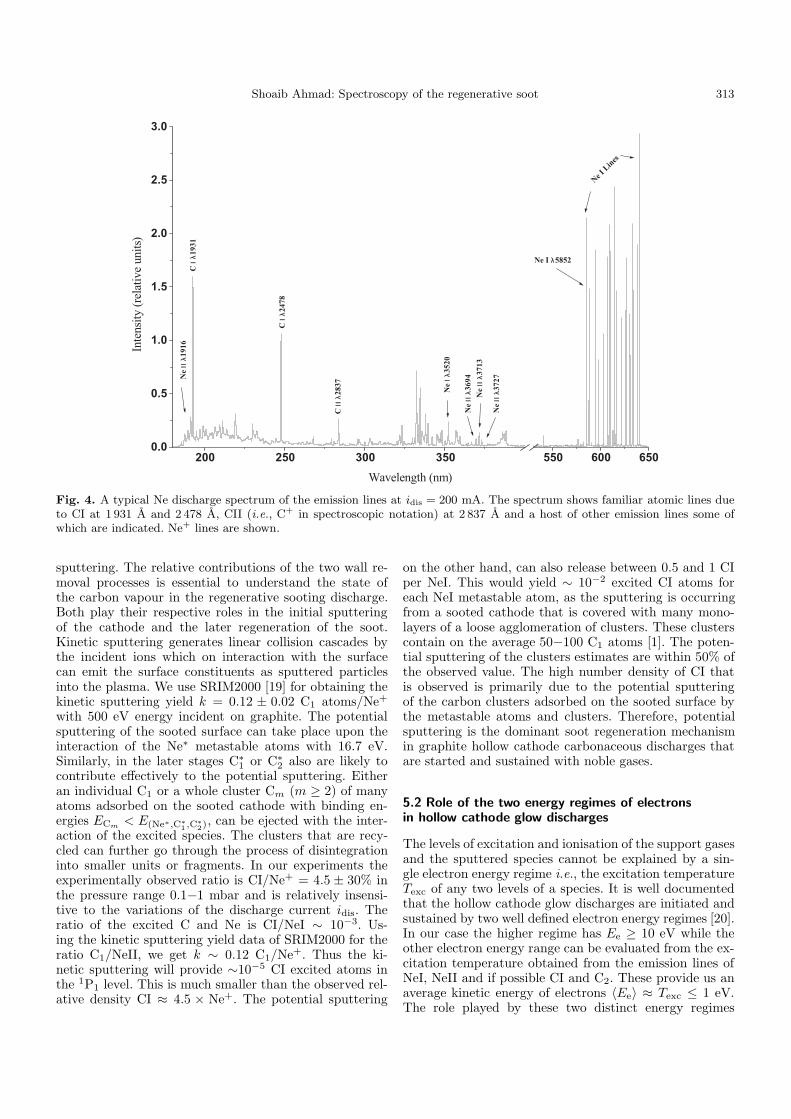
Photon emission spectroscopy of the characteristic atomicand molecular lines and bands was done with a com-pact Jobin Yvon monochromator with a grating blazedat 300 nm and minimum resolution of 1 A. The quantumefficiency of the photomultiplier tube and the relative ef-ficiency of the grating vary between 180–650 nm. Fusedsilica window was fitted on the hollow cathode source forthe transmission of wavelengths down to ∼180 nm. In Fig-ure 4 a typical emission spectrum is presented with theline intensities as obtained from the photomultiplier. Butwe have multiplied with the appropriate correction factorsfor the respective wavelengths while calculating the rela-tive number densities of the excited levels. In Figure 4 thegraphite hollow cathode discharge with Ne clearly showsthree distinct groups of emission lines between 180 and650 nm. The first group is between 180–250 nm and it in-cludes emission lines belonging to the neutral, singly anddoubly charged C. The CI λ = 1 931 A and λ = 2 478 Aare the signature lines emanating from the same singletlevel 1P1. The presence of these lines implies that theinitially pure Ne discharge has been transformed intoa carbonaceous one. Between 300−400 nm, neon’s ioniclines are grouped together with the molecular bands at357 nm and 387 nm. A significant exception is a NeI lineat λ = 3 520 A which is a resonant line of NeI and we useit along with λ = 5 854 A for the determination of theexcitation temperature Tesc of the discharge. The thirddistinct and high intensity group of emission lines dueto the excited atomic NeI lies between 580−650 nm. Alarge percentage of the discharge power is concentrated inthese excited atoms of Ne that cannot de-excite by pho-toemission to ground. These excited atoms have to give uptheir energy ∼16.7 eV in collisions with the discharge con-stituents and the sooted cathode walls. We have recentlyexplored their soot regenerative properties as a potentialsputtering agent [16]. The emission lines and levels havebeen interpreted by using NIST’s extensive Atomic Spec-tra Database (ADS) available on the web [18].
5 Mechanisms and parametersfor the formation of the regenerative soot
5.1 Potential and kinetic sputtering of the sootedcathode
We compare the contributions of the two mechanisms ofemission of C and its clusters by kinetic and potential
Shoaib Ahmad: Spectroscopy of the regenerative soot 313
200 250 300 350 550 600 650
0.0
0.5
1.0
1.5
2.0
2.5
3.0
NeILines
Ne I λ5852
CΙΙ
λ 2837
CΙλ
2478
CΙλ
1931
Ne
ΙΙλ3
694
Ne
ΙΙλ3
727
Ne
ΙΙλ 3
713
Ne
Ιλ3520
Ne
ΙΙλ 1
916
Intensity
(relativeunits)
Wavelength (nm)
Fig. 4. A typical Ne discharge spectrum of the emission lines at idis = 200 mA. The spectrum shows familiar atomic lines dueto CI at 1 931 A and 2 478 A, CII (i.e., C+ in spectroscopic notation) at 2 837 A and a host of other emission lines some ofwhich are indicated. Ne+ lines are shown.
sputtering. The relative contributions of the two wall re-moval processes is essential to understand the state ofthe carbon vapour in the regenerative sooting discharge.Both play their respective roles in the initial sputteringof the cathode and the later regeneration of the soot.Kinetic sputtering generates linear collision cascades bythe incident ions which on interaction with the surfacecan emit the surface constituents as sputtered particlesinto the plasma. We use SRIM2000 [19] for obtaining thekinetic sputtering yield k = 0.12 ± 0.02 C1 atoms/Ne+
with 500 eV energy incident on graphite. The potentialsputtering of the sooted surface can take place upon theinteraction of the Ne∗ metastable atoms with 16.7 eV.Similarly, in the later stages C∗1 or C∗2 also are likely tocontribute effectively to the potential sputtering. Eitheran individual C1 or a whole cluster Cm (m ≥ 2) of manyatoms adsorbed on the sooted cathode with binding en-ergies ECm < E(Ne∗,C∗1 ,C
∗2), can be ejected with the inter-
action of the excited species. The clusters that are recy-cled can further go through the process of disintegrationinto smaller units or fragments. In our experiments theexperimentally observed ratio is CI/Ne+ = 4.5 ± 30% inthe pressure range 0.1−1 mbar and is relatively insensi-tive to the variations of the discharge current idis. Theratio of the excited C and Ne is CI/NeI ∼ 10−3. Us-ing the kinetic sputtering yield data of SRIM2000 for theratio C1/NeII, we get k ∼ 0.12 C1/Ne+. Thus the ki-netic sputtering will provide ∼10−5 CI excited atoms inthe 1P1 level. This is much smaller than the observed rel-ative density CI ≈ 4.5 × Ne+. The potential sputtering
on the other hand, can also release between 0.5 and 1 CIper NeI. This would yield ∼ 10−2 excited CI atoms foreach NeI metastable atom, as the sputtering is occurringfrom a sooted cathode that is covered with many mono-layers of a loose agglomeration of clusters. These clusterscontain on the average 50−100 C1 atoms [1]. The poten-tial sputtering of the clusters estimates are within 50% ofthe observed value. The high number density of CI thatis observed is primarily due to the potential sputteringof the carbon clusters adsorbed on the sooted surface bythe metastable atoms and clusters. Therefore, potentialsputtering is the dominant soot regeneration mechanismin graphite hollow cathode carbonaceous discharges thatare started and sustained with noble gases.
5.2 Role of the two energy regimes of electronsin hollow cathode glow discharges
The levels of excitation and ionisation of the support gasesand the sputtered species cannot be explained by a sin-gle electron energy regime i.e., the excitation temperatureTexc of any two levels of a species. It is well documentedthat the hollow cathode glow discharges are initiated andsustained by two well defined electron energy regimes [20].In our case the higher regime has Ee ≥ 10 eV while theother electron energy range can be evaluated from the ex-citation temperature obtained from the emission lines ofNeI, NeII and if possible CI and C2. These provide us anaverage kinetic energy of electrons 〈Ee〉 ≈ Texc ≤ 1 eV.The role played by these two distinct energy regimes
314 The European Physical Journal D
Table 1. Ionisation rate coefficient αi cm3 s−1 for the atomicand ionic species of C and Ne, CI–CII, CII–CIII, CIII–CIVand NeI–NeII, NeII–NeIII. All ionisations are from the groundstate.
1 eV 10 eV 100 eV
CI—CII 1.93 × 10⁻¹³ 1.7× 10⁻⁸ 9.7× 10⁻⁸
CII–CIII 1.2× 10⁻¹⁹ 1.3× 10⁻⁹ 2.6× 10⁻⁸
CIII–CIV 4× 10⁻³⁰ 5.8× 10⁻¹¹ 7.4× 10⁻⁹
NeI–NeII 1.15 × 10⁻¹⁸ 1.32× 10⁻⁹ 4.2× 10⁻⁹
NeII–NeIII 3.25 × 10⁻²⁸ 9× 10⁻¹¹ 1.8× 10⁻⁸
of electrons can provide an explanation of the ratherhigh densities of the ionised species CII, CIII, NeII andNeIII that are present even at idis as low as 50 mA. Ta-ble 1 is prepared by using Lotz’s’ semi empirical formu-lation [21] for the ionisation rate coefficients αi cm3 s−1
for the successively higher ionisation stages of C and Ne.For these calculations Maxwellian velocity distribution forthe electrons is assumed and all excitations and ionisa-tions are from the ground state. At Te ∼ 1 eV or lesswhich can be approximated as the discharge temperaturein our case, the presence of the higher ionised species ismuch less probable. However, at higher electron energiesEe ≥ 10 eV, a significant increase in αi occurs. Between10−100 eV energy range, the electrons can ionise all ionicstages of C and Ne with similar orders of magnitude prob-abilities. The spectral line ratios of the C ions have beenused to evaluate Te for the carbon impurities in the toka-mak plasmas for CII to CIV in the Te ∼ 4− 40 eV range.Since in our case the Te ∼ 1 eV, the required high energyelectrons are provided by the cathode for the ionisationfor the higher ionisation levels of C and Ne. These areavailable due to the secondary electron emission from thecathode but in much reduced intensities compared withthe thermal electrons.
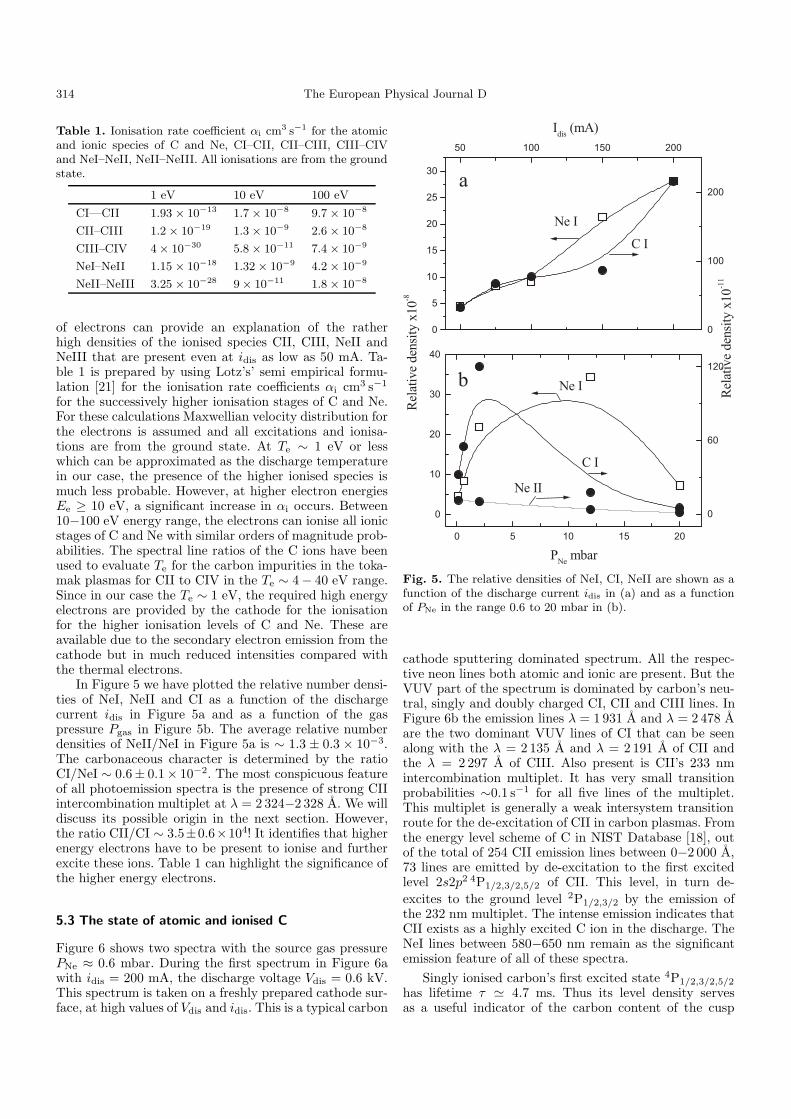
In Figure 5 we have plotted the relative number densi-ties of NeI, NeII and CI as a function of the dischargecurrent idis in Figure 5a and as a function of the gaspressure Pgas in Figure 5b. The average relative numberdensities of NeII/NeI in Figure 5a is ∼ 1.3 ± 0.3 × 10⁻³.The carbonaceous character is determined by the ratioCI/NeI ∼ 0.6± 0.1× 10⁻². The most conspicuous featureof all photoemission spectra is the presence of strong CIIintercombination multiplet at λ = 2 324−2 328 A. We willdiscuss its possible origin in the next section. However,the ratio CII/CI ∼ 3.5±0.6×10⁴! It identifies that higherenergy electrons have to be present to ionise and furtherexcite these ions. Table 1 can highlight the significance ofthe higher energy electrons.
5.3 The state of atomic and ionised C
Figure 6 shows two spectra with the source gas pressurePNe ≈ 0.6 mbar. During the first spectrum in Figure 6awith idis = 200 mA, the discharge voltage Vdis = 0.6 kV.This spectrum is taken on a freshly prepared cathode sur-face, at high values of Vdis and idis. This is a typical carbon
0 5 10 15 20
0
10
20
30
40
PNembar
Relativedensity
x10-8
0
60
120
b
C I
Ne II
Ne I
Relativedensity
x10-11
0
5
10
15
20
25
30
50 100 150 200
C I
Ne I
Idis(mA)
0
100
200
a
Fig. 5. The relative densities of NeI, CI, NeII are shown as afunction of the discharge current idis in (a) and as a functionof PNe in the range 0.6 to 20 mbar in (b).
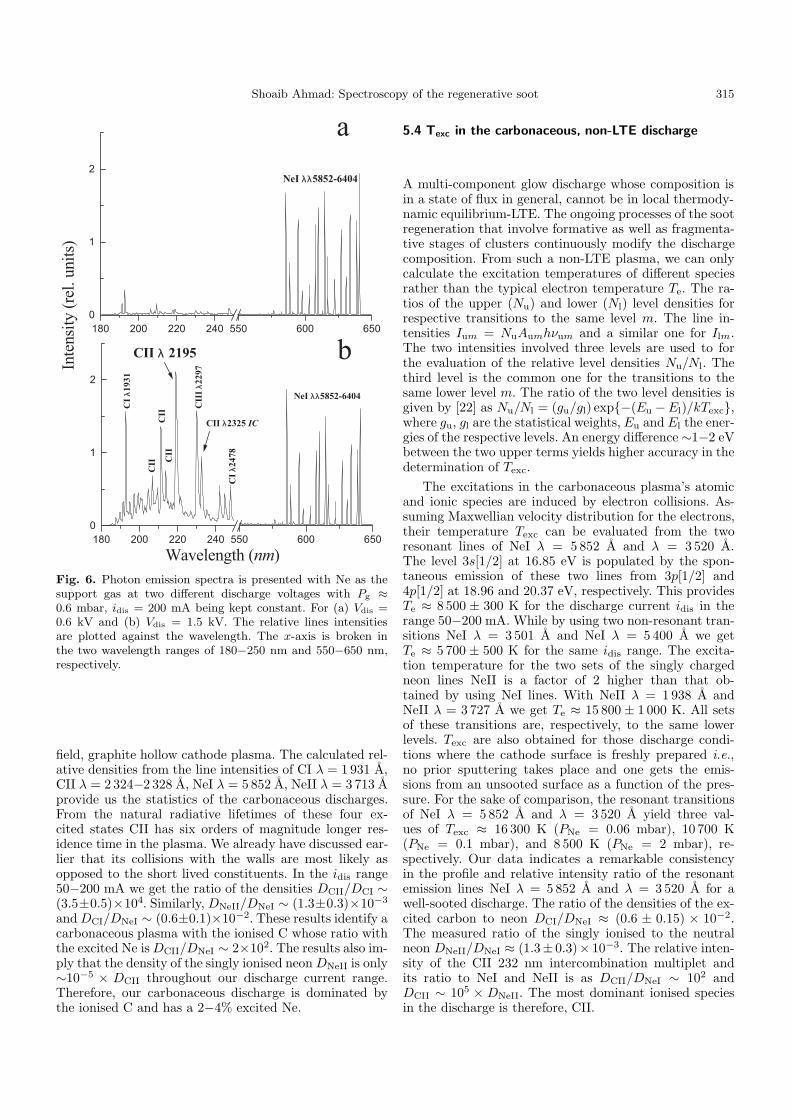
cathode sputtering dominated spectrum. All the respec-tive neon lines both atomic and ionic are present. But theVUV part of the spectrum is dominated by carbon’s neu-tral, singly and doubly charged CI, CII and CIII lines. InFigure 6b the emission lines λ = 1 931 A and λ = 2 478 Aare the two dominant VUV lines of CI that can be seenalong with the λ = 2 135 A and λ = 2 191 A of CII andthe λ = 2 297 A of CIII. Also present is CII’s 233 nmintercombination multiplet. It has very small transitionprobabilities ∼0.1 s−1 for all five lines of the multiplet.This multiplet is generally a weak intersystem transitionroute for the de-excitation of CII in carbon plasmas. Fromthe energy level scheme of C in NIST Database [18], outof the total of 254 CII emission lines between 0−2 000 A,73 lines are emitted by de-excitation to the first excitedlevel 2s2p2 4P1/2,3/2,5/2 of CII. This level, in turn de-excites to the ground level 2P1/2,3/2 by the emission ofthe 232 nm multiplet. The intense emission indicates thatCII exists as a highly excited C ion in the discharge. TheNeI lines between 580−650 nm remain as the significantemission feature of all of these spectra.
Singly ionised carbon’s first excited state 4P1/2,3/2,5/2
has lifetime τ ' 4.7 ms. Thus its level density servesas a useful indicator of the carbon content of the cusp
Shoaib Ahmad: Spectroscopy of the regenerative soot 315
180 200 220 240 550 600 650
0
1
2
Wavelength (nm)
b
NeI λλ5852-6404
Intensity
(rel.units)
180 200 220 240 550 600 650
0
1
2
CII CII
a
NeI λλ5852-6404
CII
CII λ 2195
CIII
λ 2297
CII λ2325 IC
CI
λ 2478
CI
λ 1931
Fig. 6. Photon emission spectra is presented with Ne as thesupport gas at two different discharge voltages with Pg ≈0.6 mbar, idis = 200 mA being kept constant. For (a) Vdis =0.6 kV and (b) Vdis = 1.5 kV. The relative lines intensitiesare plotted against the wavelength. The x-axis is broken inthe two wavelength ranges of 180−250 nm and 550−650 nm,respectively.
field, graphite hollow cathode plasma. The calculated rel-ative densities from the line intensities of CI λ = 1 931 A,CII λ = 2 324−2 328 A, NeI λ = 5 852 A, NeII λ = 3 713 Aprovide us the statistics of the carbonaceous discharges.From the natural radiative lifetimes of these four ex-cited states CII has six orders of magnitude longer res-idence time in the plasma. We already have discussed ear-lier that its collisions with the walls are most likely asopposed to the short lived constituents. In the idis range50−200 mA we get the ratio of the densities DCII/DCI ∼(3.5±0.5)×104. Similarly, DNeII/DNeI ∼ (1.3±0.3)×10−3
andDCI/DNeI ∼ (0.6±0.1)×10−2. These results identify acarbonaceous plasma with the ionised C whose ratio withthe excited Ne isDCII/DNeI ∼ 2×10². The results also im-ply that the density of the singly ionised neon DNeII is only∼10−5 × DCII throughout our discharge current range.Therefore, our carbonaceous discharge is dominated bythe ionised C and has a 2−4% excited Ne.
5.4 Texc in the carbonaceous, non-LTE discharge
A multi-component glow discharge whose composition isin a state of flux in general, cannot be in local thermody-namic equilibrium-LTE. The ongoing processes of the sootregeneration that involve formative as well as fragmenta-tive stages of clusters continuously modify the dischargecomposition. From such a non-LTE plasma, we can onlycalculate the excitation temperatures of different speciesrather than the typical electron temperature Te. The ra-tios of the upper (Nu) and lower (Nl) level densities forrespective transitions to the same level m. The line in-tensities Ium = NuAumhνum and a similar one for Ilm.The two intensities involved three levels are used to forthe evaluation of the relative level densities Nu/Nl. Thethird level is the common one for the transitions to thesame lower level m. The ratio of the two level densities isgiven by [22] as Nu/Nl = (gu/gl) exp{−(Eu −El)/kTexc},where gu, gl are the statistical weights, Eu and El the ener-gies of the respective levels. An energy difference ∼1−2 eVbetween the two upper terms yields higher accuracy in thedetermination of Texc.
The excitations in the carbonaceous plasma’s atomicand ionic species are induced by electron collisions. As-suming Maxwellian velocity distribution for the electrons,their temperature Texc can be evaluated from the tworesonant lines of NeI λ = 5 852 A and λ = 3 520 A.The level 3s[1/2] at 16.85 eV is populated by the spon-taneous emission of these two lines from 3p[1/2] and4p[1/2] at 18.96 and 20.37 eV, respectively. This providesTe ≈ 8 500 ± 300 K for the discharge current idis in therange 50−200 mA. While by using two non-resonant tran-sitions NeI λ = 3 501 A and NeI λ = 5 400 A we getTe ≈ 5 700 ± 500 K for the same idis range. The excita-tion temperature for the two sets of the singly chargedneon lines NeII is a factor of 2 higher than that ob-tained by using NeI lines. With NeII λ = 1 938 A andNeII λ = 3 727 A we get Te ≈ 15 800± 1 000 K. All setsof these transitions are, respectively, to the same lowerlevels. Texc are also obtained for those discharge condi-tions where the cathode surface is freshly prepared i.e.,no prior sputtering takes place and one gets the emis-sions from an unsooted surface as a function of the pres-sure. For the sake of comparison, the resonant transitionsof NeI λ = 5 852 A and λ = 3 520 A yield three val-ues of Texc ≈ 16 300 K (PNe = 0.06 mbar), 10 700 K(PNe = 0.1 mbar), and 8 500 K (PNe = 2 mbar), re-spectively. Our data indicates a remarkable consistencyin the profile and relative intensity ratio of the resonantemission lines NeI λ = 5 852 A and λ = 3 520 A for awell-sooted discharge. The ratio of the densities of the ex-cited carbon to neon DCI/DNeI ≈ (0.6 ± 0.15) × 10−2.The measured ratio of the singly ionised to the neutralneon DNeII/DNeI ≈ (1.3± 0.3)× 10−3. The relative inten-sity of the CII 232 nm intercombination multiplet andits ratio to NeI and NeII is as DCII/DNeI ∼ 102 andDCII ∼ 105 × DNeII. The most dominant ionised speciesin the discharge is therefore, CII.
316 The European Physical Journal D
-1 0 1
0
4
8
12
LogPNeon
(mbar)
C2(0,0)(rel.den
sity)
0
10
20
30
40
C2(0,0)/C
I
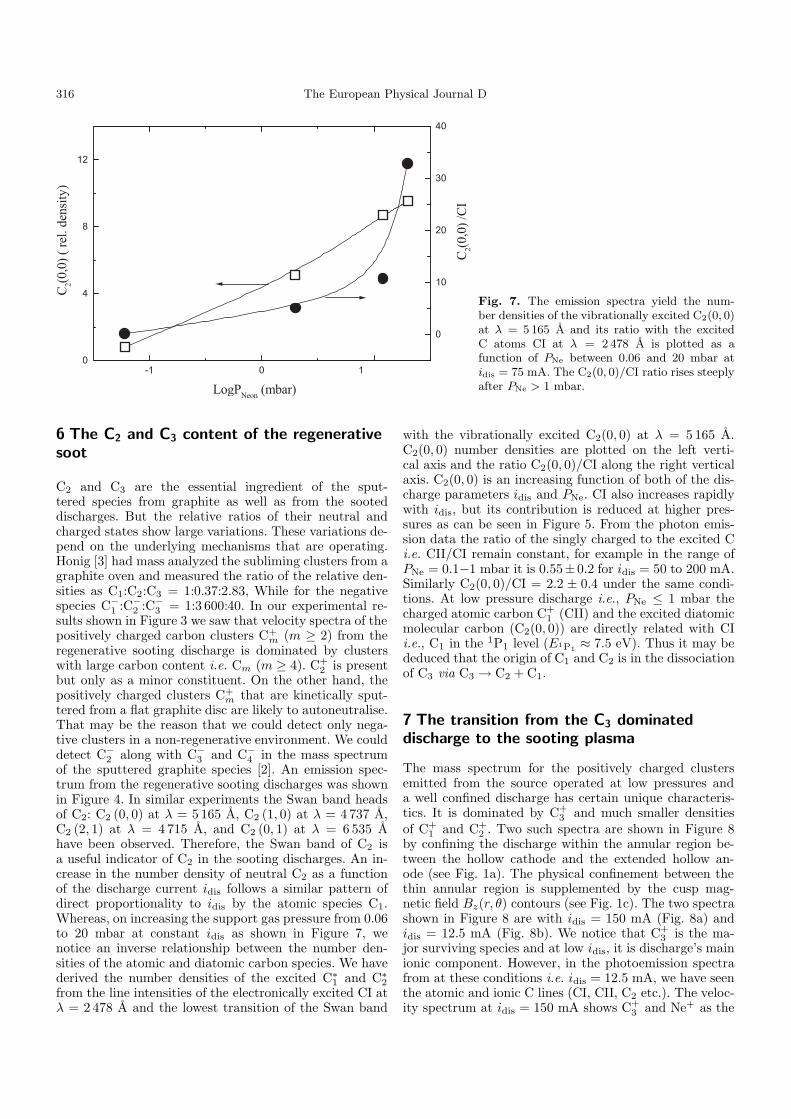
Fig. 7. The emission spectra yield the num-ber densities of the vibrationally excited C2(0, 0)at λ = 5 165 A and its ratio with the excitedC atoms CI at λ = 2 478 A is plotted as afunction of PNe between 0.06 and 20 mbar atidis = 75 mA. The C2(0, 0)/CI ratio rises steeplyafter PNe > 1 mbar.
6 The C2 and C3 content of the regenerativesoot
C2 and C3 are the essential ingredient of the sput-tered species from graphite as well as from the sooteddischarges. But the relative ratios of their neutral andcharged states show large variations. These variations de-pend on the underlying mechanisms that are operating.Honig [3] had mass analyzed the subliming clusters from agraphite oven and measured the ratio of the relative den-sities as C1:C2:C3 = 1:0.37:2.83, While for the negativespecies C−1 :C−2 :C−3 = 1:3 600:40. In our experimental re-sults shown in Figure 3 we saw that velocity spectra of thepositively charged carbon clusters C+
m (m ≥ 2) from theregenerative sooting discharge is dominated by clusterswith large carbon content i.e. Cm (m ≥ 4). C+
2 is presentbut only as a minor constituent. On the other hand, thepositively charged clusters C+
m that are kinetically sput-tered from a flat graphite disc are likely to autoneutralise.That may be the reason that we could detect only nega-tive clusters in a non-regenerative environment. We coulddetect C−2 along with C−3 and C−4 in the mass spectrumof the sputtered graphite species [2]. An emission spec-trum from the regenerative sooting discharges was shownin Figure 4. In similar experiments the Swan band headsof C2: C2 (0, 0) at λ = 5 165 A, C2 (1, 0) at λ = 4 737 A,C2 (2, 1) at λ = 4 715 A, and C2 (0, 1) at λ = 6 535 Ahave been observed. Therefore, the Swan band of C2 isa useful indicator of C2 in the sooting discharges. An in-crease in the number density of neutral C2 as a functionof the discharge current idis follows a similar pattern ofdirect proportionality to idis by the atomic species C1.Whereas, on increasing the support gas pressure from 0.06to 20 mbar at constant idis as shown in Figure 7, wenotice an inverse relationship between the number den-sities of the atomic and diatomic carbon species. We havederived the number densities of the excited C∗1 and C∗2from the line intensities of the electronically excited CI atλ = 2 478 A and the lowest transition of the Swan band
with the vibrationally excited C2(0, 0) at λ = 5 165 A.C2(0, 0) number densities are plotted on the left verti-cal axis and the ratio C2(0, 0)/CI along the right verticalaxis. C2(0, 0) is an increasing function of both of the dis-charge parameters idis and PNe. CI also increases rapidlywith idis, but its contribution is reduced at higher pres-sures as can be seen in Figure 5. From the photon emis-sion data the ratio of the singly charged to the excited Ci.e. CII/CI remain constant, for example in the range ofPNe = 0.1−1 mbar it is 0.55±0.2 for idis = 50 to 200 mA.Similarly C2(0, 0)/CI = 2.2 ± 0.4 under the same condi-tions. At low pressure discharge i.e., PNe ≤ 1 mbar thecharged atomic carbon C+
1 (CII) and the excited diatomicmolecular carbon (C2(0, 0)) are directly related with CIi.e., C1 in the 1P1 level (E1P1 ≈ 7.5 eV). Thus it may bededuced that the origin of C1 and C2 is in the dissociationof C3 via C3 → C2 + C1.
7 The transition from the C3 dominateddischarge to the sooting plasma
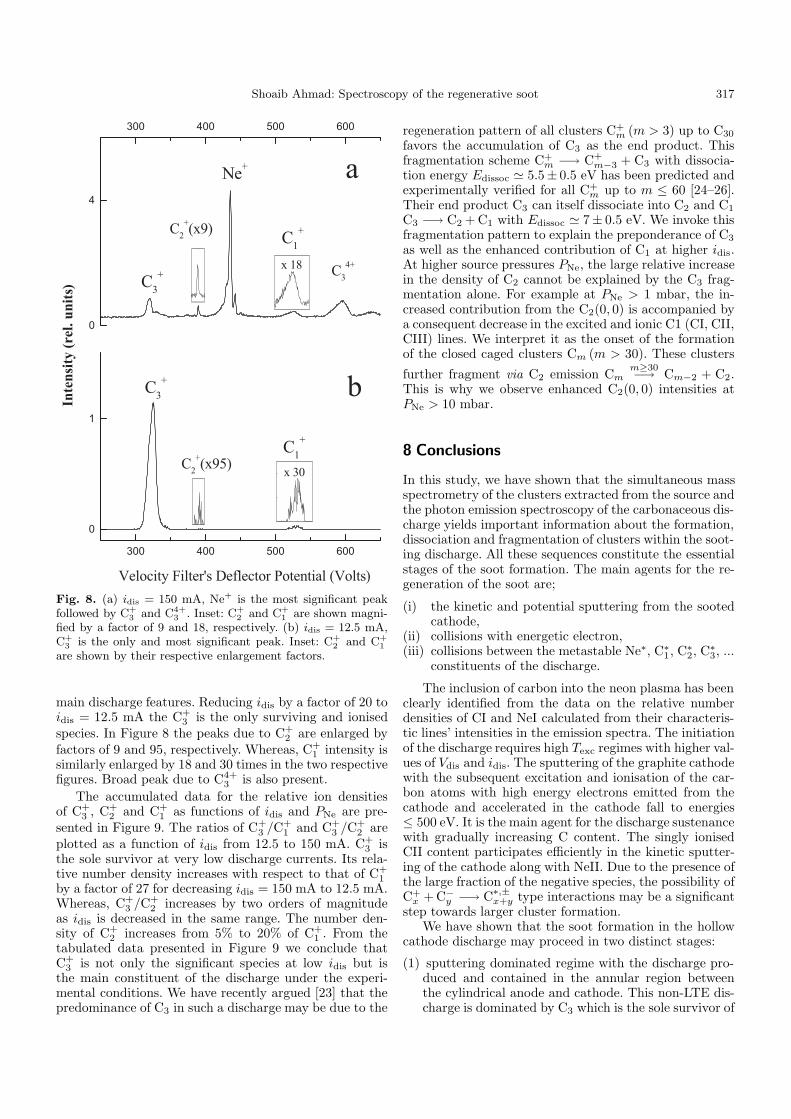
The mass spectrum for the positively charged clustersemitted from the source operated at low pressures anda well confined discharge has certain unique characteris-tics. It is dominated by C+
3 and much smaller densitiesof C+
1 and C+2 . Two such spectra are shown in Figure 8
by confining the discharge within the annular region be-tween the hollow cathode and the extended hollow an-ode (see Fig. 1a). The physical confinement between thethin annular region is supplemented by the cusp mag-netic field Bz(r, θ) contours (see Fig. 1c). The two spectrashown in Figure 8 are with idis = 150 mA (Fig. 8a) andidis = 12.5 mA (Fig. 8b). We notice that C+
3 is the ma-jor surviving species and at low idis, it is discharge’s mainionic component. However, in the photoemission spectrafrom at these conditions i.e. idis = 12.5 mA, we have seenthe atomic and ionic C lines (CI, CII, C2 etc.). The veloc-ity spectrum at idis = 150 mA shows C+
3 and Ne+ as the
Shoaib Ahmad: Spectroscopy of the regenerative soot 317
300 400 500 600
0
1
C2
+(x95)
C3
+
C1
+
b
0
4
300 400 500 600
C1
+
Ne+
C3
4+
C2
+(x9)
C3
+
a
Inte
nsity
(rel.
units)
Velocity Filter's Deflector Potential (Volts)
x 18
x 30
Fig. 8. (a) idis = 150 mA, Ne+ is the most significant peakfollowed by C+
3 and C4+3 . Inset: C+
2 and C+1 are shown magni-
fied by a factor of 9 and 18, respectively. (b) idis = 12.5 mA,C+
3 is the only and most significant peak. Inset: C+2 and C+
1
are shown by their respective enlargement factors.
main discharge features. Reducing idis by a factor of 20 toidis = 12.5 mA the C+
3 is the only surviving and ionisedspecies. In Figure 8 the peaks due to C+
2 are enlarged byfactors of 9 and 95, respectively. Whereas, C+
1 intensity issimilarly enlarged by 18 and 30 times in the two respectivefigures. Broad peak due to C4+
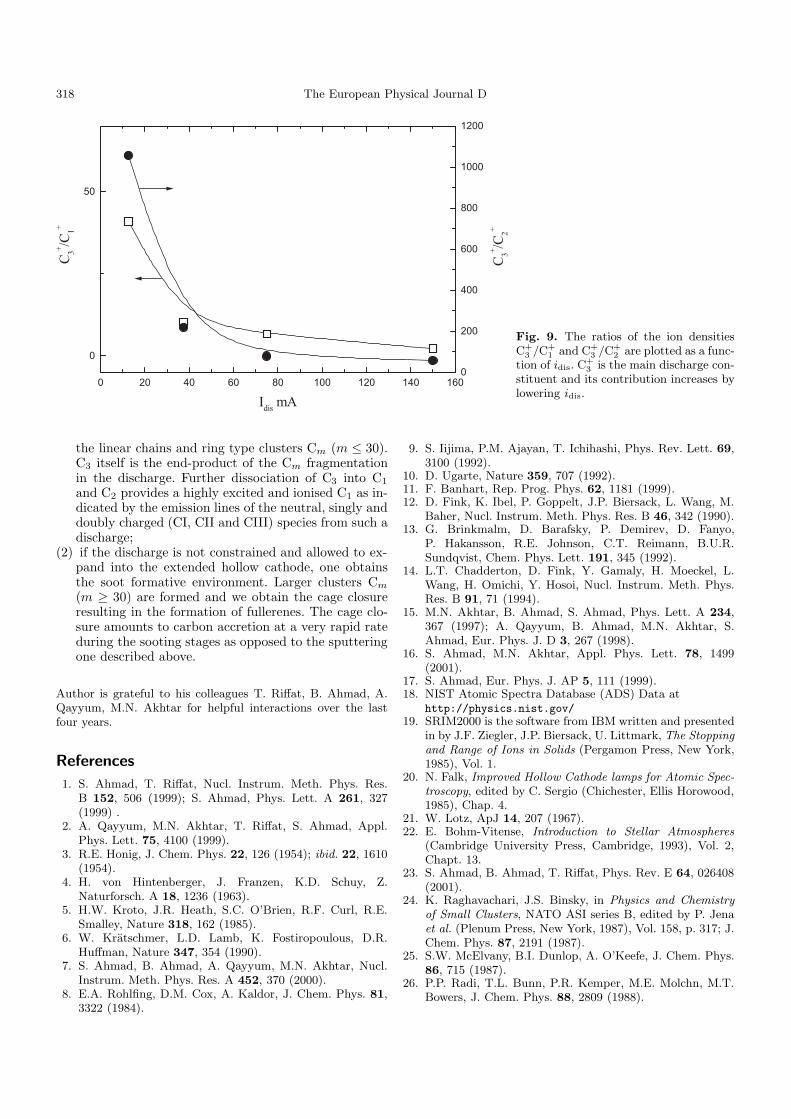
3 is also present.The accumulated data for the relative ion densities
of C+3 , C+
2 and C+1 as functions of idis and PNe are pre-
sented in Figure 9. The ratios of C+3 /C
+1 and C+
3 /C+2 are
plotted as a function of idis from 12.5 to 150 mA. C+3 is
the sole survivor at very low discharge currents. Its rela-tive number density increases with respect to that of C+
1by a factor of 27 for decreasing idis = 150 mA to 12.5 mA.Whereas, C+
3 /C+2 increases by two orders of magnitude
as idis is decreased in the same range. The number den-sity of C+
2 increases from 5% to 20% of C+1 . From the
tabulated data presented in Figure 9 we conclude thatC+
3 is not only the significant species at low idis but isthe main constituent of the discharge under the experi-mental conditions. We have recently argued [23] that thepredominance of C3 in such a discharge may be due to the
regeneration pattern of all clusters C+m (m > 3) up to C30
favors the accumulation of C3 as the end product. Thisfragmentation scheme C+
m −→ C+m−3 + C3 with dissocia-
tion energy Edissoc ' 5.5± 0.5 eV has been predicted andexperimentally verified for all C+
m up to m ≤ 60 [24–26].Their end product C3 can itself dissociate into C2 and C1
C3 −→ C2 + C1 with Edissoc ' 7± 0.5 eV. We invoke thisfragmentation pattern to explain the preponderance of C3
as well as the enhanced contribution of C1 at higher idis.At higher source pressures PNe, the large relative increasein the density of C2 cannot be explained by the C3 frag-mentation alone. For example at PNe > 1 mbar, the in-creased contribution from the C2(0, 0) is accompanied bya consequent decrease in the excited and ionic C1 (CI, CII,CIII) lines. We interpret it as the onset of the formationof the closed caged clusters Cm (m > 30). These clusters
further fragment via C2 emission Cmm≥30−→ Cm−2 + C2.
This is why we observe enhanced C2(0, 0) intensities atPNe > 10 mbar.
8 Conclusions
In this study, we have shown that the simultaneous massspectrometry of the clusters extracted from the source andthe photon emission spectroscopy of the carbonaceous dis-charge yields important information about the formation,dissociation and fragmentation of clusters within the soot-ing discharge. All these sequences constitute the essentialstages of the soot formation. The main agents for the re-generation of the soot are;
(i) the kinetic and potential sputtering from the sootedcathode,
(ii) collisions with energetic electron,(iii) collisions between the metastable Ne∗, C∗1, C∗2, C∗3, ...
constituents of the discharge.
The inclusion of carbon into the neon plasma has beenclearly identified from the data on the relative numberdensities of CI and NeI calculated from their characteris-tic lines’ intensities in the emission spectra. The initiationof the discharge requires high Texc regimes with higher val-ues of Vdis and idis. The sputtering of the graphite cathodewith the subsequent excitation and ionisation of the car-bon atoms with high energy electrons emitted from thecathode and accelerated in the cathode fall to energies≤ 500 eV. It is the main agent for the discharge sustenancewith gradually increasing C content. The singly ionisedCII content participates efficiently in the kinetic sputter-ing of the cathode along with NeII. Due to the presence ofthe large fraction of the negative species, the possibility ofC+x + C−y −→ C∗,±x+y type interactions may be a significant
step towards larger cluster formation.We have shown that the soot formation in the hollow
cathode discharge may proceed in two distinct stages:
(1) sputtering dominated regime with the discharge pro-duced and contained in the annular region betweenthe cylindrical anode and cathode. This non-LTE dis-charge is dominated by C3 which is the sole survivor of
318 The European Physical Journal D
0 20 40 60 80 100 120 140 160
0
50
IdismA
C3
+
/C1
+
0
200
400
600
800
1000
1200
C3
+
/C2
+
Fig. 9. The ratios of the ion densitiesC+
3 /C+1 and C+
3 /C+2 are plotted as a func-
tion of idis. C+3 is the main discharge con-
stituent and its contribution increases bylowering idis.
the linear chains and ring type clusters Cm (m ≤ 30).C3 itself is the end-product of the Cm fragmentationin the discharge. Further dissociation of C3 into C1
and C2 provides a highly excited and ionised C1 as in-dicated by the emission lines of the neutral, singly anddoubly charged (CI, CII and CIII) species from such adischarge;
(2) if the discharge is not constrained and allowed to ex-pand into the extended hollow cathode, one obtainsthe soot formative environment. Larger clusters Cm(m ≥ 30) are formed and we obtain the cage closureresulting in the formation of fullerenes. The cage clo-sure amounts to carbon accretion at a very rapid rateduring the sooting stages as opposed to the sputteringone described above.
Author is grateful to his colleagues T. Riffat, B. Ahmad, A.Qayyum, M.N. Akhtar for helpful interactions over the lastfour years.
References
1. S. Ahmad, T. Riffat, Nucl. Instrum. Meth. Phys. Res.B 152, 506 (1999); S. Ahmad, Phys. Lett. A 261, 327(1999) .
2. A. Qayyum, M.N. Akhtar, T. Riffat, S. Ahmad, Appl.Phys. Lett. 75, 4100 (1999).
3. R.E. Honig, J. Chem. Phys. 22, 126 (1954); ibid. 22, 1610(1954).
4. H. von Hintenberger, J. Franzen, K.D. Schuy, Z.Naturforsch. A 18, 1236 (1963).
5. H.W. Kroto, J.R. Heath, S.C. O’Brien, R.F. Curl, R.E.Smalley, Nature 318, 162 (1985).
6. W. Kratschmer, L.D. Lamb, K. Fostiropoulous, D.R.Huffman, Nature 347, 354 (1990).
7. S. Ahmad, B. Ahmad, A. Qayyum, M.N. Akhtar, Nucl.Instrum. Meth. Phys. Res. A 452, 370 (2000).
8. E.A. Rohlfing, D.M. Cox, A. Kaldor, J. Chem. Phys. 81,3322 (1984).
9. S. Iijima, P.M. Ajayan, T. Ichihashi, Phys. Rev. Lett. 69,3100 (1992).
10. D. Ugarte, Nature 359, 707 (1992).11. F. Banhart, Rep. Prog. Phys. 62, 1181 (1999).12. D. Fink, K. Ibel, P. Goppelt, J.P. Biersack, L. Wang, M.
Baher, Nucl. Instrum. Meth. Phys. Res. B 46, 342 (1990).13. G. Brinkmalm, D. Barafsky, P. Demirev, D. Fanyo,
P. Hakansson, R.E. Johnson, C.T. Reimann, B.U.R.Sundqvist, Chem. Phys. Lett. 191, 345 (1992).
14. L.T. Chadderton, D. Fink, Y. Gamaly, H. Moeckel, L.Wang, H. Omichi, Y. Hosoi, Nucl. Instrum. Meth. Phys.Res. B 91, 71 (1994).
15. M.N. Akhtar, B. Ahmad, S. Ahmad, Phys. Lett. A 234,367 (1997); A. Qayyum, B. Ahmad, M.N. Akhtar, S.Ahmad, Eur. Phys. J. D 3, 267 (1998).
16. S. Ahmad, M.N. Akhtar, Appl. Phys. Lett. 78, 1499(2001).
17. S. Ahmad, Eur. Phys. J. AP 5, 111 (1999).18. NIST Atomic Spectra Database (ADS) Data at
http://physics.nist.gov/19. SRIM2000 is the software from IBM written and presented
in by J.F. Ziegler, J.P. Biersack, U. Littmark, The Stoppingand Range of Ions in Solids (Pergamon Press, New York,1985), Vol. 1.
20. N. Falk, Improved Hollow Cathode lamps for Atomic Spec-troscopy, edited by C. Sergio (Chichester, Ellis Horowood,1985), Chap. 4.
21. W. Lotz, ApJ 14, 207 (1967).22. E. Bohm-Vitense, Introduction to Stellar Atmospheres
(Cambridge University Press, Cambridge, 1993), Vol. 2,Chapt. 13.
23. S. Ahmad, B. Ahmad, T. Riffat, Phys. Rev. E 64, 026408(2001).
24. K. Raghavachari, J.S. Binsky, in Physics and Chemistryof Small Clusters, NATO ASI series B, edited by P. Jenaet al. (Plenum Press, New York, 1987), Vol. 158, p. 317; J.Chem. Phys. 87, 2191 (1987).
25. S.W. McElvany, B.I. Dunlop, A. O’Keefe, J. Chem. Phys.86, 715 (1987).
26. P.P. Radi, T.L. Bunn, P.R. Kemper, M.E. Molchn, M.T.Bowers, J. Chem. Phys. 88, 2809 (1988).
Related Documents