Spectroscopy of Ba and Ba + deposits in solid xenon for barium tagging in nEXO B. Mong, 1, 2 S. Cook, 1, * T. Walton, 1 C. Chambers, 1 A. Craycraft, 1 C. Benitez-Medina, 1, † K. Hall, 1, ‡ W. Fairbank Jr., 1, § J.B. Albert, 3 D.J. Auty, 4 P.S. Barbeau, 5 V. Basque, 6 D. Beck, 7 M. Breidenbach, 8 T. Brunner, 9 G.F. Cao, 10 B. Cleveland, 2, ¶ M. Coon, 7 T. Daniels, 8 S.J. Daugherty, 3 R. DeVoe, 9 T. Didberidze, 4 J. Dilling, 11 M.J. Dolinski, 12 M. Dunford, 6 L. Fabris, 13 J. Farine, 2 W. Feldmeier, 14 P. Fierlinger, 14 D. Fudenberg, 9 G. Giroux, 15, ** R. Gornea, 15 K. Graham, 6 G. Gratta, 9 M. Heffner, 16 M. Hughes, 4 X.S. Jiang, 10 T.N. Johnson, 3 S. Johnston, 17 A. Karelin, 18 L.J. Kaufman, 3 R. Killick, 6 T. Koffas, 6 S. Kravitz, 9 R. Kr¨ ucken, 11 A. Kuchenkov, 18 K.S. Kumar, 19 D.S. Leonard, 20 C. Licciardi, 6 Y.H. Lin, 12 J. Ling, 7 R. MacLellan, 21 M.G. Marino, 14 D. Moore, 9 A. Odian, 8 I. Ostrovskiy, 9 A. Piepke, 4 A. Pocar, 17 F. Retiere, 11 P.C. Rowson, 8 M.P. Rozo, 6 A. Schubert, 9 D. Sinclair, 11, 6 E. Smith, 12 V. Stekhanov, 18 M. Tarka, 7 T. Tolba, 15 K. Twelker, 9 J.-L. Vuilleumier, 15 J. Walton, 7 M. Weber, 9 L.J. Wen, 10 U. Wichoski, 2 L. Yang, 7 Y.-R. Yen, 12 and Y.B. Zhao 10 1 Physics Department, Colorado State University, Fort Collins CO, USA 2 Department of Physics, Laurentian University, Sudbury ON, Canada 3 Physics Department and CEEM, Indiana University, Bloomington IN, USA 4 Department of Physics and Astronomy, University of Alabama, Tuscaloosa AL, USA 5 Department of Physics, Duke University, and Triangle Universities Nuclear Laboratory (TUNL), Durham North Carolina, USA 6 Physics Department, Carleton University, Ottawa ON, Canada 7 Physics Department, University of Illinois, Urbana-Champaign IL, USA 8 SLAC National Accelerator Laboratory, Stanford CA, USA 9 Physics Department, Stanford University, Stanford CA, USA 10 Institute of High Energy Physics, Beijing, China 11 TRIUMF, Vancouver BC, Canada 12 Department of Physics, Drexel University, Philadelphia PA, USA 13 Oak Ridge National Laboratory, Oak Ridge TN, USA 14 Technische Universitat Munchen, Physikdepartment and Excellence Cluster Universe, Garching, Germany 15 LHEP, Albert Einstein Center, University of Bern, Bern, Switzerland 16 Lawrence Livermore National Laboratory, Livermore CA, USA 17 Physics Department, University of Massachusetts, Amherst MA, USA 18 Institute for Theoretical and Experimental Physics, Moscow, Russia 19 Department of Physics and Astronomy, Stony Brook University, SUNY, Stony Brook NY,USA 20 Department of Physics, University of Seoul, Seoul, Korea 21 Department of Physics, University of South Dakota, Vermillion SD, USA (Dated: October 13, 2014) Progress on a method of barium tagging for the nEXO double beta decay experiment is reported. Absorption and emission spectra for deposits of barium atoms and ions in solid xenon matrices are presented. Excitation spectra for prominent emission lines, temperature dependence and bleaching of the fluorescence reveal the existence of different matrix sites. A regular series of sharp lines observed in Ba + deposits is identified with some type of barium hydride molecule. Lower limits for the fluorescence quantum efficiency of the principal Ba emission transition are reported. Under current conditions, an image of ≤ 10 4 Ba atoms can be obtained. Prospects for imaging single Ba atoms in solid xenon are discussed. * Now at NIST, Boulder CO, USA † Now at Intel, Hillsboro OR, USA ‡ Now at Raytheon, Denver CO, USA § Corresponding author ¶ Also SNOLAB, Sudbury ON, Canada ** Now at Queen’s University, Kingston ON, Canada I. INTRODUCTION The spectroscopy of atoms and molecules isolated in solid matrices of inert gases dates back sixty years [1]. Matrix isolation spectroscopy, as this method is known, has established that atomic states in noble gas matrices retain many of the fundamental proper- arXiv:1410.2624v1 [physics.atom-ph] 9 Oct 2014

Welcome message from author
This document is posted to help you gain knowledge. Please leave a comment to let me know what you think about it! Share it to your friends and learn new things together.
Transcript

Spectroscopy of Ba and Ba+ deposits in solid xenon for barium tagging innEXO
B. Mong,1, 2 S. Cook,1, ∗ T. Walton,1 C. Chambers,1 A. Craycraft,1 C. Benitez-Medina,1, †
K. Hall,1, ‡ W. Fairbank Jr.,1, § J.B. Albert,3 D.J. Auty,4 P.S. Barbeau,5 V. Basque,6 D. Beck,7
M. Breidenbach,8 T. Brunner,9 G.F. Cao,10 B. Cleveland,2, ¶ M. Coon,7 T. Daniels,8 S.J. Daugherty,3
R. DeVoe,9 T. Didberidze,4 J. Dilling,11 M.J. Dolinski,12 M. Dunford,6 L. Fabris,13 J. Farine,2
W. Feldmeier,14 P. Fierlinger,14 D. Fudenberg,9 G. Giroux,15, ∗∗ R. Gornea,15 K. Graham,6
G. Gratta,9 M. Heffner,16 M. Hughes,4 X.S. Jiang,10 T.N. Johnson,3 S. Johnston,17 A. Karelin,18
L.J. Kaufman,3 R. Killick,6 T. Koffas,6 S. Kravitz,9 R. Krucken,11 A. Kuchenkov,18 K.S. Kumar,19
D.S. Leonard,20 C. Licciardi,6 Y.H. Lin,12 J. Ling,7 R. MacLellan,21 M.G. Marino,14 D. Moore,9
A. Odian,8 I. Ostrovskiy,9 A. Piepke,4 A. Pocar,17 F. Retiere,11 P.C. Rowson,8 M.P. Rozo,6 A. Schubert,9
D. Sinclair,11, 6 E. Smith,12 V. Stekhanov,18 M. Tarka,7 T. Tolba,15 K. Twelker,9 J.-L. Vuilleumier,15
J. Walton,7 M. Weber,9 L.J. Wen,10 U. Wichoski,2 L. Yang,7 Y.-R. Yen,12 and Y.B. Zhao10
1Physics Department, Colorado State University, Fort Collins CO, USA2Department of Physics, Laurentian University, Sudbury ON, Canada
3Physics Department and CEEM, Indiana University, Bloomington IN, USA4Department of Physics and Astronomy, University of Alabama, Tuscaloosa AL, USA
5Department of Physics, Duke University, and Triangle UniversitiesNuclear Laboratory (TUNL), Durham North Carolina, USA
6Physics Department, Carleton University, Ottawa ON, Canada7Physics Department, University of Illinois, Urbana-Champaign IL, USA
8SLAC National Accelerator Laboratory, Stanford CA, USA9Physics Department, Stanford University, Stanford CA, USA
10Institute of High Energy Physics, Beijing, China11TRIUMF, Vancouver BC, Canada
12Department of Physics, Drexel University, Philadelphia PA, USA13Oak Ridge National Laboratory, Oak Ridge TN, USA
14Technische Universitat Munchen, Physikdepartment and Excellence Cluster Universe, Garching, Germany15LHEP, Albert Einstein Center, University of Bern, Bern, Switzerland
16Lawrence Livermore National Laboratory, Livermore CA, USA17Physics Department, University of Massachusetts, Amherst MA, USA18Institute for Theoretical and Experimental Physics, Moscow, Russia
19Department of Physics and Astronomy, Stony Brook University, SUNY, Stony Brook NY,USA20Department of Physics, University of Seoul, Seoul, Korea
21Department of Physics, University of South Dakota, Vermillion SD, USA(Dated: October 13, 2014)
Progress on a method of barium tagging for the nEXO double beta decay experiment is reported.Absorption and emission spectra for deposits of barium atoms and ions in solid xenon matrices arepresented. Excitation spectra for prominent emission lines, temperature dependence and bleachingof the fluorescence reveal the existence of different matrix sites. A regular series of sharp linesobserved in Ba+ deposits is identified with some type of barium hydride molecule. Lower limitsfor the fluorescence quantum efficiency of the principal Ba emission transition are reported. Undercurrent conditions, an image of ≤ 104 Ba atoms can be obtained. Prospects for imaging single Baatoms in solid xenon are discussed.
∗ Now at NIST, Boulder CO, USA† Now at Intel, Hillsboro OR, USA‡ Now at Raytheon, Denver CO, USA§ Corresponding author¶ Also SNOLAB, Sudbury ON, Canada∗∗ Now at Queen’s University, Kingston ON, Canada
I. INTRODUCTION
The spectroscopy of atoms and molecules isolatedin solid matrices of inert gases dates back sixty years[1]. Matrix isolation spectroscopy, as this method isknown, has established that atomic states in noblegas matrices retain many of the fundamental proper-
arX
iv:1
410.
2624
v1 [
phys
ics.
atom
-ph]
9 O
ct 2
014

ties of their vacuum counterparts, such as the quan-tum numbers, even in the most polarizable noblegas matrix, solid xenon (SXe) [2]. Peaks in the con-densed phase spectra, though broadened to nanome-ters in width and somewhat red- or blue-shifted, canbe assigned to known transitions of free atoms insimple cases such as alkali, alkaline earth and tran-sition metal atoms. As the field has matured, theability to capture, hold and study small numbers ofatoms for a long period of time has attracted interestfor difficult and sensitive applications.
A novel application of matrix isolation spec-troscopy is being explored by the nEXO collabora-tion for a future ton-scale 136Xe neutrinoless doublebeta decay (0νββ) experiment. Successful observa-tion of 0νββ decay would determine the fundamentalcharacter of neutrinos to be Majorana rather thanDirac, and could provide the additional informationneeded to infer the absolute masses of the neutri-nos [3]. The most sensitive 0νββ decay experimentsto date, with tens to hundreds of kilograms of theisotope of interest, have reached 0νββ decay life-time limits of greater than 1025 years [4–7]. In nextgeneration experiments at the ton scale, completeelimination of background would be a great advan-tage, as the sensitivity to lifetime grows linearly withthe mass of the isotope in the detector, M, in thezero background case, whereas the sensitivity growsas M1/2 with backgrounds that increase proportion-ately with mass.
Among all the double beta decay isotopes, 136Xe isunique because the decay medium can be a transpar-ent liquid or gas. The 0νββ decay of 136Xe producesa daughter ion 136Ba++ (136Xe →136Ba++ + 2e−).In liquid xenon (LXe), it has been proposed thatafter single charge transfer in the liquid, the daugh-ter 136Ba+ ion might be identified in situ by laserspectroscopy at the site of the decay. With this ad-ditional identification, or “tag”, all backgrounds of a136Xe 0νββ decay experiment in the energy range ofinterest near the Q value could be vetoed. The oneexception, background from the two-neutrino dou-ble beta decays, is estimated to be negligible still formulti-ton detectors and observed energy resolutions.The original barium tagging proposal [8] called forexciting and detecting the 136Ba ion by lasers di-rected through the liquid xenon to the decay site.However, our efforts to demonstrate direct bariumtagging in liquid xenon with lasers have thus far beeninconclusive [9].
Several different methods of barium tagging inLXe are being explored by the nEXO Collabora-tion. A method based on laser ablation and reso-nance ionization of Ba on a probe has recently been
reported [10]. In this paper progress is presentedon a hybrid barium tagging method shown on theleft in Fig. 1. In this method, the barium daughterion from the 0νββ decay is frozen with some sur-rounding xenon on a cold probe that is inserted intothe LXe. This ion, or atom if further neutralizationoccurs, is then detected by matrix isolation spec-troscopy in the solid xenon matrix on the probe.The probe could also be extracted to a low pres-sure region where the Ba detection could be done ata lower temperature, at which fluorescence may bemore efficient.
A concept for such a barium tagging probe isshown on the right in Fig. 1. When the probe isnear the 136Ba+ daughter ion, the flow of coolinggas, e.g., high pressure argon gas expanding througha Joule-Thompson nozzle or cryogenic helium gas,is increased to cool the end of the vacuum-insulatedprobe to below the Xe freezing point of 161 K. Thistraps the Ba+ ion (or Ba atom) in a thin layer of SXeon the sapphire window at the end of the probe. Thelaser light needed to excite the single Ba+ or Ba en-ters via an optical fiber within the probe. The lightis deflected to illuminate the region of SXe where theBa atom/ion is trapped. The thickness of the SXelayer is monitored by interference fringes in the re-flected light guided by a second fiber. Ba atom/ionfluorescence is collected by an efficient lens and fo-cused on a CCD chip in the probe to produce an im-age of the single atom/ion. The presence or absenceof a peak in the CCD image distinguishes 136Xe dou-ble beta decay events from background events.
Previous measurements with Ba in matrix includeabsorption and emission spectra of the dominant vis-ible transition of Ba in solid argon and krypton [11]and emission spectra of Ba+ in solid and liquid he-lium [12]. In [11] it was reported that stable sitesfor Ba in solid xenon were not obtained, and thatattempts to observe the emission spectrum failed.
In this paper, detailed studies of the fluorescenceof Ba atoms in SXe are reported. Candidate Ba+
lines are also found. Some results in solid argon(SAr) matrix are presented for comparison. A se-ries of molecular lines in Ba+ deposits is related tohydrogen content in the matrix. Images of smallnumbers of Ba atoms in solid xenon matrix are pre-sented to demonstrate the progress towards singleBa atom or Ba+ ion tagging for a second phase ofnEXO.
2

FIG. 1. (color online) Left: concept of 136Ba daughtertagging on a cryoprobe in a liquid Xe double beta decayexperiment. Right: conceptual design of a cryoprobe forgrabbing and detecting single 136Ba ions or atoms.
II. APPARATUS
The apparatus for studying the spectroscopy andimaging of Ba atoms and Ba+ ions in SXe and SAris shown schematically in Fig. 2. A 19 mm diame-ter sapphire window, on which matrix samples wereformed, was held in a copper housing (not shown)attached to the cold finger of a 10 K cryostat [13].A small tube directed the gas used to form the ma-trix toward the center of the window. For depositsof Ba atoms, a barium-aluminum getter source [14]was heated by passing a DC current through it. ForBa+ deposits, the getter assembly was pulled to theside, and Ba+ ions from from a mass-selected ionbeam were directed onto the matrix from the left.The sapphire window was angled at 45◦ such that itsfront surface had line of sight to the barium sources,while still being visible to the collection optics andgas tube.
The cold finger was equipped with a band heaterso that the temperature of the window, measuredby a thermocouple, could be stabilized at tempera-tures other than 10 K, e.g., for deposits or anneal-ing at higher temperature. A silicon diode was alsoinstalled on the window holder for more accuratetemperature measurements (±0.5 K). The windowwas surrounded by a thermal shield (not shown) andcontained in a 2 inch evacuated cube with five view-ports.
!"#$%&'(
)*+,-.&/+-+.
001
!"$2+--+.3%'4&5$67$8
9"(+.
0"/+."$9+'(:%;-+.
<+$2"(
3=%-+$9%2=-
FIG. 2. (color online) Apparatus used for spectroscopyof Ba and Ba+ deposits in SXe.
The laser beam used for exciting the emission ofatoms or ions entered through the port on the right.Sometimes a 7 cm lens was used to focus the laserbeam to smaller diameters in the matrix. A 5 cmfocal length f/2 lens at the top collected the fluores-cence into a collimated beam that was directed bytwo steering mirrors into a 50 mm focal length Nikoncamera lens or a Phoenix 70-210 mm zoom lens. Thelight was focused at the input slit of an imaging spec-trometer of 150 mm focal length with a liquid nitro-gen cooled CCD detector at the output plane [15].Raman and bandpass filters were placed between thelenses to block scattered laser light and other unde-sired light, such as the 693 nm fluorescence line ofa very low concentration of Cr3+ impurities in thesapphire window. The fluorescence detection effi-ciency in this configuration was 0.35 − 1.4 × 10⁻³
counts/photon emitted, depending on camera lensand zoom used, with an uncertainty of a factor oftwo. This included factors for the collection solidangle of the lens, narrowed collection angle in theSXe due to refraction at the SXe/vacuum interface,the transmission of filters and optics, the transmis-sion of the spectrometer, the quantum efficiency ofthe CCD chip and the CCD digitization factor inphotoelectrons/count.
Various CW laser sources were used for excita-tion, including seven discrete argon ion laser linesfrom 454 nm to 514 nm, a doubled Nd:YAG laserat 532 nm, a tunable Coherent 599 dye laser pumpedby the argon laser for 545-564 nm, and a second tun-able Coherent 599 dye laser pumped by a krypton
3

ion laser for 459-514 nm. Typical laser powers werea few tens of milliwatts, sometimes attenuated byneutral density filters up to OD4. Laser powers weremeasured with a power meter via a calibrated pickoffwindow and recorded simultaneously with fluores-cence spectra using a LabView program. The laserbeam 1/e2 radius, w, was 1-4 mm for the unfocusedlaser beams and a few µm at the focus when the lenswas used. Intermediate laser radii were obtained bymoving the lens. The LabView program controlledthe delay of a shutter in the laser beam path rel-ative to the shutter and frame period of the CCDcamera. This allowed precise timing of the laser ex-posure so that fluorescence from the very beginningof the optical pumping process could be captured.
The absorption measurements presented in thiswork were done with a different optics system inwhich white light entered from the bottom port. Thetransmitted white light was coupled by a fiber cou-pler at the top port into a multi-strand, multi-modefiber bundle. At the other end of the bundle, thefibers formed a vertical line image at the entranceplane of the spectrometer. The white light source forabsorption measurements was a halogen lamp thatwas collimated by an aperture to a small solid angleand filtered to provide a flatter spectrum in the an-ticipated absorption range (450 nm-650 nm). Oneset of emission spectra reported in this paper andthe Ba in SAr emission spectrum were also taken inthis configuration with the fiber coupler in an off-axis position at the top port.
The ion beam system for depositing Ba+ ions inSAr or SXe is shown in Fig. 3. The ion source, ex-traction optics, lens and E×B mass filter were from acommercial Colutron ion gun [16]. Additional Einzellenses, deflection plates and a deceleration lens pro-vided beam steering, focusing and deceleration sothat Ba+ ions could be deposited in the matrix atenergies from 100 eV to 2 keV. The data on Ba+ de-posits presented in this paper were taken with 2 keVion beam energy, The beam current was monitoredwith a Faraday cup of 2 mm diameter. Typical beamcurrents were on the order of 10 nA.
To achieve deposits of small numbers of ions, apair of pulsing plates were set at ±200 V DC to de-flect the beam and then pulsed to 0 V for 1 µs to passa short burst of Ba+ ions. The pulse rate was con-trolled by a LabView program and could be operatedfrom single pulse to 500 Hz in burst mode or contin-uous mode. The induction signal on a central con-ductor shielded by two grounded plates was recordedon a digital oscilloscope and provided a monitor ofthe ion pulses during the experiment.
At times the sapphire window was replaced by a
Faraday cup at the window position to check thebeam location and size at the sample relative to thebeam Faraday cup both for DC and pulsed beams.Scintillation light from the ion beam hitting the SXematrix was also used to confirm optimum ion beamdeflection to the center of the window area imagedby the optical system.
Vacuum was maintained with a small turbomolec-ular pump attached to the cryostat and two largeturbomolecular pumps on the ion beam system.Typical residual gas pressures were around 1×10⁻⁷
Torr with the warm cryostat. The gas supply wasresearch grade (99.995% pure) xenon or argon. Gasflow was controlled by a leak valve [17]. No purifierwas used because the gas flow rate was too low foreffective purification.
III. METHOD
Solid rare-gas matrices were prepared by leakinggas (argon or xenon) onto the cold sample window.The matrix growth rate was finely controlled byadjustment of the leak valve. Interference fringesin transmission or reflection of a laser beam wereused to measure the matrix growth rate. Samplefringes at three leak settings corresponding to matrixgrowth rates of ∼ 8-120 nm/s are shown in Fig. 4.The fringe rate for residual gases only was observedto be much less than one fringe in two hours, per-haps on the order of 0.005 nm/s. Using the ratioof these numbers, the residual gas impurity contentin the matrix was ≤100-1000 ppm at the above leakrates.
The gas flow was turned on for 5 seconds to 5minutes, depending on the leak rate, to build a purehost matrix foundation prior to introducing barium.For atomic deposits, Ba was then co-deposited withthe gas by joule-heating a length of getter using upto 15 amps DC. Pre-heating of the getter at lowercurrents was done before any deposit was made tobake out adsorbed gases, particularly hydrogen. Forion deposits, the Faraday cup was used as a shut-ter to control the deposition time. Large deposits,where absorption could be detected, typically lastedfor a few minutes. The Faraday cup was pulled outfor ≤ 1 s for smaller deposits. The matrix was thencapped with a final layer of pure noble gas.
4

FIG. 3. Ion beam apparatus
FIG. 4. (color online) Interference fringes with a 532 nmlaser and resulting matrix growth rates at different Xeleak rates.
IV. RESULTS
Absorption spectra of Ba in SXe and SAr from agetter deposit at 10 K are shown in Fig. 5. Multi-ple components in the dominant band are visible inboth matrices. Qualitatively similar absorption wasfound in SXe with a Ba+ ion deposit, suggestingsubstantial neutralization upon entering the matrix.The absorption band in SAr has been identified withthe 6s2 1S0 → 6s6p 1P1 transition in atomic Ba, thatoccurs at 553.5 nm in vacuum [11]. A similar assign-ment for SXe is reasonable. In xenon, the centralpeak has a 4 nm red shift from the vacuum value,whereas in argon the central peak has an 11 nm blueshift. A smaller blue absorption band with threepeaks is also seen in both spectra.
Representative emission spectra of barium in SXeand SAr at 10 K are shown in Fig. 5. The excitationlaser wavelengths for these spectra are 555 nm and532 nm, respectively. It can be seen that the Stokesshift, the red shift of emission relative to absorption,is greater in the heavier noble gas, as is typically the
FIG. 5. (color online) Absorption (black) and represen-tative emission (red) spectra of barium in solid (a) xenonand (b) argon. The absorbance Aλ = −ln(Tλ), where Tλis the transmission at wavelength λ.
case in matrix isolated atomic spectra [2]. Severalpartially resolved emission peaks are evident.
These emission spectra are for Ba+ ion and Bagetter deposits in SXe and SAr made at 45 K and10 K, respectively, and observed at 10K before sub-stantial bleaching occurs. As discussed below, therelative strength of different peaks in the emissionspectra can vary substantially depending on excita-tion wavelength, deposition temperature, measure-ment temperature, history of annealing and bleach-
5

ing.Ba emission spectra in SXe for five sample exci-
tation wavelengths are shown in Fig. 6(a). Largechanges in the emission spectrum are apparent. Ex-citation spectra, i.e., the peak counts/mW of theprominent emission peaks for all the laser wave-lengths in the run, are shown in Fig. 6(b). The threeemission peaks have quite different excitation spec-tra. This supports associating each emission peakwith Ba atoms in a different site, or neighbor atomconfiguration, in the SXe matrix.
FIG. 6. (color online) (a) Emission spectra of a Ba+ iondeposit in SXe made at 44 K and observed at 10 K for asample of excitation wavelengths; (b) excitation spectrafor the 568 nm, 575 nm, 590 nm and 617 nm peaks ofBa in SXe.
Additional information on the origin of the dif-ferent emission peaks can be gained by studies ofannealing and through deposits made at varyingtemperature. The effect of annealing on the emis-sion spectrum of a Ba+ deposit in SXe is shown inFig. 7(a). The peak counts of the 590 nm and 575 nmcomponents a four-Gaussian fit to the spectra dur-ing the annealing cycles are shown in Figs. 7(b) and
(c), respectively. The spectrum, as deposited, hada large and broad 590 nm emission peak with a tailextending to the red and a hint of a 575 nm peak.Upon warming to 39 K, the spectrum was reducedto a single broad bump. After cooling back to 10 K,the spectrum had changed considerably. The 590 nmpeak was narrower and lower, and the 575 nm peakwas increased to twice its initial size. Two more an-nealing cycles to 43 K and 48 K yielded a modestfurther reduction of the 590 nm peak and growthof the 575 nm peak. It is noteworthy that for bothwavelengths, the warming portion of the second cy-cle closely followed the cooling part of the first cycle,and similarly in the next cycle. This confirms thatbleaching was negligible in these experiments withlow laser power and unfocused laser beam. Thusthe observed spectral modifications in annealing cy-cles can be attributed to changes in the matrix sitesof the Ba atoms.
The temperature of deposition affects the rela-tive abundance of Ba atoms in different matrix sites.Emission spectra of a Ba+ deposit made at 44 K andthen observed at 10 K and a deposit made and ob-served at 10 K are shown in Fig. 8. The 44 K deposithas a much larger 575 nm peak, whereas the 10 Kdeposit has a broader and more red-shifted 590 nmpeak. Annealing of the 10 K deposit to 39 K andback yields a spectrum more like that of the 44 Kdeposit. The red tail of the 590 nm peak in Fig-ures 7(a) and 8 may indicate the existence of an ad-ditional matrix site with an emission peak at greaterthan 590 nm that is populated in the 10 K depositbut is depopulated by annealing.
Additional barium fluorescence peaks in both SXeand SAr have been observed using lower wavelengthexcitation from an argon ion laser and a blue tun-able dye laser. Sample emission spectra for a Ba get-ter deposit in SXe, excited with a tunable blue dyelaser, are shown in Fig. 9 (a). New emission peaksat 483 nm and 492 nm are observed. The emissionpeak at 596 nm may be the same as the primary Baresonance line discussed above, only weakly excitedby blue wavelengths. For higher excitation wave-lengths, a Raman filter with a higher cutoff wave-length (514 nm) was used. This filter blocked thetwo blue emission lines. No new emission peaks wereobserved with excitation up to 514 nm.
Excitation spectra for the two blue lines and the596 nm line extracted from the full set of emissionspectra are shown in Fig. 9(b). The differing exci-tation spectra for the blue lines may imply separateatomic transitions or different matrix sites for a sin-gle transition. It is interesting that the excitationspectrum of the 596 nm line matches quite well with
6

FIG. 7. (color online) Annealing of a Ba+ in SXe depositmade at 11 K: (a) spectra at the lowest and highest tem-peratures for 3 anneal cycles; peak counts in Gaussianfits to spectra during the three anneal cycles for the (b)590 nm and (c) 575 nm peaks. The excitation wavelengthwas 564 nm.
the weak blue absorption band in Fig. 5(a).Comparison of deposits made with the Ba getter
source and the Ba+ ion beam source may help distin-guish absorptions and emissions due to Ba and Ba+.The getter source should produce mainly Ba atoms,and the energy of the deposit should be thermal (lessthan 1eV). As discussed above, it is observed thata Ba+ ion deposit in SXe leads to neutral Ba fluo-rescence around 590 nm. Thus some neutralizationdoes occur. Nevertheless, additional lines in the ion
FIG. 8. (color online) 10 K emission spectra of Ba+
deposits made at 10 K (black) and 44 K (red), and thespectrum of the 10 K deposit after annealing to 39 K(blue). All spectra were taken at 10 K. The excitationwavelength was 564 nm.
deposit not seen in the neutral deposit would be can-didates for assignment to Ba+.
Emission spectra from a Ba+ ion deposit in SXeobtained with a tunable blue dye laser are shownin Fig. 10(a). Five new emission peaks at 532, 553,568, 635 and 669 nm are observed. Excitation spec-tra for these lines are shown in Fig. 10(b). The twostrongest lines, 532 nm and 635 nm, have a simi-lar excitation peak at 472 nm, indicating a commonexcited state and matrix site. Two smaller peaks,553 nm and 568 nm have a rise at the lowest wave-lengths, suggesting an excitation peak at <461 nmand perhaps also a common origin. The other twopeaks, 592 nm and 669 nm, exhibit increased exci-tation toward the shortest wavelengths probed. Al-though the 592 nm peak is similar in wavelength toa strong emission peak of Ba in SXe, the very differ-ent excitation spectrum from that of Ba in Fig. 9(b)suggests a separate assignment. The five lines thatare not seen in the getter spectra, Fig. 9 (a), and the592 nm line are tentatively associated with Ba+.
A. Bleaching
For many of the fluorescence peaks reportedabove, extended exposure of the matrix to intenselaser light causes the fluorescence signal to decrease,or bleach, with time. For example, successive spec-tra taken with a mildly focused dye laser beam at555 nm, 560 nm and 564 nm with beam radiusw=1000 µm and similar laser power-exposure timeproduct are shown in Fig. 11. The peaks bleachat different rates depending on the excitation wave-
7

FIG. 9. (color online) (a) Sample emission spectra ofa 10 K Ba getter deposit in SXe excited by a blue dyelaser; (b) Excitation spectra of the candidate Ba emis-sion lines at 484 nm and 492 nm and the 596 nm Ba linebased on Gaussian fits to the complete set of spectra.These spectra were taken with the fiber coupling systemof optics.
length. For example, with 555 nm excitation, the575 nm emission peak bleaches more rapidly thanthe 590 nm peak. On the other hand, with 560 nmexcitation the 568 nm and 590 nm emission peaksbleach more rapidly than the 575 nm peak. Thereare two additional peaks at 617 nm and 665 nm, thatare initially weaker, but do not bleach. The 665 nmpeak is not shown because it was cut off by a filterin this data set.
In all the graphs in the previous sections, efforthas been made to present spectra in which there hadbeen minimal bleaching due to low laser power andan unfocused laser beam.
FIG. 10. (color online) (a) Sample emission spectra of aBa+ ion beam deposit in SXe excited at different wave-lengths; (b) excitation spectrum for candidate Ba+ lines.This deposit was made and observed at 10 K.
B. Ba Molecular lines
Five additional emission lines observed only inBa+ ion deposits were unusually narrow and hada common excitation spectrum with a sharp peakat 478.5 nm. The emission spectrum and the ex-citation spectrum for the 522 nm emission line areshown in Fig. 12. The large and approximately con-stant spacing of 1723±48 cm−1 suggests a vibra-tional sequence of a molecular electronic transitionin a species with a small reduced mass, such as ahydrogen-containing molecule. The 478.5 nm exci-tation line is likely the electronic transition betweenv=0 vibrational states, whereas the five red-shiftedfluorescence lines can be interpreted as transitionsbetween the v′=0 level of the excited state to thev′′=1-5 levels of the ground state. The molecularvibrational constants in vacuum for several bariumhydride molecules with electronic transitions in theblue region of the spectrum are given in Table I. All
8

FIG. 11. (color online) Bleaching of 568 nm, 575 nmand 590 nm fluorescence lines of Ba in SXe with (a)555 nm, (b) 560 nm and (c) 564 nm excitation. Everytenth exposure is shown starting with the second. Thecolors range from blue (first) to red (last). The laserpower and exposure time for each excitation wavelengthare indicated. These are a Ba+ deposits in SXe made at45K and observed at 10 K.
of these candidate molecules have ground state vi-brational frequencies significantly smaller than theobserved value. The small matrix shift of the vi-brational constant of the neutral species, BaH andBaH2, in SAr argues against attributing the discrep-
ancy to a large matrix shift of these species in SXe.Nevertheless, the situation could be different for anion. For comparison, the vibrational constants of H2
and H+2 are also given. These are much greater than
the observed value. If there is H2 impurity content inthe matrix, an expected species is BaH+
2 for Ba+ iondeposits. However, measured or calculated groundstate vibrational constants for BaH+
2 were not foundin the literature.
FIG. 12. (color online) Excitation (black) and emission(red, blue) spectra with a set of sharp regularly-spacedlines observed in a Ba+ deposit.
TABLE I. Ground state vibrational constants ωe in cm−1
of simple barium and hydrogen molecules in vacuum andin solid argon matrix.
Species Vacuum SAr ref
BaH2 ν3 1102a 1069 [17]
BaH2 ν1 1167a 1129 [17]
BaH 1168 1132 [17, 18]
BaH+ 1370a [19]
H+2 2324a [20]
H2 4400 [21]
H2Xe 4398 [22]
BaH+2
Observed SXe 1723(48)atheoretical
Two experiments were performed to test the influ-ence of the hydrogen impurity content in the matrixon the strength of these lines. One way to vary therelative concentration of residual gas molecules inthe matrix is to vary the Xe leak rate, as discussedabove. Emission spectra with 478.0 nm excitation
9

at low leak rate (higher impurity concentration) andhigher leak rate (lower impurity concentration) areshown in Fig. 13. It is observed that the sharp emis-sion peaks at 522 nm and 575 nm are much reducedin the purer matrix.
FIG. 13. (color online) Emission spectra of a Ba+ de-posit in SXe made and observed at 10 K with 478.0 nmdye laser excitation at low (black) and high (red) xenongas leak rate. The matrix growth rate was 1 and30 nm/s, respectively.
In addition, one can independently control justthe H2 impurity content in the matrix through thetemperature at which the matrix is deposited. Whena pure residual gas matrix (minimal Xe) is heated,residual gas pressure measurements vs. windowtemperature reveal that H2 evaporates at 11-20 K,whereas N2, Ar and O2 start evaporating at around30-32 K. Thus a SXe matrix deposited at ≥ 25 Kshould contain much less H2 than a matrix depositedat the usual 10 K. Spectra for SXe matrices de-posited at 10 K and 50 K are shown in Fig. 14. Theabsence of the 522 nm and 575 nm lines in the highertemperature deposit further confirms the identifica-tion of these molecular lines with a barium hydridemolecule of some sort, denoted below as BaH+
x .
V. DISCUSSION
The energy level diagram for the lowest lying lev-els of Ba in vacuum is shown in Fig. 15(a). Fromthe ground 6s2 1S0 state, the strongest transition invacuum is at 553.5 nm to the 6s6p 1P1 state. Thisstate decays almost exclusively back to the groundstate, but has weaker decays at around 1.1 µm and1.5 µm to three 6s5d states with a branching ra-tio of 1/350. The strong absorption band observedaround 558 nm and 530 nm for Ba atomic deposits
FIG. 14. (color online) Fluorescence spectra of Ba+
ion deposits in SXe made at two different temperaturesand observed at 10 K. The excitation wavelength was478.1 nm.
in SXe and SAr, respectively, has been assigned tothis transition. The red-shifted emission peaks at565-590 nm and 530-540 nm, respectively, similarlyare assigned to the return transition to the groundstate in these matrices.
In vacuum, after about 350 cycles of this tran-sition, a high fraction of the population accumu-lates in the 6s5d states, which have long radiativelifetimes, from 0.2 s for 1D2 to 69 s for 3D2. Toachieve a magneto-optical trap (MOT) in vacuum,three infrared repumping lasers were applied to over-come optical pumping and depopulate these long-lived metastable states [23].
In SXe, the lifetimes of these metastable statesmay not be as long. There may exist a small oddparity component of the electric field experiencedby the Ba atoms in various matrix sites due to theelectron cloud of neighboring Xe atoms. This couldmake the parity-forbidden decays of the 6s5d statesto the 6s2 ground state weakly allowed by an admix-ture of wavefunctions of odd-parity states, e.g., 6s6pstates. It is not known how significant this effect willbe.
In this model, if the 6s2 → 6s6p excitation rateis much greater than 103 times the 6s5d state decayrates, the populations of the 6s5d states can becomecomparable to that of the ground state. This couldbe a rapid and dominant effect with focused resonantlaser excitation. Even with white light excitation,during lengthy absorption measurements, some op-tical pumping to metastable 6s5d state may occur.Thus one possible assignment of the weak absorp-tion triplets observed in the blue for Ba in SXe andSAr could be absorptions out of these metastablestates. Indeed, transitions from these levels to the
10

FIG. 15. (color online) Energy levels of (a) Ba and (b)Ba+ in vacum.
6s7p states exist in vacuum in this wavelength re-gion. The 483 nm and 492 nm emission lines of Bain SXe could be 6s7p→ 6s5d transitions.
An alternative explanation is matrix sites withlarge blue shifts on the 6s2 → 6s6p transition. Suchlarge shifts do occur for alkali atoms in noble gas ma-trices. For example, calculations have shown thatthe “blue” and “violet” triplets of Li, Na and Katoms in SAr matrices are due to atoms in sites withone and four neighboring vacancies, in which neigh-bor interactions with the alkali atom are relativelystrong [24]. Further experimental and theoreticalwork is needed to assign these new blue transitions.
The energy levels of Ba+ in vacuum, shown inFig. 15(b), are simpler than those of Ba. The exci-tation peaks at 472 nm and <461 nm in Fig. 10(b)could be the 6s-6p transitions. The various emissionpeaks in Fig. 10(a) could be associated with the 6p-5d transitions or red-shifted 6p-6s transitions. Com-parison spectra from other atomic ions in noble gasmatrices are few, so it is not possible to make assign-
ments based on general trends. An extended excita-tion range with the blue dye laser, careful bleachingstudies, pulsed laser excitation and theoretical mod-eling would help.
All observed lines and best assignments are sum-marized in Table II. Similar emission peaks obtainedin SAr are also indicated. For the spectra in SArmatrix, the dye laser was not used. Thus the argonlaser line with the strongest excitation is listed inparentheses in the excitation column. The modestblue shift of each line in SAr relative to those in SXeis consistent with expectations from previous matrixisolation spectroscopy results [2].
To progress towards the goal of single atom or iondetection, it is important to determine the fluores-cence rate per atom from the measured fluorescencecount rate. This requires a knowledge of the num-ber of Ba atoms per area in the matrix deposit. Forgetter deposits, the Ba flux is not known, but theBa atom density per area in the matrix may be de-termined from absorbance measurements. The ab-sorbance Aλ is related to the Ba density per volumeN and absorption cross-section σ(λ) by
Aλ = σ(λ)N` (1)
where l is the path length through the Ba layer inthe matrix. The quantity N` is the Ba density perarea. The number of Ba atoms in a laser beam ofarea a, N`a, can be determined for a given deposit ifthe absorbance is measured and the absorption crosssection is known.
A reasonable expectation is that the integratedcross section for a strong transition of a Ba atom invacuum is conserved in the matrix. This is an as-sumption of conservation of oscillator strength. Inthis approximation, the cross section σ(λ) for a Baatom in the SXe matrix (averaging over different ma-trix sites) may be estimated using the shape of theabsorption curve in Fig. 5(a).
σ(λ) = Aλ
∫σ(λ)dλ∫Aλdλ
(2)
The peak absorption cross section obtained isσ(λ0)=1.2×10⁻¹⁵ cm2 at λ0=558 nm. Using equa-tion (1) the area density of Ba atoms for the dataset in Fig. 5 can be estimated as 1×10¹³ atoms/cm2
for this particular deposit.For large Ba deposits, where the Ba area density is
known from absorption measurements, the expectedfluorescence rate of transitions to the ground state,F , in photons/s/atom can be predicted. In the ab-sence of non-radiative transitions from the excited
11
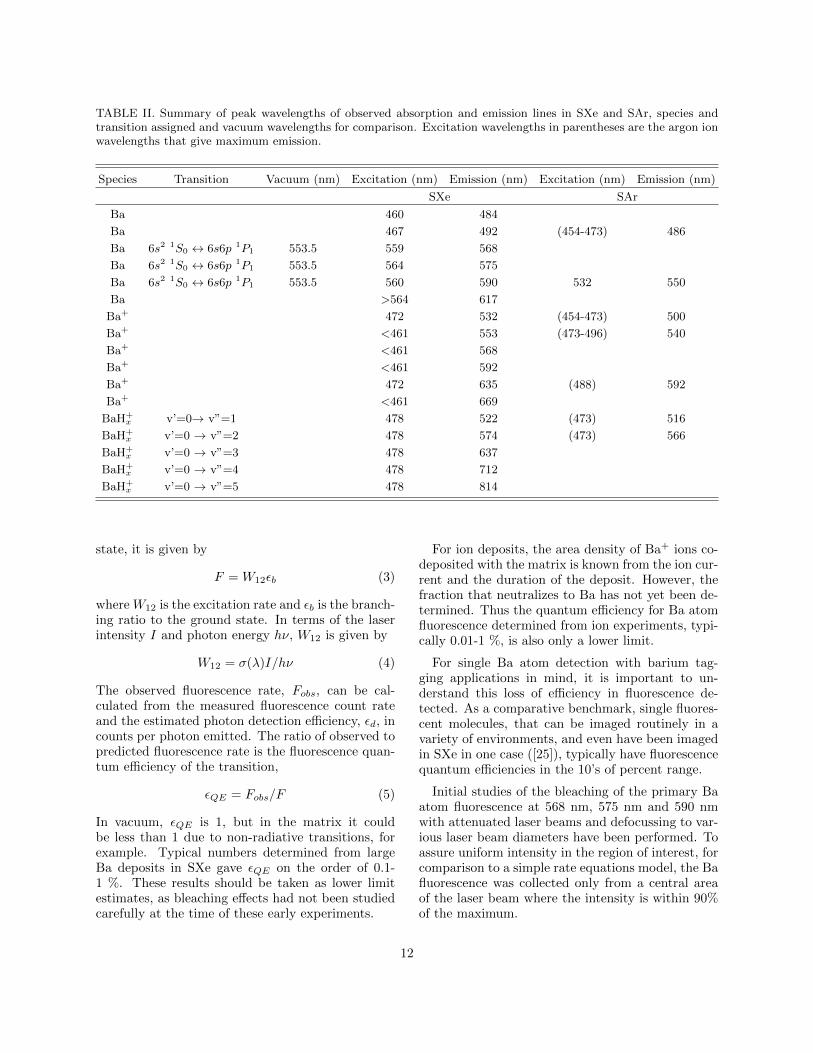
TABLE II. Summary of peak wavelengths of observed absorption and emission lines in SXe and SAr, species andtransition assigned and vacuum wavelengths for comparison. Excitation wavelengths in parentheses are the argon ionwavelengths that give maximum emission.
Species Transition Vacuum (nm) Excitation (nm) Emission (nm) Excitation (nm) Emission (nm)
SXe SAr
Ba 460 484
Ba 467 492 (454-473) 486
Ba 6s2 1S0 ↔ 6s6p 1P1 553.5 559 568
Ba 6s2 1S0 ↔ 6s6p 1P1 553.5 564 575
Ba 6s2 1S0 ↔ 6s6p 1P1 553.5 560 590 532 550
Ba >564 617
Ba+ 472 532 (454-473) 500
Ba+ <461 553 (473-496) 540
Ba+ <461 568
Ba+ <461 592
Ba+ 472 635 (488) 592
Ba+ <461 669
BaH+x v’=0→ v”=1 478 522 (473) 516
BaH+x v’=0 → v”=2 478 574 (473) 566
BaH+x v’=0 → v”=3 478 637
BaH+x v’=0 → v”=4 478 712
BaH+x v’=0 → v”=5 478 814
state, it is given by
F = W12εb (3)
where W12 is the excitation rate and εb is the branch-ing ratio to the ground state. In terms of the laserintensity I and photon energy hν, W12 is given by
W12 = σ(λ)I/hν (4)
The observed fluorescence rate, Fobs, can be cal-culated from the measured fluorescence count rateand the estimated photon detection efficiency, εd, incounts per photon emitted. The ratio of observed topredicted fluorescence rate is the fluorescence quan-tum efficiency of the transition,
εQE = Fobs/F (5)
In vacuum, εQE is 1, but in the matrix it couldbe less than 1 due to non-radiative transitions, forexample. Typical numbers determined from largeBa deposits in SXe gave εQE on the order of 0.1-1 %. These results should be taken as lower limitestimates, as bleaching effects had not been studiedcarefully at the time of these early experiments.
For ion deposits, the area density of Ba+ ions co-deposited with the matrix is known from the ion cur-rent and the duration of the deposit. However, thefraction that neutralizes to Ba has not yet been de-termined. Thus the quantum efficiency for Ba atomfluorescence determined from ion experiments, typi-cally 0.01-1 %, is also only a lower limit.
For single Ba atom detection with barium tag-ging applications in mind, it is important to un-derstand this loss of efficiency in fluorescence de-tected. As a comparative benchmark, single fluores-cent molecules, that can be imaged routinely in avariety of environments, and even have been imagedin SXe in one case ([25]), typically have fluorescencequantum efficiencies in the 10’s of percent range.
Initial studies of the bleaching of the primary Baatom fluorescence at 568 nm, 575 nm and 590 nmwith attenuated laser beams and defocussing to var-ious laser beam diameters have been performed. Toassure uniform intensity in the region of interest, forcomparison to a simple rate equations model, the Bafluorescence was collected only from a central areaof the laser beam where the intensity is within 90%of the maximum.
12

Normalized experimental bleaching curves havebeen compared to a rate equations model with oneexcitation rate W12 and 7 spontaneous emissionrates Aij between the five states of interest shownin Fig. 15(a). Agreement is relatively good usingvalues for these parameters close to the W12 valuecalculated as discussed above and the free atom Aij
rates. In some cases the shape of the decay curveis matched better by adding an additional loss ratefrom the 6s6p 1P1 state, up to 105 s−1, that may,for example, account for a change in matrix site asa result of an excitation cycle.
The addition to the model of rapid non-radiativedecays out of the 6s6p1P1 state at rates of 1010 −1012 s−1 could account for low εQE . The bleach-ing curves of the model would be unaffected ifthese rapid non-radiative decays occurred only tothe ground 6s2 state. However, this is a physicallyimprobable scenario. The most likely final state forsuch non-radiative decays is the nearby 6s6p 3P2
state, as has been found with Ba in low pressureXe gas and with Hg in SAr matrix [23, 25]. Sincethis state undergoes strong radiative decay to themetastable 6s5d 3D states, this leads to very rapidoptical pumping in the model and complete disagree-ment with observed bleaching curves.
Recent theoretical work opens the possibility of adeeper understanding of the transitions associatedwith the various observed peaks, as well as the ob-served bleaching rates. Alkali atoms Li, Na and Kin solid Ar, Kr and Xe have been modeled usinga method based on alkali-noble gas pair potentials[26]. Matrix sites of alkali atoms upon depositionwere found by molecular dynamics simulations. Ab-sorption triplets could be assigned to specific ma-trix sites, but emission spectra had poor agreementwith experiment. Using a model based on core po-larization pseudopotentials, a much better matchto experimental emission spectra was obtained forNa in SAr, and various peaks in observed spec-tra could be assigned to four distinct matrix sites[24]. Recently, the molecular pair potentials of vari-ous states of BaXe and BaXe+ have been calculated[27]. Thus detailed simulation of the spectra of Baand Ba+ in SXe matrix sites could be done. Thisopens the possibility of making assignment of theunidentified lines in Table II and understanding thebleaching and quantum efficiency of various transi-tions through theoretical comparisons.
For example, the recent calculations indicate thatthe 21π molecular potential curve of BaXe, corre-sponding to the 6s6p 1P1 atomic state of Ba, iscrossed near its minimum by the potential curve ofthe repulsive 23Σ+ state arising from the 6s6p3P
atomic states of Ba. Population transfer at thislevel crossing is spin-forbidden, but might occurweakly. This could explain the non-radiative tran-sition, 6s6p 1P1 → 6s6p 3P2, observed in gas phasecollisions. Level crossing may also contribute to theloss of quantum efficiency of Ba in SXe found inthis work, although additional non-radiative path-ways would be required have consistency with thebleaching data.
In BaXe+, the equilibrium radii for the groundX2Σ+ state and the 22π state are calculated to benearly identical, as both bound states experiencethe same dominant charge-induced dipole potentialterm. Thus, in this molecule, the low tempera-ture absorption and emission spectra correspond-ing to the primary transitions of Ba+ in vacuum at455.4 nm and 493.4 nm are expected to be quitesharp, with a Stokes shift of only a few nm. If simi-lar considerations apply for Ba+ in SXe, the emissionon these transitions could have been missed becauseit was cut off by the Raman filters used in this work.The BaXe+ transitions to the states arising from the5d atomic configuration, 12∆, 12π and 12Σ+, wouldbe in the yellow-green region and sharp for the firsttwo bound states and in the red region and broaderfor the third weakly bound state with a larger re-pulsive term. These are candidate assignments forthe observed emission lines in SXe that have beententatively listed as Ba+.
VI. IMAGING BA ATOMS
A series of three consecutive images of a smallnumber of Ba atoms in a focused dye laser beam isshown in Fig. 16. They were taken with a modifiedoptical system in which a f/0.9 aspherical collectionlens was used for higher light collection efficiency,and the zoom lens projected the image directly onthe CCD chip. This avoided angular and aberra-tion limitations, as well as losses, of the spectrome-ter in zero order imaging mode. A optical bandpassfilter with sharp cutoffs passed 578-603 nm emis-sion. In this case about 104 Ba+ ions were depositedwithin the 1/e radius of the laser beam (1/e2 radiusw=2.3 µm), and an unknown percentage of themneutralized to Ba atoms. In the first 1 s frame, asharp peak containing about 500 counts is observed.Due to bleaching, the fluorescence peak is reducedin the second frame, and is nearly gone by the thirdframe. The laser intensity was attenuated by 103
in this experiment, to the µW level, in order to ob-serve the decay due to bleaching with 1 s frames ofthe CCD camera.
13

FIG. 16. (color online) Successive 1 s images of a small number of Ba atoms from about 104 Ba+ ions depositedwithin the laser beam area. The excitation laser was at 564 nm.
With an optical magnification of 4.3, the effec-tive pixel size in this image is 4.7 µm. The FWHMof the image, 30×43 µm, is an order of magnitudelarger than the dye laser FWHM. This blurring ofthe image is mainly due a rough SXe surface in thisexperiment.
One of the remarkable observations in this work isthat after a sample with a large Ba or Ba+ depositin SXe is evaporated by heating to 100 K, there isno evidence of any remaining Ba or Ba+ fluorescencein the next deposit at the current level of sensitivity.It is not known whether the Ba or Ba+ evaporatedwith the xenon or if it remained on the window asa non-fluorescing metallic or oxide coating, for ex-ample. This lack of a “history” effect is potentiallyan important advantage for Ba tagging in a doublebeta decay experiment.
A near-term goal of this barium tagging researchis to obtain images of single Ba atoms or Ba+ ionsin SXe on a cold sapphire window. The main fac-tors that limit single atom or ion imaging in thecurrent setup are (1) limited fluorescence durationdue to bleaching, (2) low quantum efficiency, (3)modest photon detection efficiency and (4) opticalsystem aberrations. Improvement in photon detec-tion efficiency and perfecting optical system imagequality to the diffraction limit are straightforwardthrough the implementation of high collection effi-ciency microscope objectives commonly used in sin-gle molecule imaging. Greater care is needed to en-sure conditions of smooth matrix surfaces. Workis underway to study the first two factors, whichinvolve the fundamental atomic physics of bariumatoms and ions in SXe matrices. If bleaching can
be overcome, higher intensities by 103 or more andlonger exposures would yield single atom signalscomparable to the image in Fig. 16.
VII. CONCLUSIONS
Strong and stable fluorescence of Ba atoms in solidxenon matrices at low temperature has been demon-strated. Absorption and fluorescence spectra asso-ciated with the 6s2→6s6p transition are reported.Excitation spectra and temperature and bleachingdependences demonstrate the existence of differentmatrix sites for the Ba atoms in solid xenon matrix.Corresponding spectral features are found for Ba insolid argon matrix, somewhat blue-shifted relative toSXe. Additional absorption and fluorescence peaksof Ba in SXe may represent transitions out of themetastable 6s5d states of Ba or blue bands associ-ated with the primary transition in different matrixsites.
The strong neutral Ba absorption and emissionpeaks are also found in Ba+ deposits into SXe, in-dicating the occurrence of some neutralization. Inaddition, sharp peaks associated with well-resolvedvibrational lines of an electronic transition in a yetunidentified barium and hydrogen species are found.Additional peaks not found in Ba deposits are ten-tatively assigned to Ba+ transitions in SXe. Furtherexperimental and theoretical studies are needed tofully understand all the observed spectral features.
In the current work, bleaching, fluorescence quan-tum efficiency and photon detection efficiency limitBa atom imaging capability to ≤104 atoms. Op-
14

tics improvements, the addition of repumping lasersto overcome bleaching and a better understandingcould make single Ba atom imaging possible, lead-ing to a method for barium tagging in liquid xenonfor nEXO.
ACKNOWLEDGEMENTS
This material is based upon work supported bythe National Science Foundation under Grant Nun-ber PHY-1132428 and the U.S. Department of En-ergy, Office of Science, Office of High Energy Physicsunder Award Number DE-FG02-03ER41255.
[1] E. Whittle, D. A. Dows, and G. C. Pimentel, J.Chem. Phys. 22, 1943 (1954).
[2] C. Crepin-Gilbert and A. Tramer, International Re-views in Physical Chemistry 18, 485 (1999).
[3] F. T. Avignone III, S. R. Elliott, and J. Engel, Rev.Mod. Phys. 80, 481 (2008).
[4] M. Auger et al., Phys. Rev. Lett. 109, 032505(2012).
[5] A. Gando et al., Phys. Rev. Lett. 110, 062502(2013).
[6] M. Agostini et al., Phys. Rev. Lett. 111, 122503(2013).
[7] J. Albert et al., Nature (London) 510, 229 (2014).[8] M. Moe, Phys. Rev. C 44, R931 (1991).[9] K. Hall, In-situ Laser Tagging of Barium Ions in
Liquid Xenon for the EXO Experiment, Ph.D. the-sis, Colorado State University (2012).
[10] K. Twelker et al., Review of Scientific Instruments85, 095114 (2014).
[11] L. Balling and J. Wright, J. Chem. Phys. 83, 2614(1985).
[12] S. Kanorsky, M. Arndt, R. Dziewior, A. Weis, andT. Hansch, Phys. Rev. B 50, 6296 (1994); V. Lebe-dev, P. Moroshkin, and A. Weis, Phys. Rev. A 84,022502 (2011).
[13] Advanced Research Systems closed cycle cryostatmodel DE-202.
[14] SAES type HU13.[15] Acton SP2150, Princeton instruments SPEC-10.
[16] Colutron ion gun model G-2.[17] Granville-Phillips leak valve series-203; X. Wang
and L. Andrews, J. Phys. Chem. A 108, 11500(2004).
[18] U. Magg, H. Birk, and H. Jones, Chem. Phys. Lett.149, 321 (1988).
[19] A. Allouche, F. Spiegelmann, and M. Aubert-Frecon, Chem. Phys. Lett. 204, 343 (1993).
[20] C. L. Beckel, B. D. Hansen III, and J. M. Peek, J.Chem. Phys. 53, 3681 (1970).
[21] G. Herzberg and L. Howe, Can. J. Phys. 37, 636(1959).
[22] A. McKellar and H. Welsh, J. Chem. Phys. 55, 595(1971).
[23] S. De, U. Dammalapati, K. Jungmann, and L. Will-mann, Phys. Rev. A 79, 041402 (2009).
[24] E. Jacquet, D. Zanuttini, J. Douady, E. Giglio, andB. Gervais, J. Chem. Phys. 135, 174503 (2011).
[25] J. Sepio l, A. Starukhin, R. Ko los, T. Latychevskaia,J. Jasny, A. Renn, and U. P. Wild, Chem. Phys.Lett. 311, 29 (1999); C. Crepin, M. Chergui,T. Herbert, L. Konig, P. Martin, and A. Tramer,J. Phys. Chem. 98, 3280 (1994).
[26] M. Ryan, M. Collier, P. d. Pujo, C. Crepin, andJ. G. McCaffrey, J. Phys. Chemi. A 114, 3011(2009).
[27] K. Abdessalem, L. Mejrissi, N. Issaoui, B. Oujia,and F. X. Gadea, J. Phys. Chem. A 117, 8925(2013).
15
Related Documents