arXiv:1510.00324v1 [astro-ph.SR] 1 Oct 2015 Mon. Not. R. Astron. Soc. 000, 1–15 (2015) Printed 2 October 2015 (MN L A T E X style file v2.2) Spectroscopy, MOST Photometry, and Interferometry of MWC 314: Is it an LBV or an interacting binary? Noel D. Richardson 1⋆ , Anthony F. J. Moffat 1 , Rapha¨ el Maltais–Tariant 1 , Herbert Pablo 1 , Douglas R. Gies 2 , Hideyuki Saio 3 , Nicole St-Louis 1 , Gail Schaefer 4 , Anatoly S. Miroshnichenko 5 , Chris Farrington 4 , Emily J. Aldoretta 1 , ´ Etienne Artigau 1 , Tabetha S. Boyajian 6 , Kathryn Gordon 2 , Jeremy Jones 2 , Rachel Matson 2 , Harold A. McAlister 2 , David O’Brien 7 , Deepak Raghavan 2 , Tahina Ramiaramanantsoa 1 , Stephen T. Ridgway 8 , Nic Scott 4 , Judit Sturmann 4 , Laszlo Sturmann 4 , Theo ten Brummelaar 4 , Joshua D. Thomas 9 , Nils Turner 4 , Norm Vargas 4 , Sergey Zharikov 10 , Jaymie Matthews 11 , Chris Cameron 12 , David Guenther 13 , Rainer Kuschnig 11,14 , Jason Rowe 15 , Slavek Rucinski 16 , Dimitar Sasselov 17 , and Werner Weiss 14 1 D´ epartement de physique and Centre de Recherche en Astrophysique du Qu´ ebec (CRAQ), Universit´ e de Montr´ eal, C.P. 6128, Succ. Centre-Ville, Montr´ eal, Qu´ ebec, H3C 3J7, Canada 2 Center for High Angular Resolution Astronomy, Department of Physics and Astronomy, Georgia State University, P. O. Box 5060, Atlanta, GA 30302-5060, USA 3 Astronomical Institute, Graduate School of Science, Tohoku University, Sendai, Miyagi 980-8578, Japan 4 The CHARA Array, Mount Wilson Observatory, 91023 Mount Wilson CA, USA 5 Department of Physics and Astronomy, University of North Carolina at Greensboro, Greensboro, NC 27402-6170, USA 6 Yale University, New Haven, CT 06520-8101, USA 7 Max Planck Institute for Radio Astronomy, P.O. Box 20 24, D-53010 Bonn, Germany 8 National Optical Astronomy Observatory, 950 North Cherry Ave., Tucson, AZ 85719, USA 9 Department of Physics, Clarkson University, 8 Clarkson Ave, Potsdam, New York 13699, USA 10 Instituto de Astronom´ ıa, Universidad Nacional Aut´ onoma de M´ exico, Ensenada, BC 22860, Mexico 11 Department of Physics and Astronomy, University of British Columbia, 6224 Agricultural Road, Vancouver, BC V6T 1Z1, Canada 12 Department of Mathematics, Physics & Geology, Cape Breton University, 1250 Grand Lake Road, Sydney, Nova Scotia B1P 6L2, Canada 13 Institute for Computational Astrophysics, Dept. of Astronomy and Physics, St Mary’s University Halifax, NS B3H 3C3, Canada 14 University of Vienna, Institute for Astronomy, T¨ urkenschanzstrasse 17, A-1180 Vienna, Austria 15 NASA Ames Research Center, Moffett Field, CA 94035, USA 16 Dept. of Astronomy and Astrophysics, University of Toronto, 50 St George Street, Toronto, ON M5S 3H4, Canada 17 Harvard-Smithsonian Center for Astrophysics, 60 Garden Street, Cambridge, MA 02138, USA c 2015 RAS

Welcome message from author
This document is posted to help you gain knowledge. Please leave a comment to let me know what you think about it! Share it to your friends and learn new things together.
Transcript
arX
iv:1
510.
0032
4v1
[as
tro-
ph.S
R]
1 O
ct 2
015
Mon. Not. R. Astron. Soc. 000, 1–15 (2015) Printed 2 October 2015 (MN LATEX style file v2.2)
Spectroscopy, MOST Photometry, and Interferometry of
MWC 314: Is it an LBV or an interacting binary?
Noel D. Richardson1⋆, Anthony F. J. Moffat1, Raphael Maltais–Tariant1,
Herbert Pablo1, Douglas R. Gies2, Hideyuki Saio3, Nicole St-Louis1, Gail Schaefer4,
Anatoly S. Miroshnichenko5, Chris Farrington4, Emily J. Aldoretta1,
Etienne Artigau1, Tabetha S. Boyajian6, Kathryn Gordon2, Jeremy Jones2,
Rachel Matson2, Harold A. McAlister2, David O’Brien7, Deepak Raghavan2,
Tahina Ramiaramanantsoa1, Stephen T. Ridgway8, Nic Scott4, Judit Sturmann4,
Laszlo Sturmann4, Theo ten Brummelaar4, Joshua D. Thomas9, Nils Turner4,
Norm Vargas4, Sergey Zharikov10, Jaymie Matthews11, Chris Cameron12,
David Guenther13, Rainer Kuschnig11,14, Jason Rowe15, Slavek Rucinski16,
Dimitar Sasselov17, and Werner Weiss141 Departement de physique and Centre de Recherche en Astrophysique du Quebec (CRAQ), Universite de Montreal, C.P. 6128,Succ. Centre-Ville, Montreal, Quebec, H3C 3J7, Canada2 Center for High Angular Resolution Astronomy, Department of Physics and Astronomy, Georgia State University, P. O. Box 5060,Atlanta, GA 30302-5060, USA3 Astronomical Institute, Graduate School of Science, Tohoku University, Sendai, Miyagi 980-8578, Japan4 The CHARA Array, Mount Wilson Observatory, 91023 Mount Wilson CA, USA5 Department of Physics and Astronomy, University of North Carolina at Greensboro, Greensboro, NC 27402-6170, USA6 Yale University, New Haven, CT 06520-8101, USA7 Max Planck Institute for Radio Astronomy, P.O. Box 20 24, D-53010 Bonn, Germany8 National Optical Astronomy Observatory, 950 North Cherry Ave., Tucson, AZ 85719, USA9 Department of Physics, Clarkson University, 8 Clarkson Ave, Potsdam, New York 13699, USA10 Instituto de Astronomıa, Universidad Nacional Autonoma de Mexico, Ensenada, BC 22860, Mexico11 Department of Physics and Astronomy, University of British Columbia, 6224 Agricultural Road, Vancouver, BC V6T 1Z1, Canada12 Department of Mathematics, Physics & Geology, Cape Breton University, 1250 Grand Lake Road, Sydney, Nova Scotia B1P 6L2, Canada13 Institute for Computational Astrophysics, Dept. of Astronomy and Physics, St Mary’s University Halifax, NS B3H 3C3, Canada14 University of Vienna, Institute for Astronomy, Turkenschanzstrasse 17, A-1180 Vienna, Austria15 NASA Ames Research Center, Moffett Field, CA 94035, USA16 Dept. of Astronomy and Astrophysics, University of Toronto, 50 St George Street, Toronto, ON M5S 3H4, Canada17 Harvard-Smithsonian Center for Astrophysics, 60 Garden Street, Cambridge, MA 02138, USA
c© 2015 RAS
2 N. D. Richardson et al.
ABSTRACT
MWC 314 is a bright candidate luminous blue variable that resides in a fairly closebinary system, with an orbital period of 60.753±0.003 d. We observed MWC 314 with acombination of optical spectroscopy, broad-band ground- and space-based photometry,as well as with long baseline, near-infrared interferometry. We have revised the single-lined spectroscopic orbit and explored the photometric variability. The orbital lightcurve displays two minima each orbit that can be partially explained in terms ofthe tidal distortion of the primary that occurs around the time of periastron. Theemission lines in the system are often double-peaked and stationary in their kinematics,indicative of a circumbinary disc. We find that the stellar wind or circumbinary discis partially resolved in the K ′-band with the longest baselines of the CHARA Array.From this analysis, we provide a simple, qualitative model in an attempt to explain theobservations. From the assumption of Roche Lobe overflow and tidal synchronisationat periastron, we estimate the component masses to be M1 ≈ 5M⊙ and M2 ≈ 15M⊙,which indicates a mass of the LBV that is extremely low. In addition to the orbitalmodulation, we discovered two pulsational modes with the MOST satellite. Thesemodes are easily supported by a low-mass hydrogen-poor star, but cannot be easilysupported by a star with the parameters of an LBV. The combination of these resultsprovides evidence that the primary star was likely never a normal LBV, but ratheris the product of binary interactions. As such, this system presents opportunities forstudying mass-transfer and binary evolution with many observational techniques.
Key words: stars: early-type – binaries: close – stars: individual (MWC 314) – stars:winds, outflows – stars: mass loss – stars: variables: S Doradus
1 INTRODUCTION
Massive stars provide much of the energy input in the Uni-verse. Their high mass-loss rates and supernova explosionsprovide important feedback to the star formation processesand total energy input of galaxies. Recent advances in stellarmodelling (e.g., Groh et al. 2013) show that the supernovaprogenitors for core collapse supernovae come in many dif-ferent types that include red supergiants (RSG), blue super-giants (BSG), Wolf-Rayet (WR) stars, and Luminous BlueVariables (LBVs).
Massive stars tend to be found primarily in binary sys-tems. The O stars are thought to have a bound companionabout 75% of the time, with most of the exceptions beingrunaway stars (e.g. Mason et al. 2009). Mason et al. foundthat O stars in clusters and associations have companionsat least 60-80% of the time. Their sample focused on highangular resolution techniques, but also incorporated spec-troscopic results. Sana et al. (2012) showed that 71% of Ostars will have a binary interaction during their lives. Theyfound that only 29% of the O stars are effectively single (ei-ther very-long period binary stars or actually single), mean-ing that evolutionary models that do not incorporate binaryeffects will have limited applicability.
LBVs are among the most unusual classes of massivestars. They have attained a highly luminous, unstable statethat shows remarkable mass-loss and variability. The nor-mal mass-loss rates range between 10−6 − 10−3 M⊙ yr−1,which has typically led to the conclusion that these ob-jects are post-main sequence, hydrogen-shell-burning mas-sive stars that represent the transitionary phase between the
⋆ E-mail:[email protected]
main sequence O stars and the helium-burning WR stars(e.g. Humphreys & Davidson 1994; van Genderen 2001).However, the recent analysis by Groh et al. (2013) showsthat lower initial mass stars (20–25 M⊙) can become LBVsafter the RSG phase, and then explode as type II supernovaeduring the final LBV phase.
With a large binary fraction for the main-sequence Ostars, one may also expect to see a high binary fraction inthe post-main sequence massive stars. However, the binaryfraction for WR stars is low (40%) as noted by Vanbeveren &Conti (1980). An examination of the multiplicity and bina-rity of LBVs was reported by Martayan et al. (2012) who re-ported a remarkably low binary fraction of only 11%. Thereare only four well-studied LBV binary systems: η Carinae(e.g. Richardson et al. 2010, Madura et al. 2013 and refer-ences therein), MWC 314 (Lobel et al. 2013, hereafter L13),HD 5980 (e.g. Koenigsberger et al. 2010), and R 81 (HDE269128; Tubbesing et al. 2002). η Car is by far the most stud-ied of all these binary systems, but analyses of both η Carand the other systems have not produced reliable, model-independent masses yet. For example, in the R 81 system, aclear eclipse is seen in the light curve while the primary is infront of the secondary in our line of sight, but the secondaryeclipse is small, and similar in amplitude to the pulsationsin the system. The masses of both stars are only knownto a factor of ∼ 2, which does not provide much insightinto the masses of these evolved massive stars (Tubbesing etal. 2002). HD 5980 shows orbital variations due to both col-liding winds and binarity, and the system shows long-termevolution in its light curve similar to that of other LBVs(Koenigsberger et al. 2010), but the spectrum reveals thatthe two stars both appear as WNh stars (Wolf-Rayet starsshowing nitrogen-enrichment and hydrogen). This makes the
c© 2015 RAS, MNRAS 000, 1–15
The Massive, Interacting Binary MWC 314 3
temperature of HD 5980 hotter than all other LBVs so a de-termination of its mass may not be typical of LBVs. MWC314 is unique in that the orbital period is semi-short (60.8d), it is well-placed in the sky (δ = +14), and bright enoughto allow high resolution studies of the star and its environswith multiple observing techniques.
MWC 314 (BD+14 3887, V1429 Aql, Hen 3-1745) hasbeen examined in a few key studies, which were largely re-viewed in the recent work of L13. Miroshnichenko (1996)found the star to be of high luminosity, exhibit a strong in-terstellar reddening, and to have a similar luminosity to theprototypical LBV, P Cygni. Miroshnichenko et al. (1998)then determined the spectral characteristics and found it tobe very similar to P Cygni, with an estimated distance of3.0 ± 0.2 kpc. Wisniewski et al. (2006) presented a long-term spectropolarimetric and spectroscopic study of MWC314, finding the first evidence of Hα variability. They foundthat the polarisation was variable in a way reminiscent ofan asymmetric wind. MWC 314 was shown to be a spec-troscopic binary by Muratorio et al. (2008), but they un-derestimated the orbital period. L13 measured absorptionlines of S II and Ne I, which are thought to be photospheric,and found the system to have a 60.8 d orbit with a smalleccentricity of e = 0.23. They also demonstrated that theV−band photometry from the All Sky Automated Surveyis modulated on the orbital time scale, and their interpreta-tion of the light curve includes two partial eclipses.
L13 used a model of the single-lined spectroscopic radialvelocity orbit and photometric light curve to help estimatethe mass ratio and system parameters. They found thatthe primary star had typical parameters for an LBV, withTeff = 18, 000K, log g = 2.26, M ≃ 40M⊙, and R ≃ 87R⊙.The secondary star’s parameters were very unusual in thatthey suggest the companion is a yellow giant. This inter-pretation is inconsistent from an evolutionary standpointbecause the secondary should not be able to reach an ad-vanced evolutionary state (cool temperature) given the shortlifetime of the evolved primary star. Liermann et al. (2014)present NIR K−band spectrophotometry of MWC 314 andsome B[e] stars. Several of these stars show CO spectral fea-tures that would be consistent with a companion similar tothat suggested by L13, but MWC 314 does not show thesefeatures.
L13 also developed a three-dimensional wind model tocreate synthetic He I wind lines for comparative purposesshowing some evidence for an asymmetric wind, which wasfurther developed by Lobel et al. (2015). This asymmetricwind has a density enhancement on the leading hemisphereof the LBV that feeds gas into a circumbinary disc. Further,they obtained an image of the Hα emission nebula surround-ing the star which shows a bipolar structure on large scales(Marston & McCollum 2008), but appears spherically sym-metric at small scales of a few arcseconds.
In this paper, we present a variety of new observations(spectroscopy, photometry, and long-baseline near-infraredinterferometry) of the MWC 314 system, which is describedin Section 2. In Section 3, a revised single-lined orbit basedupon new spectroscopy and the work of L13 is presentedand discussed. Section 4 discusses the orbital light-curve, aswell as the discovery of pulsational modes. Our interfero-metric results are presented in Section 5. In Section 6, wepresent a general discussion of the system with respect to
the fundamental parameters, pulsations, and the interfero-metric results. We conclude our study in Section 7.
2 OBSERVATIONS
2.1 Spectroscopy
We observed MWC 314 with a variety of telescopes and in-struments with the primary goal being to better constrainthe single-lined orbit. The telescopes used include the CTIO1.5 m operated by the SMARTS Consortium, the Obser-vatoire du Mont Megantic 1.6 m, McDonald Observatory’sStruve 2.1 m and Harlan Smith 2.7 m, the Mercator 1.2m, and the San Pedro Martir 2.1 m telescopes. All observa-tions were reduced using standard techniques for long-slit orechelle spectroscopy utilising bias frames and flat fields witheither IRAF1 or custom software. Wavelength calibrationwas accomplished through emission-line comparison spec-tra taken before or after each observation. A spectroscopicobserving log is presented in Table A1 that details the tele-scopes, spectrographs, and data.
L13 measured the absorption lines S IIλλ5454, 5474, 5647 and Ne I λ6402, due to their lackof blending with the large number of emission lines inthe spectrum of MWC 314. We sought to include theselines whenever possible. Radial velocity measurements weremade through Gaussian fits of the spectral lines. We foundthat we were able to use the Ne I λ6402 line for all datasets, but the S II lines often suffered from lower S/N andwere unreliable. The McDonald Observatory observationsprovided excellent data for S II λ5647, but were not usablefor the S II λλ5454, 5474 lines. The data from the CTIO1.5 SMARTS fiber-fed bench-mounted echelle2 (Barden& Ingerson 1998) were only usable around the Ne I line.However, the data obtained with the CTIO 1.5 m andthe CHIRON spectrograph (Tokovinin et al. 2013) havehigher S/N across the optical spectrum. The spectroscopicdata discussed in L13 were obtained with the Mercator1.2 m telescope and the HERMES spectrograph (Raskinet al. 2011), which we also used to obtain three additionalspectra of comparable quality. The spectrum taken at SanPedro Martir was extremely useful due to the orbital phaseobserved (most negative radial velocity) and good S/N. Thedata from the Observatoire du Mont Megantic (OMM) wereof much lower spectral resolution, and we only obtained twospectra that had high enough S/N to measure accurately aradial velocity from the weak absorption lines.
2.2 Ground-Based Photometry
Broadband BV RI photometry was obtained throughoutthe 2010–2012 calendar years with the American Associa-tion of Variable Star Observers automated telescope located
1 IRAF is distributed by the National Optical Astronomy Ob-servatory, which is operated by the Association of Universitiesfor Research in Astronomy (AURA) under cooperative agreementwith the National Science Foundation.2 http://www.ctio.noao.edu/∼atokovin/echelle/FECH-overview.html
c© 2015 RAS, MNRAS 000, 1–15
4 N. D. Richardson et al.
at Lowell Observatory. The telescope3 is a Celestron C11Schmidt-Cassegrain instrument with an aperture of 28 cm.Imaging was accomplished with an SBIG ST-7XME camera,which yields images with a field of view of 14×9 arcmin. Thereductions utilise dark, bias, and flat frames, and typicallythe scattered light background leads to a photometric accu-racy of 1–2%. The differential photometry was done relativeto another star in the field, HD 231237, which shows a con-stant light curve in the All Sky Automated Survey (ASAS;Pojmanski 2002) and was classified as G5 by Cannon (1925).
We wished to obtain a reasonable magnitude estimateof MWC 314 relative to the comparison star, so magnitudesfor the comparison star were obtained from the AAVSOPhotometric All-Sky Survey (APASS)4, which measuredB = 11.48± 0.047, V = 10.716± 0.027, g′ = 11.024± 0.032,r′ = 10.497± 0.016, and i′ = 10.228± 0.054 for HD 231237.The Johnson R magnitude was obtained by using the rela-tions given by Kent (1985), which gave R = 9.95. Similarly,we transformed these data into Johnson I using the trans-formations given by Windhorst et al. (1991), which yieldsI = 9.48. We present the measurements of MWC 314 cali-brated by HD 231237 in Table A4. However, we caution thatwe did not perform any colour transformations on the data,so the magnitudes may have small systematic errors relatedto airmass at the time of observation.
2.3 Precision Photometry from MOST
We observed the system with the micro-satellite MOST (Mi-
crovariability and Oscillations of STars) which has a 15-cmMaksutov telescope with a custom broad-band filter cov-ering 3500–7500 A. The sun-synchronous polar orbit has aperiod of 101.4 minutes (f = 14.20 d−1), which enables un-interrupted observations for up to eight weeks for targets inthe continuous viewing zone. A pre-launch summary of themission is given by Walker et al. (2003). The satellite wasnever intended to observe a target for several months andrecover time-scales on the order of the length of the data.
MWC 314 was observed for a small portion of everyspacecraft orbit for 55 d, spanning 2014 June 19 to 2014August 15 in the direct imaging mode. Our data were takenover short orbital segments, which we then averaged dur-ing each 5–10 minute interval to have precise photometryfrom the orbital means. The photometry was extracted us-ing the standard MOST pipeline (Walker et al. 2003), andwe show two different versions of the final light-curve in thispaper, which are given in Tables A6 and A7. The first usesa trend-removed data that removes the binary-induced sig-nal from the light curve. We also attempted to extract thebinary light curve by using a raw extraction that allowed forthe signal to remain. It was difficult to recover the binarysignal, as a remaining instrumental response needed to beremoved through a comparison with all guide stars that wereobserved simultaneously, and then fitting and removing anaverage “instrumental” trend from the data. We note thata small portion of this light curve could not be corrected forthe instrumental response. The long time-series from MOST
was not continuous due to data gaps induced from passages
3 http://www.aavso.org/w284 http://www.aavso.org/apass
through the South Atlantic Anomaly, problems with scat-tered light that is more prominent during northern sum-mer months, and communications errors. Nevertheless, theMOST observations provide a unique photometric data setto explore the variability of this object.
2.4 Long Baseline, Near-Infrared Interferometry
We obtained multiple epochs of long baseline near-infraredinterferometry using the CHARA Array and the Classic (tenBrummelaar et al. 2005) and CLIMB beam combiners (tenBrummelaar et al. 2013) in the K′
−band during the cal-endar years 2010–2013. The CHARA Array is a -shapedinterferometric array of six 1-m telescopes with baselinesranging from 34 to 331 meters in length. Our observationswere primarily at longer baselines, but we obtained a fewmeasurements with short baselines. The nights of observa-tions, baselines used, and calibrators for each observationare listed in Table A2.
To measure the instrument response and calibrate ourdata, we observed calibrator stars with small angular di-ameters both before and after each observation of MWC314. Namely, we observed the calibrator stars HD 174897(θLD = 0.652±0.038 mas; Boyajian et al. 2012), HD 182101(θLD = 0.367 ± 0.017 mas; Berger et al. 2006, Baines etal. 2010), and HD 184606 (θLD = 0.236 ± 0.050 mas; vanBelle et al. 2008). These calibrators have diameters knownfrom fits to the spectral energy distribution and have all beenreliable for previous interferometric studies. The data werereduced using the standard CHARA reduction pipeline (tenBrummelaar et al. 2005, 2013). The visibilities and closurephases were averaged over each observing block. The cali-brated OIFITS data files (Pauls et al. 2005) will be availablethrough the JMMC archive5 or upon request, but we alsoinclude tabulated visibilities in Table A5.
Schaefer et al. (2014) describe the effects of emissionlines on the errors and measurements of V 2. An emissionline reduces the effective bandpass over which the fringe am-plitude is measured causing the true visibility to be smallerthan if a fixed bandpass was assumed. We measured the ef-fective bandpass through comparisons of the width of thepower spectra of both calibrator stars and MWC 314, andfound that this is typically an effect of < 3%, much smallerthan the typical error of our measurements. Further, wecompared a K′
−band filter response with a single NIR spec-trum of MWC 314 we obtained with the Mimir instrumentand the Lowell Observatory 1.8 m telescope (Clemens etal. 2007). This spectrum was reduced with the standardMimir pipline6 and flux-calibrated and telluric-corrected us-ing the xtellcor package (Vacca et al. 2003). This spectrumwas then convolved with the filter response, and we foundthat the effective width was within 1-2% of the nominalwidth. These values show that there was little change inthe visibilities, but the resulting uncertainty in the width ofthe filter (∼ 3%) was added in quadrature to the pipeline-produced error.
5 http://www.jmmc.fr/oidb.htm6 http://people.bu.edu/clemens/mimir/software.html
c© 2015 RAS, MNRAS 000, 1–15

The Massive, Interacting Binary MWC 314 5
3 THE SINGLE-LINED SPECTROSCOPIC
ORBIT
The optical spectrum of MWC 314 consists of four differentkinds of spectral lines, which are illustrated in the spectralatlas of Miroshnichenko et al. (1998). First, there are absorp-tion lines, such as those measured by L13. These are thoughtto be photospheric in origin, with minimal contamination bythe wind. These lines are similar to the photospheric metallines observed in the B7 Ia supergiant HD 183143 (Chentsovet al. 2003), but are typical of any early- or mid-B super-giant. Secondly, the wind of the system is best seen in thestrong Balmer lines and He I emission lines. The Balmerlines do not show a P Cygni absorption component, but theHe I lines have P Cygni absorption that shows orbitally-modulated variability where the absorption strengthens atcertain orbital epochs (L13). Thirdly, there are many lines ofsingly-ionised metals, such as Fe II, that show double-peakedemission profiles. These lines were shown by L13 to be con-stant in radial velocity and are thought to originate froma circumbinary disc. In reality, some of the double-peakedemission lines and Balmer lines are likely formed in a combi-nation of the circumbinary disc and stellar wind. The fourthand final type of lines are the interstellar absorption lines.These lines are very complicated, often showing several ab-sorption components due to the extreme extinction of MWC314 (AV = 5.7; Miroshnichenko 1996).
We measured radial velocities through Gaussian fits ofthe same absorption lines as measured by L13 to refine thespectroscopic orbit of MWC 314. The lines used were dis-cussed in Section 2.1, and the new radial velocities are pre-sented in Table A3. We estimate the errors on most of thedata points to be on the order of ±2 km s−1, and a littlebetter (±1 km s−1) for the HERMES spectra. The data areshown in Figure 1 with our orbital elements presented inTable 1. The data span the calendar years 2001–2013, so wederived the orbital period through a time-series analysis ofthese new radial velocities combined with the velocities re-ported by both Muratorio et al. (2008) and L13. We confirmthe orbital period, although we adopt a more conservativeerror than reported by L13. Note that L13 set phase zeroat inferior conjunction of the visible star and also measureω from this epoch, instead of the standard spectroscopicmethod of setting ω equal to the angle between the ascend-ing node and periastron. The values of T and ω given inTable 1 for the L13 solution are referenced to periastron inthe standard way. The errors reported by L13 are generallysmaller than ours, however, the PHOEBE code they useddoes not directly estimate the errors of the parameters, sowe suspect that these are underestimated. We show orbitalparameters in Table 1 for L13’s fit, our fit to their data show-ing more realistic errors, an independent fit to only our newdata, and a combined fit to all data available from Murato-rio et al. (2008), L13, and our new data. All the solutionsare comparable, and we adopt the combined fit for the re-mainder of this analysis.
The orbit is well-behaved with a moderate eccentricity(e = 0.29). The measured value of ω is such that the primaryis in front of the secondary at phase 0.098, and the secondaryis in front of the primary at phase 0.760. We find that themass function, f(M) is somewhat large, with a value of 4.0±0.3M⊙.
0.0 0.5 1.0ORBITAL PHASE
-50
0
50
100
RA
DIA
L V
ELO
CIT
Y (
km s
-1)
Figure 1. The revised single-lined spectroscopic orbit with datasources marked. Phase 0 indicates the periastron passage. Newdata are shown as solid points, the open circles are from L13, andthe open diamonds are from Muratorio et al. (2008). The blackline represents the combined fit of all data, while the blue dash-dotted line is the fit from only our measurements, and the reddashed line is the solution from L13.
4 THE PHOTOMETRIC VARIATIONS
In Figure 2, we show the V−band photometry from theAAVSOnet telescope (open circles) and the MOST satellite(solid points) phased to the periastron and orbital periodfound with the spectroscopic orbit. We removed the pulsa-tional signature from the MOST data for this plot (see Sec-tion 4.2). We performed time-series analysis of the ground-based data and found that the period (P = 60.5 ± 2.0) wederive from a Lomb-Scargle periodogram (Scargle 1982) wasconsistent with that of the spectroscopy, so we adopt thespectroscopic period due to the longer duration of the spec-troscopic observations and smaller error in the period de-termination. The larger scatter in Figure 2 results from the1–2% measurement errors inherent to the observations, thepulsational variations still present in the AAVSO data, andfrom possible long-term variability of the system (e.g. L13).We note that the light curve resembles the variations pre-sented by L13, who used PHOEBE to model the variationsas tidally induced variability with partial eclipses.
4.1 Ellipsoidal Variations
The photometric variability is likely induced by the star be-ing distorted gravitationally by the companion. This kind ofvariability has been known and calculated for many years(e.g. Beech 1985) and is referred to as ellipsoidal variability.In recent years, the modeling of eclipsing binaries has beengreatly enhanced by the code PHOEBE (PHysics Of Eclips-ing BinariEs; Prsa & Zwitter 2005). This code gives us thefreedom to treat this system in a variety of different ways,which we explored to examine the photometric variability.The different models we tested are tabulated in Table 2.
We began fitting the system through a recreation ofthe model of L13. We used our newly derived radial ve-locity orbit in Section 3 to set T , P , e, and ω, leaving uswith masses, radii, temperatures, and the orbital inclina-tion as free parameters. The first model (Model #1 in Ta-
c© 2015 RAS, MNRAS 000, 1–15

6 N. D. Richardson et al.
Table 1. Orbital Elements
Element units L13 Our Fit to L13 New data Combined analysis
P days 60.799977 ± 0.000014 60.799977 (fixed) 60.729 ± 0.028 60.753± 0.003
e 0.235± 0.003 0.28 ± 0.02 0.32± 0.03 0.29± 0.01γ km s−1 28.4± 0.2 27.7± 1.0 35.9± 1.8 31.2± 0.8K1 km s−1 85.6 90.3± 2.0 89.6± 2.4 90.3± 1.2ω 199± 1 206.4 ± 4.0 195.1± 6.3 208.6± 0.8T HJD 2454951.80 ± 0.56 2454949.75 ± 0.60 2456467.15 ± 1.02 2455618.88 ± 0.13f(M) M⊙ 3.63 4.1± 0.29 3.9± 0.3 4.0± 0.3a1 sin i AU 0.465 0.484 ± 0.011 0.475± 0.014 0.479 ± 0.010Nobservations 16 16 20 43r.m.s. km s−1 . . . 3.70 7.20 6.98
0.0 0.5 1.0ORBITAL PHASE
-0.50
-0.55
-0.60
-0.65
∆ V
(m
ag)
Typical Error
Model 1Model 2Model 3Model 4
Figure 2. V−band photometry of MWC 314 as a function of phase. The large open points represent our ground-based data. The solidpoints are orbital means from MOST with the pulsational behaviour subtracted off (see Section 4.2). Our reductions could not removethe instrumental artifacts that were at the end of the observing run at phases 0.7–0.85, so those points are omitted. As the instrumentaleffects could not be eliminated, we did not use these points in our ellipsoidal fit of the photometry. We overplot our best models of thelight curve. The dashed lines represent our best understanding of the ellipsoidal variability for the system (Section 4.1), and correspondto models in Table 2.
Table 2. PHOEBE Parameters
Element units Model #1 Model #2 Model #3 Model#4
Mp M⊙ 39.7 39.7 61.1 4.1
Rp R⊙ 81.5 81.5 94.1 35.0Teff,p K 18,000 18,000 18,000 18,000Ms M⊙ 26.2 26.2 40.3 11.3Rs R⊙ 20.6 20.6 23.7 16.4Teff,s K 6,227 12,000 30,000 25,000i 73 73 60 60
c© 2015 RAS, MNRAS 000, 1–15
The Massive, Interacting Binary MWC 314 7
ble 2) shows ellipsoidal variability and a partial secondaryeclipse. This model, along with our other PHOEBE models,suffers from inadequate flux at phases 0.2–0.5, and is over-estimated from phases 0.7–0.8. However, the variability nearperiastron is of a correct amplitude and shape to reproducethe light curve at those phases.
We then adjusted the effective temperature of the sec-ondary (Model #2) to have a hotter secondary star. Thisdemonstrates that the primary is the main source of vari-ation in these models, but the primary eclipse depth is in-creased drastically. With a small change of the inclination(Model #3), we then found that the eclipses are no longerseen, which is supported by the light curve shape, even ifthe models do not fully represent the photometry. Further,in Model #3, we increased the temperature to that of an Odwarf in order to have a more realistic companion star.
Lastly, we attempted a low mass solution (Model #4)in which the primary has lost mass via Roche lobe overflowonto the secondary (see Section 6.1). These parameters in-clude a primary with a smaller radius than Models #1–3and a secondary mass almost three times larger than theprimary. With a moderate inclination of 60, we obtain amodel light curve with the same basic shape and amplitude.This shows that the mass ratio derived by L13 can only beconsidered one possible solution, as the light curve can bereproduced with extraordinary changes in the masses andtemperatures, and is not dependent on which star is themore massive component.
For these models, we assumed a semi-detached systemwhere the primary fills its Roche lobe at periastron, as anyother configuration provided worse fits of the data. In sucha system, we see less flux as we look down the orbital axis(phases 0.76 and 0.10) and observe the strongest flux atquadrature phases (0.96 and 0.37) as we view the small andlarge profiles, respectively, of the distorted star. Tides inthe system attain a maximum near periastron, and yielda more extreme maximum and minimum flux then, as ob-served. Some problems with the PHOEBE results are likelyrelated to the eccentricity of the system. With eccentric bi-naries, we have differing values of the separation and Rochepotentials as a function of phase. This can lead to changesin the state of the binary from detached to semi-detachedover the course of an orbit. The physics involved in such asituation is much more complex and detailed models of suchbinaries are not yet developed. However, the timing of theprimary eclipse is well sampled with MOST , and we find nostrong evidence of an eclipse event, at least not to the extentof the model presented by L13.
4.2 Pulsational Behavior Discovered with MOST
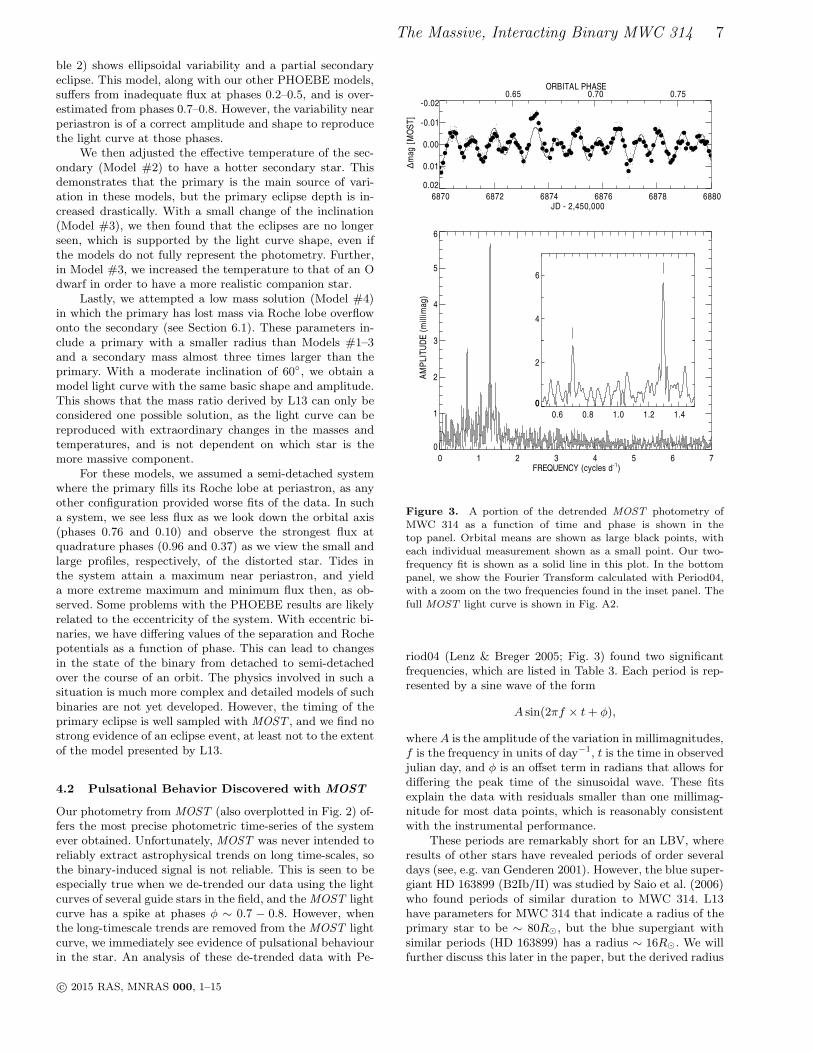
Our photometry from MOST (also overplotted in Fig. 2) of-fers the most precise photometric time-series of the systemever obtained. Unfortunately, MOST was never intended toreliably extract astrophysical trends on long time-scales, sothe binary-induced signal is not reliable. This is seen to beespecially true when we de-trended our data using the lightcurves of several guide stars in the field, and the MOST lightcurve has a spike at phases φ ∼ 0.7 − 0.8. However, whenthe long-timescale trends are removed from the MOST lightcurve, we immediately see evidence of pulsational behaviourin the star. An analysis of these de-trended data with Pe-
6870 6872 6874 6876 6878 6880JD - 2,450,000
0.02
0.01
0.00
-0.01
-0.02
∆mag
[M
OS
T]
0.65 0.70 0.75ORBITAL PHASE
0 1 2 3 4 5 6 7FREQUENCY (cycles d-1)
0
1
2
3
4
5
6
AM
PLIT
UD
E (
mill
imag
)0.6 0.8 1.0 1.2 1.4
0
2
4
6
0
Figure 3. A portion of the detrended MOST photometry ofMWC 314 as a function of time and phase is shown in thetop panel. Orbital means are shown as large black points, witheach individual measurement shown as a small point. Our two-frequency fit is shown as a solid line in this plot. In the bottompanel, we show the Fourier Transform calculated with Period04,with a zoom on the two frequencies found in the inset panel. Thefull MOST light curve is shown in Fig. A2.
riod04 (Lenz & Breger 2005; Fig. 3) found two significantfrequencies, which are listed in Table 3. Each period is rep-resented by a sine wave of the form
A sin(2πf × t+ φ),
where A is the amplitude of the variation in millimagnitudes,f is the frequency in units of day−1, t is the time in observedjulian day, and φ is an offset term in radians that allows fordiffering the peak time of the sinusoidal wave. These fitsexplain the data with residuals smaller than one millimag-nitude for most data points, which is reasonably consistentwith the instrumental performance.
These periods are remarkably short for an LBV, whereresults of other stars have revealed periods of order severaldays (see, e.g. van Genderen 2001). However, the blue super-giant HD 163899 (B2Ib/II) was studied by Saio et al. (2006)who found periods of similar duration to MWC 314. L13have parameters for MWC 314 that indicate a radius of theprimary star to be ∼ 80R⊙, but the blue supergiant withsimilar periods (HD 163899) has a radius ∼ 16R⊙. We willfurther discuss this later in the paper, but the derived radius
c© 2015 RAS, MNRAS 000, 1–15
8 N. D. Richardson et al.
Table 3. Frequencies found with MOST .
Frequency A (mmag) f (cycles d−1) φ (radians) P (d)
1 5.59±0.22 1.2964±0.0004 0.3847±0.0063 0.7713±0.00032 2.61±0.22 0.7032±0.0008 0.6940±0.0135 1.4221±0.0016
by L13 is likely much too large to support such short-periodpulsations in MWC 314.
5 INTERFEROMETRIC RESULTS
The distance of MWC 314 was derived by Miroshnichenkoet al. (1998) to be 3.0±0.2 kpc using a radial velocity of+55 km s−1 and the kinematical model of Galactic rotationby Dubath et al. (1988). We can now adjust this distanceby using the γ velocity of the single-lined orbit we derivedin Section 3 (γ = 31 ± 1 km s−1). From this derived veloc-ity, we find a closer distance to the system of only 2.4±0.1kpc. We then derive a luminosity from the expected V mag-nitude of 9.9, the effective temperature of 18,000 K (e.g.Miroshnichenko et al. 1998, L13), a reddening of AV = 5.7mag (Miroshnichenko 1996), and a bolometric correction of−1.7. The luminosity then becomes log(L/L⊙) = 5.7, withMV = −7.8 and MBOL = −9.5, neglecting any effect ofthe companion and circumstellar and circumbinary mate-rial. This result agrees with that of L13, and indicates thatMWC 314 is a near twin of the early B-type hypergiant andprototypical LBV, P Cygni, especially with a derived radiusof 73R⊙. We caution that if the absorption lines used forthe orbit form in the outflow, then the γ velocity could beblue-shifted in our line of sight, and this would change thisdistance estimate.
Our consideration of the CHARA Array results beginswith estimates for the angular size of the visible star andbinary orbit. We estimated stellar angular diameter by com-paring the observed flux distribution fλ with that for amodel photosphere Fλ,
fλFλ
=
(
R⋆
d
)2
10−0.4Aλ =1
4θ2LD 10−0.4Aλ
where θLD is the limb darkening angular diameter and Aλ
is the wavelength dependent extinction. We made this com-parison in the ultraviolet and optical parts of the spectrumwhere the observed flux is probably dominated by the con-tribution from the visible star. We followed the example ofMiroshnichenko (1996) who used UV spectra from the Inter-national Ultraviolet Explorer archive and optical magnitudesto set the observed flux estimates. We assumed a flux modelfrom the solar abundance grid of R. Kurucz for atmosphericparameters appropriate for the visible star, Teff = 18000 Kand log g = 2.5. We used the extinction law from Fitzpatrick(1999) to set the extinction law Aλ as a function of the red-dening E(B − V ) and ratio of total-to-selective extinctionR. Then a fit of the observed fluxes with the relation abovewas made with parameter values of E(B−V ) = 1.81± 0.02mag, R = 3.05± 0.05, and θLD = 0.24± 0.02 mas. The firsttwo parameters agree within uncertainties with the results ofMiroshnichenko (1996). In the following analysis we will as-sume a uniform disc model for the visible star with an equiv-alent angular size of θUD = 0.23 mas, very slightly smaller
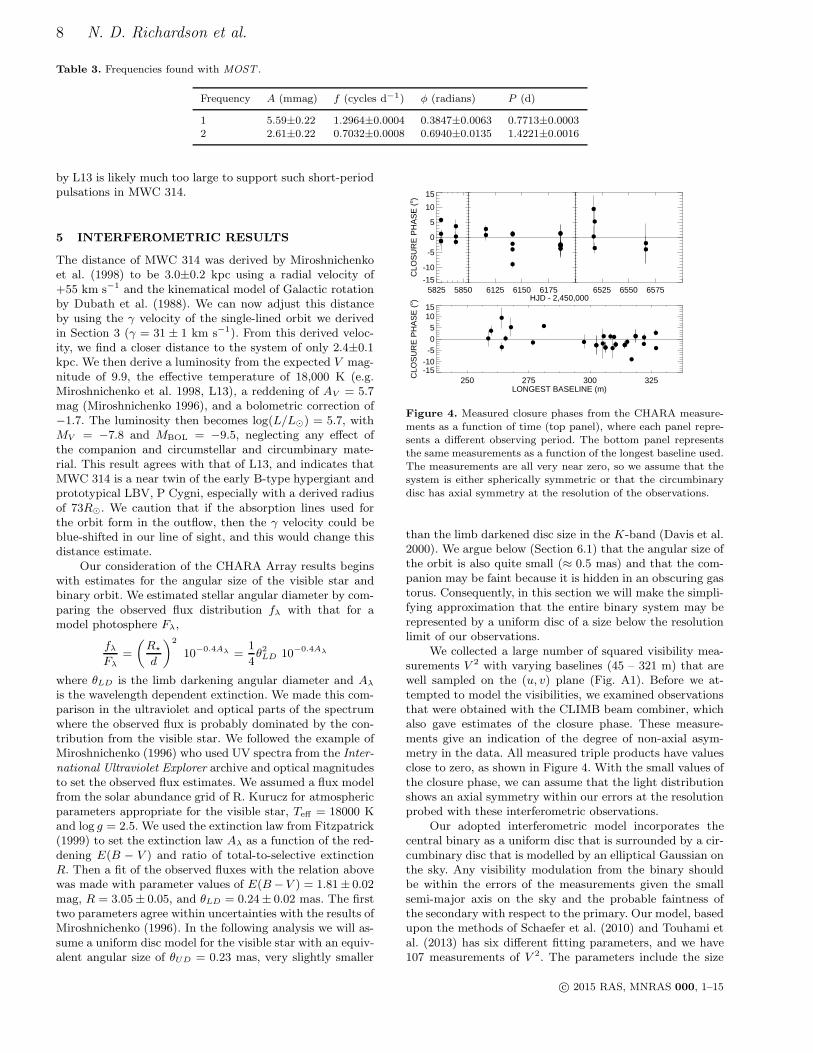
5825 5850
-15
-10
-5
0
5
10
15
CLO
SU
RE
PH
AS
E (
o )
6125 6150 6175
6525 6550 6575
HJD - 2,450,000
250 275 300 325LONGEST BASELINE (m)
-15-10
-505
1015
CLO
SU
RE
PH
AS
E (
o )Figure 4. Measured closure phases from the CHARA measure-ments as a function of time (top panel), where each panel repre-sents a different observing period. The bottom panel representsthe same measurements as a function of the longest baseline used.The measurements are all very near zero, so we assume that thesystem is either spherically symmetric or that the circumbinary
disc has axial symmetry at the resolution of the observations.
than the limb darkened disc size in the K-band (Davis et al.2000). We argue below (Section 6.1) that the angular size ofthe orbit is also quite small (≈ 0.5 mas) and that the com-panion may be faint because it is hidden in an obscuring gastorus. Consequently, in this section we will make the simpli-fying approximation that the entire binary system may berepresented by a uniform disc of a size below the resolutionlimit of our observations.
We collected a large number of squared visibility mea-surements V 2 with varying baselines (45 – 321 m) that arewell sampled on the (u, v) plane (Fig. A1). Before we at-tempted to model the visibilities, we examined observationsthat were obtained with the CLIMB beam combiner, whichalso gave estimates of the closure phase. These measure-ments give an indication of the degree of non-axial asym-metry in the data. All measured triple products have valuesclose to zero, as shown in Figure 4. With the small values ofthe closure phase, we can assume that the light distributionshows an axial symmetry within our errors at the resolutionprobed with these interferometric observations.
Our adopted interferometric model incorporates thecentral binary as a uniform disc that is surrounded by a cir-cumbinary disc that is modelled by an elliptical Gaussian onthe sky. Any visibility modulation from the binary shouldbe within the errors of the measurements given the smallsemi-major axis on the sky and the probable faintness ofthe secondary with respect to the primary. Our model, basedupon the methods of Schaefer et al. (2010) and Touhami etal. (2013) has six different fitting parameters, and we have107 measurements of V 2. The parameters include the size
c© 2015 RAS, MNRAS 000, 1–15
The Massive, Interacting Binary MWC 314 9
of the central source modeled as a uniform disc (UD), theflux from the central source (UD Flux), the flux from thecircumbinary disc (1 – UD Flux), the full width at half max-imum (FWHM) of the major axis, the FWHM of the minoraxis, and the position angle of the major axis of the cir-cumbinary disc on the sky. From the measurement of themajor and minor axes, we can compute a disc normal in-clination angle from the thin disc approximation. We tabu-late the results of various fits in Table 4. We also note thatthe additional source of error from the correction from theemission line contamination on the interferometry loweredthe reduced χ2 of these models due to the slightly largermeasurement errors in the data.
Model #0 in Table 4 is for a spherically symmetric out-flow. The derived uniform disc diameter (UD) for the star ishighly unconstrained, but the resulting χ2 indicates that themodel is on the right track. We explored alternate geome-tries with an elongated wind or circumbinary disc structure.Model #1 allows all parameters to vary and we derive anearly edge-on disc with a disc normal inclination that issomewhat larger (but equal within uncertainties) than thethe orbital inclination derived from the light curve in Section4.1.
The next model (# 2) fixed the size of the central sourceto be that of the photospheric size of the primary star asderived from the spectral energy distribution. This is a rea-sonable choice if we assume little flux emergent from thesecondary star. We note that χ2
red is statistically indistin-guishable from the models #0 and #1. Lastly, we exploreda case where we fixed the central source size, but fit the shellas spherically symmetric (Model #3).
It is also possible that we are not actually resolvinga circumbinary shell or disk, but rather the binary itself.We explored the possibility that we were actually resolv-ing the binary by an examination of the densest observationset obtained on 2012 August 01 (HJD 2,456,141), where weobtained 5 measures of the closure phase, and 15 measuresof V 2 with CLIMB. We established a grid-based χ2 mini-mization where we calculate a χ2 statistic for a large grid ofseparations in right ascension, declination, and a flux ratiobetween the two stars. On this night, our best fit was with aseparation of 0.697 mas, a position angle of 263, with a fluxratio between the two stars of 0.997. The reduced χ2 statis-tic was 22.3, meaning our model did not reproduce well theobservations. Similar results were seen for the night of 2012September 16. These “fits” actually provide a χ2 statisticmuch worse than that of a circumbinary shell or disk. Wefurther note that a flux ratio near unity shows that the re-solved companion contributes similar levels of flux as theprimary, and that the putative separation is on the sameorder as the resolving limit of the CHARA Array in the K′
band. This flux would likely imply that the orbit would beeasily seen to be a double-lined binary, making this resultmore unlikely.
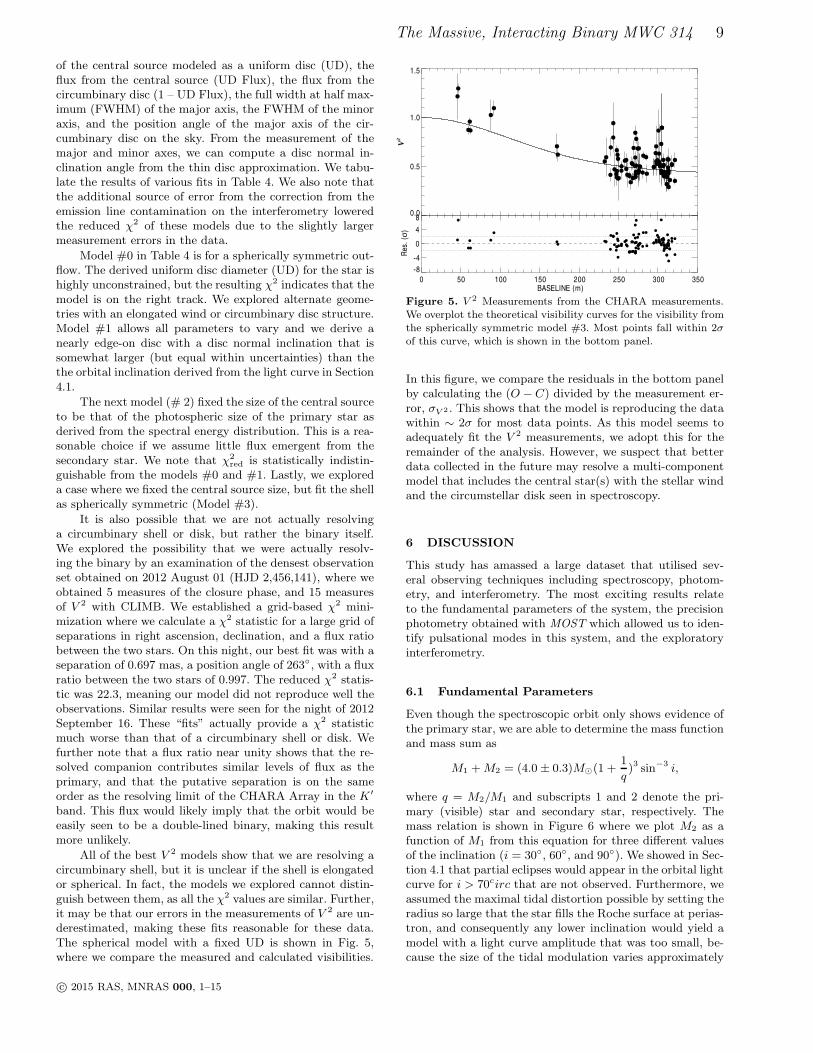
All of the best V 2 models show that we are resolving acircumbinary shell, but it is unclear if the shell is elongatedor spherical. In fact, the models we explored cannot distin-guish between them, as all the χ2 values are similar. Further,it may be that our errors in the measurements of V 2 are un-derestimated, making these fits reasonable for these data.The spherical model with a fixed UD is shown in Fig. 5,where we compare the measured and calculated visibilities.
0.0
0.5
1.0
1.5
V2
0 50 100 150 200 250 300 350BASELINE (m)
-8
-4
0
4
8
Res
. (σ
)
Figure 5. V 2 Measurements from the CHARA measurements.We overplot the theoretical visibility curves for the visibility fromthe spherically symmetric model #3. Most points fall within 2σof this curve, which is shown in the bottom panel.
In this figure, we compare the residuals in the bottom panelby calculating the (O −C) divided by the measurement er-ror, σV 2 . This shows that the model is reproducing the datawithin ∼ 2σ for most data points. As this model seems toadequately fit the V 2 measurements, we adopt this for theremainder of the analysis. However, we suspect that betterdata collected in the future may resolve a multi-componentmodel that includes the central star(s) with the stellar windand the circumstellar disk seen in spectroscopy.
6 DISCUSSION
This study has amassed a large dataset that utilised sev-eral observing techniques including spectroscopy, photom-etry, and interferometry. The most exciting results relateto the fundamental parameters of the system, the precisionphotometry obtained with MOST which allowed us to iden-tify pulsational modes in this system, and the exploratoryinterferometry.
6.1 Fundamental Parameters
Even though the spectroscopic orbit only shows evidence ofthe primary star, we are able to determine the mass functionand mass sum as
M1 +M2 = (4.0± 0.3)M⊙(1 +1
q)3 sin−3 i,
where q = M2/M1 and subscripts 1 and 2 denote the pri-mary (visible) star and secondary star, respectively. Themass relation is shown in Figure 6 where we plot M2 as afunction of M1 from this equation for three different valuesof the inclination (i = 30, 60, and 90). We showed in Sec-tion 4.1 that partial eclipses would appear in the orbital lightcurve for i > 70circ that are not observed. Furthermore, weassumed the maximal tidal distortion possible by setting theradius so large that the star fills the Roche surface at perias-tron, and consequently any lower inclination would yield amodel with a light curve amplitude that was too small, be-cause the size of the tidal modulation varies approximately
c© 2015 RAS, MNRAS 000, 1–15

10 N. D. Richardson et al.
Table 4. Derived Interferometry Model Parameters. If no error is given, the parameter was held constant.
Model UD (mas) UD Flux Major FWHM (mas) Minor FWHM (mas) Position Angle () i () χ2red
0 0.08 ± 0.88 0.67± 0.03 1.33± 0.24 1.33± 0.24 . . . . . . 4.24
1 0.49 ± 0.14 0.76± 0.05 2.69± 0.75 0.45± 0.51 141.9 ± 4.2 80.4+9.6−20.0 3.89
2 0.23 0.70± 0.03 1.63± 0.49 1.23± 0.22 114.7 ± 28.0 61.5 ± 20.0 4.153 0.23 0.69± 0.02 1.37± 0.27 1.37± 0.27 . . . . . . 4.25
0 10 20 30 40 50M1 (MSUN)
0
10
20
30
40
50
M2 (
MSU
N)
i=30o
i=60o
i=90o
q=2.35 q=1.32
Figure 6. Masses as a function of inclination and mass ratio.The solid black curve represents the mass function at i = 60.The dashed lines represent i = 30 (top) and i = 90 (bottom).L13 reported the values shown by a plus sign. We overplot linesfor several assumed mass ratios (from Table 5), and filled circles
show the corresponding masses for i = 60.
as sin i. Consequently, we suggest that the orbital inclinationprobably falls within the range from i = 50 to i = 75.
Sepinsky et al. (2007a, 2009) have investigated howmass transfer eccentric orbit binaries can alter the orbitalelements. They show that momentum transfer caused byRLOF can have a large influence on the orbit. In particular,Sepinsky et al. (2007a) show that if the mass ratio reversalhas occurred and the mass transfer rate is high, then theeccentricity can increase with time. Their Figure 3 showsthat if M1/M2 < 0.76 (M1 is the mass donor = the primaryin MWC 314), then continued RLOF will yield a positivetime derivative of eccentricity. Thus, if we accept this re-sult, then the fact that we find e = 0.29 in MWC 314 mustmean that mass transfer has proceeded beyond mass ratioreversal and that the current mass ratio obeys this limit, sothat q ≥ 1/0.76 = 1.32. We show this limit in a solid line onFig. 6, so that any mass solution must fall to the left of thisline diagram.
We argued in Section 4.1 that the tidal modulationof the light curve is best fit if we assume that the visiblestar fills its Roche lobe at periastron. Because the tides arestrongest at periastron, we might also assume that the spinof the star becomes synchronized with the instantaneous or-bital rate at that instant. We may use these assumptionsto explore the consequences of the Roche geometry for thebinary mass ratio. We can estimate the mass ratio by com-paring the projected rotational velocity, v sin i, to the orbitalsemi amplitude, K1 in the manner of Gies & Bolton (1986)
with the expression
v sin i
K1
= ρΩ
(
1 +1
q
)
(1− e2)1/2Φ
where q = M2/M1. This expression relates the size of thevisible star to the Roche radius Φ = Φ(q) (Eggleton 1983)through a fill-out factor ρ (= 1 for a Roche filling star),and the angular rotational rate is expressed relative to themean orbital synchronous rate through factor Ω. We esti-mate v sin i to be ∼ 50 km s−1 based upon the FWHM of theabsorption profiles seen in our high resolution spectroscopyobtained with high S/N, such as those obtained with theCTIO 1.5 m and CHIRON, consistent with the value re-ported by L13. Based upon the analysis of the light curve(Section 4.1) and the abundant evidence of mass transferand mass loss in MWC 314, we assume that the star has aradius that fills its Roche lobe at the periastron passage, sothe fill-out factor is given by
ρ = (1− e) = 0.71± 0.02.
If the stars are synchronous as the tidal forces peak at peri-astron passage, then
Ω =(1 + e)1/2
(1− e)3/2.
We evaluated the remaining term for the Roche radius Φabove using the general expressions for a star in an eccen-tric orbit from Sepinsky et al. (2007b). Then we can usethe formula above for the observed ratio (v sin i)/K1 to findthe mass ratio q = 2.36 for the case of spin synchronizationat periastron (Ω = 1.90). This mass ratio yields masses ofM1 ∼ 5.3M⊙ and M2 = 12.5M⊙ for intermediate inclina-tion of i = 60. Note that if some of the line broadening isdue to macroturbulence instead of rotational Doppler broad-ening, then the actual v sin i will be smaller than assumedand the resulting mass ratio larger than estimated above.We show the masses derived through this method for boththe limiting cases of synchronous rotation at periastron andthe eccentricity-growing limit of q = 1.32 in Table 5, alongwith an intermediate case. All of these solutions are basedupon i = 60 and are marked as solid circles in Figure 6.These slower spinning model solutions are particularly rel-evant, because Sepinsky et al. (2010) find that in some cir-cumstances mass transfer episodes at periastron can resultin gas returning back to the donor and decreasing its spin.
We can then calculate the physical radius of the primarystar R1 by multiplying the fractional Roche radius times thefill-out factor and times the semimajor axis. The derivedradii are listed in Table 5 using an assumed inclination ofi = 60 to find the semimajor axis. We determined the angu-lar diameter of the star in Section 5 from a fit of the spectralenergy distribution, and we can use the angular size to re-late the physical radius to the distance, R/R⊙ = 25.7d(kpc).
c© 2015 RAS, MNRAS 000, 1–15

The Massive, Interacting Binary MWC 314 11
Table 5. Potential Masses of the MWC 314 system†, given i =60.
Ω q M1 M2 R1 d(kpc) a(AU) a(mas)
1.90 2.36 5.3 12.5 36.2 1.41 0.79 0.561.60 1.82 8.1 14.8 43.0 1.67 0.86 0.511.26 1.32 14.5 19.1 54.6 2.12 0.97 0.46
† To change to another inclination, one can rescale bymultiplying by (sin 60/ sin i)3 and (sin 60/ sin i) for masses and
semi-major axis, respectively
Table 5 column 6 lists the distance from this relation basedupon the physical radius in column 5. Columns 7 and 8 listthe physical and angular semimajor axis of the binary, re-spectively, based upon the masses, period, and distance. Theangular semimajor axis is approximately 0.5 mas in all threespin cases given in Table 5, which suggests that the binaryis probably unresolved in the CHARA Array interferometricobservations (Section 5). The luminosity of the visible staris large for the radii given in Table 5, logL/L⊙ ≈ 5.1− 5.5,and if this is comparable to the initial luminosity of the starbefore mass transfer, then the star probably began life witha mass of ≈ 20− 30M⊙ (Saio et al. 2013).
All the results suggest that the system has gone througha mass reversal process in addition to the mass-loss fromstellar winds and eruptions that caused the large ejecta seenby Marston & McCollum (2008). Our derived mass ratiowould imply that the system is still early in the process ofmass transfer, as it has yet to reach the more extreme valuesfound in systems such as HDE 326823 (M2/M1 = 5.3) orRY Scuti (M2/M1 = 3.9), but the mass ratio is still clearlyreversed. We also note that the observation of very strongBalmer line emission tells us that the primary star still hassome hydrogen, supporting the idea that MWC 314 is notas far along in its binary interaction as the pre-(WN + O)binary, HDE 326823. If the low masses we derive are correct,then the Roche radius of the primary must be smaller thanestimated by L13, making the primary less luminous andthe distance smaller, as indicated in Table 5.
The visible star mass that we derive is surprisingly lowfor a star that has a spectrum resembling the prototypicalLBV, P Cygni. The masses derived by L13 are much closerto expectations for an LBV mass, but we caution that theirresults are based upon the mass function from the radialvelocity curve and an inclination and mass ratio estimatedfrom fits of the light curve. Recall from Section 4.2 and Fig-ure 2 that the light curve is complex and that a PHOEBEcalculation with a large mass ratio q produces a light curve(Model #4) that is qualitatively similar to those for a smallmass ratio (Models #1,2,3). Consequently, there is proba-bly a large range in adopted mass ratios and hence masses(Fig. 6) that will yield model light curves similar to theobserved photometric light curve. Our determination of themass ratio (above) was made assuming synchronous rotationand a visible star that fills its Roche lobe at periastron. L13recognised that their model implied slower than synchronousrotation for the visible star (they suggested a possible syn-chronous relation with gas forming the inner boundary ofthe circumbinary disc). However, stars that fill their Rochelobes experience strong tidal forces that drive the system to-wards synchronous rotation on a relatively short time scale,
5800 6000 6200 6400 6600WAVELENGTH (ANGSTROMS)
0.5
1.0
1.5
2.0
2.5
3.0
NO
RM
ALI
ZE
D F
LUX
P Cyg
HDE 326823
Figure 8. A comparison between the spectrum of MWC 314(bold, center), HDE 326823 (Richardson et al. 2011; offset forclarity), and P Cygni (Richardson et al. 2013, bottom) shows thatMWC 314 and HDE 326823 are nearly spectroscopic twins withthe exception of the stronger hydrogen emission and lack of a fewweak emission lines from MWC 314. Similarly, the comparisonwith P Cygni shows the similarity of the stellar winds of the twostars.
so the masses that we derive based upon the assumption ofsynchronous rotation are worthy of detailed consideration.
Note that we have made the assumption that the ab-sorption lines we measured form in the atmosphere of thevisible star. We suspect that the mass gainer in the systemis surrounded by a thick gas torus (see below), and it is pos-sible that the absorption lines form in this torus instead. Ifso, then the radial velocity curve would apply to the massgainer and the identities of the stars would be swapped inthe mass-mass diagram (Fig. 6). The measured “projectedrotational velocity” in this case would correspond to Keple-rian motion in the gas disc surrounding the mass gainer andnot to the rotational broadening of the mass donor star, sothe (v sin i)/K1 argument would not apply. However, spec-tral lines formed in a torus surrounding the mass gainer havebeen detected for both β Lyr (Ak et al. 2007) and RY Scuti(Grundstrom et al. 2007), and in both these cases the linesdisplay very large rotational broadening. Consequently, wesuspect that the narrow absorption lines we observe in thespectrum of MWC 314 do not form in gas torus but areassociated with the photosphere of the visible star.
6.2 Pulsational Behaviour
The MOST photometry presented us with an opportunity toexplore the pulsational properties of this unusual system. Inparticular, a pulsational analysis may provide another cluethat supports the relatively low mass of the visible star thatwe estimated above. We examined the pulsational stabilityof MWC 314 using the nonrotating stellar models and themodal analysis described by Saio et al. (2013). Saio et al.discuss how pulsations may be excited among blue super-giants in cases where the luminosity to mass ratio is large(for example, after extensive mass loss during a prior red su-pergiant phase). This is especially pertinent for MWC 314if the stellar mass has decreased significantly through mass
c© 2015 RAS, MNRAS 000, 1–15

12 N. D. Richardson et al.
Figure 7. A comparison of the observed two periods (0.77 d and 1.4 d; horizontal dashed lines) with theoretical pulsation periods for
models of a stellar mass of 5M⊙ and an effective temperature of 18000 K with hydrogen mass fractions X=0.2 (black symbols) and X=0.3(red symbols). Filled and open circles indicate excited and damped pulsation modes, respectively. The bottom and the top horizontalaxes measure stellar radius and luminosity, respectively. The longest period of each model is the fundamental mode. We find that theobserved dominant period (P=0.77d) is reproduced by an excited mode in a 5M⊙ model at a radius of 24 R⊙ (logR/R⊙ = 1.38; verticaldotted line) with X = 0.2. The second overtone of this model has a period of 1.4 d close to the observed second period, although themode is not excited. We note that the model predicts the fundamental mode with a period of 3.5 d to be excited, although no suchperiodicity is detected from our MOST light curves. On the right panel, we show how the radius and luminosity scale with mass for therange of allowed masses (Section 6.1) and hydrogen fractions that can support this pulsational mode. The open circles denote the valuesderived by the Roche geometry analysis in Section 6.1 and Table 7.
Table 6. Models having an excited 0.77 d pulsation mode (X = 0.2, Z = 0.02, Teff = 18, 000 K).
Mass (M⊙) Radius (R⊙) log(L/L⊙) Other excited period(s) Period closest to 1.40 d†
4.0 21.5 4.64 1.98, 3.47 d 1.32 d5.0 24.0 4.73 3.50 d 1.36 d
6.0 26.3 4.81 3.52 d 1.39 d7.0 28.5 4.88 3.58 d 1.43 d9.0 32.3 4.99 3.59 d 1.48 d
† Note that these periods are all second overtones, and all are damped.
transfer while maintaining the luminosity of the He-burningcore.
We began by exploring what range of mass and radiuswould yield models with an excited mode pulsational periodof 0.77 d for a stellar effective temperature of Teff = 18000 K.We found that there were no models with normal hydrogenabundances that could support the dominant pulsationalmodel. However, if the hydrogen mass fraction X was setto a value less than 0.3, then we were able to find modelswith a pulsational frequency that matched the observed one.The parameters for these solution families are illustrated inFigure 7 (right panel) that plots the stellar mass, radius, andluminosity for several trial values of X. Figure 7 also showsthe stellar parameters estimated above from the Roche ge-ometry arguments (Table 5), and we see that these indicatean overluminosity for mass relative to the smallest hydrogenfraction family of pulsation models (X = 0.10). It is possi-
ble that even lower hydrogen abundance models may excitepulsations like those observed, but it is difficult to specifythe structure of the stellar envelope for such a stripped downstar. This pulsational frequency is unlike frequencies oftenobserved in LBVs, which are both longer time-scales andnot strictly periodic (e.g., van Genderen 2001). The funda-mental 0.77 d period is also shorter in duration than thedominant periods, and smaller in amplitude than the pulsa-tional frequencies reported for 24 B supergiants reported byLefever, Puls, & Aerts (2007).
The pulsation mode identified with the 0.77 d period ofMWC 314 is a kind of strange mode associated with the He IIionization zone (log T ≈ 4.5), and the amplitude is stronglyconfined to the outermost layers with log T < 4.6. On theother hand, longer-period fundamental and first overtonemodes with periods longer than a few days are excited bythe κ-mechanism around the Fe-opacity peak at log T ≈ 5.3
c© 2015 RAS, MNRAS 000, 1–15

The Massive, Interacting Binary MWC 314 13
as occurs in other B-type variables with normal surface H-abundance. With a low hydrogen abundance of X . 0.25,the mode having a period of 0.77 d at Teff = 18000 K isexcited by the κ-mechanism in the He II ionization zone formodels with masses consistent with those from the orbitalanalysis, although the radius required for the period tendsto be smaller than that of the critical Roche Lobe as shownin Figure 7 (right panel).
In Table 6, we summarize the models with X = 0.2in which the 0.77 d period is a supported pulsational mode.These models show that there is a family of lower-mass mod-els in which this pulsational frequency is excited. The lefthand panel of Figure 7 shows an example how the periodsand the stability of the pulsation change for models withM = 5M⊙ as a function of radius at Teff = 18000 K. Themodel reproduces the 0.77 d period at logR/R⊙ = 1.38. Inaddition, the period of the second overtone of these mod-els falls in the range of 1.3 to 1.4 d, which is similar tothe observed secondary period (1.4 d), although the mode ispredicted to be damped. We note that these models predictthat the fundamental mode with a period of ≈ 3.5 d shouldbe excited, but we find no evidence of this periodicity in theMOST data (Fig. 3).
This pulsational analysis demonstrates that the kindof pulsational frequencies observed are broadly consistentwith models in which the stellar mass is relatively smalland the hydrogen abundance is low. This provides additionalevidence that the visible star is the stripped-down remnantof binary mass transfer and that it is currently the lowermass component in the binary (Table 5).
6.3 Interferometry
The only LBV with comparable interferometric data is PCygni (Richardson et al. 2013). The best models to re-produce the spherically symmetric wind of P Cyg were cre-ated either by the non-LTE code CMFGEN or a simple uni-form disc surrounded by a Gaussian halo, and show that theH−band flux emerges from a halo about 2.4 times largerthan the photosphere. In comparison, the emission from theK−band wind of MWC 314 is about 6 times larger than thephotosphere for the case of MWC 314 (Model #3 in Table4). Despite the differing wavelength of the observations forMWC 314 and P Cygni, the differences between the H− andK− bands are fairly small (a few percent in the case of theCMFGEN model of P Cygni computed by Najarro 2001).We note that optical polarimetric observations of MWC 314show some evidence of a preferred direction (Wisniewski etal. 2006), which may in fact be emerging from the circumbi-nary disc component of the flux, rather than a wind asym-metry.
The largest remaining question is why the sizes are sodifferent between P Cygni and MWC 314. The optical andnear-infrared spectra appear similar (L13, Fig. 7), so we maysuspect them to appear similar in physical size and geome-try. However, in the case of an interacting binary many ofthe existing models for hot star winds may not be good ap-proximations. We know that MWC 314 has a circumbinarydisc, and it must account for some of the flux we see with theCHARA Array. However, we had a difficult time discerningdifferent models of the visibilities, other than the extendedhalo of light surrounding the system. It’s large size compared
to P Cygni likely indicates that the CHARA Array is seeingevidence of both the wind and the disc.
The large halo observed with CHARA likely has an ori-gin in both a large circumbinary disc and a circumbinarywind, and there is evidence from spectroscopy that the bi-nary is embedded in a disc. The appearance of strong emis-sion lines throughout the optical and near-infrared spectrumof MWC 314 indicates the presence of circumstellar gas fromongoing mass loss. With the exception of the strong Balmerlines and He I emission lines, the optical emission lines tendto be weakly ionised metal lines, such as Fe II. These linesexhibit double-peaked profiles (Miroshnichenko et al. 1998)that are stationary in radial velocity (L13), indicative of anorigin in a circumbinary disc rather than in either star. Thesame double-peaked and stationary emission lines are foundin the spectrum of the spectroscopic binary HDE 326823.Richardson et al. (2011) argue that these lines form in acircumbinary disk that is fed by mass loss from the binary.The visible star in HDE 326823 is losing mass to a hiddensecondary star via Roche lobe Overflow (RLOF) and losingmass to the circumbinary disk by outflow through L2. Infact, the spectral similarities of the two stars are remark-able. In Figure 7, we show a comparison of the average lowresolution spectrum of HDE 326823 (Richardson et al. 2011)and a similar resolution spectrum of MWC 314 we obtainedat the Observatoire du Mont Megantic. With the exceptionof the stronger Hα line in MWC 314 and the absence of afew weak emission lines, the stars can be considered spectro-scopic twins. HDE 326823 is an example of a W Serpentisbinary (Tarasov 2000), where a less-massive primary starhas lost mass onto a secondary star hidden behind an opti-cally thick accretion torus (Nazarenko & Glazunova 2006).In these systems, mass exchange and systemic mass loss havedrastically altered the stellar masses.
7 SUMMARY AND FUTURE WORK
With the recent discovery that the LBV candidate HDE326823 is an interacting binary and with the work presentedhere and in L13 on MWC 314, we now have two candidateLBVs that are probably interacting binaries. Plavec (1980)and Tarasov (2000) show that the W Serpentis binaries canhave a mass-loss and transfer rate up to 10−4M⊙yr−1, whichis comparable to the mass-loss rates of LBVs. However, wecaution that mass-loss via a stellar wind and mass trans-fer are very different processes, which may have very dif-ferent mass-loss rates. The spectral appearance of double-peaked emission lines in these highly luminous stars maybe an observational way to find more interacting binaries inthe future, so that high spectral resolution time-series ob-servations will help to distinguish between LBVs and mass-transferring binaries. MWC 314 and HDE 326823 are theonly two known LBV candidates that show double-peakedemission, but others may be found in the future as massivestars identified through infrared surveys (e.g., Wachter etal. 2010; Stringfellow et al. 2012) are examined at higherspectral resolution. For example, the supergiant B[e] star(sgB[e]) Wd1-9 may show similar properties to HDE 326823and MWC 314 (Clark et al. 2013).
In summary, we found the following properties relatedto the interacting binary MWC 314.
c© 2015 RAS, MNRAS 000, 1–15

14 N. D. Richardson et al.
(i) MWC 314 is a single-lined spectroscopic binary witha period of 60.753 d and a moderate eccentricity (e = 0.29).The full orbital parameters are given in Table 1.
(ii) The system shows photometric variability modulatedwith the orbital period. We constructed light curve modelsfor the tidal deformation of the star around periastron thatwere made with the period, epoch, eccentricity, and longi-tude of periastron set from the spectroscopic results. Themodel light curves capture the main features of the orbitallight curve (timing and number of maxima), but the modelover- and under-predicts the flux just before and after vis-ible star inferior conjunction, respectively. We suspect thatthese differences are related to wind and/or disc asymme-tries that are not included in the PHOEBE model of thelight curve. Solutions similar to that of L13 can be foundwith both large and small masses.
(iii) With the MOST photometry, we discovered two pul-sational periods in the system. These periods cannot be sup-ported in a star with parameters (mass, radius) of a typicalLBV, but can easily represent a hydrogen-poor, low-massstar.
(iv) From the CHARA Array measurements of thesquared visibility of the system, we found that a halo of lightaround the binary is partially resolved. We argue that theangular size of the halo is too large for the wind alone, andit probably represents the flux of the wind and circumbinarydisc.
(v) We demonstrated how a consideration of the Rochegeometry can be used to derive the mass ratio from the ob-served ratio of projected rotational velocity to orbital semi-amplitude (independent of the system inclination). If we as-sume that the visible star spins with the same angular rateas the orbital advance at periastron, then we derive a massratio q = M2/M1 = 2.36, indicating that the donor star isnow the lower mass component in the binary. We considerother cases in which the spin rate is lower, but the massratio is limited to q > 1.32 if we accept models that pre-dict a growth in eccentricity with mass transfer (Sepinskyet al. 2007a, 2009). There is a factor of 3 – 10 discrepancybetween the masses of the L13 study and ours. This discrep-ancy could be resolved with the appropriate observations inthe future that spectroscopically determine the secondaryradial velocity curve. However, that may not be possible ifthe secondary is hidden in an accretion torus.
The system presents opportunities to study mass trans-fer with multiple observing strategies. Further efforts shouldbe employed to obtain very high signal-to-noise spectroscopywith high spectral resolution. Such spectroscopy may revealthe nature of the newly-discovered pulsational modes overshort time-scales or find a spectroscopic signature of thecompanion over orbital time-scales. The analysis of the in-terferometry may be able to be improved if a near-infraredlight curve is measured for the system, which we have be-gun trying to do with the CPAPIR instrument (Artigau etal. 2004). This would allow us to account for any changeswith orbital phase in the ratio of central binary to surround-ing flux, which would lead to an improved interpretationof the interferometric results. A combination of this withthe distance to MWC 314 with the recently launched GAIAsatellite will provide constraints on the physical size of theoutflow, allowing us to better understand mass exchange in
this binary system. All of these analyses will yield insightsinto the physics of the system which likely includes RLOFand accretion, and which could include either a circumbi-nary disc or jets. MWC 314 is an exciting target for ourunderstanding of post-main sequence binary interactions ofmassive stars.
ACKNOWLEDGEMENTS
We thank the anonymous referee for helping the analysis andpresentation of this paper. We are grateful to Fred Walter(Stony Brook University) for his scheduling of spectroscopicobservations with the CTIO 1.5 m, to the CTIO SMARTSstaff for queue observing support, and to Todd Henry (Geor-gia State University) for assistance in scheduling the ini-tial observations with the SMARTS echelle spectrograph.We are also grateful to John Monnier (Univ. of Michigan)for contributions to data reduction and analysis. We thankPierre-Luc Levesque, Bernard Malenfant, Ghislain Turcotte,and Philippe Vallee for their assistance in obtaining data atthe Observatoire du Mont Megantic. Some spectra with theCTIO 1.5 m were obtained through the NOAO Programs2009B-0153 and 2012A-0216. This work was partially basedon observations obtained at the 2.1-m Otto Struve and 2.7-m Harlan. J. Smith telescopes of the McDonald Observa-tory of the University of Texas at Austin. This work wasalso based partially on observations obtained at the Merca-tor telescopes and HERMES spectrograph of the Institutode Astrofısica de Canarias. This research was made pos-sible through the use of the AAVSO Photometric All-SkySurvey (APASS), funded by the Robert Martin Ayers Sci-ences Fund. Operational funding for the CHARA Array isprovided by the GSU College of Arts and Sciences, by theNational Science Foundation through grants AST-0606958,AST-0908253, and AST-1211129, by the W. M. Keck Foun-dation, and by the NASA Exoplanet Science Institute. Wethank the Mount Wilson Institute for providing infrastruc-ture support at Mount Wilson Observatory. The CHARAArray, operated by Georgia State University, was built withfunding provided by the National Science Foundation, Geor-gia State University, the W. M. Keck Foundation, and theDavid and Lucile Packard Foundation. This research hasmade use of the SIMBAD database, operated at CDS, Stras-bourg, France.
NDR is grateful for his CRAQ (Centre de Recherche enAstrophysique du Quebec) postdoctoral fellowship. AFJMand NSL are grateful for financial support from NSERC(Canada) and FRQNT (Quebec). DRG and GS acknowledgesupport from NSF grant AST-1411654. AM and SZ acknowl-edge support from DGAPA/PAPIIT project IN100614.TSB acknowledges support provided through NASA grantADAP12-0172.
REFERENCES
Ak, H., Chadima, P., Harmanec, P., Demircan, O., et al. 2007,A&A, 463, 233
Artigau, E., Doyon, R., Vallee, P., et al., 2004, in Society ofPhoto-Optical Instrumentation Engineers (SPIE) ConferenceSeries, Vol. 5492, Society of Photo-Optical InstrumentationEngineers (SPIE) Conference Series, 1459
c© 2015 RAS, MNRAS 000, 1–15
The Massive, Interacting Binary MWC 314 15
Baines, E. K., McAlister, H. A., ten Brummelaar, T. A., et al.
2010, AJ, 140, 167Barden, S. C. & Ingerson, T. E. 1998, in Fiber Optics in Astron-
omy III (ASP Conf. Vol. 152), ed. S. Arribas, E. Mediavilla,& F. Watson (San Francisco: ASP), 60
Beech, M. 1985, Ap&SS, 117, 69
Berger, D. H., Gies, D. R., McAlister, H. A., et al. 2006, ApJ,644, 475
Boyajian, T. S., McAlister, H. A., van Belle, G., et al. 2012, ApJ,746, 101
Cannon, A. J., 1925, Ann. Astron. Obs. Harvard Coll., 100, 17
Chentsov, E. L., Ermakov, S. V., Klochkova, V. G., et al. 2003,A&A, 397, 1035
Clark, J. S., Ritchie, B. W., & Negueruela, I. 2013, A&A, 560, 11
Clemens, D. P., Sarcia, D., Grabau, A., et al. 2007, PASP, 119,1385
Davis, J., Tango, W. J., & Booth, A. J. 2000, MNRAS, 318, 387Eggleton, P. P. 1983, ApJ, 268, 368
Fitzpatrick, E. L. 1999, PASP, 111, 63
Gies, D. R., & Bolton, C. T. 1986, ApJ, 304, 371Groh, J. H., Meynet, G., Georgy, C., & Ekstrom, S. 2013, A&A,
558, 131
Grundstrom, E. D., Gies, D. R., Hillwig, T. C., et al. 2007, ApJ,667, 505
Humphreys, R. M., & Davidson, K. 1994, PASP, 106, 1025
Kent, S. M. 1985, PASP, 97, 165Koenigsberger, G., Georgiev, L., Hillier, D. J., et al. 2010, AJ,
139, 2600
Lefever, K., Puls, J., & Aerts, C. 2015, A&A, 463, 1093
Lenz P., & Breger M. 2005, Commun. Asteroseismol., 146, 53Liermann, A., Schnurr, O., Kraus, M., Kreplin, A., Arias, M. L.,
Cidale, L. S. 2014, MNRAS, 443, 947
Lobel, A., Groh, J. H., Martayan, C., et al. 2013, A&A, 559, 16(L13)
Lobel, A., Martayan, C., Corcoran, M., Groh, J. H., & Fremat,Y. 2015, in New windows on massive stars: asteroseismology,interferometry, and spectropolarimetry, IAU Symp. 307, ed.G. Meynet, C. Georgy, J. Groh, & P. Stee (Cambridge, UK:Cambridge Univ. Press), 115
Madura, T. I., Gull, T. R., Okazaki, A. T., et al. 2013, MNRAS,436, 3820
Marston, A. P., & McCollum, B. 2008, A&A, 477, 193
Martayan, C., Lobel, A., Baade, D. et al. 2012, in AstronomicalSociety of the Pacific Conference Series, Vol. 464, Circum-stellar Dynamics at High Resolution, ed. A. C. Carciofi & T.Rivinius, (San Francisco: ASP) 293
Mason, B. D., Hartkopf, W. I., Gies, D. R., Henry, T. J., & Helsel,J. W. 2009, AJ, 137, 3358
Miroshnichenko, A. S. 1996, A&A, 312, 941
Miroshnichenko, A. S., Fremat, Y., Houziaux, L., et al. 1998,A&AS, 131, 469
Muratorio, G., Rossi, C., & Friedjung, M., 2008, A&A, 487, 637Najarro, F. 2001, in P Cygni 2000: 400 Years of Progress (ASP
Conf. Vol. 233), ed. M. de Groot & C. Sterken (San Francisco:ASP), 133
Nazarenko, V. V., & Glazunova, L. V. 2006, Astr. Rep., 50, 369
Pauls, T. A., Young, J. S., Cotton, W. D., & Monnier, J. D. 2005,PASP, 117, 1255
Plavec, M. J. 1980, in Close binary stars: Observations and in-terpretation, ed. M. J. Plavec, D. M. Popper, & R. K. Ulrich(Dordrecht: Reidel Publ.), 251
Pojmanski, G. 2002, Acta. Astron., 52, 397
Prsa, A., & Zwitter, T. 2005, ApJ, 628, 426Raskin, G., van Winckel, H., Hensberge, H., et al., 2011, A&A,
526, A69
Richardson, N. D., Gies, D. R., Henry, T. J., Fernandez-Lajus,E., & Okazaki, A. T., 2010, AJ, 139, 1534
Richardson, N. D., Gies, D. R., & Williams, S. J., 2011, AJ, 142,
201
Richardson, N. D., Schaefer, G. H., Gies, D. R., et al. 2013, ApJ,769, 118
Saio, H., Georgy, C., & Meynet, G. 2013, MNRAS, 433, 1246Saio, H., Kuschnig, R., Gautschy, A. et al. 2006, ApJ, 650, 111Sana, H., de Mink, S. E., de Koter, A., et al. 2012, Science, 337,
444Scargle, J. D. 1982, ApJ, 263, 835Schaefer, G. H., Gies, D. R., Monnier, J. D., et al. 2010, AJ, 140,
1838Schaefer, G. H., ten Brummelaar, T., Gies, D. R., et al. 2014,
Nature, 515, 234Sepinsky, J. F., Willems, B., & Kalogera, V. 2007b, ApJ, 660,
1624Sepinsky, J. F., Willems, B., Kalogera, V., & Rasio, F. A. 2007a,
ApJ, 667, 1170Sepinsky, J. F., Willems, B., Kalogera, V., & Rasio, F. A. 2009,
ApJ, 702, 1387Sepinsky, J. F., Willems, B., Kalogera, V., & Rasio, F. A. 2010,
ApJ, 724, 546Stringfellow, G. S., Gvaramadze, V. V., Beletsky, Y., & Kniazev,
A. Y. 2012, in Four Decades of Research on Massive Stars, AMeeting in Honor of Anthony F. J. Moffat (ASP Conf. Vol.465), ed. L. Drissen, C. Robert, N. St.-Louis, & A. F. J. Moffat(San Francisco: ASP), 514
Tarasov, A. E. 2000, in The Be Phenomenon in Early-Type Stars(ASP Conf. Ser. 214), ed. M. A. Smith, H. F. Henrichs, & J.Fabregat (San Francisco: ASP), 644
ten Brummelaar, T. A., McAlister, H. A., Ridgway, S. T., et al.2005, ApJ, 628, 453
ten Brummelaar, T. A., Sturmann, J., Ridgway, S. T., et al. 2013,JAI, 02, 1340004
Tokovinin, A., Fischer, D. A., Bonati, M., et al. 2013, PASP, 125,1336
Touhami, Y., Gies, D. R., Schaefer, G. H., et al. 2013, ApJ, 768,128
Tubbesing, S., Kaufer, A., Stahl, O., et al. 2002, A&A, 389, 931Vacca, W. D., Cushing, M. C., & Rayner, J. T. 2003, PASP, 115,
389van Belle, G. T., van Belle, G., Creech-Eakman, M. J., et al. 2008,
ApJS, 176, 276van Genderen, A. M., 2001, A&A, 366, 508Vanbeveren, D., & Conti, P. S., 1980, A&A, 88, 230Walker, G., Matthews, J., Kuschnig, R., et al. 2003, PASP, 115,
1023Wachter, S., Mauerhan, J. C., Van Dyk, S. D., et al. 2010, AJ,
139, 2330
Windhorst, R. A., Burstein, D., Mathis, D. F., et al. 1991, ApJ,380, 362
Wisniewski, J. W., Babler, B. L., Bjorkman, K. S., et al. 2006,PASP, 118, 820
APPENDIX A: SUPPLEMENTARY MATERIAL
This paper has been typeset from a TEX/ LATEX file preparedby the author.
c© 2015 RAS, MNRAS 000, 1–15
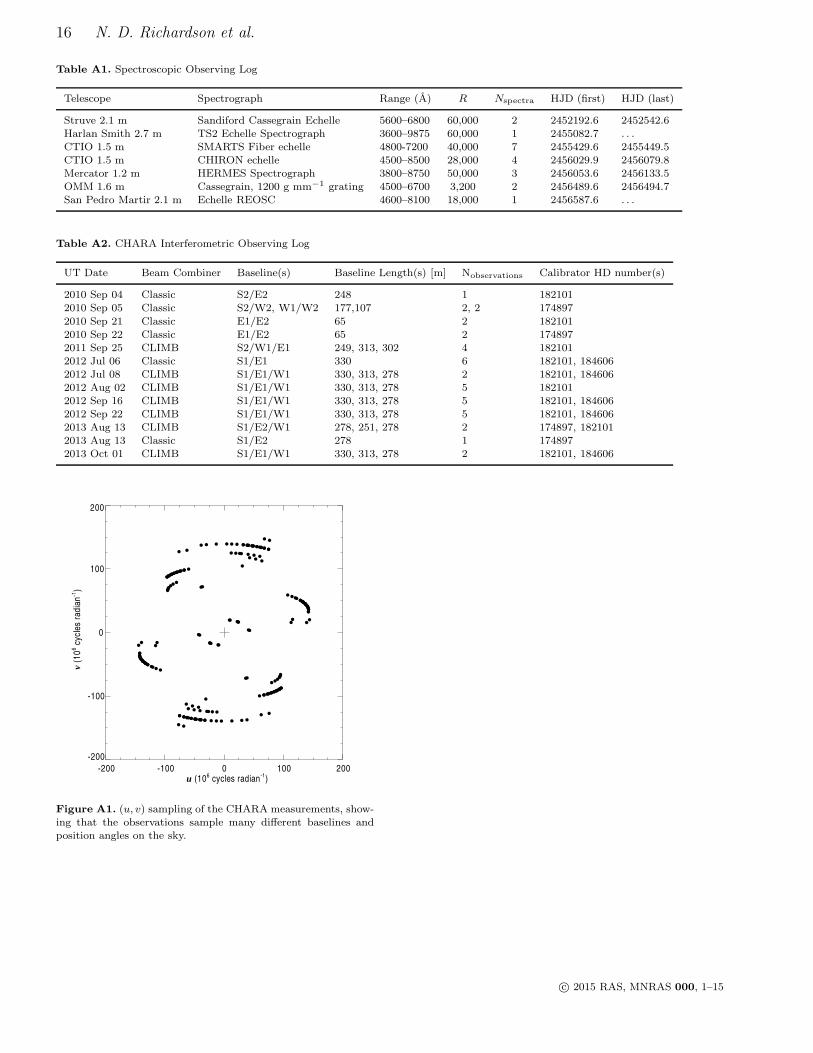
16 N. D. Richardson et al.
Table A1. Spectroscopic Observing Log
Telescope Spectrograph Range (A) R Nspectra HJD (first) HJD (last)
Struve 2.1 m Sandiford Cassegrain Echelle 5600–6800 60,000 2 2452192.6 2452542.6Harlan Smith 2.7 m TS2 Echelle Spectrograph 3600–9875 60,000 1 2455082.7 . . .CTIO 1.5 m SMARTS Fiber echelle 4800-7200 40,000 7 2455429.6 2455449.5CTIO 1.5 m CHIRON echelle 4500–8500 28,000 4 2456029.9 2456079.8Mercator 1.2 m HERMES Spectrograph 3800–8750 50,000 3 2456053.6 2456133.5OMM 1.6 m Cassegrain, 1200 g mm−1 grating 4500–6700 3,200 2 2456489.6 2456494.7San Pedro Martir 2.1 m Echelle REOSC 4600–8100 18,000 1 2456587.6 . . .
Table A2. CHARA Interferometric Observing Log
UT Date Beam Combiner Baseline(s) Baseline Length(s) [m] Nobservations Calibrator HD number(s)
2010 Sep 04 Classic S2/E2 248 1 1821012010 Sep 05 Classic S2/W2, W1/W2 177,107 2, 2 174897
2010 Sep 21 Classic E1/E2 65 2 1821012010 Sep 22 Classic E1/E2 65 2 1748972011 Sep 25 CLIMB S2/W1/E1 249, 313, 302 4 1821012012 Jul 06 Classic S1/E1 330 6 182101, 1846062012 Jul 08 CLIMB S1/E1/W1 330, 313, 278 2 182101, 1846062012 Aug 02 CLIMB S1/E1/W1 330, 313, 278 5 1821012012 Sep 16 CLIMB S1/E1/W1 330, 313, 278 5 182101, 1846062012 Sep 22 CLIMB S1/E1/W1 330, 313, 278 5 182101, 1846062013 Aug 13 CLIMB S1/E2/W1 278, 251, 278 2 174897, 1821012013 Aug 13 Classic S1/E2 278 1 1748972013 Oct 01 CLIMB S1/E1/W1 330, 313, 278 2 182101, 184606
-200 -100 0 100 200u (106 cycles radian-1)
-200
-100
0
100
200
v (1
06 c
ycle
s ra
dia
n-1
)
Figure A1. (u, v) sampling of the CHARA measurements, show-ing that the observations sample many different baselines andposition angles on the sky.
c© 2015 RAS, MNRAS 000, 1–15
The Massive, Interacting Binary MWC 314 17
Table A3. New Radial Velocity Measurements
HJD -2,450,000 Vr (km s−1) Phase Telescope
2192.6045 +70.7 0.604 McDonald Observatory2542.6229 +93.0 0.365 McDonald Observatory5082.6760 +57.9 0.174 McDonald Observatory5429.5890 −52.0 0.884 CTIO SMARTS echelle5430.6169 −64.9 0.901 CTIO SMARTS echelle5444.4983 +29.8 0.130 CTIO SMARTS echelle5445.4805 +45.6 0.146 CTIO SMARTS echelle5446.4785 +45.4 0.162 CTIO SMARTS echelle5447.4750 +63.9 0.179 CTIO SMARTS echelle5449.5198 +81.8 0.212 CTIO SMARTS echelle6029.8825 +10.1 0.765 CTIO CHIRON6053.6094 +51.3 0.156 Mercator-HERMES6054.8914 +73.6 0.177 CTIO CHIRON6078.8322 +78.7 0.571 CTIO CHIRON6079.8378 +87.9 0.587 CTIO CHIRON6103.4839 −67.5 0.977 Mercator-HERMES6133.5428 +95.0 0.471 Mercator-HERMES6489.6439 +92.8 0.333 Observatoire du Mont Megantic6494.7573 +95.8 0.417 Observatoire du Mont Megantic6587.5821 −88.5 0.945 SPM echelle
c© 2015 RAS, MNRAS 000, 1–15

18 N. D. Richardson et al.
Table A4. Ground-based Photometric Measurements
HJD -2,450,000 B σB V σV R σR I σI
5275.011 11.899 0.008 10.135 0.005 8.607 0.004 7.437 0.0045280.941 11.892 0.007 10.116 0.016 8.578 0.004 7.441 0.0085291.996 11.904 0.006 10.153 0.004 8.615 0.004 7.486 0.0045294.886 11.964 0.007 10.173 0.010 8.624 0.032 7.491 0.0095298.875 11.960 0.012 10.181 0.029 8.630 0.012 7.492 0.0245312.838 11.916 0.006 10.141 0.012 8.598 0.009 7.465 0.0055321.808 11.972 0.019 10.206 0.059 8.650 0.013 7.491 0.0115324.800 11.955 0.007 10.180 0.005 8.599 0.014 7.471 0.0105327.801 11.897 0.011 10.143 0.048 8.609 0.014 7.444 0.0075330.792 11.878 0.024 10.134 0.025 8.588 0.036 7.449 0.0185333.778 11.897 0.006 10.121 0.037 8.581 0.031 7.429 0.0045337.879 11.889 0.007 10.104 0.004 8.568 0.012 7.422 0.0045340.898 11.890 0.005 10.101 0.018 8.569 0.005 7.411 0.0105352.873 11.962 0.016 10.178 0.009 8.641 0.007 7.495 0.0045359.879 11.973 0.005 10.183 0.011 8.648 0.012 7.493 0.0045362.871 11.979 0.005 10.186 0.022 8.650 0.010 7.505 0.0145365.869 11.966 0.017 10.203 0.004 8.647 0.024 7.509 0.0105368.826 11.975 0.005 10.183 0.025 8.656 0.004 7.505 0.0145382.796 12.018 0.015 10.222 0.015 8.666 0.027 7.520 0.0165455.716 11.898 0.019 10.132 0.009 8.607 0.004 7.455 0.0195468.691 11.922 0.029 10.157 0.008 8.610 0.021 7.484 0.0105471.712 11.897 0.012 10.140 0.004 8.587 0.022 7.472 0.0045476.705 11.942 0.007 10.161 0.008 8.633 0.019 7.490 0.0155479.685 11.967 0.031 10.197 0.017 8.644 0.004 7.513 0.0095498.622 11.905 0.005 10.139 0.005 8.601 0.004 7.457 0.0085506.596 11.943 0.020 10.168 0.010 8.626 0.004 7.489 0.0045511.621 11.915 0.005 10.120 0.032 8.587 0.022 7.451 0.010
5604.032 11.971 0.006 10.211 0.031 8.649 0.008 7.514 0.0125610.016 11.991 0.011 10.213 0.012 8.695 0.045 7.533 0.0635621.982 11.974 0.009 10.178 0.004 8.636 0.011 7.492 0.0115624.975 11.979 0.023 10.205 0.037 8.623 0.030 7.496 0.0465631.956 11.916 0.008 10.137 0.044 8.598 0.043 7.439 0.0225634.948 11.891 0.021 10.106 0.022 8.564 0.016 7.431 0.0165637.940 11.900 0.008 10.113 0.015 8.597 0.005 7.421 0.0475644.921 11.944 0.006 10.155 0.013 8.600 0.004 7.474 0.0045648.911 11.945 0.021 10.160 0.033 8.589 0.016 7.475 0.0065653.897 11.920 0.006 10.157 0.005 8.617 0.005 7.477 0.0215663.871 11.987 0.007 10.183 0.016 8.644 0.016 7.489 0.0235667.861 11.996 0.007 10.204 0.006 8.672 0.031 7.528 0.0095671.850 11.976 0.007 10.185 0.029 8.664 0.031 7.524 0.0415679.829 11.916 0.009 10.138 0.005 8.604 0.019 7.493 0.0195685.812 11.978 0.023 10.197 0.028 8.634 0.051 7.509 0.0105688.931 11.948 0.010 10.155 0.007 8.610 0.004 7.469 0.0045694.915 11.927 0.013 10.137 0.004 8.609 0.017 7.457 0.0195697.781 11.872 0.008 10.108 0.005 8.551 0.010 7.452 0.0045712.845 11.885 0.006 10.113 0.009 8.584 0.012 7.446 0.0085721.891 11.988 0.043 10.190 0.022 8.646 0.010 7.516 0.0065725.822 11.996 0.031 10.226 0.026 8.665 0.020 7.519 0.0105728.857 11.977 0.016 10.199 0.023 8.665 0.027 7.531 0.0055735.852 11.921 0.013 10.136 0.014 8.609 0.004 7.483 0.0065738.824 11.958 0.027 10.173 0.005 8.634 0.015 7.478 0.0175741.951 11.945 0.022 10.173 0.008 8.607 0.007 7.491 0.0165831.698 11.934 0.006 10.155 0.014 8.620 0.019 7.494 0.0045835.692 11.944 0.008 10.165 0.031 8.616 0.004 7.518 0.0285844.635 11.980 0.006 10.193 0.013 8.653 0.015 7.522 0.0065850.630 11.962 0.045 10.197 0.008 8.650 0.005 7.524 0.0045853.668 11.948 0.006 10.167 0.016 8.628 0.008 7.502 0.0045858.684 11.897 0.008 10.127 0.009 8.585 0.004 7.477 0.0045863.601 11.929 0.006 10.139 0.010 8.607 0.004 7.482 0.0075867.600 12.005 0.007 10.202 0.005 8.661 0.027 7.520 0.0075875.584 11.893 0.018 10.135 0.005 8.605 0.021 7.466 0.0045883.601 11.882 0.006 10.117 0.005 8.567 0.005 7.452 0.0096002.003 11.901 0.006 10.126 0.005 8.597 0.005 7.436 0.0046035.987 11.979 0.023 10.180 0.020 8.645 0.004 7.503 0.024
c© 2015 RAS, MNRAS 000, 1–15
The Massive, Interacting Binary MWC 314 19
Table A4 – continued Photometric Measurements
JD - 2,450,000 B σB V σV R σR I σI
6039.979 11.945 0.006 10.155 0.005 8.624 0.008 7.486 0.0096042.906 11.934 0.006 10.136 0.009 8.609 0.011 7.463 0.0086045.979 11.947 0.012 10.158 0.005 8.628 0.005 7.480 0.0046048.878 11.989 0.016 10.211 0.015 8.651 0.039 7.514 0.0386052.941 11.953 0.015 10.174 0.005 8.633 0.004 7.499 0.0176067.970 11.899 0.011 10.118 0.006 8.588 0.010 7.457 0.0336070.836 11.866 0.017 10.090 0.006 8.566 0.018 7.427 0.0056073.836 11.919 0.008 10.138 0.038 8.609 0.009 7.449 0.0196076.864 11.898 0.019 10.120 0.017 8.560 0.036 7.442 0.0276086.868 11.942 0.007 10.155 0.018 8.640 0.027 7.484 0.0056089.838 11.959 0.017 10.180 0.032 8.652 0.017 7.481 0.0116092.845 11.987 0.008 10.180 0.005 8.650 0.005 7.507 0.0056097.826 11.982 0.016 10.193 0.005 8.655 0.005 7.503 0.0056104.847 11.937 0.009 10.123 0.008 8.596 0.004 7.460 0.0196190.733 11.933 0.030 10.158 0.006 8.627 0.004 7.489 0.0126193.640 11.966 0.022 10.166 0.004 8.630 0.011 7.489 0.0136202.693 11.975 0.012 10.176 0.005 8.660 0.022 7.526 0.0046205.610 11.964 0.009 10.169 0.011 8.646 0.004 7.515 0.008
Table A5. V 2 Measurements from CHARA
HJD - 2,450,000 Baseline u v V 2 σV 2
(d) (m) (106 cycles radian−1) (106 cycles radian−1)
5442.6938 232.508 65.653 223.046 0.552 0.0435443.7053 171.935 -77.714 153.369 0.706 0.1305443.7152 173.105 -82.696 152.075 0.622 0.0795443.7943 92.0942 91.829 6.9727 1.096 0.0855443.8059 88.1392 87.721 8.5707 1.026 0.1655459.7630 46.8597 -21.801 -41.479 1.297 0.0595459.7695 45.9541 -19.270 -41.718 1.216 0.2395460.6517 62.3953 -51.795 -34.790 0.869 0.0535460.6600 61.4734 -50.210 -35.467 0.959 0.048
5460.6741 59.7343 -47.242 -36.556 0.874 0.0545828.6275 239.741 -171.085 167.945 0.415 0.0745828.6275 312.117 299.632 87.394 0.573 0.0525828.6275 285.871 -128.547 -255.339 0.427 0.0975828.6472 244.850 -183.352 162.276 0.471 0.1735828.6472 306.665 290.973 96.840 0.505 0.1005828.6472 280.577 -107.621 -259.116 0.439 0.0675828.6657 248.009 -192.273 156.651 0.454 0.0755828.6657 298.036 278.787 105.372 0.527 0.1225828.6657 275.937 -86.514 -262.023 0.454 0.1255828.6860 249.381 -199.063 150.217 0.378 0.0455828.6860 284.970 261.066 114.248 0.596 0.0475828.6860 271.636 -62.003 -264.465 0.421 0.0445842.6526 249.360 -200.189 148.677 0.579 0.0825842.6526 281.406 256.275 116.243 0.611 0.0505842.6526 270.793 -56.086 -264.921 0.508 0.0725842.6636 248.785 -202.104 145.079 0.620 0.0845842.6636 272.484 244.283 120.720 0.782 0.0535842.6636 269.125 -42.178 -265.800 0.690 0.0845842.6765 247.165 -203.101 140.857 0.423 0.0575842.6765 261.055 228.827 125.650 0.416 0.1345842.6765 267.746 -25.726 -266.507 0.526 0.0666113.9098 299.267 46.283 295.666 0.564 0.0496113.9224 297.775 27.543 296.499 0.706 0.2196113.9357 297.049 9.5499 296.896 0.637 0.0536113.9644 297.802 -27.985 296.484 0.553 0.0986113.9897 301.286 -63.571 294.503 0.546 0.0726114.0032 304.142 -82.374 292.775 0.731 0.049
c© 2015 RAS, MNRAS 000, 1–15

20 N. D. Richardson et al.
Table A5 – continued V 2 Measurements from CHARA
HJD - 2,450,000 Baseline u v V 2 σV 2
(d) (m) (106 cycles radian−1) (106 cycles radian−1)
6115.8049 253.758 -143.509 209.280 0.502 0.0506115.8049 311.297 303.419 69.592 0.427 0.0446115.8049 321.467 -159.909 -278.873 0.567 0.0796115.8205 259.808 -159.041 205.441 0.567 0.0766115.8205 313.415 303.733 77.297 0.432 0.0636115.8205 317.611 -144.691 -282.738 0.524 0.0966140.7364 253.672 -143.281 209.331 0.458 0.0966140.7364 311.248 303.393 69.484 0.440 0.1016140.7364 321.518 -160.111 -278.816 0.354 0.045
6140.7525 259.899 -159.272 205.378 0.475 0.0986140.7525 313.426 303.715 77.417 0.572 0.1196140.7525 317.548 -144.443 -282.795 0.516 0.0476140.7679 265.385 -173.021 201.228 0.340 0.0756140.7679 312.850 301.090 84.971 0.490 0.1016140.7679 313.546 -128.068 -286.199 0.291 0.0466140.7903 272.028 -190.032 194.645 0.446 0.0486140.7903 307.525 292.246 95.729 0.401 0.0456140.7903 307.839 -102.213 -290.374 0.444 0.0926140.8049 275.251 -199.105 190.053 0.437 0.0476140.8049 301.327 283.350 102.522 0.632 0.2966140.8049 304.462 -84.244 -292.575 0.433 0.1146185.6400 263.669 -168.728 202.613 0.410 0.0486185.6400 313.319 302.256 82.525 0.456 0.1516185.6400 314.855 -133.527 -285.139 0.362 0.0756185.6541 268.295 -180.351 198.634 0.383 0.0596185.6541 311.321 298.218 89.369 0.396 0.1546185.6541 311.189 -117.866 -288.004 0.320 0.0546185.6652 271.464 -188.534 195.313 0.395 0.0476185.6652 308.272 293.367 94.695 0.411 0.0516185.6652 308.375 -104.832 -290.009 0.419 0.0906185.6794 274.749 -197.609 190.886 0.445 0.0866185.6794 302.583 285.112 101.327 0.506 0.0746185.6794 305.034 -87.502 -292.214 0.896 0.3466185.6939 277.109 -205.261 186.165 0.499 0.1416185.6939 294.781 274.330 107.884 0.495 0.0906185.6939 302.052 -69.068 -294.049 0.519 0.1106516.6622 275.739 135.758 240.003 0.685 0.0786516.6923 271.208 113.641 246.250 0.592 0.0686516.6923 243.414 -241.071 -33.697 0.943 0.2086516.6923 247.825 127.429 -212.553 0.666 0.0606516.7182 266.829 91.736 250.564 0.534 0.0766516.7182 250.177 -246.290 -43.932 0.382 0.2336516.7182 258.037 154.553 -206.631 0.560 0.0976517.6701 274.233 128.202 242.421 0.684 0.1306517.6701 234.346 -232.877 -26.192 0.594 0.2036517.6701 240.233 104.675 -216.229 0.695 0.1016517.6893 271.252 113.856 246.200 0.845 0.0806517.6893 243.311 -240.982 -33.591 0.796 0.1536517.6893 247.717 127.125 -212.609 0.390 0.0876565.6292 272.530 -191.380 194.027 0.510 0.0596565.6292 306.793 291.163 96.677 0.568 0.0726565.6292 307.352 -99.782 -290.704 0.517 0.0536565.6431 275.502 -199.870 189.613 0.453 0.1586565.6431 300.639 282.391 103.146 0.867 0.217
6565.6431 304.168 -82.520 -292.760 0.459 0.168
c© 2015 RAS, MNRAS 000, 1–15

The Massive, Interacting Binary MWC 314 21
Table A6. Orbital light curve from MOST
JD Phase m JD Phase m JD Phase m- 2,450,000 (mag) - 2,450,000 (mag) - 2,450,000 (mag)
6827.5752 0.9074 0.00820 6832.1544 0.9828 -0.00442 6836.3796 0.0524 0.008166827.6452 0.9085 0.00802 6832.2234 0.9839 0.00577 6836.4493 0.0535 0.007066827.7156 0.9097 0.00795 6832.2936 0.9851 0.00772 6836.5224 0.0547 0.014266827.7864 0.9109 0.01235 6832.3650 0.9863 -0.01125 6836.5842 0.0557 0.016006827.8569 0.9120 0.01427 6832.4349 0.9874 -0.01242 6836.6535 0.0569 0.023786827.9273 0.9132 0.01204 6832.5051 0.9886 -0.01085 6836.7230 0.0580 0.025256827.9972 0.9143 0.01216 6832.5768 0.9897 -0.00125 6836.7947 0.0592 0.031876828.0684 0.9155 0.01508 6832.6469 0.9909 -0.00493 6837.7800 0.0754 0.042406828.1389 0.9167 0.01289 6832.7175 0.9921 -0.00373 6839.2788 0.1001 0.056236828.2090 0.9178 0.01174 6832.7881 0.9932 -0.00160 6839.3313 0.1010 0.057826828.2796 0.9190 0.01143 6832.8581 0.9944 -0.00331 6839.4048 0.1022 0.057206828.3488 0.9201 0.00061 6832.9286 0.9955 -0.00575 6839.4737 0.1033 0.057966828.4186 0.9213 -0.01838 6832.9994 0.9967 -0.00193 6839.5459 0.1045 0.056436828.8432 0.9283 0.00079 6833.0697 0.9979 0.00270 6839.6122 0.1056 0.057886828.9134 0.9294 0.00207 6833.1397 0.9990 -0.00520 6839.6730 0.1066 0.059156828.9840 0.9306 0.00721 6833.2104 0.0002 -0.00190 6839.7473 0.1078 0.064946829.0543 0.9317 0.00774 6833.2799 0.0013 -0.00538 6839.8159 0.1089 0.065726829.1246 0.9329 0.00416 6833.3503 0.0025 0.00320 6839.8878 0.1101 0.063296829.1950 0.9341 0.00503 6833.4208 0.0036 0.00924 6839.9577 0.1113 0.059456829.2653 0.9352 0.03376 6833.4912 0.0048 -0.00932 6840.0267 0.1124 0.059596829.3345 0.9364 0.00897 6833.5628 0.0060 -0.00268 6840.0977 0.1136 0.059716829.4058 0.9375 -0.00834 6833.6335 0.0071 0.00216 6840.1957 0.1152 0.053036829.4761 0.9387 -0.00641 6833.7033 0.0083 -0.00413 6840.2449 0.1160 0.054196829.5472 0.9399 0.00039 6833.7738 0.0094 -0.00021 6840.3181 0.1172 0.051486829.6183 0.9410 -0.00026 6833.8445 0.0106 -0.00216 6840.3913 0.1184 0.050156829.6879 0.9422 0.00299 6833.9145 0.0118 0.00564 6840.4617 0.1196 0.054596829.7591 0.9433 -0.00371 6833.9854 0.0129 0.00338 6840.5291 0.1207 0.055756829.8295 0.9445 0.00357 6834.0554 0.0141 0.00818 6840.6001 0.1218 0.060146829.8999 0.9457 -0.00823 6834.1259 0.0152 0.00662 6840.6713 0.1230 0.064566829.9704 0.9468 0.00077 6834.1963 0.0164 0.01064 6840.7469 0.1243 0.071496830.0410 0.9480 -0.00401 6834.2662 0.0176 0.00068 6840.8175 0.1254 0.063956830.1112 0.9491 -0.00381 6834.3364 0.0187 -0.00743 6840.8864 0.1266 0.05920
6830.1813 0.9503 -0.00519 6834.4063 0.0199 -0.02639 6840.9562 0.1277 0.055126830.2506 0.9514 0.00439 6834.4777 0.0210 -0.00397 6841.0196 0.1287 0.055636830.3212 0.9526 -0.00316 6834.5490 0.0222 -0.00527 6841.0959 0.1300 0.056776830.3917 0.9538 -0.02045 6834.6203 0.0234 -0.00009 6841.1639 0.1311 0.055556830.4620 0.9549 -0.02464 6834.6896 0.0245 -0.00444 6841.2356 0.1323 0.052556830.5339 0.9561 -0.00531 6834.7608 0.0257 0.00046 6841.3054 0.1335 0.050546830.6042 0.9573 -0.00388 6834.8301 0.0268 -0.00115 6841.3755 0.1346 0.054616830.6750 0.9584 -0.00823 6834.9013 0.0280 0.00818 6841.4481 0.1358 0.060256830.7454 0.9596 -0.01100 6834.9716 0.0292 0.00543 6841.5153 0.1369 0.058726830.8160 0.9607 -0.00541 6835.0420 0.0303 0.01480 6841.5879 0.1381 0.058276830.8863 0.9619 -0.00278 6835.1125 0.0315 0.00742 6841.6581 0.1393 0.054326830.9569 0.9631 -0.00594 6835.1829 0.0326 0.01615 6841.7287 0.1404 0.046166831.0272 0.9642 -0.00492 6835.2525 0.0338 0.02036 6841.8027 0.1416 0.039946831.0973 0.9654 -0.01175 6835.3225 0.0349 0.00389 6841.8702 0.1428 0.038176831.1679 0.9665 -0.00384 6835.3934 0.0361 -0.00833 6841.9394 0.1439 0.038006831.2370 0.9677 0.00352 6835.4646 0.0373 -0.00295 6842.0052 0.1450 0.043996831.3072 0.9688 -0.01404 6835.5353 0.0385 0.00110 6842.0801 0.1462 0.044666831.3782 0.9700 -0.01552 6835.6059 0.0396 0.01702 6842.1465 0.1473 0.048316831.4479 0.9712 -0.03032 6835.6762 0.0408 0.00319 6842.2214 0.1485 0.048676831.5203 0.9723 -0.02038 6835.7470 0.0419 0.00620 6842.2912 0.1497 0.047006831.5899 0.9735 -0.00677 6835.8174 0.0431 0.01017 6842.3614 0.1508 0.045226831.6611 0.9747 -0.01306 6835.8871 0.0442 0.00591 6842.4337 0.1520 0.042906831.7315 0.9758 -0.01440 6835.9575 0.0454 0.00987 6842.4995 0.1531 0.038096831.8017 0.9770 -0.00947 6836.0280 0.0466 0.02004 6842.5727 0.1543 0.036156831.8720 0.9781 -0.00791 6836.0988 0.0477 0.01839 6842.6434 0.1555 0.036116831.9429 0.9793 -0.00785 6836.1692 0.0489 0.01539 6842.7160 0.1567 0.037926832.0128 0.9805 0.00241 6836.2383 0.0500 0.02371 6842.7858 0.1578 0.037246832.0838 0.9816 -0.00308 6836.3089 0.0512 0.01848 6842.8556 0.1590 0.03884
c© 2015 RAS, MNRAS 000, 1–15
22 N. D. Richardson et al.
Table A6 – continued Orbital light curve from MOST
JD Phase m JD Phase m JD Phase m- 2,450,000 (mag) - 2,450,000 (mag) - 2,450,000 (mag)
6842.9280 0.1602 0.04261 6853.4190 0.3329 -0.04118 6857.6448 0.4025 -0.045286842.9974 0.1613 0.04537 6853.4886 0.3341 -0.04578 6857.7144 0.4036 -0.044856843.0648 0.1624 0.04647 6853.5588 0.3352 -0.04650 6857.7631 0.4044 -0.048076843.1376 0.1636 0.04730 6853.6298 0.3364 -0.04809 6859.3455 0.4305 -0.034196843.2088 0.1648 0.04153 6853.7017 0.3376 -0.04638 6859.4002 0.4314 -0.028156843.2718 0.1658 0.04231 6853.7698 0.3387 -0.04539 6859.4605 0.4324 -0.023686843.3470 0.1671 0.03855 6853.8429 0.3399 -0.04695 6860.2651 0.4456 -0.022876843.4217 0.1683 0.03433 6853.9112 0.3410 -0.04553 6860.3200 0.4465 -0.031436843.4888 0.1694 0.04293 6853.9821 0.3422 -0.04005 6860.3902 0.4477 -0.025126843.5608 0.1706 0.04146 6854.0531 0.3433 -0.03356 6860.4603 0.4488 -0.030276843.6319 0.1718 0.04570 6854.1245 0.3445 -0.03652 6860.5307 0.4500 -0.028116843.6992 0.1729 0.05073 6854.1916 0.3456 -0.04175 6860.6021 0.4512 -0.033946843.7721 0.1741 0.04827 6854.2627 0.3468 -0.04285 6860.6676 0.4523 -0.017206843.8430 0.1752 0.04627 6854.3327 0.3479 -0.04590 6860.7458 0.4535 -0.026146843.9139 0.1764 0.04000 6854.4037 0.3491 -0.04148 6860.8145 0.4547 -0.023076843.9826 0.1775 0.03762 6854.4739 0.3503 -0.03919 6860.8823 0.4558 -0.022266844.0540 0.1787 0.03054 6854.5450 0.3514 -0.03659 6860.9521 0.4569 -0.021776844.1216 0.1798 0.02976 6854.6157 0.3526 -0.03042 6861.0251 0.4581 -0.020526844.1918 0.1810 0.02832 6854.6904 0.3538 -0.02877 6861.0917 0.4592 -0.019036844.2643 0.1822 0.02399 6854.7566 0.3549 -0.03074 6861.1581 0.4603 -0.019716844.3347 0.1833 0.02292 6854.8302 0.3561 -0.03000 6861.2353 0.4616 -0.021226844.4031 0.1845 0.02804 6854.8973 0.3572 -0.03682 6861.3063 0.4628 -0.028586844.4734 0.1856 0.02990 6854.9685 0.3584 -0.04125 6861.3756 0.4639 -0.029766844.5468 0.1868 0.03491 6855.0402 0.3596 -0.04338 6861.4458 0.4651 -0.028786844.6183 0.1880 0.03654 6855.1073 0.3607 -0.04329 6861.5165 0.4662 -0.025676844.6873 0.1891 0.03621 6855.1778 0.3619 -0.04182 6861.5898 0.4674 -0.022746844.7518 0.1902 0.03674 6855.2470 0.3630 -0.04142 6861.6597 0.4686 -0.022566844.8255 0.1914 0.03653 6855.3203 0.3642 -0.03787 6861.7303 0.4697 -0.017476844.8770 0.1923 0.04554 6855.3893 0.3653 -0.03743 6861.7984 0.4709 -0.020516848.0850 0.2451 0.00048 6855.4637 0.3666 -0.03473 6861.8696 0.4720 -0.017796848.1374 0.2459 0.00382 6855.5323 0.3677 -0.03460 6861.9403 0.4732 -0.005956848.2073 0.2471 0.00014 6855.6028 0.3689 -0.03850 6862.0069 0.4743 -0.01727
6848.2781 0.2483 -0.00217 6855.6730 0.3700 -0.03758 6862.0786 0.4755 -0.013296848.3492 0.2494 -0.00336 6855.7461 0.3712 -0.04064 6862.1474 0.4766 -0.005406848.4193 0.2506 0.00030 6855.8160 0.3724 -0.03970 6862.2134 0.4777 0.003006848.4888 0.2517 -0.00276 6855.8822 0.3735 -0.04297 6862.2908 0.4790 0.011506848.5547 0.2528 -0.00657 6855.9546 0.3747 -0.04321 6862.3347 0.4797 -0.021696848.6287 0.2540 -0.01074 6856.0262 0.3758 -0.04070 6862.4513 0.4816 -0.024066848.7024 0.2552 -0.01152 6856.0900 0.3769 -0.03539 6862.5026 0.4825 -0.011636848.7710 0.2564 -0.00968 6856.1627 0.3781 -0.02474 6862.5726 0.4836 -0.008506848.8455 0.2576 -0.01502 6856.2346 0.3793 -0.02727 6862.6445 0.4848 -0.013116848.9116 0.2587 -0.01942 6856.3061 0.3804 -0.02991 6862.7123 0.4859 -0.016906848.9825 0.2599 -0.01607 6856.3751 0.3816 -0.02864 6862.7812 0.4871 -0.013346849.0499 0.2610 -0.01132 6856.4481 0.3828 -0.03227 6862.8536 0.4882 -0.011906849.1208 0.2621 -0.00555 6856.5183 0.3839 -0.03410 6862.9214 0.4894 -0.020916849.1943 0.2633 -0.00257 6856.5871 0.3851 -0.03461 6862.9938 0.4906 -0.021486849.2659 0.2645 -0.00270 6856.6608 0.3863 -0.03427 6863.0655 0.4917 -0.024456849.3328 0.2656 -0.00615 6856.7267 0.3874 -0.03557 6863.1326 0.4928 -0.024996849.4054 0.2668 -0.00636 6856.8022 0.3886 -0.03091 6863.1995 0.4939 -0.019706849.4553 0.2676 -0.01642 6856.8738 0.3898 -0.03651 6863.2755 0.4952 -0.018566852.7259 0.3215 -0.04401 6856.9380 0.3908 -0.03627 6863.3467 0.4964 -0.011786852.7890 0.3225 -0.04841 6857.0092 0.3920 -0.04155 6863.4177 0.4975 -0.010846852.8552 0.3236 -0.05120 6857.0819 0.3932 -0.03586 6863.4821 0.4986 -0.011886852.9265 0.3248 -0.04577 6857.1494 0.3943 -0.03580 6863.5579 0.4998 -0.012916852.9962 0.3259 -0.04957 6857.2187 0.3955 -0.04584 6863.6281 0.5010 -0.020056853.0633 0.3270 -0.03773 6857.2905 0.3966 -0.04543 6863.6998 0.5022 -0.025106853.1344 0.3282 -0.03876 6857.3570 0.3977 -0.04551 6863.7691 0.5033 -0.020426853.2075 0.3294 -0.03760 6857.4310 0.3990 -0.04588 6863.8413 0.5045 -0.017636853.2736 0.3305 -0.03834 6857.5018 0.4001 -0.05396 6863.9123 0.5057 -0.016406853.3438 0.3317 -0.04217 6857.5726 0.4013 -0.04652 6863.9811 0.5068 -0.02477
c© 2015 RAS, MNRAS 000, 1–15
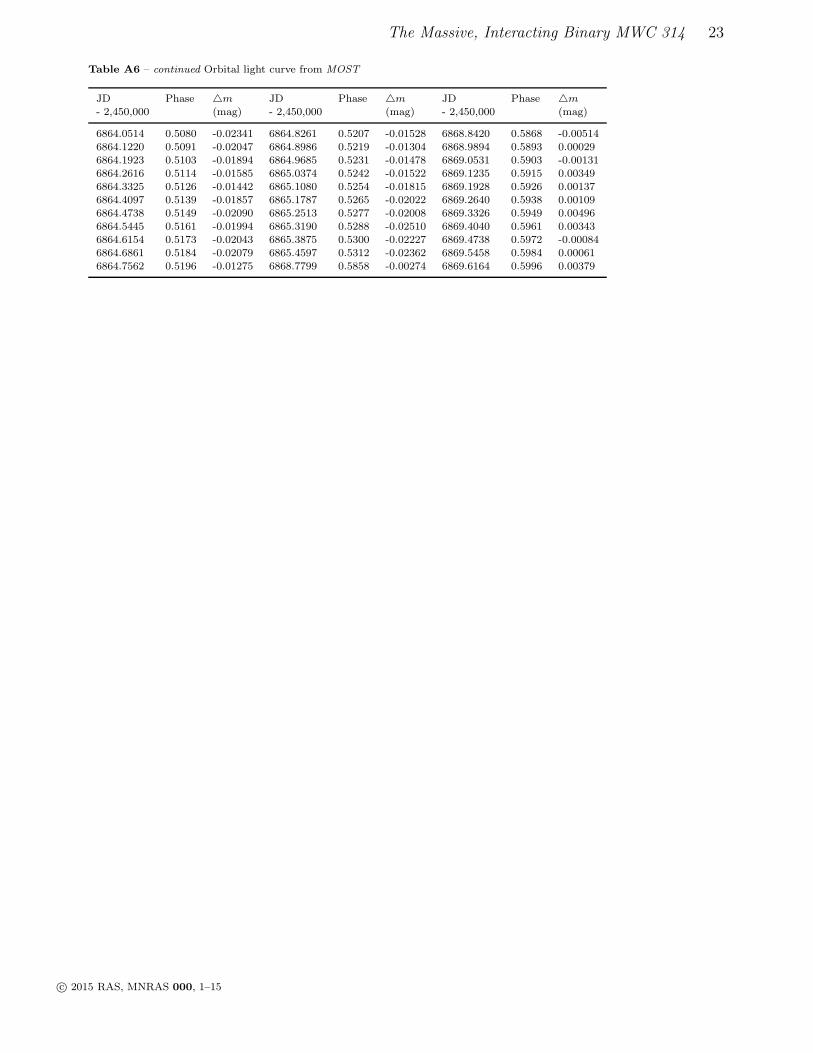
The Massive, Interacting Binary MWC 314 23
Table A6 – continued Orbital light curve from MOST
JD Phase m JD Phase m JD Phase m- 2,450,000 (mag) - 2,450,000 (mag) - 2,450,000 (mag)
6864.0514 0.5080 -0.02341 6864.8261 0.5207 -0.01528 6868.8420 0.5868 -0.005146864.1220 0.5091 -0.02047 6864.8986 0.5219 -0.01304 6868.9894 0.5893 0.000296864.1923 0.5103 -0.01894 6864.9685 0.5231 -0.01478 6869.0531 0.5903 -0.001316864.2616 0.5114 -0.01585 6865.0374 0.5242 -0.01522 6869.1235 0.5915 0.003496864.3325 0.5126 -0.01442 6865.1080 0.5254 -0.01815 6869.1928 0.5926 0.001376864.4097 0.5139 -0.01857 6865.1787 0.5265 -0.02022 6869.2640 0.5938 0.001096864.4738 0.5149 -0.02090 6865.2513 0.5277 -0.02008 6869.3326 0.5949 0.004966864.5445 0.5161 -0.01994 6865.3190 0.5288 -0.02510 6869.4040 0.5961 0.003436864.6154 0.5173 -0.02043 6865.3875 0.5300 -0.02227 6869.4738 0.5972 -0.000846864.6861 0.5184 -0.02079 6865.4597 0.5312 -0.02362 6869.5458 0.5984 0.000616864.7562 0.5196 -0.01275 6868.7799 0.5858 -0.00274 6869.6164 0.5996 0.00379
c© 2015 RAS, MNRAS 000, 1–15

24 N. D. Richardson et al.
Table A7. Pulsational light curve from MOST
JD m JD m JD m JD m JD m- 2,450,000 (mag) - 2,450,000 (mag) - 2,450,000 (mag) - 2,450,000 (mag) - 2,450,000 (mag)
6827.5753 0.00733 6833.7763 0.00080 6841.0668 -0.00696 6848.5935 0.00229 6856.1150 0.005656827.6459 0.00627 6833.8471 -0.00255 6841.1386 -0.00599 6848.6641 0.00016 6856.1864 0.005596827.7164 0.00475 6833.9178 0.00068 6841.2086 -0.00566 6848.7312 -0.00070 6856.2571 0.005286827.7871 0.00264 6833.9879 -0.00031 6841.2815 -0.00493 6848.8045 -0.00104 6856.3371 0.003766827.8579 -0.00107 6834.0591 0.00398 6841.3531 0.00181 6848.8771 -0.01215 6856.4108 -0.005596827.9291 -0.00801 6834.1295 -0.00384 6841.4261 0.00420 6848.9516 -0.00793 6856.4819 -0.011856827.9993 -0.00739 6834.1999 -0.00202 6841.5038 0.00727 6849.0253 -0.00299 6856.5496 -0.009706828.0702 -0.00465 6834.2705 -0.00280 6841.5779 0.00556 6849.0968 0.00220 6856.6229 -0.010016828.1407 0.00171 6834.5490 0.00505 6841.6504 0.00285 6849.1676 0.00657 6856.6909 -0.009036828.2112 0.00217 6834.6200 0.00799 6841.7268 -0.00124 6849.2372 0.00487 6856.7572 -0.003256828.8436 -0.00236 6834.6914 0.00534 6841.7994 -0.00075 6849.3129 0.00545 6856.8293 0.000506828.9147 -0.00340 6834.7619 0.00217 6841.8860 -0.00486 6849.3794 -0.00628 6856.9030 0.007636828.9833 0.00407 6834.8326 -0.00218 6841.9566 -0.00275 6849.4509 -0.01807 6856.9746 0.007726829.0562 0.00640 6834.9027 0.00004 6842.0321 0.00116 6852.7149 -0.00531 6857.0488 0.007716829.1260 0.00702 6834.9738 -0.00553 6842.0975 0.00577 6852.7954 -0.00292 6857.1181 0.003166829.1966 0.00335 6835.0446 -0.00427 6842.1701 0.00480 6852.8645 -0.00280 6857.1934 0.005646829.2680 -0.00106 6835.1150 -0.00598 6842.2395 0.00813 6852.9366 0.00874 6857.2647 -0.000776829.5469 -0.00729 6835.1855 0.00346 6842.3314 0.00144 6853.0177 0.01266 6857.3374 -0.001406829.6184 -0.00695 6835.2560 0.00396 6842.4032 -0.00060 6853.0853 0.01653 6857.4078 -0.003726829.6890 -0.00373 6835.5357 -0.00367 6842.4739 -0.01005 6853.1568 0.01550 6857.4782 -0.005566829.7598 -0.00247 6835.6062 -0.00430 6842.5445 -0.01488 6853.2297 0.00970 6857.5505 -0.005436829.8302 0.00404 6835.6773 -0.00640 6842.6167 -0.01600 6853.3105 0.00384 6857.6195 -0.001036829.9010 0.00211 6835.7478 -0.00327 6842.6896 -0.01083 6853.3839 -0.00157 6857.6908 0.003936829.9719 0.00494 6835.8185 0.00135 6842.7808 -0.00289 6853.4547 -0.00755 6857.7555 0.007696830.0424 0.00493 6835.8892 0.00027 6842.8683 0.00348 6853.5242 -0.01434 6859.3218 0.002386830.1126 0.00157 6835.9600 0.00556 6842.9433 0.01316 6853.6012 -0.01420 6859.3955 0.003816830.1835 -0.00087 6836.0305 0.00515 6843.0161 0.01633 6853.6693 -0.00750 6859.4662 -0.002446830.2539 -0.00246 6836.1009 0.01547 6843.0864 0.01684 6853.7378 -0.00300 6860.2527 0.003046830.5364 0.00514 6836.1717 0.00518 6843.1610 0.00941 6853.8023 0.00057 6860.3217 0.002826830.6074 0.00367 6836.2423 0.00325 6843.2301 0.00194 6853.8791 0.00484 6860.3942 -0.006486830.6779 0.00334 6836.5189 -0.00476 6843.3076 -0.00004 6853.9507 0.01128 6860.4647 -0.008626830.8159 -0.00072 6836.5911 -0.00554 6843.3820 -0.00756 6854.0261 0.01047 6860.5370 -0.00929
6830.8869 -0.00205 6836.6619 -0.00122 6843.4499 -0.00826 6854.0945 0.00465 6860.6090 -0.009326830.9573 -0.00148 6836.7327 0.00244 6843.5238 -0.00867 6854.1664 0.00007 6860.6822 -0.005256831.0281 -0.00154 6836.8036 0.00625 6843.5910 -0.00520 6854.2368 -0.00085 6860.7529 0.000036831.0988 -0.00507 6837.7828 0.00025 6843.6641 0.00218 6854.3083 -0.00360 6860.8235 0.003296831.1690 0.00162 6839.2853 0.01004 6843.7290 0.00525 6854.3783 0.00308 6860.8957 0.001856831.2395 0.00348 6839.3684 0.00679 6843.8025 0.00851 6854.4512 0.00127 6860.9660 0.001676831.5232 0.01217 6839.4381 0.00014 6843.8757 0.00054 6854.5200 0.00242 6861.0372 0.000906831.6611 0.00517 6839.5106 -0.00521 6843.9431 0.00197 6854.5920 0.00685 6861.1075 0.000676831.7319 0.00076 6839.5819 -0.00929 6844.0165 0.00109 6854.6622 0.00531 6861.2299 -0.001616831.8030 -0.00258 6839.6561 -0.00389 6844.0904 -0.00240 6854.7294 0.00886 6861.2968 0.000536831.8734 -0.00557 6839.7552 0.00100 6844.1638 -0.00582 6854.8012 0.00414 6861.3698 0.000536831.9443 -0.00854 6839.8306 0.01277 6844.2317 -0.00924 6854.8724 -0.00657 6861.4416 0.006656832.0139 -0.00634 6839.8998 0.01235 6844.3031 -0.00627 6854.9465 -0.00423 6861.5175 0.003386832.0856 -0.00227 6839.9708 0.01620 6844.3754 -0.00090 6855.0152 -0.01034 6861.5931 0.005246832.1559 -0.00393 6840.0425 0.02147 6844.4499 0.00152 6855.0865 -0.01359 6861.6661 0.003806832.2257 0.00273 6840.1136 0.01248 6844.5194 0.00469 6855.1610 -0.00659 6861.7380 -0.000786832.5092 -0.00501 6840.1978 -0.00033 6844.5866 0.00557 6855.2307 -0.00122 6861.8085 -0.002586832.5797 -0.00441 6840.2760 0.00270 6844.6559 0.00730 6855.2997 -0.00089 6861.8785 -0.005726832.7193 -0.00375 6840.3509 -0.00265 6844.7259 0.00257 6855.3723 0.00487 6861.9901 -0.024066832.7899 -0.00007 6840.4201 -0.00267 6844.7962 0.00081 6855.4443 0.00637 6862.0607 -0.017016832.8608 0.00479 6840.4940 -0.00251 6844.8710 -0.00611 6855.5196 0.00208 6862.1313 -0.011796832.9316 0.01076 6840.5653 0.00089 6848.0949 -0.01090 6855.5932 -0.00086 6862.2018 -0.004476833.0026 0.00355 6840.6388 0.00697 6848.1640 -0.00641 6855.6612 -0.00502 6862.3425 0.000006833.1410 0.00385 6840.7063 0.00911 6848.2380 -0.00618 6855.7340 0.00182 6862.4135 0.003336833.2115 -0.00121 6840.7759 0.01431 6848.3070 0.00378 6855.8121 0.00233 6862.5539 0.009376833.5631 -0.00313 6840.8476 0.00026 6848.3780 0.00854 6855.8933 -0.00240 6862.6936 -0.010046833.6349 0.00321 6840.9216 -0.00365 6848.4524 0.01032 6855.9737 0.00021 6862.7658 -0.006976833.7059 0.00287 6840.9972 -0.00386 6848.5216 0.00668 6856.0475 0.00068 6863.0000 -0.00082
c© 2015 RAS, MNRAS 000, 1–15
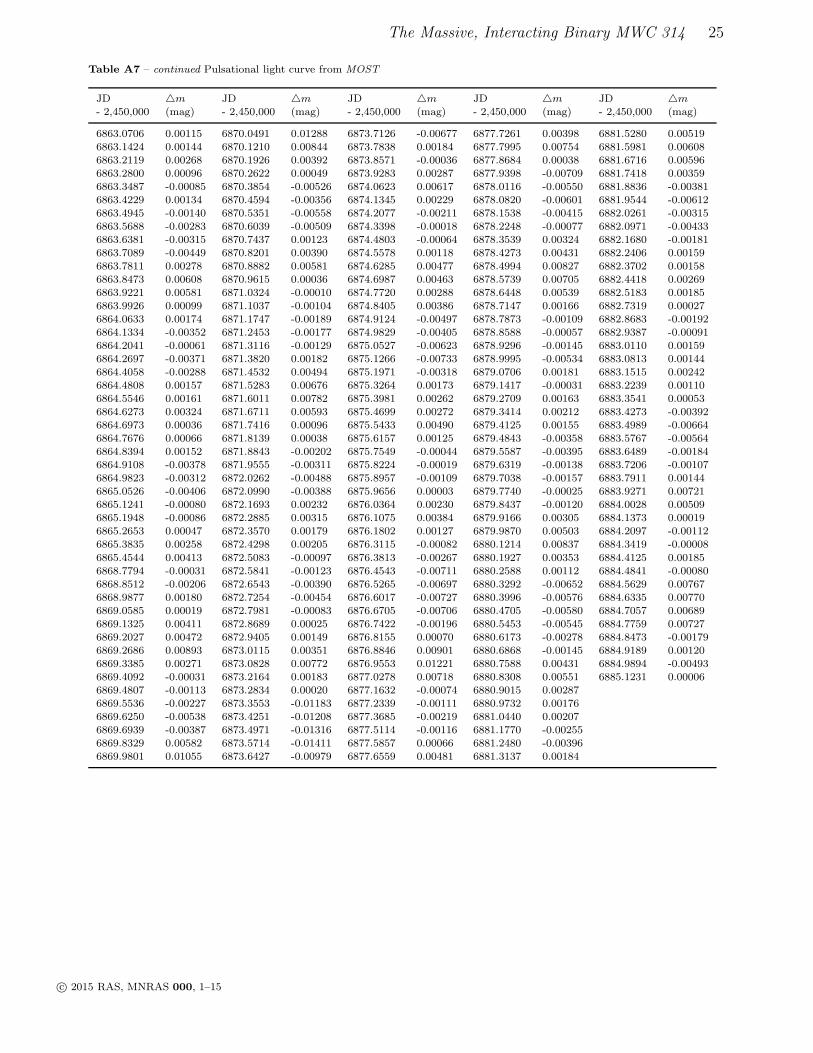
The Massive, Interacting Binary MWC 314 25
Table A7 – continued Pulsational light curve from MOST
JD m JD m JD m JD m JD m- 2,450,000 (mag) - 2,450,000 (mag) - 2,450,000 (mag) - 2,450,000 (mag) - 2,450,000 (mag)
6863.0706 0.00115 6870.0491 0.01288 6873.7126 -0.00677 6877.7261 0.00398 6881.5280 0.005196863.1424 0.00144 6870.1210 0.00844 6873.7838 0.00184 6877.7995 0.00754 6881.5981 0.006086863.2119 0.00268 6870.1926 0.00392 6873.8571 -0.00036 6877.8684 0.00038 6881.6716 0.005966863.2800 0.00096 6870.2622 0.00049 6873.9283 0.00287 6877.9398 -0.00709 6881.7418 0.003596863.3487 -0.00085 6870.3854 -0.00526 6874.0623 0.00617 6878.0116 -0.00550 6881.8836 -0.003816863.4229 0.00134 6870.4594 -0.00356 6874.1345 0.00229 6878.0820 -0.00601 6881.9544 -0.006126863.4945 -0.00140 6870.5351 -0.00558 6874.2077 -0.00211 6878.1538 -0.00415 6882.0261 -0.003156863.5688 -0.00283 6870.6039 -0.00509 6874.3398 -0.00018 6878.2248 -0.00077 6882.0971 -0.004336863.6381 -0.00315 6870.7437 0.00123 6874.4803 -0.00064 6878.3539 0.00324 6882.1680 -0.001816863.7089 -0.00449 6870.8201 0.00390 6874.5578 0.00118 6878.4273 0.00431 6882.2406 0.001596863.7811 0.00278 6870.8882 0.00581 6874.6285 0.00477 6878.4994 0.00827 6882.3702 0.001586863.8473 0.00608 6870.9615 0.00036 6874.6987 0.00463 6878.5739 0.00705 6882.4418 0.002696863.9221 0.00581 6871.0324 -0.00010 6874.7720 0.00288 6878.6448 0.00539 6882.5183 0.001856863.9926 0.00099 6871.1037 -0.00104 6874.8405 0.00386 6878.7147 0.00166 6882.7319 0.000276864.0633 0.00174 6871.1747 -0.00189 6874.9124 -0.00497 6878.7873 -0.00109 6882.8683 -0.001926864.1334 -0.00352 6871.2453 -0.00177 6874.9829 -0.00405 6878.8588 -0.00057 6882.9387 -0.000916864.2041 -0.00061 6871.3116 -0.00129 6875.0527 -0.00623 6878.9296 -0.00145 6883.0110 0.001596864.2697 -0.00371 6871.3820 0.00182 6875.1266 -0.00733 6878.9995 -0.00534 6883.0813 0.001446864.4058 -0.00288 6871.4532 0.00494 6875.1971 -0.00318 6879.0706 0.00181 6883.1515 0.002426864.4808 0.00157 6871.5283 0.00676 6875.3264 0.00173 6879.1417 -0.00031 6883.2239 0.001106864.5546 0.00161 6871.6011 0.00782 6875.3981 0.00262 6879.2709 0.00163 6883.3541 0.000536864.6273 0.00324 6871.6711 0.00593 6875.4699 0.00272 6879.3414 0.00212 6883.4273 -0.003926864.6973 0.00036 6871.7416 0.00096 6875.5433 0.00490 6879.4125 0.00155 6883.4989 -0.006646864.7676 0.00066 6871.8139 0.00038 6875.6157 0.00125 6879.4843 -0.00358 6883.5767 -0.005646864.8394 0.00152 6871.8843 -0.00202 6875.7549 -0.00044 6879.5587 -0.00395 6883.6489 -0.001846864.9108 -0.00378 6871.9555 -0.00311 6875.8224 -0.00019 6879.6319 -0.00138 6883.7206 -0.001076864.9823 -0.00312 6872.0262 -0.00488 6875.8957 -0.00109 6879.7038 -0.00157 6883.7911 0.001446865.0526 -0.00406 6872.0990 -0.00388 6875.9656 0.00003 6879.7740 -0.00025 6883.9271 0.007216865.1241 -0.00080 6872.1693 0.00232 6876.0364 0.00230 6879.8437 -0.00120 6884.0028 0.005096865.1948 -0.00086 6872.2885 0.00315 6876.1075 0.00384 6879.9166 0.00305 6884.1373 0.000196865.2653 0.00047 6872.3570 0.00179 6876.1802 0.00127 6879.9870 0.00503 6884.2097 -0.001126865.3835 0.00258 6872.4298 0.00205 6876.3115 -0.00082 6880.1214 0.00837 6884.3419 -0.00008
6865.4544 0.00413 6872.5083 -0.00097 6876.3813 -0.00267 6880.1927 0.00353 6884.4125 0.001856868.7794 -0.00031 6872.5841 -0.00123 6876.4543 -0.00711 6880.2588 0.00112 6884.4841 -0.000806868.8512 -0.00206 6872.6543 -0.00390 6876.5265 -0.00697 6880.3292 -0.00652 6884.5629 0.007676868.9877 0.00180 6872.7254 -0.00454 6876.6017 -0.00727 6880.3996 -0.00576 6884.6335 0.007706869.0585 0.00019 6872.7981 -0.00083 6876.6705 -0.00706 6880.4705 -0.00580 6884.7057 0.006896869.1325 0.00411 6872.8689 0.00025 6876.7422 -0.00196 6880.5453 -0.00545 6884.7759 0.007276869.2027 0.00472 6872.9405 0.00149 6876.8155 0.00070 6880.6173 -0.00278 6884.8473 -0.001796869.2686 0.00893 6873.0115 0.00351 6876.8846 0.00901 6880.6868 -0.00145 6884.9189 0.001206869.3385 0.00271 6873.0828 0.00772 6876.9553 0.01221 6880.7588 0.00431 6884.9894 -0.004936869.4092 -0.00031 6873.2164 0.00183 6877.0278 0.00718 6880.8308 0.00551 6885.1231 0.000066869.4807 -0.00113 6873.2834 0.00020 6877.1632 -0.00074 6880.9015 0.002876869.5536 -0.00227 6873.3553 -0.01183 6877.2339 -0.00111 6880.9732 0.001766869.6250 -0.00538 6873.4251 -0.01208 6877.3685 -0.00219 6881.0440 0.002076869.6939 -0.00387 6873.4971 -0.01316 6877.5114 -0.00116 6881.1770 -0.002556869.8329 0.00582 6873.5714 -0.01411 6877.5857 0.00066 6881.2480 -0.003966869.9801 0.01055 6873.6427 -0.00979 6877.6559 0.00481 6881.3137 0.00184
c© 2015 RAS, MNRAS 000, 1–15

26 N. D. Richardson et al.
6828 6830 6832 6834 6836 6838JD - 2,450,000
0.02
0.01
0.00
-0.01
-0.02
∆mag
[M
OS
T]
6840 6842 6844 6846 6848 6850JD - 2,450,000
0.02
0.01
0.00
-0.01
-0.02
∆mag
[M
OS
T]
6852 6854 6856 6858 6860 6862JD - 2,450,000
0.02
0.01
0.00
-0.01
-0.02
∆mag
[M
OS
T]
6864 6866 6868 6870 6872 6874JD - 2,450,000
0.02
0.01
0.00
-0.01
-0.02
∆mag
[M
OS
T]
6876 6878 6880 6882 6884 6886JD - 2,450,000
0.02
0.01
0.00
-0.01
-0.02
∆mag
[M
OS
T]
Figure A2. The entire de-trended MOST light curve, with our two frequency fit overplotted. The detrending has removed the orbitallymodulated variation, and only pulsational behaviour remains. Small points represent individual measurements, with the large pointsrepresenting the orbital means.
c© 2015 RAS, MNRAS 000, 1–15
Related Documents


