Spectroscopic analysis of the intrinsic chromophores within small multidrug resistance protein SugE Denice C. Bay, Raymond J. Turner ⁎ Department of Biological Sciences, University of Calgary, Calgary, Alberta, Canada T2N 1N4 abstract article info Article history: Received 14 February 2011 Received in revised form 3 May 2011 Accepted 4 May 2011 Available online 12 May 2011 Keywords: Small multidrug resistance protein (SMR) Suppressor of GroEL mutations (SugE) Quaternary cation compound (QCC) Cetrimide Cetylpyridinium Quaternary ammonium compound (QAC) Small multidrug resistance (SMR) protein family member, SugE, is an integral inner membrane protein that confers host resistance to antiseptic quaternary cation compounds (QCC). SugE studies generally focus on its resistance to limited substrates in comparison to SMR protein EmrE. This study examines the conformational characteristics of SugE protein in two detergents, sodium dodecyl sulphate (SDS) and dodecyl maltoside (DDM), commonly used to study SMR proteins. The influence of cetylpyridinium (CTP) and cetrimide (CET) using SugE aromatic residues (4W, 2Y, 1F) as intrinsic spectroscopic probes was also determined. Organically extracted detergent solubilized Escherichia coli SugE protein was examined by SDS-Tricine PAGE and various spectroscopic techniques. SDS-Tricine PAGE analysis of SugE in either detergent demonstrates the protein predominates as a monomer but also dimerizes in SDS. Far-UV region circular dichroism (CD) analysis determined that the overall α-helix content SugE in SDS and DDM was almost identical and unaltered by QCC. Near-UV region CD, fluorescence, and second-derivative ultraviolet absorption (SDUV) indicated that only DDM-SugE promoted hydrophobic environments for its Trp and Tyr residues that were perturbed by QCC addition. This study identified that only the tertiary structure of SugE protein in DDM is altered by QCC. © 2011 Elsevier B.V. All rights reserved. 1. Introduction Small multidrug resistance (SMR) proteins are integral membrane proteins located within the plasma membranes of most Bacteria and Euryarchaea [1] that confer resistance to quaternary cation com- pounds (QCC) via proton motive force [2]. The SMR protein family is one of many secondary active multidrug transporters in Bacteria that can confer resistance to QCC. They are also distinct from any other multidrug transporter due to their short length (105–150 amino acids; 4 α-helix transmembrane strands (TMS)) and presence within the 3′ conserved region of Class I integrons (as reviewed by [3]). These characteristics make SMR protein studies essential for understanding larger multidrug transporters (N 10–22 TMS), multidrug efflux regula- tion, and provide insight into bacterial multidrug resistance mediated by horizontal gene transfer. The SMR protein family is composed of three major protein subclasses: small multidrug proteins (SMP), suppressor of groEL mutations (SUG), and paired SMR proteins (PSMR) (as reviewed by [3]). Among the three SMR subclasses, only SMP and SUG subclass members are capable of conferring isogenic QCC resistance to its host and members from either subclasses are frequently encoded in conserved regions of integrons [4,5] and on multidrug resistant plasmids [6,7]. SMP subclass members are identified more frequently with these transposable elements [3], however, SUG subclass homologues are the most broadly identified SMR within the genomes of diverse Archaeal and Bacterial genera [1]. Fur- thermore, QCC resistance experiments of SugE and EmrE (the archetype of the SMP subclass) demonstrate that SugE has a narrow QCC substrate range compared to the broad substrate resistance conferred by EmrE [8]. The narrow QCC spectrum of SugE is limited to antiseptics, specifically those with one or more elongated acyl chain R groups that range from C 12 to C 18 covalently bound to a single N cation [8]. More specifically, SugE can confer host resistance to the antispectics, cetylpyridinium (C 21 H 38 N), cetyldimethylethyl ammonium (C 20 H 42 N), and hexadecyltrimethyl am- monium (C 19 H 42 N) also known as cetrimide [8]. The inability of SugE to transport diverse substrates may be due to its potential involvement as a chaperone like groEL[9,10], although no experimental evidence directly supports this to date. Over-expression experiments of cloned sugE demonstrated that it rescued groEL mutations [9] but experiments using precisely cloned sugE failed to reproduce this finding [8]. Examination of the SugE protein to date has focused solely on its ligand binding ability [11] and site-directed mutagenesis experiments examining the transport ability of particular SugE amino acid variants [12]. Cell free expression of green fluorescent protein tagged SugE protein revealed that the protein adopted high amounts of α-helix content confirmed by circular dichroism and nuclear magnetic reso- nance (NMR) analyses and it was capable of functional reconstitution into proteoliposomes [13]. However by comparison to EmrE protein, SugE conformation is relatively unknown and its particular substrate recognition limitations warrant further study. Biochimica et Biophysica Acta 1808 (2011) 2233–2244 ⁎ Corresponding author at: BI 156 Biological Sciences Building, 2500 University Drive N.W., Department of Biological Sciences, University of Calgary, Calgary, Alberta, Canada, T2N 1N4. Tel.: +1 403 220 4308; fax: +1 403 289 9311. E-mail address: [email protected] (R.J. Turner). 0005-2736/$ – see front matter © 2011 Elsevier B.V. All rights reserved. doi:10.1016/j.bbamem.2011.05.005 Contents lists available at ScienceDirect Biochimica et Biophysica Acta journal homepage: www.elsevier.com/locate/bbamem

Welcome message from author
This document is posted to help you gain knowledge. Please leave a comment to let me know what you think about it! Share it to your friends and learn new things together.
Transcript
Biochimica et Biophysica Acta 1808 (2011) 2233–2244
Contents lists available at ScienceDirect
Biochimica et Biophysica Acta
j ourna l homepage: www.e lsev ie r.com/ locate /bbamem
Spectroscopic analysis of the intrinsic chromophores within small multidrugresistance protein SugE
Denice C. Bay, Raymond J. Turner ⁎Department of Biological Sciences, University of Calgary, Calgary, Alberta, Canada T2N 1N4
⁎ Corresponding author at: BI 156 Biological Sciences BN.W., Department of Biological Sciences, University of CaT2N 1N4. Tel.: +1 403 220 4308; fax: +1 403 289 931
E-mail address: [email protected] (R.J. Turner).
0005-2736/$ – see front matter © 2011 Elsevier B.V. Aldoi:10.1016/j.bbamem.2011.05.005
a b s t r a c t
a r t i c l e i n f oArticle history:Received 14 February 2011Received in revised form 3 May 2011Accepted 4 May 2011Available online 12 May 2011
Keywords:Small multidrug resistance protein (SMR)Suppressor of GroEL mutations (SugE)Quaternary cation compound (QCC)CetrimideCetylpyridiniumQuaternary ammonium compound (QAC)
Small multidrug resistance (SMR) protein family member, SugE, is an integral inner membrane protein thatconfers host resistance to antiseptic quaternary cation compounds (QCC). SugE studies generally focus on itsresistance to limited substrates in comparison to SMR protein EmrE. This study examines the conformationalcharacteristics of SugE protein in two detergents, sodium dodecyl sulphate (SDS) and dodecyl maltoside(DDM), commonly used to study SMR proteins. The influence of cetylpyridinium (CTP) and cetrimide (CET)using SugE aromatic residues (4W, 2Y, 1F) as intrinsic spectroscopic probes was also determined. Organicallyextracted detergent solubilized Escherichia coli SugE protein was examined by SDS-Tricine PAGE and variousspectroscopic techniques. SDS-Tricine PAGE analysis of SugE in either detergent demonstrates the proteinpredominates as a monomer but also dimerizes in SDS. Far-UV region circular dichroism (CD) analysisdetermined that the overallα-helix content SugE in SDS and DDMwas almost identical and unaltered by QCC.Near-UV region CD, fluorescence, and second-derivative ultraviolet absorption (SDUV) indicated that onlyDDM-SugE promoted hydrophobic environments for its Trp and Tyr residues that were perturbed by QCCaddition. This study identified that only the tertiary structure of SugE protein in DDM is altered by QCC.
uilding, 2500 University Drivelgary, Calgary, Alberta, Canada,1.
l rights reserved.
© 2011 Elsevier B.V. All rights reserved.
1. Introduction
Small multidrug resistance (SMR) proteins are integral membraneproteins located within the plasma membranes of most Bacteria andEuryarchaea [1] that confer resistance to quaternary cation com-pounds (QCC) via proton motive force [2]. The SMR protein familyis one of many secondary active multidrug transporters in Bacteriathat can confer resistance to QCC. They are also distinct from any othermultidrug transporter due to their short length (105–150 aminoacids; 4 α-helix transmembrane strands (TMS)) and presence withinthe 3′ conserved region of Class I integrons (as reviewed by [3]). Thesecharacteristics make SMR protein studies essential for understandinglarger multidrug transporters (N10–22 TMS), multidrug efflux regula-tion, and provide insight into bacterial multidrug resistance mediatedby horizontal gene transfer.
TheSMRprotein family is composedof threemajorprotein subclasses:small multidrug proteins (SMP), suppressor of groEL mutations (SUG),and paired SMR proteins (PSMR) (as reviewed by [3]). Among the threeSMR subclasses, only SMP and SUG subclass members are capable ofconferring isogenic QCC resistance to its host and members from eithersubclasses are frequently encoded in conserved regions of integrons[4,5] and on multidrug resistant plasmids [6,7]. SMP subclass members
are identified more frequently with these transposable elements [3],however, SUG subclass homologues are the most broadly identified SMRwithin the genomes of diverse Archaeal and Bacterial genera [1]. Fur-thermore, QCC resistance experiments of SugE and EmrE (the archetypeof the SMP subclass) demonstrate that SugE has a narrow QCC substraterange compared to the broad substrate resistance conferred by EmrE [8].The narrow QCC spectrum of SugE is limited to antiseptics, specificallythosewith one ormore elongated acyl chain R groups that range fromC12to C18 covalently bound to a singleN cation [8].More specifically, SugE canconfer host resistance to the antispectics, cetylpyridinium (C21H38N),cetyldimethylethyl ammonium (C20H42N), and hexadecyltrimethyl am-monium (C19H42N) also known as cetrimide [8]. The inability of SugEto transport diverse substrates may be due to its potential involvementas a chaperone like groEL[9,10], although no experimental evidencedirectly supports this to date. Over-expression experiments of clonedsugE demonstrated that it rescued groEL mutations [9] but experimentsusing precisely cloned sugE failed to reproduce this finding [8].
Examination of the SugE protein to date has focused solely on itsligand binding ability [11] and site-directed mutagenesis experimentsexamining the transport ability of particular SugE amino acid variants[12]. Cell free expression of green fluorescent protein tagged SugEprotein revealed that the protein adopted high amounts of α-helixcontent confirmed by circular dichroism and nuclear magnetic reso-nance (NMR) analyses and it was capable of functional reconstitutioninto proteoliposomes [13]. However by comparison to EmrE protein,SugE conformation is relatively unknown and its particular substraterecognition limitations warrant further study.
2234 D.C. Bay, R.J. Turner / Biochimica et Biophysica Acta 1808 (2011) 2233–2244
Almost all structural knowledge regarding SugE protein confor-mation and multimerization are predicted from studies of the SMRmember EmrE. Structural characterization of EmrE protein over thepast two decades have been extensive and resulted in many twodimensional and three dimensional (3.7–6 Å) structures of the protein[14–17]. These X-ray diffraction and 2D cryo-electron microscopycrystal structures of EmrE protein have revealed that the proteinadopts an asymmetrical arrangement to two protein monomersto form a dual topology homodimer (as reviewed by [18,19]). It isimportant to note that conclusions drawn from the existing EmrEstructures may be potentially misleading based on their current reso-lution. Support for the dual topology EmrE homodimer has beenmet with some controversy due to concerns focusing on its in vivobiological topology and structural conflicts with biochemical studiesof the protein [20,21]. Regardless, valuable biochemical informationfrom the structure-function studies of EmrE has been achieved andhas benefited SMR family studies as a whole. Knowledge obtainedfrom EmrE studies has aided the characterization of other SMPmembers such as TB-Smr [22,23] and PSMR subclass members EbrAand EbrB from Bacillus subtilis[24–26]. However, conclusions madeabout other SMR subclass members based solely on the structuralarrangement from EmrE studies alone might have never revealed theimportance of loop and the C-terminus contributions to SMR functiongained from the biochemical analyses of PSMR members EbrA andEbrB [24]. Therefore, characterization of the specific antiseptic trans-porter SugE, may provide valuable information regarding the trans-port and ligand binding specificity of the SMR family as well as othermultidrug transporters. Structural characterization of SugE may alsoassist in identifying the evolutionary origin of the SMR family.
The focus of this work is to characterize the secondary, tertiary,quaternary structures of SugE protein and determine its ligand inter-action in the presence of two QCC, cetrimide (CET) and cetylpyridinium(CTP). The intrinsic aromatic residues of SugE (4W, 2Y, 1F) were usedas internal chromophores to measure any conformational differenceswithin the protein solubilized in SDS or DDM detergents as well asalterations induced by QCC ligand interactions. Fluorescence spectrom-etry (tertiary structure), circular dichroism spectropolarimetry (second-ary and tertiary structure), and UV absorbance spectroscopy (tertiarystructure) methods were selected to examine the conformationalarrangements of SugE protein. The multimeric forms of SugE in thepresence of either QCC were also examined by SDS-Tricine PAGEanalysis. The results of this study reveal that SugE predominates as amonomer in either detergent examined but can adopt a less abundantdimer form at high protein concentrations. As predicted from primarysequence analysis, SugE demonstrated high overall α-helix content inboth detergents that was not significantly changed in the presence ofeither ligand examined. Spectroscopic analysis of DDM-SugE tertiarystructure demonstrated that its aromatic amino acid residues undergorearrangements as the ratio of QCC:SugE ratio exceeds 10. CET and CTPinduced different conformational changes in arrangements of Trp andTyr of DDM-SugE. This study demonstrates that DDM-SugE proteintertiary structure arrangements but not its secondary structure areinfluenced by ligand binding.
2. Materials and methods
2.1. Materials used in this study
All chemicals used during these experiments were purchased fromSigma Aldrich (St Louis, MO, USA) or EMD Chemicals (Darmstadt,Germany). Electrophoresis equipment and chemicals such as sodiumdodecyl sulphate (SDS), tricine, trizma base, acrylamide, andbisacrylamide were obtained from BioRad (Hercules, CA, USA). Thedetergent, dodecyl-β-D-maltopyranoside (DDM), used for protein solu-bilization and spectroscopic analysis was purchased from Affymetrix-Anatrace (Santa Clara, CA, USA). Cetylpyridinium chloride (R1N(Cl)R2
R1=C5H8 R2=C16H33) abbreviated CTP in this study was purchasedfromSigma-Aldrich (St Louis,MO,USA). Cetrimide (C16H33N(Br)(CH3)3)also known as cetyltrimethylammonium bromide is abbreviated toCET in this study and was purchased from Sigma-Aldrich (St Louis,MO, USA).
2.2. Expression and purification of SMR proteins
SugE protein over-accumulation was performed using the E. colicell strain LE392Δunc transformed with pMS119EH plasmid encodingan unmodified copy of the E. coli sugE gene [12]. Overnight cultures(14–16 h) were diluted 10−2 into 6 L of terrific broth and 100 μg/mlampicillin grown in a shaking incubator at 37 °C until an opticaldensity at 600 nm (OD600 nm) of ~0.5 units was reached. Cultures withan OD600 nm of 0.5 were induced with isopropyl thio β-galactoside(IPTG) to a final concentration of 0.1 mM IPTG to express eitherrecombinant SMR gene using the Ptac promoter. Cells were grown at37 °C for an additional 3 h after induction, harvested by centrifugationat 4000×g, and stored frozen at −70 °C in SMR-A buffer (50 mMMOPS, 8% glycerol, 5 mM EDTA, 1 mM dithiothreitol (DTT), pH 7). Thefrozen cell slurry was thawed at 4 °C and a final concentration of0.1 mM phenylmethyl sulphonylfluoride (PMSF) was added to theslurry to inhibit proteolysis. Each cell slurry was French pressed at800–1000 psi using a Sim-Aminco French Press instrument and sub-sequently centrifuged at 11000×g for 10 min at 4 °C to remove un-broken cells. This cell free lysate was ultracentrifuged in a Beckman-Coulter Optima™ L-90 K Ultracentrifuge at 40000 rpm for 90 minat 4 °C in a Ti70 rotor to separate the membrane pellets from thecytosolic fraction. Membrane pellets were re-suspended in SMR-Abuffer at a total protein concentration of 10 mg/ml accordingmodifiedLowry Assays [27] and frozen in liquid N2 for storage at −70 °C.
Frozenmembrane preparations were thawed at room temperature(20–25 °C) and hydrophobic SugE proteins therein were organicallyextracted into 3:1 chloroform:methanol according to the proceduredescribed by Winstone et al.[28]. Membrane extractions were con-centrated to 4–10 ml using a Rotovap condenser system (SAVANT).SugE protein purification was performed by fast pressure liquidchromatography (FPLC) on an AKTA™ Unicorn instrument using anLH20 sephadex resin SR10/50 column in 1:1 chloroform:methanolsolvent. SugE protein eluted within the first peak as monitored by UVabsorption at 280 nm (A280nm). SugE protein fractions were pooledtogether at concentrations ranging from 0.01 mg/ml to 10 mg/mlprotein, dried under N2 gas and stored at −20 °C.
2.3. Detergent and solvent resuspension of SMR protein
Dried SugE proteins at a variety of initial starting concentrations,ranging from 0.001 mg to 15 mg protein, were used for these ex-periments. SugE proteins were resuspended into one of two de-tergents, 35 mM (1.0% w/v) SDS or 3.9 mM (0.2% w/v) DDM in SMR-Bbuffer (5 mM MOPS, 10 mM NaCl, 10 μM DTT, pH 7), or in thedenaturing detergent–solvent mixture 10 M urea, 175 mM (5.0% w/v)SDS. Protein resuspension solutions were shaken for 1–2 h and thenstored frozen at −20 °C. Thawed protein samples were mixed byvortexing for 1 min before they were sonicated to optical clarityusing three, 10 second bursts of 30% intensity using the Microson XLUltrasonic cell disrupter. Sonicated solutions were centrifuged at10 000×g at room temperature for 10 min to pellet any insolublematerial. SugE protein concentrations were determined by its ab-sorbance at A280nm using the appropriate extinction co-efficient (ε) foreach protein (SugE 24980 cm−1 M−1). All ultraviolet (UV) absor-bance (Abs) spectra were collected in 1 cm pathlength cell with anOcean Optics UV–visible (Vis)-Spectrophotometer.
Two QCC, cetylpyridinium chloride (CTP) and cetrimide (CET), wereselected for this study based on previous ligand binding studies [11] andhost resistance experiments involving SugE protein [8] (Supplementary
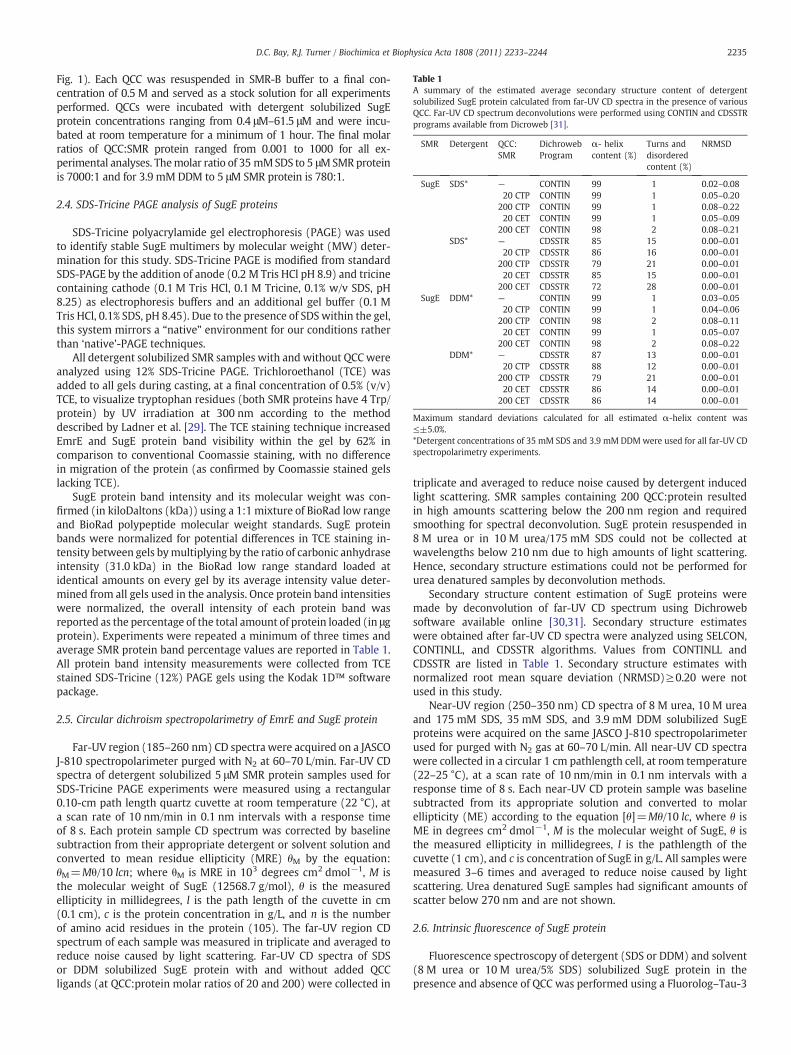
Table 1A summary of the estimated average secondary structure content of detergentsolubilized SugE protein calculated from far-UV CD spectra in the presence of variousQCC. Far-UV CD spectrum deconvolutions were performed using CONTIN and CDSSTRprograms available from Dicroweb [31].
SMR Detergent QCC:SMR
DichrowebProgram
α- helixcontent (%)
Turns anddisorderedcontent (%)
NRMSD
SugE SDS* — CONTIN 99 1 0.02–0.0820 CTP CONTIN 99 1 0.05–0.20
200 CTP CONTIN 99 1 0.08–0.2220 CET CONTIN 99 1 0.05–0.09
200 CET CONTIN 98 2 0.08–0.21SDS* — CDSSTR 85 15 0.00–0.01
20 CTP CDSSTR 86 16 0.00–0.01200 CTP CDSSTR 79 21 0.00–0.0120 CET CDSSTR 85 15 0.00–0.01
200 CET CDSSTR 72 28 0.00–0.01SugE DDM* — CONTIN 99 1 0.03–0.05
20 CTP CONTIN 99 1 0.04–0.06200 CTP CONTIN 98 2 0.08–0.1120 CET CONTIN 99 1 0.05–0.07
200 CET CONTIN 98 2 0.08–0.22DDM* — CDSSTR 87 13 0.00–0.01
20 CTP CDSSTR 88 12 0.00–0.01200 CTP CDSSTR 79 21 0.00–0.0120 CET CDSSTR 86 14 0.00–0.01
200 CET CDSSTR 86 14 0.00–0.01
Maximum standard deviations calculated for all estimated α-helix content was≤±5.0%.*Detergent concentrations of 35 mM SDS and 3.9 mM DDMwere used for all far-UV CDspectropolarimetry experiments.
2235D.C. Bay, R.J. Turner / Biochimica et Biophysica Acta 1808 (2011) 2233–2244
Fig. 1). Each QCC was resuspended in SMR-B buffer to a final con-centration of 0.5 M and served as a stock solution for all experimentsperformed. QCCs were incubated with detergent solubilized SugEprotein concentrations ranging from 0.4 μM–61.5 μM and were incu-bated at room temperature for a minimum of 1 hour. The final molarratios of QCC:SMR protein ranged from 0.001 to 1000 for all ex-perimental analyses. Themolar ratio of 35 mMSDS to 5 μMSMR proteinis 7000:1 and for 3.9 mM DDM to 5 μM SMR protein is 780:1.
2.4. SDS-Tricine PAGE analysis of SugE proteins
SDS-Tricine polyacrylamide gel electrophoresis (PAGE) was usedto identify stable SugE multimers by molecular weight (MW) deter-mination for this study. SDS-Tricine PAGE is modified from standardSDS-PAGE by the addition of anode (0.2 M Tris HCl pH 8.9) and tricinecontaining cathode (0.1 M Tris HCl, 0.1 M Tricine, 0.1% w/v SDS, pH8.25) as electrophoresis buffers and an additional gel buffer (0.1 MTris HCl, 0.1% SDS, pH 8.45). Due to the presence of SDS within the gel,this system mirrors a “native” environment for our conditions ratherthan ‘native’-PAGE techniques.
All detergent solubilized SMR samples with and without QCC wereanalyzed using 12% SDS-Tricine PAGE. Trichloroethanol (TCE) wasadded to all gels during casting, at a final concentration of 0.5% (v/v)TCE, to visualize tryptophan residues (both SMR proteins have 4 Trp/protein) by UV irradiation at 300 nm according to the methoddescribed by Ladner et al. [29]. The TCE staining technique increasedEmrE and SugE protein band visibility within the gel by 62% incomparison to conventional Coomassie staining, with no differencein migration of the protein (as confirmed by Coomassie stained gelslacking TCE).
SugE protein band intensity and its molecular weight was con-firmed (in kiloDaltons (kDa)) using a 1:1 mixture of BioRad low rangeand BioRad polypeptide molecular weight standards. SugE proteinbands were normalized for potential differences in TCE staining in-tensity between gels bymultiplying by the ratio of carbonic anhydraseintensity (31.0 kDa) in the BioRad low range standard loaded atidentical amounts on every gel by its average intensity value deter-mined from all gels used in the analysis. Once protein band intensitieswere normalized, the overall intensity of each protein band wasreported as the percentage of the total amount of protein loaded (in μgprotein). Experiments were repeated a minimum of three times andaverage SMR protein band percentage values are reported in Table 1.All protein band intensity measurements were collected from TCEstained SDS-Tricine (12%) PAGE gels using the Kodak 1D™ softwarepackage.
2.5. Circular dichroism spectropolarimetry of EmrE and SugE protein
Far-UV region (185–260 nm) CD spectra were acquired on a JASCOJ-810 spectropolarimeter purged with N2 at 60–70 L/min. Far-UV CDspectra of detergent solubilized 5 μΜ SMR protein samples used forSDS-Tricine PAGE experiments were measured using a rectangular0.10-cm path length quartz cuvette at room temperature (22 °C), ata scan rate of 10 nm/min in 0.1 nm intervals with a response timeof 8 s. Each protein sample CD spectrum was corrected by baselinesubtraction from their appropriate detergent or solvent solution andconverted to mean residue ellipticity (MRE) θM by the equation:θM=Mθ/10 lcn; where θM is MRE in 103 degrees cm2 dmol−1, M isthe molecular weight of SugE (12568.7 g/mol), θ is the measuredellipticity in millidegrees, l is the path length of the cuvette in cm(0.1 cm), c is the protein concentration in g/L, and n is the numberof amino acid residues in the protein (105). The far-UV region CDspectrum of each sample was measured in triplicate and averaged toreduce noise caused by light scattering. Far-UV CD spectra of SDSor DDM solubilized SugE protein with and without added QCCligands (at QCC:protein molar ratios of 20 and 200) were collected in
triplicate and averaged to reduce noise caused by detergent inducedlight scattering. SMR samples containing 200 QCC:protein resultedin high amounts scattering below the 200 nm region and requiredsmoothing for spectral deconvolution. SugE protein resuspended in8 M urea or in 10 M urea/175 mM SDS could not be collected atwavelengths below 210 nm due to high amounts of light scattering.Hence, secondary structure estimations could not be performed forurea denatured samples by deconvolution methods.
Secondary structure content estimation of SugE proteins weremade by deconvolution of far-UV CD spectrum using Dichrowebsoftware available online [30,31]. Secondary structure estimateswere obtained after far-UV CD spectra were analyzed using SELCON,CONTINLL, and CDSSTR algorithms. Values from CONTINLL andCDSSTR are listed in Table 1. Secondary structure estimates withnormalized root mean square deviation (NRMSD)≥0.20 were notused in this study.
Near-UV region (250–350 nm) CD spectra of 8 M urea, 10 M ureaand 175 mM SDS, 35 mM SDS, and 3.9 mM DDM solubilized SugEproteins were acquired on the same JASCO J-810 spectropolarimeterused for purged with N2 gas at 60–70 L/min. All near-UV CD spectrawere collected in a circular 1 cm pathlength cell, at room temperature(22–25 °C), at a scan rate of 10 nm/min in 0.1 nm intervals with aresponse time of 8 s. Each near-UV CD protein sample was baselinesubtracted from its appropriate solution and converted to molarellipticity (ME) according to the equation [θ]=Mθ/10 lc, where θ isME in degrees cm2 dmol−1, M is the molecular weight of SugE, θ isthe measured ellipticity in millidegrees, l is the pathlength of thecuvette (1 cm), and c is concentration of SugE in g/L. All samples weremeasured 3–6 times and averaged to reduce noise caused by lightscattering. Urea denatured SugE samples had significant amounts ofscatter below 270 nm and are not shown.
2.6. Intrinsic fluorescence of SugE protein
Fluorescence spectroscopy of detergent (SDS or DDM) and solvent(8 M urea or 10 M urea/5% SDS) solubilized SugE protein in thepresence and absence of QCC was performed using a Fluorolog–Tau-3
2236 D.C. Bay, R.J. Turner / Biochimica et Biophysica Acta 1808 (2011) 2233–2244
Time-resolved spectrofluorometer. Fluorescent spectra were collectedin either a 3 mm or 10 mm pathlength quartz cuvette at excitation(Ex) wavelengths of 280 nm or 295 nm. The emission (Em) spectrumwas measured from 290 to 400 nm (Ex 280 nm) or 310 to 400 nm (Ex295) using double monochrometers for both Ex and Em to reducescattering artefacts. Both Ex and Em for all samples were collectedusing a 1 nm to 2 nm slit width and all spectra were the average of6 scans. Fluorescence spectroscopy of SDS, DDM, 10 M urea–175 mMSDS and 8 M urea solubilized SMR proteins were performed aminimum of triplicate for each QCC tested.
Detergent solubilized SugE protein preparations used for SDS-Tricine PAGE experiments were diluted to 1.1 μM SugE protein and allfluorescence spectra were collected in a 10 mm pathlength quartzcuvette. QCC, CTP and CET were added to SDS and DDM solubilizedSugE protein samples at molar ratios of QCC:protein ranging from0.001–1000. Final QCC concentrations used for Trp quenchingfluorescence experiments ranged from 0.01 μM to 5000 μM for eachcompound.
To address whether the Cl− or Br− counter ion of each QCC+ hadany quenching affects on Trp quenching within the detergentsolubilized SugE protein samples, the experiments described earlierwere repeated using the same molar concentrations of NaCl and KBrsalts in lieu of QCC+. Fluorescent spectra collected from SugE proteinsamples showed no alteration in Trp Em intensity or in its Trpmaximafrom samples lacking ligand during these experiments (data notshown). The fluorescent intensity maximum of Tyr occurs at 300–305 nm and the Tyr contribution within the overall fluorescentspectrum was only observed as a defined shoulder in experimentsinvolving amino acidmodel compounds at or above 4W:5Y ratios only(data not shown).
2.7. Tyrosine exposure (Yexp) of SugE protein by second derivative UV(SDUV) analysis
Tyrosine exposure (Yexp) was determined using second-orderderivative UV absorption (SDUV) analysis according to the methoddescribed by Ragone et al.[32]. Briefly, this method provides anestimation of total Tyr residues within a protein that are exposedto hydrophilic environments through the second-order derivativeconversion of its UV absorption spectrum. Tyr and Trp residues in aprotein both absorb wavelengths from 280 to 285 nm, while a secondpeak is derived solely from Trp absorbance occurs from 291 to297 nm. The absorbance maximum of Tyr is variable depending onthe polarity of its surrounding environment. Increasing the hydro-philicity of the surrounding environment of Tyr will result in spectralred-shifts to the 283 nm wavelength region due to alterations inthe
1La state across the Tyr phenol ring. UV absorption of the Trp
indole ring (1Lb and
1La components) is indiscernible by UV Abs since
both1La→
1Lb transitions are nearly equivalent and makes any spec-
tral shifts in wavelength insensitive to polarity in the 290 nm region[32]. Therefore, red-shifted Tyr absorbance will decrease its signalat 283 nm in a second-order UV spectrum relative to that of Trp at291 nm (Supplementary Fig. 2). Hence, determining the ratio ofthese wavelength distance troughs (r) reflects the hydrophilicity ofthe Tyr environment within the protein; low r values indicate en-hanced hydrophobicity to the surrounding Tyr environments withinthe protein.
Yexp was calculated using the average of 4–6 UV absorption spectraof each detergent (SDS or DDM) solubilized SugE protein sample in thepresence or absence of either QCC used for CD analysis. UV absorptionspectra of model amino acid compounds, N-acetyl-tryptophan amide(NAWA), N-acetyl-tyrosine amide (NAYA), N-acetyl-tryptophan ethylester (NAWE), and N-acetyl tyrosine ethyl ester (NAYE) weremeasured for use as SugE Yexp controls. Mixtures of each model Trpand Tyr compound set (NAWA:NAYA and NAWE:NAYE) wereprepared at the same molar ratios present within SugE (4W:2Y)
protein in the solvents 8 M urea, H2O, and ethylene glycol (EG). Modelcompound mixtures in the polar solvents, 8 M urea and H2O, serve ascomplete Tyr exposure controls, whereas EG mimics the hydrophobicinterior of a protein [33]. All UV absorbance spectra were measured inquadruplet for each sample in a 1 cm quartz cuvette, at 0.2 nmwavelength intervals, from 250 nm to 320 nm using an Ocean OpticsUV–visible (Vis)-Spectrophotometer.
Each second-order derivative UV spectrum was calculated fromthe average UV absorbance spectrum for given sample at 0.5 nmwavelength intervals from 250 to 320 nm using a moving window of3.5–5.5 nm. SDUV spectra was used to determine r, the ratio of shortTyr (283 nm) to long Trp (291 nm) wavelength trough depths. For agiven detergent, the SugE Yexp was calculated using the equationYexp=(rn−ra)/(ru−ra). In this equation, rn is the r value determinedfor SMR protein in a particular detergent (SDS or DDM), ra is r value of4W:2Y mixtures of NAWA:NAYA or NAWE:NAYE in EG, and ru is rvalue of 4W:2Y in 8 M urea. Typically, ru values are calculated usingcompletely denatured protein samples, however, complete denatur-ation of SugE protein was not possible due to the extremehydrophobicity of the protein. As a result, model compound mixtureswere used for ru values in all Yexp calculations for this study.
3. Results
3.1. SugE protein resuspension in SDS orDDMpromotes distinctmultimericstates of the protein
Previous ligand binding and site-directed mutagenesis studies ofunmodified SugE protein (lacking any additional tags or amino acidsequence changes) were performed using protein purified via anorganic extraction method [11,12]. This method was selected for ouranalysis to allow direct comparison to previous SugE studies. Weacknowledge that this method of SMR purification, like any othermembrane extraction purification which relies on detergents orruptured membranes, may result in protein folding artefacts.However, previous analysis of organically extracted SMR protein,EmrE, has revealed that this resilient membrane protein can stillmaintain high levels of α-helix in a variety of solvents, detergents andphospholipids [34] and demonstrates ethidium transport activitywhen reconstituted into artificial lipid systems [28]. SugE purified in asimilarmanner to EmrE [28,34] can be reconstituted into lipid vesiclesand demonstrate transport [12]. Additionally the ligand binding hasbeen evaluated both in detergent and vesicles by ITC showing SugEdissociation constants (KD in μM ) for methyl viologen to be 24.9, 54.0,and 5.3, in lipopsomes, DDM, and SDS respectively [11]. Since SugEprotein can bind QCC in SDS, it provides a tool to evaluate anymultimeric forms of this protein using SDS-PAGE as a ‘native’technique for this integral membrane protein. This demonstratesthat the purification method does not interfere with the proteinsability to adopt a conformation and structure for ligand binding andactive transport in the detergents studied.
SDS-Tricine PAGE analysis was performed using SugE proteinresuspended in two detergents, SDS and DDM. Both SDS and DDMwere used in previous biochemical and biophysical experiments ofSMR proteins, including EmrE (as reviewed by [3]). DDM is commonlyused for EmrE protein biochemical and biophysical studies and thisdetergent is considered to promote a native-like conformation ofEmrE [35]. SDS is also included in these studies as an alternativemembrane mimetic system since previous experiments of SDSsolubilized EmrE proteins demonstrated that the detergent promotessecondary and tertiary structures within the protein [36]. Blue-nativeand native PAGE techniques were attempted for this study, but failedto reliably resolve SMR complexes likely due to the variation in bounddetergent and QCC, as well as poor dye binding by the highlyhydrophobic SMR proteins that prohibited band resolution duringelectrophoresis. Hence, SugE protein resuspended in either SDS or
2237D.C. Bay, R.J. Turner / Biochimica et Biophysica Acta 1808 (2011) 2233–2244
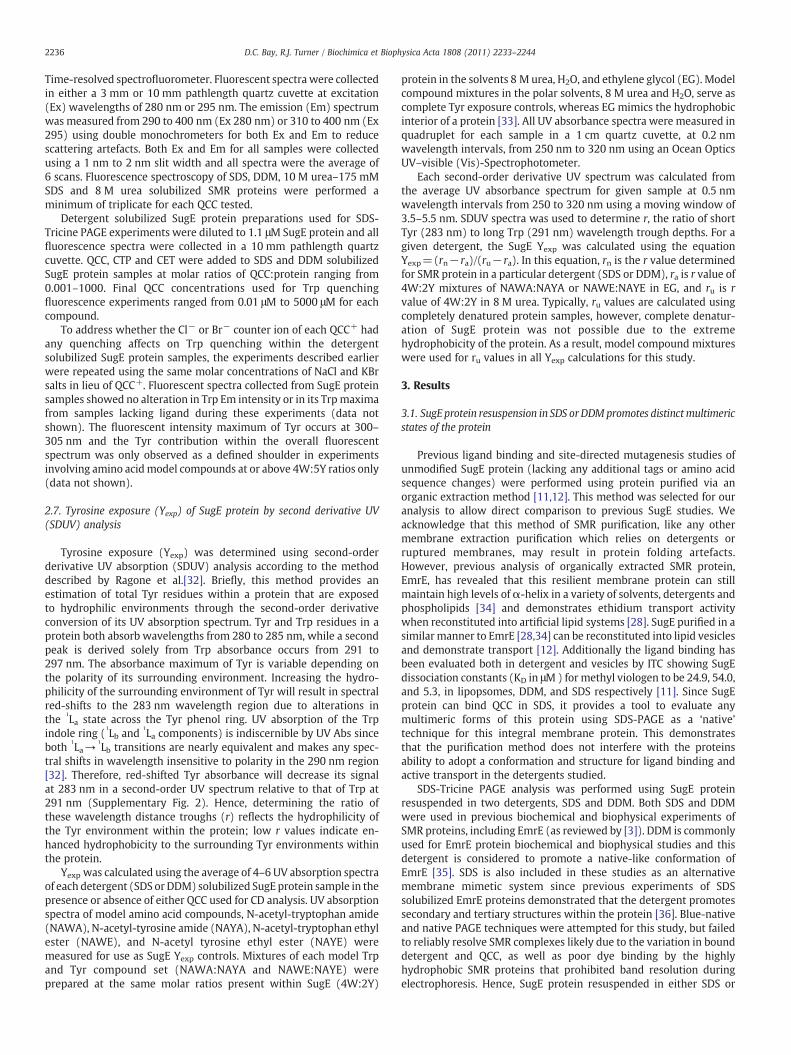
DDM was separated by SDS-Tricine PAGE to confirm the molecularweight of the protein, assess its purity, and determine its oligomer-ization. In Fig. 1, SDS-Tricine PAGE separation of either SDS or DDMsolubilized SugE protein indicates that the majority of the proteinresides as a monomer that corresponds to ~10–11 kDa protein bandwithin the gel. Comparison of SDS or DDM solubilized SugE protein atidentical concentrations (5 or 21 μM SugE) after SDS-Tricine PAGEseparation revealed that only the SDS-SugE preparations produced anadditional protein band from the monomer corresponding to 21 kDawithin the gel. Quantification of all SDS-SugE protein band intensitiesby TCE gel staining demonstrated that this 21 kDa dimer band was20–35% of the total separated SugE protein in the gel lane at or above31 μM protein concentration (Supplemental Fig. 3) but was signifi-cantly reduced to 7–15% total SugE protein at 21 μM protein (Fig. 1).The dimer band observed in SDS-SugE preparations only visualized inDDM-SugE samples with SDS-Tricine PAGE analysis at concentrationsof ≥31 μM protein (Supplementary Fig. 3). However, even at higherSugE protein concentrations in DDM, quantification of individual SugEprotein band intensities from these gels was much lower (DDM-SugEdimer bands were less than 10% of the total protein band intensity inthe gel lane) than SDS induced SugE dimers. Hence, SDS-Tricine PAGEanalysis of SDS or DDM solubilized SugE proteins reveals that only SDSdetergent was capable of promoting and or stabilizing a multimericdimer form of SugE.
26.6
14.4
31.045.066.297.4
116.2
MW (kDa)
21.5
200.0
B
0 5 25 50 250
500
5 25 50 250
500
CTP: SugE CET: SugE
A
31.0
45.066.297.4
116.2
0 5 25 50 250
500
5 25 50 250
500
CTP: SugE CET: SugE
21.514.4
MW (kDa)
M
D
M
Fig. 1. SDS-Tricine PAGE of SDS and DDM solubilized SugE protein multimerization inthe presence of CTP and CET. SugE proteins were separated by SDS-Tricine PAGE (12%)and visualized by UV absorbance after trichloroethanol (TCE) staining. Panel A shows aTCE stained SDS-Tricine PAGE gel of 35 mM SDS solubilized SugE protein (15 μgprotein/ lane) with increasing QCC:SugE molar ratio (μM). Labelled arrows to the right-hand side of each gel arrows correspond to predicted protein multimers based on theestimated molecular weight (MW) in kiloDaltons (kDa) in the first lane; monomer (M)and dimer (D). Panel B shows TCE stained SDS-Tricine PAGE of 3.9 mMDDM solubilizedSugE protein (15 μg protein/lane) in the presence of increasing QCC according to themolar ratio of QCC:SugE.
To determine if QCC has any influence on the separation ormultimerization of SugE protein in either SDS or DDM, CET or CTPligands were individually incubated with detergent solubilized SugEsamples at increasing concentrations and examined by SDS-TricinePAGE. A previous study, examining the mulimerization of the relatedSMR protein EmrE in SDS by SDS-Tricine PAGE analysis revealed thatEmrE multimers were enhanced in presence of increasing QCCtetraphenyl phosphonium [36]. To determine if a similar influence isobserved for SDS-SugE protein, QCC to SugEmolar ratios ranging from5 to 500 were prepared and analyzed SDS-Tricine PAGE and shown inFig. 1. In Fig. 1, Both SDS- and DDM-SugE preparations incubated withCET or CTP ligand at all molar ratios tested did not demonstrate anyincrease in protein band intensity of dimer that exceeded thecalculated error from repeated experiments. Furthermore, QCCincubationwith SDS or DDM solubilized SugE protein did not promoteadditional proteins bands from those lacking ligand (Fig. 1A and B).However, the addition of CET above 250 QCC:1 SugE molar ratios toDDM-SugE preparations resulted in a slight migration shift of themonomeric band from 10 kDa to 12–14 kDa within SDS-Tricine PAGEgels (Fig. 1B). A similar shift of the monomeric SugE protein band inDDM preparations was also observed by PAGE analysis after CTPaddition to QCC:SugE samples at molar ratios above 250. The slightshift in SugE monomer migration at high QCC:protein ratios (≥250)are likely due to a conformational change within the protein inducedby either QCC that caused a decrease in the electrophoretic mobility ofSugE. An alternative explanation for the slight shift of the detergentsolubilized SugE monomer protein band after PAGE may be caused byinteractions between cationic ligands which are present at highconcentrations with anionic SDS present in the gel itself. This effectbetween either CTP or CET with SDS results in a white precipitate atdetergent:QCC molar ratio of ≥7. However, electrophoresis of bovineserum albumin (BSA) protein resuspended in either SDS or DDMfailed to demonstrate a protein band shift (at 66 kDa) when incubatedwith either ligand at identical QCC:proteinmolar ratios by SDS-TricinePAGE (data not shown). Therefore, both CTP and CET ligandsmay alterthe conformation of the detergent solubilized SugE proteins but not itsmultimeric states.
3.2. The α-helix content of SugE remains high in SDS or DDM and is notdiminished by ligands
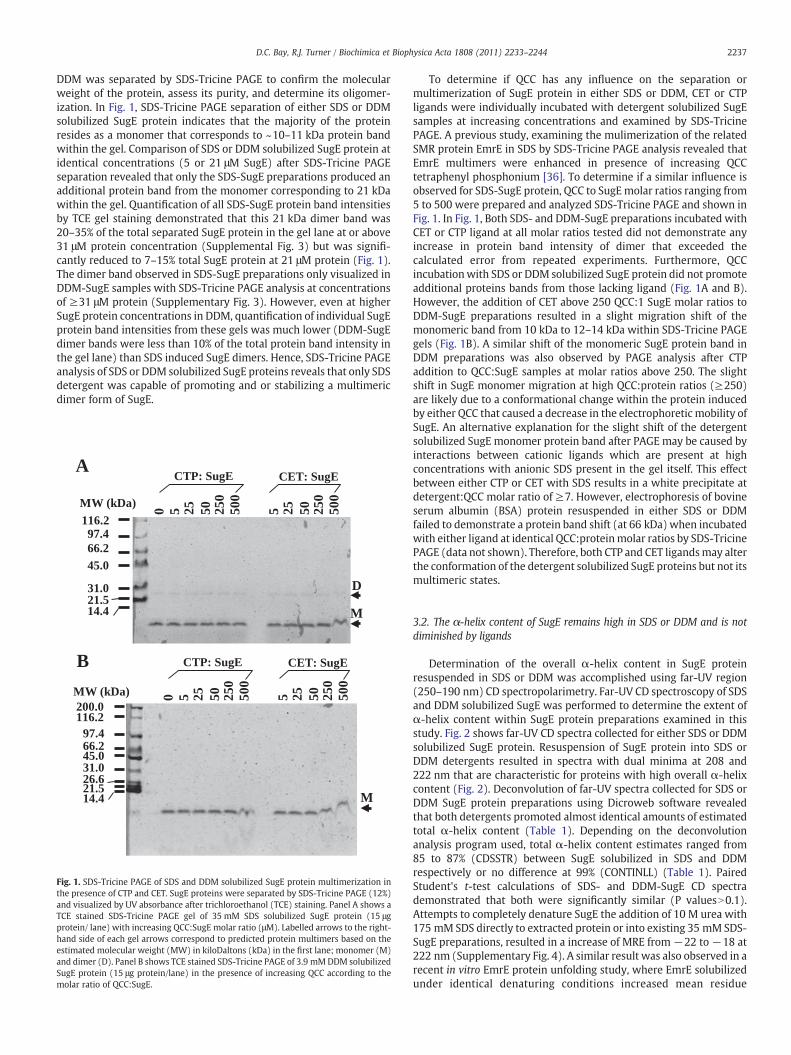
Determination of the overall α-helix content in SugE proteinresuspended in SDS or DDM was accomplished using far-UV region(250–190 nm) CD spectropolarimetry. Far-UV CD spectroscopy of SDSand DDM solubilized SugE was performed to determine the extent ofα-helix content within SugE protein preparations examined in thisstudy. Fig. 2 shows far-UV CD spectra collected for either SDS or DDMsolubilized SugE protein. Resuspension of SugE protein into SDS orDDM detergents resulted in spectra with dual minima at 208 and222 nm that are characteristic for proteins with high overall α-helixcontent (Fig. 2). Deconvolution of far-UV spectra collected for SDS orDDM SugE protein preparations using Dicroweb software revealedthat both detergents promoted almost identical amounts of estimatedtotal α-helix content (Table 1). Depending on the deconvolutionanalysis program used, total α-helix content estimates ranged from85 to 87% (CDSSTR) between SugE solubilized in SDS and DDMrespectively or no difference at 99% (CONTINLL) (Table 1). PairedStudent's t-test calculations of SDS- and DDM-SugE CD spectrademonstrated that both were significantly similar (P valuesN0.1).Attempts to completely denature SugE the addition of 10 M urea with175 mM SDS directly to extracted protein or into existing 35 mM SDS-SugE preparations, resulted in a increase of MRE from−22 to−18 at222 nm (Supplementary Fig. 4). A similar result was also observed in arecent in vitro EmrE protein unfolding study, where EmrE solubilizedunder identical denaturing conditions increased mean residue
2238 D.C. Bay, R.J. Turner / Biochimica et Biophysica Acta 1808 (2011) 2233–2244
ellipticity at 222 nm in comparison to DDM-EmrE far-UV CD spectra[35].
Fig. 2 shows highly similar far-UV region CD spectra that did notdemonstrate any changes in minima or increases in MRE collected forSDS or DDM-SugE preparations incubated with either QCC ligand atmolar ratio of 20 and 200 (Table 1). CD spectrum deconvolution usingthe program CDSSTR estimated that only slight α-helix content losses(3-6%) occurred within the protein in the presence of ligand, even atthe highest molar ratio of QCC:protein tested (200) for either ligand(Table 1). Estimated losses in α-helix content were also extremelylow (1–2%) for far-UV CD spectra deconvoluted by CONTINL. Based oncalculated NRMSD values derived from both analyses, it would appearthat the α-helix estimations provided by CDSSTR may be morereliable for SugE secondary structure determination.
3.3. Tertiary structure arrangements of aromatic residues in SugE in thepresence of CTP and CET differ at high QCC concentration
The overall secondary structure of SugE protein in SDS or DDM issimilar and high in overall α-helix content. To confirm if the tertiarystructure arrangements within SugE in SDS or DDM are similar near-UV region (250–400 nm) CD spectropolarimetry was performed toexamine the environments of the aromatic residues within theprotein (Fig. 3). Each aromatic amino acid contributes significantellipticity (either positive or negative depending on their environ-ment within the protein) at particular wavelengths; signals from Pheoccur within 250–270 nm, signals from Tyr occur within 270–290 nmand those from Trp occur within 280–300 nm regions in a near-UV CDspectrum. Since SugE protein lacks Cys, the contribution fromdisulfide bonds which give rise to broad weak signals throughoutthe near-UV spectrum are not a factor and all signal is produced by
190 200 210 220 230 240Wavelength (nm)
190 200 210 220 230 240Wavelength (nm)
-30
-20
-10
0
10
20
30
40
50
60
MR
E θ
(deg
rees
· cm
2 · d
mol
-1
resi
due-1
x 10
3 )
-30
-20
-10
0
10
20
30
40
50
60
MR
E θ
(deg
rees
· cm
2 · d
mol
-1
resi
due-1
x 10
3 )
A
C
Fig. 2. Far-UV region (190–245 nm) CD spectra of SDS or DDM solubilized SugE protein in tidentical concentrations of 5 μM protein for all far-UV CD spectra shown in the figure. A) Far200 CTP:SugE (dotted line) are shown. B) Far-UV CD spectra of DDM-SugE protein at 0 CTalteration of far-UV CD spectra measured for SDS-SugE protein at 0 CET:SugE (solid line), 2spectra of 3.9 mM DDM-SugE are observed at 0 CET:SugE (solid line), 20 CET:SugE (dashed
aromatic residues only (as reviewed by [37]). It is also expected thatSugE Trp absorptionwill predominate over all other aromatic residueswithin the protein due to its 4 Trp to 2 Tyr stoichiometry and byits ε value of 5600 cm−1 M−1 which is 4 times greater than Tyr ε1450 cm−1 M−1. Measurement of the near-UV region by CD spectro-polarimetry was used to determine the extent of tertiary structuresimilarities of SugE aromatic residues (4 Trp, 2 Tyr, and 1 Phe) in bothdetergents.
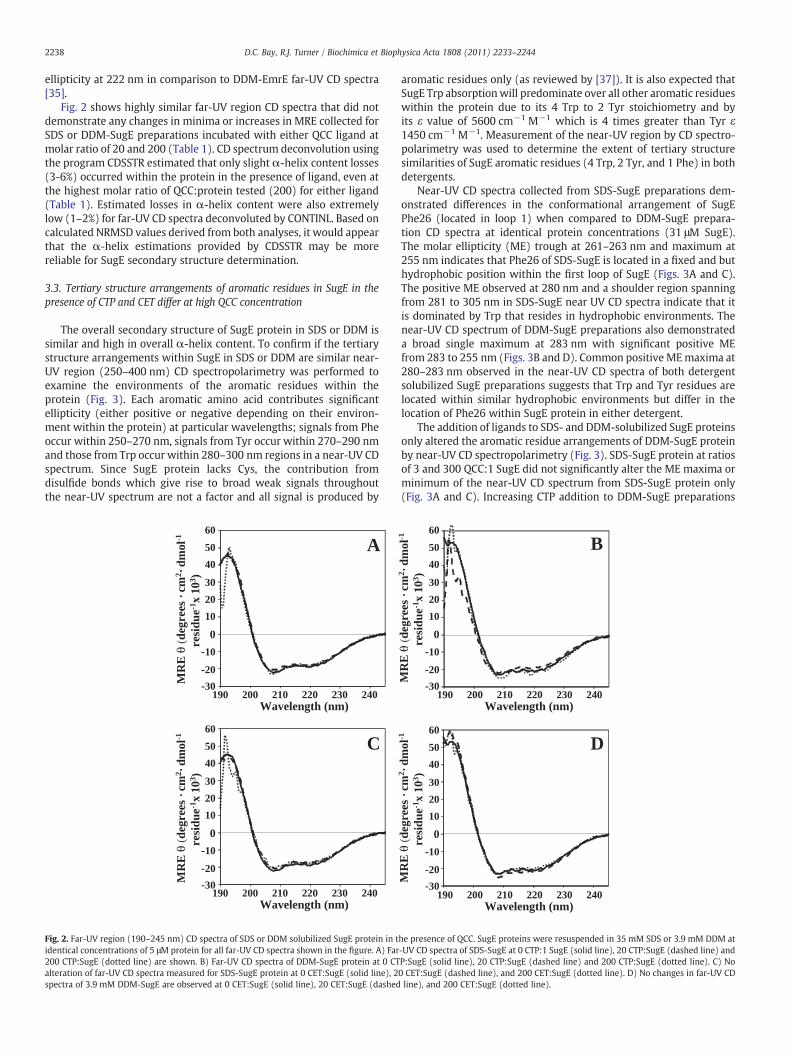
Near-UV CD spectra collected from SDS-SugE preparations dem-onstrated differences in the conformational arrangement of SugEPhe26 (located in loop 1) when compared to DDM-SugE prepara-tion CD spectra at identical protein concentrations (31 μM SugE).The molar ellipticity (ME) trough at 261–263 nm and maximum at255 nm indicates that Phe26 of SDS-SugE is located in a fixed and buthydrophobic position within the first loop of SugE (Figs. 3A and C).The positive ME observed at 280 nm and a shoulder region spanningfrom 281 to 305 nm in SDS-SugE near UV CD spectra indicate that itis dominated by Trp that resides in hydrophobic environments. Thenear-UV CD spectrum of DDM-SugE preparations also demonstrateda broad single maximum at 283 nm with significant positive MEfrom 283 to 255 nm (Figs. 3B and D). Common positive MEmaxima at280–283 nm observed in the near-UV CD spectra of both detergentsolubilized SugE preparations suggests that Trp and Tyr residues arelocated within similar hydrophobic environments but differ in thelocation of Phe26 within SugE protein in either detergent.
The addition of ligands to SDS- and DDM-solubilized SugE proteinsonly altered the aromatic residue arrangements of DDM-SugE proteinby near-UV CD spectropolarimetry (Fig. 3). SDS-SugE protein at ratiosof 3 and 300 QCC:1 SugE did not significantly alter the ME maxima orminimum of the near-UV CD spectrum from SDS-SugE protein only(Fig. 3A and C). Increasing CTP addition to DDM-SugE preparations
190 200 210 220 230 240Wavelength (nm)
190 200 210 220 230 240Wavelength (nm)
0
0
-30
-20
-10
10
20
30
40
50
60
B
D
MR
E θ
(deg
rees
· cm
2 · d
mol
-1
resi
due-1
x 10
3 )
-30
-20
-10
10
20
30
40
50
60
MR
E θ
(deg
rees
· cm
2 · d
mol
-1
resi
due-1
x 10
3 )
he presence of QCC. SugE proteins were resuspended in 35 mM SDS or 3.9 mM DDM at-UV CD spectra of SDS-SugE at 0 CTP:1 SugE (solid line), 20 CTP:SugE (dashed line) andP:SugE (solid line), 20 CTP:SugE (dashed line) and 200 CTP:SugE (dotted line). C) No0 CET:SugE (dashed line), and 200 CET:SugE (dotted line). D) No changes in far-UV CDline), and 200 CET:SugE (dotted line).
250 275 300 325 350 375 250Wavelength (nm)
-20000
2000400060008000
100001200014000
Mol
ar E
llipt
icit
y (θ
)M
olar
Elli
ptic
ity
(θ)
16000A
275 300 325 350 375 400Wavelength (nm)
B
250 275 300 325 350 375 250Wavelength (nm)
-20000
2000400060008000
10000120001400016000
C
275 300 325 350 375 400Wavelength (nm)
D
SugEDDM
3 CTP: SugE30 CTP: SugE
SugE3 CTP: SugE30 CTP: SugE
SDS
DDMSugE3 CET: SugE30 CET: SugE
SDSSugE3 CET: SugE30 CET: SugE
Fig. 3. Near-UV region (250–400 nm) CD spectra of SDS and DDM solubilized SugE in the presence of QCC. Near-UV CD spectra were measured from protein samples with identicalconcentrations of SugE (31 μM protein) in either 35 mM SDS (A and C) or 3.9 mM DDM (B and D). In both panels the near UV CD spectra of detergent solubilized SugE protein isshown at QCC:SugE molar ratios of 0 (solid black line), 3 (solid dark grey line) and 30 (light grey line). Panels A and B show near-UV CD spectra of CTP:SugE protein addition andpanels B and D show near-UV CD spectra of CET:SugE protein addition.
2239D.C. Bay, R.J. Turner / Biochimica et Biophysica Acta 1808 (2011) 2233–2244
resulted in a gradual loss of ME and a sharp maxima at 280 nm(3 CTP:1 SugE) and at 285 nm (30 CTP:1 SugE) indicating that Trpresidues are facing more hydrophilic environments (Fig. 3B). CETaddition to DDM-SugE protein resulted in near-UV CD spectra thatalso demonstrated a gradual loss of positive ellipticity with increasingligand but resulted in two maxima at 254 nm and 280–285 nmseparated by a minimum trough at 264–266 nm (Fig. 3D). Unlike CTP,CET addition to DDM-SugE appears to alter Phe26 exposure towards asimilar environment observed in the SDS-SugE conformation. How-ever, the position of Phe26 within the first loop becomes less fixedas CTP or CET concentration increases as shown by the gradual lossof ellipticity at 3 and 30 QCC:SugE in Fig. 3. This indicates that aro-matic residue environments, particularly Phe26, in DDM-SugE proteinrespond differently to each ligand, unlike aromatic residues of SugEprotein within SDS.
3.4. SugE Trp residues are located in hydrophobic environments in DDMand quenched differently by CET and CTP
Differences in Trp and Tyr contributions were not easily discern-able by near-UV CD spectropolarimetry alone. To specifically identifyTrp contributions from the overall conformational arrangement ofSugE protein in SDS and DDM, the intrinsic fluorescence of SugE ineither detergent was measured at excitation (Ex) wavelengths of280 nm and 295 nm. SugE protein has a total of 4 Trp residuespredicted within TM1 (W3 andW16), TM2 (W48) and TM3 (W62) inthe protein, but only W62 is conserved within EmrE at the sameposition (W63 and TM3 strand). The fluorescence emission of SugEprotein after Ex 295 nm provides information regarding Trp hydro-phobicity or hydrophilicity only within its surrounding environment.Excitation at 280 nm is useful for examining the surrounding envi-ronments of both Tyr and Trp. At Ex 280 nm, Trp fluorescence emis-sion predominates within the spectrum from 325 to 350 nm, whileTyr fluorescence may occur as a spectrum shoulder from 295 to310 nm if they are present in high amounts within the protein.
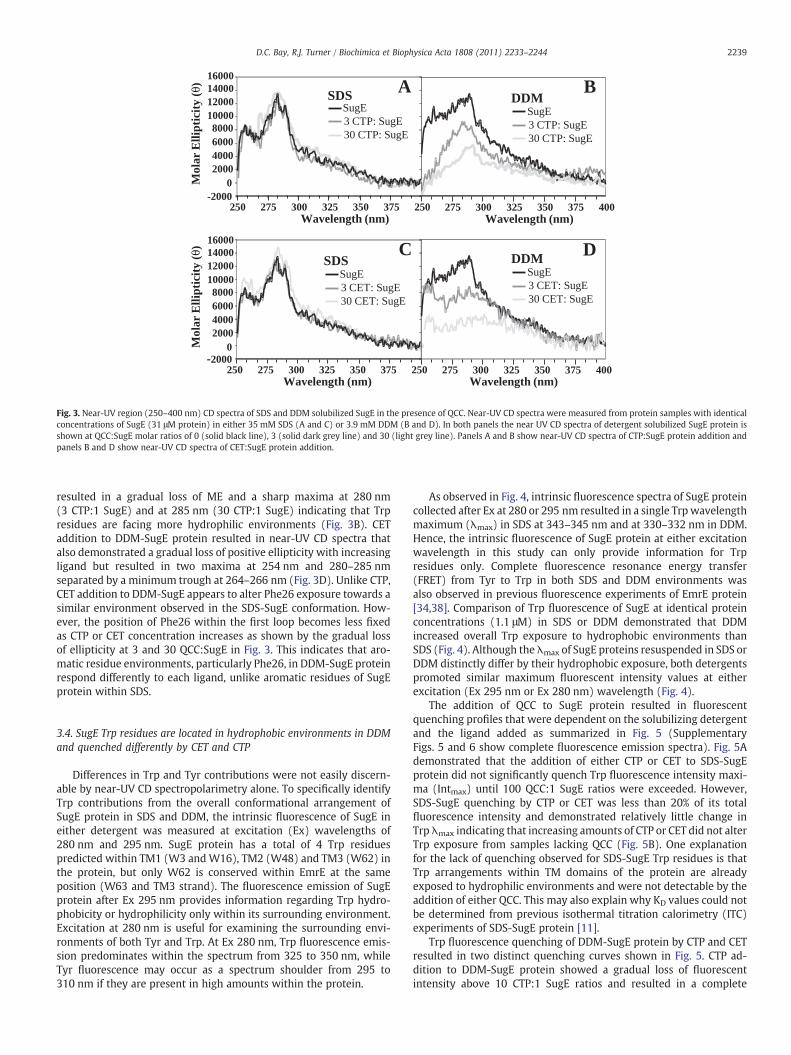
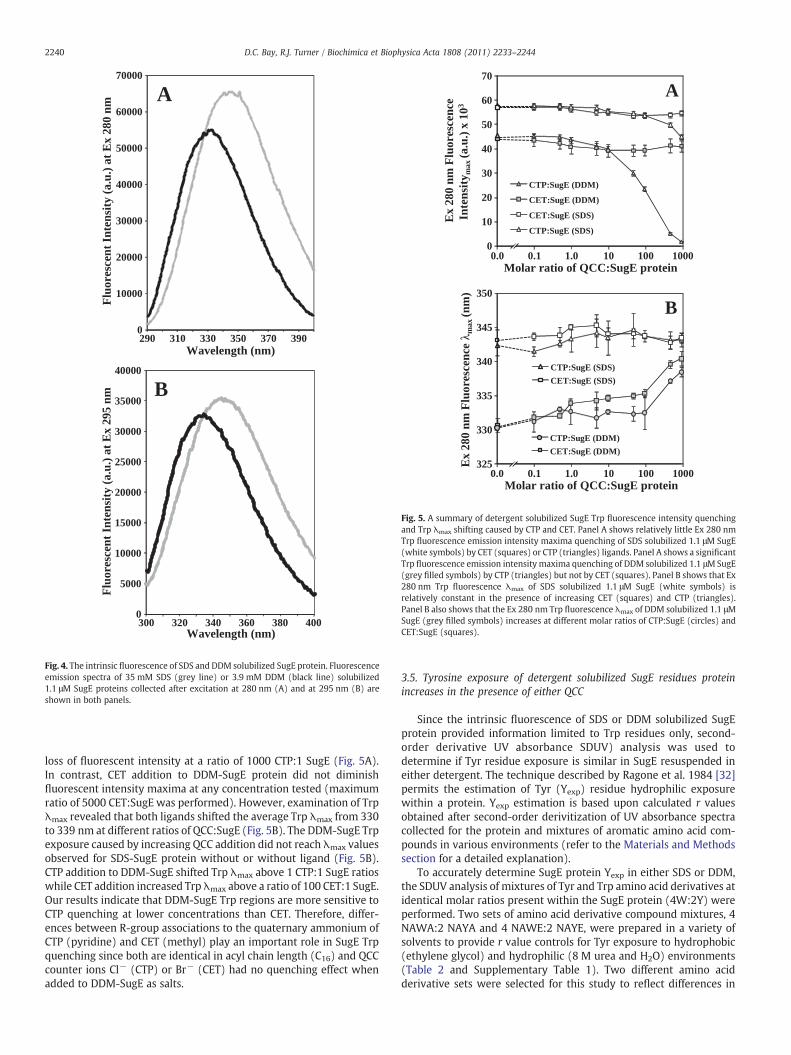
As observed in Fig. 4, intrinsic fluorescence spectra of SugE proteincollected after Ex at 280 or 295 nm resulted in a single Trpwavelengthmaximum (λmax) in SDS at 343–345 nm and at 330–332 nm in DDM.Hence, the intrinsic fluorescence of SugE protein at either excitationwavelength in this study can only provide information for Trpresidues only. Complete fluorescence resonance energy transfer(FRET) from Tyr to Trp in both SDS and DDM environments wasalso observed in previous fluorescence experiments of EmrE protein[34,38]. Comparison of Trp fluorescence of SugE at identical proteinconcentrations (1.1 μM) in SDS or DDM demonstrated that DDMincreased overall Trp exposure to hydrophobic environments thanSDS (Fig. 4). Although the λmax of SugE proteins resuspended in SDS orDDM distinctly differ by their hydrophobic exposure, both detergentspromoted similar maximum fluorescent intensity values at eitherexcitation (Ex 295 nm or Ex 280 nm) wavelength (Fig. 4).
The addition of QCC to SugE protein resulted in fluorescentquenching profiles that were dependent on the solubilizing detergentand the ligand added as summarized in Fig. 5 (SupplementaryFigs. 5 and 6 show complete fluorescence emission spectra). Fig. 5Ademonstrated that the addition of either CTP or CET to SDS-SugEprotein did not significantly quench Trp fluorescence intensity maxi-ma (Intmax) until 100 QCC:1 SugE ratios were exceeded. However,SDS-SugE quenching by CTP or CET was less than 20% of its totalfluorescence intensity and demonstrated relatively little change inTrp λmax indicating that increasing amounts of CTP or CET did not alterTrp exposure from samples lacking QCC (Fig. 5B). One explanationfor the lack of quenching observed for SDS-SugE Trp residues is thatTrp arrangements within TM domains of the protein are alreadyexposed to hydrophilic environments and were not detectable by theaddition of either QCC. This may also explain why KD values could notbe determined from previous isothermal titration calorimetry (ITC)experiments of SDS-SugE protein [11].
Trp fluorescence quenching of DDM-SugE protein by CTP and CETresulted in two distinct quenching curves shown in Fig. 5. CTP ad-dition to DDM-SugE protein showed a gradual loss of fluorescentintensity above 10 CTP:1 SugE ratios and resulted in a complete
0
10000
20000
30000
40000
50000
60000
70000
290 310 330 350 370 390
AF
luor
esce
nt I
nten
sity
(a.
u.)
at E
x 28
0 nm
Wavelength (nm)
0
5000
10000
15000
20000
25000
30000
35000
40000
Flu
ores
cent
Int
ensi
ty (
a.u.
) at
Ex
295
nm B
300 320 340 360 380 400Wavelength (nm)
Fig. 4. The intrinsic fluorescence of SDS and DDM solubilized SugE protein. Fluorescenceemission spectra of 35 mM SDS (grey line) or 3.9 mM DDM (black line) solubilized1.1 μM SugE proteins collected after excitation at 280 nm (A) and at 295 nm (B) areshown in both panels.
CTP:SugE (DDM)
CET:SugE (DDM)
CTP:SugE (SDS)
CET:SugE (SDS)
0
10
20
30
40
50
60
70
0.0 0.1 1.0 10 100 1000
CTP:SugE (DDM)
CET:SugE (DDM)
CET:SugE (SDS)
CTP:SugE (SDS)
325
330
335
340
345
350
0.0 0.1 1.0 10 100 1000E
x 28
0 nm
Flu
ores
cenc
e λ m
ax (n
m)
Molar ratio of QCC:SugE protein
Molar ratio of QCC:SugE protein
Ex
280
nm F
luor
esce
nce
Inte
nsit
y max
(a.u
.) x
103
A
B
Fig. 5. A summary of detergent solubilized SugE Trp fluorescence intensity quenchingand Trp λmax shifting caused by CTP and CET. Panel A shows relatively little Ex 280 nmTrp fluorescence emission intensity maxima quenching of SDS solubilized 1.1 μM SugE(white symbols) by CET (squares) or CTP (triangles) ligands. Panel A shows a significantTrp fluorescence emission intensity maxima quenching of DDM solubilized 1.1 μMSugE(grey filled symbols) by CTP (triangles) but not by CET (squares). Panel B shows that Ex280 nm Trp fluorescence λmax of SDS solubilized 1.1 μM SugE (white symbols) isrelatively constant in the presence of increasing CET (squares) and CTP (triangles).Panel B also shows that the Ex 280 nm Trp fluorescence λmax of DDM solubilized 1.1 μMSugE (grey filled symbols) increases at different molar ratios of CTP:SugE (circles) andCET:SugE (squares).
2240 D.C. Bay, R.J. Turner / Biochimica et Biophysica Acta 1808 (2011) 2233–2244
loss of fluorescent intensity at a ratio of 1000 CTP:1 SugE (Fig. 5A).In contrast, CET addition to DDM-SugE protein did not diminishfluorescent intensity maxima at any concentration tested (maximumratio of 5000 CET:SugE was performed). However, examination of Trpλmax revealed that both ligands shifted the average Trp λmax from 330to 339 nm at different ratios of QCC:SugE (Fig. 5B). The DDM-SugE Trpexposure caused by increasing QCC addition did not reach λmax valuesobserved for SDS-SugE protein without or without ligand (Fig. 5B).CTP addition to DDM-SugE shifted Trp λmax above 1 CTP:1 SugE ratioswhile CET addition increased Trp λmax above a ratio of 100 CET:1 SugE.Our results indicate that DDM-SugE Trp regions are more sensitive toCTP quenching at lower concentrations than CET. Therefore, differ-ences between R-group associations to the quaternary ammonium ofCTP (pyridine) and CET (methyl) play an important role in SugE Trpquenching since both are identical in acyl chain length (C16) and QCCcounter ions Cl− (CTP) or Br− (CET) had no quenching effect whenadded to DDM-SugE as salts.
3.5. Tyrosine exposure of detergent solubilized SugE residues proteinincreases in the presence of either QCC
Since the intrinsic fluorescence of SDS or DDM solubilized SugEprotein provided information limited to Trp residues only, second-order derivative UV absorbance SDUV) analysis was used todetermine if Tyr residue exposure is similar in SugE resuspended ineither detergent. The technique described by Ragone et al. 1984 [32]permits the estimation of Tyr (Yexp) residue hydrophilic exposurewithin a protein. Yexp estimation is based upon calculated r valuesobtained after second-order derivitization of UV absorbance spectracollected for the protein and mixtures of aromatic amino acid com-pounds in various environments (refer to the Materials and Methodssection for a detailed explanation).
To accurately determine SugE protein Yexp in either SDS or DDM,the SDUV analysis of mixtures of Tyr and Trp amino acid derivatives atidentical molar ratios present within the SugE protein (4W:2Y) wereperformed. Two sets of amino acid derivative compound mixtures, 4NAWA:2 NAYA and 4 NAWE:2 NAYE, were prepared in a variety ofsolvents to provide r value controls for Tyr exposure to hydrophobic(ethylene glycol) and hydrophilic (8 M urea and H2O) environments(Table 2 and Supplementary Table 1). Two different amino acidderivative sets were selected for this study to reflect differences in
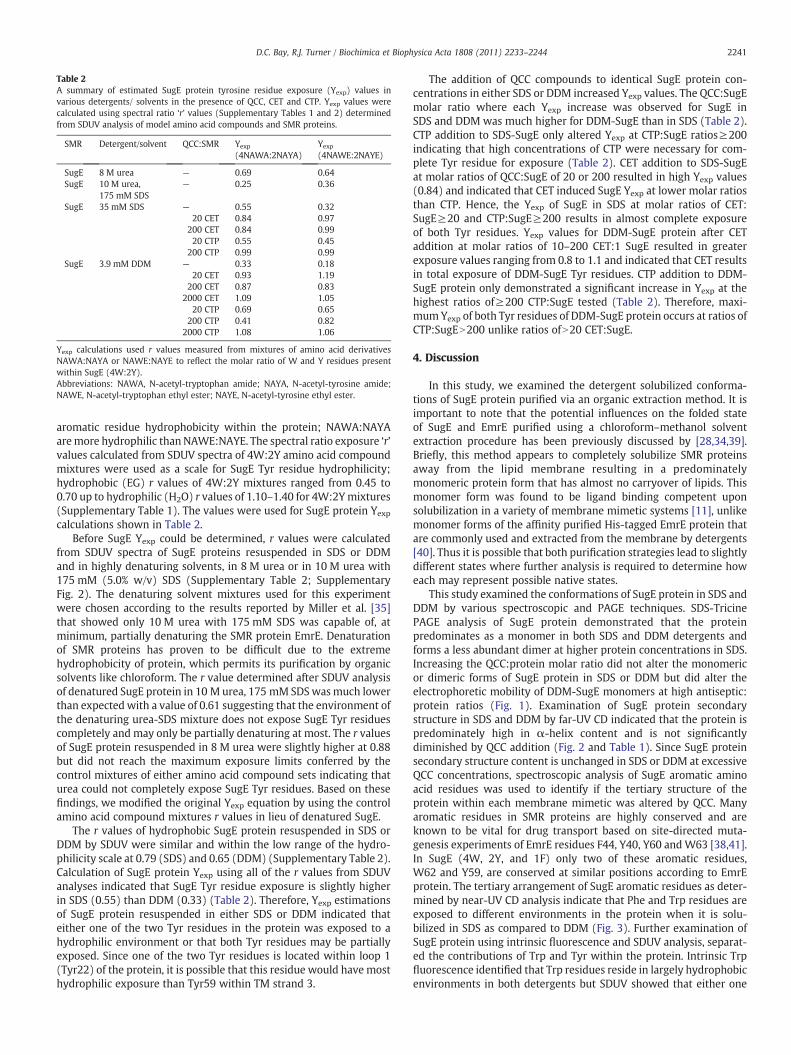
Table 2A summary of estimated SugE protein tyrosine residue exposure (Yexp) values invarious detergents/ solvents in the presence of QCC, CET and CTP. Yexp values werecalculated using spectral ratio ‘r’ values (Supplementary Tables 1 and 2) determinedfrom SDUV analysis of model amino acid compounds and SMR proteins.
SMR Detergent/solvent QCC:SMR Yexp
(4NAWA:2NAYA)Yexp
(4NAWE:2NAYE)
SugE 8 M urea — 0.69 0.64SugE 10 M urea,
175 mM SDS— 0.25 0.36
SugE 35 mM SDS — 0.55 0.3220 CET 0.84 0.97
200 CET 0.84 0.9920 CTP 0.55 0.45
200 CTP 0.99 0.99SugE 3.9 mM DDM — 0.33 0.18
20 CET 0.93 1.19200 CET 0.87 0.83
2000 CET 1.09 1.0520 CTP 0.69 0.65
200 CTP 0.41 0.822000 CTP 1.08 1.06
Yexp calculations used r values measured from mixtures of amino acid derivativesNAWA:NAYA or NAWE:NAYE to reflect the molar ratio of W and Y residues presentwithin SugE (4W:2Y).Abbreviations: NAWA, N-acetyl-tryptophan amide; NAYA, N-acetyl-tyrosine amide;NAWE, N-acetyl-tryptophan ethyl ester; NAYE, N-acetyl-tyrosine ethyl ester.
2241D.C. Bay, R.J. Turner / Biochimica et Biophysica Acta 1808 (2011) 2233–2244
aromatic residue hydrophobicity within the protein; NAWA:NAYAaremore hydrophilic than NAWE:NAYE. The spectral ratio exposure ‘r’values calculated from SDUV spectra of 4W:2Y amino acid compoundmixtures were used as a scale for SugE Tyr residue hydrophilicity;hydrophobic (EG) r values of 4W:2Y mixtures ranged from 0.45 to0.70 up to hydrophilic (H2O) r values of 1.10–1.40 for 4W:2Ymixtures(Supplementary Table 1). The values were used for SugE protein Yexp
calculations shown in Table 2.Before SugE Yexp could be determined, r values were calculated
from SDUV spectra of SugE proteins resuspended in SDS or DDMand in highly denaturing solvents, in 8 M urea or in 10 M urea with175 mM (5.0% w/v) SDS (Supplementary Table 2; SupplementaryFig. 2). The denaturing solvent mixtures used for this experimentwere chosen according to the results reported by Miller et al. [35]that showed only 10 M urea with 175 mM SDS was capable of, atminimum, partially denaturing the SMR protein EmrE. Denaturationof SMR proteins has proven to be difficult due to the extremehydrophobicity of protein, which permits its purification by organicsolvents like chloroform. The r value determined after SDUV analysisof denatured SugE protein in 10 M urea, 175 mM SDSwasmuch lowerthan expected with a value of 0.61 suggesting that the environment ofthe denaturing urea-SDS mixture does not expose SugE Tyr residuescompletely and may only be partially denaturing at most. The r valuesof SugE protein resuspended in 8 M urea were slightly higher at 0.88but did not reach the maximum exposure limits conferred by thecontrol mixtures of either amino acid compound sets indicating thaturea could not completely expose SugE Tyr residues. Based on thesefindings, we modified the original Yexp equation by using the controlamino acid compound mixtures r values in lieu of denatured SugE.
The r values of hydrophobic SugE protein resuspended in SDS orDDM by SDUV were similar and within the low range of the hydro-philicity scale at 0.79 (SDS) and 0.65 (DDM) (Supplementary Table 2).Calculation of SugE protein Yexp using all of the r values from SDUVanalyses indicated that SugE Tyr residue exposure is slightly higherin SDS (0.55) than DDM (0.33) (Table 2). Therefore, Yexp estimationsof SugE protein resuspended in either SDS or DDM indicated thateither one of the two Tyr residues in the protein was exposed to ahydrophilic environment or that both Tyr residues may be partiallyexposed. Since one of the two Tyr residues is located within loop 1(Tyr22) of the protein, it is possible that this residue would have mosthydrophilic exposure than Tyr59 within TM strand 3.
The addition of QCC compounds to identical SugE protein con-centrations in either SDS or DDM increased Yexp values. The QCC:SugEmolar ratio where each Yexp increase was observed for SugE inSDS and DDM was much higher for DDM-SugE than in SDS (Table 2).CTP addition to SDS-SugE only altered Yexp at CTP:SugE ratios≥200indicating that high concentrations of CTP were necessary for com-plete Tyr residue for exposure (Table 2). CET addition to SDS-SugEat molar ratios of QCC:SugE of 20 or 200 resulted in high Yexp values(0.84) and indicated that CET induced SugE Yexp at lower molar ratiosthan CTP. Hence, the Yexp of SugE in SDS at molar ratios of CET:SugE≥20 and CTP:SugE≥200 results in almost complete exposureof both Tyr residues. Yexp values for DDM-SugE protein after CETaddition at molar ratios of 10–200 CET:1 SugE resulted in greaterexposure values ranging from 0.8 to 1.1 and indicated that CET resultsin total exposure of DDM-SugE Tyr residues. CTP addition to DDM-SugE protein only demonstrated a significant increase in Yexp at thehighest ratios of≥200 CTP:SugE tested (Table 2). Therefore, maxi-mumYexp of both Tyr residues of DDM-SugE protein occurs at ratios ofCTP:SugEN200 unlike ratios ofN20 CET:SugE.
4. Discussion
In this study, we examined the detergent solubilized conforma-tions of SugE protein purified via an organic extraction method. It isimportant to note that the potential influences on the folded stateof SugE and EmrE purified using a chloroform–methanol solventextraction procedure has been previously discussed by [28,34,39].Briefly, this method appears to completely solubilize SMR proteinsaway from the lipid membrane resulting in a predominatelymonomeric protein form that has almost no carryover of lipids. Thismonomer form was found to be ligand binding competent uponsolubilization in a variety of membrane mimetic systems [11], unlikemonomer forms of the affinity purified His-tagged EmrE protein thatare commonly used and extracted from the membrane by detergents[40]. Thus it is possible that both purification strategies lead to slightlydifferent states where further analysis is required to determine howeach may represent possible native states.
This study examined the conformations of SugE protein in SDS andDDM by various spectroscopic and PAGE techniques. SDS-TricinePAGE analysis of SugE protein demonstrated that the proteinpredominates as a monomer in both SDS and DDM detergents andforms a less abundant dimer at higher protein concentrations in SDS.Increasing the QCC:protein molar ratio did not alter the monomericor dimeric forms of SugE protein in SDS or DDM but did alter theelectrophoretic mobility of DDM-SugE monomers at high antiseptic:protein ratios (Fig. 1). Examination of SugE protein secondarystructure in SDS and DDM by far-UV CD indicated that the protein ispredominately high in α-helix content and is not significantlydiminished by QCC addition (Fig. 2 and Table 1). Since SugE proteinsecondary structure content is unchanged in SDS or DDM at excessiveQCC concentrations, spectroscopic analysis of SugE aromatic aminoacid residues was used to identify if the tertiary structure of theprotein within each membrane mimetic was altered by QCC. Manyaromatic residues in SMR proteins are highly conserved and areknown to be vital for drug transport based on site-directed muta-genesis experiments of EmrE residues F44, Y40, Y60 andW63 [38,41].In SugE (4W, 2Y, and 1F) only two of these aromatic residues,W62 and Y59, are conserved at similar positions according to EmrEprotein. The tertiary arrangement of SugE aromatic residues as deter-mined by near-UV CD analysis indicate that Phe and Trp residues areexposed to different environments in the protein when it is solu-bilized in SDS as compared to DDM (Fig. 3). Further examination ofSugE protein using intrinsic fluorescence and SDUV analysis, separat-ed the contributions of Trp and Tyr within the protein. Intrinsic Trpfluorescence identified that Trp residues reside in largely hydrophobicenvironments in both detergents but SDUV showed that either one
2242 D.C. Bay, R.J. Turner / Biochimica et Biophysica Acta 1808 (2011) 2233–2244
of the two Tyr residues, or half of both Tyr, within SDS-SugE arelocated in hydrophilic environments (Fig. 4 and Table 2). Analysis ofDDM-SugE protein by intrinsic fluorescence and SDUV indicate thatTrp and Tyr residues both adopt a far more hydrophobic environmentthan SugE in SDS (Fig. 4 and Table 2). Intrinsic fluorescence of Trpresidues of SugE protein in SDS or DDM demonstrated average λmax
values of 330 and 345 nm respectively, similar to EmrE proteinsolubilized by the same detergents in a recent study [35] and beginsto suggest that SugE protein studied herein shows similar structuralfeatures common to the entire SMR protein family.
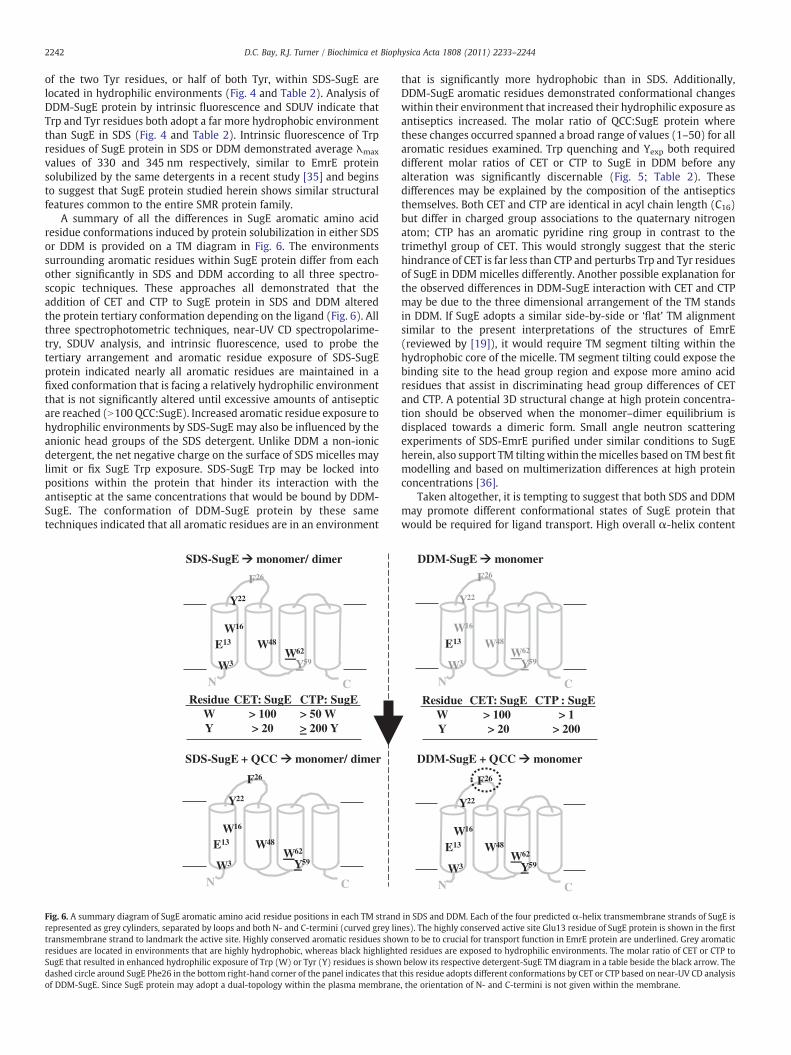
A summary of all the differences in SugE aromatic amino acidresidue conformations induced by protein solubilization in either SDSor DDM is provided on a TM diagram in Fig. 6. The environmentssurrounding aromatic residues within SugE protein differ from eachother significantly in SDS and DDM according to all three spectro-scopic techniques. These approaches all demonstrated that theaddition of CET and CTP to SugE protein in SDS and DDM alteredthe protein tertiary conformation depending on the ligand (Fig. 6). Allthree spectrophotometric techniques, near-UV CD spectropolarime-try, SDUV analysis, and intrinsic fluorescence, used to probe thetertiary arrangement and aromatic residue exposure of SDS-SugEprotein indicated nearly all aromatic residues are maintained in afixed conformation that is facing a relatively hydrophilic environmentthat is not significantly altered until excessive amounts of antisepticare reached (N100 QCC:SugE). Increased aromatic residue exposure tohydrophilic environments by SDS-SugE may also be influenced by theanionic head groups of the SDS detergent. Unlike DDM a non-ionicdetergent, the net negative charge on the surface of SDS micelles maylimit or fix SugE Trp exposure. SDS-SugE Trp may be locked intopositions within the protein that hinder its interaction with theantiseptic at the same concentrations that would be bound by DDM-SugE. The conformation of DDM-SugE protein by these sametechniques indicated that all aromatic residues are in an environment
Fig. 6. A summary diagram of SugE aromatic amino acid residue positions in each TM strandrepresented as grey cylinders, separated by loops and both N- and C-termini (curved grey lintransmembrane strand to landmark the active site. Highly conserved aromatic residues showresidues are located in environments that are highly hydrophobic, whereas black highlightSugE that resulted in enhanced hydrophilic exposure of Trp (W) or Tyr (Y) residues is showndashed circle around SugE Phe26 in the bottom right-hand corner of the panel indicates thatof DDM-SugE. Since SugE protein may adopt a dual-topology within the plasma membrane
that is significantly more hydrophobic than in SDS. Additionally,DDM-SugE aromatic residues demonstrated conformational changeswithin their environment that increased their hydrophilic exposure asantiseptics increased. The molar ratio of QCC:SugE protein wherethese changes occurred spanned a broad range of values (1–50) for allaromatic residues examined. Trp quenching and Yexp both requireddifferent molar ratios of CET or CTP to SugE in DDM before anyalteration was significantly discernable (Fig. 5; Table 2). Thesedifferences may be explained by the composition of the antisepticsthemselves. Both CET and CTP are identical in acyl chain length (C16)but differ in charged group associations to the quaternary nitrogenatom; CTP has an aromatic pyridine ring group in contrast to thetrimethyl group of CET. This would strongly suggest that the sterichindrance of CET is far less than CTP and perturbs Trp and Tyr residuesof SugE in DDM micelles differently. Another possible explanation forthe observed differences in DDM-SugE interaction with CET and CTPmay be due to the three dimensional arrangement of the TM standsin DDM. If SugE adopts a similar side-by-side or ‘flat’ TM alignmentsimilar to the present interpretations of the structures of EmrE(reviewed by [19]), it would require TM segment tilting within thehydrophobic core of the micelle. TM segment tilting could expose thebinding site to the head group region and expose more amino acidresidues that assist in discriminating head group differences of CETand CTP. A potential 3D structural change at high protein concentra-tion should be observed when the monomer–dimer equilibrium isdisplaced towards a dimeric form. Small angle neutron scatteringexperiments of SDS-EmrE purified under similar conditions to SugEherein, also support TM tiltingwithin themicelles based on TM best fitmodelling and based on multimerization differences at high proteinconcentrations [36].
Taken altogether, it is tempting to suggest that both SDS and DDMmay promote different conformational states of SugE protein thatwould be required for ligand transport. High overall α-helix content
in SDS and DDM. Each of the four predicted α-helix transmembrane strands of SugE ises). The highly conserved active site Glu13 residue of SugE protein is shown in the firstn to be to crucial for transport function in EmrE protein are underlined. Grey aromatic
ed residues are exposed to hydrophilic environments. The molar ratio of CET or CTP tobelow its respective detergent-SugE TM diagram in a table beside the black arrow. Thethis residue adopts different conformations by CET or CTP based on near-UV CD analysis, the orientation of N- and C-termini is not given within the membrane.
2243D.C. Bay, R.J. Turner / Biochimica et Biophysica Acta 1808 (2011) 2233–2244
at similar estimated amounts existed in both SDS and DDM prep-arations of SugE that were not lost by QCC addition (Table 1; Fig. 2).This indicates that the tertiary arrangements of the protein were themajor differences between SDS and DDM SugE protein preparations.The aromatic residue arrangements within SDS-SugE may reflect atransition state between the monomer to dimer that is unresponsiveto ligand binding. Evidence to support this notion can be observed bythe fixed tertiary arrangements of Phe26 and Trp residues (near-UVCD), the presence of both monomer and dimers (SDS-Tricine PAGE),and general lack of Trp fluorescence quenching by the additionof either QCC. Considering the harshness of SDS, due its extremehydrophile-lipophile balance, SugE and likely other SMR proteinsas well as other highly hydrophobic peptides and proteins have ahighly resilient conformation. Earlier experiments with EmrE proteinpurified under the same conditions support this observation since thesecondary structure of SDS-EmrE was also α-helix rich and boundligand with similar affinity shown by SDS-SugE [37].
Based on the conditions of this study, the tertiary conformationof DDM-SugE protein reflects a monomer form that is capable ofligand interaction. The DDM-SugE monomer form interacts witheach type of QCC based on fluorescence and SDUV analysis. Thisconformation adopts slight variations in TM strands 1–3 aromaticresidue arrangements according to Trp fluorescence quenchingexperiments with each QCC and more hydrophilic Phe environ-ments in loop 1 based on near-UV CD analysis. Previous workexamining SugE protein purified using similar purification methodsdemonstrated that SugE bound a variety of drugs at a 1:1 protein toligand ratio in DDM and small unilamellar vesicles using isother-mal titration calorimetry (ITC) [11]. Unfortunately, these ITCexperiments could not determine the KD values of CTP binding toSugE since CTP interacted strongly with the membrane mimeticitself [11].
The findings of this study also support a lateral mechanism of QCCdelivery to SMR proteins. Many SMR transport mechanisms (asreviewed by [3]) suggest that QCC interaction with the SMR proteincould occur laterally within the membrane bilayer or enter from theaqueous phase. Nearly all QCC substrates of SMR proteins are highlylipophilic but many do not demonstratemicelle forming abilities, suchas ethidium, methyl viologen or tetraphenyl phosphonium. How-ever, all of the known QCC substrates of SugE are cationic detergentantiseptics indicating that QCC interaction with this SugE would onlyoccur laterally within a membrane bilayer. CET has a critical micellarconcentration (CMC) of 3.88 mM, whereas CTP has a CMC of 1.24 mM(at room temperature in water). Both QCC have demonstrated in vitropartitioning ability into lipid bilayers as well as variety of ionic (SDS)and non-ionic (DDM) detergents forming mixed micelles [42,43]. Ourstudies involved high concentrations of anionic SDS (35 mM) andnon-ionic DDM (3.9 mM) for solubilization of SugE protein that arewell above their CMC to ensure that bothmembranemimetics (SDS orDDM) dominated over the added QCC antiseptics. The partitioningability of both drugs tested herein may also explain why such highamounts of QCC are required before tertiary alterations can be ob-served. The partitioning and membrane disrupting properties ofthese antiseptics also complicates an accurate Kd determination inmore biologically relevant phospholipid membrane systems in vitro.These QCC will disrupt membranes and detergent micelles at theconcentrations used for these experiments, as demonstrated in arecent thermodynamic study of QCC partitioning within variousmembrane mimetics [44]. For this reason, small unilamellar vesiclesor phospholiposome reconstitution experiments are not informativefor this antiseptic-SugE interaction study and prohibited the use ofin vitro transport assays. Hence, this selective antiseptic transporterprotein can act as an invaluable system for future mechanistic studiesof SMR proteins since this method is not reliant on phospholipidbilayer formation to study SugE conformation in the presence ofcationic detergent substrates.
This study strongly suggests that SugE protein adopts tertiary andquaternary structure conformations that are distinct in anionic andnon-ionic membrane mimetic environments. Despite these confor-mational differences, the secondary structure of SugE is predomi-nately α-helix rich and unperturbed by ligand addition. Althoughmonomer forms of SugE protein predominated using this purificationmethod, solubilization in SDS and to a far less extent DDM bothinduced dimer forms of the protein. Since the evidence supporting afunctional oligomer for EmrE is convincing (as reviewed by [19]), ourstudies of the SugE monomer may not reflect a functional multimer,but this work does indicate that a SugE monomer can interact with itsknown ligands and supports earlier work in this regard [11]. Inconclusion, this study has revealed conformational changes that areaffected in DDM solubilized SugE protein conformation induced byCET and CTP.
Acknowledgements
Funding for this work was provided by the Natural Sciences andEngineering research Council of Canada (NSERC) discovery grant toRJT. We thank R. Edwards for useful discussions on the spectroscopy,E. Haney and H. Vogel for assistance with CD spectropolarimetry, andT. Winstone, V. De Wever, and all members of the R. J. Turner lab forhelpful discussions.
Appendix A. Supplementary data
Supplementary data to this article can be found online atdoi:10.1016/j.bbamem.2011.05.005.
References
[1] D.C. Bay, R.J. Turner, Diversity and evolution of the small multidrug resistanceprotein family, BMC Evol. Biol. 9 (2009) 140.
[2] T.G. Littlejohn, I.T. Paulsen, M.T. Gillespie, J.M. Tennent, M. Midgley, I.G. Jones, A.S.Purewal, R.A. Skurray, Substrate specificity and energetics of antiseptic anddisinfectant resistance in Staphylococcus aureus, FEMS Microbiol. Lett. 74 (1992)259–265.
[3] D.C. Bay, K.L. Rommens, R.J. Turner, Small multidrug resistance proteins: amultidrug transporter family that continues to grow, Biochim. Biophys. Acta 1778(2008) 1814–1838.
[4] I.T. Paulsen, T.G. Littlejohn, P. Radstrom, L. Sundstrom, O. Skold, G. Swedberg, R.A.Skurray, The 3′ conserved segment of integrons contains a gene associated withmultidrug resistance to antiseptics and disinfectants, Antimicrob. Agents Che-mother. 37 (1993) 761–768.
[5] L.H. Su, H.L. Chen, J.H. Chia, S.Y. Liu, C. Chu, T.L. Wu, C.H. Chiu, Distribution of atransposon-like element carrying bla(CMY-2) among Salmonella and otherEnterobacteriaceae, J. Antimicrob. Chemother. 57 (2006) 424–429.
[6] A. Schluter, H. Heuer, R. Szczepanowski, S.M. Poler, S. Schneiker, A. Puhler, E.M.Top, Plasmid pB8 is closely related to the prototype IncP-1beta plasmid R751 buttransfers poorly to Escherichia coli and carries a new transposon encoding a smallmultidrug resistance efflux protein, Plasmid 54 (2005) 135–148.
[7] S.W. Wu, K. Dornbusch, G. Kronvall, M. Norgren, Characterization and nucleotidesequence of a Klebsiella oxytoca cryptic plasmid encoding a CMY-type beta-lactamase: confirmation that the plasmid-mediated cephamycinase originatedfrom the Citrobacter freundii AmpC beta-lactamase, Antimicrob. Agents Che-mother. 43 (1999) 1350–1357.
[8] Y.J. Chung, M.H. Saier Jr., Overexpression of the Escherichia coli sugE gene confersresistance to a narrow range of quaternary ammonium compounds, J. Bacteriol.184 (2002) 2543–2545.
[9] T. Greener, D. Govezensky, A. Zamir, A novel multicopy suppressor of a groELmutation includes two nested open reading frames transcribed from differentpromoters, EMBO J. 12 (1993) 889–896.
[10] R.E. Bishop, S.S. Penfold, L.S. Frost, J.V.Holtje, J.H.Weiner, Stationaryphase expressionof a novel Escherichia coli outer membrane lipoprotein and its relationship withmammalian apolipoprotein D. Implications for the origin of lipocalins, J Biol Chem270 (1995) 23097–23103.
[11] C.W. Sikora, R.J. Turner, SMR proteins SugE and EmrE bind ligand with similaraffinity and stoichiometry, Biochem. Biophys. Res. Commun. 335 (2005) 105–111.
[12] M.S. Son, C. Del Castilho, K.A. Duncalf, D. Carney, J.H.Weiner, R.J. Turner,Mutagenesisof SugE, a small multidrug resistance protein, Biochem. Biophys. Res. Commun. 312(2003) 914–921.
[13] C. Klammt, F. Lohr, B. Schafer, W. Haase, V. Dotsch, H. Ruterjans, C. Glaubitz, F.Bernhard, High level cell-free expression and specific labeling of integral membraneproteins, Eur. J. Biochem. 271 (2004) 568–580.
2244 D.C. Bay, R.J. Turner / Biochimica et Biophysica Acta 1808 (2011) 2233–2244
[14] C.G. Tate, I. Ubarretxena-Belandia, J.M. Baldwin, Conformational changes in themultidrug transporter EmrE associated with substrate binding, J. Mol. Biol. 332(2003) 229–242.
[15] I. Ubarretxena-Belandia, J.M. Baldwin, S. Schuldiner, C.G. Tate, Three-dimensionalstructure of the bacterial multidrug transporter EmrE shows it is an asymmetrichomodimer, EMBO J. 22 (2003) 6175–6181.
[16] V.M. Korkhov, C.G. Tate, Electron crystallography reveals plasticity within thedrug binding site of the small multidrug transporter EmrE, J. Mol. Biol. 377 (2008)1094–1103.
[17] Y.J. Chen, O. Pornillos, S. Lieu, C. Ma, A.P. Chen, G. Chang, X-ray structure of EmrEsupports dual topologymodel, Proc. Natl. Acad. Sci. U. S. A. 104 (2007) 18999–19004.
[18] S. Schuldiner, EmrE, a model for studying evolution and mechanism of ion-coupled transporters, Biochim. Biophys. Acta 1794 (2009) 748–762.
[19] V.M. Korkhov, C.G. Tate, An emerging consensus for the structure of EmrE, ActaCrystallogr. D Biol. Crystallogr. 65 (2009) 186–192.
[20] S. Schuldiner, Controversy over EmrE structure, Science 317 (2007) 748–751(author reply 748–751).
[21] S. Schuldiner, When biochemistry meets structural biology: the cautionary tale ofEmrE, Trends Biochem. Sci. 32 (2007) 252–258.
[22] E. De Rossi, M. Branzoni, R. Cantoni, A. Milano, G. Riccardi, O. Ciferri, mmr, aMycobacterium tuberculosis gene conferring resistance to small cationic dyes andinhibitors, J. Bacteriol. 180 (1998) 6068–6071.
[23] S. Ninio, D. Rotem, S. Schuldiner, Functional analysis of novel multidrugtransporters from human pathogens, J. Biol. Chem. 276 (2001) 48250–48256.
[24] T. Kikukawa, T. Nara, T. Araiso, S. Miyauchi, N. Kamo, Two-component bacterialmultidrug transporter, EbrAB: mutations making each component solelyfunctional, Biochim. Biophys. Acta 1758 (2006) 673–679.
[25] Y. Masaoka, Y. Ueno, Y. Morita, T. Kuroda, T. Mizushima, T. Tsuchiya, A two-component multidrug efflux pump, EbrAB, in Bacillus subtilis, J. Bacteriol. 182(2000) 2307–2310.
[26] Z. Zhang,C.Ma,O. Pornillos, X.Xiu,G. Chang,M.H. Saier Jr., Functional characterizationof the heterooligomeric EbrAB multidrug efflux transporter of Bacillus subtilis,Biochemistry 46 (2007) 5218–5225.
[27] C.M. Stoscheck, Quantitation of protein, Methods Enzymol. 182 (1990) 50–68.[28] T.L. Winstone, K.A. Duncalf, R.J. Turner, Optimization of expression and the
purification by organic extraction of the integral membrane protein EmrE, ProteinExpr. Purif. 26 (2002) 111–121.
[29] C.L. Ladner, J. Yang, R.J. Turner, R.A. Edwards, Visiblefluorescent detection of proteinsin polyacrylamide gels without staining, Anal. Biochem. 326 (2004) 13–20.
[30] A. Lobley, L. Whitmore, B.A. Wallace, DICHROWEB: an interactive website for theanalysis of protein secondary structure from circular dichroism spectra, Bioinfor-matics 18 (2002) 211–212.
[31] L. Whitmore, B.A. Wallace, DICHROWEB, an online server for protein secondarystructure analyses from circular dichroism spectroscopic data, Nucleic Acids Res.32 (2004) W668–W673.
[32] R. Ragone, G. Colonna, C. Balestrieri, L. Servillo, G. Irace, Determination of tyrosineexposure in proteins by second-derivative spectroscopy, Biochemistry 23 (1984)1871–1875.
[33] H.A. Havel, Derivative near-ultraviolet absorption techniques for investigatingprotein structure, in: H.A. Havel (Ed.), Spectroscopic Methods for DeterminingProtein Structure in Solution, VCH Publishers, Inc., New York, 1995, pp. 62–68.
[34] S.L. Federkeil, T.L. Winstone, G. Jickling, R.J. Turner, Examination of EmrEconformational differences in various membrane mimetic environments, Bio-chem. Cell Biol. 81 (2003) 61–70.
[35] D. Miller, K. Charalambous, D. Rotem, S. Schuldiner, P. Curnow, P.J. Booth, In vitrounfolding and refolding of the small multidrug transporter EmrE, J. Mol. Biol. 393(2009) 815–832.
[36] D.C. Bay, R.A. Budiman, M.P. Nieh, R.J. Turner, Multimeric forms of the smallmultidrug resistance protein EmrE in anionic detergent, Biochim. Biophys. Acta1798 (2009) 526–535.
[37] R. Pain, Determining the CD spectrum of a protein, Curr. Protoc. Protein Sci. (2005)(Chapter 7, Unit Suppl. 38), 1–24.
[38] Y. Elbaz, N. Tayer, E. Steinfels, S. Steiner-Mordoch, S. Schuldiner, Substrate-induced tryptophan fluorescence changes in EmrE, the smallest ion-coupledmultidrug transporter, Biochemistry 44 (2005) 7369–7377.
[39] T.L. Winstone, M. Jidenko, M. le Maire, C. Ebel, K.A. Duncalf, R.J. Turner, Organicsolvent extracted EmrE solubilized in dodecyl maltoside is monomeric and bindsdrug ligand, Biochem. Biophys. Res. Commun. 327 (2005) 437–445.
[40] P.J. Butler, I. Ubarretxena-Belandia, T. Warne, C.G. Tate, The Escherichia colimultidrug transporter EmrE is a dimer in the detergent-solubilised state, J. Mol.Biol. 340 (2004) 797–808.
[41] D. Rotem, S. Steiner-Mordoch, S. Schuldiner, Identification of tyrosine residuescritical for the function of an ion-coupled multidrug transporter, J. Biol. Chem. 281(2006) 18715–18722.
[42] P.M. Shanthi, R.V. Mangalaraja, A.P. Uthirakumar, S. Velmathi, T. Balasubramanian,M. Ashok, Synthesis and characterization of porous shell-like nano hydroxyap-atite using cetrimide as template, J. Colloid Interface Sci. 350 (2010) 39–43.
[43] K.U. Din, M.S. Sheikh, A.A. Dar, Analysis of mixed micellar and interfacial behaviorof cationic gemini hexanediyl-1,6-bis(dimethylcetylammonium bromide) withconventional ionic and nonionic surfactants in aqueous medium, J. Phys. Chem. B114 (2010) 6023–6032.
[44] A. Beck, X. Li-Blatter, A. Seelig, J. Seelig, On the interaction of ionic detergents withlipid membranes. thermodynamic comparison of n-alkyl-+N(CH3)3 and n-alkyl-SO4-, J. Phys. Chem. B 114 (2010) 15862–15871.
Related Documents