Research Article Spectrophotometric Determination of Gemifloxacin Mesylate, Moxifloxacin Hydrochloride, and Enrofloxacin in Pharmaceutical Formulations Using Acid Dyes Ayman A. Gouda, 1 Alaa S. Amin, 2 Ragaa El-Sheikh, 1 and Amira G. Yousef 1 1 Chemistry Department, Faculty of Science, Zagazig University, Zagazig 44519, Egypt 2 Chemistry Department, Faculty of Science, Benha University, Benha, Egypt Correspondence should be addressed to Ayman A. Gouda; [email protected] Received 4 September 2013; Revised 25 November 2013; Accepted 27 November 2013; Published 22 January 2014 Academic Editor: Sibel A. Ozkan Copyright © 2014 Ayman A. Gouda et al. is is an open access article distributed under the Creative Commons Attribution License, which permits unrestricted use, distribution, and reproduction in any medium, provided the original work is properly cited. Simple, rapid, and extractive spectrophotometric methods were developed for the determination of some fluoroquinolones antibiotics: gemifloxacin mesylate (GMF), moxifloxacin hydrochloride (MXF), and enrofloxacin (ENF) in pure forms and pharmaceutical formulations. ese methods are based on the formation of ion-pair complexes between the basic drugs and acid dyes, namely, bromocresol green (BCG), bromocresol purple (BCP), bromophenol blue (BPB), bromothymol blue (BTB), and methyl orange (MO) in acidic buffer solutions. e formed complexes were extracted with chloroform and measured at 420, 408, 416, 415, and 422nm for BCG, BCP, BPB, BTB, and MO, respectively, for GMF; at 410, 415, 416, and 420 nm for BCP, BTB, BPB, and MO, respectively, for MXF; and at 419 and 414 nm for BCG and BTB, respectively, in case of ENF. e analytical parameters and their effects are investigated. Beer’s law was obeyed in the ranges 1.0–30, 1.0–20, and 2.0–24 g mL −1 for GMF, MXF, and ENF, respectively. e proposed methods have been applied successfully for the analysis of the studied drugs in pure forms and pharmaceutical formulations. Statistical comparison of the results with the reference methods showed excellent agreement and indicated no significant difference in accuracy and precision. 1. Introduction Fluoroquinolones are the second-generation members of quinolone antibiotics fluorinated in position 6 and bearing a piperazinyl moiety at position. ey are considered to be the most effective Gram-positive and Gram-negative pathogens to combat infection caused by microorganisms that are resist- ant to other microbials, such as tetracyclines. Also, they have some activity against mycobacteria, mycoplasmas, rickettsias, and the protozoan Plasmodium falciparum [1–3]. ere is a substantial body of literature related to both the mechanism of their action as DNA gyrase inhibitors and the influence of systematic structural modifications on their biological activ- ity. Gemifloxacin mesylate (GMF) is (R,S)-7-[(4Z)-3-(amino- methyl)-4-(methoxyimino)-1-pyrrolidinyl]-1-cyclopropyl-6- fluoro-1,4-dihydro-4-oxo-1,8-naphthyridine-3-carboxylic acid methanesulfonate. Moxifloxacin (MXF) is {1-cyclopro- pyl-7-[2,8-diazobicyclo (4.3.0) nonane]-6-fluoro-8-meth- oxy-1,4 dihydro-4-oxo-3-quinolone carboxylic acid}. Enro- floxacin (ENF) is (1 cyclopropyl-7-(4-ethyl-1-piperazinyl)- 6-fluoro-1,4-dihydro-4-oxo-3-quinolone carboxylic acid) (Scheme 1). GMF and MXF are fourth-generation synthetic broad-spectrum 8-methoxy fluoroquinolone antibacterial drug derivatives. Due to their clinical advantages, GMF and MXF are receiving a great interest and there was an increase in number of their pharmaceutical dosage forms in the mar- ket in the recent past. Enrofloxacin is the first fluoroquinolone developed for veterinary application and is potentially avai- lable for the treatment of some urinary tract, respiratory tract, and skin infectious diseases in pets and livestock [2]. ere are no official (pharmacopoeia) methods that have been found for the assay of GMF and MXF in their pharmaceutical formulations. ENF is official in the United States Pharma- copeia (USP) [4]. Hindawi Publishing Corporation Journal of Analytical Methods in Chemistry Volume 2014, Article ID 286379, 16 pages http://dx.doi.org/10.1155/2014/286379

Welcome message from author
This document is posted to help you gain knowledge. Please leave a comment to let me know what you think about it! Share it to your friends and learn new things together.
Transcript

Research ArticleSpectrophotometric Determination of GemifloxacinMesylate, Moxifloxacin Hydrochloride, and Enrofloxacin inPharmaceutical Formulations Using Acid Dyes
Ayman A. Gouda,1 Alaa S. Amin,2 Ragaa El-Sheikh,1 and Amira G. Yousef1
1 Chemistry Department, Faculty of Science, Zagazig University, Zagazig 44519, Egypt2 Chemistry Department, Faculty of Science, Benha University, Benha, Egypt
Correspondence should be addressed to Ayman A. Gouda; [email protected]
Received 4 September 2013; Revised 25 November 2013; Accepted 27 November 2013; Published 22 January 2014
Academic Editor: Sibel A. Ozkan
Copyright © 2014 Ayman A. Gouda et al. This is an open access article distributed under the Creative Commons AttributionLicense, which permits unrestricted use, distribution, and reproduction in any medium, provided the original work is properlycited.
Simple, rapid, and extractive spectrophotometric methods were developed for the determination of some fluoroquinolonesantibiotics: gemifloxacin mesylate (GMF), moxifloxacin hydrochloride (MXF), and enrofloxacin (ENF) in pure forms andpharmaceutical formulations. These methods are based on the formation of ion-pair complexes between the basic drugs and aciddyes, namely, bromocresol green (BCG), bromocresol purple (BCP), bromophenol blue (BPB), bromothymol blue (BTB), andmethyl orange (MO) in acidic buffer solutions. The formed complexes were extracted with chloroform and measured at 420, 408,416, 415, and 422 nm for BCG, BCP, BPB, BTB, and MO, respectively, for GMF; at 410, 415, 416, and 420 nm for BCP, BTB, BPB,and MO, respectively, for MXF; and at 419 and 414 nm for BCG and BTB, respectively, in case of ENF. The analytical parametersand their effects are investigated. Beer’s law was obeyed in the ranges 1.0–30, 1.0–20, and 2.0–24𝜇g mL−1 for GMF, MXF, andENF, respectively. The proposed methods have been applied successfully for the analysis of the studied drugs in pure forms andpharmaceutical formulations. Statistical comparison of the results with the reference methods showed excellent agreement andindicated no significant difference in accuracy and precision.
1. Introduction
Fluoroquinolones are the second-generation members ofquinolone antibiotics fluorinated in position 6 and bearing apiperazinyl moiety at position. They are considered to be themost effective Gram-positive and Gram-negative pathogensto combat infection caused bymicroorganisms that are resist-ant to other microbials, such as tetracyclines. Also, they havesome activity againstmycobacteria,mycoplasmas, rickettsias,and the protozoan Plasmodium falciparum [1–3]. There is asubstantial body of literature related to both the mechanismof their action as DNA gyrase inhibitors and the influence ofsystematic structural modifications on their biological activ-ity. Gemifloxacinmesylate (GMF) is (R,S)-7-[(4Z)-3-(amino-methyl)-4-(methoxyimino)-1-pyrrolidinyl]-1-cyclopropyl-6-fluoro-1,4-dihydro-4-oxo-1,8-naphthyridine-3-carboxylicacid methanesulfonate. Moxifloxacin (MXF) is {1-cyclopro-
pyl-7-[2,8-diazobicyclo (4.3.0) nonane]-6-fluoro-8-meth-oxy-1,4 dihydro-4-oxo-3-quinolone carboxylic acid}. Enro-floxacin (ENF) is (1 cyclopropyl-7-(4-ethyl-1-piperazinyl)-6-fluoro-1,4-dihydro-4-oxo-3-quinolone carboxylic acid)(Scheme 1). GMF and MXF are fourth-generation syntheticbroad-spectrum 8-methoxy fluoroquinolone antibacterialdrug derivatives. Due to their clinical advantages, GMF andMXF are receiving a great interest and there was an increasein number of their pharmaceutical dosage forms in the mar-ket in the recent past. Enrofloxacin is the first fluoroquinolonedeveloped for veterinary application and is potentially avai-lable for the treatment of some urinary tract, respiratory tract,and skin infectious diseases in pets and livestock [2]. Thereare no official (pharmacopoeia) methods that have beenfound for the assay of GMF andMXF in their pharmaceuticalformulations. ENF is official in the United States Pharma-copeia (USP) [4].
Hindawi Publishing CorporationJournal of Analytical Methods in ChemistryVolume 2014, Article ID 286379, 16 pageshttp://dx.doi.org/10.1155/2014/286379

2 Journal of Analytical Methods in Chemistry
Gemifloxacin mesylate (GMF)
O
O
OO OO
N N N N NN
NNN
F F F
HN
H
H
OH HO
Moxifloxacin (MXF) Enrofloxacin (ENF)
CH3
CH3O
H2N H3C
∗HCI
CH3SO3H·
Scheme 1: The chemical structure of the studied fluoroquinolones.
Several methods have been reported for the determina-tion of fluoroquinolones either in pure forms, dosage forms,or biological fluids like chromatography [5–9], microchipelectrophoresis [10], chiral counter-current chromatography[11], capillary zone electrophoresis [12], electrochemistry [13–15], atomic absorption spectrometry [16, 17], and spectroflu-orimetry [18–21]. However, these methods are expensive andnot available at most quality control laboratories. For routineanalysis of the studied drugs, a simple, rapid, and cost effect-ive analytical method was required.
The spectrophotometric technique continues to be themost preferred method for the assay of different classes ofdrugs in pure, pharmaceutical formulations and in biologicalsamples, for its simplicity and reasonable sensitivity withsignificant economical advantages. Spectrophotometricmethods are reported for the assay of GMF [22–32], MXF[16, 33–40], and ENF [17, 41–47]. These methods were asso-ciated with some major drawbacks such as decreased select-ivity due to measurement in ultraviolet region and/or de-creased simplicity of the assay procedure (e.g., tedious precip-itation, heating, or liquid-liquid extraction steps in the ion-pair formation-based methods). For these reasons, it wasworthwhile to develop a new simple and selective spectro-photometric method for the determination of the studieddrugs in their pharmaceutical dosage forms.
In the present work, we report the development of accur-ate and precise extractive spectrophotometric methods basedon the chloroform soluble ion-pair complexes between thestudied fluoroquinolone antibiotics (GMF, MXF, and ENF)and some acid dyes (BCG, BCP, BTB, BPB, or MO). Theabsorbance measurements were measured at optimumwave-lengths. The proposed methods were applied successfully forthe determination of the studied drugs in pure and dosageforms. No interference was observed from the additives. Themethods provide rapid, economic procedures andmore sens-itive compared to the previously reported spectrophotomet-ric methods. These methods were validated by the statisticaldata.
2. Experimental
2.1. Apparatus. All absorption spectra were made using Kon-tron Unikon 930 (UV-Visible) spectrophotometer (German)with a scanning speed of 200 nm/min and a band width of2.0 nm, equipped with 10mm matched quartz cells. The pH
values of different buffer solutions were checked using aHanna pH-meter instrument (pH 211) (Romania) equippedwith a combined glass-calomel electrode.
2.2. Materials and Reagents. All reagents and chemicals usedwere of analytical or pharmaceutical grade and all solutionswere prepared fresh daily.
Materials. Pharmaceutical grade gemifloxacin mesylate(GMF) was supplied by Al-Obour Pharmaceutical andChemical Industries Company, Egypt. Moxifloxacin hydro-chloride (MXF) reference standard was provided by Sabaa,Kahira Company, Egypt. Enrofloxacin (ENF) was kindly pro-vided by Pharma Swede, Egypt (AVICO).
All pharmaceutical preparations were obtained fromcommercial sources in the local markets. Factive tablets wereobtained from Oscient Pharmaceuticals Corporation, USA,labeled to contain 320mg GMF per tablet; Flobiotic tabletswere obtained from Hikma Pharmaceutical and ChemicalIndustries Company, Egypt, labeled to contain 320mg GMFper tablet. GemiQue tablets were obtained fromObour Phar-maceutical andChemical Industries Company, Egypt, labeledto contain 320mg GMF per tablet. Avelox tablets were ob-tained from Bayer, Germany, labeled to contain 400mgMXFper tablet. Moxiflox tablets were obtained from EVA Pharm.& Chem. Ind. Company, Egypt, labeled to contain 400mgMXF per tablet. Moxifloxacin tablets were obtained fromSabaa International Company for Pharmaceuticals andChemical Industries, S.A.E., labeled to contain 400mg MXFper tablet. Enrocin 10% injectable (Alexandria Company forPharmaceuticals and Chemical Industries, Alexandria,Egypt) was labeled to contain 10% ENR and Avitryl 20% in-jectable (AVICO Veterinary Pharmaceuticals) was labeled tocontain 200mg ENR.
2.3. Preparation of Stock Standard Solutions. Stock standardsolutions of GMF, MXF, and ENR (100 𝜇g mL−1 and 1.0 ×10⁻³M) were prepared by dissolving an exact weight of puredrugs in least amount of 0.1M HCl; the mixture was warmedat 50∘C in a water bath for 5.0min, agitated by an electricalshaker for another 5.0min, cooled to room temperature, anddiluted to 100mL with bidistilled water in a 100mL measur-ing flask.The standard solutions were found stable for at leastone week without alteration when kept in an amber colouredbottle and stored in a refrigerator when not in use.

Journal of Analytical Methods in Chemistry 3
2.4. Reagents. Bromocresol green (BCG), bromocresol pur-ple (BCP), bromophenol blue (BPB), bromothymol blue(BTB), and methyl orange (MO) (BDH Chemicals Ltd.,Poole, England)were usedwithout further purification. Stocksolutions (1.0 × 10⁻³M) of reagents were prepared by dissolv-ing the appropriate weight of each reagent in 10mL of 96%ethanol and diluted to 100mL with bidistilled water. Thesesolutions are stable for at least one week if kept in the refrig-erator.
Series of buffer solutions of KCl-HCl (pH = 1.5–4.2),NaOAc-HCl (pH= 1.99–4.92),NaOAc-AcOH(pH=3.0–5.6),and potassium hydrogen phthalate-HCl (pH = 2.0–7.0) wereprepared by following the standard methods [48].
2.5. General Procedures
2.5.1. For GMF. Aliquots of (0.1–3.0mL) the standard drugsolution (100 𝜇g mL−1) were transferred to 10mL measuringflasks and added 2.0mL of acetate buffers of pH 3.0 and 3.5using (BCGor BCP) and (BPB, BTB orMO), respectively andthen added 2.0mL of all reagent solutions (1.0 × 10⁻³M).Themixture was extracted twice with 10mL chloroform by shak-ing for 2.0min and then allowed to stand for clear separationof the two phases and the chloroform layer was passedthrough anhydrous sodium sulphate. The absorbance of theyellow colored complexes was measured at 420, 408, 416, 415,and 422 nm, using BCG, BCP, BPB, BTB, and MO, respec-tively, against corresponding reagent blank similarly pre-pared. All measurements were made at room temperature(25± 2∘C).Theprocedureswere repeated for other analyte ali-quots and calibration plots were drawn to calculate theamount of drugs in unknown analyte samples.
2.5.2. For MXF. Aliquots of (0.1–2.0mL) the standard drugsolution (100 𝜇g mL−1) were transferred to 10mL measuringflasks and added 2.0mL of potassium hydrogen phthalate-HCl buffer of pH 3.5 and 3.0 using BCP or MO and BPB orBTB, respectively, then added to 2.0mL of all reagent solu-tions (1.0 × 10⁻³M). The mixture was extracted twice with10mL chloroform by shaking for 2.0min and then allowed tostand for clear separation of the two phases and the chloro-form layer was passed through anhydrous sodium sulphate.The absorbance of the yellow colored complexes was mea-sured at 410, 415, 416, and 420 nm using BCP, BTB, BPB, andMO, respectively, against corresponding reagent blank simi-larly prepared. Allmeasurements weremade at room temper-ature (25 ± 2∘C).The procedures were repeated for other ana-lyte aliquots and calibration plots were drawn to calculate theamount of drugs in unknown analyte samples.
2.5.3. For ENF. Aliquots of (0.2–2.4mL) the standard drugsolution (100 𝜇g mL−1) were transferred to 10mL measuringflasks and added 2.0mL of acetate buffer of pH 3.0 using BCGor BTB and then added to 2.0mL of reagent solutions (1.0 ×10⁻³M). The mixture was extracted twice with 10mL chloro-form by shaking for 2.0min, then allowed to stand for clearseparation of the two phases and the chloroform layer was
passed through anhydrous sodium sulphate. The absorbanceof the yellow colored complexes was measured at 419 and414 nm using BCG and BTB, respectively, against corres-ponding reagent blank similarly prepared. All measurementswere made at room temperature (25 ± 2∘C). The procedureswere repeated for other analyte aliquots and calibration plotswere drawn to calculate the amount of drug in unknown ana-lyte samples.
2.6. Applications to Pharmaceutical Formulations
2.6.1. Procedure for Tablets. The contents of ten tablets (Fac-tive, Flobiotic, or GemiQue) labeled to contain 320mg GMFper tablet and (Avelox orMoxiflox) labeled to contain 400mgMXF per tablet were crushed, powdered, and weighted outand the average weight of one tablet was determined. Anaccurate weight equivalent to 10mg GMF or MXF was dis-solved in 20mL of 0.5MHClwith shaking for 5.0min and fil-tered.The filtrate was diluted to 100mL with bidistilled waterin a 100mL measuring flask to give 100𝜇g mL−1 stock solu-tion. An aliquot of the diluted drug solution was treated asdescribed previously.
2.6.2. Procedure for Injection. Accurate volumes of Enrocin10% or Avitryl 20% of injectable quantity equivalent to200mg were extracted with 10mL of 0.5M HCl, diluted withwater, and sonicated for about 5.0min. The extracts weretransferred into 100mL volumetric flasks and then diluted tovolumewith bidistilledwater. Aliquots of these solutionsweretransferred into a series of 10mL volumetric flasks, and theanalysis was completed as previously mentioned.
2.7. Stoichiometric Relationship. The stoichiometric ratios ofthe ion-associates formed between the drugs under investiga-tion and the reagents were determined by applying the con-tinuous variation [49] and the molar ratio [50] methods atthe wavelengths of maximum absorbance. In continuous var-iation method, equimolar solutions were employed: 5.0 ×10⁻⁴M standard solutions of drug and 5.0 × 10⁻⁴M solutionsof dye were used. A series of solutions was prepared in whichthe total volume of the studied drugs and the dye was kept at2.0mL.The drug and reagent were mixed in various comple-mentary proportions (0 : 2, 0.2 : 1.8, 0.4 : 1.6,. . .,2 : 0, inclusive)and completed to volume in a 10 mL calibrated flask withthe appropriate solvent for extraction following the abovementioned procedure. In themolar ratiomethod, the concen-trations of GMF, MXF, and ENF are kept constant (1.0mL of5.0 × 10−4M) while that of dyes (5.0 × 10⁻⁴M) are regularlyvaried (0.2–2.4mL). The absorbance of the prepared solu-tions optimum is measured at optimum condition at wave-length for each complex.
3. Results and Discussion
3.1. Absorption Spectra. The nitrogenous drugs are present inpositively charged protonated forms and anionic dyes of sul-fonephthalein group present mainly in anionic form at pH ≥2.5. So when treated with an acid dye at pH range 2.8–4.0 of
4 Journal of Analytical Methods in Chemistry
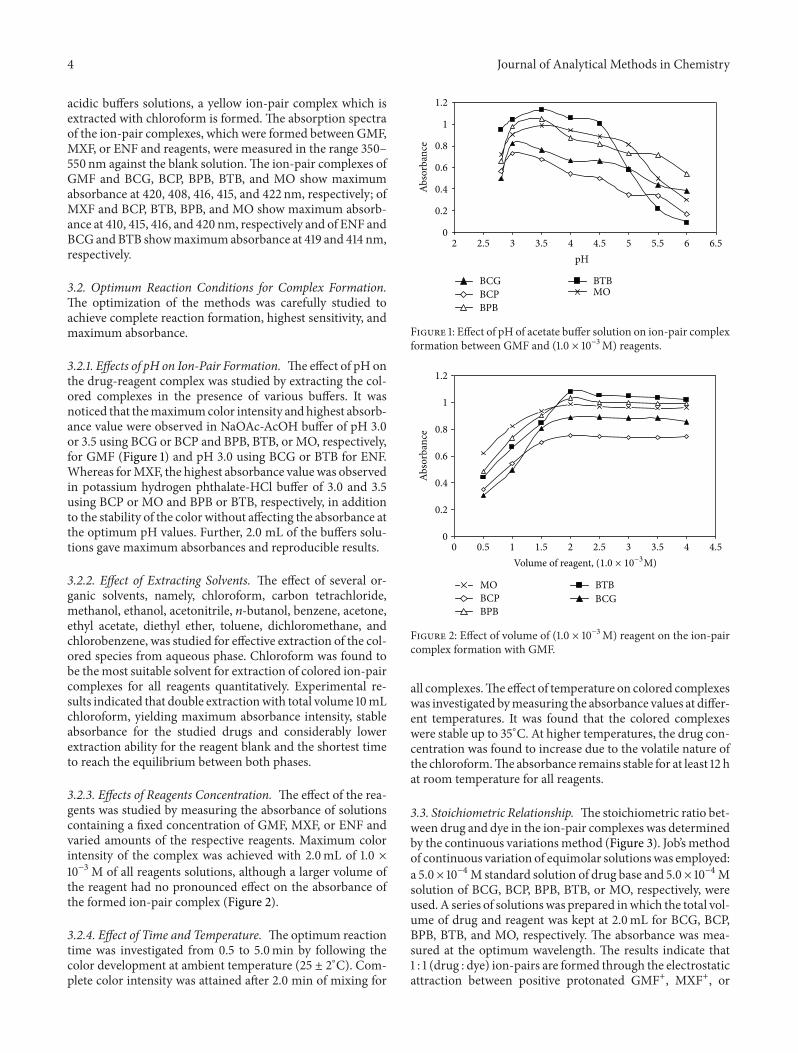
acidic buffers solutions, a yellow ion-pair complex which isextracted with chloroform is formed. The absorption spectraof the ion-pair complexes, which were formed between GMF,MXF, or ENF and reagents, were measured in the range 350–550 nm against the blank solution.The ion-pair complexes ofGMF and BCG, BCP, BPB, BTB, and MO show maximumabsorbance at 420, 408, 416, 415, and 422 nm, respectively; ofMXF and BCP, BTB, BPB, and MO show maximum absorb-ance at 410, 415, 416, and 420 nm, respectively and of ENF andBCGandBTB showmaximumabsorbance at 419 and 414 nm,respectively.
3.2. Optimum Reaction Conditions for Complex Formation.The optimization of the methods was carefully studied toachieve complete reaction formation, highest sensitivity, andmaximum absorbance.
3.2.1. Effects of pH on Ion-Pair Formation. The effect of pH onthe drug-reagent complex was studied by extracting the col-ored complexes in the presence of various buffers. It wasnoticed that themaximumcolor intensity andhighest absorb-ance value were observed in NaOAc-AcOH buffer of pH 3.0or 3.5 using BCG or BCP and BPB, BTB, or MO, respectively,for GMF (Figure 1) and pH 3.0 using BCG or BTB for ENF.Whereas forMXF, the highest absorbance valuewas observedin potassium hydrogen phthalate-HCl buffer of 3.0 and 3.5using BCP or MO and BPB or BTB, respectively, in additionto the stability of the color without affecting the absorbance atthe optimum pH values. Further, 2.0 mL of the buffers solu-tions gave maximum absorbances and reproducible results.
3.2.2. Effect of Extracting Solvents. The effect of several or-ganic solvents, namely, chloroform, carbon tetrachloride,methanol, ethanol, acetonitrile, 𝑛-butanol, benzene, acetone,ethyl acetate, diethyl ether, toluene, dichloromethane, andchlorobenzene, was studied for effective extraction of the col-ored species from aqueous phase. Chloroform was found tobe the most suitable solvent for extraction of colored ion-paircomplexes for all reagents quantitatively. Experimental re-sults indicated that double extractionwith total volume 10mLchloroform, yielding maximum absorbance intensity, stableabsorbance for the studied drugs and considerably lowerextraction ability for the reagent blank and the shortest timeto reach the equilibrium between both phases.
3.2.3. Effects of Reagents Concentration. The effect of the rea-gents was studied by measuring the absorbance of solutionscontaining a fixed concentration of GMF, MXF, or ENF andvaried amounts of the respective reagents. Maximum colorintensity of the complex was achieved with 2.0mL of 1.0 ×10⁻³M of all reagents solutions, although a larger volume ofthe reagent had no pronounced effect on the absorbance ofthe formed ion-pair complex (Figure 2).
3.2.4. Effect of Time and Temperature. The optimum reactiontime was investigated from 0.5 to 5.0min by following thecolor development at ambient temperature (25 ± 2∘C). Com-plete color intensity was attained after 2.0 min of mixing for
0
0.2
0.4
0.6
0.8
1
1.2
2 2.5 3 3.5 4 4.5 5 5.5 6 6.5pH
Abso
rban
ce
BCGBCPBPB
BTBMO
Figure 1: Effect of pH of acetate buffer solution on ion-pair complexformation between GMF and (1.0 × 10⁻³M) reagents.
0
0.2
0.4
0.6
0.8
1
1.2
0 0.5 1 1.5 2 2.5 3 3.5 4 4.5
Abso
rban
ce
MOBCPBPB
BTBBCG
Volume of reagent, (1.0 × 10⁻³M)
Figure 2: Effect of volume of (1.0 × 10⁻³M) reagent on the ion-paircomplex formation with GMF.
all complexes.The effect of temperature on colored complexeswas investigated bymeasuring the absorbance values at differ-ent temperatures. It was found that the colored complexeswere stable up to 35∘C. At higher temperatures, the drug con-centration was found to increase due to the volatile nature ofthe chloroform.The absorbance remains stable for at least 12 hat room temperature for all reagents.
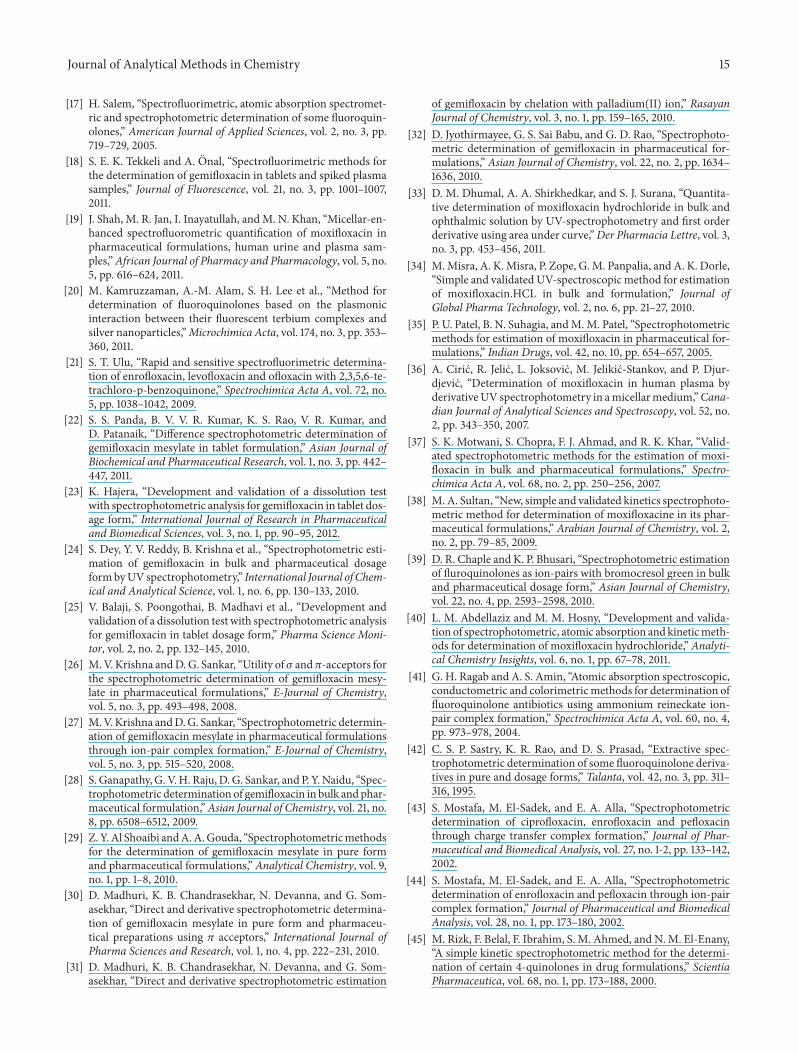
3.3. Stoichiometric Relationship. The stoichiometric ratio bet-ween drug and dye in the ion-pair complexes was determinedby the continuous variationsmethod (Figure 3). Job’s methodof continuous variation of equimolar solutionswas employed:a 5.0× 10⁻⁴Mstandard solution of drug base and 5.0× 10⁻⁴Msolution of BCG, BCP, BPB, BTB, or MO, respectively, wereused.A series of solutionswas prepared inwhich the total vol-ume of drug and reagent was kept at 2.0mL for BCG, BCP,BPB, BTB, and MO, respectively. The absorbance was mea-sured at the optimum wavelength. The results indicate that1 : 1 (drug : dye) ion-pairs are formed through the electrostaticattraction between positive protonated GMF+, MXF+, or

Journal of Analytical Methods in Chemistry 5
00.10.20.30.40.50.60.70.80.9
1
0 0.1 0.2 0.3 0.4 0.5 0.6 0.7 0.8 0.9 1Mole fraction of MXF (Vd/ Vd + Vr)
Abso
rban
ce
BCPBTB
BPBMO
Figure 3: Job’s method of continuous variation graph for the reaction of MXF with dyes BCP, BPB, BTB, and MO, [drug] = [dye] = 5.0 ×10⁻⁴M.
C
O
OBr C
O O
C
OHOHOHO OH
BrBrBr
BrBr Br
BrBrBrBrBrBr
O
Bromophenol blue(lactoid ring)
(quinoid ring)
C
O
Br
BrBr
BrBr
Br
Br
Br
HO O
pH = 3.0
C
OHOO
MXF-BPB ion-pair complex
BPB salt
N
FO
COOH
COOH
N
N
N
FO
N
MXF
SO2 SO3H
+
+
H+
+NH
SO3
−
SO3
−
SO3
−
CH3
CH3
Scheme 2: Proposed mechanism of the reaction between MXF and BPB salt.

6 Journal of Analytical Methods in Chemistry
ENF+ and negative BCG−, BCP−, BPB−, BTB−, andMO−.Theextraction equilibrium can be represented as follows:
GMF+(aq) + D
−
(aq) ←→ GMF+D−(aq) ←→ GMF+D−
(org), (1)
where GMF+ and D− represent the protonated GMF and theanion of the dye, respectively, and the subscripts (aq) and(org) refer to the aqueous and organic phases, respectively(Scheme 2).
3.4. Conditional Stability Constants (𝐾𝑓
) of Ion-Pair Com-plexes. The stability of the ion-pair complexes was evaluated.The formation of the ion-pair complexes was rapid and theyellow color extracts were stable at least for 12 h for drug-dyewithout any change in color intensity and with the maximumabsorbance at room temperature. The conditional stabilityconstants (𝐾
𝑓
) of the ion-pair complexes for the studied drugwere calculated from the continuous variation data using thefollowing equation [51]:
𝐾𝑓
=𝐴/𝐴𝑚
[1 − 𝐴/𝐴𝑚
]𝑛+1
𝐶𝑀
(𝑛)𝑛
, (2)
where 𝐴 is the observed maximum absorbance, 𝐴𝑚
is theabsorbance value corresponding to intersection of the twotangents of the curve, 𝐶
𝑀
is the mole concentration corre-sponding tomaximumabsorbance, and 𝑛 is the stoichiometrywith which dye ion associates with drugs. The log𝐾
𝑓
valuesfor drug-dye ion-pair associates were calculated in Table 1.
3.5. Method of Validation
3.5.1. Linearity. At described experimental conditions forGMF, MXF, and ENF determination, standard calibrationcurves with reagents were constructed by plotting absorbanceversus concentration.The statistical parameters were given inthe regression equation calculated from the calibrationgraphs. The linearity of calibration graphs was proved by thehigh values of the correlation coefficient (𝑟) and the small val-ues of the𝑦-intercepts of the regression equations.The appar-ent molar absorptivities of the resulting colored ion-paircomplexes and relative standard deviation of response factorsfor each proposed spectrophotometric method were also cal-culated and recorded in Table 1. The molar absorptivity ofBCP>BCG>BTB>MO>BPB ion-pair complexes forGMF,while for MXF the molar absorptivity of BCP > BTB > BPB >MO ion-pair complexes, also, the molar absorptivity ofBCG > BTB ion-pair complexes for ENF.
3.5.2. Sensitivity. The limits of detection (LOD) and quantita-tion (LOQ) for the proposed methods were calculated usingthe following equation [51, 52]:
LOD = 3𝑠𝑘, LOQ = 10𝑠
𝑘, (3)
where is the standard deviation of the response of the blank orthe standard deviation of intercepts of regression lines and 𝑘is the sensitivity, namely, the slope of the calibration graph.
In accordance with the formula, the limits of detection forGMFwere found to be 0.23, 0.26, 0.52, 0.28, and 0.87 𝜇gmL−1for BCG, BCP, BTB, BPB, and MO methods, respectively.Whereas, for MXF the detection limits were found to be 0.21,0.56, 0.25, and 0.41 𝜇g mL−1 for BCP, BTB, BPB, and MOmethods, respectively. Also, for ENF the detection limits werefound to be 0.48 and 0.51 𝜇gmL−1 for BCGandBTBmethods,respectively.
According to this equation, the limit of quantitation forGMF was found to be 0.77, 0.87, 1.73, 0.93, and 2.90 𝜇gmL−1for BCG, BCP, BTB, BPB, and MO methods, respectively.Whereas, for MXF the detection limits were found to be 0.70,1.87, 0.83, and 1.37 𝜇gmL−1 for BCP, BTB, BPB, and MOmethods, respectively. Also, for ENF the detection limits werefound to be 1.6 and 1.70𝜇g mL−1 for BCG and BTB methods,respectively.
3.5.3. Accuracy and Precision. Specificity of ion-pair reactionand selective determination of GMF, MXF, and ENF whichwere the basic nitrogenous compounds with acid dyes couldbe possible. Percentage relative standard deviation (RSD%) asprecision and percentage relative error (RE%) as accuracy ofthe suggestedmethods were calculated. Precision was carriedout by six determinations at four different concentrations inthese spectrophotometric methods. The percentage relativeerror was calculated using the following equation:
RE% = [ founded − addedadded
] × 100. (4)
The interday and intraday precision and accuracy resultsare shown in Tables 2, 3, and 4. These results of accuracy andprecision show that the proposed methods have good repeat-ability and reproducibility.
3.5.4. Robustness and Ruggedness. For the evaluation of themethod robustness, some parameters were interchanged: pH,dye concentration, wavelength range, and shaking time. Thecapacity remains unaffected by small deliberate variations.Method ruggedness was expressed as RSD% of the same pro-cedure applied by two analysts and with two different instru-ments on different days. The results showed no statistical dif-ferences between procedures done with different analysts andinstruments suggesting that the developed methods wererobust and rugged.
3.6. Effects of Interference. To assess the usefulness of themethod, the effect of diluents, excipients, and additives whichoften accompany GMF, MXF, and ENF in their dosage forms(starch, lactose, glucose, sucrose, talc, sodium chloride, tita-nium dioxide, and magnesium stearate) was studied. The re-sults indicated that there is no interference from excipientsand additives, indicating a high selectivity for determiningthe studied GMF, MXF, and ENF in their dosage forms.
3.7. Analysis of Pharmaceutical Formulations. The proposedmethods have been successfully applied to the determinationof GMF, MXF, and ENF in pharmaceutical dosage forms. Six

Journal of Analytical Methods in Chemistry 7
Table1:Statisticalanalysisof
calib
ratio
ngraphs
andanalyticaldatain
thed
eterminationof
thes
tudied
drugsu
singthep
ropo
sedmetho
ds.
Parameters
GMF
MXF
ENF
BCG
BCP
BTB
BPB
MO
BCP
BTB
BPB
MO
BCG
BTB
Wavele
ngths𝜆
max(nm)
420
408
415
416
422
410
415
416
420
419
414
pH3.0
3.0
3.5
3.5
3.5
3.0
3.5
3.0
3.5
3.0
3.0
Beer’slaw
limits
(𝜇gm
L−1 )
1.0–16
1.0–12
2.0–
161.0
–16
3.0–
301.0
–12
2.0–
181.0
–10
2.0–
202.0–
202.0–
24Molar
absorptiv
ity𝜀
(L/m
ol−1 cm−1 )×10
42.1787
3.9244
1.8904
2.44
570.9386
3.3572
1.9365
4.1976
1.2876
1.4126
1.198
Sand
ell’ssensitivity
(ngc
m−2 )
22.3
12.4
25.7
19.9
51.7
13.0
22.6
10.4
34.0
25.4
30.0
log𝐾𝑓
5.25±0.134.90±0.104.95±0.085.36±0.124.76±0.094.86±0.074.98±0.115.12±0.095.20±0.074.82±0.125.14±0.09
Regressio
nequatio
naIntercept(𝑎)
0.0016
0.00
420.0087
0.00
64−0.00
06−0.00
91−0.0058
−0.0137
0.0299
0.00
660.00
05Slop
e(𝑏)
0.04
470.0805
0.0382
0.0498
0.0196
0.0764
0.04
410.0953
−0.0023
0.0393
0.0334
Correlationcoeffi
cient(𝑟)
0.9998
0.9999
0.9993
0.9997
0.9996
0.9991
0.9997
0.9994
0.9995
0.9998
0.9995
LOD(𝜇gm
L−1 )b
0.23
0.26
0.52
0.28
0.87
0.21
0.56
0.25
0.41
0.48
0.51
LOQ(𝜇gm
L−1
)b0.77
0.87
1.73
0.93
2.90
0.70
1.87
0.83
1.37
1.60
1.70
Mean±SD
99.80±1.1499.60±0.7499.90±0.9099.75±1.0599.65±0.8699.95±0.74100.10±1.0799.60±0.8299.70±0.79100.05±0.9899.80±0.87
RSD%
1.14
0.74
0.90
1.05
0.86
0.74
1.07
0.82
0.79
0.98
0.87
RE%
1.20
0.77
0.94
1.10
0.90
0.78
1.12
0.86
0.83
1.03
0.91
𝑡-testc
0.23
0.50
0.19
0.29
0.42
0.01
0.11
0.26
0.19
0.24
0.07
𝐹-te
stc3.49
1.47
2.18
2.96
1.98
1.35
1.54
1.10
1.19
1.24
1.02
a 𝐴=𝑎+𝑏𝐶,w
here𝐶isthec
oncentratio
nin𝜇gm
L−1and𝑦isthea
bsorbanceu
nits.
b LOD:lim
itof
detection;
LOQ:lim
itof
quantifi
catio
n;𝜀:m
olar
absorptiv
ity.
c Thetheoreticalvalues
of𝑡and𝐹at𝑃=0.05are2
.571
and5.05,respectively
.

8 Journal of Analytical Methods in Chemistry
Table2:Intraday
andinterday
precision
andaccuracy
dataforG
MFob
tained
bythep
ropo
sedmetho
ds.
Metho
dAd
ded(𝜇gmL−
1 )Intraday
Interday
Recovery
%Precision
RSD%
aAc
curacy
RE%
Con
fidence
limitb
Recovery
%Precision
RSD%
aAc
curacy
RE%
Con
fidence
limitb
BCG
5.0
99.30
0.53
−0.80
4.996±0.026
100.60
0.43
0.60
5.03±0.022
1099.50
0.65
−0.50
9.950±0.065
99.30
0.59
−0.70
9.930±0.059
1599.10
0.82
−0.90
14.865±0.122
99.90
0.83
−0.10
14.985±0.124
BCP
4.0
100.60
0.47
0.60
4.024±0.019
99.30
0.51
−0.70
3.988±0.02
8.0
99.20
0.72
−0.80
7.936±0.057
99.70
0.70
−0.30
7.976±0.056
12100.20
1.17
0.20
12.024±0.141
100.30
1.10
0.30
12.036±0.132
BPB
5.0
100.10
0.49
0.10
5.005±0.025
99.60
0.62
−0.40
4.98±0.031
1099.80
0.79
−0.20
9.98±0.079
99.40
0.87
−0.60
9.94±0.086
1599.70
1.01
−0.30
14.955±0.151
100.20
1.24
0.20
15.03±0.23
BTB
5.0
99.60
0.65
−0.40
4.98±0.032
99.70
0.54
−0.30
4.985±0.027
10100.10
0.88
0.10
10.01±
0.088
99.30
0.75
−0.70
9.93±0.074
15100.40
0.93
0.40
15.06±0.140
100.20
1.08
0.20
15.03±0.162
MO
1099.60
0.44
−0.40
9.96±0.04
499.50
0.52
−0.50
9.95±0.052
2099.80
0.68
−0.20
19.96±0.136
99.70
0.83
−0.30
19.94±0.166
30100.30
0.98
0.30
30.09±0.295
100.20
1.20
0.20
30.06±0.361
a Meanof
sixdeterm
inations;R
SD%:percentager
elatives
tand
arddeviation;
RE%:percentager
elativee
rror.
b Con
fidence
limitat95%confi
dencelevelandfived
egrees
offre
edom
(𝑡=2.571).

Journal of Analytical Methods in Chemistry 9
Table3:Intraday
andinterday
precision
andaccuracy
dataforM
XFob
tained
bythep
ropo
sedmetho
ds.
Metho
dAd
ded(𝜇gm
L−1 )
Intraday
Interday
Recovery
%Precision
RSD%
aAc
curacy
RE%
Con
fidence
limitb
Recovery
%Precision
RSD%
aAc
curacy
RE%
Con
fidence
limitb
BCP
2.0
99.50
0.36
−0.50
1.99±0.007
99.00
0.38
−1.0
01.9
8±0.008
6.0
100.20
0.57
0.20
6.012±0.034
99.60
0.70
−0.40
5.976±0.04
210
100.50
0.81
0.50
10.05±0.081
99.80
0.92
−0.20
9.98±0.092
BPB
5.0
99.20
0.42
−0.80
4.96±0.021
100.30
0.50
0.30
5.015±0.025
1099.50
0.76
−0.50
9.95±0.076
99.20
0.79
−0.80
9.92±0.078
1599.70
0.90
−0.30
14.955±0.135
99.60
1.16
−0.40
14.94±0.173
BTB
2.0
99.40
0.50
−0.60
1.988±0.01
100.10
0.58
0.10
2.002±0.012
6.0
99.20
0.79
−0.80
5.952±0.047
99.70
0.76
−0.30
5.982±0.045
1099.50
1.05
−0.50
9.95±0.104
99.30
1.07
−0.70
9.93±0.106
MO
5.0
100.30
0.42
0.30
5.015±0.021
100.40
0.47
0.40
5.02±0.024
10100.60
0.85
0.60
10.06±0.086
99.80
0.83
−0.20
9.98±0.083
1599.90
1.19
−0.10
14.985±0.178
99.20
1.23
−0.80
14.88±0.183
a Meanof
sixdeterm
inations;R
SD%:percentager
elatives
tand
arddeviation;
RE%:percentager
elativee
rror.
b Con
fidence
limitat95%confi
dencelevelandfived
egrees
offre
edom
(𝑡=2.571).

10 Journal of Analytical Methods in Chemistry
Table4:Intraday
andinterday
precision
andaccuracy
dataforE
NFob
tained
bythep
ropo
sedmetho
ds.
Metho
dAd
ded
(𝜇gm
L−1 )
Intraday
Interday
Recovery
%Precision
RSD%
aAc
curacy
RE%
Con
fidence
limitb
Recovery
%Precision
RSD%
aAc
curacy
RE%
Con
fidence
limitb
BCG
5.0
99.10
0.42
−0.90
4.955±0.021
99.60
0.51
−0.40
4.98±0.025
10100.20
0.78
0.20
10.02±0.078
99.80
0.75
0.20
9.98±0.075
1599.40
1.16
−0.60
14.91±0.173
99.20
1.02
−0.80
14.88±0.152
BTB
5.0
99.30
0.53
−0.70
4.965±0.026
100.60
0.40
0.60
5.03±0.020
1099.50
0.90
−0.50
9.95±0.09
99.40
0.68
−0.60
9.94±0.06
820
100.50
1.15
0.50
20.10±0.231
99.60
0.96
−0.40
19.92±0.191
a Meanof
sixdeterm
inations;R
SD%:percentager
elatives
tand
arddeviation;
RE%:percentager
elativee
rror.
b Con
fidence
limitat95%confi
dencelevelandfived
egrees
offre
edom
(𝑡=2.571).

Journal of Analytical Methods in Chemistry 11
Table5:Determinationof
GMFin
itsph
armaceutic
aldo
sage
form
sapp
lyingthes
tand
ardadditio
ntechniqu
e.
Reagent T
aken
(𝜇gm
L−1 )
Pure
drug
added(𝜇gm
L−1 )
Factivetablets
Flob
iotic
tablet
Gem
iQue
tablets
Totalfou
nd(𝜇gm
L−1 )
Recovery
%a±SD
Totalfou
nd(𝜇gm
L−1 )
Recovery
%±SD
Totalfou
nd(𝜇gm
L−1 )
Recovery
%±SD
BCG
2.0
4.0
5.96
99.30±0.78
5.98
99.60±0.67
6.02
100.30±0.51
8.0
9.91
99.10±1.0
210.02
100.20±0.82
9.92
99.20±0.70
1213.97
99.80±1.2
413.96
99.70±1.09
13.99
99.90±0.94
BCP
2.0
2.0
3.996
99.90±0.66
3.96
99.10±0.42
3.97
99.30±0.38
6.0
8.02
100.20±0.90
7.98
99.80±0.69
7.99
99.90±0.84
1011.92
99.30±0.95
12.05
100.40±1.03
11.95
99.60±1.17
BPB
2.0
4.0
5.97
99.50±0.57
5.99
99.80±0.36
6.01
100.15±0.76
8.0
9.97
99.70±0.76
9.96
99.60±0.49
9.97
99.70±0.96
1213.87
99.10±1.14
13.97
99.90±0.78
13.89
99.20±1.21
BTB
2.0
4.0
6.03
100.50±0.48
6.01
100.10±0.53
6.01
100.10±0.54
8.0
9.90
99.00±0.72
9.96
99.60±0.85
9.96
99.60±1.03
1213.93
99.50±0.97
13.96
99.70±1.31
14.04
100.30±1.15
MO
5.0
5.0
9.97
99.70±0.32
9.91
99.10±0.70
9.99
99.90±0.65
1014.94
99.60±0.56
15.06
100.40±1.05
14.97
99.80±0.85
2024.95
99.80±0.90
24.88
99.50±1.25
24.90
99.60±1.10
a Average
ofsix
determ
inations.

12 Journal of Analytical Methods in Chemistry
Table6:Determinationof
MXF
inits
pharmaceutic
aldo
sage
form
sapp
lyingthes
tand
ardadditio
ntechniqu
e.
ReagentTaken(𝜇gmL−
1 )Pu
redrug
added(𝜇gmL−
1 )Av
elox
tablets
Moxiflox
tablets
Moxifloxacin
tablets
Totalfou
nd(𝜇gm
L−1 )
Recovery
%a±SD
Totalfou
nd(𝜇gm
L−1 )
Recovery
%±SD
Totalfou
nd(𝜇gm
L−1 )
Recovery
%±SD
BCP
2.0
2.0
3.98
99.40±0.56
3.96
99.10±0.62
3.98
99.60±0.48
6.0
7.98
99.70±0.83
8.06
100.70±0.89
7.98
99.80±1.10
1011.89
99.10±1.2
012.02
100.20±1.26
11.92
99.30±1.17
BPB
2.0
4.0
5.98
99.60±0.61
5.97
99.50±0.35
5.96
99.30±0.36
8.0
9.99
99.90±0.84
9.96
99.60±0.60
9.99
99.90±0.63
1214.07
100.50±1.14
13.99
99.90±0.85
14.08
100.60±1.36
BTB
2.0
2.0
3.98
99.50±0.48
3.97
99.20±0.33
4.01
100.20±0.61
4.0
5.95
99.20±0.92
5.99
99.80±0.65
5.96
99.30±0.84
8.0
10.04
100.40±1.17
10.01
100.10±0.93
9.95
99.50±1.07
MO
5.0
5.0
9.91
99.10±0.42
9.94
99.40±0.37
9.95
99.50±0.45
1015.08
100.50±0.76
15.03
100.20±0.75
14.97
99.80±0.85
1519.90
99.50±1.16
19.92
99.60±1.28
19.83
99.15±0.90
a Average
ofsix
determ
inations.

Journal of Analytical Methods in Chemistry 13
Table 7: Determination of ENF in its pharmaceutical dosage forms applying the standard addition technique.
ReagentTaken (𝜇gmL−1) Pure drug added (𝜇gmL−1) Enrocin 10% injectable Avitryl 20% injectableTotal found (𝜇gmL−1) Recovery %a
± SD Total found (𝜇gmL−1) Recovery % ± SD
BCG5.0 5.0 9.92 99.20 ± 0.48 9.94 99.40 ± 0.46
10 14.94 99.60 ± 0.66 15.20 100.10 ± 0.7215 19.98 99.90 ± 0.82 19.90 99.50 ± 1.05
BBTB5.0 5.0 10.05 100.50 ± 0.56 9.97 99.70 ± 0.52
10 14.91 99.40 ± 0.83 15.05 100.30 ± 0.6915 19.84 99.20 ± 1.20 19.82 99.10 ± 0.95
aAverage of six determinations.
Table 8: Application of the proposed methods for the determination of GMF, MXF, and ENF in their pharmaceutical preparations.
Samples Reported methodsc Proposed methodsBCG BCP BPB BTB MO
Factive tabletsX ± SDa
100.08 ± 0.56 99.90 ± 0.62 100.15 ± 0.74 99.75 ± 0.53 99.80 ± 0.71 100.20 ± 0.59
t-valueb 0.20 0.07 0.39 0.28 0.13F-valueb 1.23 1.75 1.12 1.61 1.11
Flobiotic tabletsX ± SDa
99.94 ± 0.68 99.68 ± 0.80 99.79 ± 0.57 99.90 ± 0.73 100.10 ± 0.84 100.20 ± 0.77
t-valueb 0.23 0.15 0.04 0.14 0.23F-valueb 1.38 1.42 1.15 1.53 1.67
GemiQue tabletsX ± SDa
99.85 ± 0.49 99.70 ± 0.60 100.05 ± 0.57 99.60 ± 0.38 99.96 ± 0.55 99.55 ± 0.63
t-valueb 0.18 0.24 0.37 0.14 0.34F-valueb 1.50 1.35 1.66 1.26 1.65
Avelox tabletsX ± SDa
99.03 ± 0.97 99.60 ± 0.74 99.35 ± 0.96 99.10 ± 1.20 99.50 ± 0.82
t-valueb 0.47 0.21 0.04 0.34F-valueb 1.72 1.02 1.53 1.40
Moxiflox tabletsX ± SDa
99.34 ± 0.34 99.15 ± 0.52 99.50 ± 0.46 99.62 ± 0.43 99.55 ± 0.60
t-valueb 0.28 0.26 0.47 0.28F-valueb 2.34 1.83 1.60 3.11
Moxifloxacin tabletsX ± SDa
99.94 ± 0.92 99.70 ± 1.05 99.85 ± 0.80 100.15 ± 0.98 99.90 ± 0.84
t-valueb 0.16 0.07 0.14 0.03F-valueb 1.30 1.32 1.13 1.20
Enrocxin 10% injectableX ± SDa
99.85 ± 0.43 99.70 ± 0.68 100.10 ± 0.32
t-valueb 0.17 0.43F-valueb 2.50 1.81
Avitryl 20% injectableX ± SDa
99.78 ± 0.64 99.50 ± 0.48 99.46 ± 0.47
t-valueb 0.32 0.37F-valueb 1.78 1.85
aAverage of six determinations.bTheoretical values for 𝑡- and 𝐹-values at five degrees of freedom and 95% confidence limit are 𝑡 = 2.57 and 𝐹 = 5.05.cReported spectrophotometric methods for GMF [29], MXF [40], and ENF [44].

14 Journal of Analytical Methods in Chemistry
replicate determinations were made. Moreover, to check thevalidity of the proposed methods, dosage forms were testedfor possible interference with standard addition method(Tables 5, 6, and 7). There was no significant difference bet-ween slopes of calibration curves and standard additionmethods.Therefore it is concluded that the excipients in phar-maceutical dosage forms of GMF, MXF, and ENF were notfound any interference in the analysis of GMF,MXF, and ENF.At 95% confidence level the calculated 𝑡- and𝐹-values did notexceed the theoretical𝐹-value indicating no significant differ-ence between the proposed methods and the reported meth-ods for GMF [29], MXF [40], and ENF [44] (Table 8) [52].The results show that satisfactory recovery datawere obtainedand the assay results were in good agreement with thereported methods.
4. Conclusion
This paper describes the application of extractive ion-paircomplexation reactionwith acid dyes for the quantification ofsome fluoroquinolones antibiotics (GMF, MXF, and ENF) inpure forms and pharmaceutical formulations. Comparedwith the existing visible spectrophotometric methods, theproposed methods have the advantages of being relativelysimple, rapid, cost-effective, free from auxiliary reagents, andmore sensitive for determination of the studied drugs in pureform and pharmaceutical formulations. Moreover, the pro-posedmethods are free from tedious experimental steps suchas heating unlike the previously reported spectrophotometricmethods cited earlier. The most attractive feature of thesemethods is their relative freedom from interference by theusual diluents and excipients in amounts far in excess of theirnormal occurrence in pharmaceutical formulations. Thestatistical parameters and the recovery data reveal high preci-sion and accuracy of the methods besides being robust andrugged. Therefore, the validated method could be useful forroutine quality control assay of the studied drugs in pureforms and pharmaceutical formulations.
Conflicts of Interests
There is no other conflict of interests related to this paper.
Authors’ Contribution
All the authors contributed to the concept anddesign,makingand analysis of data, drafting, revising, and final approval.Ayman A. Gouda is responsible for the study registration.Ayman A. Gouda and Amira G. Yousef have done the experi-ments. Alaa S. Amin provided test samples, reference mate-rial, and data analysis. AymanA. Gouda and Ragaa El-Sheikhare responsible for interpretation, paper writing, and admin-istrative support. All authors read and approved the finalpaper.
References
[1] S. Budavari, Ed.,The Merck Index, Merck and Co., WhitehouseStation, NJ, USA, 13th edition, 2001.
[2] C. S. Sean, Martindale, The Complete Drug Reference, RoyalPharmaceutical Society, Pharmaceutical Press, London, UK,36th Edn edition, 2009.
[3] M. K. Bolon, “The newer fluoroquinolones,” Infectious DiseaseClinics of North America, vol. 23, no. 4, pp. 1027–1051, 2009.
[4] The United States Pharmacopoeia, 35, NF 30, vol. 1, UnitedStates Pharmacopeial Convention, Rockville, Md, USA, 2012.
[5] S. Shamim, N. Sultana, M. S. Arayne, M. Akhtar, and S. Gul,“Optimization and simultaneous determination of gemiflox-acin and Non-steroidal anti-inflammatory drugs in bulk, phar-maceutical formulations and human serumbyRP-HPLC and itsapplications,” International Research Journal of Pharmacy andPharmacology, vol. 2, no. 10, pp. 245–253, 2012.
[6] B. M. H. Al-Hadiya, A. A. Khady, and G. A. E. Mostafa, “Valid-ated liquid chromatographic-fluorescencemethod for the quan-titation of gemifloxacin in human plasma,” Talanta, vol. 83, no.1, pp. 110–116, 2010.
[7] A. S. Amin, H. A. Dessouki, and I. A. Agwa, “Ion-pairing andreversed phase liquid chromatography for the determination ofthree different quinolones: enrofloxacin, lomefloxacin andoflox-acin,” Arabian Journal of Chemistry, vol. 4, no. 3, pp. 249–257,2011.
[8] A. R. Rote and S. P. Pingle, “Reverse phase-HPLC and HPTLCmethods for determination of gemifloxacin mesylate in humanplasma,” Journal of Chromatography B, vol. 877, no. 29, pp. 3719–3723, 2009.
[9] N. Sultana, M. S. Arayne, M. Akhtar, S. Shamim, S. Gul, andM.M. Khan, “High-performance liquid chromatography assay formoxifloxacin in bulk, pharmaceutical formulations and serum:application to in-vitrometal interactions,” Journal of the ChineseChemical Society, vol. 57, no. 4, pp. 708–717, 2010.
[10] S. I. Cho, J. Shim, M.-S. Kim, Y.-K. Kim, and D. S. Chung, “On-line sample cleanup and chiral separation of gemifloxacin in aurinary solution using chiral crown ether as a chiral selector inmicrochip electrophoresis,” Journal of Chromatography A, vol.1055, no. 1-2, pp. 241–245, 2004.
[11] E. Kim, Y.-M. Koo, and D. S. Chung, “Chiral counter-currentchromatography of gemifloxacin guided by capillary electroph-oresis using (+)-(18-crown-6)-tetracarboxylic acid as a chiralselector,” Journal of Chromatography A, vol. 1045, no. 1-2, pp.119–124, 2004.
[12] A. F. Faria, M. V. N. de Souza, M. V. de Almeida, andM. A. L. deOliveira, “Simultaneous separation of five fluoroquinolone anti-biotics by capillary zone electrophoresis,” Analytica ChimicaActa, vol. 579, no. 2, pp. 185–192, 2006.
[13] A. Radi, A.Khafagy,A. El-shobaky, andH. El-mezayen, “AnodicVoltammetric determination of gemifloxacin using screen-printed carbon electrode,” Journal of Pharmaceutical Analysis,vol. 3, no. 2, pp. 132–136, 2013.
[14] A. A. Ensaifi, T. Khayamian, and M. Taei, “Determination ofultra trace amount of enrofloxacin by adsorptive cathodic strip-ping voltammetry using copper(II) as an intermediate,”Talanta,vol. 78, no. 3, pp. 942–948, 2009.
[15] A.-E. Radi, T. Wahdan, Z. Anwar, and H. Mostafa, “Elec-trochemical determination of gatifloxacin, moxifloxacin andsparfloxacin fluoroquinolonic antibiotics on glassy carbon elec-trode in pharmaceutical formulations,” Drug Testing and Anal-ysis, vol. 2, no. 8, pp. 397–400, 2010.
[16] S. M. Al-Ghannam, “Atomic absorption spectroscopic, conduc-tometric and colorimetric methods for determination of somefluoroquinolone antibacterials using ammonium reineckate,”Spectrochimica Acta A, vol. 69, no. 4, pp. 1188–1194, 2008.
Journal of Analytical Methods in Chemistry 15
[17] H. Salem, “Spectrofluorimetric, atomic absorption spectromet-ric and spectrophotometric determination of some fluoroquin-olones,” American Journal of Applied Sciences, vol. 2, no. 3, pp.719–729, 2005.
[18] S. E. K. Tekkeli and A. Onal, “Spectrofluorimetric methods forthe determination of gemifloxacin in tablets and spiked plasmasamples,” Journal of Fluorescence, vol. 21, no. 3, pp. 1001–1007,2011.
[19] J. Shah, M. R. Jan, I. Inayatullah, andM. N. Khan, “Micellar-en-hanced spectrofluorometric quantification of moxifloxacin inpharmaceutical formulations, human urine and plasma sam-ples,”African Journal of Pharmacy and Pharmacology, vol. 5, no.5, pp. 616–624, 2011.
[20] M. Kamruzzaman, A.-M. Alam, S. H. Lee et al., “Method fordetermination of fluoroquinolones based on the plasmonicinteraction between their fluorescent terbium complexes andsilver nanoparticles,”Microchimica Acta, vol. 174, no. 3, pp. 353–360, 2011.
[21] S. T. Ulu, “Rapid and sensitive spectrofluorimetric determina-tion of enrofloxacin, levofloxacin and ofloxacin with 2,3,5,6-te-trachloro-p-benzoquinone,” Spectrochimica Acta A, vol. 72, no.5, pp. 1038–1042, 2009.
[22] S. S. Panda, B. V. V. R. Kumar, K. S. Rao, V. R. Kumar, andD. Patanaik, “Difference spectrophotometric determination ofgemifloxacin mesylate in tablet formulation,” Asian Journal ofBiochemical and Pharmaceutical Research, vol. 1, no. 3, pp. 442–447, 2011.
[23] K. Hajera, “Development and validation of a dissolution testwith spectrophotometric analysis for gemifloxacin in tablet dos-age form,” International Journal of Research in Pharmaceuticaland Biomedical Sciences, vol. 3, no. 1, pp. 90–95, 2012.
[24] S. Dey, Y. V. Reddy, B. Krishna et al., “Spectrophotometric esti-mation of gemifloxacin in bulk and pharmaceutical dosageformbyUV spectrophotometry,” International Journal of Chem-ical and Analytical Science, vol. 1, no. 6, pp. 130–133, 2010.
[25] V. Balaji, S. Poongothai, B. Madhavi et al., “Development andvalidation of a dissolution test with spectrophotometric analysisfor gemifloxacin in tablet dosage form,” Pharma Science Moni-tor, vol. 2, no. 2, pp. 132–145, 2010.
[26] M.V. Krishna andD.G. Sankar, “Utility of𝜎 and𝜋-acceptors forthe spectrophotometric determination of gemifloxacin mesy-late in pharmaceutical formulations,” E-Journal of Chemistry,vol. 5, no. 3, pp. 493–498, 2008.
[27] M.V.Krishna andD.G. Sankar, “Spectrophotometric determin-ation of gemifloxacin mesylate in pharmaceutical formulationsthrough ion-pair complex formation,” E-Journal of Chemistry,vol. 5, no. 3, pp. 515–520, 2008.
[28] S. Ganapathy, G.V.H. Raju,D.G. Sankar, and P. Y.Naidu, “Spec-trophotometric determination of gemifloxacin in bulk andphar-maceutical formulation,”Asian Journal of Chemistry, vol. 21, no.8, pp. 6508–6512, 2009.
[29] Z. Y.Al Shoaibi andA.A.Gouda, “Spectrophotometricmethodsfor the determination of gemifloxacin mesylate in pure formand pharmaceutical formulations,” Analytical Chemistry, vol. 9,no. 1, pp. 1–8, 2010.
[30] D. Madhuri, K. B. Chandrasekhar, N. Devanna, and G. Som-asekhar, “Direct and derivative spectrophotometric determina-tion of gemifloxacin mesylate in pure form and pharmaceu-tical preparations using 𝜋 acceptors,” International Journal ofPharma Sciences and Research, vol. 1, no. 4, pp. 222–231, 2010.
[31] D. Madhuri, K. B. Chandrasekhar, N. Devanna, and G. Som-asekhar, “Direct and derivative spectrophotometric estimation
of gemifloxacin by chelation with palladium(II) ion,” RasayanJournal of Chemistry, vol. 3, no. 1, pp. 159–165, 2010.
[32] D. Jyothirmayee, G. S. Sai Babu, and G. D. Rao, “Spectrophoto-metric determination of gemifloxacin in pharmaceutical for-mulations,” Asian Journal of Chemistry, vol. 22, no. 2, pp. 1634–1636, 2010.
[33] D. M. Dhumal, A. A. Shirkhedkar, and S. J. Surana, “Quantita-tive determination of moxifloxacin hydrochloride in bulk andophthalmic solution by UV-spectrophotometry and first orderderivative using area under curve,”Der Pharmacia Lettre, vol. 3,no. 3, pp. 453–456, 2011.
[34] M.Misra, A. K.Misra, P. Zope, G.M. Panpalia, and A. K. Dorle,“Simple and validated UV-spectroscopicmethod for estimationof moxifloxacin.HCL in bulk and formulation,” Journal ofGlobal Pharma Technology, vol. 2, no. 6, pp. 21–27, 2010.
[35] P. U. Patel, B. N. Suhagia, andM.M. Patel, “Spectrophotometricmethods for estimation of moxifloxacin in pharmaceutical for-mulations,” Indian Drugs, vol. 42, no. 10, pp. 654–657, 2005.
[36] A. Ciric, R. Jelic, L. Joksovic, M. Jelikic-Stankov, and P. Djur-djevic, “Determination of moxifloxacin in human plasma byderivativeUV spectrophotometry in amicellarmedium,”Cana-dian Journal of Analytical Sciences and Spectroscopy, vol. 52, no.2, pp. 343–350, 2007.
[37] S. K. Motwani, S. Chopra, F. J. Ahmad, and R. K. Khar, “Valid-ated spectrophotometric methods for the estimation of moxi-floxacin in bulk and pharmaceutical formulations,” Spectro-chimica Acta A, vol. 68, no. 2, pp. 250–256, 2007.
[38] M.A. Sultan, “New, simple and validated kinetics spectrophoto-metric method for determination of moxifloxacine in its phar-maceutical formulations,” Arabian Journal of Chemistry, vol. 2,no. 2, pp. 79–85, 2009.
[39] D. R. Chaple and K. P. Bhusari, “Spectrophotometric estimationof fluroquinolones as ion-pairs with bromocresol green in bulkand pharmaceutical dosage form,” Asian Journal of Chemistry,vol. 22, no. 4, pp. 2593–2598, 2010.
[40] L. M. Abdellaziz and M. M. Hosny, “Development and valida-tion of spectrophotometric, atomic absorption andkineticmeth-ods for determination of moxifloxacin hydrochloride,” Analyti-cal Chemistry Insights, vol. 6, no. 1, pp. 67–78, 2011.
[41] G. H. Ragab and A. S. Amin, “Atomic absorption spectroscopic,conductometric and colorimetricmethods for determination offluoroquinolone antibiotics using ammonium reineckate ion-pair complex formation,” Spectrochimica Acta A, vol. 60, no. 4,pp. 973–978, 2004.
[42] C. S. P. Sastry, K. R. Rao, and D. S. Prasad, “Extractive spec-trophotometric determination of some fluoroquinolone deriva-tives in pure and dosage forms,” Talanta, vol. 42, no. 3, pp. 311–316, 1995.
[43] S. Mostafa, M. El-Sadek, and E. A. Alla, “Spectrophotometricdetermination of ciprofloxacin, enrofloxacin and pefloxacinthrough charge transfer complex formation,” Journal of Phar-maceutical and Biomedical Analysis, vol. 27, no. 1-2, pp. 133–142,2002.
[44] S. Mostafa, M. El-Sadek, and E. A. Alla, “Spectrophotometricdetermination of enrofloxacin and pefloxacin through ion-paircomplex formation,” Journal of Pharmaceutical and BiomedicalAnalysis, vol. 28, no. 1, pp. 173–180, 2002.
[45] M. Rizk, F. Belal, F. Ibrahim, S. M. Ahmed, and N.M. El-Enany,“A simple kinetic spectrophotometric method for the determi-nation of certain 4-quinolones in drug formulations,” ScientiaPharmaceutica, vol. 68, no. 1, pp. 173–188, 2000.

16 Journal of Analytical Methods in Chemistry
[46] Z. A. El Sherif, “Spectrophotometric determination of enroflox-acin through the formation of a binary complex with iron III,ion-pair and charge-transfer complexation in pure and dosageforms,” Analytical Letters, vol. 32, no. 1, pp. 65–78, 1999.
[47] C. S. P. Sastry, K. R. Rao, J. S. V.M. Lingeswara, andD. S. Prasad,“Two simple spectrophotometricmethods for the assay of enro-floxacin in pharmaceutical dosage formulations,” Eastern Phar-macist, vol. 38, no. 1, pp. 143–144, 1995.
[48] H. T. S. Britton,Hydrogen Ions, Chapman&Hall, NewYork, NY,USA, 4th edition, 1952.
[49] P. Job, Spectrochemical Methods of Analysis, Wiley Interscience,New York, NY, USA, 1971.
[50] J.H. Yoe andA. L. Jones, “Determination of tungsten,” Industrialand Engineering Chemistry, Analytical Edition, vol. 16, p. 111,1944.
[51] International Conference on Harmonization of Technical Re-quirements for Registration of Pharmaceuticals forHumanUse,ICH Harmonized Tripartite Guideline, Validation of AnalyticalProcedures: Text and Methodology, Q2(R1), ComplementaryGuideline on Methodology dated 06 November 1996, ICH,London, UK, 2005.
[52] J.N.Miller and J. C.Miller, Statistics andChemometrics ForAna-lytical Chemistry, Chapman &Hall/CRC, London, UK, 5th edi-tion, 2005.
Related Documents