arXiv:astro-ph/9905384v1 28 May 1999 Mon. Not. R. Astron. Soc. 000, 1–15 (1999) Printed 1 February 2008 (MN L A T E X style file v1.4) Spectral Analysis of the Stromlo-APM Survey I. Spectral Properties of Galaxies L. Tresse, 1,2,3 S. Maddox, 1,5 J. Loveday 4 and C. Singleton 1 1 Institute of Astronomy, Cambridge, CB3 0HA, UK 2 Laboratoire d’Astronomie Spatiale, Traverse du Siphon, B.P.8, 13376, Marseille Cedex 12, France 3 Istituto di Radioastronomia del CNR, Via P. Gobetti, 101, 40129 Bologna, Italia 4 Department of Astronomy and Astrophysics, University of Chicago, 5640 S. Ellis Ave, Chicago, IL 60637, USA 5 School of Physics and Astronomy, University of Nottingham, Nottingham, NG7 2RD, UK 1 February 2008 ABSTRACT We analyze spectral properties of 1671 galaxies from the Stromlo-APM survey, selected to have 15 ≤ b J ≤ 17.15 and having a mean redshift z =0.05. This is a representative local sample of field galaxies, so the global properties of the galaxy population provide a comparative point for analysis of more distant surveys. We measure Hα, [O II] λ3727, [S II] λλ6716, 6731, [N II] λ6583 and [O I] λ6300 equivalent widths and the D 4000 break index. The 5 ˚ A resolution spectra use an 8 ′′ slit, which typically covers 40– 50% of the galaxy area. We find no evidence for systematic trends depending on the fraction of galaxy covered by the slit, and further analysis suggests that our spectra are representative of integrated galaxy spectra. We classify spectra according to their Hα emission, which is closely related to massive star formation. Overall we find 61% of galaxies are Hα emitters with rest- frame equivalent widths EW(Hα) > ∼ 2 ˚ A. The emission-line galaxy (ELG) fraction is smaller than seen in the CFRS at z =0.2 (Tresse et al. 1996) and is consistent with a rapid evolution of Hα luminosity density (Tresse & Maddox 1998). The ELG fraction, and EW(Hα), increase at fainter absolute magnitudes, smaller projected area and smaller D 4000 . In the local Universe, faint, small galaxies are dominated by star formation activity, while bright, large galaxies are more quiescent. This picture of the local Universe is quite different from the distant one, where bright galaxies appear to show rapidly-increasing activity back in time. We find that the ratio [N II] λ6583/Hα is anti-correlated with EW(Hα), and that the value of 0.5 commonly used to remove the [N II] contribution from blended Hα + [N II] λλ6548, 6583 applies only for samples with an EW distribution similar to that seen at low redshift. We show that [O II], [N II], [S II] and Hα EWs are correlated, but with large dispersions (∼ 50%) due to the diversity of galaxy contents sampled. Our [O II]–Hα relation is similar to the one derived by Kennicutt (1992), but is a factor 10% higher at 1σ significance. We show that this relation is not valid for distant, strong [O II] emitters with blue colors, which are more numerous than locally. This relation would overestimate the individual star formation rate (SFR) by ∼ 50% for these kind of galaxies. We find that on average luminous blue ELG are likely to be enhanced in nitrogen abundance. This suggests that in faint, low-mass, late-type ELG, nitrogen is a primary element, whereas in more bright, more massive galaxies nitrogen it comes from a secondary source. We also find 4% of early-type galaxies which show star formation activity; this fraction seems to increase at higher redshifts. Key words: galaxies: fundamental parameters – galaxies: general – galaxies: statis- tics. 1 INTRODUCTION Studies of spectral properties within well-defined surveys are crucial to determine the evolutionary properties of galaxies. Indeed the continuum of spectra provides information on the global stellar content, while the lines are powerful diagnos- tics of the star formation rate. To understand the evolution c 1999 RAS

Welcome message from author
This document is posted to help you gain knowledge. Please leave a comment to let me know what you think about it! Share it to your friends and learn new things together.
Transcript
arX
iv:a
stro
-ph/
9905
384v
1 2
8 M
ay 1
999
Mon. Not. R. Astron. Soc. 000, 1–15 (1999) Printed 1 February 2008 (MN LATEX style file v1.4)
Spectral Analysis of the Stromlo-APM Survey
I. Spectral Properties of Galaxies
L. Tresse,1,2,3 S. Maddox,1,5 J. Loveday4 and C. Singleton1
1Institute of Astronomy, Cambridge, CB3 0HA, UK2Laboratoire d’Astronomie Spatiale, Traverse du Siphon, B.P.8, 13376, Marseille Cedex 12, France3Istituto di Radioastronomia del CNR, Via P. Gobetti, 101, 40129 Bologna, Italia4Department of Astronomy and Astrophysics, University of Chicago, 5640 S. Ellis Ave, Chicago, IL 60637, USA5School of Physics and Astronomy, University of Nottingham, Nottingham, NG7 2RD, UK
1 February 2008
ABSTRACTWe analyze spectral properties of 1671 galaxies from the Stromlo-APM survey, selectedto have 15 ≤ bJ ≤ 17.15 and having a mean redshift z = 0.05. This is a representativelocal sample of field galaxies, so the global properties of the galaxy population provide acomparative point for analysis of more distant surveys. We measure Hα, [O II] λ3727,[S II] λλ6716, 6731, [N II] λ6583 and [O I] λ6300 equivalent widths and the D4000
break index. The 5 A resolution spectra use an 8′′ slit, which typically covers 40–50% of the galaxy area. We find no evidence for systematic trends depending on thefraction of galaxy covered by the slit, and further analysis suggests that our spectraare representative of integrated galaxy spectra.
We classify spectra according to their Hα emission, which is closely related tomassive star formation. Overall we find 61% of galaxies are Hα emitters with rest-frame equivalent widths EW(Hα) >
∼ 2 A. The emission-line galaxy (ELG) fractionis smaller than seen in the CFRS at z = 0.2 (Tresse et al. 1996) and is consistentwith a rapid evolution of Hα luminosity density (Tresse & Maddox 1998). The ELGfraction, and EW(Hα), increase at fainter absolute magnitudes, smaller projected areaand smaller D4000. In the local Universe, faint, small galaxies are dominated by starformation activity, while bright, large galaxies are more quiescent. This picture of thelocal Universe is quite different from the distant one, where bright galaxies appear toshow rapidly-increasing activity back in time.
We find that the ratio [N II] λ6583/Hα is anti-correlated with EW(Hα), and thatthe value of 0.5 commonly used to remove the [N II] contribution from blended Hα +[N II] λλ6548, 6583 applies only for samples with an EW distribution similar to thatseen at low redshift. We show that [O II], [N II], [S II] and Hα EWs are correlated, butwith large dispersions (∼ 50%) due to the diversity of galaxy contents sampled. Our[O II]–Hα relation is similar to the one derived by Kennicutt (1992), but is a factor10% higher at 1σ significance. We show that this relation is not valid for distant,strong [O II] emitters with blue colors, which are more numerous than locally. Thisrelation would overestimate the individual star formation rate (SFR) by ∼ 50% forthese kind of galaxies. We find that on average luminous blue ELG are likely to beenhanced in nitrogen abundance. This suggests that in faint, low-mass, late-type ELG,nitrogen is a primary element, whereas in more bright, more massive galaxies nitrogenit comes from a secondary source. We also find 4% of early-type galaxies which showstar formation activity; this fraction seems to increase at higher redshifts.
Key words: galaxies: fundamental parameters – galaxies: general – galaxies: statis-tics.
1 INTRODUCTION
Studies of spectral properties within well-defined surveys arecrucial to determine the evolutionary properties of galaxies.
Indeed the continuum of spectra provides information on theglobal stellar content, while the lines are powerful diagnos-tics of the star formation rate. To understand the evolution
c© 1999 RAS

2 L. Tresse, S. Maddox , J. Loveday and C. Singleton
of galaxies from today to earlier epochs, one major task isto carefully compare different surveys. Each survey has itsown galaxy selection and line detection levels, and these mayvary even within one survey if it samples a large range ofredshifts.
The main aim of this paper is to measure the ave-rage spectral properties of a representative local bJ -selectedgalaxy population, which can be used as a reference pointfor more distant galaxy samples. We analyse spectra fromthe Stromlo-APM redshift survey, which uniformly samplesa large volume and gives a representative population of lo-cal galaxies. The measured spectral properties include Hα,[O II] λ3727, [N II] λ6583, [S II] λλ6716, 6731, [O I] λ6300xand the 4000 A break. Most previous studies have concen-trated on [O II], since it is the line commonly observed atlarger redshifts. Combined with other lines, and photometricproperties, a deeper knowledge of galaxy content and starformation rate evolution can be reached.
We wish to stress that our aim is to quantify the global
spectral properties of the galaxy population. Measurementsfor individual galaxies may be affected by the limited arealcoverage of the spectral slit, but the overall average mea-surements should be accurate as we demonstrate throughthis paper. Our measurements of spectral features are fluxratios (EWs and the 4000 A Balmer break index), and thusthey are insensitive of uncertainties in the flux calibration.
This paper is organized as follows. Section 2 describesthe spectroscopic database, our measurements, and the sliteffects. In Section 3 we classify spectra according to theirHα emission, and investigate how the fraction of Hα emit-ters (EW(Hα) >∼ 2 A) depends on other galaxy properties.In Section 4 we compare this to other surveys. Sections 5, 6and 7 present the properties of the Hα-emitter population;we also examine the repercussions for star formation ratemeasurements. Section 8 discusses those galaxies which ex-hibit [O II] in the absence of Hα emission. We conclude inSection 9.
2 DATA
2.1 The spectroscopic survey
Our sample of galaxies is taken from the Stromlo-APM(SAPM) redshift survey which covers 4300 sq-deg of thesouth galactic cap and consists of 1797 galaxies brighter thanbJ = 17.15 mag. The galaxies all have redshifts z < 0.145,and the mean is 〈z〉 = 0.051. A detailed description of thespectroscopic observations and the redshift catalog is pub-lished by Loveday et al. (1996). In this paragraph, we brieflyrecall some important points.
The SAPM galaxies were randomly selected at a rateof 1 in 20 from Automated Plate Measurement (APM) ma-chine scans of UK-Schmidt (UKS) plates (see Loveday 1996;Maddox et al. 1990). Most of the galaxies were given a mor-phological class from visual inspection of the UKS plates,and we will investigate the link between spectral propertiesand morphology in a future paper. For the faintest galaxiesmorphological classification is difficult, and many galaxieswere not given a classification, leading to incompleteness inthe morphological subsamples (Zucca, Pozetti & Zamorani1994). Our present study is not affected by this problem,
since we study all galaxy spectra, whether or not they havebeen assigned to a specific morphological class.
The galaxy images that overlap other images were ex-cluded from the redshift catalog (214 out of 2011) to guaran-tee reliable redshift and magnitude measurements. Most ofthese galaxy images overlap with star images (70.5% of theoverlaps), the rest with other galaxy images. The galaxy–star overlapping images are a random sub-sample of thegalaxies, and thus their rejection does not affect our analysis.Rejecting galaxy–galaxy overlapping images may introducea bias against physically merging systems. However galaxy–galaxy overlaps represent only 3% of the total galaxy ima-ges, hence the fraction of genuine merging systems shouldbe smaller than this.
Of the 1797 galaxies originally published in the red-shift survey, 54 have a redshift taken from the literature (ofwhich 28 are at bJ < 15), and for 7 we could not retrievethe spectra because they were not observed with the Dual-Beam Spectrograph (DBS) of the ANU 2.3-m telescope atSiding Spring. Amongst the 1736 spectra we had in hand,we excluded 7 blueshifted spectra, 3 with cz < 1000 km s−1,and 2 with too low signal-to-noise. Following Loveday et al.(1992), we also applied a bright apparent magnitude cutto the sample to reject galaxies which have saturated ima-ges on photographic plates. Thus, in this paper, we studied1671 spectra with 15 ≤ bJ ≤ 17.15, cz > 1000 km s−1,which constitute a representative sample of nearby galaxies.It has been argued that the SAPM survey is biased by pho-tometric calibration errors, but in addition to the originalCCD photometry (Maddox et al. 1990b; Loveday 1996), newCCD photometry has recently been used to check the SAPMcalibration, and this shows no evidence of significant photo-metric errors (Loveday & Lilly 1999). In any case our mea-surements of EW and 4000 A Balmer break index are in-dependent of photometric calibration and so our results arenot affected by uncertainties in calibration.
The DBS divides the light into blue and red beams.The wavelength range is 3700–5000 A in the blue, and 6300–7600 A in the red, both with a dispersion of ∼ 1 A per pixel.Each beam is fibre-coupled to two CCD chips; this leavessmall gaps in the wavelength coverage between 4360–4370A in the blue, and 7000–7020 A in the red (see Fig. 1). Themean integration time for the 1671 galaxies is 470s, of which795 have a 600s exposure time. Each integration was stoppedwhen spectral features could be identified at the level re-quired to measure a redshift. As a consequence the variationin signal-to-noise as a function of apparent magnitude is re-duced. For instance the signal-to-noise of EW(Hα) variesby only a factor ∼ 2 over our observed apparent magnituderange, whilst a fixed exposure time would have given a factor∼ 10. The width of ∼ 8′′ slit leads to a spectral resolutionof about FWHM = 5 A.
We calibrated spectra in relative flux using spectropho-tometric standard stars. Since standard stars were not ob-served systematically each night, we cannot have reliableabsolute flux calibration. Consequently we built a mean sen-sitivity function from the several standard stars observed ineach run, and applied it to all objects observed during thecorresponding run. Hence the zero-point of flux calibrationcannot be properly recovered, and the calibration can onlybe relative. That is equivalent to correcting for the instru-
c© 1999 RAS, MNRAS 000, 1–15

Spectral properties of galaxies in the SAPM survey 3
mental response function and atmospheric extinction, andto applying a gross zero-point for flux calibration.
By comparing continuum levels across the two blueCCDs we estimate that the relative calibration is good to∼ 1%; the accuracy is the same for the two red CCDs. Com-paring the continuum in the red and blue spectra suggeststhat their relative calibration is consistent to ∼ 5%, thoughoccasionally the discrepancy appears to be as much as 20%.However, the large gap between the red and blue spectramakes comparison of continuum levels liable to large uncer-tainties. Since we concentrate our analyses on EW measure-ments, calibration errors at this level are not important.
2.2 Emission-line and D4000 measurements
The prominent spectral features include in the blue range[O II] λ3727, Ca H&K λλ3933, 3969, the 4000 A Balmerbreak and for a few galaxies Hβ. In the red range we ob-serve Hα, [N II] λλ6548, 6583, [S II] λλ6716, 6731, and forsome strong emission-line spectra [O I] λ6300. Unfortunately[O III] λλ4959, 5007, and usually Hβ, are in the gap be-tween the blue and red parts of the spectra (from ∼ 5000 to∼ 6300 A).
We measured the integrated relative fluxes, F , and rest-frame equivalent widths, EW, of the emission lines using thepackage splot under iraf/cl, interactively marking twoendpoints around the line to be measured. This method al-lows the measurement of lines with asymmetric shapes (i.e.with deviations from Gaussian profiles). In most cases asin Fig. 1 the Hα and [N II] lines could be measured sepa-rately. When these lines are blended, we used the Gaussiandeblending program. Note that in these later cases lines areonly partly blended. The interactive method allows us tocontrol by eye the level of the continuum taking into accountdefects that may be present around the line measured. Itdoes not have the objectivity of automatic measurements,but it does allow us to obtain reliable accurate measure-ments.
We estimated 1σ standard deviations as follows:
σF = σcD√
2Npix + EW/D
for the flux, and
σEW =EW
FσcD
√
EW/D + 2Npix + (EW/D)2/Npix
for the EW, where D is the spectral dispersion in A perpixel, σc is the mean standard deviation per pixel of thecontinuum on each side of the line, and Npix is the number ofpixels covered by the line. Note that these are not exactly theformal statistical 1σ errors of F or EW, because we estimatethe signal-to-noise for each pixel by scaling the continuumvariance according to Poisson statistics. Our approximationslightly overestimates the errors, but in our analysis we aremainly interested in the consistency of the estimation oferrors.
In our study, we use mainly the EW, since we have onlyrelative fluxes. Whenever we could see a significant Hα emis-sion line by eye, we measured the EW. Figure 2 shows thatour EW limit is approximately at a 3σ confidence level. Forthe signal-to-noise of our spectra this corresponds to mea-surements of EW(Hα) >∼ 2A, and the average detection levelis 5.6σ. Then [N II] λ6583 was measured; [N II] λ6548 is 3
times less intense and so is usually too faint to be detectedor has often a too low signal-to-noise to be detected in thesame homegeous manner as its counterpart. As seen in Fig-ure 2 the [N II] measurements include lines detected at lessthan 2σ, because it was simple to attempt a measurementwhenever we measured Hα. Detection at the 3σ confidencelevel corresponds to EW([N II] λ6583) >∼ 2 A, similar tothe Hα limit. We measured both the [S II] λ6716 and [S II]λ6731 lines, and added their EW to give [S II] λλ6716, 6731as plotted in Figure 2. If only one [S II] line could be seenabove 2σ, the EW of the non-detected line was set to zero.Again the 3σ detection level is ∼ 2 A. Although [O I] λ6300is rarely detectable, we were able to measure it in a fewspectra. The 3σ detection level is also at ∼ 2 A. The [O II]measurements typically have confidence levels >∼ 2σ. Its 3σdetection level is 3 A, slightly higher than the other lines,because the blue continuum is less intense than the red,and so is more noisy. All of the lines in the red part of thespectrum have a 3σ detection limit of ∼ 2 A because thesignal-to-noise of the red continuum is about the same foreach of these lines. This shows that our measurements weremade in a consistent way.
As well as the emission lines, we also measured the4000 A Balmer break. This spectral discontinuity is due tothe opacity produced by the presence of a large number ofspectral lines of ionized metal, in a narrow wavelength re-gion. Its amplitude depends on the metallicity, and thus onthe stellar temperature and age (Bruzual 1983). Early-typegalaxies usually have larger amplitudes than late-type galax-ies. We estimated the break as follows:
D4000 = f(4200 − 4000)/f(4000 − 3800),
where f is the mean integrated flux within the rest-framewavelength range mentioned. We rejected pixels havingfluxes more than 2σ from the mean flux; this ensured thatemission or absorption lines and bad pixels did not bias themeasurements.
2.3 Slit effects
The galaxy spectra were taken using a slit 8′′ wide and 7′
long. The slit was always positioned to cross the centralregion of the galaxies, thus the light collected for each galaxyoriginates from the core and from a fraction of the outerpart of the galaxies. In this section, we assess how close ourspectra are to fully integrated galaxy spectra.
We estimated the area of each galaxy image using themeasurements of the major and minor axes, a and b, at a bJ
surface brightness level of 25 mag arcsec−2 (see Maddox etal. 1990). The major axis a varies between 15′′ and 153′′ with〈a〉 = 36′′, and so is always shorter than the length of theslit. The minor axis b is between 6′′ and 67′′ with 〈b〉 = 21′′,and so is usually larger than the slit width. The orientationof the slit was not systematically recorded, therefore we donot know the angle of the slit relative to the major axis ofthe galaxies. However, we can test the two possible extremecases of overlaying each galaxy image with an 8′′ slit posi-tioned either along the major axis, or along the minor axis.For the first case, we approximated the fraction of the galaxyimage covered by the slit,
F (a) ≈ min(
8 a
0.25 πab, 1
)
c© 1999 RAS, MNRAS 000, 1–15

4 L. Tresse, S. Maddox , J. Loveday and C. Singleton
as a function of S25, defined as the rest-frame projectedarea⋆ brighter than bJ = 25 mag arcsec−2 in kpc2, and of thegalaxy inclination i, defined by sin2(i) = [1 − (b/a)2]/0.96(Hubble 1926) (Fig. 3). For the second possibility we calcu-lated F (b), using the same approximation with 8a replacedby 8b. The true configuration must lie between these twopossible extremes. With an 8′′ wide slit, this fraction de-pends mainly on the galaxy inclination, i, rather than on S25
(Table 1). As seen in Figure 3, our typical spectrum sam-ples the light from ∼ 45% of the rest-frame projected area ofthe galaxy. The Figure and Table show also that F (a) andF (b) are respectively 2% and 7% larger at z > 0.05 than atz < 0.05. Thus the average fraction of galaxy projected areacovered by our slit does not depend strongly on redshift; thehigh-z galaxies have only 5% more coverage than the low-zones.
Figure 4 shows that cos(i) and S25 are barely correlated,which demonstrates that the SAPM survey is representativeof the different kinds of nearby galaxies at 15 ≤ bJ ≤ 17.15.A galaxy sample with random inclinations would have auniform distribution as a function of cos(i), but our sam-ple is biased towards galaxies with low inclination angles, asexpected in magnitude-limited surveys (Maiolino & Rieke1995). This is because the more inclined a galaxy is, themore its intrinsic galactic absorption reduces the light alongthe line of sight. Thus with the same absolute luminosityand distance, an inclined galaxy is likely to be fainter thana face-on galaxy. This effect will be particularly strong inblue-selected surveys where dust absorption is large.
3 ELG FRACTION
3.1 Classification of spectra
We classified spectra according to the Hα recombinationline; when it is detected in emission as an emission-linegalaxy (ELG), otherwise as a non emission-line galaxy (non-ELG). The level of detection of Hα depends on the intensityof the line, on its equivalent width, and on the signal-to-noiseof the continuum. Thus when comparing the ELG fractionto other surveys, one has to bear in mind the limits of detec-tion of emission lines. Another point is that Hα may sufferfrom stellar absorption, reducing the EW of emission by asmuch as 5 A (see Kennicutt 1992), especially in the case ofearly-type galaxies. Weak Hα lines (≪ 10 A) may not bedetected, which would lead to a non-ELG classification.
An ELG classification scheme based on Hα has the fol-lowing advantages: (a) Comparison of Hα to [N II], [S II] and[O I] allows discrimination between AGN and H II galaxies(Veilleux & Osterbrock 1987). (b) It is a tracer of recentstar formation for most galaxies (Kennicutt 1992). (c) Ofthe Balmer lines, it is the most directly proportional to theionizing stellar UV flux at λ < 912 A (see Osterbrock 1989for a review; Schaerer & de Koter 1997 for recent models),because the weaker Balmer lines are much more affectedby the equivalent absorption lines produced in stellar atmo-spheres. (d) It does not depend strongly on the metallicity,
⋆ We assume H0 = 50 km s−1 Mpc−1 and q0 = 0.5 throughoutthis paper.
which is not the case for the other commonly observed op-tical lines such as [N II], [S II], [O II] and [O III]. Sincethese latter are forbidden lines, their presence depends alsoon the density of the gas. They have higher ionizing poten-tial than Balmer lines, thus depend also on the hardness ofthe ionizing stellar spectra. (e) It is less affected by dustthan any other lines at shorter wavelengths. Consequently aclassification based on Hα has the advantage that it is moreor less comparable at any redshift with less dependence onchemical evolution than other spectral features.
When Hα falls in the wavelength coverage gap ∼7000–7020 A (see Section 2.1), we cannot see whether this line isin emission or not. To avoid introducing any bias, we sys-tematically did not classify these spectra, even if other linesstrongly suggest that Hα should indeed be in emission orabsorption. There are 82 spectra in this category, which rep-resent 5% of the sample of 1671 spectra. 990 (59%) spectrahave been classified as Hα emitters, i.e. as ELG, and 599(36%) as non-Hα emitters, i.e. as non-ELG. If we assumethat the 82 unclassified spectra are distributed like the clas-sified ones, this give 62% of ELG with EW(Hα) >∼ 2 A,and 38% of non-ELG. However the red gap location meansthat these unclassified galaxies are mainly at z ∼ 0.06 (seeFig. 7), and thus they are mainly bright (M(bJ )< −21 inFig. 8) where, as we will see, the fraction of ELG is smallerthan at fainter magnitudes. When we do attempt to classifythe 82 spectra by taking into account the presence of otherspectral lines, we find the percentage of ELG and non-ELGis 61% and 39%. This is essentially the same as assumingthat the 82 spectra are distributed like the classified ones,and so we conclude that any bias due to Hα falling in thewavelength coverage gap is insignificant.
3.2 ELG fraction and slit effects
Since the SAPM spectra are not integrated over the wholegalaxy, the fraction of ELG with EW(Hα) >∼ 2 A may beslightly higher than estimated in Section 3.1. Indeed, onestrong H II region outside the central galaxy region canchange an absorption-like spectrum into an ELG. Thus ifthe 8′′ wide slit did not cover this H II region, a galaxywould be classified as non-ELG rather than ELG.
However, since the spectral slit covers on average 45–50% of the galaxy, and since H II regions are mainly dis-tributed along the spiral arms, our fraction of ELG shouldremain approximately correct. Even though the distributionof H II regions tends to be more centrally concentrated inbulge dominated systems, the luminous H II regions tend tobe found at larger radius in late-type spirals (see for instanceHodge & Kennicutt 1983). No bias should arise for galax-ies with central Hα emission. The major caveat might comefrom irregular systems where star-forming regions can befound anywhere. In the SAPM sample, galaxies classified asirregular represent only 5%. The morphologically unclassi-fied galaxies (21%; see Table 1 in Loveday, Tresse & Mad-dox 1999) typically have small images with no easily iden-tifiable morphological features. They are likely to be earlyHubble-type galaxies, or spirals with weak spiral arms, orcompact galaxies, and are very unlikely to be irregulars.Those galaxies with only one dominant H II region in thedisk (perhaps due to an interaction with another galaxy forinstance), should represent a very small fraction. In these
c© 1999 RAS, MNRAS 000, 1–15
Spectral properties of galaxies in the SAPM survey 5
cases, there was ∼ 50% chance for having observed the H II
region with an 8′′ slit. Moreover, we note that 50 spectrawere re-observed because there were no obvious spectralfeatures to identify accurately a redshift; these re-observedspectra still remain non-ELG, even though the slit orienta-tion changed. Moreover in Section 3.4, we find that very fewnon-ELG (11) have a 4000 A break consistent with what isexpected for blue galaxies, hence it tells us that our fractionof ELG should be correct to 1%.
Figure 5 shows that neither EW(Hα) >∼ 2 A nor thesignal-to-noise of the measurements depend globally on thegalaxy inclination angle, i, or the fraction of area coveredby the 8′′ slit. Consequently we find that the SAPM sampleshows no trend to detect more ELG than non-ELG as a func-tion of inclination angles i (Fig. 4). The means of the axialratios, (b/a), are similar for ELG and non-ELG, respectively0.60 (or i = 55◦) and 0.63 (or i = 52◦).
3.3 Correlation of the ELG fraction with galaxyproperties
The average parameters (bJ , z, kz, M(bJ ), µ25, S25) for theSAPM galaxies are summarized in Table 2. The fraction ofELG does not globally depend on bJ (Fig. 6), showing thatthe EW is not dependent on apparent magnitude. This isbecause the integration times were adjusted for each galaxy(see Section 2.1). Figure 7 shows that the ELG fraction doesnot systematically depend on redshift, but there is a slightexcess at z < 0.014; we discuss this later.
The ELG fraction depends strongly on the absolutemagnitudes (Fig. 8); from M(bJ ) = −23 to −18 mag, itincreases by a factor of 2. The fraction also depends onthe physical size of galaxies (Fig. 9); from S25 = 10000 to100 kpc2, it increases by a factor of 4. ELG are more com-mon than non-ELG in intrinsically faint galaxies, and smallsystems. ELG are on average 0.43 ± 0.06 mag fainter thannon-ELG. If we exclude galaxies at z < 0.014 (see below),ELG are 0.33 ± 0.05 mag fainter than non-ELG. The ap-parent flattening of these trends at M(bJ ) > −18 and atS25 < 40 is probably due to the combination of the smallnumber of galaxies in these bins, and the fractions approach-ing 100%.
The dependence on rest-frame surface brightness avera-ged over the area brighter than bJ = 25 mag arcsec−2, µ25,is more complex. The fraction of ELG decreases by a factor2 from µ25 = 21.9 to 23.1 mag arcsec−2, and increases bythe same factor towards fainter values (Fig. 10). Galaxieswith µ25 > 24 are at z < 0.014. ELG are more common forthe highest and lowest surface brightness galaxies than non-ELG. This means that faint, small systems which contributemost to the ELG sample may be either high-surface bright-ness, compact galaxies, or low-surface brightness dwarfs.
Going back to the ELG fraction as a function of z wecan now understand the high fraction at z < 0.014. TheSAPM sample is magnitude-limited with both high and lowmagnitude limits, and so at z < 0.014 we observe only small,M(bJ ) > −18 galaxies. From Figure 8, we see that mostgalaxies this faint are ELG, so we expect to see a high ELGfraction at these low redshifts.
To summarize, ELG galaxies are found more frequentlyat fainter intrinsic magnitudes, and in smaller systems thannon-ELG. This agrees with the general picture where dwarf
and compact galaxies are more actively forming stars thantheir bright counterparts in the local Universe. This is areflection of the difference between ELG and non-ELG lu-minosity functions (Loveday, Tresse & Maddox 1999). It isalso consistent with the rapidly evolving population of smallgalaxies up to z ∼ 1 (Brinchmann et al. 1998). The over-all blue luminosity density is dominated by bright galaxies,which formed most of their stars much earlier than dwarfs,which are actively forming stars today.
3.4 Correlation of the ELG fraction with D4000
We estimated the 4000 A break using the D4000 index asdefined in Section 2.2. The measured values of D4000 rangefrom 0.9 to 2.5, with a mean of 1.6. These values are con-sistent with the limits obtained with spectral evolution ofstellar populations using isochrone synthesis. For instancein Fig. 13b (D4000 versus age, assuming solar metallicity)of Bruzual & Charlot (1993), this index never reaches val-ues above 1.5 if a constant star formation rate is adopted,while a 108.5 year old instantaneous-burst or a 109.5 year old1Gyr-burst reproduce these high values. Thus half of the lo-cal population is dominated by star bursting of at least 108.5
year old. The other half is dominated by younger star for-mation whatever the star formation rates adopted.
The D4000 distribution for ELG is clearly different fromthe non-ELG distribution (Fig. 11), the average D4000 forELG is 31% smaller than for non-ELG (see Table 2). How-ever, there is an overlap between the two distributions, andthere is no clear separation into distinct populations. Thepresence of Hα in emission is correlated with a low D4000,which is expected since both are indicators of massive starformation. It strengthens the link between our Hα ELG clas-sification and star formation activity. In general, the smallerD4000, the bluer the galaxy color; as expected our ELG havebluer colors on average than the non-ELG.
We note that 1% (12) of ELG galaxies have D4000 > 2,the value characteristic of elliptical galaxies. They are brightgalaxies (M(bJ) ≤ −21.6), and have EW(Hα) ≃ EW([O II])≃ 8 A. In these systems, stellar absorption at Hα must besignificant, and thus their true EW(Hα) must be higher,as we expect from the relation between [O II] and Hα (seeSection 7.1). These galaxies have a significant old stellarpopulation, and are undergoing current star formation; mostof them have a spiral morphology.
Also 2% (11) of non-ELG have D4000 < 1.2, the valuetypical of very blue galaxies. They span the whole range ofluminosities, they have no [O II] line. Five are spirals, two areellipticals, one is irregular and three are not morphologicallyclassified. For some of them, this could be due to slit effectsas discussed in Section 3.2.
Figure 12 shows that nearly all galaxies fainter thanM(bJ ) = −19 have D4000 < 1.7. Most dwarf galaxies tendto have rather young stellar populations, consistent with thehigh fraction of ELG that we find at faint magnitudes.
4 COMPARISON OF THE ELG FRACTIONWITH OTHER SURVEYS
Comparing average properties from different surveys is nevera straightforward task. Different detection limits, different
c© 1999 RAS, MNRAS 000, 1–15

6 L. Tresse, S. Maddox , J. Loveday and C. Singleton
instrumentation, different criteria for galaxy selection anddifferent methods of classifications must be taken into con-sideration otherwise results of the comparison may be verymisleading.
4.1 The CFRS-12 sample (0.1 < z < 0.3)
The CFRS-12 sample (Tresse et al. 1996) is magnitude limi-ted in the same way as the SAPM, and has 〈z〉 = 0.2. Galax-ies in CFRS-12 were selected on I magnitude (i.e. more sen-sitive to old stellar populations), while the SAPM used bJ
selection (i.e. more sensitive to star forming galaxies). Thegalaxy area covered by the 1.′′75 CFRS slit for galaxies atz ≃ 0.2 is similar to the 8′′ SAPM slit for galaxies at z ≃ 0.05(i.e. ∼ 50% of the galaxy area).
In CFRS-12, 85% of the galaxies are Hα emitters withEW(Hα + [N II]) >∼ 10 A and −21.5 < M(BAB) < −14(see Table 1; Fig. 14 of Tresse et al. 1996). In Figure 13,CFRS-12 galaxies follow the same trend as SAPM galaxiesin Figure 8; a higher fraction of ELG is found at fainter blueabsolute magnitudes. Similarly to the SAPM, in the CFRS-12, the non-ELG population is brighter by ∼ 1 mag, andredder by ∼ 0.4 mag than the ELG population.
To make a fair comparison between the two surveys, welimit the samples to EW(Hα + [N II]) ≥ 10 A for ELG,and −17 ≤ M(BAB ≃ bJ) ≤ −21. We obtain 82% and65% of ELG respectively for these subsets of the CFRS-12and SAPM samples. Thus even though SAPM galaxies wereselected from their rest-frame blue continuum, and CFRS-12galaxies from their rest-frame red continuum, the fraction ofELG at z = 0.2 is higher by a factor 1.3 than locally. Theexclusion of APM merged systems (< 3%, see Section 2)would not change this result. Moreover the APM galaxycatalog is known to miss ∼ 5% of compact galaxies whichare difficult to distinguish from stars (see Maddox et al.1990); even if this fraction is as much as 10%, the fractionsof ELG for the same EW limit at low and high redshiftswould still be discrepant.
This result is consistent with the rapid evolution in Hαluminosity density (Tresse & Maddox 1998). On average athigher redshifts Hα is more intense, and consequently for thesame EW limit, the fraction of ELG increases. An impor-tant point to note is that the ELG fraction does not dependon the relative normalization of the galaxy counts, and sothis result is an independent demonstration of rapid galaxyevolution at relatively low redshifts (z < 0.3).
4.2 Other surveys
Statistically complete, magnitude-selected spectroscopicsurveys which have Hα line information are rare. In the verynearby Universe (z ≪ 0.005), Ho et al. (1997b) spectroscop-ically observed 486 galaxies from the Revised Shapley–AmesCatalog of bright galaxies (BT ≤ 12.5 mag) which containsall morphological types. Only the central few hundred par-secs of the galaxies have been observed with a 2′′ x 4′′ slit,but the detection limit of emission lines is very low, at EW∼ 0.25 A (3σ). After removing the stellar background of thebulge, and thus correcting for stellar absorption (which doesnot exceed 2–3 A, Ho et al. 1997a), they detected optical lineemission in 86% of the galaxy nuclei. Their result implies
that ionized gas is almost invariably present in the core ofgalaxies. From Ho et al. (1997b) figures 4 and 6, we estimatethat ∼60–65% of the emission-line nucleus galaxies (ELNG)within roughly the same absolute B-magnitude range asSAPM, have EW(Hα) > 2 A. This fraction is similar tothat found by Veron–Cetty & Veron (1986) (60–65%), whodid not subtract the stellar background. The differences inapertures and signal-to-noise mean we cannot directly com-pare this fraction to the SAPM or the CFRS-12 samples,however we will make one comment.
The SAPM 61–62% ELG fraction is close to the ∼60–65% ELNG. Since ∼40–50% of the galaxy area is surveyedin the SAPM galaxies, this suggests that Hα emission fromthe disk causes little change in the number of Hα emittersdetected above 2 A. Overall, the nuclear emission amountsto a few percent of the integrated flux (see Kennicutt &Kent 1983), so we might have expected more Hα emittersin the case of the SAPM in which the extra-nuclear emis-sion is observed. This is not the case, because the extra-nuclear nebular emission varies roughly in proportion to thecontinuum, and thus the EW is relatively unchanged. Thisis consistent with detailed studies by Hunter et al. (1998)who show that in irregular galaxies, the star formation rate(measured from Hα luminosities) and the total stellar den-sity (measured from the surface brightness) lie close to eachother throughout the whole galaxy, and by Ryder & Dopita(1994) who observed that the star formation follows the oldstellar mass surface density in spiral galaxies. For the sur-face brightness profiles of typical SAPM galaxies, this im-plies that the detected Hα emission is centrally peaked formost of the SAPM ELG. This is seen also in other surveyswhich select only emission-line galaxies, such as the UCMsurvey (Gallego et al. 1998); these find that the line emissioncomes largely from the nuclear region.
5 EMISSION-LINE AND CONTINUUMPROPERTIES
We investigate in this section how Hα, [N II], [S II], [O II]and [O I] correlate with bJ luminosity, and D4000.
5.1 Hα and M(bJ)
Out of the 990 ELGs, 56 (6%) have detectable Hα emissionthat could not be properly measured, usually because it wasat the same wavelength as a sky line. For the remaining 934ELG, 98% have EW(Hα) under 60 A, (20 have EW > 60 A).The mean and median EW(Hα) (> 2 A) are respectively 19and 15 A.
Figure 15 shows that the fraction of faint ELG(M(bJ) > −21), increases as a function of EW. FromEW(Hα) = 10 to 60 A, the fraction increases by a factor∼ 2. Another way to look at this is to consider the fractionof high EW ELG (EW> 15 A), which increases at fainterM(bJ ) (see Fig. 14).
These trends are the continuation of those seen forthe ELG fraction as a function of M(bJ ), and they reflecta global tendency within the whole population; the largerEW(Hα), the bluer the galaxy (Kennicutt & Kent 1983).This is because EW(Hα) is the ratio of the flux originatingfrom UV photionization photons (< 912 A), over the flux
c© 1999 RAS, MNRAS 000, 1–15

Spectral properties of galaxies in the SAPM survey 7
from the old stellar population emitted in the rest-frame Rpassband, which forms the continuum at Hα. Thus largeEW is either due to a large UV flux (or B absolute mag-nitude since they are correlated), or to a small continuumfrom the old stars. In either case this implies a blue con-tinuum colour. Hence the observed trend of larger EW(Hα)for fainter galaxies implies that the faint ELG population isdominated by blue galaxies, while the bright ELG popula-tion is dominated by redder galaxies.
So, the galaxies which evolve rapidly with redshift (atleast up to z = 1) are faint and dominated by a young stellarpopulation. The bright galaxies evolve more or less passivelyand are dominated by an older stellar population. It is nowwell established that the faint end of the luminosity functionof B-selected galaxies is dominated by actively star-forminggalaxies. This is what we find also in the SAPM (Loveday,Tresse & Maddox 1999).
Since B-luminosity is strongly correlated with Hα lu-minosity (Tresse & Maddox 1998), the fainter a galaxy, thesmaller its Hα luminosity is, and thus the faint populationdoes not dominate the total Hα flux density, or the UV(< 912 A) ionizing flux density at low z, even though it isthe population which evolves most rapidly with redshift.
5.2 [N II], [S II], [O II], [O I] detection and M(bJ)
In this subsection, we discuss measurements of [N II] λ6583,[S II] λλ6716, 6731, [O II] λ3727 and [O I] λ6300 for the 934Hα ELG with quantified EW(Hα). [N II] λ6548, which is3 times fainter than [N II] λ6583, has often too low signal-to-noise to be detected in the same homegeneous way as itscounterpart at 6583 A.
We measured [N II] for 784 galaxies (84%). The averageEW([N II]) detection is at 4.7σ, which is ∼ 19% lower thanthe one for Hα. Since the wavelengths are very close, thedifference is because on average [N II] has smaller intensity.This is to be expected since [N II] is harder to ionize, and lessabundant than Hα. The remaining [N II] are 46 (5%) withno detection above ∼ 2 A, 43 (5%) detected but too noisy tobe measured, 31 (3%) with a sky subtraction problem, and30 (3%) not observed because it falls in the gap at 7000–7020A (see Section 2.1).
We measured [S II] λλ6716, 6731 for 506 galaxies (54%);for 30 (3%) galaxies only one line could be measured. Inthese cases the other line has a too low signal-to-noise to bereliably measured, and we set the EW to zero. The averageEW([S II] λλ6716, 6731) detection for these 536 galaxiesis at 4.3σ, which is ∼ 30% lower than Hα. This is partlybecause [S II] has a smaller intensity than Hα (as in thecase of [N II]), but also because the continuum at 6717–6731 A is more noisy than at Hα; sky lines start to increasethe noise in the red continuum. For 123 galaxies no line wasdetected, and for the remaining 275 galaxies, one of the lineswas either on a sky line or in the gap. The percentage of [S II]detected above 2 A is higher than for [N II], because the sumhas higher intensity, even though individual lines are harderto detect.
We measured [O I] λ6300 for 43 galaxies (3%). Theaverage detection of EW[O I] is 2.7σ, it is the lowest valuesince this line intensity is usually extremely weak relativelyto the other lines.
We measured [O II] for 859 galaxies (92%). The average
detection is 4.8σ, which is ∼ 15% lower than for EW(Hα).This is because the blue continuum is less intense than thered continuum, and consequently more noisy. We find 75galaxies with significant Hα but no detectable [O II]. TheEW(Hα) for these galaxies is detected at more than 3σ, andlies in the range 2–24 A, with a mean at 8 A. They havealso 1.3 < D4000 < 1.8, and a median D4000 = 1.5. Outof the 75, 58 have [N II] detected, and 15 have also [S II]detected. These galaxies are undergoing star bursts, and areprobably heavily absorbed so that they show a moderateBalmer break, and a weak noisy blue continuum (see alsoSection 8). They are not preferentially edge-on galaxies.
Figure 15 shows that the fraction of faint galaxies(M(bJ) > −21) increases as a function of: (a) [N II] EWby a factor 1.2 from 2 to 15 A, (b) [S II] EW by a factor2 from 2 to 20 A, and (c) [O II] EW by a factor 2 from2 to 40 A. These trends are analogous to what we see forHα, where the fraction of faint ELG increases by a factor 2up to EW(Hα) = 60 A. Faint galaxies have larger EW foremission lines both in the blue and red band at rest. Thus,as well as being bluer as seen previously, they have alsostronger photoionization sources which enhance forbiddenline intensities. Indeed, if there was simply a larger amountof young stellar background in the blue, then EW([O II])would decrease while EW([S II]) would increase, (noting that[O II] has similar photoionization conditions to [S II]). So,the enhancement of UV photoionization sources is coupledwith a larger amount of B-band flux produced mainly byintermediate-mass stars. This leads to the correlation be-tween Hα and B luminosity (Tresse & Maddox 1998). Thesemetallic lines follow the same trend as Hα, suggesting thatthey have a common source of ionization. The small num-ber of galaxies with detected [O I] makes the comparisonmore difficult, however the fraction of faint galaxies seemsnot to be correlated with this weak line. Emission-line ra-tios are studied in the following Section, and correlations arestudied in Section 7.
The medians of the EW distributions for the bright andfaint ELG populations are listed in Table 3. The differencebetween these medians is largest for [O II] (47%), then Hαand [S II] (∼ 31%). We can interpret these variations as fol-lows: EW([O II]) is the most sensitive to blue luminosity,since it depends directly on the rest-frame B-band contin-uum; EW(Hα) and EW([S II]) are slightly less sensitive sincethey depend on the rest-frame R-band continuum.
For [N II] there is no significant difference (4% discrep-ancy). The global behavior of EW([N II]) reflects intrinsicdifferences in the nitrogen abundance (N/O) in ELG. Theorigin of nitrogen is still an open debate (see for instancedata analysis in Izotov & Thuan (1999), Garnett (1990),Kobulnicky & Skillman (1998) and references within). Onone hand, the nature of stars producing the primary nitrogen(i.e. from burning H and He via fresh C and O) remains un-clear in low-metallicity systems (high- or intermediate-massstars). On the other hand, the scenario to explain a secondsource for nitrogen enrichment observed in high-metallicitygalaxies is still open. We cannot address these points in de-tail here. However in our representative local sample, we findthat on average luminous blue ELG are likely to be enhancedin nitrogen abundance. This suggests that in faint, low-mass,late-type ELG, nitrogen is a primary element, whereas inmore bright, more massive galaxies nitrogen it comes from
c© 1999 RAS, MNRAS 000, 1–15

8 L. Tresse, S. Maddox , J. Loveday and C. Singleton
a secondary source. Thus the expected global increase inthe fraction of faint galaxies as a function of line strengthswould not be observed in the case nitrogen enhanced in anon negligible fraction of bright galaxies.
5.3 Emission-line EW and D4000
As seen in Section 3 the presence of Hα in emission is cor-related with a low D4000 index. This trend continues withinthe ELG population; the larger is EW(Hα), the smaller isD4000.
Figure 16 shows that the fraction of ELG with low D4000
(< 1.4) increases as a function of: (a) Hα EW by a factor4.5 from 2 to 60 A, (b) [O II] EW by a factor 3.4 from 2 to40 A, (c) [S II] EW by a factor 4.6 from 2 to 20 A, (d) [N II]EW by a factor 2 from 2 to 15 A. The medians of the EWdistributions for the low and high D4000 ELG populationsare listed in Table 3. They are the most discrepant for Hα(69%), then [O II] (52%), [O I] (40%), [S II] (36%), and [N II](35%). EW(Hα) is the most sensitive to D4000 as expected,since these two measurements are the most sensitive tracersof star formation rate. Here [N II] and [O I] follow the sametrend as for the other lines, in contrast to their behavior asa function of rest-frame blue luminosity. This is because alow D4000 is caused by the high-mass stars which enhanceall line strengths.
6 EMISSION-LINE RATIOS
6.1 [N II]/Hα, [S II]/Hα, [O I]/Hα ratios
The ratio [N II] λ6583/Hα involves lines close in wavelength,and thus it does not depend on reddening or flux calibration.The EW ratio must be in principle equivalent to the fluxratio, since the continuum is the same. It is a good ratio tocompare galaxies at different redshifts.
Only substantial stellar absorption at Hα may affectthis comparison: in late-type galaxies, it is usually negligi-ble; it may become significant in early types, which exhibitBalmer absorption lines. For SAPM galaxies where [N II] isdetected, it is certainly negligible. Indeed only detailed stud-ies with a level of detection lower than 2 A EW can detectweak [N II] in early-type galaxies (Ho et al. 1997a).
Figure 17 shows the distribution of the [N II]/Hα EWratios for our 784 galaxies with EW(Hα) + 1.33EW([N II]λ6583) > 3 A. We note that the ratio does not show anytrend with redshift. The median and mean values are 0.37and 0.41, and we find much the same values using our rela-tive flux ratios, 0.36 and 0.40. We also show the distributionof the ratios published by Kennicutt (1992, hereafter K92)in his tables 1 & 2 respectively of high (5–7 A) and low(> 10 A) resolution spectra. We excluded the H ii regions(Mkr 59 and Mkr 71), the Seyfert 1 galaxies (NCG 3516,NGC 5548 and NGC 7469) and galaxies with EW(Hα) +EW([N II] λλ6748, 6583) < 3 A as in the SAPM. We notethat his table 2 contains galaxies already tabulated in ta-ble 1. For these, we used the measurements from his table 1.In total, K92’s sample has 57 ratios of narrow-line fluxes in-tegrated over the whole galaxies. Since the K92 galaxies arenot a complete magnitude-limited sample, it is dangerousto consider the observed distributions of any parameter as
representative of the true distributions. Therefore we cal-culated the distribution of the [N II]/Hα EW ratios sepa-rately for each morphological type, and averaged them withweights proportional to the fraction of each type in the RSA(Sandage & Tammann 1981). The median and mean ratiosare 0.38 and 0.47 for this K92 sample.
The median and mean ratios for the SAPM and K92samples are similar. Kennicutt’s values are slightly higherbecause his ratios are likely to be biased towards highervalues, as discussed in K92. This tells us that the SAPMspectral properties are on average well representative of in-tegrated spectra (see also Fig. 25). As noted by K92, under-sampling the disk tends to reduce the strengths of the emis-sion lines in roughly equal proportion, and thus the relativeline fluxes should be insensitive to it. This strengthens ourconclusions from Section 2, showing that our results are veryunlikely to be affected or biased by using a long slit.
The median and mean for the EW ratio, [S II] λλ 6716,6731/Hα, are 0.36 and 0.42, and for the flux ratio, are 0.36and 0.41. If we take only our spectra for which [S II] linesfall on the same CCD chip as Hα, we have similar values,respectively 0.37 and 0.43, 0.36 and 0.41. This tells us thatthe relative calibration for the continuum of the two redchips is on average good to about 1%. The median and meanfor the EW ratio, [O I] λ 6300/Hα, are 0.08 and 0.11, and forthe flux ratio, are 0.08 and 0.42. The fact that the EW andflux ratio averages are similar shows that the red continuumat Hα and at [S II] or [O I] is not significantly different.
[N II]/Hα, [S II]/Hα and [O I]/Hα (Fig. 17) are com-monly used to distinguish galaxies hosting an AGN from theothers. We analyse them elsewhere.
6.2 [N II]/Hα versus EW(Hα + [N II])
In deep optical surveys, Hα and [N II] λλ6548, 6583 linesare often blended because of the use of low-resolution spec-troscopy. It is however important to recover the flux solelyin Hα to measure for instance the Hα luminosity function,hence to derive a star formation rate. This is also necessaryto distinguish AGN galaxies from H II galaxies, in particu-lar in narrow-line emission galaxies. Broad-line galaxies areidentified straightforwardly as AGN, and they are not nu-merous in representative surveys of field galaxies.
The value of the ratio [N II] λλ6548, 6583/Hα is usuallytaken to be 0.5 to remove the contribution of [N II] to (Hα +[N II]) blended emission, as determined by Kennicutt (1992).Using the SAPM sample, we study this ratio in more detail.We note that including AGN changes the average valuesvery little, since the overall emission is dominated by stellaremission in local representative surveys.
Figure 18a shows that [N II] λ6583/Hα EW ratio de-creases as a function of EW(Hα). In this plot we consideronly spectra with [N ii] EW detected above 3σ. We fitted aleast square relation to the log of the data (log[N II]/Hα =−0.4 logEW(Hα) +0.1). At our median EW(Hα), the rela-tion gives a [N II]/Hα ratio of 0.4, i.e. 0.5 for ([N II] λλ6548,6583)/Hα. We recall that 1.33 [N II] λ6583 should be equi-valent to [N II] λλ6548, 6583 since [N II] λ6548/[N II] λ6583= 1/3. In this figure, we also plot K92’s sample; we see thatthe high-resolution K92 subsample is generally above ourSAPM trend because it contains a large fraction of early-type galaxies which have systematically higher ratios. The
c© 1999 RAS, MNRAS 000, 1–15

Spectral properties of galaxies in the SAPM survey 9
low resolution K92 data are slightly higher than our me-dian value because of K92’s exclusion of weak Hα + [N II]blended lines.
Figure 18b shows the relation 1.33 [N II]/Hα EW versusEW(Hα) + 1.33 EW([N II]). The trend is the same as inFig. 18a. Thus we can predict which value is expected forthe ratio when observing the blend Hα + [N II]. For instance,if this latter is ∼ 100 A, the ratio should be ∼ 0.3, whilst ifit is ∼ 20 A, it should be ∼ 0.7.
In terms of galaxy numbers, the slight overestimationfor bright galaxies (mainly low EW), and underestimationfor faint galaxies (mainly high EW) are about counter-balanced, since 0.5 is the median value. In fact, as we willsee in Section 7, our relations [O II]–Hα and [O II]–(Hα +[N II]) are equivalent if this median is taken. However thisargument applies only for a similar EW(Hα) distribution.Samples at higher redshifts are skewed towards higher EWcompared to the local samples (at least in [O II] EW, seeFig. 25), and thus the local median, 0.5, is not the correctone to use. This effect will be more significant in small sam-ples at high redshift.
7 CORRELATION BETWEEN EMISSIONLINES
7.1 [N II], [S II], [O II], [O I] versus Hα
Figs. 19, 20, 21 & 23 show that EW of [N II] λ6583,[S II] λλ6716, 6731, [O II] λ3727, [O I] λ6300 increase asa function of Hα EW. The figures are on a log-log scaleto show all points, in particular those with low EWs. Wenote that this scale enhances the dispersion of low EWs incomparison with the one of high EWs. Table 4 gives thecorrelation parameters. The correlations are measured withEW, and not log(EW).
The large scatter (rms of about 50%) found in the EWcorrelations is not due to poor signal-to-noise; the scatteris still large even with lines detected above 5σ. In the caseof [N II] or [S II] lines, it is independent of the red stellarbackground. It simply reflects real scatter in the main physi-cal parameters (metallicity, effective temperature, ionisationparameter) which drive variations in the strengths of variousforbidden transitions relative to the recombination lines. Inaddition, any presence of AGN, in particular in early Hub-ble types, and any contribution to the emission from thediffused ionized gas will increase the primary scatter (seefor instance (Ho et al. 1997c) and references within). Thedispersion is larger for the [O II] correlation. In this case,the effect is accentuated by the diversity of young stellarcontents which produce the continuum at [O II]. Althoughthe [O I] line is rarely detectable, we were able to measurethe EW in a few galaxies. For this line the dispersion isas large as ∼80%. The scatter is so large partly because ofthe weakness of the line intensity which leads to low signal-to-noise, and partly because most of the [O I] flux comesfrom the partially ionized transition zone produced by high-energy photoionisation, which means the [O I]/Hα ratio isvery sensitive to the structure and thickness of the zone.We flagged all objects having [N II] λ6563/Hα > 0.63 (i.e.as good candidates for hosting an AGN) with starred sym-bols. Excluding them changes the correlations by less than
5%. The fractional dispersions are almost independent of theEW strength. Since EW is correlated with luminosity (seeSection 5.1), this implies that both faint and bright galaxieshave a variety of photoionization environments.
Since [O II] is at short optical wavelengths and is corre-lated with Hα strength, it has been used as a star formationrate (SFR) indicator for high-z galaxies, when Hα is notvisible in the optical window at z > 0.3–0.4. From the K92relation, EW([O II]) = 0.4 EW(Hα + [N II] λλ6548, 6583),we assumed his quoted value [N II] λ6583/Hα = 0.53, andderived EW([O II]) ≃ 0.6 EW(Hα). Our value is discrepantwith K92 by ∼ 10%, which is not significant given the dis-persion of the data in both samples.
We note that EWs measured from the overall galaxycontent are likely to be affected by dust. Indeed, recombina-tion emission lines originate from dusty H II regions wherehot stars (OB type) are formed, whereas the continuum at[O II] or Hα comes from long-lived stars sitting in less, ornon obscured regions. EW([O II]) is more affected by thedust than EW(Hα). Hence, the intrinsic [O II]–Hα EW ra-tio should be on average slightly larger than our observedrelation.
7.2 The [O II]–(Hα + [N II]) relation in differentsurveys
The correlation between EW([O II]) and EW(Hα + [N II]λλ6548, 6583) has been commonly used to estimate SFR. InFigure 22, we show it for our SAPM data, and in Figure 24we plot it together with data from the K92 and CFRS-12samples. The distribution of K92 data is spread over theSAPM distribution; the correlation and dispersion of K92data are similar to the SAPM with as little as 5–10% dis-crepancy (see Table 4). This is just about within the ex-pected random noise; the rms in the mean relation is ∼ 8%for K92, and ∼2–3% for the SAPM.
K92 sample has a larger fraction of high EW data. HighEWs in K92 sample usually correspond to late Hubble typegalaxies (see fig. 11 in Kennicutt 1992). Our median for [O II]and Hα + [N II] are about half those for the K92 data.Our EW([O II]) distribution at z = 0.05 is very similar tonearby samples (see Fig. 25), except for EW < 5 A, whichis probably due to different detection levels, and magnituderanges (luminous galaxies of the local Universe usually havelow EW). Thus this factor two cannot be due to our under-sampling, but rather reflects the difference between a rep-resentative sample (SAPM) and a sample selecting specificgalaxies (K92).
CFRS-12 data, which is a small representative sampleat 〈z〉 = 0.2 of galaxies usually fainter than −21 in B, havestronger EWs. On one hand, the small number of low EW iscertainly due to the poor detection of EW lower than 10 Ain the CFRS spectra, and the lack of luminous galaxies atz < 0.3. On the other hand, the larger fraction of strong EWspectra is genuine, and corresponds to the rapid evolutionof faint galaxies, as discussed previously. The distributionof EW in distant surveys such as the CFRS is significantlydifferent than to the local ones (see Fig. 25). Another obser-vation is that the [O II]/(Hα + [N II]) ratio for the CFRS-12galaxies (see Table 4) is ∼ 40% higher than in the local Uni-verse, but the scatter in the data is also larger. The ratiois higher because spectra exhibit stronger [O II] EW than
c© 1999 RAS, MNRAS 000, 1–15

10 L. Tresse, S. Maddox , J. Loveday and C. Singleton
local galaxies with same Hα EW. This has been noted byHammer et al. (1997). Since the CFRS-12 flux ratio is ex-actly the same as the CFRS-12 EW ratio, then differences inthe color of the continuum do not change the relation. Evenstrong stellar absorption at Hα would not be sufficient to ex-plain the shift towards smaller Hα EWs than expected fromthe local relation at strong [O II] EWs. Therefore the appar-ent excess of abnormally strong [O II] must correspond toa genuine change in faint galaxies towards higher redshifts,which produces larger degrees of ionization. This suggeststhat the local relation between [O II] and Hα should notbe extrapolated to distant galaxies with strong [O II] andvery blue continuum, which are more numerous than locally.For these galaxies, the SFR estimated from the [O II] EWand the local relation will be overestimated by as much as∼ 50%. Clearly amongst emission lines, Hα is the most reli-able tracer of SFR for distant galaxies (see Tresse, Maddox& Loveday 1998).
8 [O II] DETECTED IN NON-ELG
Out of 599 galaxies with no Hα detected, 68 (11%) exhibit[O II] λ3727. Their distribution is represented in Figure 25;their EW are mainly lower than 10 A. They are not found ata particular redshift, or magnitude. They have D4000 > 1.5,with a median at 1.8, i.e. these [O II] emitters are lying prefe-rentially in red galaxies. According our relation between Hαand [O II], they should have EW(Hα) ≃ 15 A. Only strongstellar absorption (> 10 A) in these red objects would not al-low us to detect Hα. We note that the distribution of theirEW([O II]) does not have a preferred galaxy inclination.They are most likely early Hubble type galaxies undergo-ing modest starbursts. Their morphology is as follows: 10elliptical, 10 SO, 39 spirals, 1 irregular, and 5 unclassified.They represent only 4% of the total SAPM sample. Analo-gous objects have been found in the CFRS at z > 0.45 (seeHammer et al. 1997), i.e. [O II] detected with red colors (Hαis not visible). A fraction of 6% (13 out of 210) are detectedwith an old stellar background. These CFRS galaxies seemto be the equivalent of our non-ELG with [O II] lines de-tected. It seems that the fraction of such objects increaseswith redshift, indeed the CFRS has a much lower spectralresolution than the SAPM, which increases the detectionlimit of [O II], and certainly more [O II] emitters withinthese early-type galaxies should be found.
Another 5% (10 out of 210) in the CFRS are detectedwith a young stellar background, but heavily reddened.These galaxies seem more likely to correspond to our galax-ies with Hα but no [O II] detected (see Section 5.2). In ourSAPM spectra, [O II] is not always detected with certaintybecause the blue continuum is too noisy for these galaxies.In addition, the median of the [O II] EW distribution oflocal galaxies is lower by a factor >2 than the one for high-z distributions, and so EW are expected to be on averagesmaller (see Table 5). They represent 4% (75 out of 1671)of the total SAPM sample, and thus their fraction seems tobe constant with redshift.
If we classify the SAPM galaxies according their [O II]emission, then we find ∼ 61% of [O II] emitters, which is thesame fraction as Hα emitters. Indeed galaxies with [O II]
but no Hα are counterbalanced by galaxies with Hα and no[O II].
9 CONCLUSION
In this paper we have analysed various line EWs and the4000 A Balmer break of galaxies in the SAPM survey. Thissurvey uniformly samples all galaxy types, and the spec-tral properties are representative of the local Universe atz ∼ 0.05. We would like to point out in particular that ourresults are independent of any incompleteness in the SAPMmorphological classifications and uncertainties in the SAPMflux calibration. Thus our results can on average be com-pared with deeper surveys. Our main results are:
(i) 61±1% of the SAPM galaxies are Hα-emitters (ELG)with EW(Hα) >∼ 2 A. The detection of Hα in emission in-dicates the presence of newly-formed, short-lived stars (t <few 106 yr) which radiate at λ < 912 A. The ELG fractionincreases as the galaxy is fainter and physically smaller. Thisfraction is larger in high and low surface brightness galaxies,i.e. in compact and dwarf galaxies. ELG have low 4000 ABalmer breaks, i.e. consistent with massive star formation.Faint (L < L∗
B) galaxies are bluer, and have stronger pho-toionization sources than bright galaxies. This agrees withthe general picture where faint and small galaxies are moreactively forming stars than their bright counterparts in thelocal Universe. This is reflected in the difference betweenELG and non-ELG luminosity functions (Loveday, Tresse &Maddox 1999). It is also consistent with a “peak” in theSFR history since the overall luminosity density is domi-nated by bright galaxies, which formed most of their starsmuch earlier than faint galaxies, which are actively formingstars today. The population of small, less massive systemsis what evolves rapidly, and undergoes rapid brightening to-wards earlier epochs.
(ii) Comparison of the ELG fraction with the CFRS-12sample (〈z〉 = 0.2) demonstrates a rapid evolution of thefaint galaxy population at low redshifts. This observationdoes not depend on the relative normalization of the galaxycounts. Emission lines trace the massive, young, short-livedstar galaxy contents, and thus their evolution is more rapidthan color evolution. However, since the SFR follows the to-tal stellar or gas density, no strong change in the averagespectral properties should be detected, unless some processrapidly enhances the SFR. Except in the case of interactinggalaxies, where disruption of the galaxy density will providea good site for starbursting, for the remaining population,other factors must be taken into account.
(iii) We note a continuity in the spectral properties andluminosities of ELG and non-ELG, and of strong and weakHα emitters. In addition, a small D4000 is closely related tothe presence of Hα in emission, and to the EW strengthsof recombination and forbidden lines. We do not identify aspecial class of galaxies, except those 4% galaxies discussedin (vii) below.
(iv) The ratio [N II] λ6583/Hα decreases with EW(Hα).Its median is 0.5 for nearby galaxies as found by Kennicutt(1992). However this value should only be applied to the
c© 1999 RAS, MNRAS 000, 1–15

Spectral properties of galaxies in the SAPM survey 11
Hα + [N II] λλ6548, 6583 blend for galaxies with similarEW(Hα) distributions to local ones and is not appropriatefor high-z samples.
(v) [O II], [S II], [N II], [O I] and Hα are all correlated, butpresent large dispersions (∼ 50%, and even larger for [O I]),which reflect the diversity in the photoionisation processes.The relation between [O II] and Hα EW of the SAPM galax-ies gives on average a SFR smaller by ∼ 10% than the K92derived relation. Moreover this relation seems to change athigh redshifts, and the distribution of [O II] EWs evolveswith redshift. Thus SFRs estimated from [O II] EWs andthe local relation may be overestimates. In particular, using[O II] for the faint, blue galaxies, the individual SFR may beoverestimated by as much as ∼ 50%. Hα remains the mostreliable indicator for distant galaxies.
(vi) On average luminous blue ELG are likely to be en-hanced in nitrogen abundance. This suggests that in faint,low-mass, late-type ELG, nitrogen is a primary element,whereas in more bright, more massive galaxies nitrogen itcomes from a secondary source.
(vii) Only 4% of non-ELG (Hα not detected) have [O II]detected, and correspond to early-type galaxies undergoingmodest starburts. Their fraction seems to increase with red-shift.
ACKNOWLEDGMENTS
We thank the referee L. Ho for his careful reading of thepaper.
REFERENCES
Brinchmann J., Abraham R., Schade D., Tresse L. et al., 1998,
ApJ, 499, 112Bruzual G., 1983, ApJ, 273, 105Bruzual G., Charlot S., 1993, ApJ, 405, 538Garnett D. R., 1989, ApJ, 363, 142Gallego J., Zamorano J., Garcia–Dabo C. E., Aragon–Salamanca
A., Guzman R., 1998, in D’Odorico S., Fontana A., GiallongoE., eds, The Young Universe, A.S.P. Conference Series Vol.146, p. 235
Hammer F., Flores H., Lilly S., Crampton D., Le Fevre O., RolaC., Mallen–Ornelas G., Schade D., Tresse L., 1997, ApJ, 481,49
Ho L. C., Filippenko A. V., Sargent W. L., 1997a, ApJS, 112, 315Ho L. C., Filippenko A. V., Sargent W. L., 1997b, ApJ, 487, 568
Ho L. C., Filippenko A. V., Sargent W. L., 1997c, ApJ, 487, 579Hodge P.W., Kennicutt, R. C., 1983, ApJ, 267, 563Hubble E., 1926, ApJ, 64, 321Hunter D. A., Elmegreen B. G., Baker A. L., 1998, ApJ, 493, 595Isotov Y. I, Thuan T. X., 1999, ApJ, 511, 639Kennicutt R. C., 1992, ApJ, 272, 54 (K92)Kennicutt R. C., Kent S. M., 1983, AJ, 88, 1094Kobulnicky H. A., Skillman E. D., 1998, ApJ, 497, 601Loveday J., 1996, MNRAS, 278, 1025
Loveday J., Lilly, S. J., in preparationLoveday J., Peterson B. A., Efstathiou G., Maddox S. J., 1992,
ApJ, 390, 338Loveday J., Peterson B. A., Maddox S. J., Efstathiou G., 1996,
ApJS, 107, 201
Loveday J., Tresse L., Maddox S. J., 1999, MNRAS, in press
Maddox S. J., Sutherland W. J., Efstathiou G., Loveday J., 1990,MNRAS, 243, 692
Maddox S. J., Sutherland W. J., Efstathiou G., Loveday J., Pe-terson B. A. 1990, MNRAS, 247, 1p
Maiolino R., Rieke G. H., 1995, ApJ, 454, 95Osterbrock D. E., 1989, Astrophysics of Gazeous Nebulae and
Active Galactic Nuclei, Univ. Sci. BooksRyder S. D., Dopita M. A., 1994, ApJ, 430, 142Sandage A., Tammann G. A., 1981, A Revised Shapley–Ames
Catalog of Bright Galaxies (Washington, DC: Carnegie Insti-tution of Washington) (RSA)
Schaerer D., de Koter A., 1997, A&A, 322, 598Tresse L., Maddox S. J., 1998, ApJ, 495, 691Tresse L., Rola C., Hammer F., Stasinska G., Le Fevre O., Lilly
S. J., Crampton D., 1996, MNRAS, 281, 847Tresse L., Maddox S. J., Loveday J., 1998, in D’Odorico S.,
Fontana A., Giallongo E., eds, The Young Universe, A.S.P.Conference Series Vol. 146, p. 330
Veilleux S., Osterbrock D. E., 1987, ApJS, 63, 295Veron–Cetty M. P., Veron P., 1986, A&AS, 66, 335Zucca E., Pozetti L., Zamorani G., 1994, MNRAS, 269, 953
This paper has been produced using the Royal AstronomicalSociety/Blackwell Science LATEX style file.
c© 1999 RAS, MNRAS 000, 1–15

12 L. Tresse, S. Maddox , J. Loveday and C. Singleton
Table 1. Fractions F (a) and F (b) covered by a 8′′ slit for different ranges of ellipticities, S25 and z, as described in Section 2.3.
Ellipticity N F(a) F(b)range mean mean mean
0.00–1.00 0.62 1671 (ALL) 57% 33%0.00–0.64 0.44 836 67% 28%0.64–1.00 0.80 835 47% 37%
Log S25 (kpc2) N F(a) F(b)range mean mean mean
0.80–4.00 2.88 1671 (ALL) 57% 33%0.80–2.94 2.56 836 62% 33%2.94–4.00 3.19 835 51% 32%
z N F(a) F(b)range mean mean mean
0.0036–0.1422 0.0531 1671 (ALL) 57% 33%0.0036–0.0533 0.0346 836 56% 29%0.0533–0.1422 0.0717 835 58% 36%
Table 2. Average parameters and respective rms (see Section 3.1 for details of the classification)
Average parameters ELG (rms) non-ELG (rms) unclassified (rms) ALL (rms)
Number 990 599 82 1671
bJ [mag] 16.53 (0.02) 16.46 (0.02) 16.58 (0.05) 16.51 (0.01)z 0.0504 (0.0008) 0.0559 (0.0009) 0.0663 (0.0003) 0.0531 (0.0006)M(bJ ) [mag] −20.73 (0.04) −21.16 (0.04) −21.65 (0.06) −20.93 (0.03)k [mag] 0.142 (0.002) 0.173 (0.004) 0.200 (0.009) 0.156 (0.002)Log S25 [kpc2] 2.79 (0.01) 2.99 (0.02) 3.14 (0.02) 2.88 (0.01)µ25 [mag arcsec−2] 22.81 (0.01) 22.89 (0.01) 22.76 (0.03) 22.839 (0.007)D4000 1.395 (0.006) 1.83 (0.01) 1.65 (0.03) 1.563 (0.008)i [deg] 52.3 (0.6) 51.1 (0.7) 48.7 (0.7) 51.7 (0.4)
bJ is the apparent magnitude; z is the redshift; M(bJ ) is the absolute magnitude; k is the k-correction for bJ
magnitudes, calculated individually for different morphological types as used by Loveday et al. (1992); S25 is therest-frame projected area brighter than a bJ surface brightness level of 25 mag arcsec−2; µ25 is the rest-frame surfacebrightness averaged over the area brighter than bJ = 25 mag arcsec−2; D4000 is the Balmer index at 4000 A; and i
is the galaxy inclination.
Table 3. Median and number of galaxies of the EW distributions for bright and faint ELG, and for low and highD4000 ELG (see also Fig. 15, and Fig. 16).
EW(Hα) EW([O II]3727) EW([S II]6717, 6731) EW([N II]6583) EW([O I]6300)
ALL 14.9 [934] 10.4 [859] 6.9 [536] 5.7 [784] 2.0 [43]
(L ≥ L∗
B) ELG 12.7 [417] 8.1 [371] 5.4 [193] 5.6 [350] 1.9 [17]
(L < L∗
B) ELG 17.5 [517] 13.0 [488] 7.5 [343] 5.8 [434] 2.0 [26]
(D4000 ≥ 1.4) ELG 10.6 [467] 8.1 [409] 5.3 [234] 4.7 [394] 1.7 [20](D4000 < 1.4 ) ELG 20.9 [467] 13.5 [449] 7.8 [302] 6.7 [390] 2.5 [23]
c© 1999 RAS, MNRAS 000, 1–15

Spectral properties of galaxies in the SAPM survey 13
Table 4. Correlations between emission-line EW
Median correlation rms MedianEW(2) = a EW(1) EW σ level1 dispersion N EW(1) EW(2)
[N II] λ6583 = 0.37 Hα any ∼ 55% 784 15.6 5.7[N II] λ6583 = 0.41 Hα 3σ ∼ 50% 553 15.8 6.5[N II] λ6583 = 0.45 Hα 5σ ∼ 42% 280 17.8 7.8
[S II] λλ6716, 6731 = 0.36 Hα any ∼ 57% 536 18.1 6.9[S II] λλ6716, 6731 = 0.39 Hα 3σ ∼ 48% 361 20.0 7.8[S II] λλ6716, 6731 = 0.40 Hα 5σ ∼ 46% 143 24.4 10.0
[O II] λ3727 = 0.67 Hα any ∼ 68% 859 15.6 10.4[O II] λ3727 = 0.69 Hα 3σ ∼ 64% 656 17.0 11.5
[O II] λ3727 = 0.67 Hα 5σ ∼ 57% 294 21.6 14.6
[O II] λ3727 = 0.45 (Hα + [N II] λλ6548, 6583) any ∼ 65% 769 24.2 10.6[O II] λ3727 = 0.47 (Hα + [N II] λλ6548, 6583) 3σ ∼ 59% 593 26.3 11.7[O II] λ3727 = 0.47 (Hα + [N II] λλ6548, 6583) 5σ ∼ 52% 280 32.5 14.7
[O II] λ3727 = 0.42 (Hα + [N II] λλ6548, 6583) K92 data2 ∼ 61% 63 60 25
[O II] λ3727 = 0.62 (Hα + [N II] λλ6548, 6583) CFRS-123 ∼ 83% 32 51.74 42.60
[O I] λ6300 = 0.08 Hα any ∼ 92% 43 23.6 2.0[O I] λ6300 = 0.15 Hα 3σ ∼ 77% 11 17.6 2.9[O I] λ6300 = 0.09 Hα 5σ ∼ 88% 3 15.1 3.8
1 The correlation is measured with data which have both EW(1) and EW(2) detected (see Fig. 2). In the case ofEW([O II]) = a EW(Hα + [N II] λλ6548, 6583), only [O II] and Hα EW detection levels are considered; [N II]λλ6548, 6583 = 1.33 [N II] λ6583 and [N II] λ6583 EW may be equal to zero.2 We excluded only Seyfert 1 from K92 sample. If we exclude all AGN galaxies we find respectively a = 0.41, K92,∼ 55%, 63, 60 and 25.3 The CFRS EWs are usually detected above 10 A. The correlation measured with the CFRS calibrated line fluxesgives also a = 0.62.
Table 5. Mean and median of the [O II] EW distributions (see Fig. 25)
Sample1 [O II] EW median [O II] EW mean
SAPM [O II]>0 9.6 12.6SAPM [O II]>0, Hα > 0 10.4 13.3SAPM [O II]>0, Hα ≤ 0 5.4 5.8
CFRS-12 [O II]>0 29.4 34.9CFRS-12 [O II]>0, Hα > 0 42.6 41.7
CFRS-14 [O II]>0 26.4 30.1
1 Note that each sample has different properties, for instance the SAPM, blue selection, has a EW detection level∼ 2A, 〈z〉 = 0.05 and −24 < M(bJ ) < −14; the CFRS-12, red selection, has a EW detection level ∼ 10A, 〈z〉 = 0.2and −21 < M(bJ ) < −14; and the CFRS-14, from red to blue selection, has a EW detection level ∼ 10A, 〈z〉 = 0.6and −24 < M(bJ ) < −14.
c© 1999 RAS, MNRAS 000, 1–15

14 L. Tresse, S. Maddox , J. Loveday and C. Singleton
Figure 1. Top panels: The complete rest-frame wavelength range spanned by one SAPM spectrum at z = 0.0534. Onecan see the small gaps in continuum at (observed frame) ∼[4360–4370]A, and ∼[7000–7020]A (see Section 2.1). Bottom-leftpanel: Zoomed view of [O II] λ3727. Bottom-right panel: Zoomed view of [N II] λ6548, Hα, [N II] λ6583, [S II] λλ6716, 6731respectively.
Figure 2. Top panel: Log of the detection level of EW(Hα), i.e. DL = Log (EW/σ(EW)), versus Log EW(Hα). Lower panels:Same but for [O II] λ3727, for [S II] λλ6716, 6731, for [N II] λ6584, and for [O I] λ6300. Vertical solid lines are the respectiveEW medians (see Table 3). The number of plotted data and the 2, 3σ detection levels (dashed lines) are indicated in eachpanel.
Figure 3. For the whole sample (1671), fractions of the galaxy image covered by the 8′′ wide slit if the slit was positionedalong the major axis, F (a), or the minor axis, F (b), as a function of the physical size at 25 mag arcsec−2, S25 (upper panels),the cosine inclination angle, cos(i) (middle panels), and the redshift, z (lower panels).
Figure 4. Top panel: Physical size at 25 mag arcsec−2, S25, as a function of the cosine inclination angle, cos(i). Middle panel:Distributions of cos(i), the shaded histogram is for unclassified galaxies (see Sect. 3.1). Bottom panel: Fractions of ELG as afunction cos(i), the mean is 61% (dashed-dotted line).
Figure 5. Log EW(Hα), and detection level of EW(Hα) as a function of the fraction of the galaxy image covered if theslit was positioned along the major axis, F (a) (upper panels), the cosine inclination angle, cos(i) (middle panels), and theredshift, z (lower panels).
Figure 6. Top panel: N(bJ) distributions, the shaded histogram is for the 82 unclassified galaxies (see Sect. 3.1). Bottompanel: Fraction of ELG as a function of bJ , the mean is 61% (dashed-dotted line).
Figure 7. Top panel: N(z) distributions. Bottom panel: Fraction of ELG as a function of z. Notation the same as in Figure 6.
Figure 8. Top panel: N(M(bJ )) distributions. Bottom panel: Fraction of ELG as a function of M(bJ ). Notation the same asin Figure 6.
Figure 9. Top panel: Physical size S25 distributions. Bottom panel: Fraction of ELG as a function of S25. Notation the sameas in Figure 6.
Figure 10. Top panel: Rest-frame surface brightness µ25 distributions. Bottom panel: Fraction of ELG as a function of µ25.Notation the same as in Figure 6.
Figure 11. Top panel: D4000 distributions. Bottom panel: Fraction of ELG as a function of D4000 . Notation the same as inFigure 6.
Figure 12. M(bJ ) versus D4000
Figure 13. Top panel: N(M(BAB)) distributions for the 138 CFRS galaxies at z < 0.3, with Hα detected (ELG) and withno Hα detected (non-ELG). Bottom panel: Fraction of CFRS ELG as a function of M(BAB).
Figure 14. Top panel: M(bJ ) distributions for the 934 ELG, for the 467 EW(Hα) > 15 A ELG (dashed line), and for the467 EW(Hα) ≤ 15 A (dotted line). Arrows are the respective medians (see Table 3). Bottom panel: Fraction of EW(Hα) >15 A ELG as a function of M(bJ ).
Figure 15. Top panels: EW distributions of Hα, [O II] λ3727, [S II] λλ6716, 6731, [N II] λ6583 and [O I] λ6300 for brightM(bJ ) ≤ −21 (or L ≥ L∗
B) ELG (dotted lines), and faint (L < L∗
B) ELG (dashed lines). Arrows are the respective medians(see Table 3). Bottom panels: Respective fractions of faint ELG as a function of EW.
Figure 16. Top panels: EW distributions of Hα, [O II] λ3727, [S II] λλ6716, 6731 and [N II] λ6583 lines for high D4000 ≥ 1.4ELG (dotted lines), and low D4000 < 1.4 ELG (dashed lines). Arrows are the respective medians (see Table 3). Bottom panels:Respective fractions of low D4000 ELG as a function of EW.
Figure 17. Distribution of the EW ratios for [N II] λ6583/Hα, [S II] λλ6716,6731/Hα and [O I] λ6300/Hα (solid line). Thedashed line is for 57 galaxies from K92’s sample weighted as described in Section 6.1.
Figure 18. (a) Log [N II] λ6583/Hα versus Log EW(Hα). (b) Log 1.33 [N II] λ6583/Hα versus Log EW(Hα) + 1.33EW([N II]λ6583). Dots are SAPM (> 3σ) data, crosses are SAPM (< 3σ) data. Open symbols are K92 high-resolution data, filledsymbols are K92 low-resolution data. Triangles are AGN and circles are normal galaxies in K92 sample. The dotted line is
c© 1999 RAS, MNRAS 000, 1–15

Spectral properties of galaxies in the SAPM survey 15
the empirical separation between AGN and H ii galaxies. The solid line is the commonly used average value for [N II]/Hα.The diagonal line is our best fit to the correlation.
Figure 19. Log EW([N II] λ6583) versus Log EW(Hα). Small symbols are data detected below 3σ, large symbols are > 3σdata. AGN candidates ([N II] λ6563/Hα > 0.63) are denoted by stars and non-AGN by filled circles. The solid line is thecorrelation using all (> 3σ) data; EW([N II]) ≈ 0.4 EW(Hα) (see Table 4). The average 1σ EW errorbars are also shown.
Figure 20. Log EW([S II] λλ6716, 6731) versus Log EW(Hα). Same notation as Figure 19. EW([S II]) ≈ 0.4 EW(Hα) (seeTable 4).
Figure 21. Log EW([O II] λ3727) versus Log EW(Hα). Same notation as Figure 19. EW([O II]) ≈ 0.7 EW(Hα) (see Table 4).
Figure 22. Log EW([O II] λ3727) versus Log EW(Hα + [N II] λλ6548, 6583). Same notation as Figure 19. EW([O II]) ≈ 0.5EW(Hα + [N II]) (see Table 4).
Figure 23. Log EW([O I] λ6300) versus Log EW(Hα). Same notation as Figure 19. EW([O I]) ≈ 0.1 EW(Hα); note thecorrelation is very poor (see Table 4).
Figure 24. Log EW([O II] λ3727) versus Log EW(Hα + [N II] λλ6548, 6583). Dots are SAPM data, and the line shows thecorrelation from Figure 22. Filled symbols show K92 data (diamonds are AGN galaxies excluding Seyfert1) and open symbolsshow CFRS-12 data.
Figure 25. Relative distributions of EW([O II] λ3727). (a) For the 1008 SAPM spectra with [O II] detected (solid line), andfor the 68 spectra with [O II] but not Hα detected (dotted line). The curve is reproduced from figure 9 in Kennicutt 1992,which shows the distribution of very nearby galaxies. (b) For the 1008 SAPM data (thick-solid line), for 55 CFRS-12 data at0.2 < z < 0.3 (thin-solid line), and for 403 CFRS-14 data (0.2 < z < 1.3; Hammer et al. 1997) (dashed line). Medians of thedistributions are listed in Table 5.
c© 1999 RAS, MNRAS 000, 1–15

16 L. Tresse, S. Maddox , J. Loveday and C. Singleton
Figure 1. Top panels: The complete rest-frame wavelength range spanned by one SAPM spectrum at z = 0.0534. One can see the smallgaps in continuum at (observed frame) ∼[4360–4370]A, and ∼[7000–7020]A (see Section 2.1). Bottom-left panel: Zoomed view of [O II]λ3727. Bottom-right panel: Zoomed view of [N II] λ6548, Hα, [N II] λ6583, [S II] λλ6716, 6731 respectively.
c© 1999 RAS, MNRAS 000, 1–15

Spectral properties of galaxies in the SAPM survey 17
Figure 2. Top panel: Log of the detection level of EW(Hα), i.e. DL = Log (EW/σ(EW)), versus Log EW(Hα). Lower panels: Samebut for [O II] λ3727, for [S II] λλ6716, 6731, for [N II] λ6584, and for [O I] λ6300. Vertical solid lines are the respective EW medians.The number of plotted data and the 2, 3σ detection levels (dashed lines) are indicated in each panel.
c© 1999 RAS, MNRAS 000, 1–15

18 L. Tresse, S. Maddox , J. Loveday and C. Singleton
Figure 3. For the whole sample (1671), fractions of the galaxy image covered by the 8′′ wide slit if the slit was positioned along themajor axis, F (a), or the minor axis, F (b), as a function of the physical size at 25 mag arcsec−2, S25 (upper panels), the cosine inclinationangle, cos(i) (middle panels), and the redshift, z (lower panels).
c© 1999 RAS, MNRAS 000, 1–15

Spectral properties of galaxies in the SAPM survey 19
Figure 4. Top panel: Physical size at 25 mag arcsec−2, S25, as a function of the cosine inclination angle, cos(i). Middle panel:Distributions of cos(i), the shaded histogram is for the 82 unclassified galaxies (see Sect. 3.1). Bottom panel: Fractions of ELG as afunction cos(i), the mean is 61% (dashed-dotted line).
c© 1999 RAS, MNRAS 000, 1–15

20 L. Tresse, S. Maddox , J. Loveday and C. Singleton
Figure 5. Log EW(Hα), and detection level of EW(Hα) as a function of the fraction of the galaxy image covered if the slit was positionedalong the major axis, F (a) (upper panels), the cosine inclination angle, cos(i) (middle panels), and the redshift, z (lower panels).
c© 1999 RAS, MNRAS 000, 1–15

Spectral properties of galaxies in the SAPM survey 21
Figure 6. Top panel: N(bJ ) distributions, the shaded histogram is for the 82 unclassified galaxies (see Sect. 3.1). Bottom panel: Fractionof ELG as a function of bJ , the mean is 61% (dashed-dotted line).
c© 1999 RAS, MNRAS 000, 1–15

22 L. Tresse, S. Maddox , J. Loveday and C. Singleton
Figure 7. Top panel: N(z) distributions. Bottom panel: Fraction of ELG as a function of z. Notation the same as in Figure 6.
c© 1999 RAS, MNRAS 000, 1–15

Spectral properties of galaxies in the SAPM survey 23
Figure 8. Top panel: N(M(bJ )) distributions. Bottom panel: Fraction of ELG as a function of M(bJ ). Notation the same as in Figure 6.
c© 1999 RAS, MNRAS 000, 1–15

24 L. Tresse, S. Maddox , J. Loveday and C. Singleton
Figure 9. Top panel: Physical size S25 distributions. Bottom panel: Fraction of ELG as a function of S25. Notation the same as inFigure 6.
c© 1999 RAS, MNRAS 000, 1–15

Spectral properties of galaxies in the SAPM survey 25
Figure 10. Top panel: Rest-frame surface brightness µ25 distributions. Bottom panel: Fraction of ELG as a function of µ25. Notationthe same as in Figure 6.
c© 1999 RAS, MNRAS 000, 1–15

26 L. Tresse, S. Maddox , J. Loveday and C. Singleton
Figure 11. Top panel: D4000 distributions. Bottom panel: Fraction of ELG as a function of D4000 . Notation the same as in Figure 6.
c© 1999 RAS, MNRAS 000, 1–15

Spectral properties of galaxies in the SAPM survey 27
Figure 12. M(bJ ) versus D4000.
c© 1999 RAS, MNRAS 000, 1–15

28 L. Tresse, S. Maddox , J. Loveday and C. Singleton
Figure 13. Top panel: N(M(BAB)) distributions for the 138 CFRS galaxies at z < 0.3, with Hα detected (ELG) and with no Hα
detected (non-ELG). Bottom panel: Fraction of CFRS ELG as a function of M(BAB).
c© 1999 RAS, MNRAS 000, 1–15
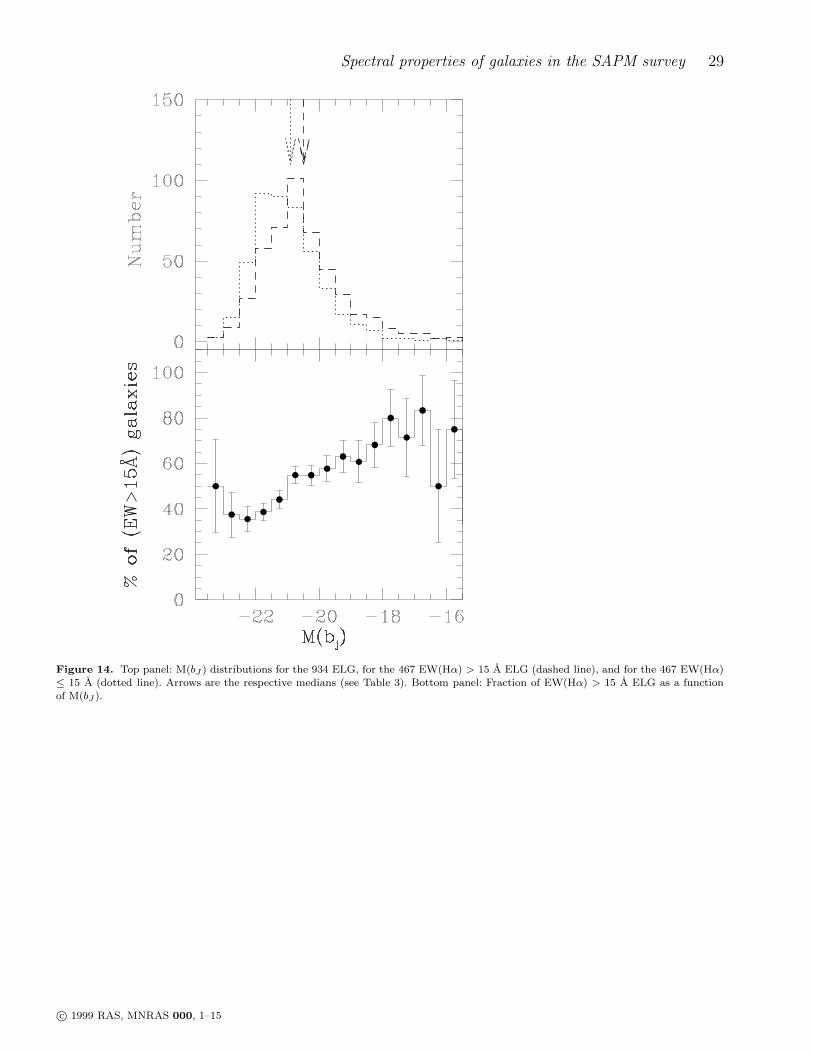
Spectral properties of galaxies in the SAPM survey 29
Figure 14. Top panel: M(bJ ) distributions for the 934 ELG, for the 467 EW(Hα) > 15 A ELG (dashed line), and for the 467 EW(Hα)≤ 15 A (dotted line). Arrows are the respective medians (see Table 3). Bottom panel: Fraction of EW(Hα) > 15 A ELG as a functionof M(bJ ).
c© 1999 RAS, MNRAS 000, 1–15

30 L. Tresse, S. Maddox , J. Loveday and C. Singleton
Figure 15. Top panels: EW distributions of Hα, [O II] λ3727, [S II] λλ6716, 6731, [N II] λ6583 and [O1] λ6300 for bright M(bJ ) ≤ −21(or L ≥ L∗
B) ELG (dotted lines), and faint (L < L∗
B) ELG (dashed lines). Arrows are the respective medians (see Table 3). Bottom
panels: Respective fractions of faint ELG as a function of EW.
c© 1999 RAS, MNRAS 000, 1–15

Spectral properties of galaxies in the SAPM survey 31
Figure 16. Top panels: EW distributions of Hα, [O II] λ3727, [S II] λλ6716, 6731, [N II] λ6583 and [O I] λ6300 for high D4000 ≥ 1.4ELG (dotted lines), and low D4000 < 1.4 ELG (dashed lines). Arrows are the respective medians (see Table 3). Bottom panels: Respectivefractions of low D4000 ELG as a function of EW.
c© 1999 RAS, MNRAS 000, 1–15

32 L. Tresse, S. Maddox , J. Loveday and C. Singleton
Figure 17. Distribution of the EW ratios for [N II] λ6583/Hα, [S II] λλ6716,6731/Hα and [O I] λ6300/Hα (solid line). The dashed lineis for 57 galaxies from K92’s sample weighted as described in Section 6.1.
c© 1999 RAS, MNRAS 000, 1–15

Spectral properties of galaxies in the SAPM survey 33
Figure 18. (a) Log [N II] λ6583/Hα versus Log EW(Hα). (b) Log 1.33 [N II] λ6583/Hα versus Log EW(Hα + 1.33[N II] λ6583). Dotsare SAPM (> 3σ) data, crosses are SAPM (< 3σ) data. Open symbols are K92 high-resolution data, filled symbols are K92 low-resolutiondata. Triangles are AGN and circles are normal galaxies in K92 sample. The dotted line is the empirical separation between AGN andH ii galaxies. The solid line is the commonly used average value for [N II]/Hα. The diagonal line is our best fit to the correlation.
c© 1999 RAS, MNRAS 000, 1–15

34 L. Tresse, S. Maddox , J. Loveday and C. Singleton
Figure 19. Log EW([N II] λ6583) versus Log EW(Hα). Small symbols are data detected below 3σ, large symbols are > 3σ data. AGNcandidates ([N II] λ6563/Hα > 0.63) are denoted by stars and non-AGN by filled circles. The solid line is the correlation using all (> 3σ)data; EW([N II]) ≈ 0.4 EW(Hα) (see Table 4). The average 1σ EW errorbars are also shown.
c© 1999 RAS, MNRAS 000, 1–15

Spectral properties of galaxies in the SAPM survey 35
Figure 20. Log EW([S II] λλ6716, 6731) versus Log EW(Hα). Same notation as Figure 19. EW([S II]) ≈ 0.4 EW(Hα) (see Table 4).
c© 1999 RAS, MNRAS 000, 1–15

36 L. Tresse, S. Maddox , J. Loveday and C. Singleton
Figure 21. Log EW([O II λ3727]) versus Log EW(Hα). Same notation as Figure 19. EW([O II]) ≈ 0.7 EW(Hα) (see Table 4).
c© 1999 RAS, MNRAS 000, 1–15

Spectral properties of galaxies in the SAPM survey 37
Figure 22. Log EW([O II] λ3727) versus Log EW(Hα + [N II] λλ6548, 6583). Same notation as Figure 19. EW([O II]) ≈ 0.5 EW(Hα
+ [N II]) (see Table 4).
c© 1999 RAS, MNRAS 000, 1–15

38 L. Tresse, S. Maddox , J. Loveday and C. Singleton
Figure 23. Log EW([O I] λ6300) versus Log EW(Hα). Same notation as Figure 19. EW([O I]) ≈ 0.1 EW(Hα); note the correlation isvery poor (see Table 4).
c© 1999 RAS, MNRAS 000, 1–15

Spectral properties of galaxies in the SAPM survey 39
Figure 24. Log EW([O II] λ3727) versus Log EW(Hα + [N II] λλ6548, 6583). Dots are SAPM data, and the line shows the correlationfrom Figure 22. Filled symbols show K92 data (diamonds are AGN galaxies excluding Seyfert1) and open symbols show CFRS-12 data.
c© 1999 RAS, MNRAS 000, 1–15

40 L. Tresse, S. Maddox , J. Loveday and C. Singleton
Figure 25. Relative distributions of EW([O II] λ3727). (a) For the 1008 SAPM spectra with [O II] detected (solid line), and for the68 spectra with [O II] but not Hα detected (dotted line). The curve is reproduced from figure 9 in Kennicutt 1992, which shows thedistribution of very nearby galaxies. (b) For the 1008 SAPM data (thick-solid line), for 55 CFRS-12 data at 0.2 < z < 0.3 (thin-solidline), and for 403 CFRS-14 data (0.2 < z < 1.3; Hammer et al. 1997) (dashed line). Medians of the distributions are listed in Table 5.
c© 1999 RAS, MNRAS 000, 1–15
Related Documents